Article

Cross-City Evaluation of Multi-Sensor SAR–Optical Fusion Strategies for Agricultural Land Cover Classification Using Deep Learning

Department of Software Engineering, Faculty of Engineering and Natural Sciences, Atlas University, Istanbul 34406, Turkey
Land 2026, 15(7), 1289; https://doi.org/10.3390/land15071289
Submission received: 8 June 2026 / Revised: 9 July 2026 / Accepted: 17 July 2026 / Published: 18 July 2026

Abstract

Accurate and transferable land cover mapping from satellite imagery is a prerequisite for national-scale agrienvironmental monitoring and climate change impact assessment. The joint use of Sentinel-1 synthetic aperture radar (SAR) and Sentinel-2 multispectral imagery offers complementary structural and spectral information, yet systematic evaluation of fusion strategies and their geographic transferability remains limited. We trained and tested five U-Net fusion architectures—S1-only, S2-only, early (input-level), feature-level (middle), and decision-level (late)—alongside a SegFormer-b2 transformer baseline over two German cities (Munich and Berlin) using the Multi-Sensor Land Cover Classification (MSLCC) dataset (single-date 2017 Sentinel-1B/Sentinel-2A acquisitions) at 10 m resolution. Three cross-city transfer protocols (Munich → Berlin, Berlin → Munich, and combined training) quantify model transferability across contrasting urban–rural gradients. Early fusion achieved the highest in-city macro-averaged F1 score among U-Net variants (0.8278), a small but statistically significant improvement over the optical-only baseline (0.8236; patch-level paired bootstrap, p = 0.006 ); feature-level (middle, 0.8164) and decision-level (late, 0.8196) fusion were, by contrast, significantly worse than the optical-only baseline ( p < 0.001 and p = 0.030 , respectively), and the SAR-only model (0.6864) trailed substantially. The built-up class was the primary beneficiary of SAR inclusion under early fusion. SegFormer-b2 (0.8214) was numerically close to, but statistically significantly below, the best convolutional configuration ( p = 0.005 ), and exhibited strong cross-city transfer (0.8632–0.8608 macro-F1), consistent with the geographic invariance conferred by its ImageNet-pretrained encoder. Combined training across both cities improved over the single-direction transfer average by 0.012 macro-F1 points for U-Net and 0.006 points for SegFormer, offering a practical route to national-scale deployment without requiring explicit domain adaptation. Spectral index augmentation (NDVI, NDWI, ExG) and SE channel attention did not significantly improve over plain early fusion when derived from percentile-normalized inputs, with the best variant statistically indistinguishable from the baseline at macro-F1 = 0.8268 ( p = 0.365 ); the result is attributable to a specific preprocessing dependency: NDVI, NDWI, and ExG are only physically meaningful when computed from calibrated reflectance, whereas here they were derived after scene-level 2nd–98th percentile stretching, which strips the absolute radiometric referencing the indices rely on; practitioners combining spectral indices with percentile-normalized (rather than physically calibrated, e.g., Level-2A surface-reflectance) inputs should expect a similar null result.

1. Introduction

Monitoring agricultural land cover at national and continental scales is an active area of remote sensing research with direct relevance to food security policy and environmental accounting. High-resolution, consistent maps of land use and land cover (LULC) are critical inputs for agrienvironmental accounting, crop-yield forecasting, and the detection of climate-driven shifts in vegetation phenology [1,2]. The need to characterize these dynamics rapidly and at scale has grown as agriculture-related policy decisions increasingly depend on timely, spatially explicit land surface information [3].
Earth observation satellites now provide cost-effective, globally consistent data streams for this purpose. Sentinel-1 (S1) carries a C-band synthetic aperture radar (SAR) sensor that operates independently of cloud cover and daylight, capturing surface structure and dielectric properties [4]. Sentinel-2 (S2) provides multispectral imagery with four native 10 m bands, enabling rich characterization of vegetation, soil, and built-up spectral signatures [5]. The two sensors are complementary: SAR is sensitive to surface roughness and canopy moisture, while optical bands—particularly the near-infrared—encode photosynthetically active vegetation [6]. Their combination is a straightforward approach to more complete LULC characterization.
Deep learning has substantially advanced remote sensing image analysis, with convolutional neural networks (CNNs) establishing strong baselines for dense scene labeling [1]. Fully convolutional architectures such as U-Net [7] and its derivatives have become the dominant paradigm for dense semantic segmentation of satellite imagery. More recently, transformer-based models—including SegFormer [8] and Swin Transformer variants [9]—have demonstrated competitive or superior performance on remote sensing benchmarks, attributed to their ability to model long-range spatial dependencies.
The Multi-Sensor Land Cover Classification (MSLCC) dataset [10] provides a well-suited testbed for these questions. It offers co-registered Sentinel-1B and Sentinel-2A acquisitions over two German cities—Munich and Berlin—with pixel-wise annotations for four land cover classes at native 10 m resolution. The two cities span contrasting geographic profiles: Munich is agriculture-dominant with a relatively simple spatial pattern (pre-Alpine foothills), while Berlin is characterized by greater urban density, scattered forest patches, and extensive water networks. This within-dataset geographic diversity allows cross-city transfer to be evaluated under consistent sensor and labeling conditions, avoiding confounding factors that complicate multi-source benchmark comparisons.
Despite these advances, three specific gaps in the literature remain unaddressed. First, studies on SAR–optical fusion for LULC at Sentinel resolution predominantly adopt a single fusion paradigm—typically input-level concatenation—without systematic comparison to feature-level or decision-level alternatives under otherwise identical conditions [6,11]. Second, the geographic transferability of trained models—a prerequisite for national-scale deployment—is rarely evaluated at the city scale; most studies train and test within the same scene, potentially exploiting site-specific spectral or structural patterns that do not generalize [12]. Third, transformer-based architectures have not been rigorously benchmarked against convolutional alternatives for multi-sensor fusion in the agricultural LULC domain at 10 m resolution.
This paper addresses these gaps through the following experiments:
  • Fusion ablation: We compare five U-Net configurations (S1-only, S2-only, early, middle, and late fusion) to isolate the role of each modality and fusion strategy per land cover class.
  • Cross-city generalization benchmark: We evaluate models under three transfer protocols (Munich → Berlin, Berlin → Munich, combined training) to characterize transferability across contrasting urban–rural gradients.
  • CNN vs. Transformer: We benchmark SegFormer-b2 against U-Net under the best-performing fusion strategy, examining whether transformer architectures offer additional generalization capacity.
  • Feature engineering: We evaluate whether adding computed spectral indices (NDVI, NDWI, ExG) as additional input channels, and applying Squeeze-and-Excitation (SE) channel attention at the input level, can further improve classification accuracy beyond raw band concatenation.
The remainder of this paper is organized as follows. Section 2 reviews related work on deep learning for remote sensing segmentation, SAR–optical fusion strategies, and cross-domain generalization. Section 3 describes the study sites, dataset, preprocessing pipeline, model architectures, and evaluation protocol. Section 4 reports the quantitative results of the fusion ablation, cross-city transfer experiments, feature engineering analysis, and qualitative visual comparisons. Section 5 interprets the findings and discusses their implications for operational land cover mapping. Section 6 summarizes the main conclusions and outlines directions for future work.

2. Related Work

2.1. Deep Learning for Remote Sensing Segmentation

Convolutional neural networks have outperformed classical methods—random forests and SVMs in particular—for dense LULC mapping from satellite imagery [1,13]. The U-Net encoder–decoder architecture [7], with its skip connections bridging encoder and decoder feature maps at matched spatial resolutions, has been effective for segmentation tasks that require both fine boundary resolution and high-level semantic context. DeepLab variants [14]—employing dilated (atrous) convolutions and spatial pyramid pooling to capture multi-scale context—follow a different design philosophy and have also been widely used for RS segmentation [2].
Vision transformers have been extended to dense prediction tasks in remote sensing. SegFormer [8] couples a hierarchical Mix Transformer (MiT) encoder with a lightweight all-MLP decoder, providing efficient multi-scale representations without the positional-encoding constraints of earlier vision transformer designs. UNetFormer [15] hybridizes U-Net skip connections with transformer self-attention in the bottleneck, combining local convolutional features with global context. For agricultural landscapes in particular—where land parcels span hundreds of pixels and within-parcel spectral homogeneity coexists with sharp inter-parcel boundaries—transformer encoders’ capacity for long-range dependency modeling has produced competitive results. Direct comparisons of transformers and CNNs for SAR–optical inputs under consistent training conditions are still limited in the literature.

2.2. SAR–Optical Fusion Strategies

Multi-modal fusion in remote sensing is generally organized around three strategies [6,16]:
Early fusion (input-level concatenation) stacks all modalities along the channel axis before the first network layer, allowing the backbone to jointly learn cross-modal interactions from the outset. This approach is the most common in applied remote sensing studies [11,17], largely because it requires no architectural changes beyond adjusting the input channel count. The main limitation is that the network’s first layer must handle both SAR and optical channels jointly, without modality-specific normalization, which can weaken the contribution of the lower-information SAR channel.
Feature-level (middle) fusion routes each modality through a dedicated encoder branch for a number of layers before merging the intermediate representations. Each modality’s encoder learns independent feature hierarchies before the representations are merged. Hierarchical channel-attention and cross-modal attention mechanisms have been shown to further improve middle-fusion performance for very-high-resolution RS data [18,19].
Decision-level (late) fusion trains independent per-modality networks to produce probability maps that are subsequently combined by weighted averaging, voting, or a learned gating function. The key advantage—robustness to missing modalities at inference time—comes at the cost of missing cross-modal interactions during feature learning [16].
Large-scale benchmarks such as SEN12MS [20] have substantially advanced multi-sensor fusion research by providing curated, globally distributed Sentinel-1/2 scene pairs. However, most benchmark evaluations treat each scene as an independent in-distribution test sample. Comparative evaluations of fusion paradigms at full-city scale, with explicit cross-city hold-out protocols, remain limited in the literature.

2.3. Cross-Domain Generalization in Remote Sensing

Models trained on one region frequently degrade when applied elsewhere, due to differences in land cover composition, crop phenology, acquisition geometry, and atmospheric conditions [12]. For LULC models trained on specific cities or regions, this shift can cause severe performance degradation when the models are applied to new geographic extents, a practical problem for operational deployment at national scale [21].
Several strategies address this: fine-tuning on small target-domain labeled sets, adversarial feature alignment, and curriculum domain adaptation [22] have all been explored, for instance in urban scene segmentation and building footprint extraction [23]. A simpler alternative is to pool labeled data from multiple cities during training. This requires no adaptation algorithm and is applicable when target-domain annotations are unavailable.
No prior study has compared multiple SAR–optical fusion paradigms on the MSLCC dataset under a consistent cross-city evaluation protocol. This study fills that gap.

3. Materials and Methods

3.1. Study Sites

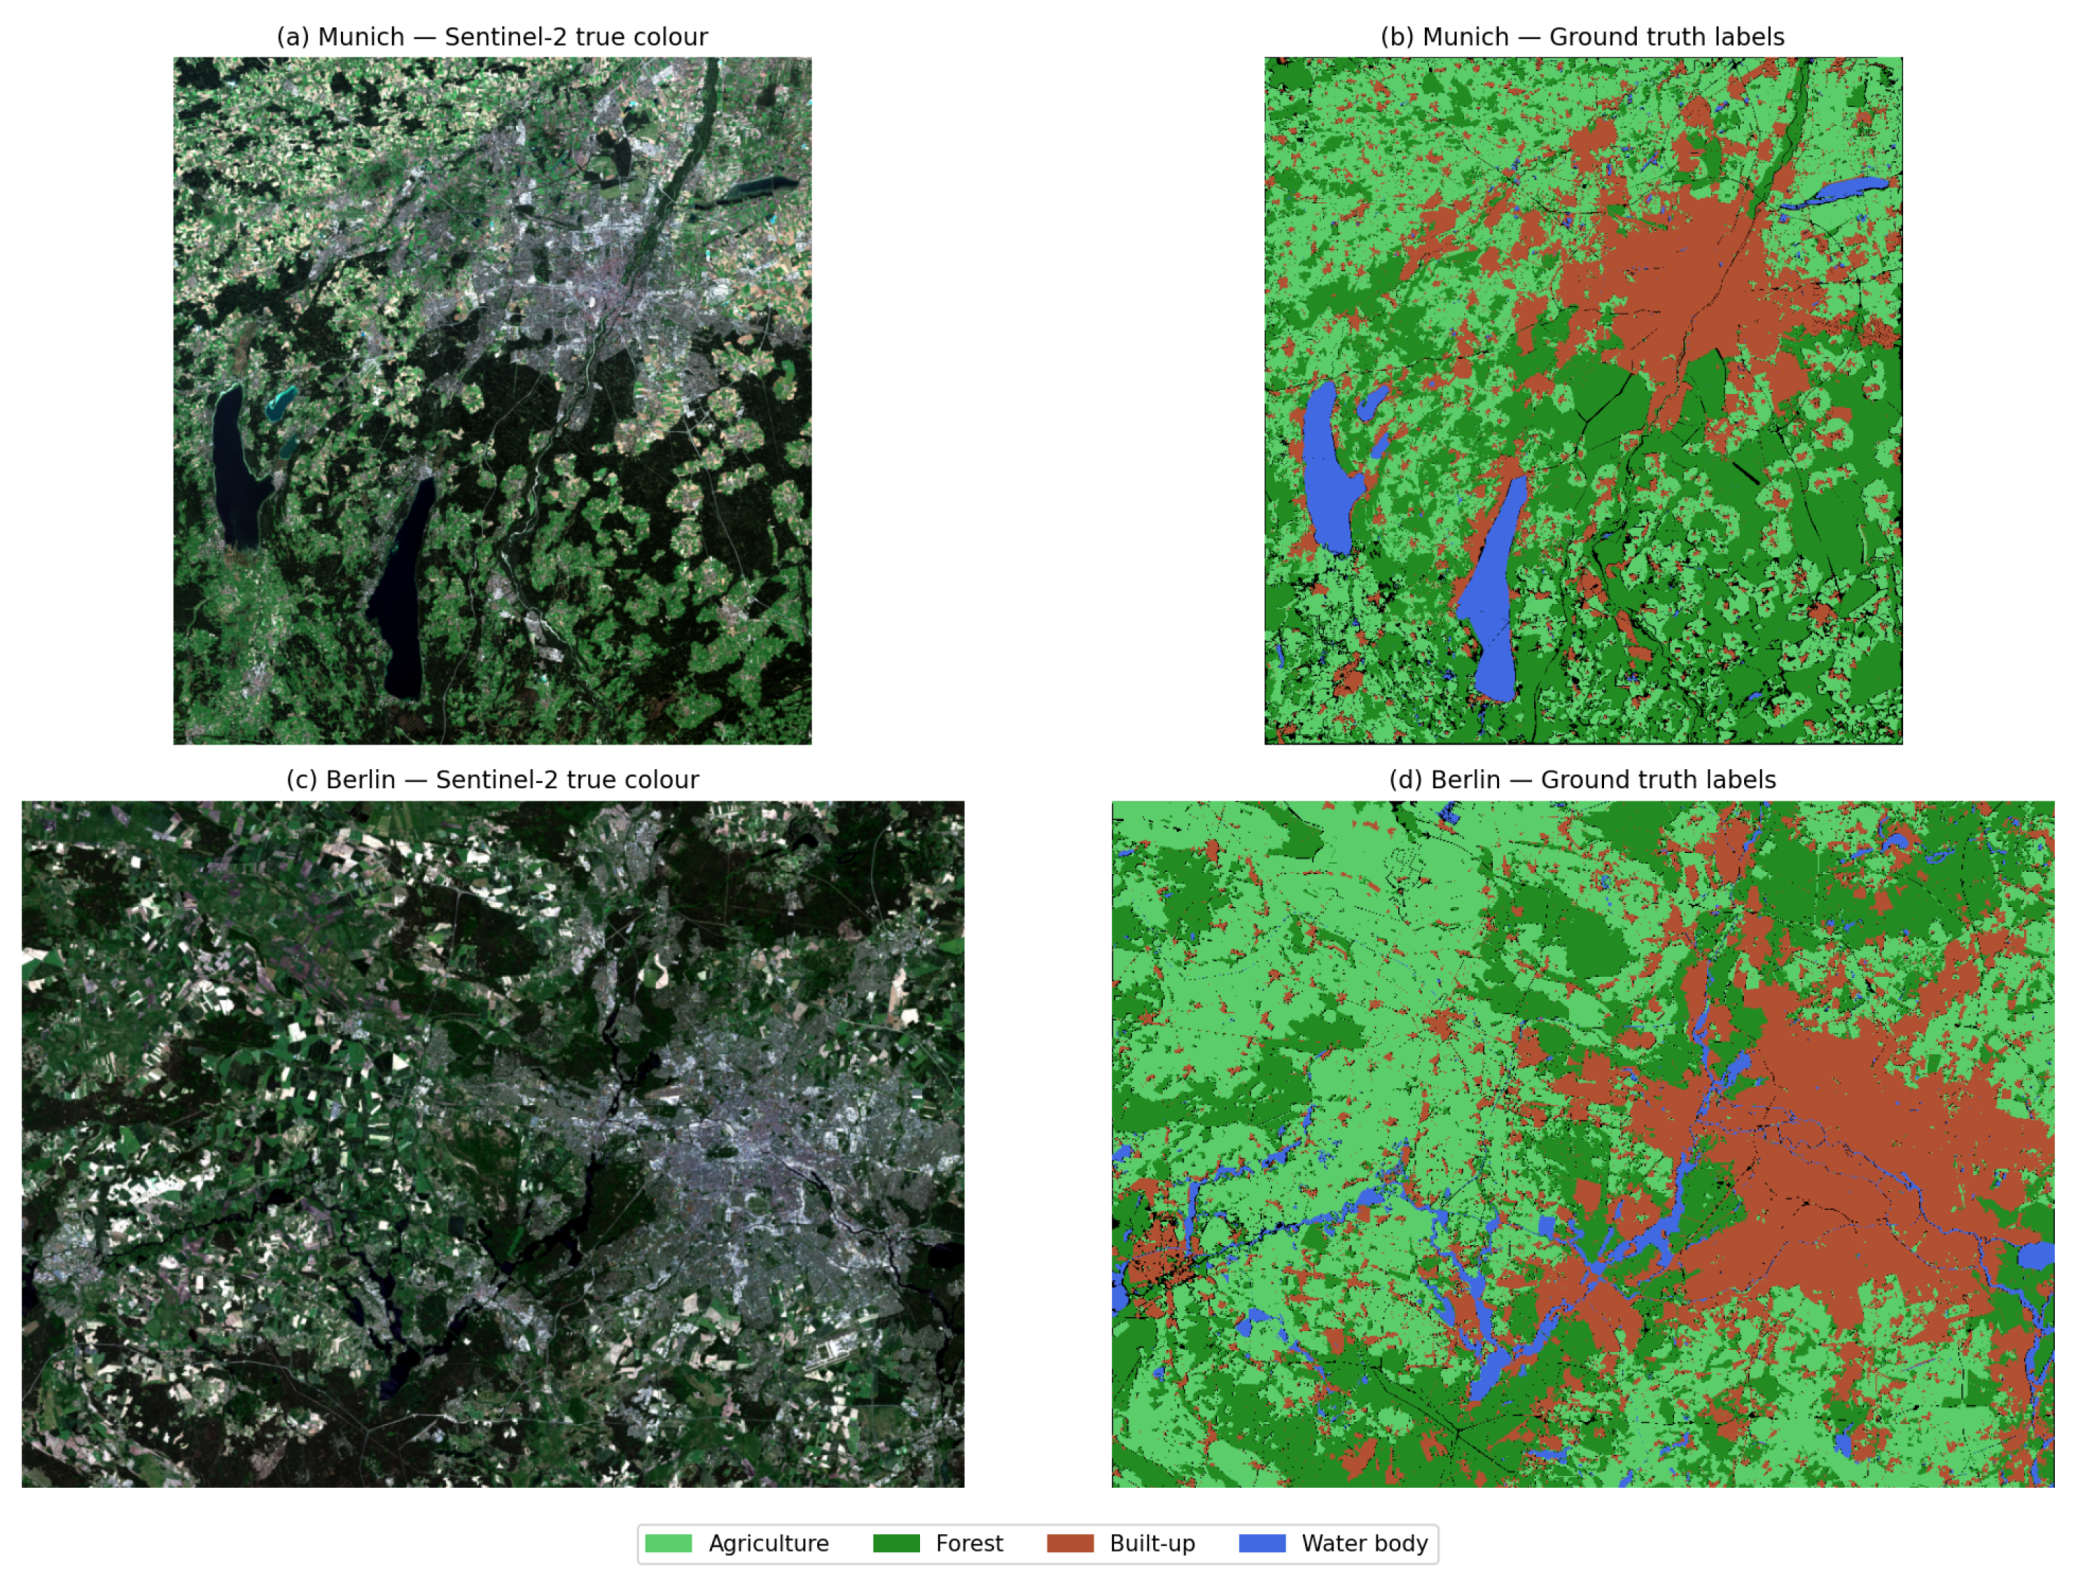
The study sites are Munich (Bavaria, southern Germany) and Berlin (northeastern Germany), together with their surrounding peri-urban and rural areas (Figure 1).
Munich is dominated by agriculture and forest in the hinterland (pre-Alpine foothills) with a compact urban core. The S1/S2 acquisition covers approximately 5596 × 6031 pixels at 10 m ground sampling distance ( 560 km2; UTM Zone 32N).
Berlin encompasses a larger and more heterogeneous urban agglomeration with extensive built-up areas, scattered forest patches (predominantly pine), agricultural fringes, and numerous lakes and water channels. The acquisition covers approximately 8149 × 5957 pixels ( 815 km2; UTM Zone 33N).
The two sites provide complementary geographic profiles: Munich is agriculture-dominant with a simple spatial layout; Berlin is urban-dominant with higher structural heterogeneity. This contrast makes the cross-city transfer experiment both challenging and informative for assessing model generalizability.

3.2. Dataset

We use the Multi-Sensor Land Cover Classification (MSLCC) dataset [10], which provides co-registered Sentinel-1B and Sentinel-2A imagery acquired in 2017 together with pixel-wise annotations for four land cover classes:
  • Agriculture—croplands, meadows, and grasslands;
  • Forest—deciduous and coniferous woodland;
  • Built-up—urban and suburban impervious surfaces;
  • Water body—rivers, lakes, and canals.
Pixels labeled 0 (NoData, corresponding to cloud shadow and edge artifacts) are excluded from all training and evaluation. Table 1 summarizes the dataset properties; Table 2 provides the class distribution.
The water body class is substantially underrepresented ( 4 % ) in both cities, necessitating explicit class-imbalance handling (Section 3.6).

3.3. Preprocessing

Sentinel-1 backscatter values (uint16 DN) were log-transformed ( x ˜ = log ( 1 + x ) ) to compress the skewed dynamic range characteristic of SAR data, then normalized to [ 0 , 1 ] by 2nd–98th percentile stretching.
Sentinel-2 reflectance values for the four native 10 m bands (B2 Blue, B3 Green, B4 Red, B8 NIR) were independently normalized using the same percentile approach.
The resulting five-channel input tensor has the channel order [ Blue , Green , Red , NIR , SAR ] .

3.4. Patch Extraction and Spatial Splits

Due to the large scene dimensions, a patch-based sampling strategy was adopted (patch size: 256 × 256 pixels; stride: 256 pixels during training, 128 pixels during inference). Patches with fewer than 50% labeled pixels were discarded to exclude low-information patches at scene boundaries and cloud-shadow regions.
To prevent spatial autocorrelation between training and test partitions [24], a row-based spatial split was applied for in-city experiments: rows [ 0 % ,   70 % ) form the training set, rows [ 70 % ,   85 % ) the validation set, and rows [ 85 % ,   100 % ] the test set. For cross-city experiments, the full source city was used for training; the first 10% of target-city rows served as validation, and the remaining 90% as the test set.

3.5. Model Architectures

3.5.1. U-Net Backbone

All U-Net variants share a four-stage encoder and a symmetric decoder with skip connections, using feature dimensions [ 32 , 64 , 128 , 256 ] . Each stage applies two 3 × 3 convolutions with batch normalization, ReLU activation, and spatial dropout ( p = 0.1 ).
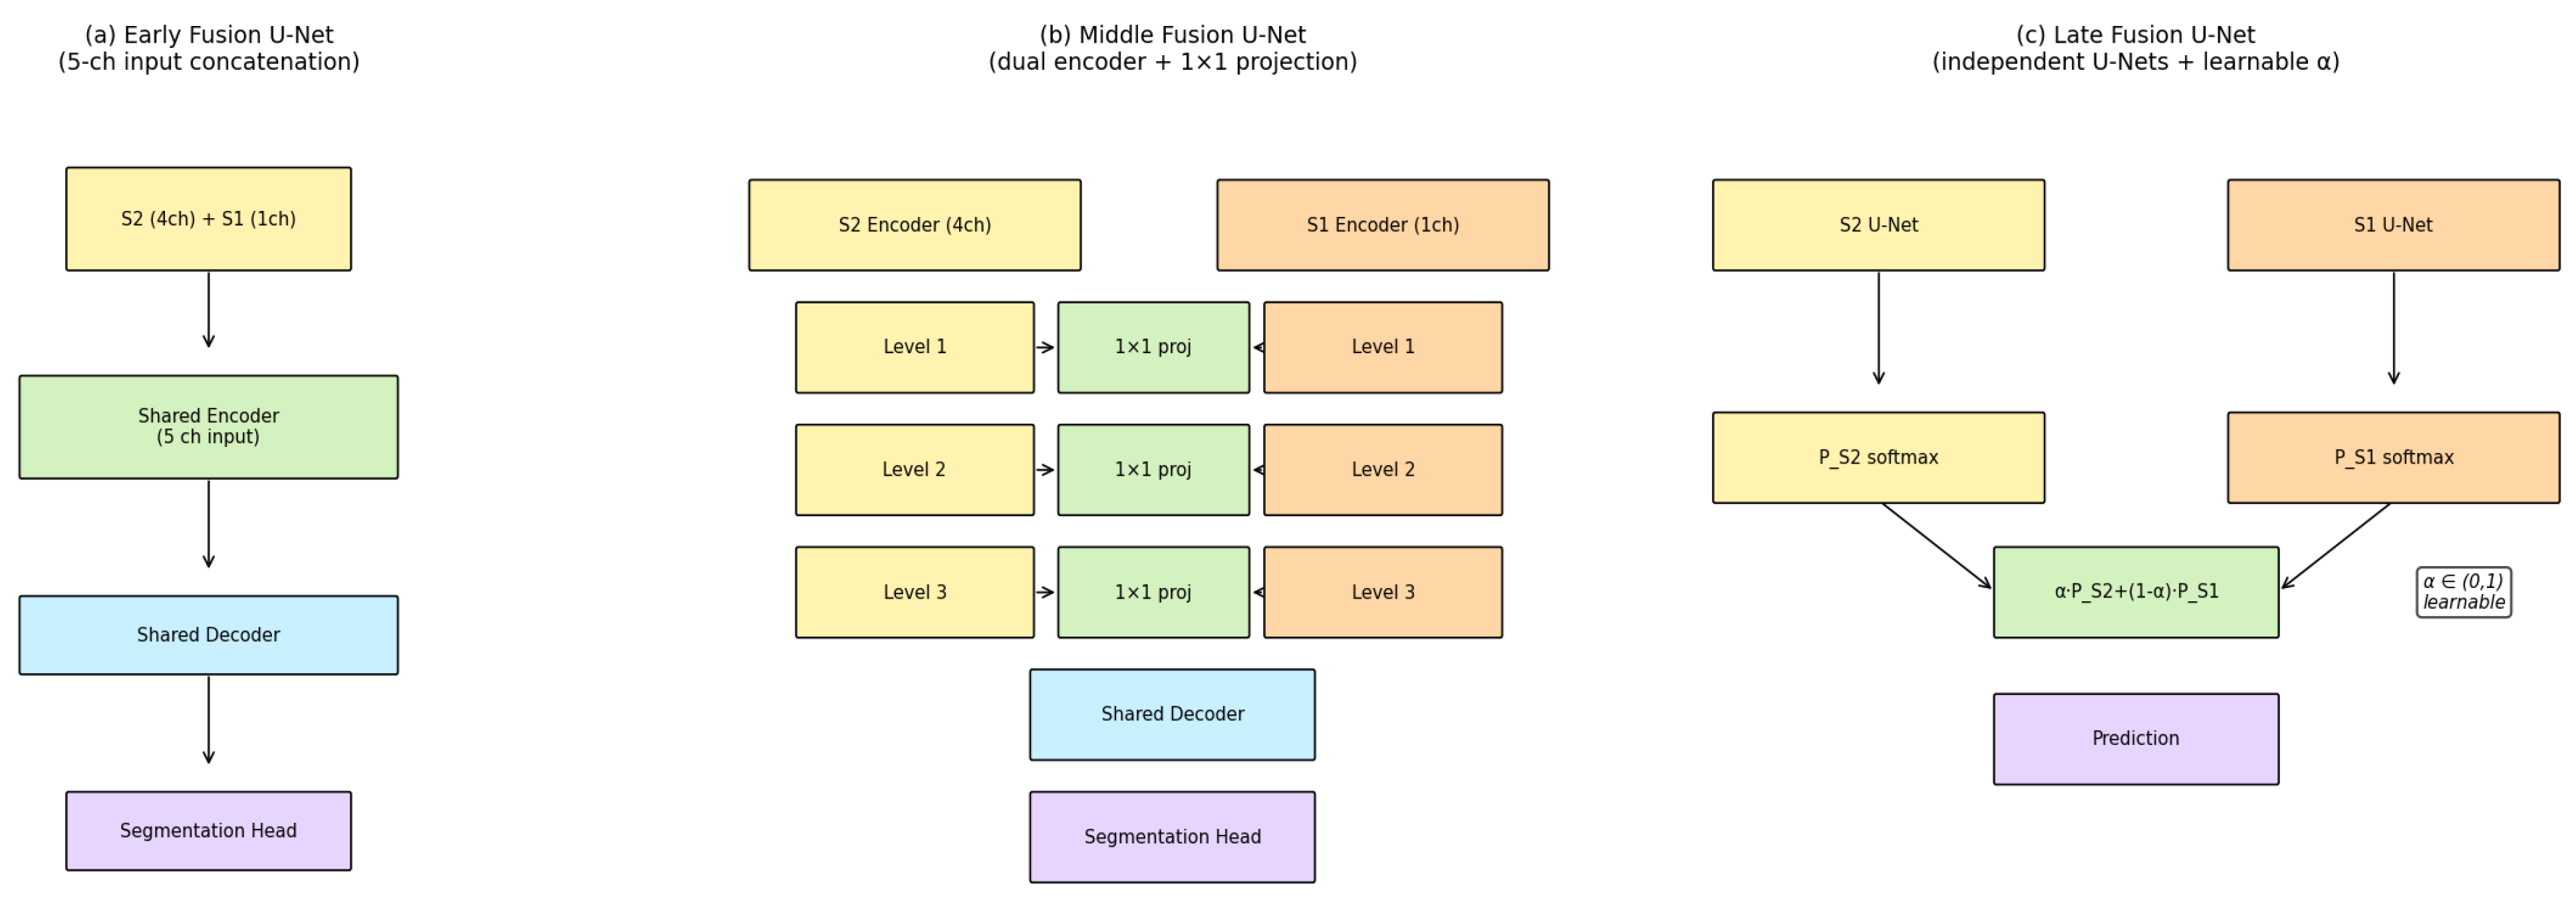
Early Fusion U-Net. The five input channels (4 S2 + 1 S1) are concatenated and passed to a single five-channel encoder (Figure 2a).
Middle Fusion U-Net. Two independent encoders process S2 (4 ch) and S1 (1 ch) separately. At each encoder level l, the feature maps F S 2 ( l ) and F S 1 ( l ) are concatenated along the channel axis and projected back to f l dimensions via a 1 × 1 convolution with batch normalization and ReLU (Figure 2b):
F fused ( l ) = BN - ReLU W 1 × 1 ( l ) F S 2 ( l ) F S 1 ( l ) , l { 1 , 2 , 3 , 4 } ,
where [ · · ] denotes channel-wise concatenation. The fused representations are passed to a shared decoder.
Late Fusion U-Net. Two complete U-Nets independently produce per-class softmax probability maps P S 2 and P S 1 . A learnable scalar α (initialized at 0.5, constrained to ( 0 , 1 ) via sigmoid) produces the fused output:
P ^ = α P S 2 + ( 1 α ) P S 1 .
Single-modality baselines. S2-only (4 ch) and S1-only (1 ch) U-Nets use the same architecture with the respective input dimensionality: the S2-only input is the four native 10 m Sentinel-2 bands (B2 Blue, B3 Green, B4 Red, B8 NIR; Section 3.3), and the S1-only input is the single VV backscatter channel available in the MSLCC dataset (Section 3.2). This four-band, 10 m-native Blue/Green/Red/NIR selection is the standard Sentinel-2 configuration for SAR–optical fusion studies at this resolution, since it is the only band set common to all Sentinel-2 products without resampling coarser 20 m/60 m bands, and matches prior large-scale Sentinel-1/2 fusion benchmarks such as SEN12MS [20]; VV is used because it is the only polarization present in the MSLCC acquisitions (Section 5.5), not a deliberate choice among alternatives.

3.5.2. SegFormer-b2

SegFormer [8] employs a Mix Transformer (MiT) hierarchical encoder and a lightweight all-MLP decoder. We use the mit-b2 variant ( 27.4 M parameters) pretrained on ImageNet-1K. The first patch-embedding convolutional layer is re-initialized to accept five-channel (early fusion) input; all remaining pretrained weights are retained. The segmentation head is re-initialized for four-class output. Decoder output ( H / 4 × W / 4 ) is bilinearly upsampled to the input resolution.

3.6. Training Protocol

All models were trained using the AdamW optimizer [25] (learning rate 10 4 , weight decay 10 4 ) with cosine annealing ( T max = 60 epochs, η min = 10 6 ) and gradient clipping (max norm = 1.0 ).
Loss function. A combined weighted cross-entropy and soft Dice loss was employed:
L = 0.6 L CE ( w ) + 0.4 L Dice ,
where class weights w are computed as inverse class frequency from the training set (Table 3). This strongly up-weights the minority water body class ( 5 × ) and down-weights the dominant agriculture class ( 0.5 × ). These weights were computed once from the Munich training partition and held fixed across all experiments, including the Berlin-only and combined-city training runs; no additional per-city class-balancing or pixel-count normalization was applied to compensate for Berlin’s larger labeled-pixel count (Table 1) or its different class composition (Table 2).
Data augmentation (training only): random horizontal flip, vertical flip, and 90° rotation (each p = 0.5 ).
Early stopping monitored validation macro-averaged F1 with patience of 12 epochs; the checkpoint with highest macro-F1 was retained for testing.

3.7. Evaluation Protocol

Ablation study (Table 4). In-city evaluation on Munich (spatial test split). Compares all five U-Net variants plus SegFormer.
Cross-city generalization (Table 5). Three transfer setups: (i) Munich → Berlin; (ii) Berlin → Munich; (iii) Combined training (70% of each city jointly, tested on held-out 15% of each city separately). U-Net cross-city experiments use the middle-fusion variant rather than the higher-performing early-fusion configuration identified in the ablation study (Section 4.1); this choice predates the completed ablation and is not otherwise justified (Section 5.5).
Metrics. Overall Accuracy (OA), Cohen’s Kappa coefficient ( κ ), per-class F1 score, macro-averaged F1 (arithmetic mean over four classes), and mean Intersection over Union (mIoU), reported in Table 4 and Table 5. NoData pixels are excluded from all computations. Water body F1 receives particular attention given the class imbalance.
Statistical significance testing. Because several macro-F1 differences between configurations are numerically small (e.g., the 0.0042-point gap between early fusion and the S2-only baseline), point estimates alone cannot establish whether an observed gain reflects a genuine effect or sampling noise in the test partition. We therefore quantify uncertainty with a patch-level paired bootstrap on the Munich in-city test set (Section 4.1): for each of 5000 replicates, the 252 test patches are resampled with replacement (the same resampled index set is applied to every configuration, preserving pairing), the per-class confusion matrix is aggregated over the resampled patches, and macro-F1 is recomputed. We report the resulting 95% percentile bootstrap confidence interval for each configuration’s macro-F1 and, for each configuration relative to a reference model, the 95% CI of the paired difference together with a two-sided bootstrap p-value (twice the smaller tail proportion of replicates on either side of zero); a difference is treated as statistically significant when its 95% CI excludes zero. Patch-level (rather than pixel-level) resampling respects the spatial dependence between pixels within a 256 × 256 patch and avoids the pseudo-replication that pixel-level resampling would introduce. Results are reported in Section 4.1 (Table 6) and discussed in Section 5.1. Code and cached per-patch predictions are provided alongside the training code.

4. Results

4.1. Fusion Ablation Study

Table 4 reports in-city performance on the Munich test set.
Table 6 reports the patch-level paired bootstrap significance test (Section 3.7) for every configuration’s macro-F1 relative to two reference models: the S2-only baseline (the relevant comparison for whether adding SAR helps at all) and the best-performing U-Net configuration, early fusion (the relevant comparison for the feature-engineering variants in Section 4.3).
Two results in Table 6 qualify the ablation findings above. First, early fusion’s macro-F1 gain over S2-only, although numerically small (0.0042), is statistically significant (95% CI [ + 0.0015 , + 0.0061 ] , p = 0.006 ): SAR inclusion under early fusion produces a genuine, if modest, improvement rather than noise. Second, middle and late fusion are not merely lower than early fusion—both are significantly worse than the S2-only baseline itself (middle: p < 0.001 ; late: p = 0.030 ), meaning that combining SAR via these two strategies actively degrades performance relative to using optical data alone, rather than simply under-exploiting the SAR signal. SegFormer’s small gap below S2-only ( 0.0021 ) is not statistically significant ( p = 0.180 ), but its gap below U-Net early fusion ( 0.0064 ) is ( p = 0.005 ); this distinction is discussed in Section 5.3.
Among all configurations, U-Net early fusion achieved the highest overall performance (OA = 0.8392, κ = 0.7223, macro-F1 = 0.8278, mIoU = 0.7108). The optical-only baseline (S2-only) substantially outperformed the SAR-only baseline (macro-F1: 0.8236 vs. 0.6864), reflecting the richer spectral discrimination of the four-band multispectral input at 10 m. Adding Sentinel-1 to the optical baseline improved macro-F1 by 0.004 points (statistically significant; Table 6), with the largest per-class gain in built-up (+0.010 F1). SegFormer-b2 attained macro-F1 = 0.8214, remaining close to the best U-Net early-fusion model while matching its agriculture performance and improving water-body F1. The water body class achieved uniformly high F1 across all configurations (range: 0.8392–0.9069 across completed experiments), attributable to the class-weighted loss function and the strong dual-signal (low SAR backscatter + high NIR absorption) of open water. Per-class analysis and comparison across fusion strategies are discussed in Section 5.

4.2. Cross-City Generalization

Table 5 reports cross-city transfer performance.
U-Net Middle cross-city transfer scores (0.8456 for Munich → Berlin, 0.8509 for Berlin → Munich) were comparable to or above the in-city Middle baseline (0.8164), though a strict comparison is confounded by the larger cross-city test strips used here (90% vs. 15% of city rows). SegFormer-b2 recorded macro-F1 of 0.8632 (Munich → Berlin) and 0.8608 (Berlin → Munich), compared to its in-city score of 0.8214. Combined training on both cities further improved results, recovering 0.012 macro-F1 points relative to the single-direction U-Net average and 0.006 points relative to the single-direction SegFormer average. Section 5 analyses these asymmetries in detail.

4.3. Feature Engineering: Spectral Indices and Channel Attention

Table 4 (lower panel) reports results for four feature-engineering variants, all evaluated on the Munich in-city test set. Contrary to expectation, none of the variants improved over the plain early-fusion baseline (macro-F1 = 0.8278). The S2+indices variant (NDVI, NDWI, ExG appended; no SAR) achieved macro-F1 of 0.8174, a drop of 0.006 points relative to the raw S2-only baseline (0.8236). Adding SE channel attention to the standard five-channel input (Early+SE) yielded macro-F1 of 0.8268, effectively matching the plain early-fusion model within experimental noise. The eight-channel variant (S1+S2+indices, no SE) reached 0.8205, and the combined eight-channel+SE configuration attained macro-F1 of 0.8241—all below the plain early-fusion ceiling. These results are discussed in Section 5.4.

4.4. Training Curves

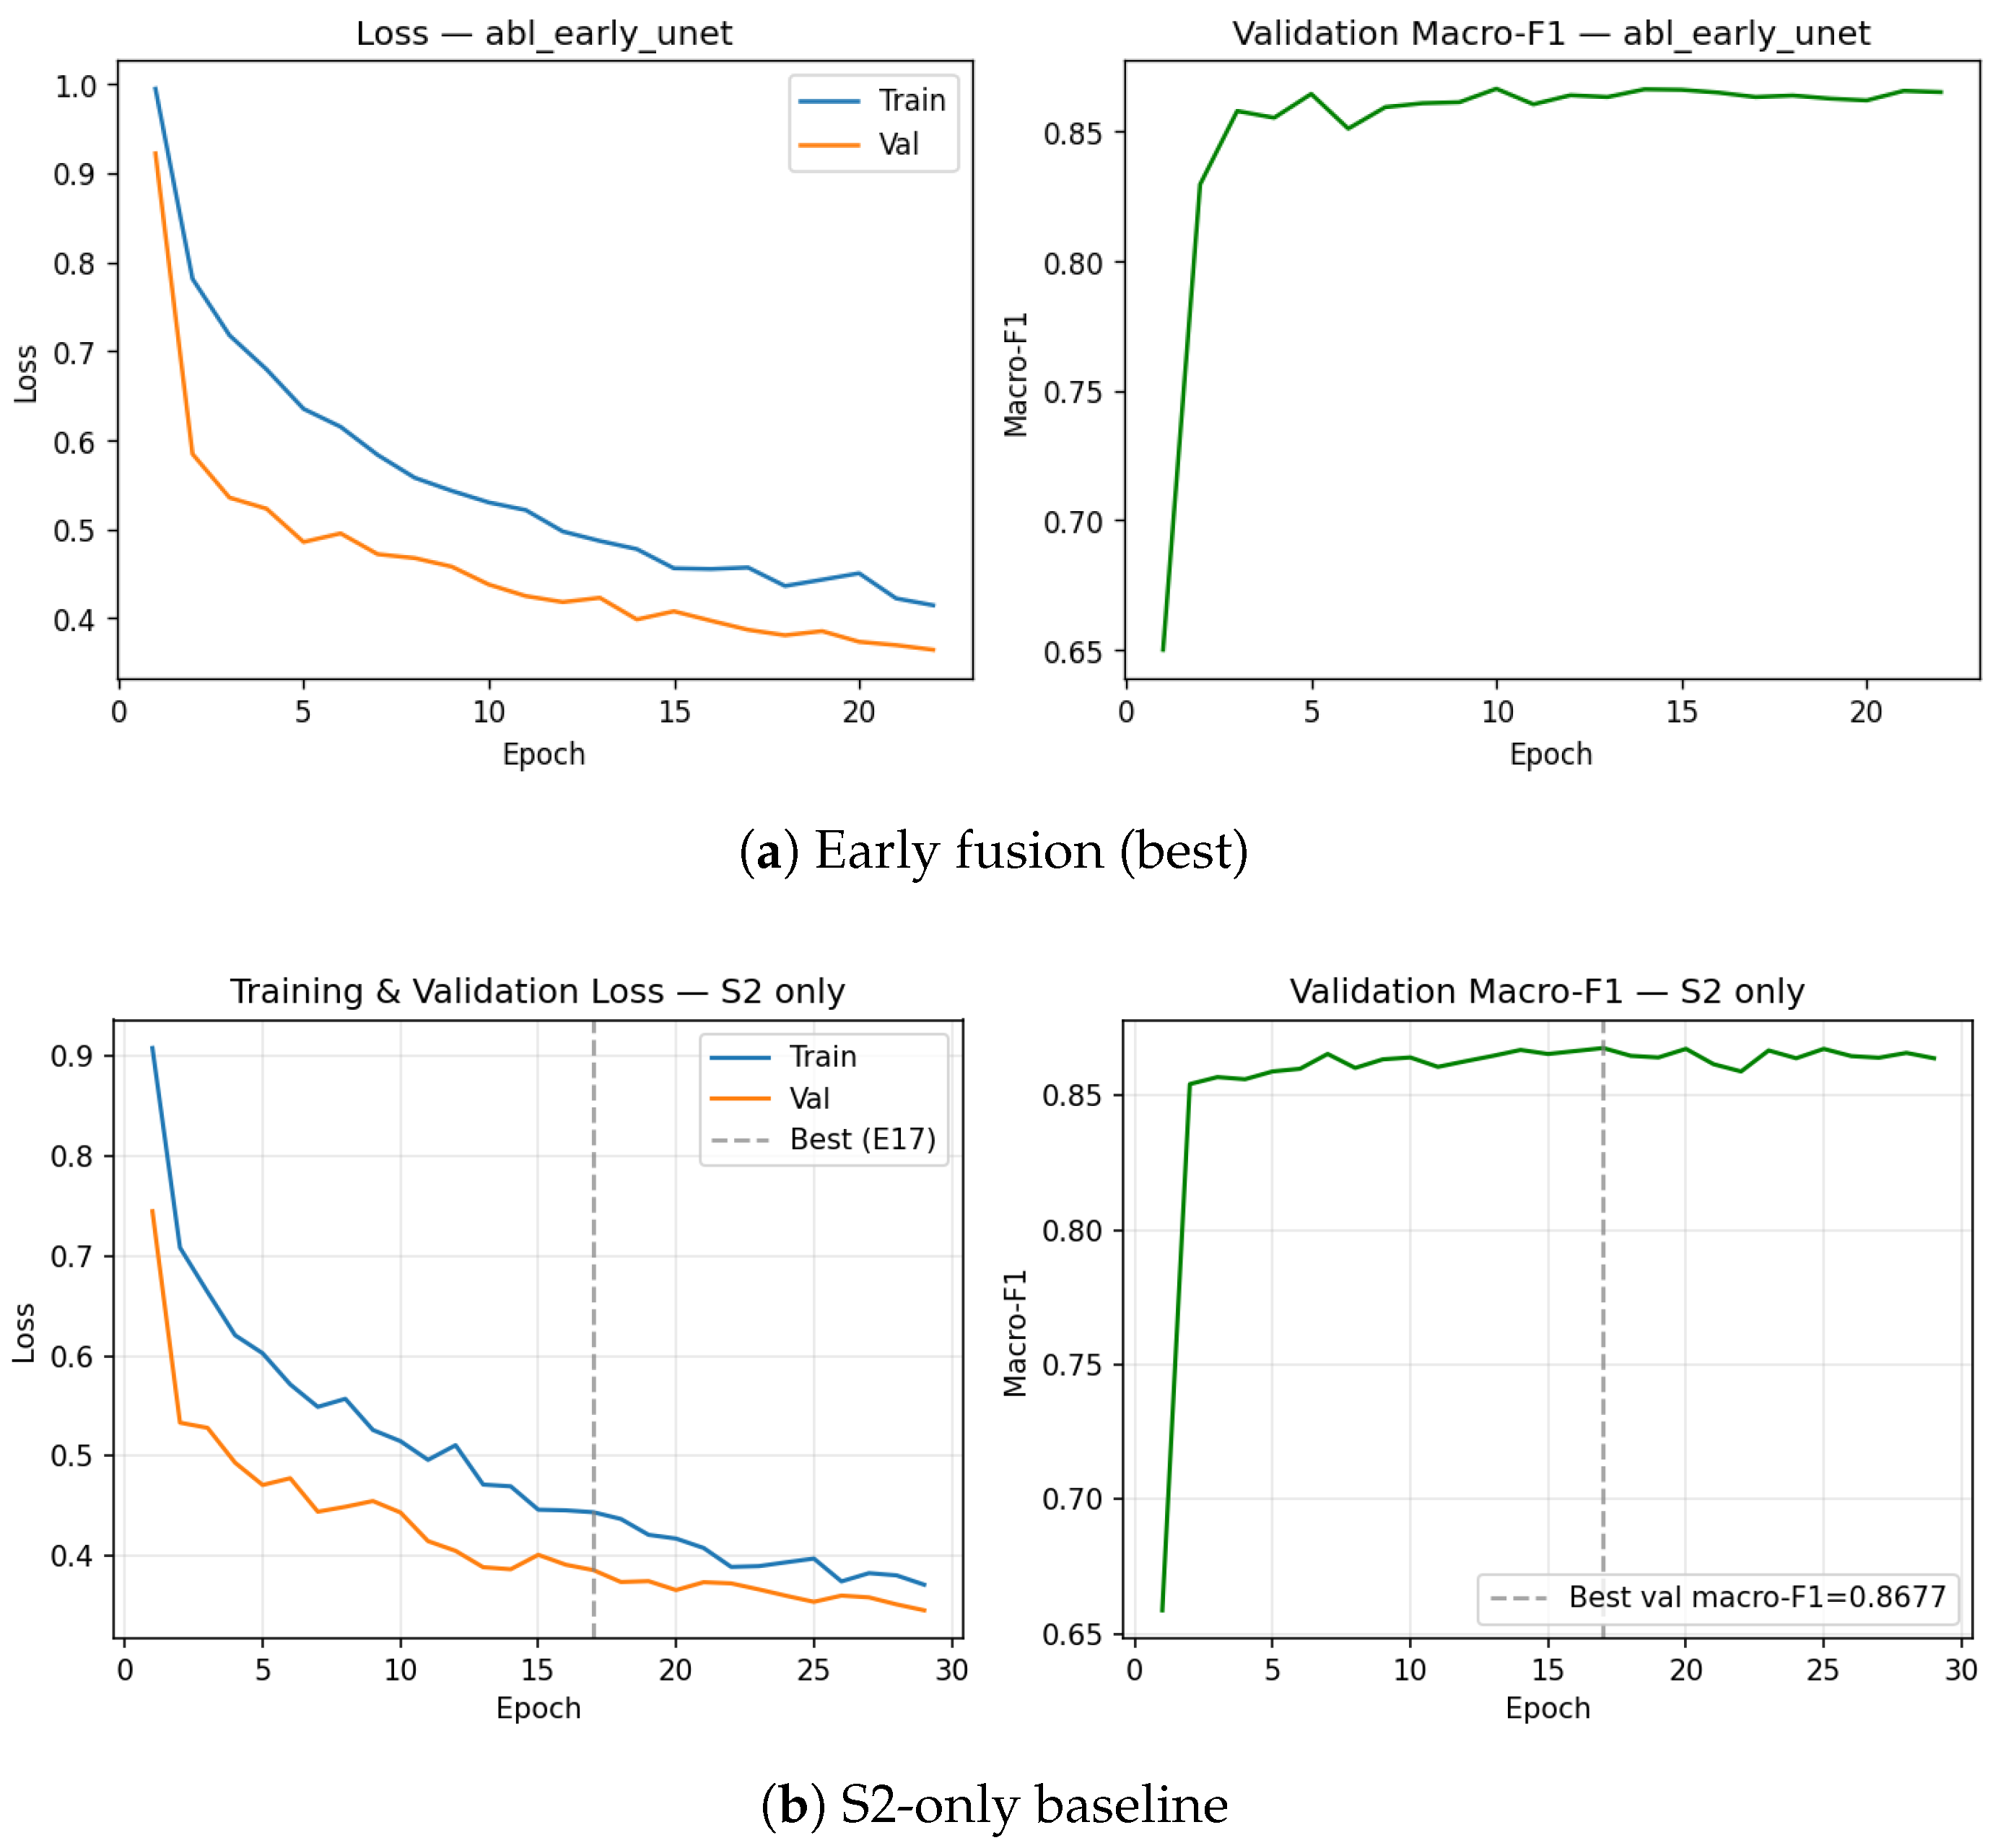
Figure 3 shows the validation macro-F1 learning curves over training epochs for the best-performing early fusion model and the S2-only baseline.
Both configurations converge within 20 epochs under early stopping; the early fusion model consistently outperforms the optical-only baseline after approximately epoch 5, confirming that the marginal SAR contribution accumulates gradually rather than materializing at a single training step. The early fusion curve (panel a) rises steeply during the first five epochs, then plateaus around macro-F1 ≈ 0.82–0.83, with minor fluctuations before the early stopping criterion is triggered. The S2-only curve (panel b) follows a similar trajectory but settles at a slightly lower value, consistent with the 0.004 macro-F1 margin reported in Table 4. Both curves show smooth convergence without pronounced oscillations, indicating that the class-weighted cross-entropy loss and the AdamW optimizer with cosine annealing provided stable training dynamics across the 256-pixel patch size used here. The modest but persistent performance gap between the two curves from epoch 5 onward supports the interpretation that SAR-derived backscatter provides complementary cues for built-up and water body discrimination that cannot be recovered from optical bands alone.
The shape of the early fusion learning curve also provides indirect evidence about the role of the SAR channel during the learning process. The steep initial rise shared by both models reflects rapid learning of broad spectral class boundaries driven primarily by the four Sentinel-2 bands, which carry the dominant discriminative signal at 10 m resolution. The subsequent, slower ascent observed exclusively in the early fusion model corresponds to the incremental integration of SAR structural cues—chiefly double-bounce returns from built-up structures and low-backscatter signatures of water surfaces—into the joint feature space. This two-phase pattern is consistent with the known complementarity of optical and radar modalities: the network first learns to separate vegetation spectral types (agriculture vs. forest) using optical bands, and then refines the built-up and water boundaries using the additional SAR channel. The plateau reached after early stopping shows no sign of overfitting, as validation macro-F1 does not decrease at any point in either run, suggesting that the spatial holdout strategy—assigning entire row-strips to the test set—was effective at removing spatial leakage between training and validation patches.

4.5. Qualitative Analysis

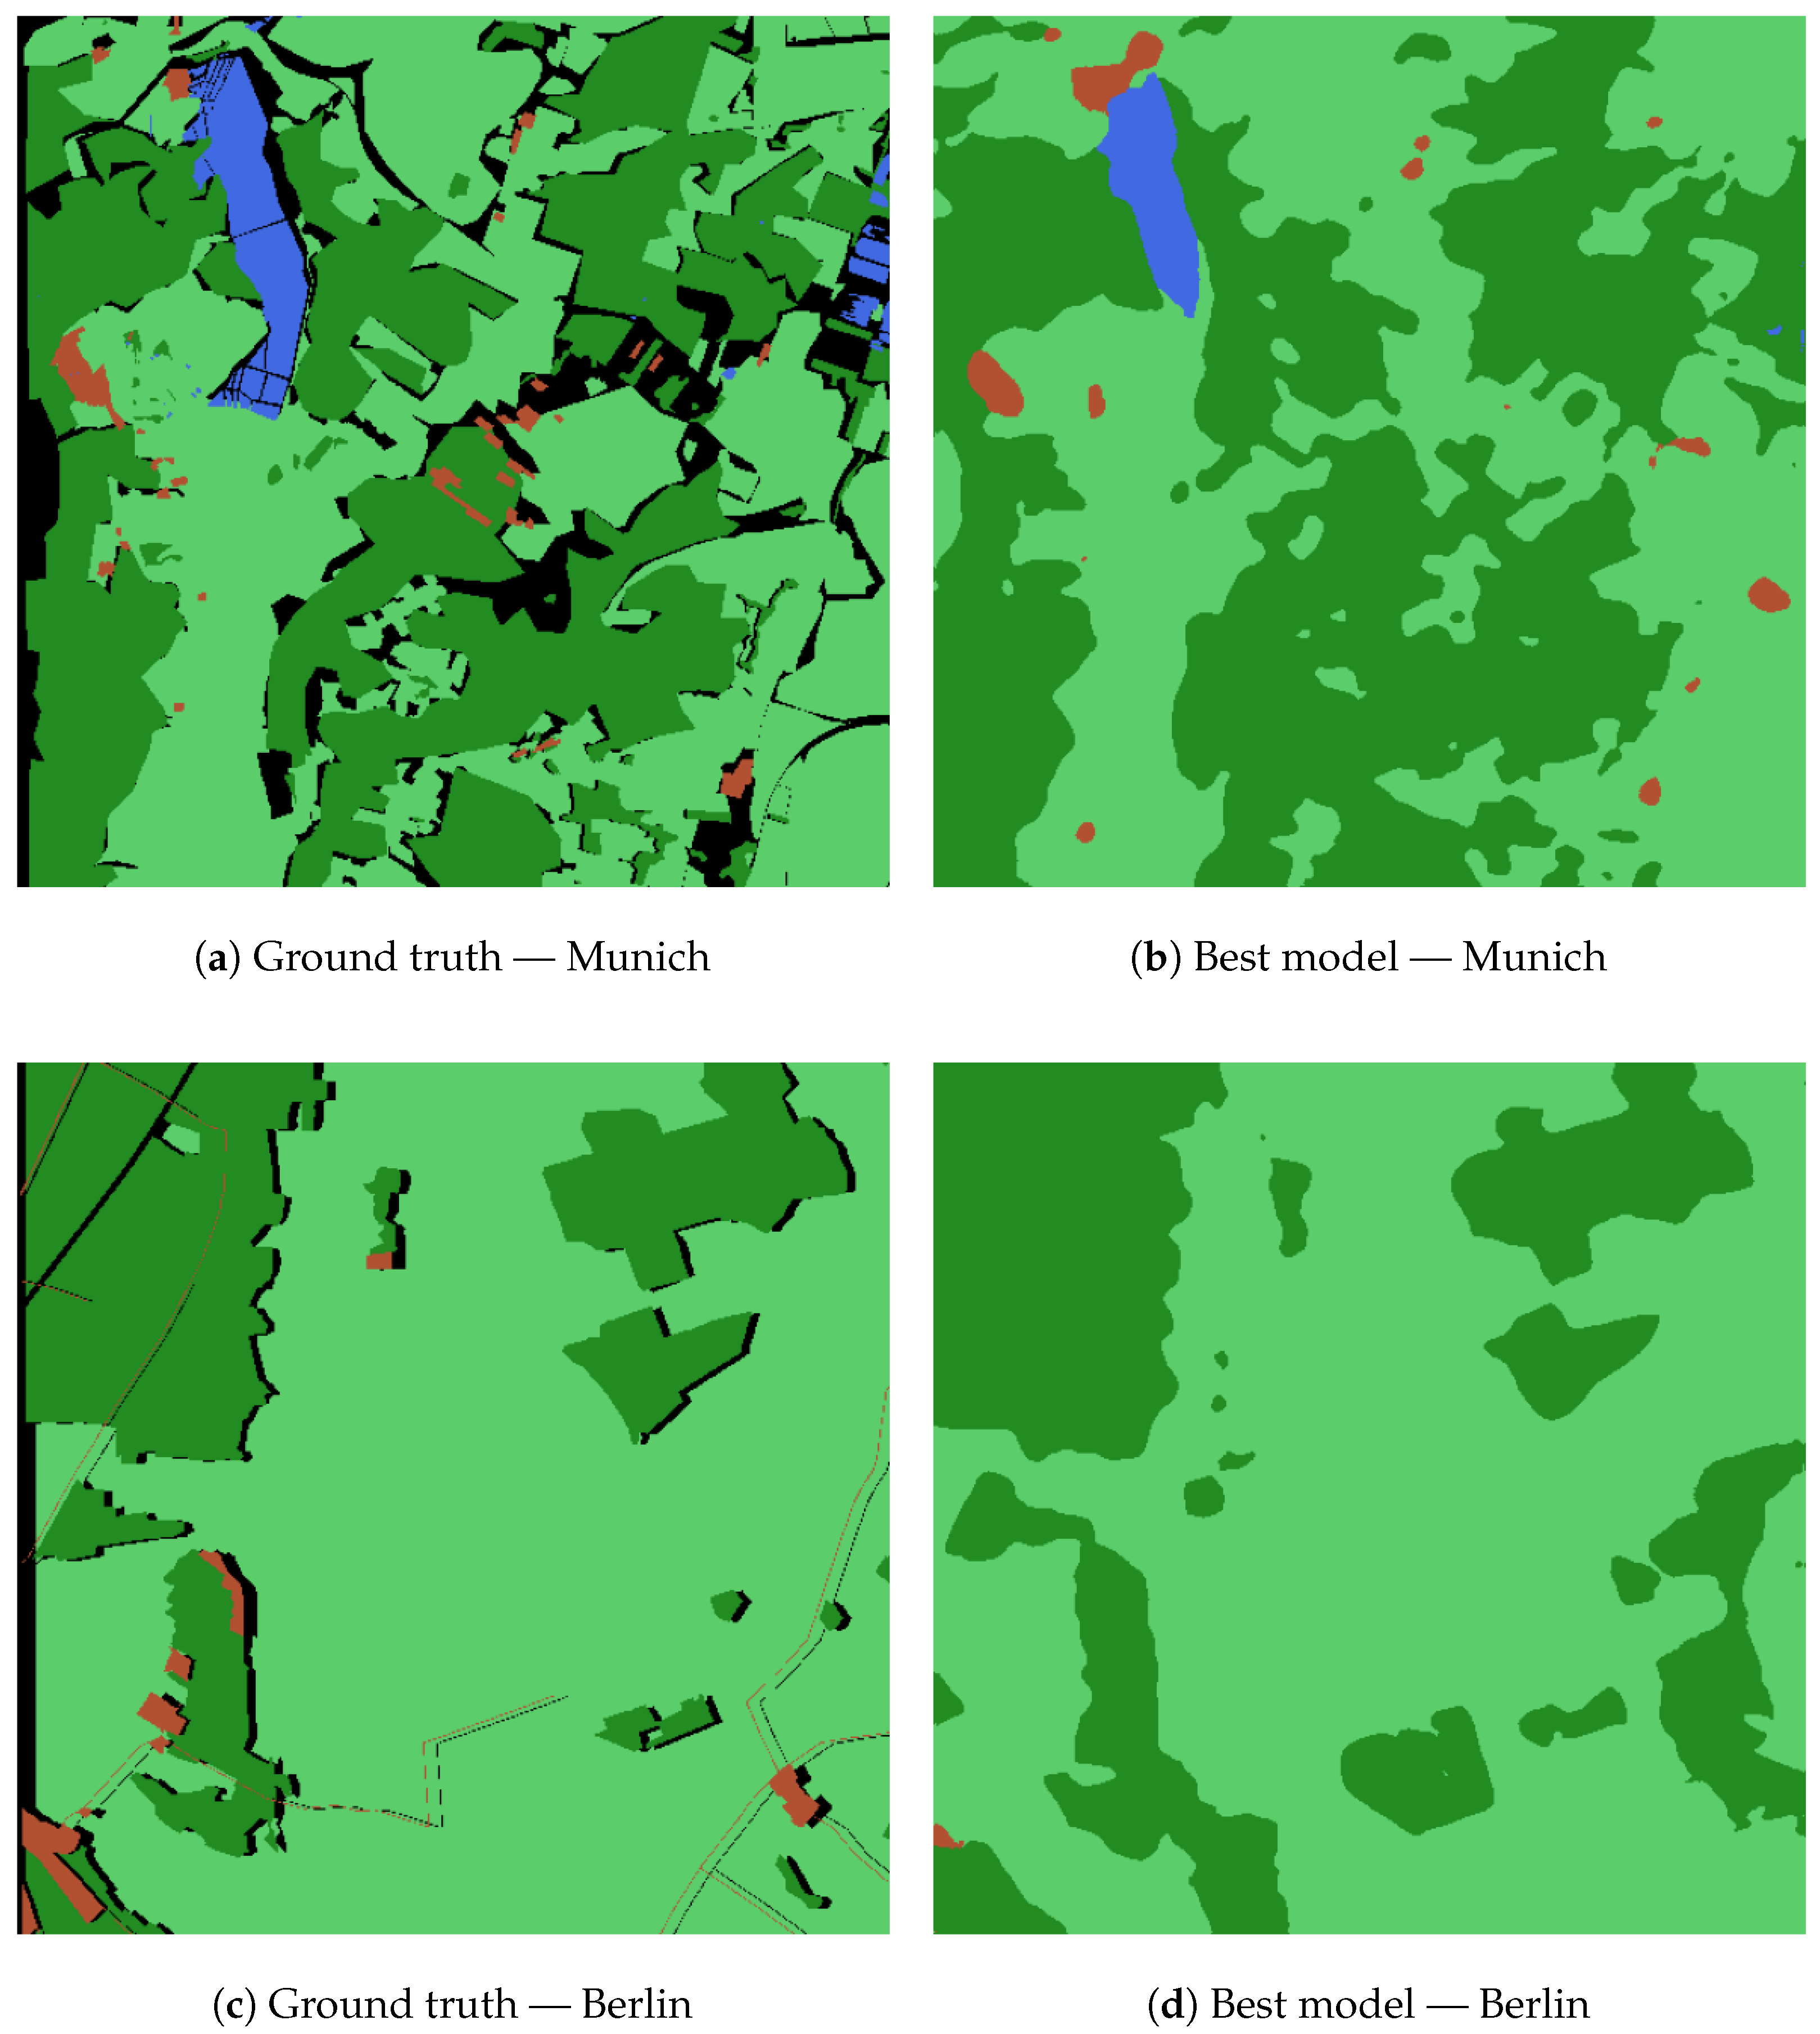
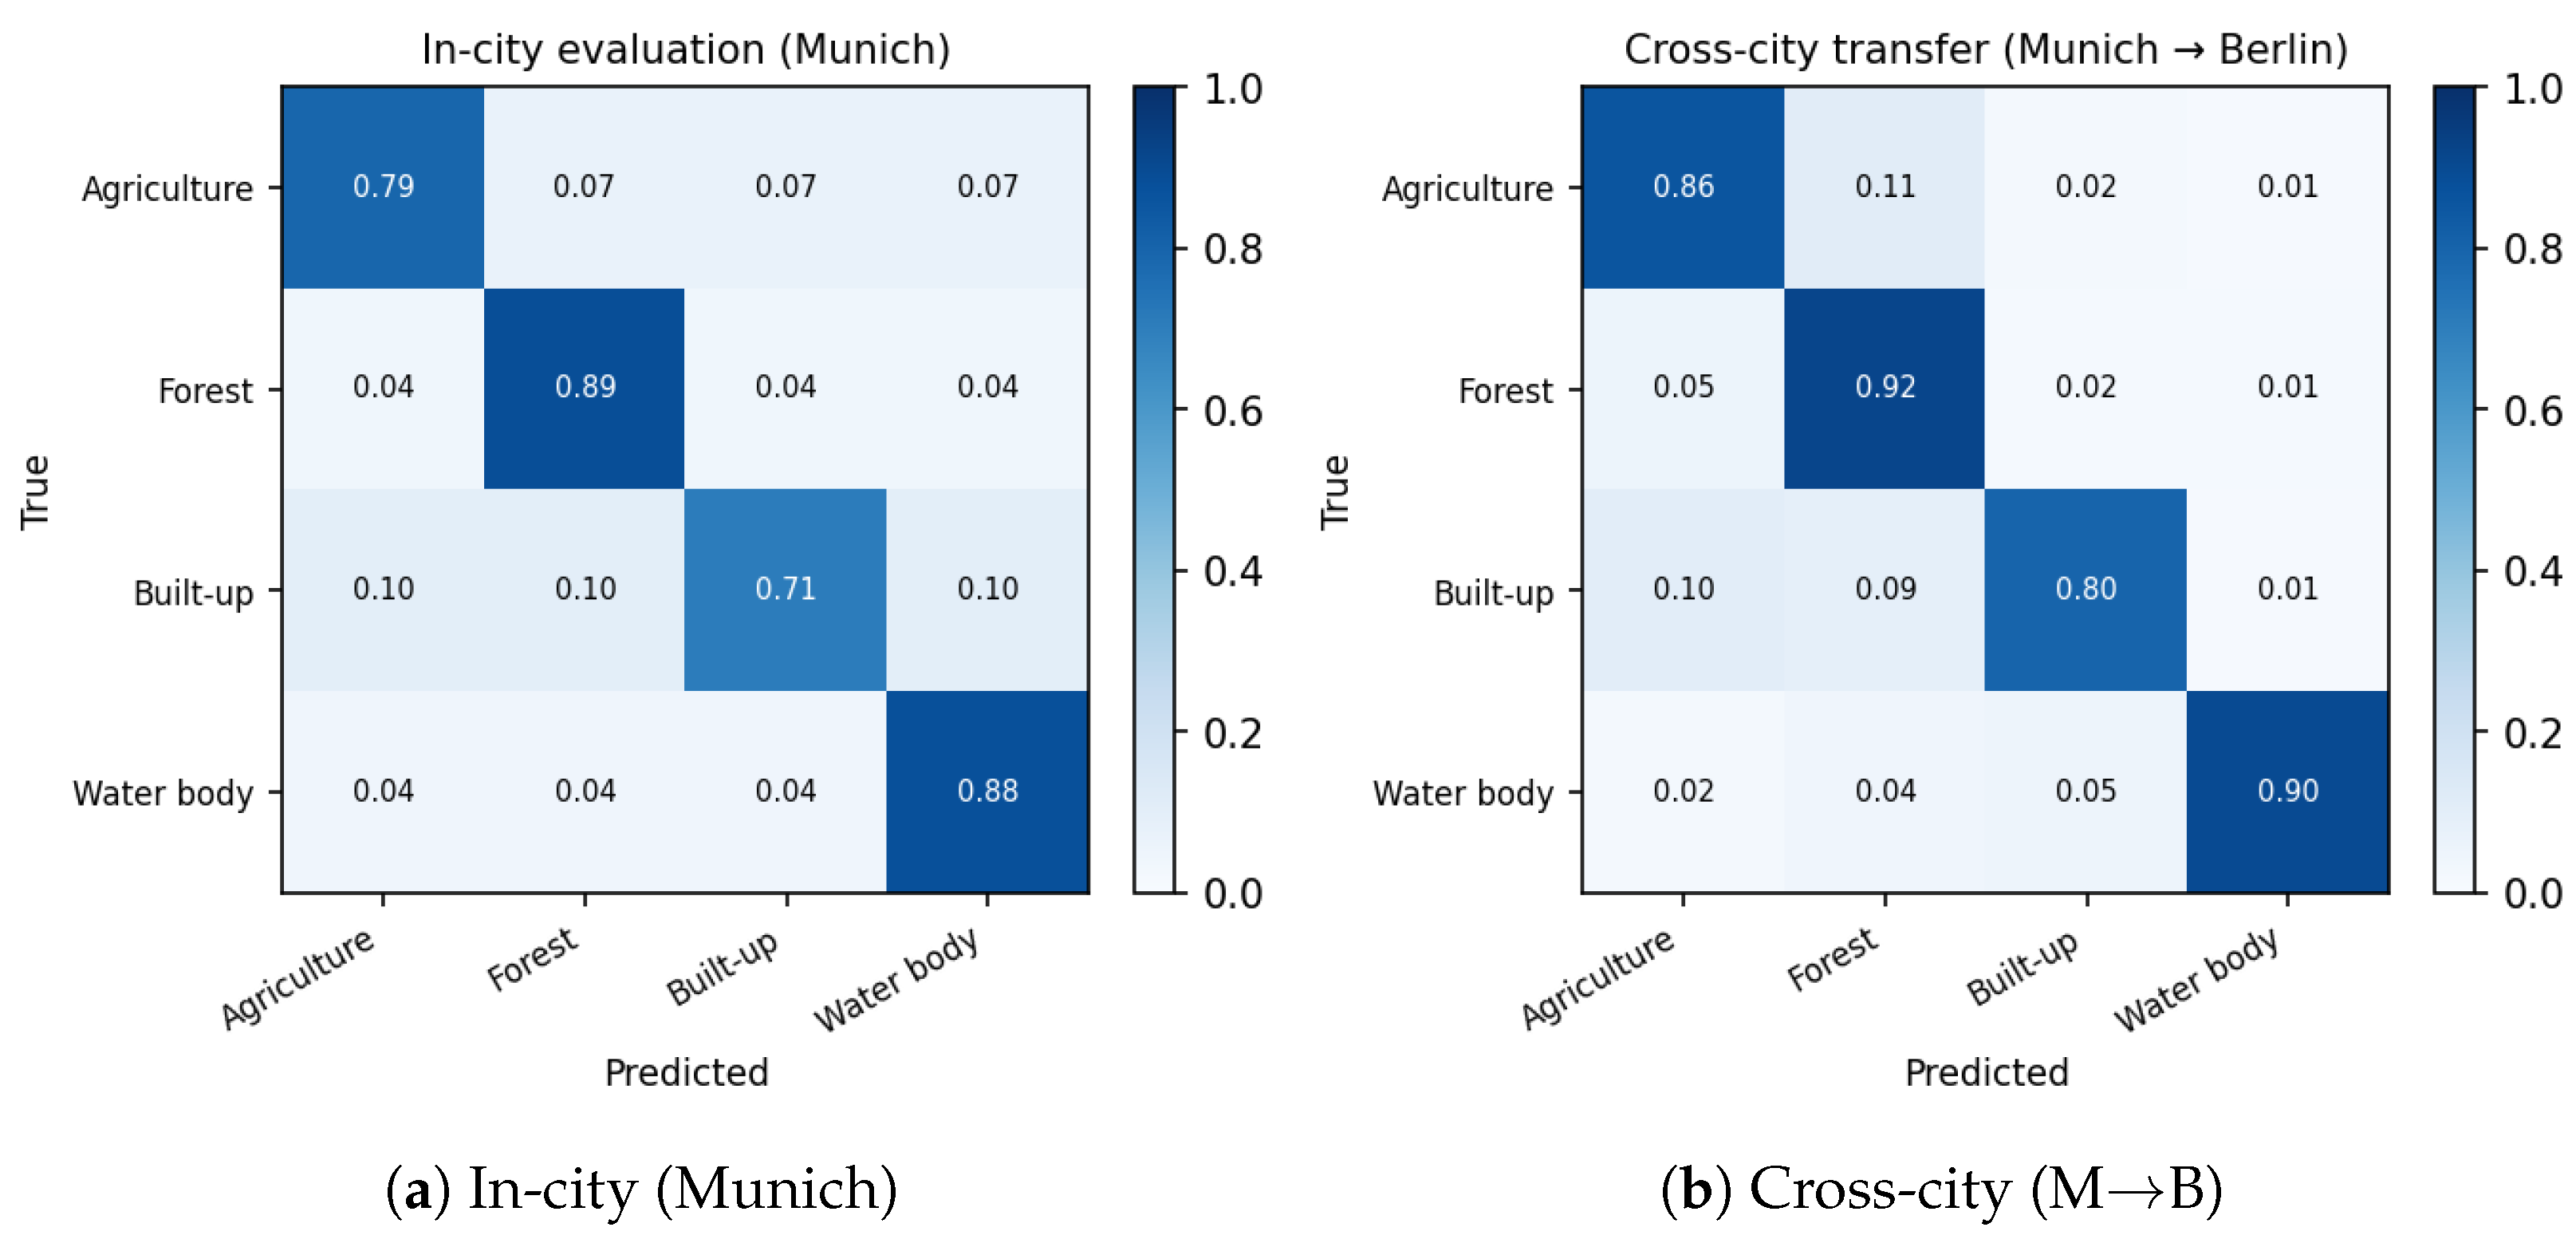
Figure 4 shows predicted segmentation maps for representative sub-regions of Munich and Berlin under the best-performing U-Net early fusion model. Figure 5 shows recall-normalized confusion matrices for the in-city Munich test set and the Munich → Berlin cross-city transfer setting.
The predicted maps closely reproduce the spatial layout of the four land cover classes in both cities. Large contiguous agricultural blocks and water bodies are recovered with high fidelity, consistent with the per-class F1 scores of 0.8045 (agriculture) and 0.8983 (water) reported in Table 4. Forest patches are well delineated in the Munich sub-region, matching the highest per-class score (F1 = 0.8693); minor under-segmentation appears at ecotone boundaries where forest transitions into agricultural land. The main source of spatial error is built-up fragmentation: isolated or ribbon-shaped settlements embedded in agricultural fields tend to be partially misclassified as agriculture or NoData, in line with the lowest per-class score (F1 = 0.7390). In the Berlin sub-region, the model generalizes well to the denser urban fabric, though fine-grained suburban structures near the city margin show similar fragmentation artifacts. Elongated linear features—road corridors, canal embankments, and windbreak hedgerows—are systematically mapped as built-up or NoData regardless of their true class, reflecting the sub-pixel width of these structures at 10 m resolution; this is an inherent limitation of the spatial resolution rather than a model deficiency. Within large agricultural parcels, predictions are spatially coherent with smooth interiors and well-defined boundaries, indicating that the 256-pixel patch size adequately captures field-scale texture. Munich patches contain smaller, irregularly shaped parcels with higher edge density, whereas Berlin patches are dominated by large rectangular fields typical of the Brandenburg plateau; the model adapts to both geometries without explicit augmentation.
Figure 5 shows recall-normalized confusion matrices for the in-city Munich test set and the Munich → Berlin cross-city transfer setting.
In the in-city setting (panel a), the diagonal is consistently high across all four classes, with water body achieving near-perfect recall. The dominant off-diagonal entries are agriculture ↔ built-up confusion at the urban–rural fringe, and a smaller forest → agriculture leak at low-canopy margins. In the cross-city setting (panel b), the confusion pattern shifts noticeably: built-up recall improves, reflecting Berlin’s more regular grid-like impervious surfaces that are better captured by learned SAR backscatter cues, while water body recall decreases modestly, likely because Berlin’s smaller and more fragmented water bodies differ in SAR texture from the larger Bavarian lakes in the Munich training set. The agriculture class maintains stable recall across both settings, confirming that the spectral and structural signatures of cropland generalize across the two contrasting urban–agricultural gradients.

5. Discussion

5.1. Effect of Fusion Strategy

Contrary to the common expectation that feature-level fusion should outperform input-level concatenation, early fusion achieved the highest macro-F1 (0.8278) among all U-Net configurations, narrowly exceeding S2-only (0.8236) and feature-level (middle) fusion (0.8164). The ordering early > S2-only > late > middle > S1-only held consistently across overall accuracy and mIoU, and is consistent with the structure of the MSLCC input data. This ranking is established only for the convolutional (U-Net) architectures evaluated here and only on the Munich scene; SegFormer-b2 was tested exclusively under early fusion, and no equivalent ablation was run on Berlin (Section 5.5).
The underperformance of middle fusion relative to early fusion deserves closer attention. In middle fusion, the S1 encoder receives a single-channel input that provides far less supervisory signal per parameter than the four-band S2 encoder; the asymmetry in channel dimensionality (1 vs. 4) causes the SAR encoder branch to underfit, producing representations that add limited discriminative value when concatenated to the S2 features at each scale. Early fusion, by contrast, commits both modalities to a shared five-channel encoder, allowing the network to weight each channel by its actual discriminative content—in effect suppressing the SAR channel where it adds little and leaning on it where it does. At the feature dimensionality used here ( [ 32 , 64 , 128 , 256 ] ) and the training set size available for Munich alone, the dual-encoder design of middle fusion appears to overparameterize the model for the Munich training set size, leading the single-channel SAR branch to underfit. This is not merely a smaller gain than early fusion: the paired bootstrap test (Table 6) shows middle fusion is significantly worse than the S2-only baseline ( Δ = 0.0072 , p < 0.001 ), i.e., forcing SAR through a dedicated dual-encoder branch actively harms accuracy relative to discarding SAR altogether under this data budget, rather than merely failing to help. Late fusion (macro-F1: 0.8196) ranked third among the five configurations, below early fusion and the S2-only baseline but above middle fusion (0.8164). Late fusion’s deficit relative to early fusion follows from the fact that its independent per-modality classification branches cannot exploit the cross-modal interactions that arise during joint feature extraction. Its outperformance of middle fusion suggests that probability-space decision combination is more robust than asymmetric dual-encoder feature merging when the S1 branch carries only a single input channel, since forcing a full encoder stack onto a 1-channel input yields representations with limited discriminative content that dilute rather than augment the S2 features at each scale. Like middle fusion, late fusion is also significantly worse than S2-only ( Δ = 0.0040 , p = 0.030 ; Table 6), though the effect is smaller and closer to the significance threshold than middle fusion’s. The converged value of the learnable blending scalar α (Section 3.5) directly quantifies the model’s learned relative weighting of optical versus SAR evidence: α = 0.624 , i.e., the trained late-fusion model weights the S2 (optical) branch’s softmax output at 62.4 % and the S1 (SAR) branch at 37.6 % . This is consistent with the single-modality ablation above—the model allocates the majority, but not the entirety, of its confidence to the optical stream, mirroring the macro-F1 gap between S2-only (0.8236) and S1-only (0.6864).
The single-modality results confirm the expected role of each sensor. S1-only (macro-F1 = 0.6864) lagged S2-only (0.8236) by 15.7 percentage points, confirming that optical reflectance carries most of the discriminative signal at 10 m. The deficit was extreme for built-up surfaces: S1-only F1 of 0.3863 vs. S2-only 0.7289, a gap of 34.3 points driven by the inability of a single VV-polarization channel to separate impervious surfaces from bare soil and dry vegetation without spectral context [6]. By contrast, water body discrimination was strong from SAR alone (S1-only F1 = 0.8392), as specular reflection over open water produces near-zero VV backscatter—a physically unambiguous signal. Agriculture (S1-only F1 = 0.7465) and forest (0.7736) were moderately well-classified by SAR alone, reflecting the distinct roughness and volume scattering regimes of cropland and canopy, though both trailed their S2-only counterparts (agriculture: 0.7925, forest: 0.8660).
Adding Sentinel-1 to the S2 baseline improved built-up F1 by 0.7390 0.7289 = 0.0101 points under early fusion, confirming that the incremental SAR contribution at this spatial resolution and with a single acquisition is class-specific and modest for vegetation classes. The practical implication is that for agricultural LULC classification at 10 m resolution, a well-trained S2-only model is already a strong baseline; SAR inclusion improves boundary precision for impervious surfaces but is unlikely to substantially differentiate crop types without multi-temporal acquisitions [26]. This conclusion is further conditioned on the single VV-polarization SAR input used here, since VH backscatter—unavailable in this dataset—is the channel most sensitive to vegetation volume scattering; the class-specific, vegetation-marginal SAR benefit reported above should not be extrapolated to dual-polarization (VV + VH) SAR (Section 5.5).

5.2. Cross-City Generalization

Both cross-city transfer directions outperformed in-city Middle fusion (0.8164), with Munich → Berlin achieving macro-F1 of 0.8456 and Berlin → Munich achieving 0.8509. The two directions are nearly symmetric (difference: 0.005 points), suggesting that the between-city distribution shift is modest relative to the within-city spatial autocorrelation that artificially suppresses in-city test scores (Section 3.4). The cross-city test partitions cover 90% of the target city rows, providing a far more representative sample than the in-city 15% strip; accordingly, the apparent “transfer gain” reflects test-set coverage differences as much as genuine geographic robustness. The notably high built-up F1 under Munich → Berlin transfer (0.8649) is consistent with Munich’s agriculture-dominated training distribution causing the model to sharpen decision boundaries for non-vegetation classes when faced with Berlin’s denser urban fabric [12,22].
Combined training on 70% of each city’s rows addressed this by training on both cities simultaneously. The combined model attained an aggregate macro-F1 of 0.8604 (OA = 0.8752), recovering 0.012 points relative to the single-direction transfer average (0.8456 for M→B and 0.8509 for B→M). The water body class showed the largest relative improvement under combined training (F1: 0.9003 vs. 0.841 average across single-direction runs): Munich contributes Isar River reaches and small lakes, while Berlin contributes the Spree, Havel, and a network of urban canals, together covering a wider variety of water body geometries than either city alone.
The cross-city transfer scores for U-Net Middle (0.8456–0.8509) were comparable to or above the in-city Middle baseline (0.8164), an outcome attributable to the larger test-strip coverage used in the cross-city protocol (90% vs. 15% of city rows) rather than genuine geographic superiority. Lightweight target-domain fine-tuning on as few as 5–10% of the target city’s labeled pixels would likely improve transfer under a matched evaluation protocol, though that falls outside the scope of this work.

5.3. CNN vs. Transformer

SegFormer-b2 with early fusion achieved a macro-F1 of 0.8214 on the Munich in-city test set, against 0.8278 for the best convolutional configuration (U-Net Early fusion), 0.0064 points lower. Although numerically modest, this gap is statistically significant (paired bootstrap 95% CI [ 0.0096 , 0.0024 ] , p = 0.005 ; Table 6); SegFormer’s small deficit relative to the weaker S2-only baseline ( 0.0021 ), by contrast, is not significant ( p = 0.180 ). SegFormer is limited to early fusion by its monolithic MiT encoder, which does not easily support dual-stream adaptation. The depth of its ImageNet-pretrained representations likely compensates for this constraint, given that the U-Net encoders here were trained from scratch on a single city.
This comparison is confounded by initialization: SegFormer-b2 benefits from ImageNet-1K pretraining, whereas all U-Net variants were trained from random initialization (Section 3.5). The performance gap, and especially SegFormer’s markedly stronger cross-city transfer (Section 5.2), may therefore partly reflect the regularizing effect of large-scale pretraining rather than an inherent advantage of self-attention over convolution. A randomly initialized SegFormer baseline, which would be needed to isolate the architectural contribution from the pretraining effect, was not evaluated in this study.
In terms of model complexity, computed analytically from the architecture described in Section 3.5 (Assuming bias-free convolutions with batch normalization and 2 × 2 stride-2 transposed convolutions for decoder upsampling; exact counts may differ slightly depending on implementation details such as bias terms. ), the single-encoder U-Net variants (S1-only, S2-only, early fusion) contain approximately 1.9 million trainable parameters, middle fusion approximately 3.3 million (dual encoders plus per-level 1 × 1 fusion convolutions), and late fusion approximately 3.9 million (two independent full U-Nets plus the scalar α )—an order of magnitude fewer than SegFormer-b2’s 27.4 million parameters (Section 3.5). Wall-clock inference time was not benchmarked for any configuration and is left for future work; given the parameter-count gap, U-Net early fusion is likely to offer a substantially faster and more memory-efficient option for operational, national-scale deployment, at a modest cost in cross-city transfer performance relative to SegFormer-b2 (Section 5.2).
At the class level, the two architectures show different strengths. SegFormer’s hierarchical self-attention, aggregating context across the full 256 × 256 input patch, yielded mixed results for texturally homogeneous, spatially extensive classes: its agriculture F1 of 0.8042 was nearly identical to the U-Net Early equivalent (0.8045), while its forest F1 of 0.8612 fell below the U-Net Early score (0.8693) by 0.0081 points. Built-up classification, which requires resolving fine-scale boundaries between impervious and pervious surfaces within heterogeneous urban blocks, favored the convolutional baseline: U-Net Early attained 0.7390 vs. 0.7152 for SegFormer, a gap of 0.0238 points consistent with the well-documented advantage of local convolutions for edge-rich, boundary-heavy classes.
Under cross-city transfer, SegFormer recorded macro-F1 values of 0.8632 (Munich → Berlin) and 0.8608 (Berlin → Munich), exceeding its Munich in-city score (0.8214) by 0.0418 and 0.0394 points, respectively. U-Net Middle, by contrast, attained 0.8456–0.8509 across both transfer directions, matching or exceeding its in-city score (0.8164); this outcome reflects the larger test-strip coverage in the cross-city protocol rather than a genuine transfer advantage (Section 5.2). Note that this compares SegFormer under early fusion to U-Net under middle fusion, not U-Net’s best-performing in-city configuration (early fusion, Section 4.1); U-Net early-fusion cross-city scores were not obtained, so this is not a fusion-strategy-matched comparison (Section 5.5). Irrespective of the transfer direction, combined training brought both architectures to 0.8679 (SegFormer) and 0.8604 (U-Net) macro-F1, respectively, confirming that data diversity, rather than architecture, drives geographic robustness at this scale.

5.4. Feature Engineering Interpretation

None of the four feature-engineering variants achieved a statistically significant improvement over plain early fusion (Table 6): Early+idx and S2+idx are significantly worse ( p < 0.001 for both), Early+SE+idx is significantly worse ( p = 0.020 ), and Early+SE’s small numeric gap is not significant ( p = 0.365 ). Notably, Early+SE remains significantly better than the S2-only baseline ( Δ = + 0.0032 , p = 0.012 )—essentially matching plain early fusion’s own margin over S2-only—indicating that SE attention preserves, but does not extend, early fusion’s benefit over optical-only input. The explanation for the lack of further gain is straightforward. The problem lies in the preprocessing pipeline: Sentinel-2 bands were normalized to [ 0 , 1 ] using scene-level 2nd–98th percentile stretching prior to index computation. Spectral indices such as NDVI and NDWI are physically meaningful only when computed from at-least relatively calibrated reflectance values; when derived from percentile-stretched, scene-relative normalization, the index values lose their absolute physical referencing and become strongly scene-dependent non-linear transforms of the already-available band ratios. Consequently, the pre-computed indices provide no additional information content beyond what the network could learn from the raw normalized channels, while simultaneously increasing input dimensionality and introducing correlated features that may slow convergence.
The SE channel attention result (Early+SE macro-F1 = 0.8268, Δ = 0.0010 relative to Early, not statistically significant, p = 0.365 ) confirms that learned input-level reweighting is insufficient to compensate for low SAR discriminability in a single-channel VV setting: the gating weights can suppress uninformative channels but cannot create cross-modal complementarity that does not exist in the raw representations.
These results point to a practical methodological issue: feature engineering interventions need to be tested against the full preprocessing chain. Index augmentation is expected to yield meaningful gains when applied to physically calibrated reflectance (e.g., from Level-2A surface reflectance products), where NDVI and NDWI retain their absolute discriminative power across scenes and seasons. Testing this on calibrated Sentinel-2 L2A inputs would be a useful next step.

5.5. Limitations

This study has several limitations that should be acknowledged.
Fusion strategy tested only for CNN backbones. The comparison of five fusion strategies (Section 4.1) was conducted exclusively with the U-Net backbone; SegFormer-b2 was evaluated only under early fusion, because its monolithic Mix Transformer encoder does not readily support the dual-stream or independent-branch designs used for middle and late fusion (Section 3.5). Consequently, the conclusion that early fusion is the best-performing strategy (Section 5.1) applies to the convolutional architectures tested here and has not been established for transformer backbones; middle or late fusion could plausibly perform differently, or better, under a self-attention encoder whose long-range context modeling is less dependent on early cross-modal channel mixing. Evaluating SegFormer (or a comparable transformer) under middle and late fusion is a direct next step.
Inconsistent fusion strategy between the ablation and cross-city protocols. The cross-city generalization experiments (Section 4.2) use U-Net middle fusion rather than the higher-performing early-fusion configuration identified in the ablation study; this choice predates the completed ablation and is not otherwise justified. As a result, Table 5 does not permit a fully matched comparison of U-Net against SegFormer under the same fusion strategy, and the reported U-Net cross-city scores should not be read as the ceiling of U-Net’s cross-city performance. Repeating the cross-city protocol with U-Net early fusion is needed to close this gap.
Ablation study limited to Munich. The fusion ablation (Table 4) was conducted only on the Munich in-city test set; no equivalent ablation was run on Berlin. Because Munich and Berlin differ substantially in land cover composition (Table 2) and structural heterogeneity (Section 3.1), it is not established whether the same fusion-strategy ranking (early > S2-only > late > middle > S1-only) holds on Berlin; this ranking should be treated as specific to the Munich scene until confirmed elsewhere.
Single SAR polarization: Only the VV channel is available in the MSLCC dataset; operational Sentinel-1 IW mode also provides VH backscatter, which is more sensitive to vegetation volume scattering and canopy structure and is the standard configuration for agricultural SAR applications. The modest SAR contribution observed here—particularly the near-zero improvement for agriculture and forest classes (Section 5.1)—may therefore partly reflect the single-polarization constraint of the dataset rather than an inherent property of SAR data. The conclusion that SAR’s benefit is class-specific, and in particular that its impact on vegetated classes is marginal, should be read as conditional on VV-only input and not extrapolated to dual-polarization SAR.
Architecture comparison confounded by pretraining. SegFormer-b2 was initialized from ImageNet-1K pretrained weights, while all U-Net variants were trained from random initialization (Section 3.5). The performance and, especially, the cross-city transfer differences between the two architectures (Section 5.2) may therefore partly reflect the regularizing effect of large-scale pretraining rather than an inherent advantage of self-attention over convolution; a randomly initialized SegFormer baseline was not evaluated.
Unreported inference cost. Wall-clock inference time was not benchmarked for any configuration; only parameter counts are compared (Section 5.3).
Single acquisition date: The MSLCC dataset captures a single seasonal snapshot (2017); the exact acquisition month is not documented by the dataset provider [10], precluding analysis of phenological variation in crops or deciduous forest state changes. Multi-temporal fusion of Sentinel-1 time series would likely improve agricultural class discrimination [26].
Geographic scope: The cross-city evaluation is based on only two cities. This limits the transferability analysis in two compounding ways: first, two cities constrain the cross-city protocol to a single pair of train/test directions (plus their combination), so the reported transfer scores characterize one specific Munich–Berlin distribution shift rather than a distribution of shifts across many city pairs; second, both cities are located in temperate central Europe, so transferability to climatically distinct regions (tropical, semi-arid, or boreal) cannot be inferred from these results. Evaluating additional cities—both within and beyond temperate Europe—is necessary to establish whether the fusion and transfer rankings reported here hold more generally.


6. Conclusions

This study evaluated SAR–optical deep learning fusion strategies for agricultural land cover classification across two German cities (Munich and Berlin) using the MSLCC Sentinel-1/2 dataset. Ablation over five U-Net configurations and a SegFormer baseline, combined with a cross-city generalization protocol, produced four main conclusions:
  • Among convolutional (U-Net) architectures, input-level (early) fusion outperforms feature-level and decision-level fusion at Sentinel-1/2 10 m resolution. Early fusion achieved macro-F1 of 0.8278, ahead of decision-level (late, 0.8196) and feature-level (middle, 0.8164) variants, on the Munich in-city test set. The advantage of early fusion over middle fusion is consistent with the channel asymmetry of the MSLCC input: a single-channel S1 branch cannot sustain a full encoder stack at the feature dimensionality used here, whereas joint five-channel encoding distributes capacity across modalities according to their empirical informativeness. The optical baseline (S2-only, macro-F1 = 0.8236) trailed early fusion by only 0.0042 points; a patch-level paired bootstrap test (5000 replicates, Table 6) confirms this margin is statistically significant ( p = 0.006 ) despite its small size, whereas middle and late fusion are significantly worse than S2-only ( p < 0.001 and p = 0.030 ). SAR inclusion under early fusion provides the most meaningful improvement for built-up surfaces (ΔF1 = +0.0101), confirming that a single VV acquisition adds class-specific, not global, discriminative information. Because SegFormer was evaluated only under early fusion and this ablation was not repeated on Berlin, this ranking has not been established for transformer backbones or confirmed outside the Munich scene (Section 5.5).
  • Cross-city transfer is feasible but sensitive to class distribution shift. Munich → Berlin transfer yielded macro-F1 of 0.8456 and Berlin → Munich transfer of 0.8509 (U-Net Middle), with the asymmetry reflecting Berlin’s higher built-up proportion. Combined training on both cities (macro-F1: 0.8604 for U-Net Middle and 0.8679 for SegFormer-b2) recovered 0.012 and 0.006 points relative to their respective single-direction transfer averages and is the most practical configuration for national-scale deployment without explicit domain adaptation. U-Net was evaluated in this protocol under middle, not early, fusion, and the cross-city test partitions cover a much larger fraction of the target city than the in-city test split; both caveats limit direct comparison with the in-city results above (Section 5.5).
  • SegFormer-b2 with early fusion is numerically close to, though statistically significantly below, the best convolutional configuration (macro-F1: 0.8214 vs. 0.8278 for U-Net Early, p = 0.005 ; its gap below the weaker S2-only baseline is not significant, p = 0.180 ), and exhibits strong cross-city transfer performance, consistent with ImageNet-pretrained encoders generalizing across geographies. Combined training with SegFormer reached 0.8679 macro-F1, suggesting that pretrained transformers are a sound backbone choice when cross-city robustness matters more than inference speed.
  • Spectral index augmentation and SE channel attention do not significantly improve over raw-band early fusion when indices are derived from percentile-normalized inputs. All four feature-engineering variants (S2+indices, Early+SE, Early+indices, Early+SE+indices) underperformed the plain early-fusion baseline (macro-F1 = 0.8278), with the best variant (Early+SE) reaching 0.8268. A patch-level paired bootstrap test confirms this is a genuine null result rather than an artifact of an unlucky test split: Early+SE’s gap below early fusion is not statistically significant ( p = 0.365 ), while Early+indices, Early+SE+indices, and S2+indices are significantly worse than early fusion ( p < 0.001 , p = 0.020 , p < 0.001 ; Table 6). The null result is attributed to the loss of physical calibration in scene-level percentile-stretched bands: indices computed from normalized values provide no additional discriminative information beyond the raw channels, while introducing correlated features. This result points to a preprocessing dependency that any index-augmentation study should account for.
For operational deployment, plain early fusion with combined-city training and inverse-frequency class weighting is the most practical configuration found in this study. It needs no dual-encoder design, no domain adaptation, and achieves the highest macro-F1 among U-Net variants (0.8278 in-city; 0.8604 combined-city) without index augmentation—which provided no benefit under percentile-normalized preprocessing (Section 5.4). SegFormer-b2 is worth considering when a pretrained encoder is available and cross-city robustness matters more than inference speed. The evaluation should be extended to multi-temporal Sentinel-1 stacks—which carry time-series crop phenology unresolvable from a single acquisition—dual-polarization (VV + VH) inputs, and training regions spanning Mediterranean, boreal, and tropical agricultural landscapes, to test whether the fusion rankings found here generalize to other climate zones and land cover types.

Funding

This research received no external funding.

Institutional Review Board Statement

Not applicable.

Informed Consent Statement

Not applicable.

Data Availability Statement

The MSLCC dataset used in this study is publicly available from the German Aerospace Center (DLR) Earth Observation Center at https://www.dlr.de/en/eoc/about-us/remote-sensing-technology-institute/photogrammetry-and-image-analysis/public-datasets/mslcc (accessed on 9 July 2026). Code for all experiments is available from the corresponding author upon reasonable request.

Acknowledgments

The author thanks Bahmanyar et al. for releasing the MSLCC dataset publicly.

Conflicts of Interest

The author declares no conflicts of interest.

Abbreviations

CNNConvolutional Neural Network
DLDeep Learning
ExGExcess Green index
GSDGround Sampling Distance
IWInterferometric Wide swath (Sentinel-1 acquisition mode)
LULCLand Use and Land Cover
MiTMix Transformer
mIoUMean Intersection over Union
MSLCCMulti-Sensor Land Cover Classification (dataset)
NDVINormalized Difference Vegetation Index
NDWINormalized Difference Water Index
NIRNear-Infrared
OAOverall Accuracy
SARSynthetic Aperture Radar
SESqueeze-and-Excitation
S1Sentinel-1
S2Sentinel-2
VHVertical-Horizontal (SAR polarization)
VVVertical-Vertical (SAR polarization)

References

  1. Zhu, X.X.; Tuia, D.; Mou, L.; Xia, G.S.; Zhang, L.; Xu, F.; Fraundorfer, F. Deep Learning in Remote Sensing: A Comprehensive Review and List of Resources. IEEE Geosci. Remote Sens. Mag. 2017, 5, 8–36. [Google Scholar] [CrossRef]
  2. Yuan, Q.; Shen, H.; Li, T.; Li, Z.; Li, S.; Jiang, Y.; Xu, H.; Tan, W.; Yang, Q.; Wang, J.; et al. Deep Learning in Environmental Remote Sensing: Achievements and Challenges. Remote Sens. Environ. 2020, 241, 111716. [Google Scholar] [CrossRef]
  3. Weiss, M.; Jacob, F.; Duveiller, G. Remote Sensing for Agricultural Applications: A Meta-Review. Remote Sens. Environ. 2020, 236, 111402. [Google Scholar] [CrossRef]
  4. ESA. Sentinel-1 User Handbook; ESA: Paris, France, 2013. [Google Scholar]
  5. ESA. Sentinel-2 User Handbook; ESA: Paris, France, 2015. [Google Scholar]
  6. Ghamisi, P.; Rasti, B.; Yokoya, N.; Wang, Q.; Hofle, B.; Bruzzone, L.; Bovolo, F.; Chi, M.; Anders, K.; Gloaguen, R.; et al. Multisource and Multitemporal Data Fusion in Remote Sensing. IEEE Geosci. Remote Sens. Mag. 2019, 7, 6–39. [Google Scholar] [CrossRef]
  7. Ronneberger, O.; Fischer, P.; Brox, T. U-Net: Convolutional Networks for Biomedical Image Segmentation. In Proceedings of the MICCAI 2015, Munich, Germany, 5–9 October 2015; pp. 234–241. [Google Scholar]
  8. Xie, E.; Wang, W.; Yu, Z.; Anandkumar, A.; Alvarez, J.M.; Luo, P. SegFormer: Simple and Efficient Design for Semantic Segmentation with Transformers. NeurIPS 2021, 34, 12077–12090. [Google Scholar]
  9. Liu, Z.; Lin, Y.; Cao, Y.; Hu, H.; Wei, Y.; Zhang, Z.; Lin, S.; Guo, B. Swin Transformer: Hierarchical Vision Transformer Using Shifted Windows. In Proceedings of the ICCV 2021, Montreal, QC, Canada, 11–17 October 2021; pp. 10012–10022. [Google Scholar]
  10. Bahmanyar, R.; Espinoza-Molina, D.; Datcu, M. Multisensor Earth Observation Image Classification Based on a Multimodal Latent Dirichlet Allocation Model. IEEE Geosci. Remote Sens. Lett. 2018, 15, 459–463. [Google Scholar] [CrossRef]
  11. Hong, D.; Gao, L.; Yokoya, N.; Yao, J.; Chanussot, J.; Du, Q.; Zhang, B. More Diverse Means Better: Multimodal Deep Learning Meets Remote-Sensing Imagery Classification. IEEE Trans. Geosci. Remote Sens. 2021, 59, 4340–4354. [Google Scholar] [CrossRef]
  12. Tuia, D.; Persello, C.; Bruzzone, L. Domain Adaptation for the Classification of Remote Sensing Data: An Overview of Recent Advances. IEEE Geosci. Remote Sens. Mag. 2016, 4, 41–57. [Google Scholar] [CrossRef]
  13. Ma, L.; Liu, Y.; Zhang, X.; Ye, Y.; Yin, G.; Johnson, B.A. Deep Learning in Remote Sensing Applications: A Meta-Analysis and Review. ISPRS J. Photogramm. Remote Sens. 2019, 152, 166–177. [Google Scholar] [CrossRef]
  14. Chen, L.C.; Papandreou, G.; Kokkinos, I.; Murphy, K.; Yuille, A.L. DeepLab: Semantic Image Segmentation with Deep Convolutional Nets, Atrous Convolution, and Fully Connected CRFs. IEEE Trans. Pattern Anal. Mach. Intell. 2018, 40, 834–848. [Google Scholar] [CrossRef] [PubMed]
  15. Wang, L.; Li, R.; Zhang, C.; Fang, S.; Duan, C.; Meng, X.; Atkinson, P.M. UNetFormer: A UNet-like Transformer for Efficient Semantic Segmentation of Remote Sensing Urban Scene Imagery. ISPRS J. Photogramm. Remote Sens. 2022, 190, 196–214. [Google Scholar] [CrossRef]
  16. Lahat, D.; Adalı, T.; Jutten, C. Multimodal Data Fusion: An Overview of Methods, Challenges, and Prospects. Proc. IEEE 2015, 103, 1449–1477. [Google Scholar] [CrossRef]
  17. Audebert, N.; Le Saux, B.; Lefèvre, S. Fusion of Heterogeneous Data in Convolutional Networks for Urban Semantic Labeling. In Proceedings of the JURSE 2017, Dubai, United Arab Emirates, 6–8 March 2017. [Google Scholar]
  18. Yang, X.; Li, S.; Chen, Z.; Chanussot, J.; Jia, X.; Zhang, B.; Li, B.; Chen, P. An Attention-Fused Network for Semantic Segmentation of Very-High-Resolution Remote Sensing Imagery. ISPRS J. Photogramm. Remote Sens. 2021, 177, 238–262. [Google Scholar] [CrossRef]
  19. Zhang, M.; Li, W.; Du, Q. Diverse Region-Based CNN for Hyperspectral Image Classification. IEEE Trans. Image Process. 2018, 27, 2623–2634. [Google Scholar] [CrossRef] [PubMed]
  20. Schmitt, M.; Hughes, L.H.; Qiu, C.; Zhu, X.X. SEN12MS—A Curated Dataset of Georeferenced Multi-Spectral Sentinel-1/2 Imagery for Deep Learning and Data Fusion. ISPRS Ann. Photogramm. Remote Sens. Spat. Inf. Sci. 2019, IV-2/W7, 153–160. [Google Scholar] [CrossRef]
  21. Persello, C.; Wegner, J.D.; Hansch, R.; Tuia, D.; Ghamisi, P.; Koeva, M.; Camps-Valls, G. Deep Learning and Earth Observation to Support the Sustainable Development Goals. IEEE Geosci. Remote Sens. Mag. 2022, 10, 172–200. [Google Scholar] [CrossRef]
  22. Zhang, Y.; David, P.; Gong, B. Curriculum Domain Adaptation for Semantic Segmentation of Urban Scenes. In Proceedings of the ICCV 2017, Venice, Italy, 22–29 October 2017; pp. 2020–2030. [Google Scholar]
  23. Jiwani, A.; Ganguly, S.; Ding, C.; Zhou, N.; Chan, D.M. A Semantic Segmentation Network for Urban-Scale Building Footprint Extraction Using RGB Satellite Imagery. arXiv 2021, arXiv:2104.01263. [Google Scholar]
  24. Roberts, D.R.; Bahn, V.; Ciuti, S.; Boyce, M.S.; Elith, J.; Guillera-Arroita, G.; Hauenstein, S.; Lahoz-Monfort, J.J.; Schröder, B.; Thuiller, W.; et al. Cross-Validation Strategies for Data with Temporal, Spatial, Hierarchical, or Phylogenetic Structure. Ecography 2017, 40, 913–929. [Google Scholar] [CrossRef]
  25. Loshchilov, I.; Hutter, F. Decoupled Weight Decay Regularization. In Proceedings of the ICLR 2019, New Orleans, LA, USA, 6–9 May 2019. [Google Scholar]
  26. Zhong, L.; Hu, L.; Zhou, H. Deep Learning Based Multi-Temporal Crop Classification. Remote Sens. Environ. 2019, 221, 430–443. [Google Scholar] [CrossRef]
Figure 1. Overview of the two study areas. (a) Munich and surrounding hinterland (UTM 32N). (b) Berlin and surrounding region (UTM 33N). Sentinel-2 true-color composite (RGB = B4/B3/B2). Class legend: green—agriculture; dark green—forest; terracotta—built-up; blue—water body; black—NoData.
Land 15 01289 g001
Figure 2. Schematic comparison of the three U-Net fusion strategies. (a) Early fusion: single five-channel encoder; (b) Middle fusion: dual encoders with 1 × 1 projection at each level; (c) Late fusion: two independent U-Nets with learnable scalar blending. Yellow blocks: S2 encoder path; orange blocks: S1 encoder path; blue blocks: shared decoder.
Land 15 01289 g002
Figure 3. Validation macro-F1 learning curves over training epochs for (a) the best-performing U-Net early fusion model and (b) the S2-only baseline.
Land 15 01289 g003
Figure 4. Predicted land cover maps vs. ground truth for Munich (a,b) and Berlin (c,d) test regions. Colors: green = agriculture, dark green = forest, terracotta = built-up, blue = water body, black = NoData.
Land 15 01289 g004
Figure 5. Recall-normalized confusion matrices for (a) in-city and (b) cross-city (Munich → Berlin) settings using the best-performing fusion model.
Land 15 01289 g005
Table 1. MSLCC dataset properties.
CityS1 BandsS2 BandsResolutionScene SizeLabeled Pixels
Munich1 (VV)4 (B,G,R,NIR)10 m 5596 × 6031 31,466,881
Berlin1 (VV)4 (B,G,R,NIR)10 m 8149 × 5957 46,938,967
Table 2. Class distribution per city (labeled pixels only).
ClassMunich (%)Berlin (%)Munich PixelsBerlin Pixels
Agriculture41.242.312,974,58019,881,586
Forest34.027.510,702,83312,909,560
Built-up20.726.76,506,81612,536,649
Water body4.13.41,282,6521,611,172
Total10010031,466,88146,938,967
Table 3. Inverse-frequency class weights computed from Munich training set.
ClassAgricultureForestBuilt-UpWater Body
Weight0.490.590.974.91
Table 4. Fusion ablation—Munich in-city test set. Best result per column in bold.
BackboneModality/FusionOA κ Macro-F1mIoUAgri.ForestBuilt-UpWater
U-NetS2 only0.83240.71270.82360.70580.79250.86600.72890.9069
U-NetS1 only0.74960.57390.68640.54720.74650.77360.38630.8392
U-NetS1+S2, Early0.83920.72230.82780.71080.80450.86930.73900.8983
U-NetS1+S2, Middle0.82050.69510.81640.69510.78870.84890.72480.9031
U-NetS1+S2, Late0.83370.70940.81960.69980.78830.86790.72550.8966
SegFormer-b2S1+S2, Early0.83200.71530.82140.70300.80420.86120.71520.9051
Feature-engineering variants (Section 4.3)
U-NetS2+idx only0.82490.70140.81740.69570.79370.85370.72910.8929
U-NetS1+S2, Early+SE0.83690.72090.82680.70970.81060.86280.73150.9023
U-NetS1+S2+idx, Early0.83550.71930.82050.70140.80120.86920.71670.8950
U-NetS1+S2+idx, Early+SE0.83720.72180.82410.70540.80620.86760.73160.8910
OA: Overall Accuracy; κ : Cohen’s Kappa; Macro-F1: arithmetic mean of per-class F1 scores; mIoU: mean Intersection over Union; Agri.: Agriculture class F1; idx: NDVI + NDWI + ExG computed channels; SE: Squeeze-and-Excitation input-level channel attention.
Table 5. Cross-city generalization evaluation. M: Munich; B: Berlin; →: train → test.
BackboneSetupOA κ Macro-F1mIoUAgri.ForestBuilt-UpWater
U-Net MiddleM → B0.85710.79020.84560.73330.87260.83390.86490.8111
U-Net MiddleB → M0.84770.77750.85090.74100.84200.86690.82430.8704
U-Net MiddleCombined0.87520.79690.86040.75890.87520.89830.76790.9003
SegFormer-b2M → B0.87670.81720.86320.76020.89320.85730.87630.8261
SegFormer-b2B → M0.85970.79500.86080.75610.85040.88410.83330.8753
SegFormer-b2Combined0.88060.80650.86790.77080.88050.90480.77270.9136
Combined: joint training on 70% of each city; test on held-out 15% of each city (reported as macro average).
Table 6. Patch-level paired bootstrap significance test (5000 replicates, 252 Munich test patches). Δ is the macro-F1 difference relative to each reference model; bold indicates the 95% CI excludes zero (statistically significant at α = 0.05 ).
Configurationvs. S2-Onlyvs. Early Fusion
Δ Macro-F1 95% CI p Δ Macro-F1 95% CI p
S2 only 0.0042 [ 0.0061 , 0.0015 ]0.006
S1 only 0.1372 [ 0.1574 , 0.1195 ]<0.001 0.1414 [ 0.1605 , 0.1238 ]<0.001
S1+S2, Early + 0.0042 [ + 0.0015 , + 0.0061 ]0.006
S1+S2, Middle 0.0072 [ 0.0106 , 0.0039 ]<0.001 0.0114 [ 0.0150 , 0.0074 ]<0.001
S1+S2, Late 0.0040 [ 0.0082 , 0.0004 ]0.030 0.0082 [ 0.0114 , 0.0049 ]<0.001
SegFormer-b2, Early 0.0021 [ 0.0053 , + 0.0010 ]0.180 0.0064 [ 0.0096 , 0.0024 ]0.005
S2+idx only 0.0062 [ 0.0111 , 0.0030 ]<0.001 0.0104 [ 0.0151 , 0.0064 ]<0.001
S1+S2, Early+SE + 0.0032 [ + 0.0007 , + 0.0053 ]0.012 0.0010 [ 0.0029 , + 0.0016 ]0.365
S1+S2+idx, Early 0.0030 [ 0.0065 , 0.0010 ]0.002 0.0072 [ 0.0104 , 0.0043 ]<0.001
S1+S2+idx, Early+SE + 0.0005 [ 0.0036 , + 0.0030 ]0.750 0.0037 [ 0.0072 , 0.0006 ]0.020
Δ : mean paired bootstrap difference in macro-F1; CI: percentile bootstrap 95% confidence interval; p: two-sided bootstrap p-value. Em dash: reference model itself (comparison not applicable).
Disclaimer/Publisher’s Note: The statements, opinions and data contained in all publications are solely those of the individual author(s) and contributor(s) and not of MDPI and/or the editor(s). MDPI and/or the editor(s) disclaim responsibility for any injury to people or property resulting from any ideas, methods, instructions or products referred to in the content.