Article

Evaluation and Formation Mechanism Analysis of Urban Waterfront Space Value: A Case Study of Shanghai, China


1
Shanghai Academy of Fine Arts, Shanghai University, Shanghai 200072, China
2
College of Architecture and Urban Planning, Tongji University, Shanghai 200092, China
*
Author to whom correspondence should be addressed.
Land 2026, 15(7), 1277; https://doi.org/10.3390/land15071277
Submission received: 9 June 2026 / Revised: 8 July 2026 / Accepted: 14 July 2026 / Published: 16 July 2026
(This article belongs to the Special Issue Big Data in Urban Land Use Planning and Infrastructure Building)

Abstract

Waterfront space is an important spatial carrier that reflects the quality of the human settlement environment. In the stage of stock-based urban renewal, value evaluation is the primary task for achieving the “precise optimization” of waterfront spaces. Based on Maslow’s hierarchy of needs, this study constructs a waterfront space value evaluation system covering basic support value, livability value, and well-being value. Taking the Suzhou Creek waterfront space in Shanghai as a case study, this research integrates data such as street-view images and Weibo check-in records, and applies deep learning, natural language processing, and other techniques to evaluate waterfront space value. Correlation analysis, principal component analysis, and spatial autocorrelation analysis are used to explore the factors associated with waterfront space value. The results show that waterfront space value presents significant spatial differences, with the eastern area near the Huangpu River showing a markedly higher value than the western area. Spatial value is associated with street environment, facility services, spatial morphology, functional experience, and spatial attractiveness. In addition, the results of spatial autocorrelation analysis indicate that optimizing functional experience and facility services in the eastern core area is of great importance, while improving online popularity and attractiveness in the western area is also important for promoting coordinated development between the eastern and western areas. The findings provide a reference for future waterfront space evaluation and offer scientific support for urban renewal and policy-making.

1. Introduction

Urban waterfront spaces are important areas that accommodate economic activities, recreation, and leisure. They also play a key role in shaping urban image and spatial characteristics. Recent studies have shown that waterfront space contributes to improving the urban environment, enhancing urban vitality, and promoting public health, well-being, and happiness [1,2,3,4,5]. The renewal and redevelopment of waterfront spaces are often accompanied by the transformation of urban functions and the improvement of the urban landscape. With the relocation of port functions and the adjustment of industrial structures, waterfront spaces have shifted from productive shorelines dominated by transportation and industrial production to multifunctional urban spaces that integrate leisure and recreation, cultural display, and urban image-making. They have become important carriers for enhancing urban attractiveness and spatial competitiveness. This process is shaped by a combination of factors, including global economic processes, locational conditions, community attitudes, environmental sensitivity, and public interest [6,7]. In China, the development of urban waterfront spaces has long received considerable attention [8], and waterfront revitalization is regarded as a catalyst for sustainable urban development [9]. In recent years, Beijing has issued the Beijing Urban Design Guidelines for Waterfront Spaces, while Shanghai has promoted the construction of waterfront spaces along the Huangpu River and Suzhou Creek. Both cities aim to activate the integrated ecological, economic, cultural, and social value of waterfront areas through urban design. Although the value of waterfront spaces has been widely recognized, some waterfront spaces still face problems during rapid urbanization, such as insufficient spatial vitality, low levels of public use, and inadequate connections between service facilities and daily needs. As a result, they have difficulty fully responding to the diverse needs of residents and visitors [10]. At present, urban development in China has entered a stage of refined governance focused on improving the quality and efficiency of existing urban areas. To achieve the “precise optimization” and sustainable development of waterfront spaces, clear tools are needed to identify and diagnose their current conditions and support differentiated renewal decisions [11]. Therefore, evaluating the utility of waterfront spaces from the perspective of human needs has important theoretical and practical significance.
Current research on the value of urban waterfront space is multidisciplinary, with studies widely distributed across geography, urban planning, sociology, and related fields [12]. In terms of research content, early studies paid more attention to the economic value and land value appreciation effects of waterfront spaces. For example, Dahal et al. [13] assessed the economic value of waterfront resources using a hedonic pricing method. As waterfront spaces have shifted from productive shorelines to multifunctional public spaces, research perspectives have gradually expanded to ecological environment, climate adaptation, planning and governance, public use, and perceptual experience. Dal Cin et al. [14] and Lopez et al. [15] emphasized the role of waterfront spaces in responding to environmental risks and enhancing urban resilience from the perspectives of climate adaptation and spatial governance. Liu et al. [2] and Niu et al. [16] discussed the use characteristics of waterfront spaces from the perspective of spatial vitality. Hermida et al. [17] and Che et al. [18] highlighted the importance of connectivity and public accessibility for the quality of waterfront spaces. Nian et al. [19] and Yuan et al. [20] further revealed the relationship between waterfront environments and human perception from the perspective of multisensory experience. Isa et al. [21] incorporated place identity and user satisfaction into the discussion of waterfront space quality. These studies indicate that the value orientation of waterfront space is closely related to changes in public needs. It has shifted from the early pursuit of economic and land-use benefits to ecological and environmental value, and then to integrated value that includes environmental comfort, spatial quality, and perceptual experience. However, most existing studies focus on a single value dimension and have not yet established an integrated framework for waterfront space value assessment.
In recent years, with the development of new technologies and data sources, social media data and street view images have been widely used in urban studies. They provide high-spatiotemporal-resolution information for characterizing human activities and the built environment. Check-in frequency in social media data [22] and the number of comments [23] are often used to represent the popularity of urban spaces. Text data are commonly analyzed using natural language processing (NLP) techniques [24] and pretrained language models [25,26] to quantify human emotional tendencies. Street view images are often processed using deep learning techniques to extract street environment elements and assess street space quality and human perception [4,27,28]. For example, object detection techniques, such as YOLO, can assign a bounding box to each category of object in an image [29]. Common applications include pedestrian recognition, the identification of various types of vehicles [30], and street signage detection [31]. However, object detection techniques tend to have lower accuracy under nighttime and backlit conditions. In contrast, image segmentation techniques, such as DeepLab, PSPNet, and Mask R-CNN, assign each pixel in an image to a specific category, and are used to extract indicators such as green space [32], sky view factor [33], and road width [34]. Overall, the integration of deep learning, NLP techniques, and multi-source urban data provides strong support for urban space evaluation.
The above discussion shows that, in the context of stock-based urban renewal and refined governance, how to construct a waterfront space value evaluation framework based on human needs and how to identify the spatial differences and optimization directions of waterfront space value using multi-source data have become important issues in waterfront space renewal research. To address this issue, this paper aims to develop a waterfront space value evaluation system, providing methodological support for value assessment, problem identification, and renewal decision-making in high-density urban waterfront spaces. Specifically, the research objectives of this paper include: (1) to establish a comprehensive evaluation system for waterfront space value from the perspective of human needs; (2) to take the Suzhou Creek waterfront space in Shanghai as an example and integrate multi-source data to quantitatively measure waterfront space value; and (3) to analyze the spatial differentiation characteristics of waterfront space value based on the evaluation results, identify the key factors associated with spatial value, and propose differentiated renewal and optimization strategies accordingly. This study can provide a methodological reference for problem identification and differentiated renewal of waterfront spaces, and offer strong support for the governance and quality improvement of waterfront spaces in other high-density cities.

2. Study Area and Theoretical Framework

2.1. Study Area

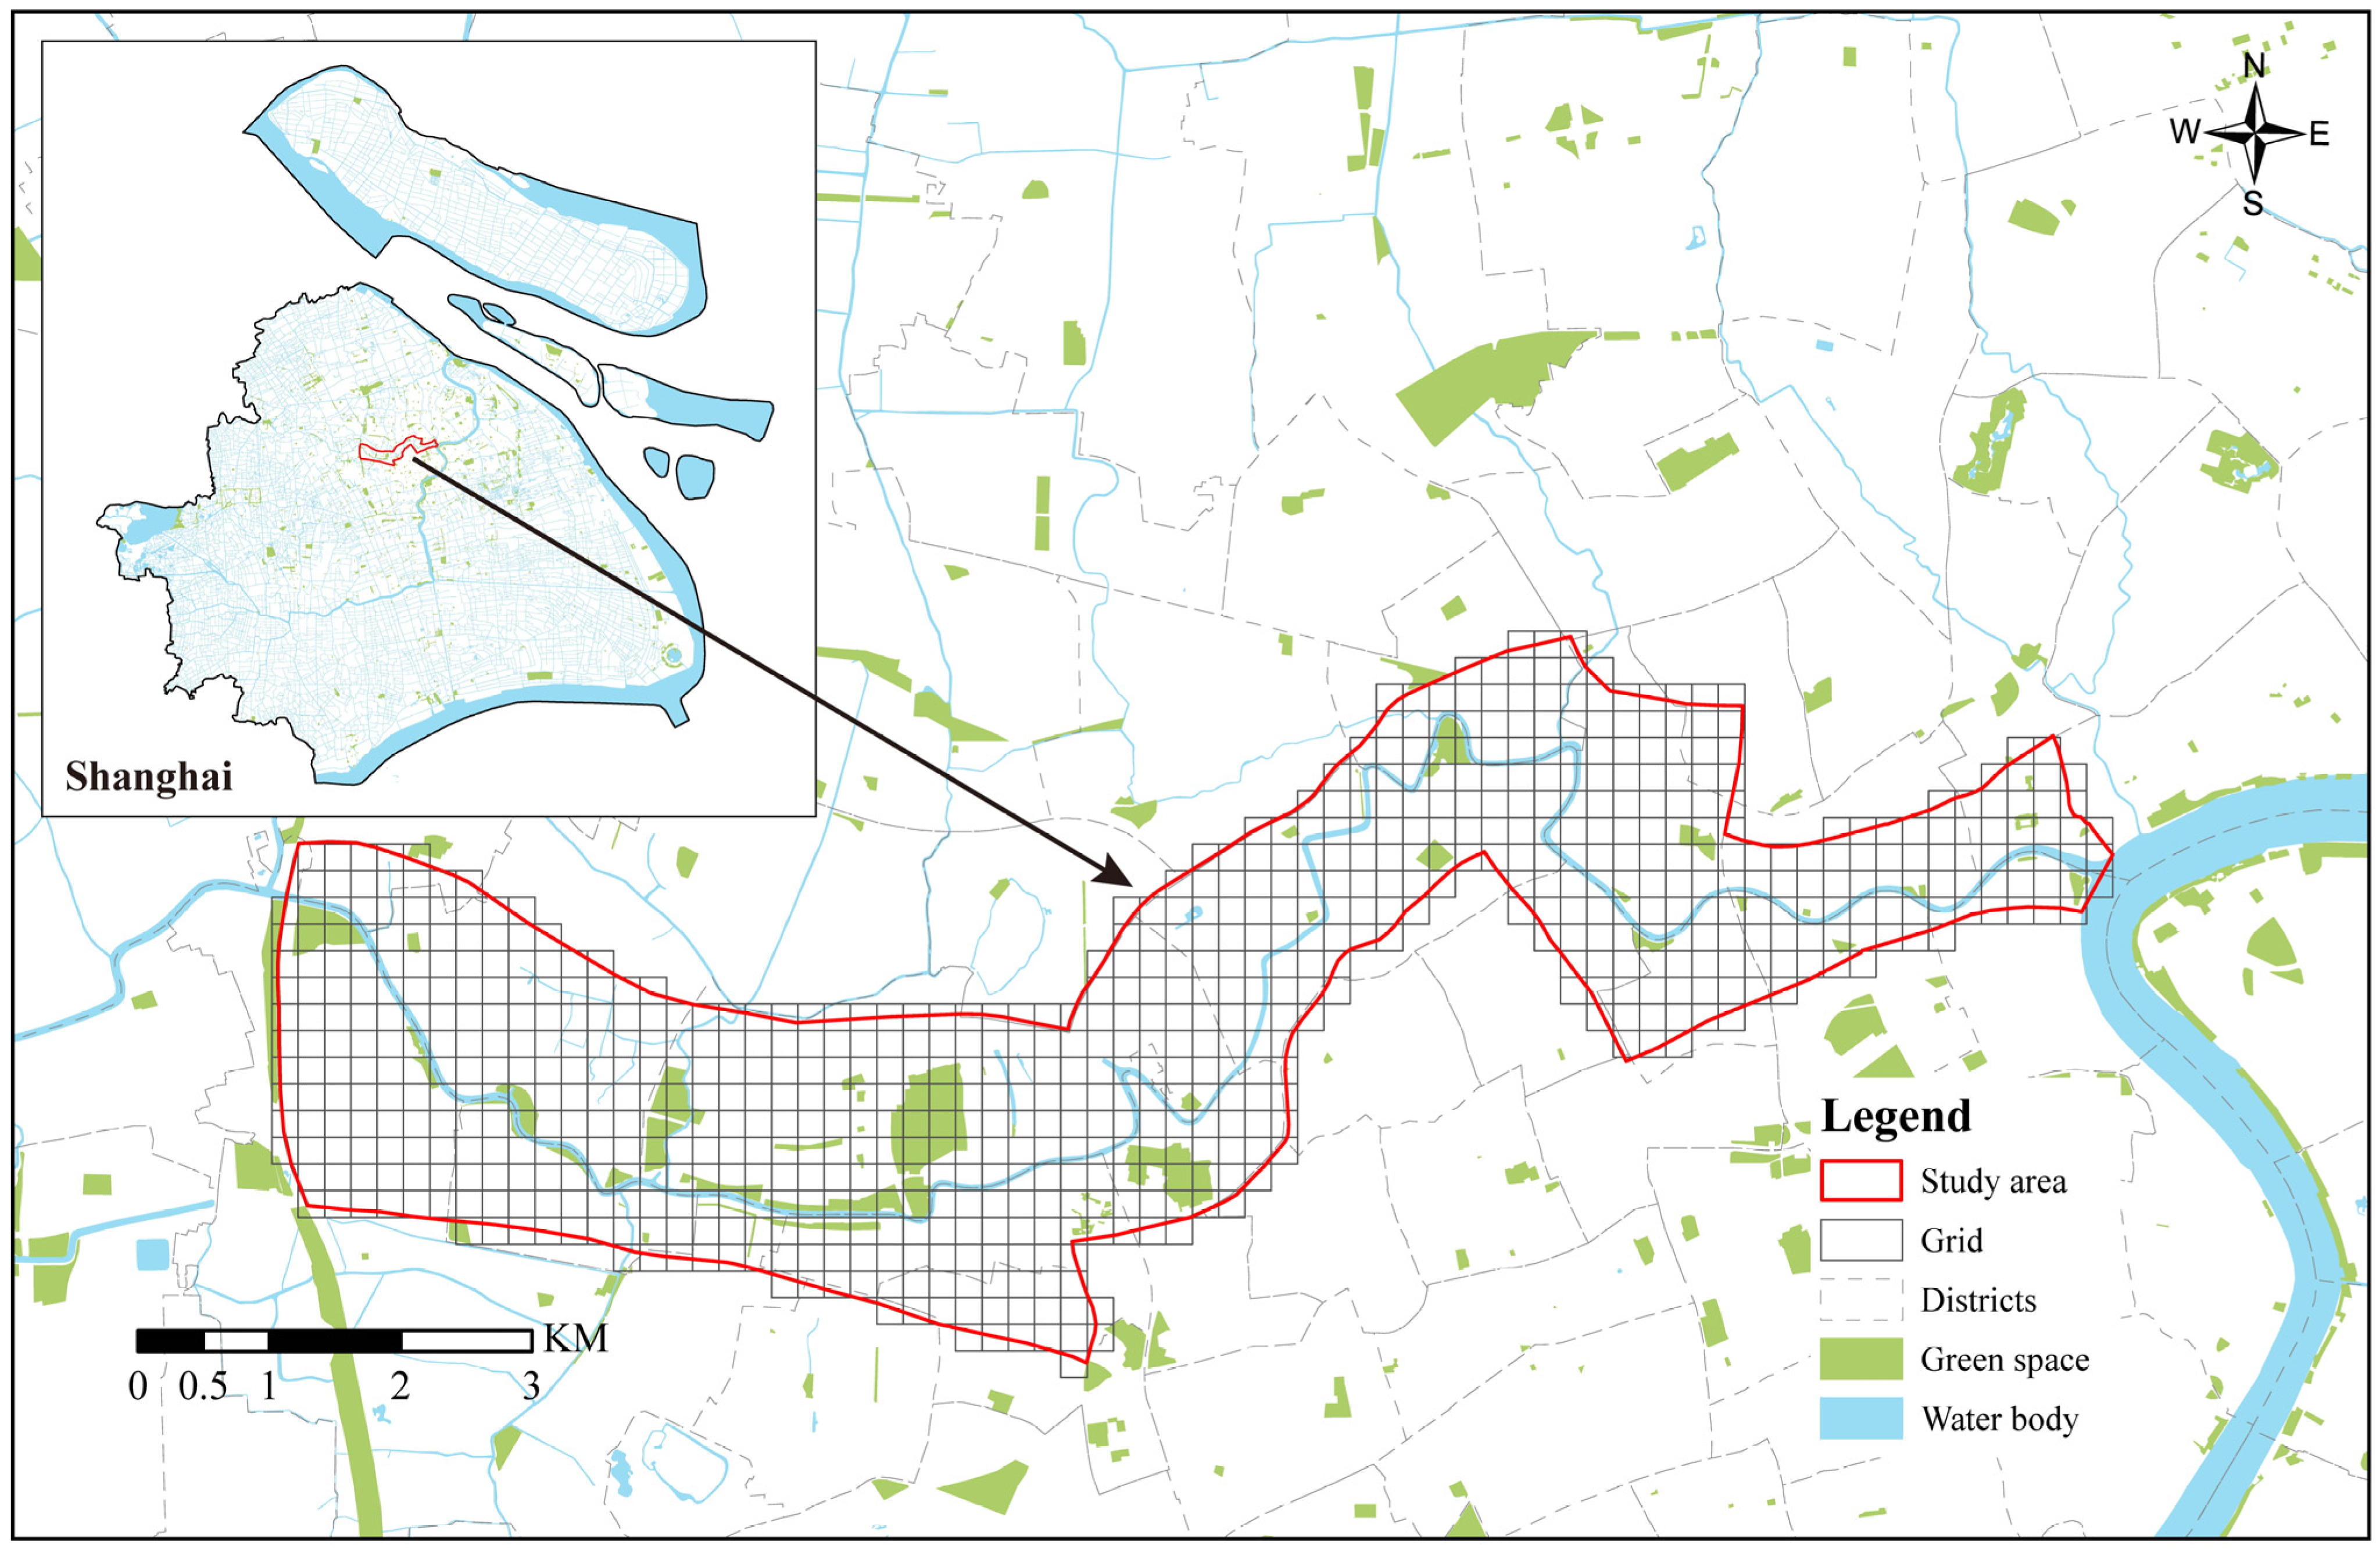
As an economic and cultural center of China, Shanghai has an administrative area of 6340.5 km2. As of the end of 2024, its permanent resident population was 24.8026 million, and its urbanization rate was 89.85%. Suzhou Creek, which runs through the urban area of Shanghai, is known as the “mother river” of Shanghai and is a life-oriented waterfront space closely connected with citizens’ daily lives. The study area selected in this paper extends westward from the confluence of Suzhou Creek and the Huangpu River to the Outer Ring Expressway, covering an area of approximately 26 km2. As a high-density megacity, Shanghai has a relatively compact radius of residents’ daily activities. Based on the average adult walking speed of 3–4 km/h, a 3–4 min walking distance is approximately 200 m. Meanwhile, the blocks within the study area are relatively small, with an average block size of approximately 200 m. Therefore, this study uses 200 m × 200 m grid cells for analysis, with a total of 750 grid cells (Figure 1). There are two reasons for selecting this study area: (1) this area is closely connected with the urban hinterland and is a highly active area for residents along Suzhou Creek; and (2) the Special Plan for the Overall Character and Open Space Improvement of the Suzhou Creek Area (2025–2035), released in March 2025, divides the areas along Suzhou Creek into three spatial levels. Among them, the middle-level scope, approximately 400–1000 m outward from the water area, focuses on the overall improvement of the waterfront area, and the study area of this paper is located within this middle-level scope. In this context, conducting research on this area can help promote the improvement of environmental quality along Suzhou Creek and has important theoretical and practical significance.

2.2. Theoretical Framework

In value philosophy, value is essentially a relational attribute between the subject and the object. Value emerges when the subject recognizes that an object available to it is important for maintaining its own well-being [35]. Therefore, value is not an inherent attribute of the object in isolation, but is manifested in the relationship between the function of the object and the needs of the subject. When this relational perspective is introduced into urban space research, the value of urban space can be understood as the comprehensive utility formed through the interaction between spatial supply and public demand [36,37]. Specifically, urban space is the material carrier through which value is realized, and its value depends on the extent to which the spatial environment, functional facilities, and perceptual experience respond to public needs for access, use, social interaction, and place identity.
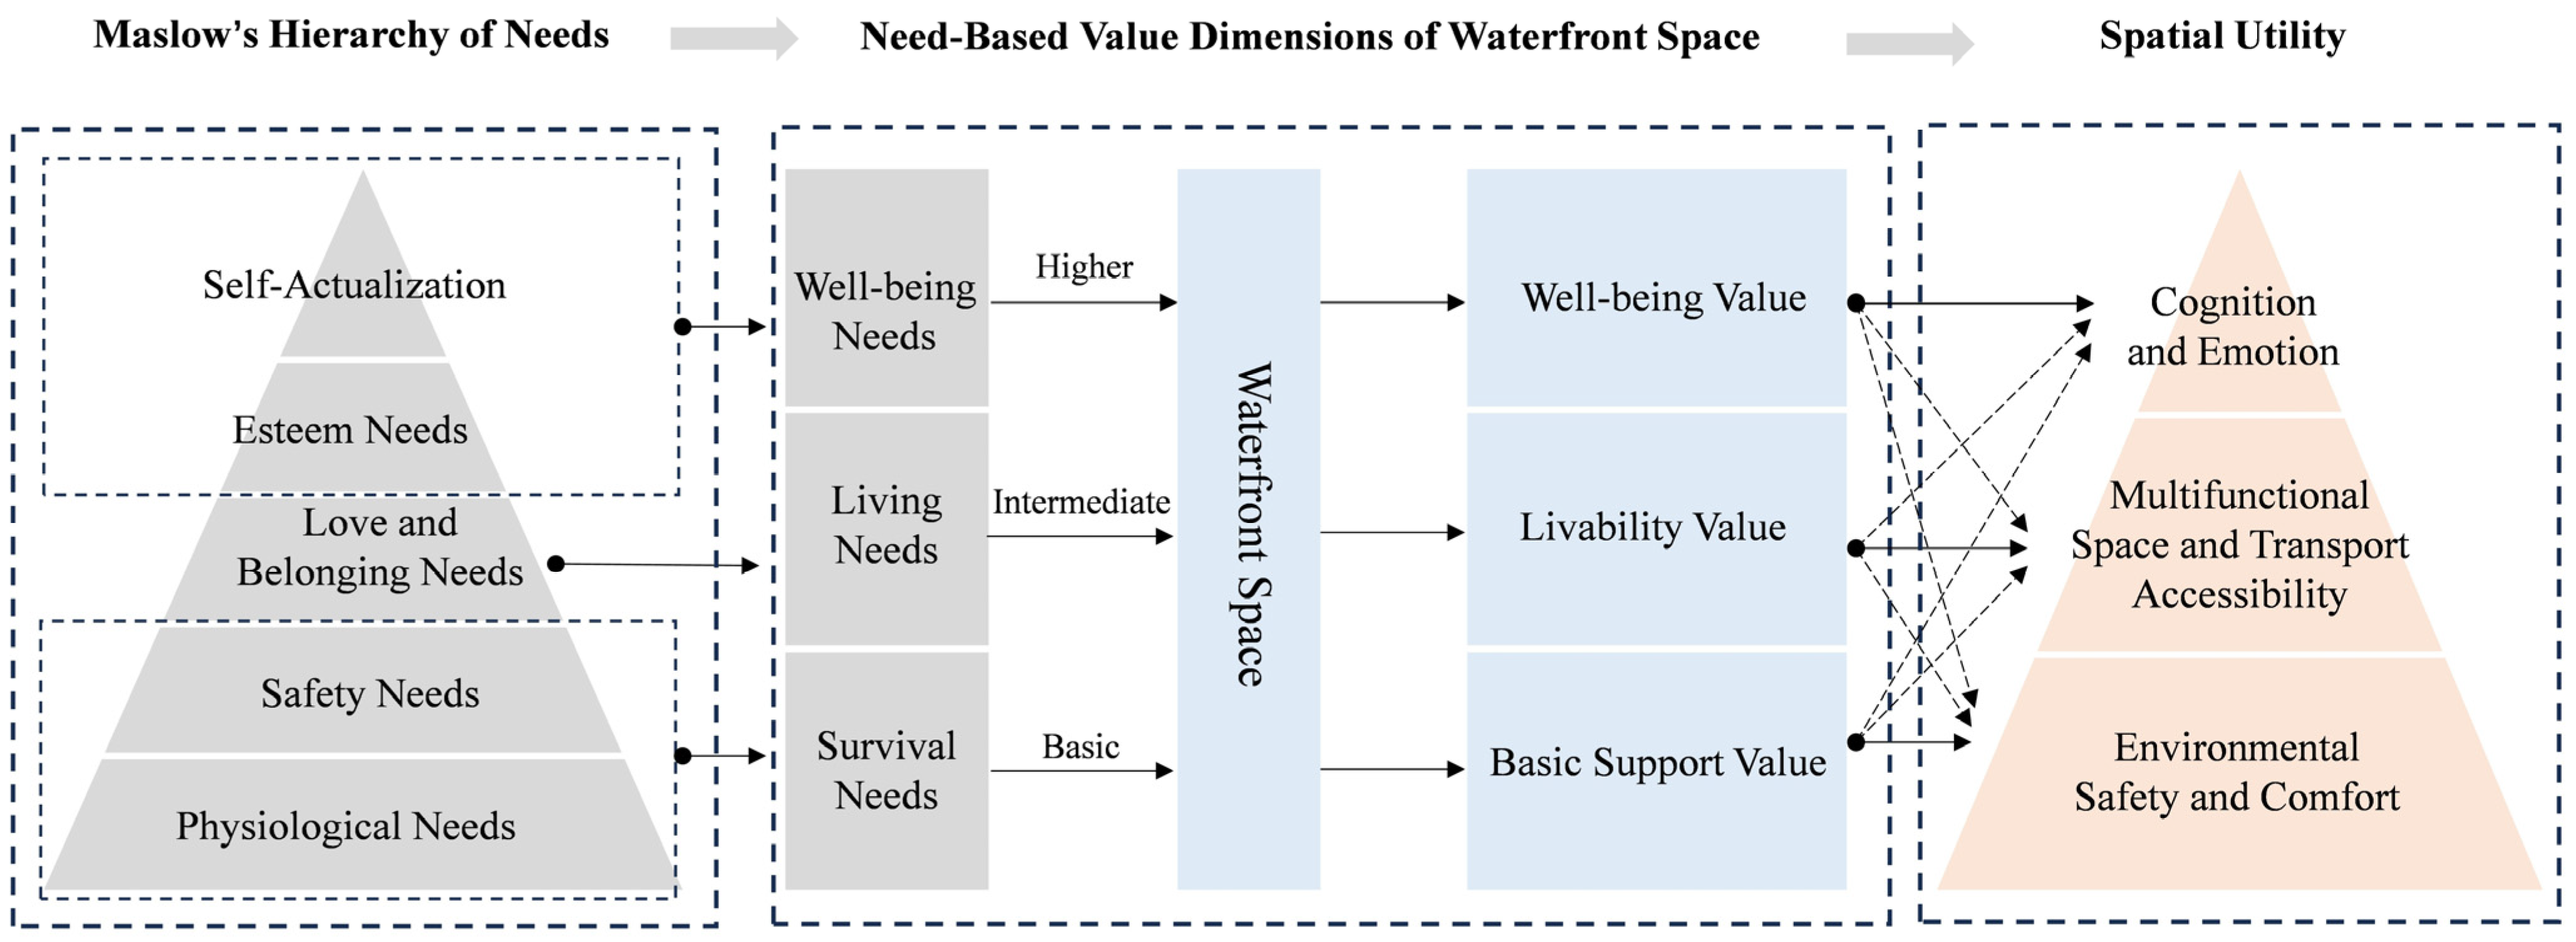
According to Maslow’s hierarchy of needs, people’s needs for space show a hierarchical structure from lower to higher levels. For urban waterfront spaces, public needs also show a hierarchical pattern: first, the basic support required for accessing and using the space; second, the service support needed for daily activities and social interaction; and further, the pursuit of place identity and positive emotional experiences. Based on this, public needs for waterfront spaces can be summarized as “survival needs–living needs–well-being needs”. This serves as the basis for dividing the value dimensions. Accordingly, waterfront space value is divided into three dimensions: basic support value, livability value, and well-being value. These three dimensions correspond to the utility of waterfront spaces in terms of basic use, daily life, and emotional experience, respectively, forming a theoretical framework of “hierarchy of needs–value dimensions–spatial utility” (Figure 2).
The first level is basic support value, which corresponds to physiological and safety needs and reflects the basic environmental and safety support conditions required for the public to access, move through, stay in, and use waterfront spaces. Physiological and safety needs are the prerequisites for the public to access, stay in, and use waterfront spaces. Waterfront spaces with good basic conditions play an important role in ensuring basic public use, reducing spatial risks, and improving the comfort of staying by providing a comfortable visual environment, appropriate street scale, and necessary sanitation and safety facilities. In this way, they meet public needs for basic activities and safe use.
The second level is livability value, which corresponds to love and belonging needs and reflects the capacity of waterfront spaces to support daily public life and social interaction. Love and belonging needs refer to public needs for activity participation and social interaction. Waterfront spaces are not only urban landscape interfaces, but also important public places for residents’ activities and social interaction. Waterfront spaces with high livability value can strengthen the connections between people, and between people and waterfront spaces, through diversified service provision and convenient transport networks. In this way, they meet public needs for participation in public life, social connection, and spatial belonging.
The third level is well-being value, which corresponds to esteem and self-actualization needs and reflects the utility of waterfront spaces in terms of cognitive identification and emotional experience. Esteem and self-actualization needs are higher-level needs, reflected in the public pursuit of spatial quality, urban culture, and emotional experience. As urban waterfront spaces shift from productive shorelines to life-oriented shorelines, their value is reflected not only in whether they can be accessed and used, but also in whether they can be perceived and recognized by the public. Waterfront spaces with positive experiences and strong recognition usually have good landscape quality, and can play a role in shaping urban image, strengthening local memory, and improving public experience. In this way, they meet public needs for esteem and self-actualization.
Given that spatial elements in urban waterfront spaces do not correspond to public needs in a strict one-to-one manner, the same spatial element may relate to multiple aspects, such as comfort, safety, and emotional experience. Therefore, considering the public attributes and multifunctionality of waterfront spaces, this paper classifies each element into the corresponding value dimension according to its dominant spatial utility. It then identifies the spatial differences in waterfront space value based on the comprehensive evaluation results, thereby supporting the process from spatial value assessment to renewal optimization. The specific evaluation system is presented in Section 3.
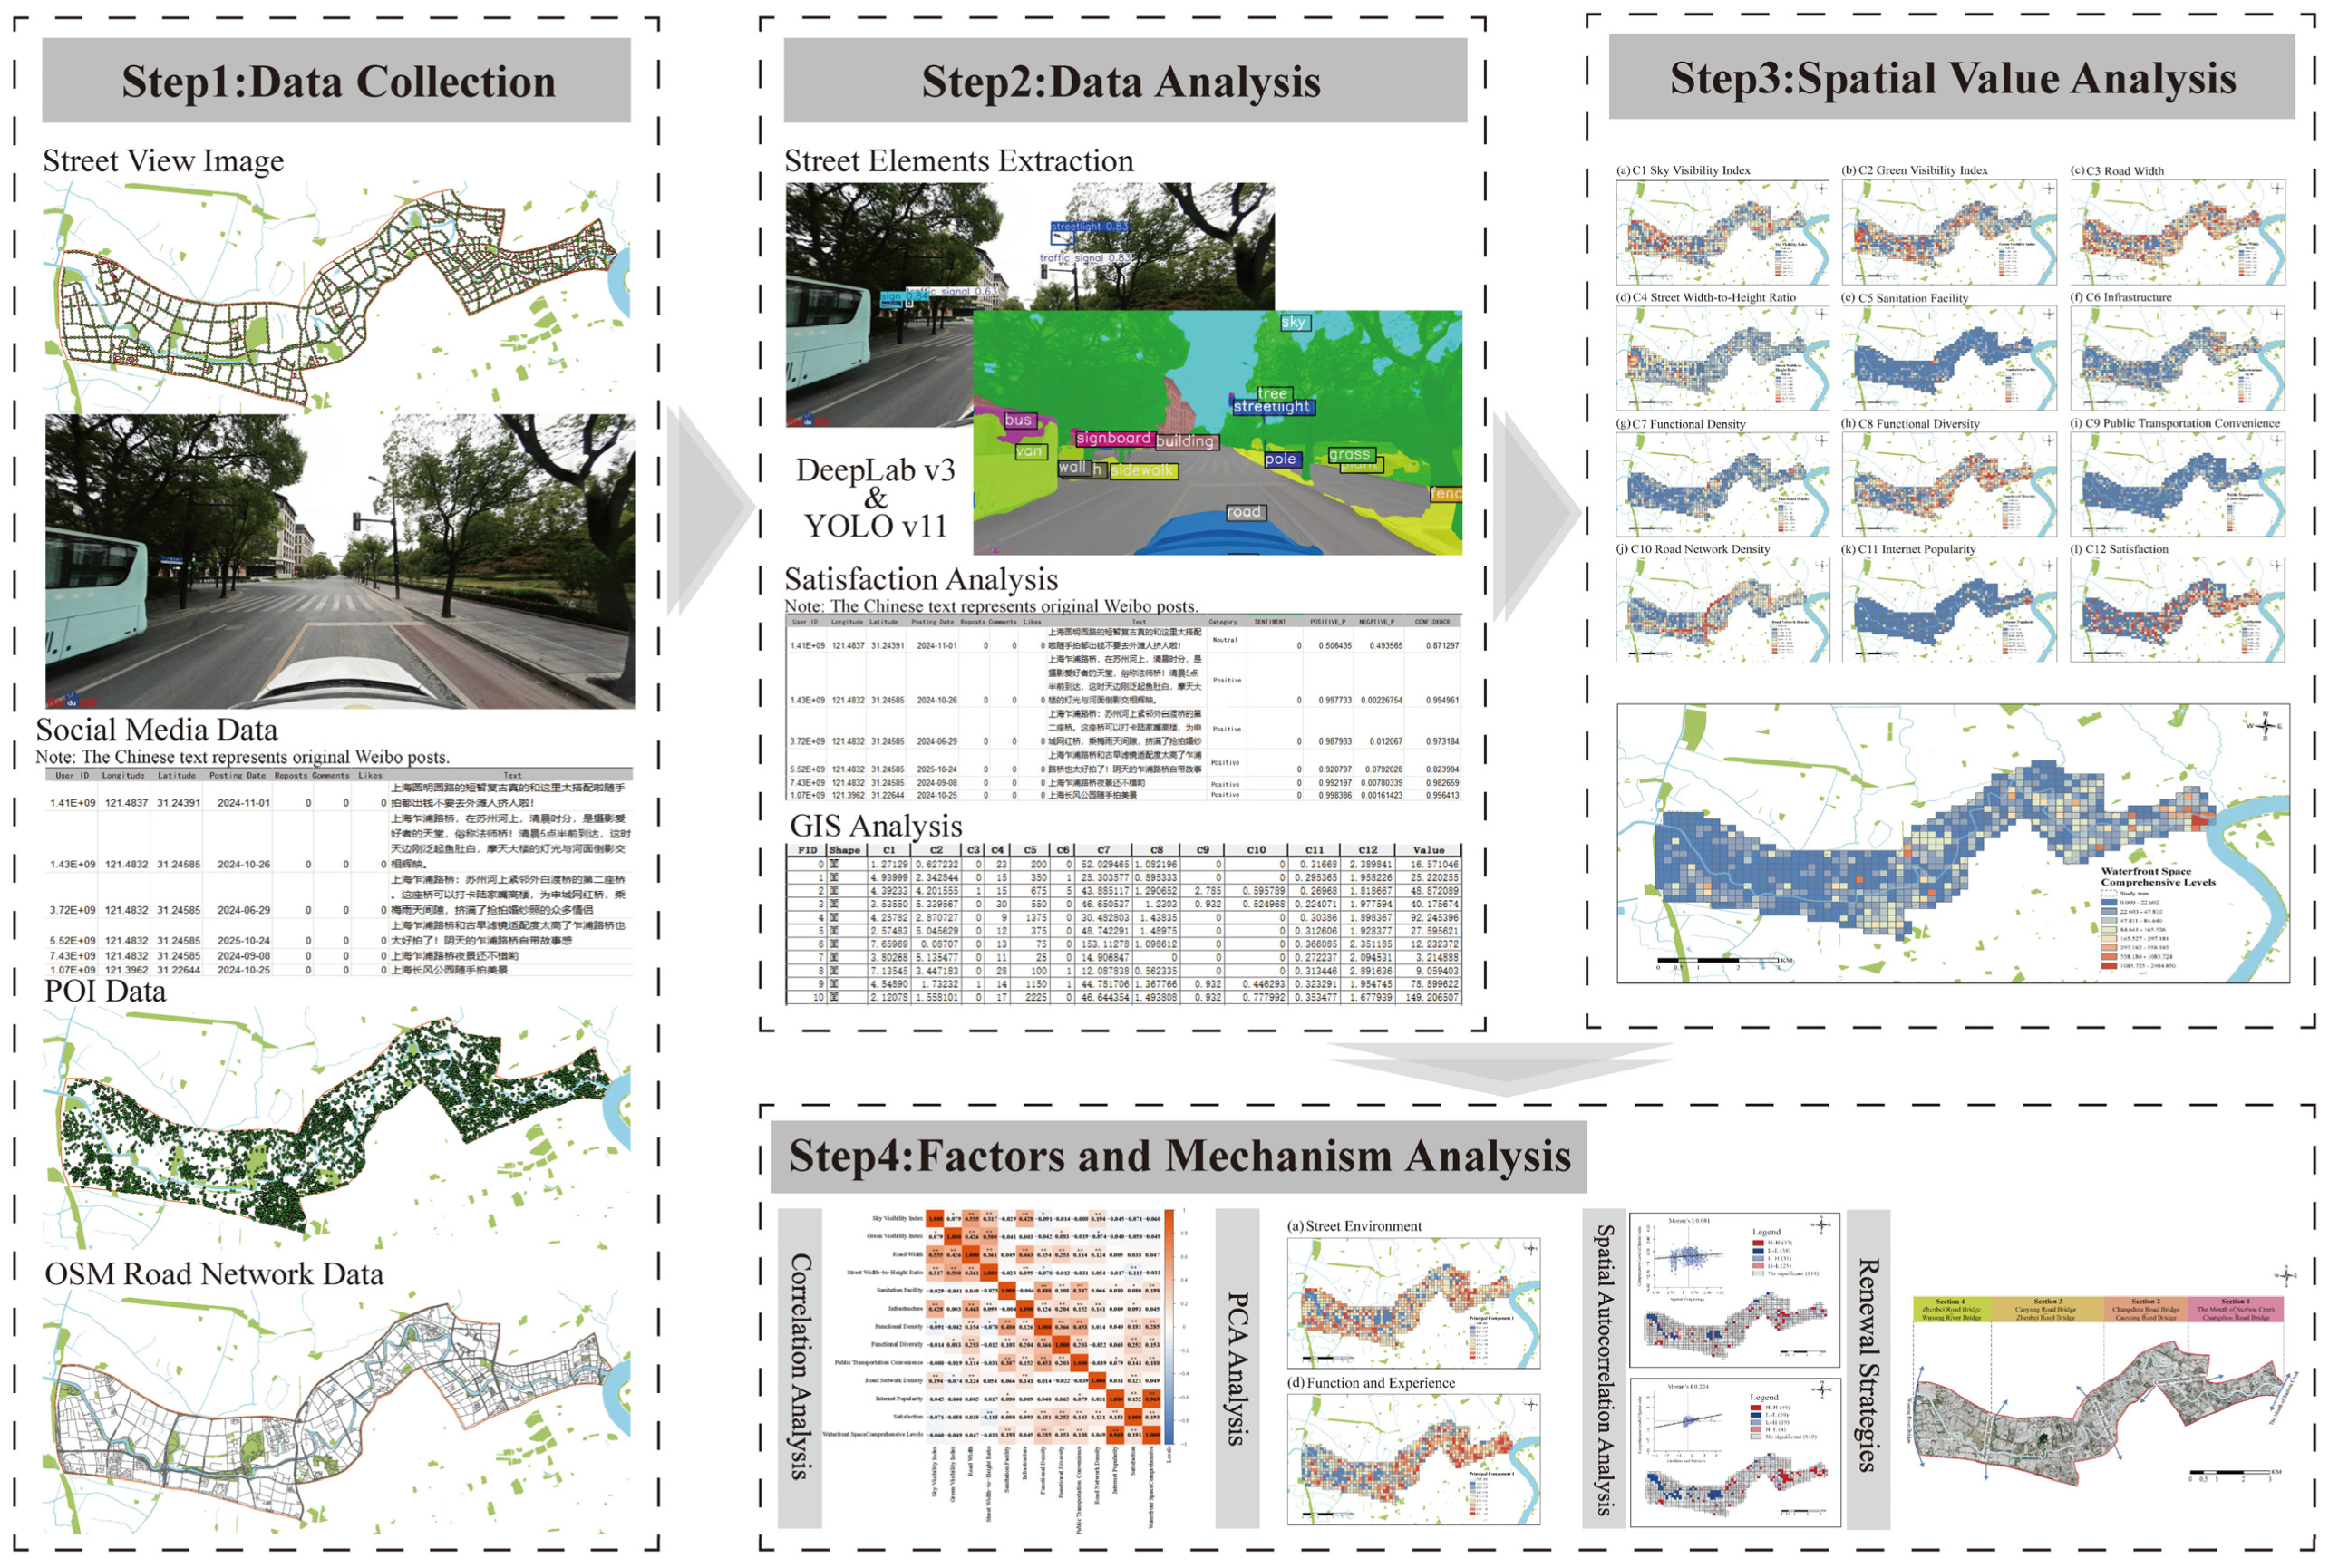
Based on the above theoretical framework, this study is conducted through the following steps (Figure 3). First, multi-source data, including street-view images, Weibo check-ins, POIs, and road networks, are collected. Second, deep learning, NLP, and other techniques are used to calculate various indicators from data such as street-view images and Weibo check-ins. Third, a combined weighting method integrating Analytic Hierarchy Process (AHP) and the Entropy Weight Method (EWM) is adopted to calculate the weight of each indicator. A waterfront space value evaluation system is then constructed to calculate the value of waterfront spaces within the study area. Finally, correlation analysis, principal component analysis (PCA), and spatial autocorrelation analysis are used to explore the key factors associated with waterfront space value.

3. Methods

3.1. Data Source and Processing

The data used in this study include street view images, Weibo check-in data, urban road network data, and POI data. Street view images were obtained via the Baidu API, while Weibo check-in records within the study area were collected using web crawling techniques. Urban road network data were sourced from OpenStreetMap, and POI data were obtained from Amap (Beijing, China). After data screening, POIs related to catering services, shopping services, education and culture, commercial facilities, residential functions, sports and leisure, and healthcare were retained.

3.1.1. Street View Images

Street view image data are an important source for urban spatial research [38], providing realistic visual representations of the urban physical environment [39]. Following Tao et al. [40], motorways, trunk, primary, secondary, tertiary, and residential roads were selected, and sampling points were set at 100 m intervals along the road network. A total of 1497 sampling points were generated within the study area. Street view images were collected from the Baidu Maps (Beijing, China) API using Python 3.14.6 (Python Software Foundation, Beaverton, OR, USA) scripts, with four directional images captured at each sampling point (0°, 90°, 180°, and 270°), resulting in 5988 street view images in total. All images have a resolution of 1024 × 512 pixels.

3.1.2. Social Media Data

Weibo check-in records were obtained from Sina Weibo (https://open.weibo.com/), one of the major social media platforms in China. These records have high spatiotemporal resolution and are representative in reflecting public emotions [41]. This study collected Weibo check-in data within the study area from January 2023 to December 2025. Each check-in record includes user ID, timestamp, latitude, longitude, number of reposts, number of likes, number of comments, and text content. We used Python-based processing and manual screening to clean the text content: (1) duplicate and blank text content was removed, and English characters, emojis, and special characters were deleted; (2) texts with fewer than three Chinese characters were removed to reduce the risk of incorrect sentiment analysis; and (3) content that was likely posted by bots, such as advertisements and weather forecasts, was filtered, and posts describing other urban spaces or unrelated to the Suzhou Creek waterfront space were excluded. Finally, a total of 13,898 valid check-in records were retained.

3.2. Construction and Calculation of Index System

3.2.1. Evaluation Index System

Existing studies on waterfront spaces differ to some extent in terms of evaluation objects, indicator selection, and data methods. However, they generally focus on dimensions such as spatial form, landscape environment, functional facilities, transport accessibility, spatial vitality, perceptual experience, and user satisfaction. For example, Sun et al. [3] explored the popularity of coastal waterfront spaces and its underlying mechanisms from the dimensions of the built environment, street environment, natural environment, cultural ecosystem services, and landscape perception, using multimodal large models and large language models. Wu and Li [12] established an evaluation system for measuring the quality of urban waterfront public spaces, including spatial form, functional facilities, and user satisfaction. Liu et al. [42] developed a quantitative evaluation system to assess the quality of waterfront spaces, including slow-mobility experience, landscape characteristics, waterfront environment, spatial vitality, and service facilities, with the assessment relying on field surveys. Based on the value evaluation framework constructed above, this paper establishes a waterfront space value evaluation system from three dimensions: basic support value, livability value, and well-being value. The indicators and calculation methods for each dimension are shown in Table 1.
Basic support value corresponds to the public’s physiological and safety needs. Its core concern is whether waterfront spaces can provide safe, comfortable, and convenient basic conditions for use. Physiological needs include the public’s basic requirements for environmental comfort and sanitary convenience in waterfront spaces. Safety needs include public requirements for traffic safety, nighttime lighting, spatial order, and related aspects. Therefore, Sky Visibility Index and Green Visibility Index are selected to measure environmental comfort. Sky Visibility Index reflects the openness of the visual field and the level of spatial exposure, while Green Visibility Index reflects the perceived presence of vegetation in the street environment. Together, these two indicators reflect whether waterfront spaces provide basic visual comfort and environmental amenity for public use. Road Width and Street Width-to-Height Ratio are selected to represent the scale of movement and the relationship of spatial enclosure [43]. Road Width reflects the physical scale of movement corridors, while Street Width-to-Height Ratio reflects the relationship between street openness and spatial enclosure. Together, these two indicators reflect the basic spatial conditions for pedestrian movement and staying in high-density waterfront areas. Traffic lights, sign, streetlights, and electronic monitoring are selected to represent the levels of traffic guidance, spatial identification, and nighttime lighting, so as to reflect the safety support capacity of waterfront spaces [3,44]. The number of public toilets is selected to represent the provision of basic sanitation services, so as to reflect the capacity of waterfront spaces to support long-duration public use [45].
Livability value corresponds to love and belonging needs. Its core concern is whether waterfront spaces can provide conditions for the public’s daily activities and social interaction. The concentration of service facilities can increase the frequency of daily visits and use by the public. A composite mix of functional types can support diverse activities, while a convenient transport network can lower the threshold for public access to waterfront spaces and strengthen the connection between waterfront areas and the urban hinterland. Therefore, functional density is selected to represent the concentration of service facilities; functional diversity is selected to represent the composite level of different functional types; public transportation convenience is selected to represent the degree of connection between waterfront spaces and the urban public transport system; and road network density is selected to represent the level of connectivity between waterfront spaces and the urban hinterland.
Well-being value corresponds to esteem and self-actualization needs. Its core concern is whether waterfront spaces can enable the public to form positive experiences and place identity. Well-being is related to personal tendencies or achievements [46]. Therefore, waterfront spaces with distinctive landscape features, cultural connotations, and attractiveness are more likely to be recorded, evaluated, shared, and disseminated by the public. In this process, cognitive recognition and emotional feedback toward the space may be formed. Existing studies have begun to use social media data to characterize perceptual experience and emotional tendencies in urban spaces [47]. Accordingly, this paper selects two indicators, internet popularity and satisfaction, to represent well-being value from the perspectives of public attention and emotional evaluation. Among them, internet popularity is calculated comprehensively based on the number of check-ins, likes, comments, and reposts. It reflects the extent to which a space is recorded and visited, as well as the intensity of interaction and dissemination on social networks. Satisfaction is based on the results of sentiment analysis of Weibo texts, reflecting the emotional tendencies expressed by the public after visiting, using, or perceiving waterfront spaces.

3.2.2. Quantitative Calculation of Indices

(1) Quantification of Street View Images
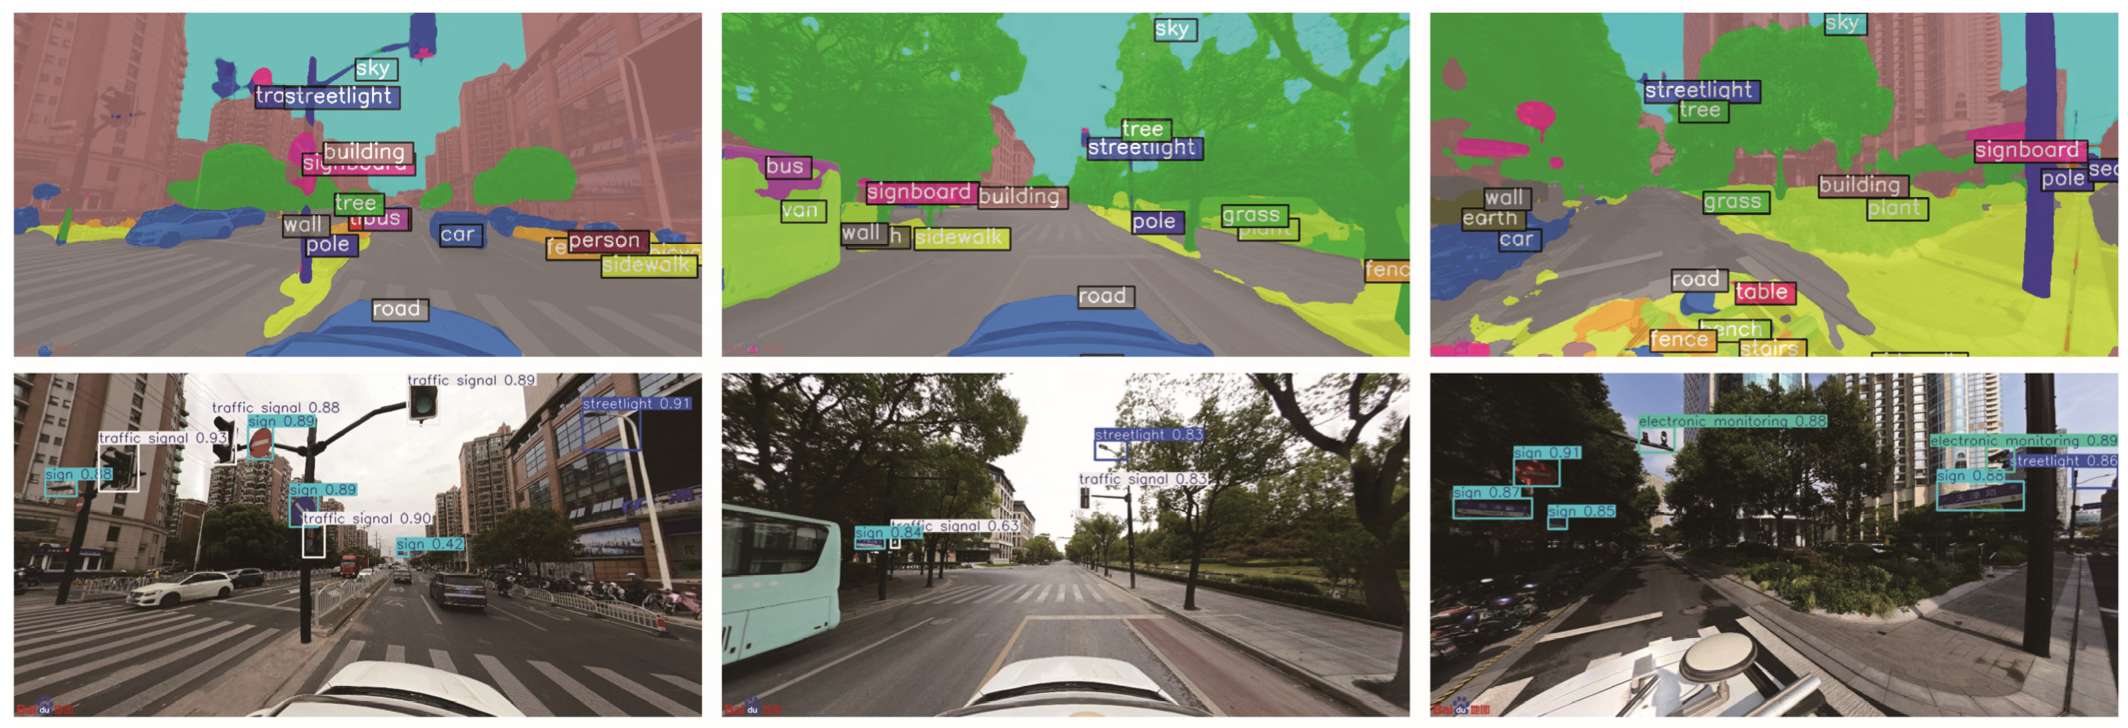
Indicators C1–C4 and C6 were calculated based on street-view data. We used two advanced deep learning algorithms: semantic segmentation and object detection (Figure 4). For C1–C4, semantic segmentation was used to extract environmental elements such as sky, greenery, roads, and buildings. This study used the DeepLabv3 model [48], trained on the ADE20K dataset, to quantify the average value of each type of environmental element at each sampling point, and then calculated the average value of each environmental element within each grid cell. For C6, object detection was used to obtain the number of street facilities. YOLOv11 was used to identify streetlights, traffic signals, signage, and electronic surveillance devices, and the total number of facilities within each grid cell was calculated. The YOLO model has been widely applied to detect various environmental attributes in image datasets, while maintaining a balance between accuracy and computational efficiency [49].
Object detection included the following steps. First, 1015 images were selected from the street-view images. To improve detection accuracy, the selected images covered different street scales and lighting conditions. LabelImg software (version 1.8.6) was used for manual annotation to classify street facilities. The dataset was divided into 80% for training and 20% for validation. Subsequently, after 230 training epochs, the accuracy of the validation set became stable and showed no significant improvement. Therefore, the best-performing training result was selected for object detection. To assess the accuracy of the detection results, 100 street-view images were randomly selected for manual review. The comparison between the YOLOv11 detection results and the manual review results showed a high level of consistency. The correlation coefficients were 0.90 for streetlights, 0.91 for traffic signals, 0.90 for signage, and 0.89 for electronic surveillance devices.
(2) Quantification of Weibo Check-in Data
Indicators C11–C12 are calculated based on Weibo check-in data. Internet popularity (C11) is not only determined by check-in frequency, but also incorporates the number of reposts, comments, and likes [47]. This study adopts the popularity scoring formula used by TikTok (i.e., Popularity Score = Check-in frequency × a + Number of reposts × b + Number of comments × c + Number of likes ×d) [50]. The weights of each component are determined by combining the AHP with expert scoring, as follows:
H = F × 0.466 + R × 0.096 + C × 0.161 + L × 0.277
where H denotes internet popularity, F represents check-in frequency, R denotes the number of reposts, C represents the number of comments, and L denotes the number of likes.
Indicator C12 is derived from sentiment analysis of Weibo text content. With the advancement of NLP techniques, an increasing number of studies have used NLP platforms to assess emotions expressed in social media data [24,51]. This study employs the NLP platform provided by Baidu (https://cloud.baidu.com/product/nlp_apply/sentiment_classify; accessed on 10 January 2026) to conduct sentiment analysis, in which the API returns a “positive prob” value representing the probability that a text conveys positive sentiment [52]. This positive probability is selected as the sentiment score, with a value ranging from 0 to 1. Texts with a score greater than 0.5 are labeled as having positive sentiment, while those with a score lower than 0.5 are labeled as having negative sentiment.
(3) Quantification of Urban Road Network and POI Data
Indicators C5 and C7–C10 are calculated based on POI data and road network data. Indicators C7 and C10 are evaluated by measuring the density of POIs or the road network within each grid unit. Indicator C8 is assessed by calculating entropy within each grid unit, with higher entropy indicating greater functional diversity. Indicators C5 and C9 are evaluated by counting the total number of public toilets, bus stops, and subway stations within each grid unit.

3.3. Waterfront Space Value Evaluation and Associated-Factor Analysis

3.3.1. Weight Determination Based on AHP and EWM

This study integrates subjective and objective weighting methods. The Analytic Hierarchy Process (AHP) was used to analyze the expert scoring results. Five experts from urban planning and related fields were invited to participate in pairwise comparisons of the indicators. The Saaty 1–9 scale was used for scoring, and the expert judgments were aggregated to obtain the judgment matrix at the indicator level. The consistency ratio was CR = 0.034027, satisfying CR < 0.1, and thus passed the consistency test. In addition, the Entropy Weight Method (EWM) was used to determine the objective weights based on the variability of each indicator dataset. Finally, the combined weight coefficients were determined through matrix-based analysis, so as to consider both subjective expert judgment and objective data characteristics [53]. The formulas are as follows:
α i = ν i ν i + ω i
β i = ω i ν i + ω i
where i = 1, 2, ⋯n, ν i denotes the AHP-derived weight of indicator i, ω i denotes the EWM-derived weight of indicator i. α i and β i represent the relative contribution coefficients of the AHP-derived and EWM-derived weights, respectively.
After obtaining the relative contribution coefficients of AHP and EWM, these values are substituted into the following formula to obtain the combined weight of each indicator (Table 1):
Q i = ν i α i + ω i β i i = 1 n ( ν i α i + ω i β i )

3.3.2. Associated-Factor Analysis of Waterfront Space Value

(1) Correlation Analysis
Pearson correlation analysis is a parametric statistical method used to measure the degree and direction of linear correlation between two continuous variables. The Pearson correlation coefficient (r) ranges from −1 to 1. The closer its absolute value is to 1, the stronger the linear correlation. When p < 0.05, * indicates that the correlation is significant at the 0.05 significance level; when p < 0.01, ** indicates that the correlation is significant at the 0.01 significance level.
(2) PCA
PCA is a dimensionality reduction statistical method that captures the maximum amount of information in the original data by reducing data dimensions. This method can minimize information loss between the original data and the new dimensions, and address problems caused by excessive indicators and overlapping information [54]. The number of principal components used to represent the original data is determined through procedures including data standardization, the KMO test, Bartlett’s test of sphericity, and cumulative variance.
(3) Spatial Autocorrelation Analysis
Bivariate spatial autocorrelation analysis is used to examine the spatial association between two variables and has been widely applied in fields such as geography and regional economics [55]. Based on the GeoDa platform, this study employs bivariate spatial autocorrelation analysis to quantify the spatial association between principal components and waterfront space value. In addition, LISA cluster maps are used to analyze local-scale spatial clustering patterns between the two variables. The results are visualized using ArcGIS Pro (version 3.4.3) to identify high-value and low-value clusters and to reveal spatial heterogeneity in their relationships, thereby highlighting areas for further investigation or potential intervention [56]. The calculation formula is as follows:
I k l i = x k i x k ¯ σ k j = l n ( W i j x l j x l ¯ σ l )
where W i j is the spatial weight matrix; x k i is the observation k of study unit i; x l j is the observation l of study unit j; σ k and σ l are the variances of x k and x l respectively.

4. Results

4.1. Spatial Distribution Characteristics of Waterfront Space Value Along Suzhou Creek

4.1.1. Spatial Distribution Characteristics of Evaluation Indicators

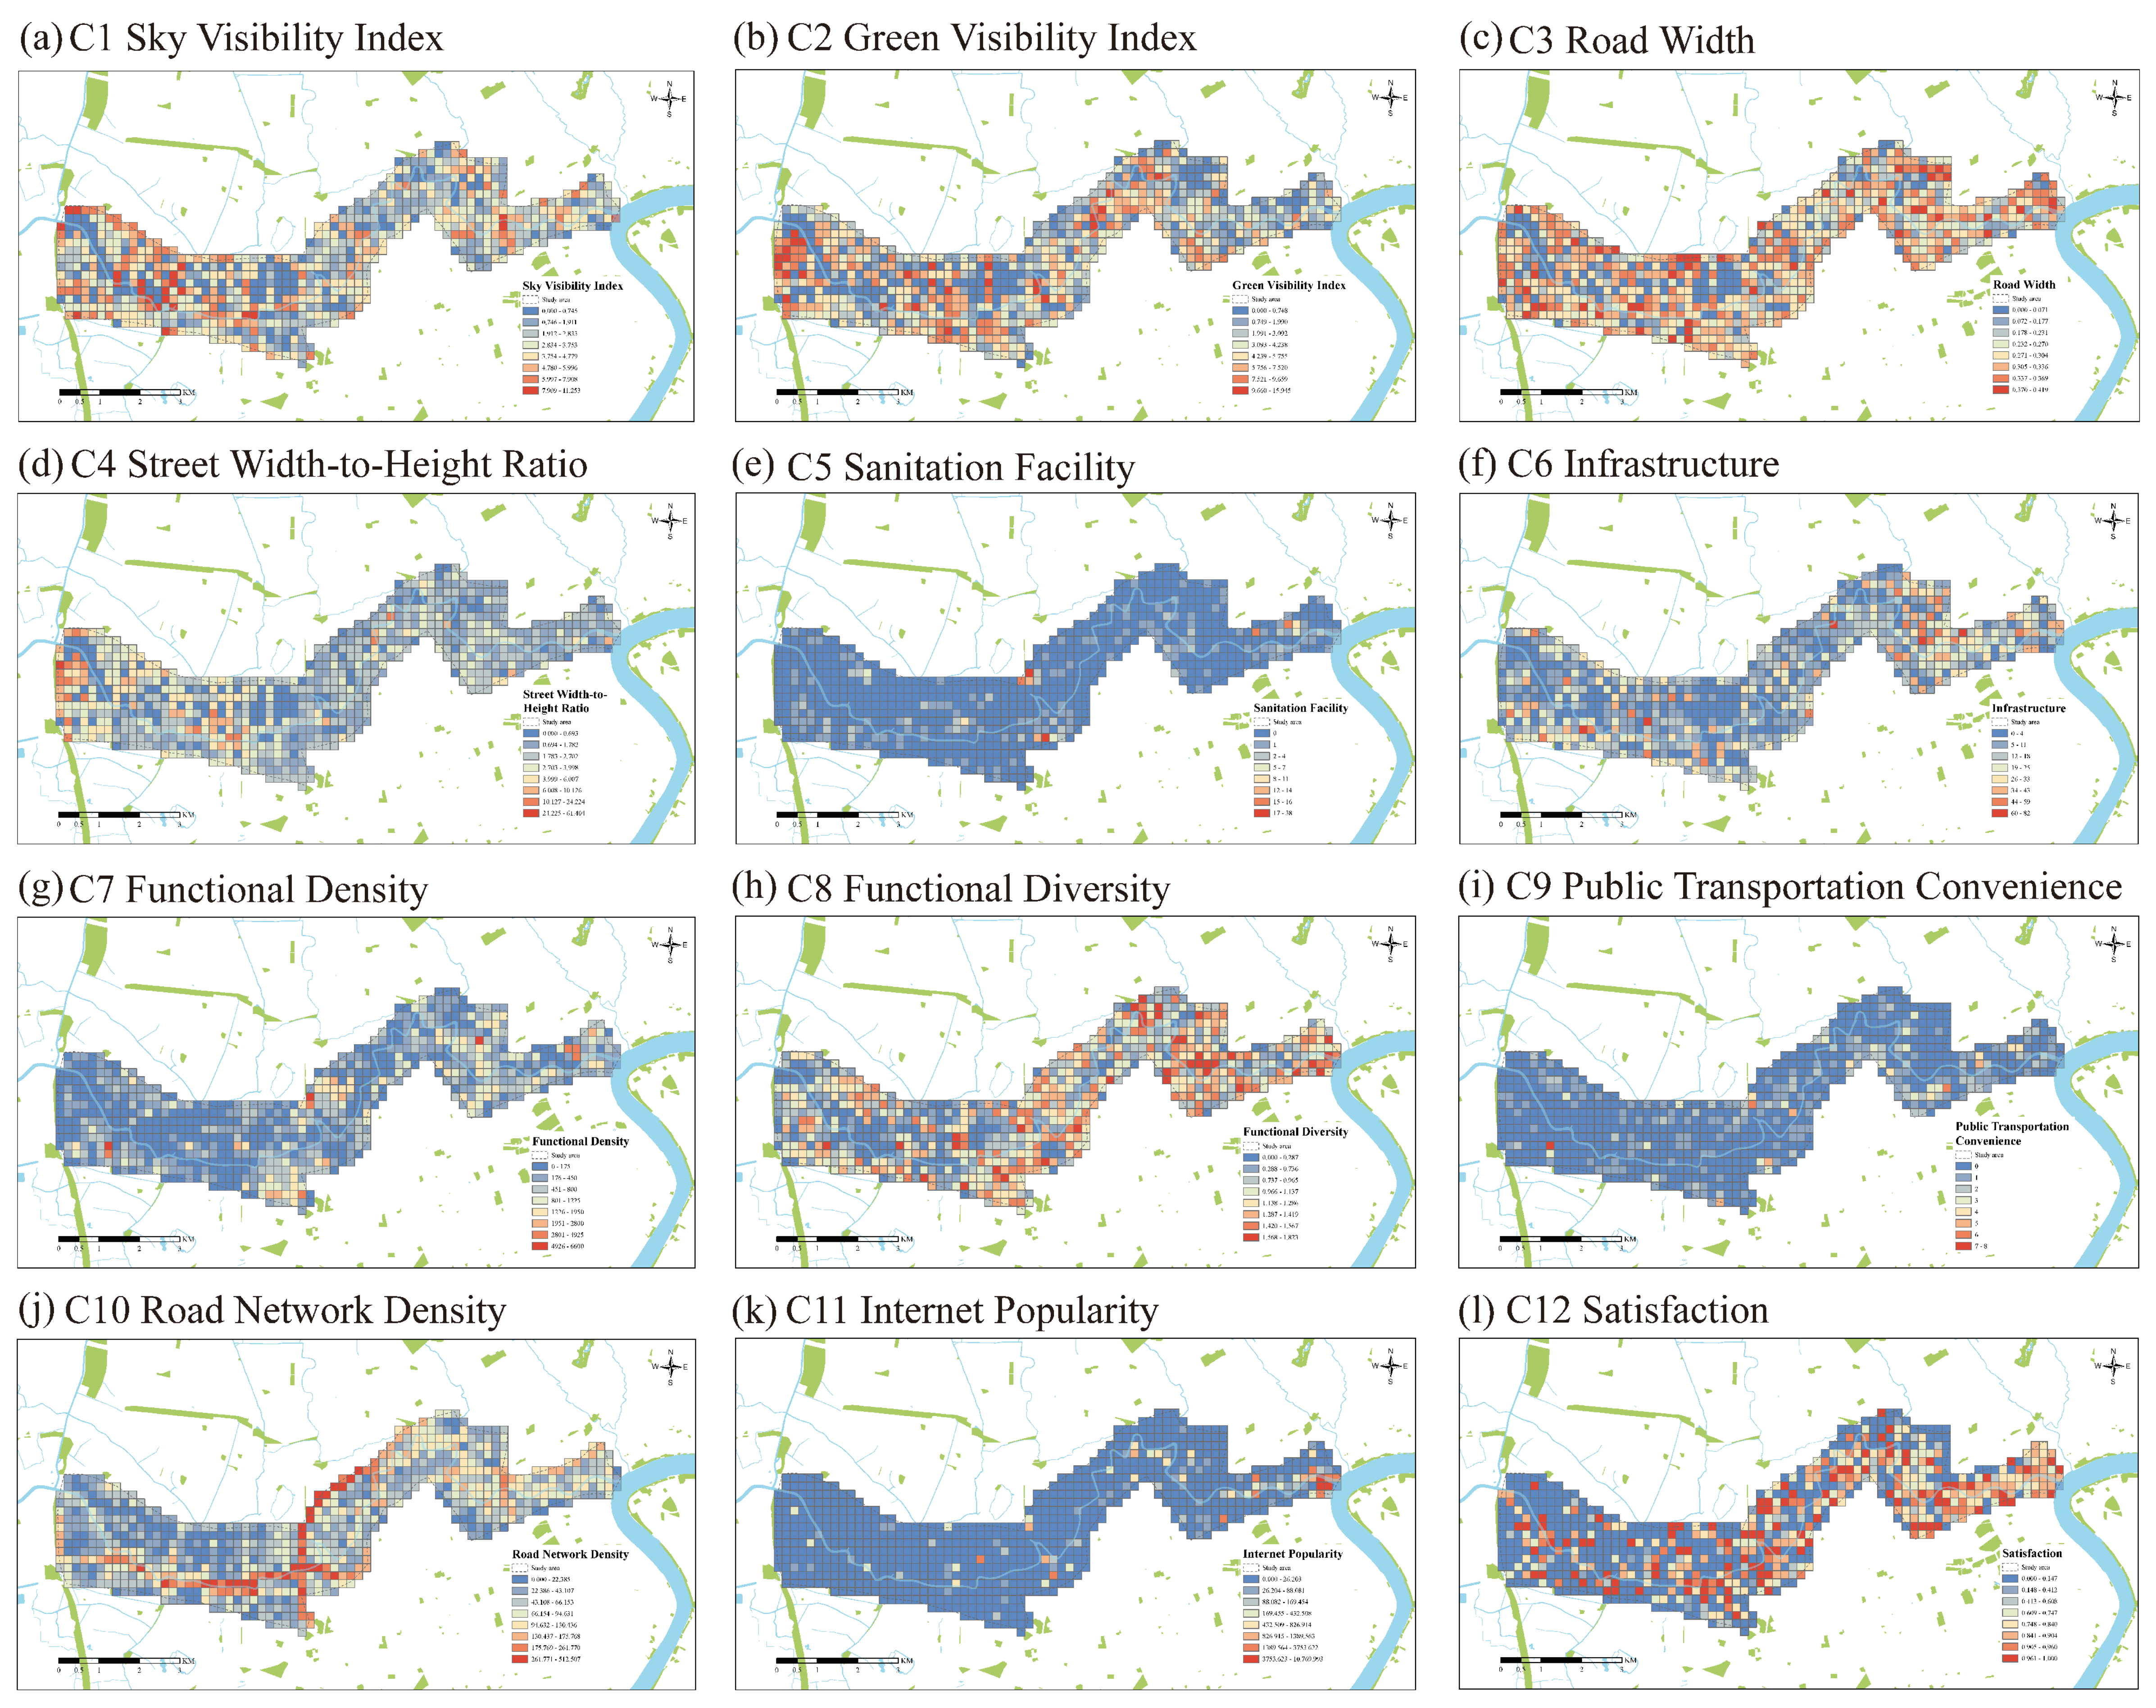
Based on the waterfront space value evaluation system established in Section 3.2, Figure 5a–l shows the spatial distribution of each indicator. In terms of basic support value, Road Width (C3) is generally high, indicating that the street scale in this area is relatively large. Sky Visibility Index (C1), Green Visibility Index (C2), and Street Width-to-Height Ratio (C4) decrease from west to east. This pattern is closely related to differences in urban development, with narrow streets and dense road networks in the eastern section, and wider streets with sparser road networks in the western section. The eastern section is dominated by small-scale blocks and high-density buildings, which affect streetscape visual perception, whereas the western section mainly consists of large-scale industrial parks, university campuses, and green spaces, with wider streets and better greening conditions. This urban development pattern also influences the spatial distribution of POIs and the road network, thereby affecting other indicators. Sanitation Facility (C5) shows a generally low level, as most of the study area is residential and public toilets are mainly concentrated in shopping centers and green spaces. Infrastructure (C6) decreases from east to west, as the dense road network and complex traffic conditions in the eastern section result in a higher concentration of streetlights and traffic signals.
At the level of livability value, functional density (C7) and functional diversity (C8) decrease from east to west, as the eastern section is the urban core with a greater quantity and diversity of functional services. Public transportation convenience (C9) is influenced by Suzhou Creek, with fewer public transport stops located directly along the waterfront, while higher levels of accessibility are observed in the outer areas of the study region. High values of road network density (C10) are mainly concentrated along two major east–west and north–south urban expressways within the study area, and overall road network density is higher in the eastern section than in the western section.
At the level of well-being value, internet popularity (C11) shows an uneven spatial distribution, with high-value areas concentrated at the mouth of Suzhou Creek in the eastern section. This area includes major attractions and commercial districts, such as the Bund, Waibaidu Bridge, and pedestrian streets, as well as numerous historic buildings and conservation areas, resulting in a large volume of Weibo check-in activity. Satisfaction (C12) decreases from east to west, which may be attributed to the higher volume of check-in data in the eastern section and its role as a key focus of recent waterfront development along the Huangpu River and Suzhou Creek, resulting in better overall environmental quality and spatial character.

4.1.2. Overall Spatial Value

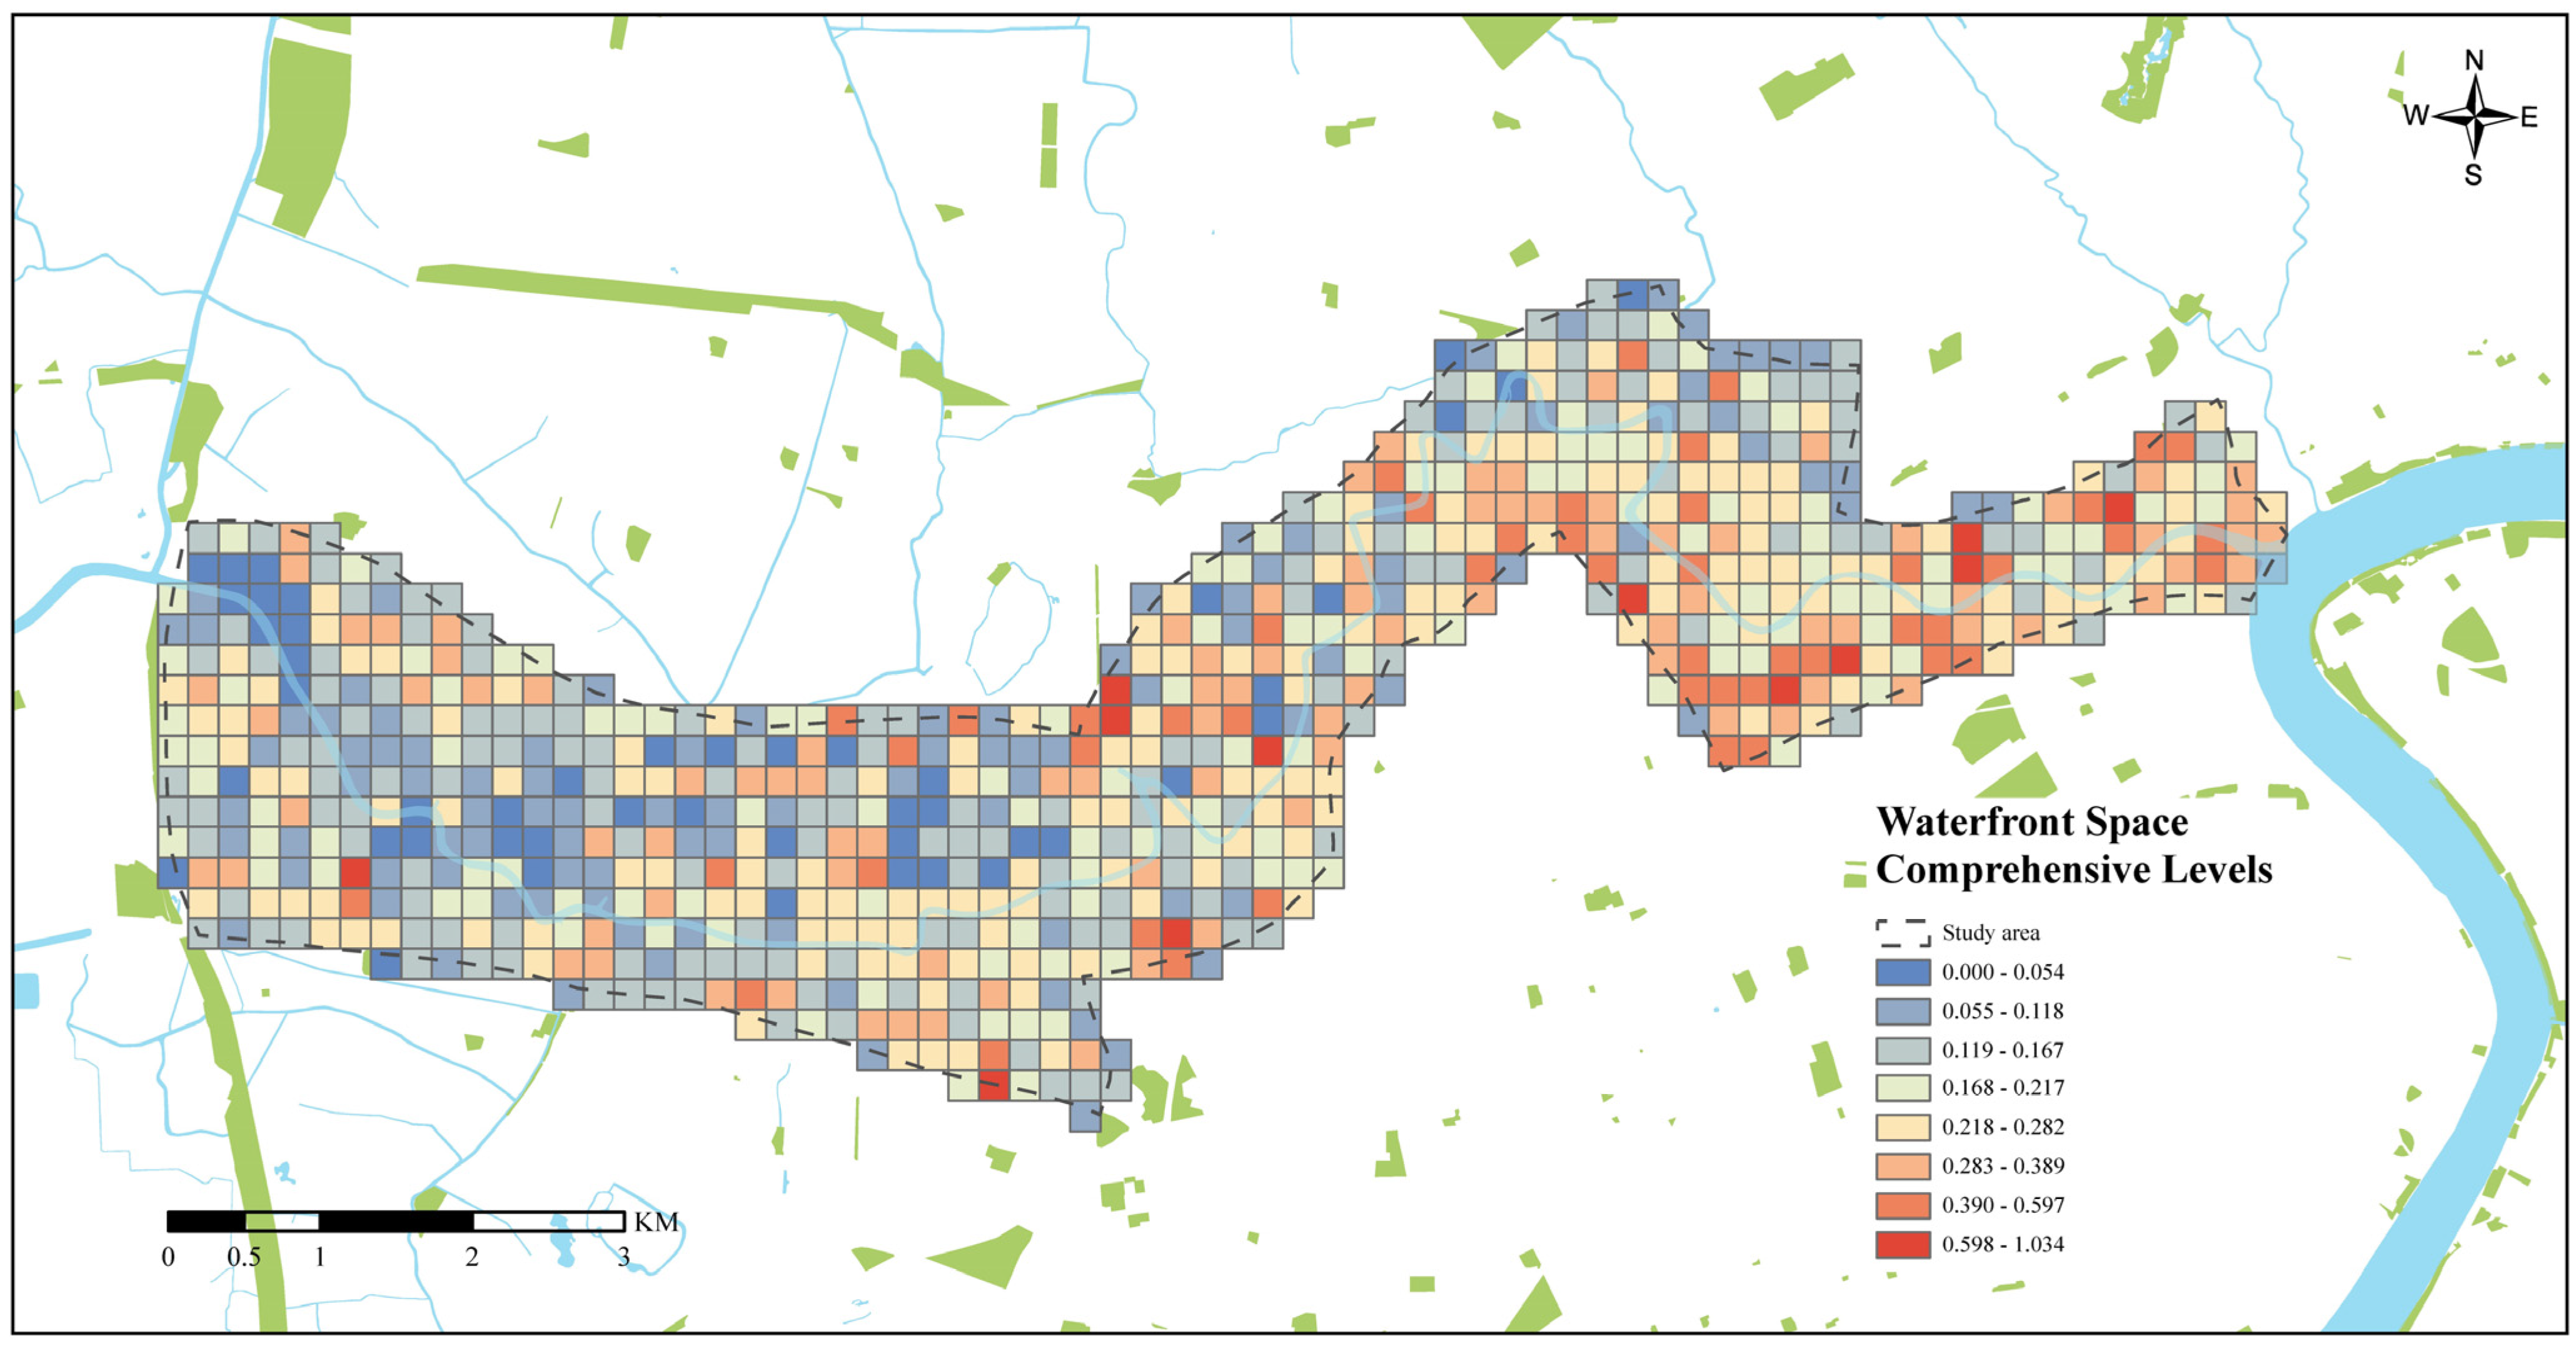
As shown in Figure 6, the comprehensive value of waterfront spaces along Suzhou Creek presents a pattern of “higher in the east and lower in the west”. According to the previous analysis, the dense road network and abundant functions and facilities in the eastern area are closely associated with the higher spatial value of this area. In contrast, the lower spatial value in the western area may be related to factors such as large-scale streets, lower densities of functions and facilities, and relatively insufficient road network connectivity.

4.2. Analysis of Factors Associated with the Value of Suzhou Creek Waterfront Spaces

Differences in spatial value are usually associated with multiple factors. Therefore, identifying the associations between these factors and spatial value can help promote the renewal and optimization of Suzhou Creek waterfront spaces. This study uses correlation analysis, PCA, and spatial autocorrelation analysis to identify the factors closely associated with spatial value.

4.2.1. Correlation Analysis

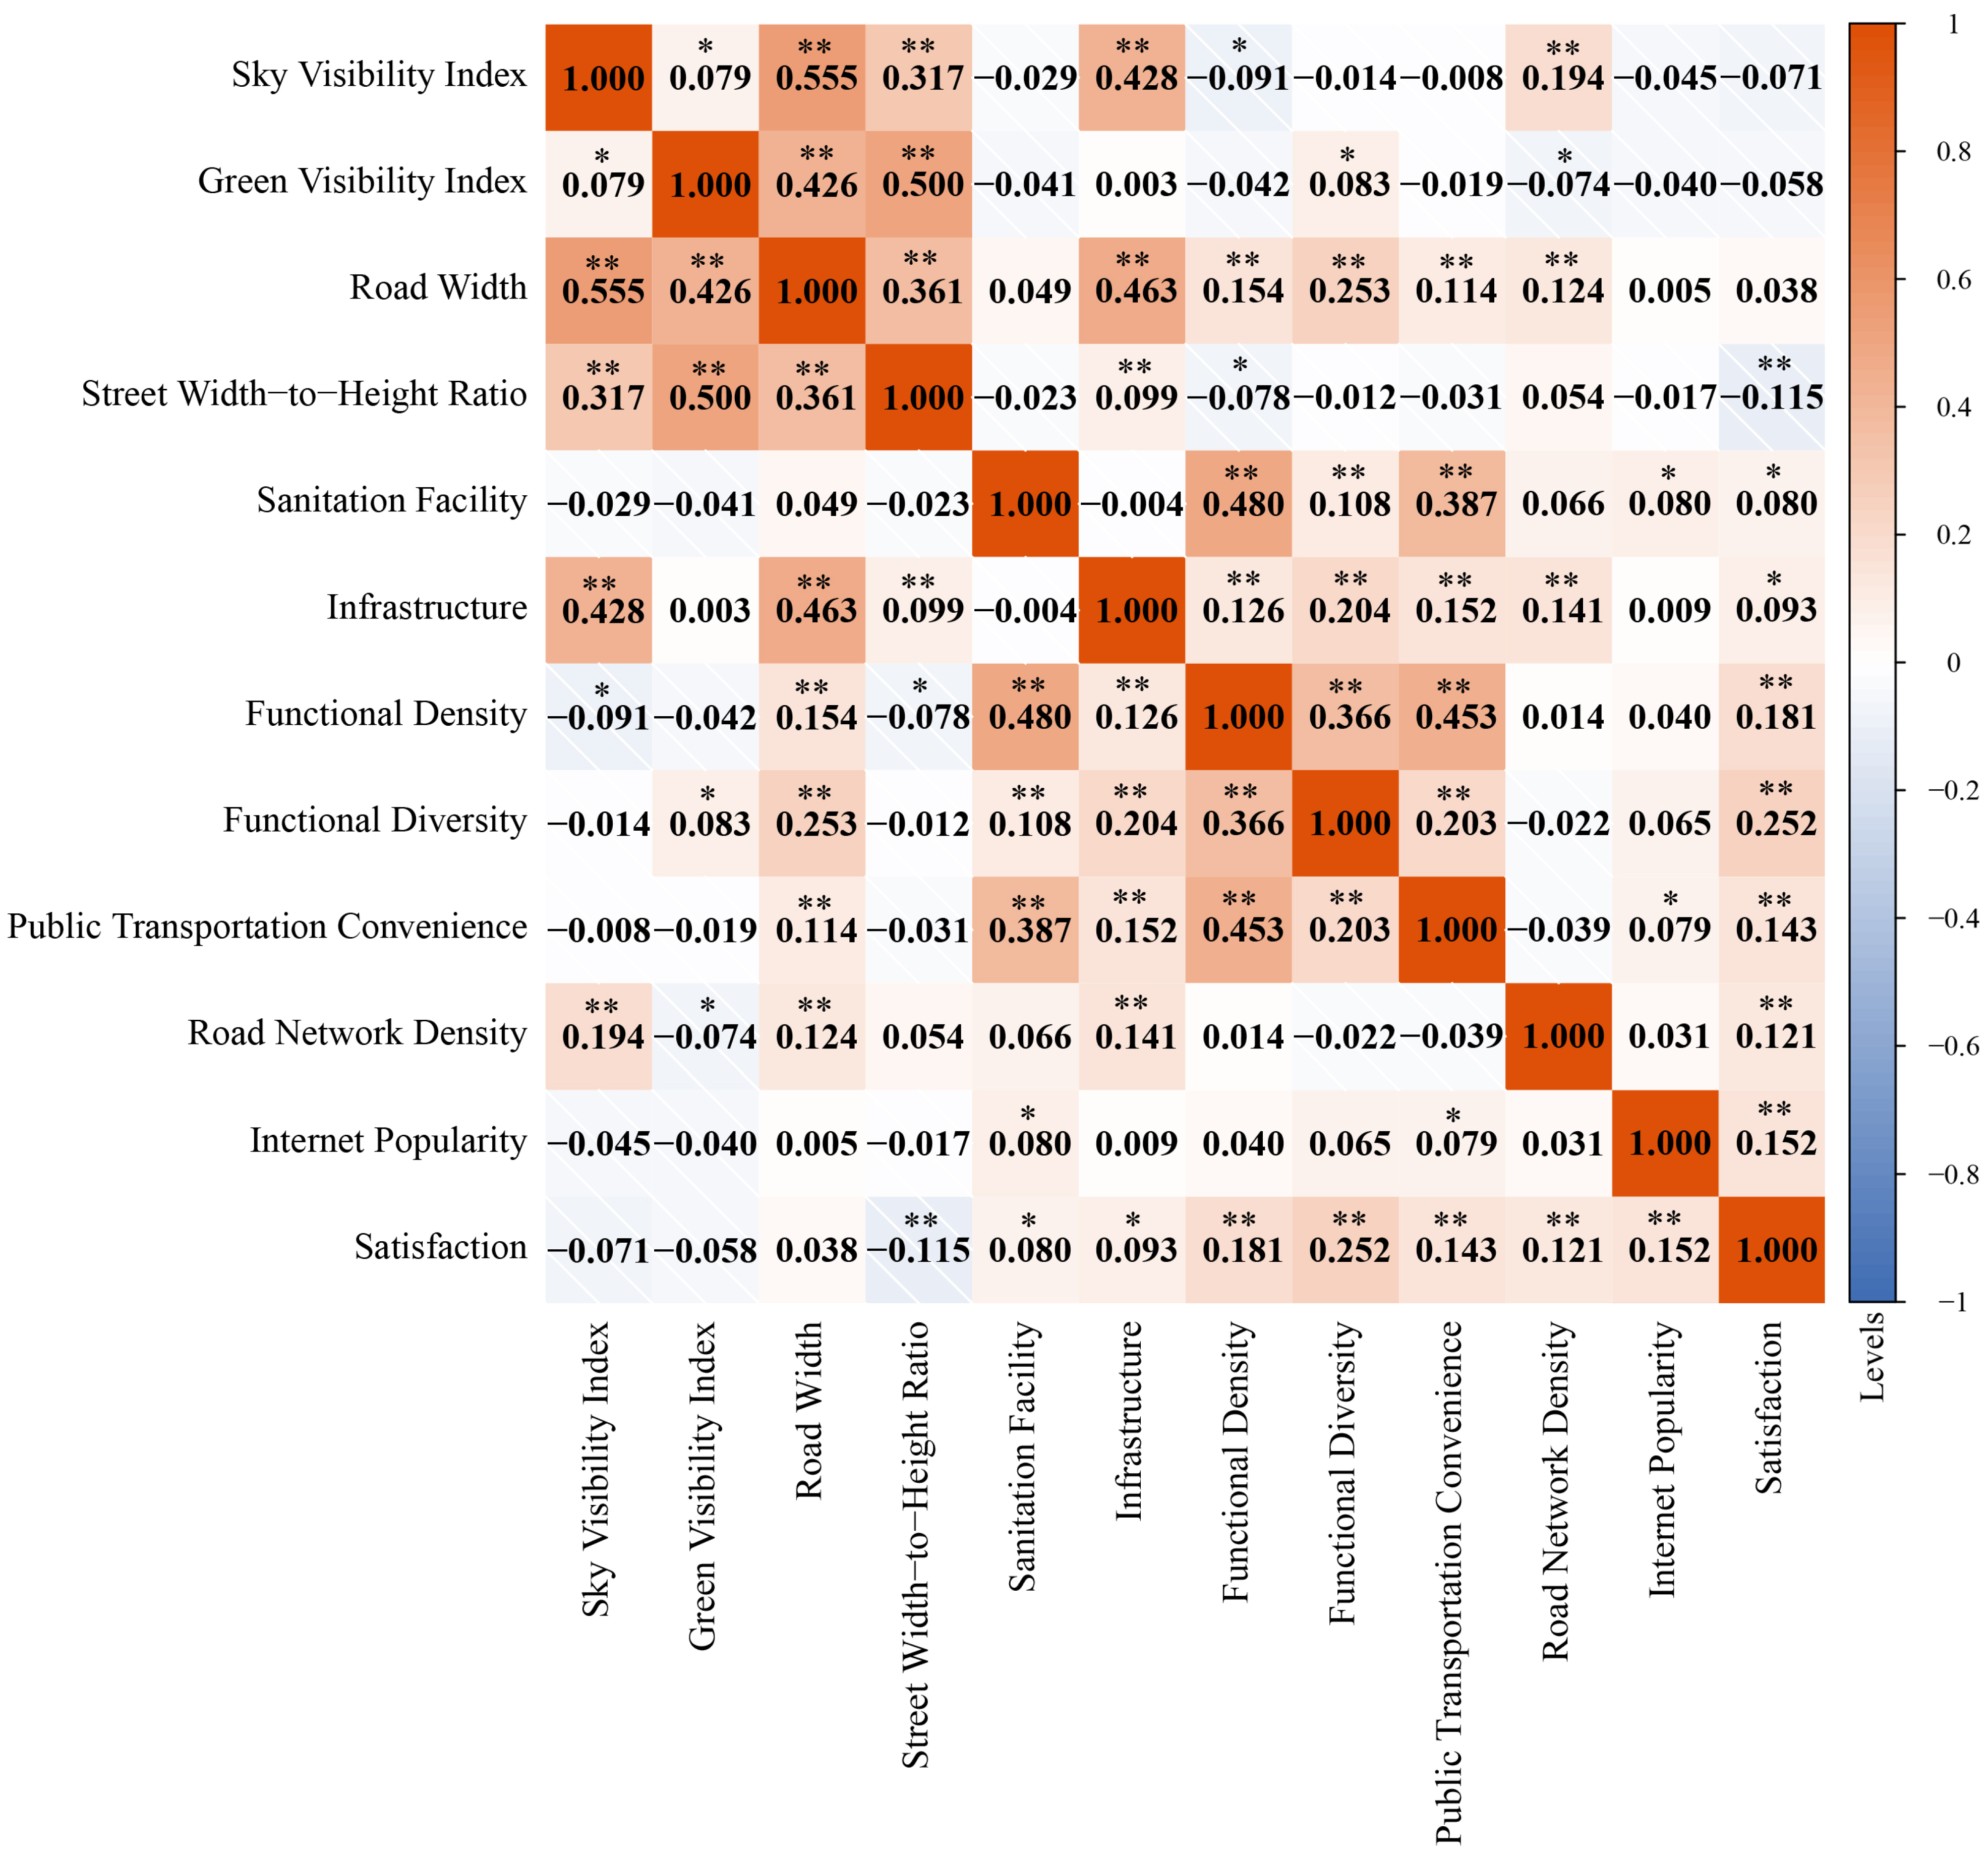
This study uses Pearson correlation analysis to examine the associations among the 12 evaluation indicators, so as to reveal the synergistic characteristics among the micro-environment, facility services, functional activities, and public perception of waterfront spaces. As shown in Figure 7, there are relatively clear correlations among indicators related to the visual environment and spatial form. Sky Visibility Index (C1) and Green Visibility Index (C2) are significantly positively correlated with Road Width (C3) and Street Width-to-Height Ratio (C4), indicating a certain co-occurrence relationship among the openness of waterfront streets, road scale, and the visibility levels of sky and greenery. Facility service indicators and functional activity indicators also show a certain degree of synergy. Sanitation Facility (C5) is significantly positively correlated with functional density (C7) and public transportation convenience (C9), suggesting that facility provision is usually accompanied by transport support and functional carrying capacity. Functional density (C7), functional diversity (C8), and public transportation convenience (C9) are significantly correlated, indicating that areas with higher transport convenience tend to accommodate more diverse functional activities. Satisfaction (C12) is positively correlated with functional density (C7), functional diversity (C8), public transportation convenience (C9), and road network density (C10), suggesting that positive public emotional perception is associated with functional mix and transport accessibility. In contrast, Street Width-to-Height Ratio (C4) is negatively correlated with satisfaction (C12), indicating that excessive spatial openness or overly large street scale may be associated with lower emotional experience.

4.2.2. PCA

Because there are many evaluation indicators and certain correlations exist among them, PCA was adopted for analysis. This method can effectively address multicollinearity and facilitate subsequent in-depth analysis. As shown in Table 2, the KMO value of this analysis was 0.636, and Bartlett’s test of sphericity showed a significance level of 0.000, indicating that the data were suitable for principal component analysis. Five principal components with eigenvalues greater than 1 were extracted. Their variance and cumulative contribution rates are shown in Table 3. By analyzing the factor loadings of each principal component (Table 4), we identified five main components and named them according to the shared meanings of the high-loading indicators in the rotated component matrix.
Principal Component 1, street environment (including C1, C3, and C6), reflects the visual openness, road scale, and infrastructure configuration of waterfront streets. Principal Component 2, facilities and services (including C5, C7, and C9), reflects the service provision and daily use support of waterfront spaces. Principal Component 3, spatial morphology (including C2 and C4), reflects the relationship between green perception and spatial openness in waterfront streets. Principal Component 4, function and experience (including C8 and C12), reflects the degree of functional mix and users’ emotional evaluation. Principal Component 5, spatial attractiveness (including C10 and C11), reflects the level of road connectivity and public attention. Based on Table 3 and Table 4, the principal component scores of each grid cell were calculated. Typical areas were then identified according to the score levels. The formulas for calculating each principal component score are as follows:
F 1 = 0.812 C 1 0.020 C 2 + 0.671 C 3 + 0.212 C 4 0.036 C 5 + 0.772 C 6 + 0.031 C 7 + 0.118 C 8 + 0.057 C 9 + 0.437 C 10 0.139 C 11 + 0.019 C 12
F 2 = 0.058 C 1 0.042 C 2 + 0.110 C 3 0.024 C 4 + 0.834 C 5 + 0.057 C 6 + 0.776 C 7 + 0.215 C 8 + 0.733 C 9 + 0.042 C 10 + 0.041 C 11 + 0.047 C 12
F 3 = 0.184 C 1 + 0.875 C 2 + 0.499 C 3 + 0.791 C 4 + 0.011 C 5 0.063 C 6 0.052 C 7 + 0.064 C 8 0.013 C 9 0.144 C 10 + 0.090 C 11 0.153 C 12
F 4 = 0.161 C 1 + 0.117 C 2 + 0.227 C 3 0.166 C 4 0.157 C 5 + 0.275 C 6 + 0.312 C 7 + 0.782 C 8 + 0.166 C 9 0.305 C 10 + 0.105 C 11 + 0.557 C 12
F 5 = 0.019 C 1 0.052 C 2 0.014 C 3 + 0.045 C 4 + 0.130 C 5 0.047 C 6 0.013 C 7 + 0.002 C 8 0.016 C 9 + 0.539 C 10 + 0.748 C 11 + 0.515 C 12
Based on the results of Equations (6)–(10), the comprehensive spatial score (F) was calculated to evaluate the study area as a whole. The formula is as follows:
F = 16.520 % F 1 + 15.894 % F 2 + 14.471 % F 3 + 11.409 % F 4 + 9.495 % F 5 67.788 %
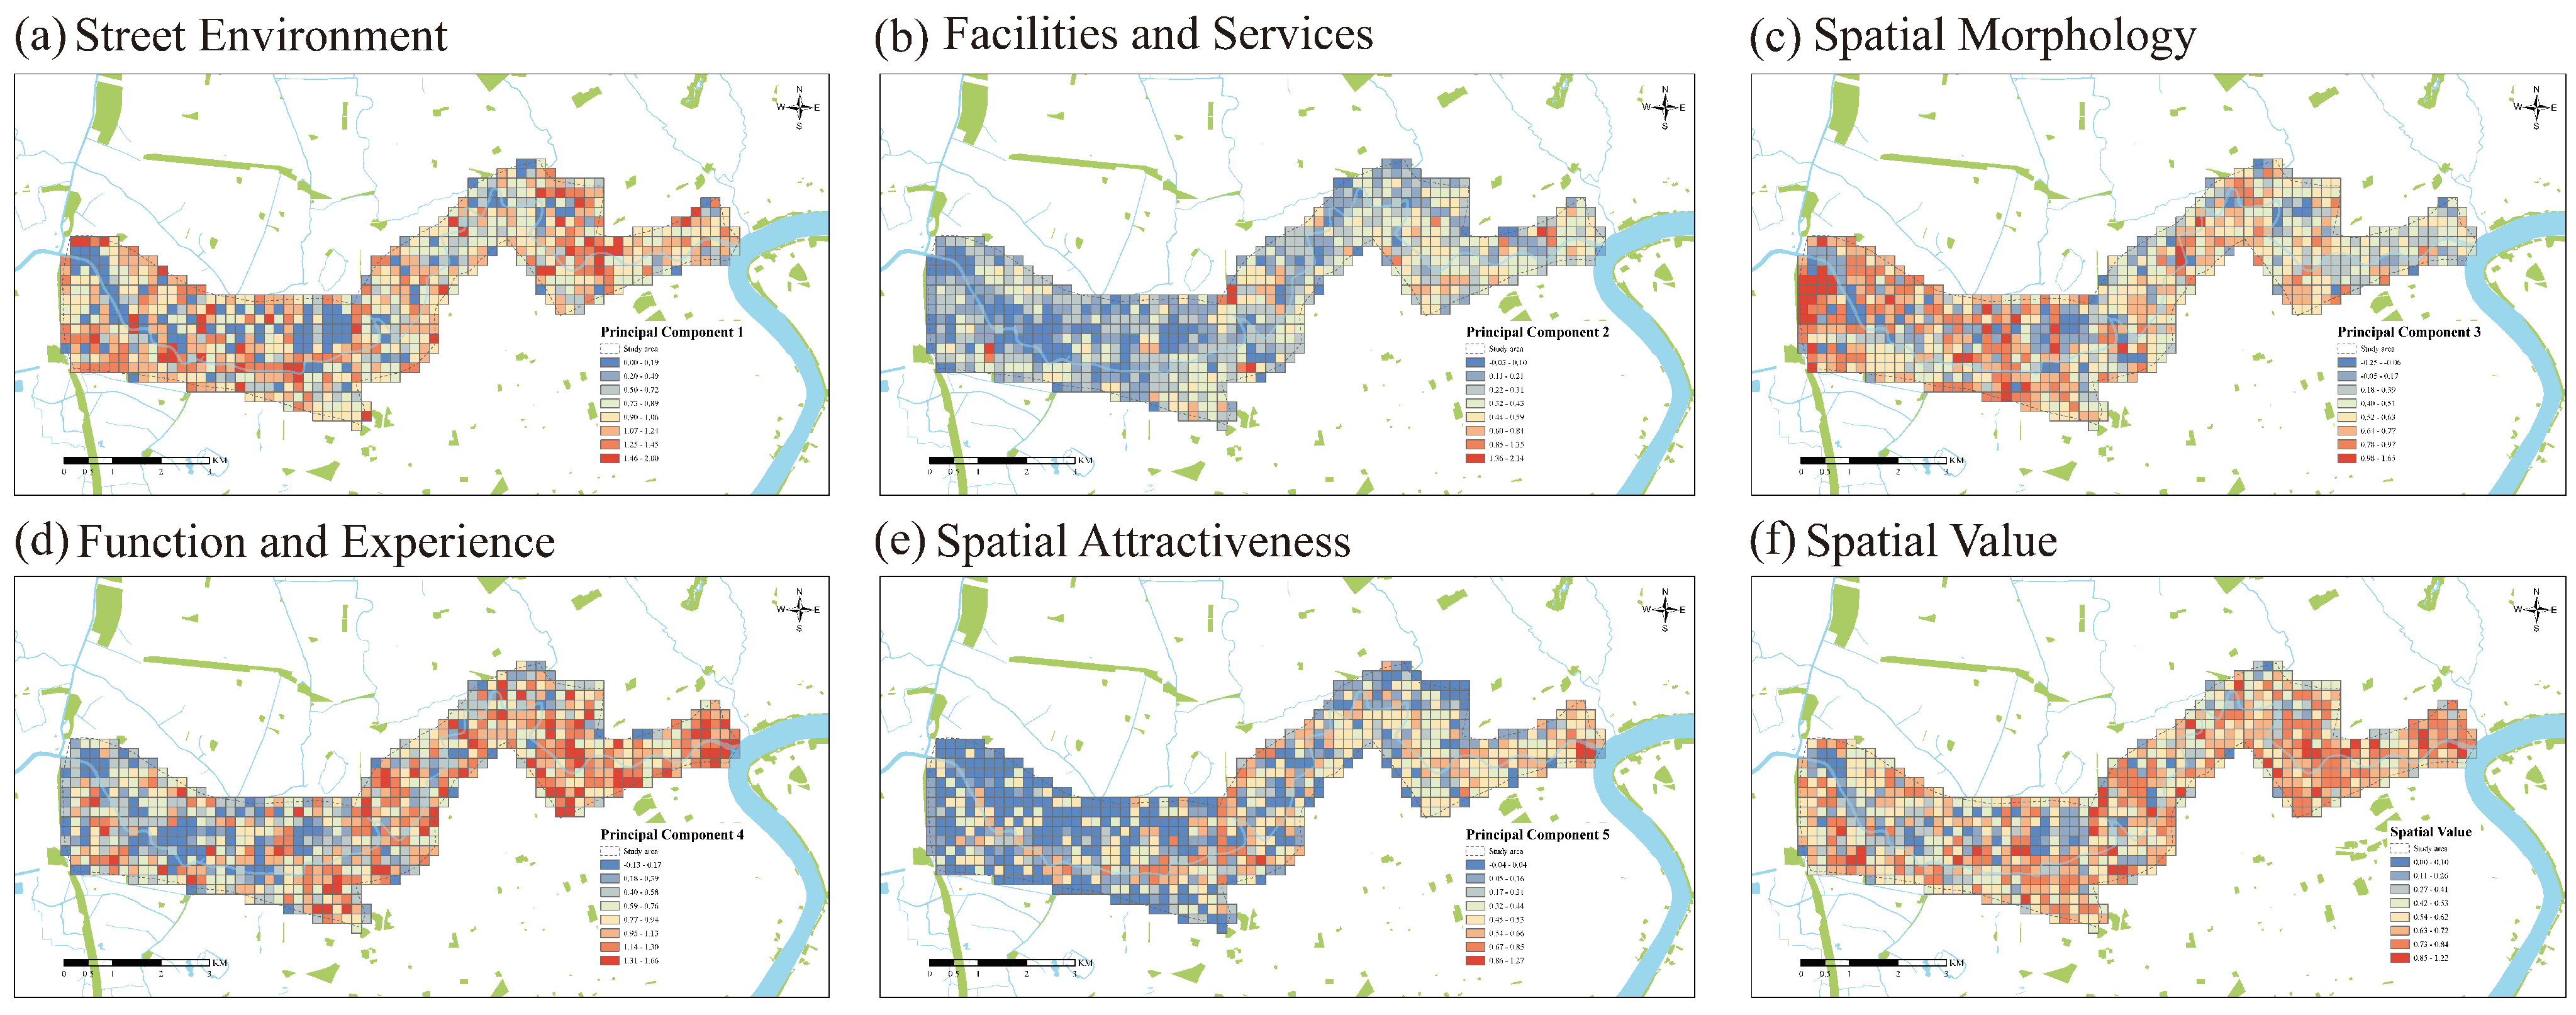
To better understand the spatial distribution of these principal components, the calculation results were visualized (Figure 8a–f). Principal Components 1 and 3 show generally high scores in the study area, indicating that the overall street environment and spatial morphology are relatively good. Principal Components 2, 4, and 5 decrease from east to west, suggesting better facilities and services, function and experience, and spatial attractiveness in the eastern section. The comprehensive score results (Figure 8f) show that the western section along Suzhou Creek has lower scores, which supports the previous analysis. This area has fewer facilities and services, weak spatial attractiveness, and a stronger influence of the river on the transportation network, which together reduce the overall comprehensive score.

4.3. Spatial Autocorrelation Analysis

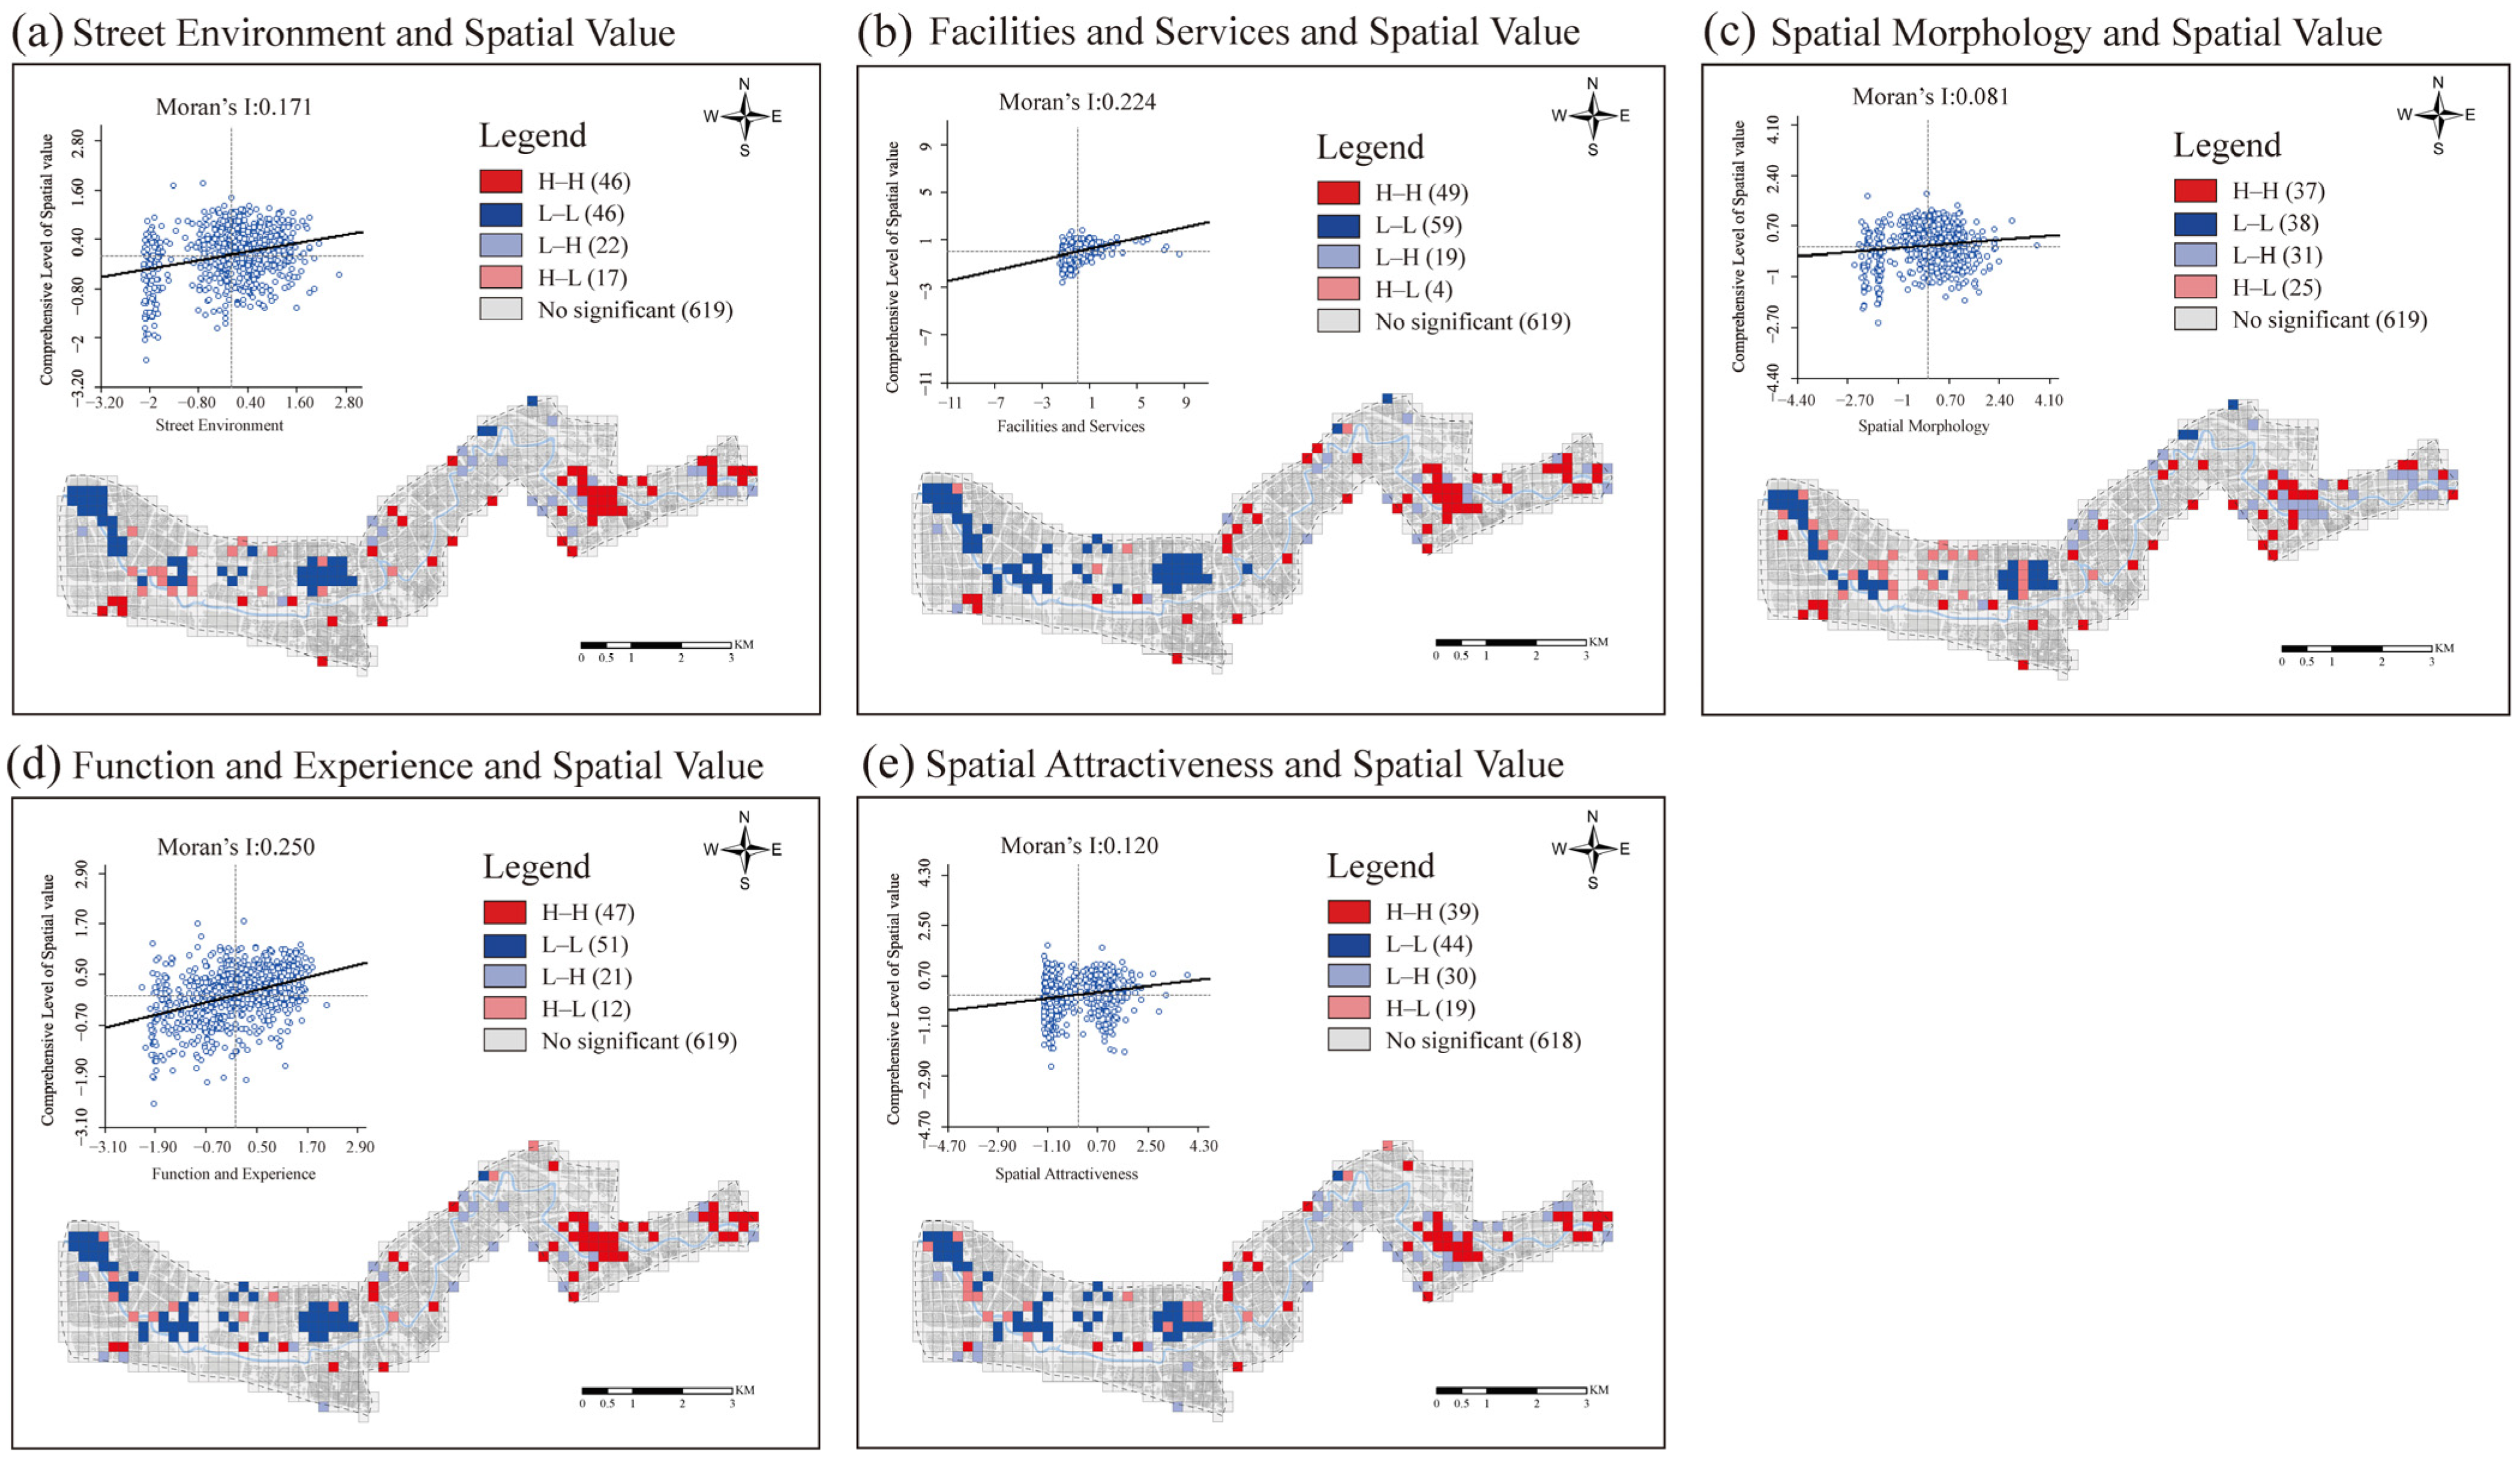
To further explore the key factors associated with waterfront space value, this study uses global and local spatial autocorrelation analysis. The results of global spatial autocorrelation show that spatial value has positive spatial associations with all five principal components. As shown in Figure 9a–e, the Moran’s I values are 0.171, 0.224, 0.081, 0.250, and 0.120, respectively. Among them, functional experience has the highest Moran’s I value, indicating that its spatial association with spatial value is relatively more evident.
Local spatial autocorrelation further reveals the spatial differentiation and clustering patterns between the principal components and spatial value. As shown in the LISA cluster maps in Figure 9a–e, the study area mainly presents two types of clustering patterns: H–H and L–L. In terms of spatial distribution, H–H clusters are mainly concentrated in the eastern area, indicating that areas with high levels of street environment, facilities and services, spatial morphology, functional experience, and spatial attractiveness spatially overlap with high-value areas. L–L clusters are mainly distributed along Suzhou Creek in the western area. This area is mainly composed of large-scale industrial parks and universities, with fewer functions and facilities, as well as lower levels of internet popularity and satisfaction. L–H clusters are mainly concentrated in the eastern area, indicating that some areas with relatively high spatial value still show clear spatial heterogeneity. This is reflected in problems such as poor street environment quality, limited facility service provision, low functional experience, and insufficient spatial attractiveness. These areas therefore have considerable potential for optimization.

5. Discussion

5.1. Spatial Distribution of Spatial Value and Indicators

The value of Suzhou Creek waterfront spaces presents a pattern of “higher in the east and lower in the west”. The spatial value of the eastern area near the Suzhou Creek estuary is higher than that of the western area. This is consistent with the findings of Liu et al. [42] and Tu et al. [57]. Their studies on Shanghai indicated that the eastern section of Suzhou Creek is located in the city center, with a dense street network, a large concentration of cultural, commercial, and entertainment functions, and many historic character elements, which are closely associated with the higher spatial value of this area. However, while this concentration of space and functions attracts large numbers of people, it also generates higher spatial demand. Due to limited land resources, improving the spatial carrying capacity of the eastern area faces considerable challenges, which should be a key focus of future renewal in this area. In contrast, the western area has a generally better street spatial environment but lower spatial value. This is consistent with the conclusion of Freeman [58], who pointed out that larger block sizes reduce the continuity of the walking experience, meaning that the advantages of the physical environment may not be transformed into spatial attractiveness and experiential quality. This suggests that higher greening levels and wider road spaces do not necessarily translate into higher spatial value. This imbalance between the physical environment and spatial vitality indicates that it is necessary to enhance spatial vitality in the western area in the future, promote coordination between spatial vitality and physical environmental quality, and support the coordinated development of waterfront spaces along Suzhou Creek.

5.2. Factors Associated with Waterfront Space Value

To better understand the key factors associated with waterfront space value, PCA was used to reduce the dimensionality of the evaluation indicators, and five principal components were identified. Principal Component 1, street environment, reflects the basic conditions and operational support of waterfront streets. It represents the basic environmental conditions that support daily use and value realization in waterfront spaces. This is consistent with Ma [39] who emphasized the importance of physical space quality, indicating that the street spatial environment is the foundation for promoting public activities and enhancing urban vitality and attractiveness. Principal Component 2, facilities and services, reflects the service provision and carrying capacity of waterfront spaces for daily life. The level of facilities and services is closely related to the publicness and life-oriented character of waterfront spaces. This is consistent with Hu et al. [59], who found that adding supporting and service facilities can provide users with convenience and comfort. Principal Component 3, spatial morphology, reflects the spatial morphological characteristics of waterfront streets and people’s visual perception. There is a close association between environmental comfort, visual quality, and spatial value. This echoes the conclusion of Guan et al. [60] that streetscape visual features are closely related to residents’ quality of life and urban environmental quality. Principal Component 4, functional experience, emphasizes the vitality and subjective experience of waterfront spaces. By stimulating spatial vitality and strengthening emotional connections, waterfront spaces can shift from material carriers to public places with emotional meaning. Principal Component 5, spatial attractiveness, reflects the agglomeration effect and influence of waterfront spaces, emphasizing the role of spatial accessibility and internet popularity in the formation of spatial value. Future urban renewal should focus on these factors to enhance spatial value.
This study uses spatial autocorrelation analysis to reveal the spatial clustering characteristics between the value of Suzhou Creek waterfront spaces and related factors. The results of global spatial autocorrelation analysis show that street environment, facilities and services, spatial morphology, functional experience, and spatial attractiveness all show positive spatial associations with spatial value. Jin et al. [56] found that built-environment factors are related to the spatial distribution of urban vitality in their study on the spatial clustering of urban vitality. The results of this study echo this view, showing that high-value areas are usually concentrated in areas with better spatial environments, functional services, and popularity. The results of local spatial autocorrelation show significant differences between the eastern area and the central-western area of the study area. The eastern estuary area is mainly characterized by H–H clusters, indicating that these areas generally have high spatial value. Such high-value areas may influence surrounding spaces through the spillover of pedestrian flows, activities, and functions, thereby forming continuous waterfront zones with high spatial value. However, some L–H areas also exist in the eastern area. These areas are surrounded by spaces with high spatial value, but their own street environment, service facilities, or functional experience have not reached a high level. This reflects insufficient local supporting elements within a high-value context and should be regarded as a key focus for future spatial renewal. L–L clusters are mainly concentrated in the central-western area. Although the street environment is relatively good, insufficient facilities and services and weak spatial attractiveness are related to the lower spatial value of this area. This is consistent with Chen et al. [61], who argued that the ecological features and recreational functions of waterfront spaces need to be coordinated. Waterfront space value does not depend on a single environmental condition, but is closely related to the degree of matching among environmental quality, functional services, activity opportunities, and public perception. Therefore, it is necessary to optimize functional services in the western area in the future to achieve coordinated development between the eastern and western areas.

5.3. Waterfront Space Renewal Strategies Along Suzhou Creek

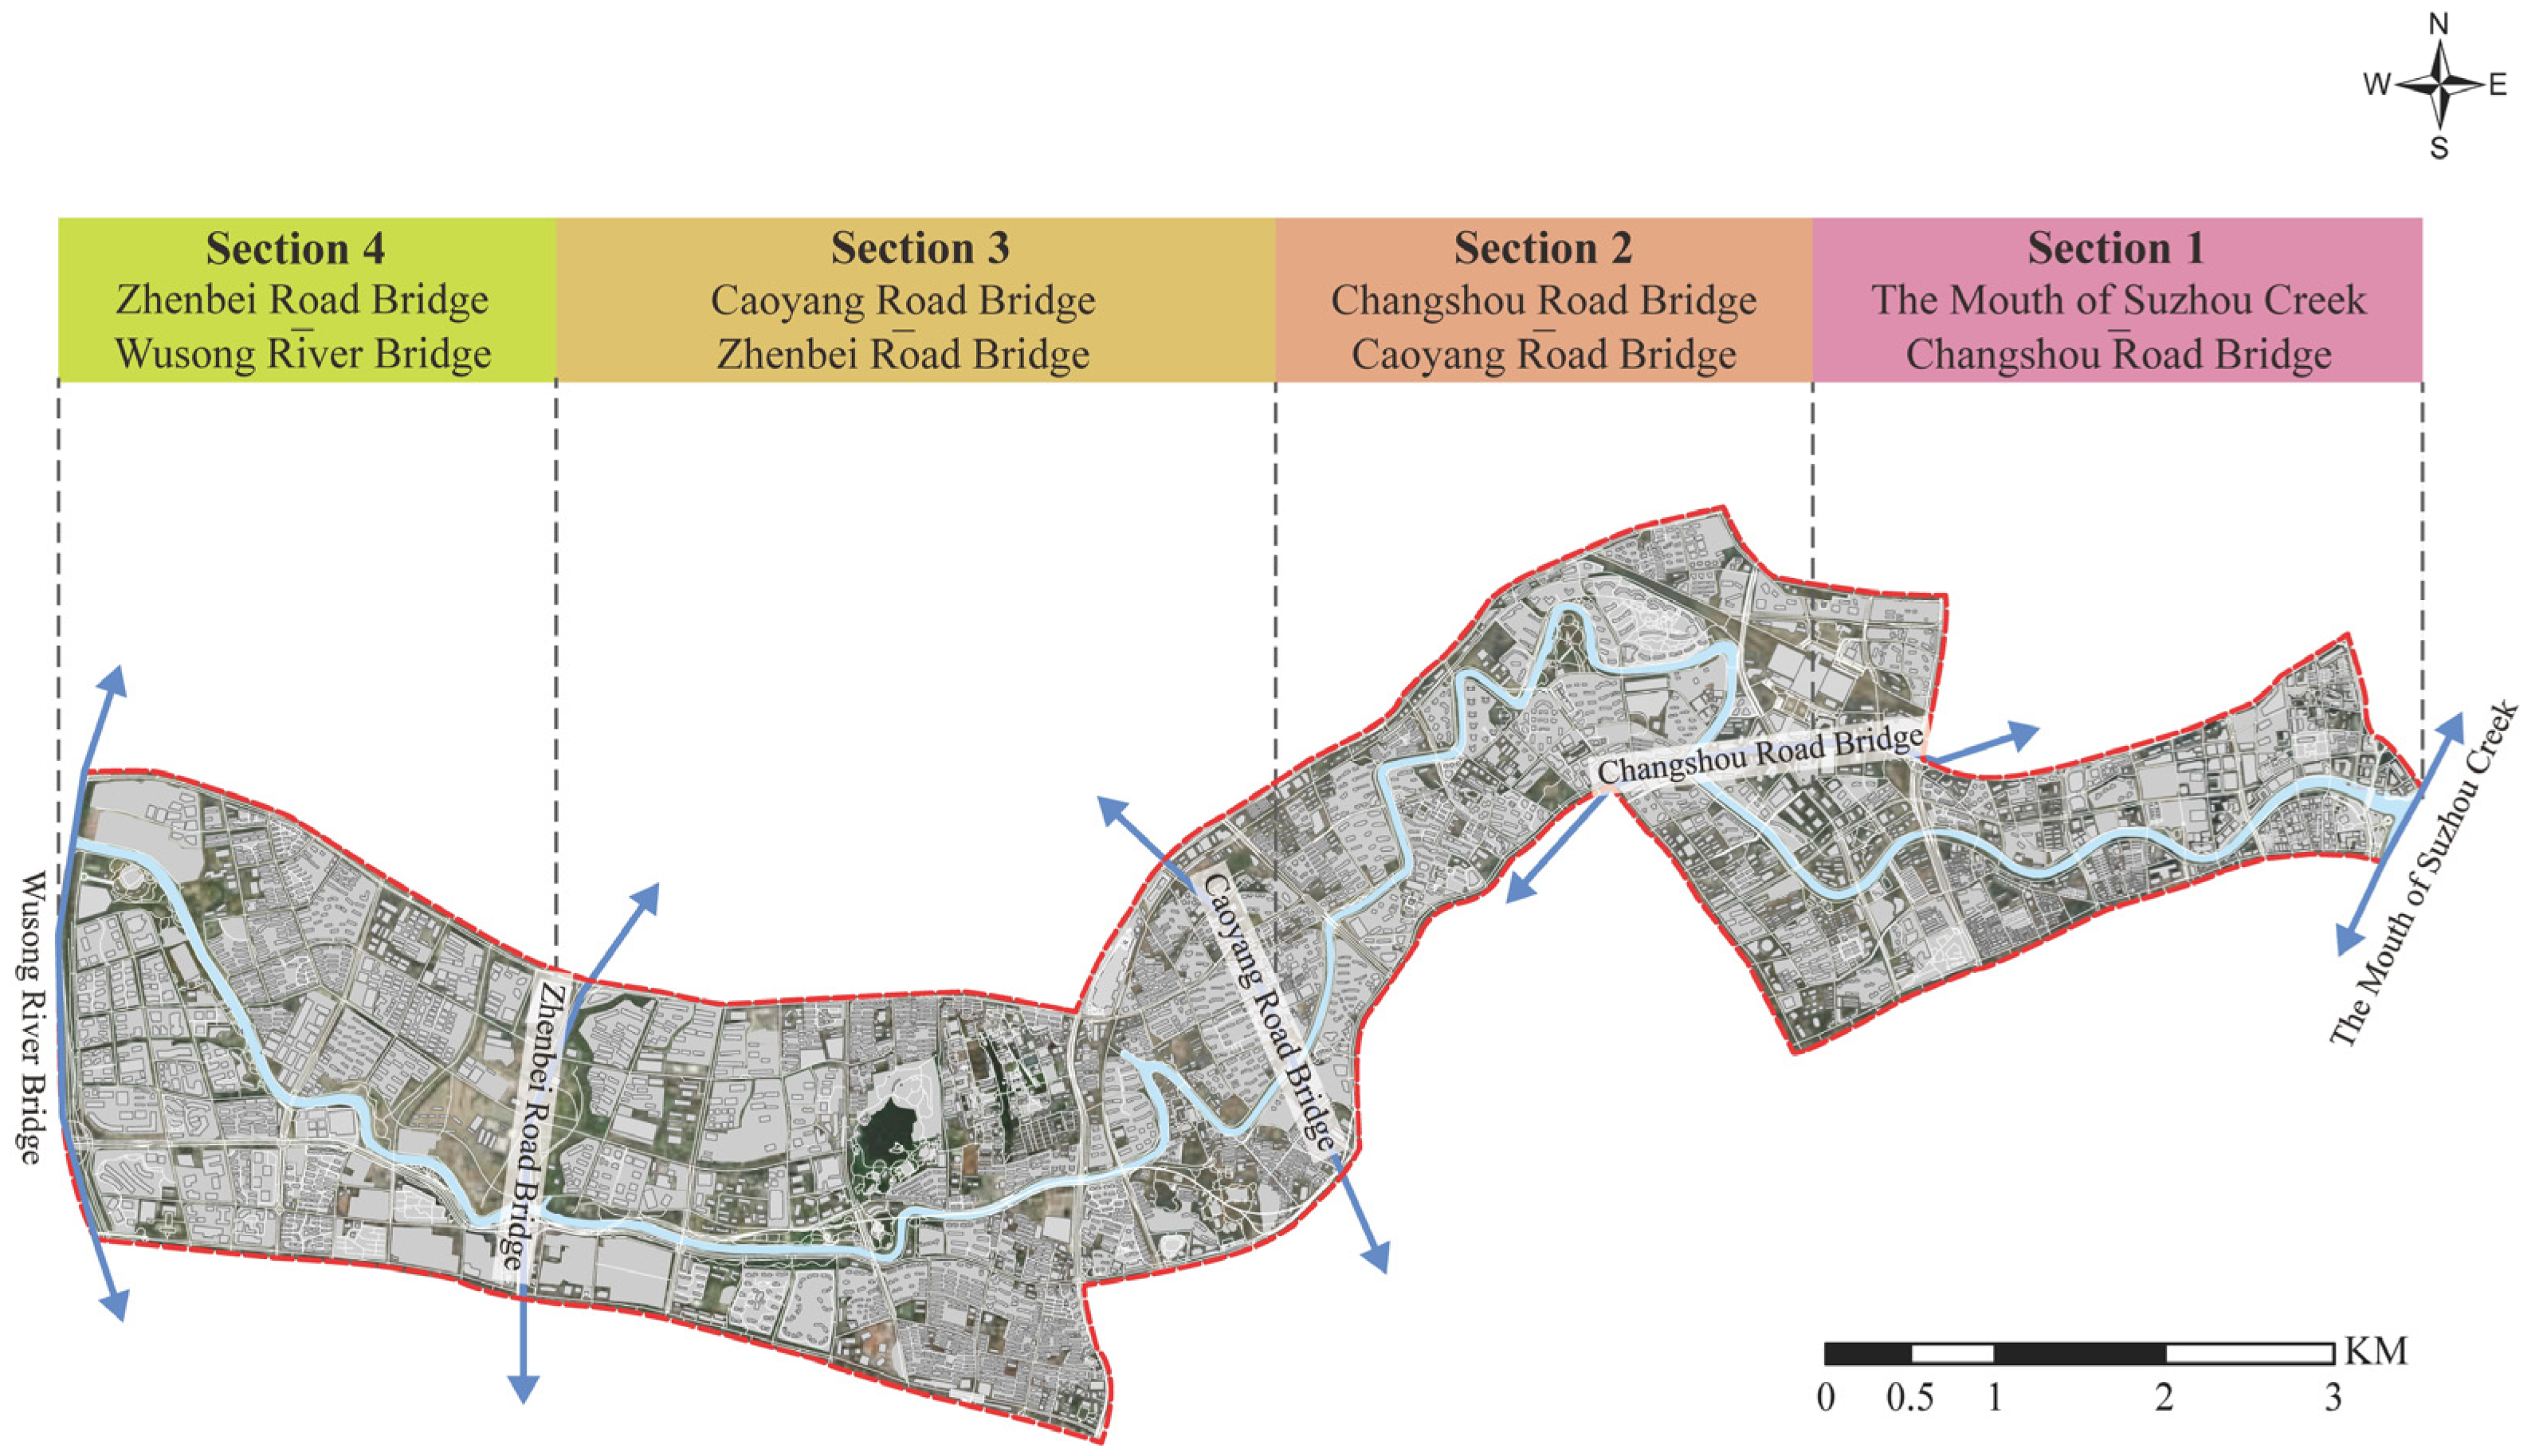
The waterfront spaces along Suzhou Creek have different resources and conditions. Based on spatial location, cultural resources, and spatial clustering patterns, this study divides the study area into four sections from east to west, as shown in Figure 10. Differentiated renewal strategies are then proposed based on the research findings, as shown in Table 5.

6. Conclusions

This study takes the Suzhou Creek waterfront space in Shanghai as a case study. Based on Maslow’s hierarchy of needs theory, waterfront space value is defined as the utility of space in terms of basic support, daily life, and well-being experience. An evaluation system including basic support value, livability value, and well-being value is then constructed. By integrating multi-source data such as street-view images, Weibo check-ins, POIs, and road networks, this study uses deep learning, NLP, Pearson correlation analysis, PCA, and spatial autocorrelation analysis to examine the value of Suzhou Creek waterfront spaces, its associated factors, and spatial association characteristics.
The main innovations of this study are as follows. First, a waterfront space value evaluation framework is constructed based on the hierarchy of needs theory, providing a foundation for the “precise optimization” of waterfront spaces. Second, multi-source data, including street-view images, social media data, POIs, and road networks, are integrated with NLP, deep learning, and other techniques to achieve a fine-scale measurement of waterfront space value. Third, renewal strategies for different sections are proposed based on spatial differentiation and clustering results, providing a methodological reference for the precise diagnosis and differentiated renewal of waterfront spaces in high-density cities.
However, this study still has certain limitations. The street-view data used in this study are static cross-sectional data, with a relatively narrow time span, and cannot reflect day–night, seasonal, or weather-related changes. Therefore, a long-term time-series analysis of spatial value in the study area could not be conducted. Future research can combine manually collected data at regular intervals to analyze changes in spatial value across different temporal scales. In addition, the Weibo check-in data used in this study have the advantages of broad coverage and the ability to capture online public perceptions, but they cannot fully reflect the complex experiences of different user groups. Future research can further incorporate data from different age groups and field surveys for cross-validation. Meanwhile, the renewal strategies proposed in this paper based on the evaluation results do not yet include external factors such as land prices and policies. Future research can further integrate land price data, policy investment, and data before and after the implementation of actual renewal projects to verify changes in waterfront space value and the effectiveness of renewal strategies. We believe that addressing these issues will further improve the accuracy and applicability of the research findings and provide stronger support for more scientific waterfront space renewal planning.

Author Contributions

Conceptualization, S.D. and S.Z.; methodology, S.D. and S.Z.; software, S.Z. and D.L.; formal analysis, S.Z.; investigation, S.Z.; resources, S.D.; data curation, S.Z.; writing—original draft preparation, S.Z.; writing—review and editing, S.D. and S.Z.; visualization, S.Z.; project administration, L.J.; funding acquisition, L.J. All authors have read and agreed to the published version of the manuscript.

Funding

This research was funded by the National Natural Science Foundation of China Young Scholars, grant number 52408080.

Data Availability Statement

The data presented in this study are available on request from the corresponding author.

Conflicts of Interest

The authors declare no conflicts of interest.

Abbreviations

The following abbreviations are used in this manuscript:
NLPNatural language processing
PCAPrincipal component analysis
POIPoint of interest
AHPAnalytic Hierarchy Process
EWMEntropy Weight Method
LISALocal indicators of spatial association
YOLOYou Only Look Once

References

  1. Brückner, A.; Falkenberg, T.; Heinzel, C.; Kistemann, T. The regeneration of urban blue spaces: A public health intervention? Reviewing the evidence. Front. Public Health 2022, 9, 782101. [Google Scholar] [CrossRef] [PubMed]
  2. Liu, S.; Lai, S.Q.; Liu, C.; Jiang, L. What influenced the vitality of the waterfront open space? A case study of Huangpu River in Shanghai, China. Cities 2021, 114, 103197. [Google Scholar] [CrossRef]
  3. Sun, P.; Zhao, H.; Zhong, J.; Cao, S.; Gao, M. Popularity influence mechanism of coastal spaces in urban areas: Insights from multi-modal large language models. Cities 2025, 161, 105909. [Google Scholar] [CrossRef]
  4. Poulsen, M.N.; Nordberg, C.M.; Fiedler, A.; DeWalle, J.; Mercer, D.; Schwartz, B.S. Factors associated with visiting freshwater blue space: The role of restoration and relations with mental health and well-being. Landsc. Urban Plan. 2022, 217, 104282. [Google Scholar] [CrossRef]
  5. Hagerman, C. Shaping neighborhoods and nature: Urban political ecologies of urban waterfront transformations in Portland, Oregon. Cities 2007, 24, 285–297. [Google Scholar] [CrossRef]
  6. Hoyle, B. Global and local change on the port-city waterfront. Geogr. Rev. 2000, 90, 395–417. [Google Scholar] [CrossRef]
  7. Hoyle, B. Urban waterfront revitalization in developing countries: The example of Zanzibar’s Stone Town. Geogr. J. 2002, 168, 141–162. [Google Scholar] [CrossRef]
  8. Hao, X.; Wei, W. The Application of GIS to Study Urban Waterfront District Planning—A Case Study of Landscape Planning in Guyang Lake. In Proceedings of the 2013 Fifth International Conference on Measuring Technology and Mechatronics Automation; IEEE: Piscataway, NJ, USA, 2013; pp. 1132–1134. [Google Scholar] [CrossRef]
  9. Vollmer, D. Urban waterfront rehabilitation: Can it contribute to environmental improvements in the developing world? Environ. Res. Lett. 2009, 4, 024003. [Google Scholar] [CrossRef]
  10. Wu, J.; Li, J.; Ma, Y. Exploring the relationship between potential and actual of urban waterfront spaces in Wuhan based on social networks. Sustainability 2019, 11, 3298. [Google Scholar] [CrossRef]
  11. Chen, L.; Liu, Y.; Leng, H.; Xu, S.; Wang, Y. Current and expected value assessment of the waterfront urban design: A case study of the comprehensive urban design of Beijing’s waterfront. Land 2022, 12, 85. [Google Scholar] [CrossRef]
  12. Wu, X.; Li, X. Multi-source data-driven quality assessment of waterfront public spaces in urban contexts. Land 2025, 14, 231. [Google Scholar] [CrossRef]
  13. Dahal, R.P.; Grala, R.K.; Gordon, J.S.; Munn, I.A.; Petrolia, D.R.; Cummings, J.R. A hedonic pricing method to estimate the value of waterfronts in the Gulf of Mexico. Urban For. Urban Green. 2019, 41, 185–194. [Google Scholar] [CrossRef]
  14. Dal Cin, F.; Fleischmann, M.; Romice, O.; Costa, J.P. Climate adaptation plans in the context of coastal settlements: The case of Portugal. Sustainability 2020, 12, 8559. [Google Scholar] [CrossRef]
  15. Lopez, I.P.; Carrasco, S.; Madrigal, C.M. Cartographic analysis as spatial determinant for climate change adaptation in the Hunter River Estuary, Australia. Cities 2024, 152, 105162. [Google Scholar] [CrossRef]
  16. Niu, Y.; Mi, X.; Wang, Z. Vitality evaluation of the waterfront space in the ancient city of Suzhou. Front. Archit. Res. 2021, 10, 729–740. [Google Scholar] [CrossRef]
  17. Hermida, M.A.; Cabrera-Jara, N.; Osorio, P.; Cabrera, S. Methodology for the assessment of connectivity and comfort of urban rivers. Cities 2019, 95, 102376. [Google Scholar] [CrossRef]
  18. Che, Y.; Yang, K.; Chen, T.; Xu, Q. Assessing a riverfront rehabilitation project using the comprehensive index of public accessibility. Ecol. Eng. 2012, 40, 80–87. [Google Scholar] [CrossRef]
  19. Nian, X.; Cao, Y.; Li, Y.; Zhang, Y.; Hong, B. Effects of environmental factors on multisensory perceptions of comfort, safety, and pleasure in autumnal urban riverfront spaces. Sustain. Cities Soc. 2025, 131, 106710. [Google Scholar] [CrossRef]
  20. Yuan, Z.; Luo, J.; Liu, Y.; Xu, L.; Chen, L.; Xu, W. Toward climate-adaptive waterfront walking spaces: Thresholds and cross-modal mechanisms of multi-sensory comfort. Urban For. Urban Green. 2026, 118, 129278. [Google Scholar] [CrossRef]
  21. Isa, M.I.; Hedayati Marzbali, M.; Saad, S.N. Mediating role of place identity in the relationship between place quality and user satisfaction in waterfronts: A case study of Penang, Malaysia. J. Place Manag. Dev. 2022, 15, 130–148. [Google Scholar] [CrossRef]
  22. Chen, Y.; Song, Y.; Li, C. Where do people tweet? The relationship of the built environment to tweeting in Chicago. Sustain. Cities Soc. 2020, 52, 101817. [Google Scholar] [CrossRef]
  23. Liang, H.; Zhang, Q. Do social media data indicate visits to tourist attractions? A case study of Shanghai, China. Open House Int. 2022, 47, 17–35. [Google Scholar] [CrossRef]
  24. Yang, L.; Wu, Q. How do residents perceive urban parks? A cross-geographic comparison based on online reviews. Front. Archit. Res. 2025, 14, 1217–1227. [Google Scholar] [CrossRef]
  25. He, X.; Zhou, Y.; Yuan, X.; Zhu, M. The coordination relationship between urban development and urban life satisfaction in Chinese cities—An empirical analysis based on multi-source data. Cities 2024, 150, 105016. [Google Scholar] [CrossRef]
  26. Wang, H.; Yu, Z.; Liu, X. Deciphering urban soundscapes: A study of sensory experiences at Hong Kong Victoria Harbour waterfronts using social media. Comput. Environ. Urban Syst. 2025, 120, 102307. [Google Scholar] [CrossRef]
  27. Sun, P.; Lu, W. Environmental inequity in hilly neighborhood using multi-source data from a health promotion view. Environ. Res. 2022, 204, 111983. [Google Scholar] [CrossRef] [PubMed]
  28. Wei, Z.; Cao, K.; Kwan, M.P.; Jiang, Y.; Feng, Q. Measuring the age-friendliness of streets’ walking environment using multi-source big data: A case study in Shanghai, China. Cities 2024, 148, 104829. [Google Scholar] [CrossRef]
  29. Zhao, Z.Q.; Zheng, P.; Xu, S.T.; Wu, X. Object detection with deep learning: A review. IEEE Trans. Neural Netw. Learn. Syst. 2019, 30, 3212–3232. [Google Scholar] [CrossRef] [PubMed]
  30. Nath, V.; Nathvani, R.; Bennett, J.E.; Clark, S.N.; Muller, E.; Hughes, A.; Nimo, J.; Bedford Moses, J.; Owusu, G.; Agyei-Mensah, S.; et al. Capturing urban activities and environment across time scales: Object detection and time-series analysis of 6.8 million images in Accra, Ghana. Cities 2026, 177, 107203. [Google Scholar] [CrossRef]
  31. Campbell, A.; Both, A.; Sun, Q.C. Detecting and mapping traffic signs from Google Street View images using deep learning and GIS. Comput. Environ. Urban Syst. 2019, 77, 101350. [Google Scholar] [CrossRef]
  32. Zhang, L.; Wang, L.; Wu, J.; Li, P.; Dong, J.; Wang, T. Decoding urban green spaces: Deep learning and Google Street View measure greening structures. Urban For. Urban Green. 2023, 87, 128028. [Google Scholar] [CrossRef]
  33. Xia, Y.; Yabuki, N.; Fukuda, T. Sky view factor estimation from street view images based on semantic segmentation. Urban Clim. 2021, 40, 100999. [Google Scholar] [CrossRef]
  34. Rita, L.; Nathvani, R.; Peliteiro, M.; Bostan, T.C.; Muller, E.; Suel, E.; Metzler, A.B.; Tamagusko, T.; Ferreira, A. Using deep learning and Google Street View imagery to assess and improve cyclist safety in London. Sustainability 2023, 15, 10270. [Google Scholar] [CrossRef]
  35. Colomés, D.; Valera, L. Examining the anthropological–philosophical implicit content in Carl Menger’s value theory through three philosophers. Philosophies 2025, 10, 109. [Google Scholar] [CrossRef]
  36. Alsayed, S.S. Urban human needs: Conceptual framework to promoting urban city fulfills human desires. Front. Sustain. Cities 2024, 6, 1395980. [Google Scholar] [CrossRef]
  37. Cardoso, R.; Sobhani, A.; Meijers, E. The cities we need: Towards an urbanism guided by human needs satisfaction. Urban Stud. 2022, 59, 2638–2659. [Google Scholar] [CrossRef]
  38. Chen, L.; Lu, Y.; Sheng, Q.; Ye, Y.; Wang, R.; Liu, Y. Estimating pedestrian volume using Street View images: A large-scale validation test. Comput. Environ. Urban Syst. 2020, 81, 101481. [Google Scholar] [CrossRef]
  39. Ma, Z. Deep exploration of street view features for identifying urban vitality: A case study of Qingdao city. Int. J. Appl. Earth Obs. Geoinf. 2023, 123, 103476. [Google Scholar] [CrossRef]
  40. Tao, Y.; Wang, Y.; Wang, X.; Tian, G.; Zhang, S. Measuring the correlation between human activity density and streetscape perceptions: An analysis based on Baidu street view images in Zhengzhou, China. Land 2022, 11, 400. [Google Scholar] [CrossRef]
  41. Lv, Y.; Yang, J.; Xu, J. High-dimensional urban dynamic patterns perception under the perspective of human activity semantics and spatiotemporal coupling. Sustain. Cities Soc. 2025, 121, 106192. [Google Scholar] [CrossRef]
  42. Liu, R.; Wang, L.; Ren, N.; Bao, B. Study on the quality evaluation of daily-living waterfront public space: A case study of Suzhou Creek in Shanghai. Shanghai Urban Plan. Rev. 2023, 3, 84–90. (In Chinese) [Google Scholar] [CrossRef]
  43. Long, Y.; Jiao, S.; Yu, Y.; Xiao, K. An analysis of spatial vitality distribution and formation mechanisms in historical urban areas based on multi-source big data: A case study of Changsha. Front. Archit. Res. 2025, 14, 1727–1749. [Google Scholar] [CrossRef]
  44. Zhang, K.; Wu, X.; Chen, C.; Ding, H. Research and practice of techniques for environmental health and safety assessment of children’s school trip space: A case study of Hangzhou City. Landsc. Archit. 2024, 31, 113–120. (In Chinese) [Google Scholar] [CrossRef]
  45. Chen, L.; Peng, P.; Zhu, E.; Wu, H.; Feng, D. Fairness of urban park layout from the perspective of multidimensional supply and demand relationship. Urban For. Urban Green. 2025, 113, 129016. [Google Scholar] [CrossRef]
  46. Nieuwenhuis, J.; van Ham, M.; Yu, R.; Branje, S.; Meeus, W.; Hooimeijer, P. Being poorer than the rest of the neighborhood: Relative deprivation and problem behavior of youth. J. Youth Adolesc. 2017, 46, 1891–1904. [Google Scholar] [CrossRef] [PubMed]
  47. Ge, Y.; Guo, Y.; Ma, Y.; Ma, S.; Liu, Y.; Qin, X. A study on the relationship between internet popularity and emotional perception of urban parks using Weibo data in Luoyang, China. Sci. Rep. 2025, 15, 9940. [Google Scholar] [CrossRef] [PubMed]
  48. Chen, L.C.; Papandreou, G.; Kokkinos, I.; Murphy, K.; Yuille, A.L. DeepLab: Semantic image segmentation with deep convolutional nets, atrous convolution, and fully connected CRFs. IEEE Trans. Pattern Anal. Mach. Intell. 2017, 40, 834–848. [Google Scholar] [CrossRef] [PubMed]
  49. Lai, S.; Deal, B. An innovative approach to urban parks and perception: A cross-cultural analysis using big and small data. Discov. Cities 2025, 2, 27. [Google Scholar] [CrossRef]
  50. Zhao, Z. Analysis on the “Douyin (TikTok) Mania” phenomenon based on recommendation algorithms. In E3S Web of Conferences; EDP Sciences: Les Ulis, France, 2021; Volume 235, p. 03029. [Google Scholar] [CrossRef]
  51. Li, L.; Liu, X.; Zhang, X. Public attention and sentiment of recycled water: Evidence from social media text mining in China. J. Clean. Prod. 2021, 303, 126814. [Google Scholar] [CrossRef]
  52. Ye, B.; Jia, S. Monitoring public sentiment and sensitivity to air pollution in China: A text mining approach on Sina Weibo. Humanit. Soc. Sci. Commun. 2025, 12, 549. [Google Scholar] [CrossRef]
  53. Shang, B.; Chen, X.; Bao, Y. Integrating MaxEnt and circuit theory to construct an ecological network framework for invasive plant management in urban ecosystems. J. Environ. Manag. 2026, 404, 129544. [Google Scholar] [CrossRef] [PubMed]
  54. Demšar, U.; Harris, P.; Brunsdon, C.; Fotheringham, A.S.; McLoone, S. Principal component analysis on spatial data: An overview. Ann. Assoc. Am. Geogr. 2013, 103, 106–128. [Google Scholar] [CrossRef]
  55. Fan, Y.; Wei, G. Assessment of ecological resilience and its response mechanism to land spatial structure conflicts in China’s Southeast Coastal Areas. Ecol. Indic. 2025, 170, 112980. [Google Scholar] [CrossRef]
  56. Jin, A.; Ge, Y.; Zhang, S. Spatial characteristics of multidimensional urban vitality and its impact mechanisms by the built environment. Land 2024, 13, 991. [Google Scholar] [CrossRef]
  57. Tu, Y.; Wu, Y.; Zheng, X.; Tao, S. Unraveling threshold effects and hierarchical mechanisms of spatial mismatch between urban environment and subjective well-being in megacities. Landsc. Urban Plan. 2026, 271, 105639. [Google Scholar] [CrossRef]
  58. Freeman, L. The effects of sprawl on neighborhood social ties: An explanatory analysis. J. Am. Plan. Assoc. 2001, 67, 69–77. [Google Scholar] [CrossRef]
  59. Hu, X.; Cao, K.; Kwan, M.P. Effects of seasonal environment changes on greenway use intensity: Evidence from the Huangpu River waterfront greenway in Shanghai, China. Urban For. Urban Green. 2026, 117, 129245. [Google Scholar] [CrossRef]
  60. Guan, H.; Zhang, W.; Huang, B.; Xu, Y.; Hong, W. How urban street-scape visual features influence carbon emissions from residents visiting urban parks: A case study of Shenzhen, China. Landsc. Urban Plan. 2026, 266, 105531. [Google Scholar] [CrossRef]
  61. Chen, L.; Ma, Y. How do ecological and recreational features of waterfront space affect its vitality? Developing coupling co-ordination and enhancing waterfront vitality. Int. J. Environ. Res. Public Health 2023, 20, 1196. [Google Scholar] [CrossRef]
Figure 1. Study area.
Land 15 01277 g001
Figure 2. Conceptual framework.
Land 15 01277 g002
Figure 3. Research workflow. * p < 0.05 and ** p < 0.01.
Land 15 01277 g003
Figure 4. Extracting street elements via DeepLab v3 and YOLO v11.
Land 15 01277 g004
Figure 5. Spatial distribution of waterfront space value indicators.
Land 15 01277 g005
Figure 6. Comprehensive value of waterfront space.
Land 15 01277 g006
Figure 7. Pearson correlation matrix among the evaluation indicators. Note: * p < 0.05 and ** p < 0.01 .
Land 15 01277 g007
Figure 8. Spatial distribution of principal components and composite scores.
Land 15 01277 g008
Figure 9. Moran scatter plot and LISA cluster map.
Land 15 01277 g009
Figure 10. Sections of waterfront space along Suzhou Creek.
Land 15 01277 g010
Table 1. Waterfront space value assessment indicator system.
Value
Dimensions
Hierarchy
of Needs
IndicatorsCalculation
Method
ωiνiQi
Basic Support Value (A1)Physiological
and Safety Needs
(B1)
Sky Visibility Index (C1)Ssky/Stotal0.0390.0660.046
Green Visibility Index (C2)Svegetation/Stotal0.0460.1780.123
Road Width (C3)Sroad/Stotal0.0280.0460.032
Street Width-to-Height Ratio (C4)(2×Sroad)/Sbuilt0.0420.0730.051
Sanitation Facility (C5)Npublic toilets0.2080.0350.150
Infrastructure (C6)Ntraffic light+sign+streetlight+electronic monitoring0.0490.0700.050
Livability Value (A2)Love and
Belonging Needs
(B2)
Functional Density (C7)NPOI/Area0.0620.0920.065
Functional Diversity (C8) H = i = 1 n p i l n p i 0.0480.1150.078
Public Transportation Convenience (C9)Nbus stop+subway station0.1360.0940.097
Road Network Density (C10)Total Length of Roads/Area0.0430.0660.047
Well-being Value (A3)Esteem and
Self-Actualization Needs
(B3)
Internet Popularity (C11)Check-in frequency + Number of reposts + Number of comments + Number of likes0.2360.0350.172
Satisfaction (C12)NLP (positive prob)0.0630.1300.089
Table 2. KMO and Bartlett’s test.
KMO measure of sampling adequacy0.636
Bartlett’s test of sphericityApprox. Chi-square1847.784
Degrees of freedom66
Significance0.000
Table 3. Principal component variance and cumulative contribution rate.
Principal ComponentInitial EigenvaluesSum of Squared LoadingsRotated Sum of Squared Loadings
TotalVariance PercentageCumulative PercentageTotalVariance PercentageCumulative PercentageTotalVariance PercentageCumulative Percentage
12.48420.70420.7042.48420.70420.7041.98216.52016.520
22.16518.04138.7442.16518.04138.7441.90715.89432.414
31.34111.17749.9211.34111.17749.9211.73714.47146.885
41.1189.31459.2351.1189.31459.2351.36911.40958.294
51.0268.55367.7881.0268.55367.7881.1399.49567.788
60.9007.50375.291
70.6925.76981.060
80.5824.85485.914
90.5184.32090.233
100.4854.04594.278
110.4293.57897.856
120.2572.144100.000
Table 4. Rotated component matrix.
IndexPrincipal
Component 1
Principal
Component 2
Principal
Component 3
Principal
Component 4
Principal
Component 5
C10.812−0.0580.184−0.161−0.019
C2−0.020−0.0420.8750.117−0.052
C30.6710.1100.4990.227−0.014
C40.212−0.0240.791−0.1660.045
C5−0.0360.8340.011−0.1570.130
C60.7720.057−0.0630.275−0.047
C70.0310.776−0.0520.312−0.013
C80.1180.2150.0640.7820.002
C90.0570.733−0.0130.166−0.016
C100.4370.042−0.144−0.3050.539
C11−0.1390.0410.0900.1050.748
C120.0190.047−0.1530.5570.515
Table 5. Section-specific renewal strategies.
SectionEvaluation ResultPriority Renewal DirectionRenewal Strategies
Mouth of Suzhou Creek–Changshou Road Bridge SectionH–H clusters are concentrated, but hinterland space is constrained, and some basic services need to be supplemented.Maintain existing advantages, and improve infrastructure and pedestrian organization.① Improve basic facilities such as wayfinding, lighting, seating, and sanitation facilities.
② Optimize waterfront pedestrian organization and enhance spatial carrying capacity under high-intensity use.
Changshou Road Bridge–Caoyang Road SectionSpatial clustering is not significant; industrial heritage resources are scattered, and spatial attractiveness is insufficient.Connect cultural resources, and enhance continuous experience and spatial attractiveness.① Connect industrial heritage sites, waterfront walkways, and public open spaces to form a continuous cultural experience path.
② Organize thematic events such as exhibitions, waterfront markets, and art activities to build a continuous waterfront cultural experience route.
Caoyang Road Bridge–Zhenbei Road Bridge SectionL–L and H–L clusters are relatively common; open spaces such as parks have a good foundation, but functions are simple, and service facilities and cross-river connections are insufficient.Supplement service facilities, and strengthen functional mix and slow-mobility connections.① Enrich functional services and supporting facilities.
② Improve walking and cycling systems and cross-river connections, and enhance the continuity of waterfront spaces.
Zhenbei Road Bridge–Wusongjiang Bridge SectionL–L clusters are concentrated; the street environment is relatively good, but there are many waterfront discontinuities and gray spaces.Connect waterfront discontinuities, and activate gray spaces.① Connect discontinuous waterfront walkways, and add bridges, piers, or pedestrian and cycling connections.
② Renovate under-bridge spaces and introduce functions such as sports fields and parks.
③ Supplement lighting, safety, and landscape facilities to improve conditions for daily use.
Disclaimer/Publisher’s Note: The statements, opinions and data contained in all publications are solely those of the individual author(s) and contributor(s) and not of MDPI and/or the editor(s). MDPI and/or the editor(s) disclaim responsibility for any injury to people or property resulting from any ideas, methods, instructions or products referred to in the content.