Article

Developing a Morphology–Structure–Function Coupled Framework to Delineate Critical Stages in Vegetation Restoration Trajectories of Opencast Mine Dump

1
School of Public Administration, Zhejiang University of Finance & Economics, Hangzhou 310018, China
2
College of Forestry, Northeast Forestry University, Harbin 150040, China
3
School of Land Science and Technology, China University of Geosciences Beijing, Beijing 100083, China
4
Key Laboratory of Land Consolidation and Rehabilitation, Ministry of Natural Resources, Beijing 100035, China
5
School of Economics and Management, China University of Geosciences Beijing, 29 Xueyuanlu, Haidian District, Beijing 100083, China
*
Author to whom correspondence should be addressed.
Current affiliation: Observation and Research Station of Land Reclamation in Loess Plateau Mining Area, Ministry of Natural Resources, Beijing 100083, China.
Land 2026, 15(7), 1236; https://doi.org/10.3390/land15071236
Submission received: 12 May 2026 / Revised: 2 July 2026 / Accepted: 7 July 2026 / Published: 9 July 2026

Abstract

The reconstruction of vegetation in opencast mining areas constitutes an intricate process of ecological restoration within human-altered systems. A systematic characterization of the multi-dimensional synergistic successional pathways—encompassing morphology, structure, and function—and the corresponding delineation of key recovery phases holds significant potential to inform and refine land reclamation strategies. This study took the southern dump of the Antaibao Coal Mine within the Pingshuo mining area on the Loess Plateau as the study area. Using the Google Earth Engine (GEE) platform, time series Landsat remote sensing images from 1990 to 2023 were processed to derive three indicators representing vegetation coverage morphology, landscape pattern structure, and ecosystem service function: Vegetation Fractional Coverage (VFC), Mining Landscape Restoration Index (MLRI), and Remote Sensing Ecological Index (RSEI). A Reconstructed vegetation Restoration Comprehensive Index (RRCI) was established through the multi-dimensional collaborative analysis of morphology–structure–function. Based on the long-term evolutionary sequence of RRCI, the S-logistic growth curve model was employed for nonlinear fitting, and critical restoration stages of reconstructed vegetation were quantitatively delineated using preset threshold rules. The results demonstrate that time series RRCI data of the screened sample plots effectively characterize the spatiotemporal restoration dynamics of reconstructed vegetation, with a high model goodness of fit (R2 > 0.7). In accordance with the criteria for delineating critical stages of reconstructed vegetation restoration, the average durations of the accelerated development period, consolidation development period, and overall recovery development period of reconstructed vegetation in the study area are 5.09 years, 4.64 years, and 9.73 years, respectively. Significant differences exist in the accelerated development period and overall recovery development period between arbor forest lands and arbor shrub forest lands (p < 0.05), and the time required for vegetation restoration at each stage is longer in arbor forest lands than in arbor shrub forest lands. This study constructs a multi-dimensionally collaborative RRCI and quantifies critical stages of reconstructed vegetation evolution, which is of great significance for promoting the sustainable evolution and dynamic management of reconstructed vegetation in opencast mining areas.

1. Introduction

Opencast mining, as a primary mode of mineral resource exploitation, guarantees the global supply of energy and mineral resources while inducing severe land degradation issues such as surface vegetation stripping, soil structure destruction, and sharp declines in ecosystem service functions [1,2,3]. These problems restrict the effective supply of ecosystem services in mining areas and hinder the progress of green mine construction and the achievement of the United Nations Sustainable Development Goals [4,5]. Implementing vegetation reconstruction has been internationally recognized as a core pathway for regional ecological restoration and sustainable land management [6,7,8]. Precisely identifying the long-term evolutionary trajectories of reconstructed vegetation is not only a critical basis for evaluating the effectiveness of reclamation projects but also a scientific prerequisite for optimizing post-management strategies and realizing positive succession of damaged ecosystems. Against the global backdrop of addressing climate change and advancing the goal of land degradation neutrality, in-depth analysis of the spatiotemporal dynamic laws of vegetation restoration in mining areas carries prominent practical implications.
Ecological restoration involves a continual interplay between anthropogenic disturbance and natural response [4]. Constrained by the combined effects of pronounced habitat heterogeneity, frequent anthropogenic disturbances, and prolonged natural recovery periods in mining areas, the successional trajectory of reconstructed vegetation in opencast mines exhibits highly nonlinear and stage-specific characteristics [9]. The evolutionary process of reconstructed vegetation exhibits highly nonlinear and phased characteristics. Current ecological management practices in mining areas mostly rely on empirical judgment or short-term static assessment, lacking quantitative identification of critical turning points in the restoration process, which affects the timely implementation of artificial guidance measures [10]. This extensive management model readily leads to mismatched water and fertilizer resources, delayed or excessive intervention, which not only reduces the utilization efficiency of reclamation funds but may also hinder the ecosystem from transitioning to a steady-state threshold, creating a practical dilemma restricting sustainable land use in mining areas.
In recent years, time series remote sensing analysis has been widely applied in ecological monitoring of mining areas [11]. Existing studies predominantly rely on vegetation coverage or vegetation indices to track greenness changes [10], introduce landscape pattern indices to portray the restoration status of spatial patterns, or adopt comprehensive indices such as the Remote Sensing Ecological Index (RSEI) to evaluate habitat quality [12]. Nevertheless, a thorough review of the extant research identifies two tiers of critical knowledge gaps that demand immediate attention. On the one hand, at the level of indicator dimensions, the prevailing body of work tends to rely on unidimensional proxies to characterize vegetation recovery. Although these metrics serve as useful indicators of specific trait variations in reconstructed vegetation, they are inherently inadequate for representing the structural complexity and functional diversity inherent in vegetation systems. As a result, scholarly understanding of the successional mechanisms governing reconstructed vegetation has remained largely tethered to cursory assessments of “greenness fluctuations,” lacking the diagnostic depth required to evaluate restoration efficacy and systemic resilience [12]. On the other hand, in terms of evolutionary trajectory simulation, some studies have attempted to predict vegetation dynamic laws using linear trend analysis, breakpoint detection, or Markov models [9,13]. However, a comprehensive review of current research progress reveals significant limitations. Firstly, trajectory modeling and stage delineation methods lag behind. Most studies rely on static cross-sectional assessment or linear fitting [14], ignoring the nonlinear growth law of vegetation restoration driven by soil maturation, community succession, and climate fluctuation [8]. Critical stage delineation mostly relies on expert experience or fixed time windows, lacking objective quantitative criteria based on ecological dynamic inflection points and threshold mechanisms [15]. Secondly, long-term dynamic diagnosis and heterogeneity analysis are insufficient. Most existing studies focus on short-term responses of 5–10 years after reclamation, lacking systematic depiction of full-cycle trajectories spanning decades from rapid succession to steady-state thresholds, and rarely quantitatively reveal the differentiation rules of stage duration and succession rates under different reconstruction modes. The limitations of existing studies easily lead to the practical dilemma of emphasizing initial governance while neglecting long-term management in mining ecological management, urgently requiring the construction of a multi-dimensionally collaborative and quantitatively diagnostic analytical framework to break through bottlenecks [16].
Overall, systematically exploring the complex internal mechanisms of reconstructed vegetation evolution in opencast mining areas has become an urgent need to break through current ecological bottlenecks in mining areas. Leveraging the advantage of possessing over 30 years of historical data from the southern dump of the Antaibao Coal Mine within the Pingshuo mining area on the Loess Plateau, this study aims to achieve two core objectives: (1) Construct a Reconstruction vegetation Restoration Comprehensive Index (RRCI) that integrates the synergistic dimensions of morphology, structure, and function, with the aim of systematically portraying the successional trajectory of reconstructed vegetation within open-pit mine settings. Furthermore, this index holds potential as a transferable methodological framework for vegetation recovery studies conducted in contexts of other human-induced disturbances. (2) Introduce the S-shaped growth curve model to fit the evolutionary trajectory of reconstructed vegetation, quantitatively identify three critical stages (accelerated development period, consolidation development period, and recovery development period) of reconstructed vegetation, and reveal evolutionary characteristics of vegetation under different configuration modes in stages. This study intends to provide a scientific basis for zoned and classified precise management, optimization of reclamation technologies, and long-term sustainable land management in mining areas.

2. Materials and Methods

2.1. Study Area

The Pingshuo mining area is located in Shuozhou City, Shanxi Province, China, at the transition zone between the Loess Plateau and the Inner Mongolia Plateau, spanning Pinglu District and Shuocheng District (Figure 1). The mine is approximately 21 km long from north to south and 22 km wide from east to west, with a total area of about 380 km2 and a geological reserve of about 12.75 billion tons. The Pingshuo mining area is a typical large-scale opencast coal mining region in China, comprising three major coal mines: Antaibao, Anjialing, and East Open-pit Mine. The mine features a temperate continental climate, characterized by cold and dry winters, hot and dry summers, relatively low annual precipitation (approximately 430 mm) concentrated in summer, a high evaporation–precipitation ratio, and loose soil parent material with weak erosion resistance. Surface stripping, habitat fragmentation, and soil erosion induced by opencast mining are highly representative in northern China’s energy bases, providing a highly typical natural background and socio-economic context for research on land degradation and ecological restoration in mining areas [17].
The Antaibao opencast coal mine, a core component of the Pingshuo mining area, is situated in the central part of the mine and is one of the largest opencast coal mines in China [18]. The southern dump, a vital part of the Antaibao opencast coal mine, commenced waste disposal in 1988, completed external dumping in 1993, and launched vegetation reconstruction in 1994, covering a total area of 1.6 km2. Land reclamation has been continuously implemented in this mine for over 30 years since 1988. After years of ecological restoration, a vegetation community with considerable coverage and diversity has been formed. At present, the main vegetation species in the southern dump include elm, Caragana korshinskii, Chinese pine, and black locust, with a vegetation coverage rate of approximately 80%. The reclamation process has systematically iterated from early topographic reshaping and surface coverage reconstruction (morphology dimension), to mid-stage optimization of community spatial pattern and species configuration (structure dimension) and later-stage improvement of soil and water conservation, microclimate regulation, and carbon sequestration capacity (function dimension), which highly conforms to the verification requirements of the “morphology–structure–function” multi-dimensional collaborative analysis framework, providing an irreplaceable data foundation for accurately identifying critical stages of reconstructed vegetation evolution.

2.2. Data Sources

To deeply explore the long-term evolutionary characteristics of reconstructed vegetation in the study area, this study utilized the Google Earth Engine (GEE) cloud platform [19,20] and took Landsat series remote sensing images (Landsat 5, Landsat 7, and Landsat 8) with a temporal resolution of 16 days and spatial resolution of 30 m as data sources. Key remote sensing indices covering the entire Pingshuo opencast coal mine from 1990 to 2023 were systematically calculated and obtained, including Normalized Difference Vegetation Index (NDVI), Enhanced Vegetation Index (EVI), Normalized Difference Built-up and Bareness Index (NDBSI), Land Surface Temperature (LST), and Wetness Component Index (WET).
To ensure the acquired data accurately represent the restoration characteristics of reconstructed vegetation in a given year, all available remote sensing images from June to October of each year during the study period were selected for calculation. This period covers the critical growth stage of vegetation and can effectively reflect the interannual variation and restoration status of reconstructed vegetation [21]. The median value of all images from June to October was used to reassign values to each pixel, generating annual remote sensing data from 1990 to 2023, effectively avoiding interference from partial data anomalies. During data processing, special attention was paid to the calculation of the Wetness Component Index (WET). Due to inconsistent coefficients used for WET calculation between Landsat 5 and Landsat 7, adjustment of index inversion coefficients before and after 2013 was a critical step to ensure data continuity and accuracy.
In addition, some image data may have missing values due to cloud cover and other factors. To fill these missing pixels, the nearest value of the pixel in the preceding and succeeding five months was obtained through a sliding window and assigned to fill the gaps. This method reduces the impact of external factors such as cloud cover and signal disturbance on data integrity to a certain extent, ensuring the continuity and availability of data.

2.3. Three-Dimensional Data Processing of Reconstructed Vegetation: Morphology–Structure–Function

This study mainly adopted time series remote sensing data, supplemented by existing survey data in the mining area (mining area basic database data and permanent fixed monitoring sample plot data). Time series remote sensing data include three-dimensional data of reconstructed vegetation: morphology, structure, and function. Relying on the three-dimensional quantitative analysis framework, this study comprehensively explored the evolutionary characteristics of the whole life cycle process of reconstructed vegetation in opencast mining areas. Specifically, time series VFC data were used to characterize the morphological characteristics of reconstructed vegetation, time series MLRI data to characterize the structural characteristics, and time series RSEI data to characterize the functional characteristics. Existing survey data mainly include reshaped topographic features and reconstructed vegetation configuration modes, providing basic data for analyzing the evolutionary laws of reconstructed vegetation under different reclamation modes.
Based on the GEE cloud platform, time series VFC data were inverted on the basis of calculated NDVI data to reveal the spatial differentiation law of vegetation coverage in the mining area from the perspective of vegetation morphology. Time series MLRI data of the mining area were inverted by fusing EVI and LST time series data to characterize the structural evolutionary characteristics of reconstructed vegetation restoration in the mining area from the perspective of vegetation structure. Time series NDVI, NDBSI, LST, and WET data were calculated and used to invert RSEI time series data, evaluating the performance of vegetation in ecosystem services in opencast mining areas from the perspective of vegetation function, thereby characterizing the functional restoration characteristics of mining area vegetation. Furthermore, the three-dimensional data of “morphology–structure–function” were integrated to innovatively construct the RRCI for opencast mining areas, quantifying and integrating key elements of each dimension to provide a comprehensive description of the evolutionary process of reconstructed vegetation.

2.3.1. Time Series VFC Data Processing

With the aid of the GEE cloud platform, all Landsat series remote sensing images covering the study area with cloud cover less than 10% from 1990 to 2023 were obtained, and NDVI data of the study area were inverted through band calculation [22,23]. The median value of all images from June to October (the critical growing season of vegetation) each year during the study period was used to reassign values to each pixel, effectively eliminating outliers and noise interference and accurately restoring the typical characteristics of vegetation growth. Finally, a 34-scene time series NDVI dataset from 1990 to 2023 was constructed.
On this basis, the pixel-based dual component model was used to calculate 34 scenes of time series VFC data of the mining area from 1990 to 2023. This model is based on a core assumption: in a single pixel of a remote sensing image, its NDVI is only composed of green vegetation information and bare soil information, which jointly determine the spectral response of the pixel. Based on this assumption, a simplified linear mixed model can be constructed to quantitatively estimate vegetation coverage through NDVI values [24,25]. The specific calculation formula is as follows:
f c = ( N D V I N D V I s o i l ) ( N D V I v e g N D V I s o i l )
where f c represents the vegetation coverage of the pixel, ranging from 0 to 1; N D V I s o i l represents the NDVI value of bare soil areas; and N D V I v e g represents the NDVI value of pure vegetation areas.
Given that the present study aims to trace the long-term restoration trajectory of revegetated areas, as opposed to capturing seasonal or interannual phenological variability, fixed thresholds offer a more consistent benchmark for meaningful comparisons across years. Therefore, this study selected the NDVI value with a cumulative frequency of 0.5% within the mining area as N D V I s o i l and the NDVI value with a cumulative frequency of 99.5% as N D V I v e g . The GEE cloud platform was used to calculate the N D V I s o i l and N D V I v e g values of each scene image in the study area, and the 34-year average values were taken as the N D V I s o i l and N D V I v e g values in this study, respectively.

2.3.2. Time Series MLRI Data Processing

MLRI data is a restoration index for reconstructed vegetation constructed based on Landsat images and more suitable for mining area scales, improved on the basis of the MODIS Global Disturbance Index (MGDI) and vegetation disturbance index [16,26]. MLRI is positively proportional to vegetation indices and inversely proportional to surface temperature, indicating that a higher MLRI value corresponds to better land reclamation and restoration effects in mining areas. Time series data of this index can effectively reveal extensive details of the dynamic changes in reconstructed vegetation, providing a basis for solving the problem of emphasizing state over process in the evaluation of reconstructed vegetation restoration in mining areas.
All Landsat series remote sensing images covering the study area with cloud cover less than 10% from 1990 to 2023 were adopted, and the GEE cloud platform was used to invert time series MLRI data of the study area. The specific MLRI inversion formula and process refer to the achievements of Professor Xie’s team [16]. The calculation formula is as follows:
M L R I i j = L S T j m a x / E V I j m i n L S T i j / E V I i j
where L S T j m a x is the maximum surface temperature of pixel j from the commencement of reclamation measures to the target monitoring year; E V I j m i n is the minimum EVI value of pixel j from the commencement of reclamation measures to the research time point. L S T i j is the surface temperature of pixel j in the target monitoring year i; E V I i j is the Enhanced Vegetation Index of pixel j in the target monitoring year i.
To improve the accuracy and reliability of MLRI data in the study area, median filtering technology was used to process each scene of MLRI data. Specifically, multi-scene MLRI image data during the vegetation growing season (June to October each year) were merged into one scene per year through median filtering, finally generating 34 scenes of annual MLRI data, effectively reducing the intra-annual image data errors caused by natural factors such as cloud cover and rainfall, and ensuring the stability and consistency of time series remote sensing data.

2.3.3. Time Series RSEI Data Processing

The RSEI is a comprehensive ecological evaluation index based on remote sensing technology, which can quickly and quantitatively characterize the functional restoration characteristics of vegetation in opencast mining areas. By integrating four key ecological factors including vegetation greenness, surface wetness, dryness, and heat, this index can effectively quantify the changes in regional ecological environment quality and functions [27,28,29]. Vegetation greenness (NDVI) reflects vegetation coverage and growth status; an increase in NDVI indicates improved vegetation coverage and restored ecosystem productivity functions. Surface wetness (WET) reflects soil moisture conditions; an increase in the WET index indicates enhanced regional soil water-holding capacity. Dryness (NDBSI) reflects surface bare degree; a decrease in NDBSI indicates reduced surface bare area and enhanced vegetation functions. Heat (LST) reflects surface temperature and vegetation transpiration capacity; a decrease in LST index indicates improved vegetation transpiration capacity. The comprehensive analysis of the four factors can fully reflect the restoration of vegetation functions in mining areas. In this study, an annual time-step approach was adopted, wherein the annual composite images for each year (NDVI, NDBSI, LST, and WET) were independently subjected to PCA-based integration. The weights were determined by the contribution of each factor to the first principal component, thereby circumventing the influence of subjective human bias and enhancing the objectivity and generalizability of the model.
The RSEI is a dimensionless index ranging from 0 to 1. A value closer to 1 indicates better ecosystem function in the region, while a value closer to 0 indicates poorer ecosystem function. Spatiotemporal variation analysis of the RSEI in the study area can effectively reveal the restoration of vegetation functions in mining areas, providing a scientific basis for ecological restoration and management in opencast mining areas.

2.3.4. Data Filtering Processing Based on BISE-WT

On the basis of calculating the annual time series data of VFC, MLRI, and RSEI across the study area from 1990 to 2023, the Best Index Slope Extraction and Wavelet Transform (BISE-WT) filtering method was further adopted to denoise the time series data. The BISE-WT filter integrates the advantages of the Best Index Slope Extraction (BISE) algorithm and Wavelet Transform (WT), which can effectively eliminate disturbances induced by interannual climatic fluctuations and remote sensing imaging noises, while retaining authentic signals in the data to the maximum extent. This provides more reliable data support for subsequent ecological analysis and land reclamation research [13].
The BISE algorithm is a classic method for removing obvious noise in time series data, first proposed by Viovy et al. in 1992 [30]. This method identifies and eliminates abrupt outliers in the time series by setting a threshold, thereby reducing noise interference. Nevertheless, BISE may also affect real signals in the data while removing noise. In contrast, WT is an automatic one-dimensional wavelet denoising method that decomposes the time series into components of different frequencies and filters out high-frequency noise to smooth the data. The advantage of WT is that it can better retain key features and periodic variation information in the data. Given the respective strengths of BISE and WT, the BISE-WT filter has been proposed in previous studies to combine the two methods for processing time series data [31]. The BISE-WT filtering procedure consists of two main steps: first, obvious noise is removed using BISE; then, WT is adopted to further optimize the denoising performance on this basis. The combined approach not only effectively removes noise in the annual time series data but also preserves real information in the data to the greatest extent, providing more reliable data support for subsequent ecological analysis and land reclamation research.
Prior to the analysis of interannual time series data, the BISE algorithm was employed to eliminate pronounced noise components, so as to enhance the temporal continuity of the resulting data series. Prior to the analysis of interannual time series data, the BISE algorithm was utilized to eliminate pronounced noise components, with the aim of enhancing temporal data continuity. Accordingly, a moving-window approach was adopted in the present study to perform noise reduction on the time series. Taking a sliding window of length 3 as an example, the calculation formulas are as follows [31]:
D i 1 , i = T i 1 T i T i 1
D i + 1 , i = T i + 1 T i T i + 1
If both D i 1 , i and D i + 1 , i are greater than the set threshold, T i is reassigned as:
T i = T i 1 T i + 1 2
The following constraint must also be satisfied:
T i + 1 T i T i 1 T i 0.4
where i denotes the number of sliding window movements, T i 1 denotes the first value in the sliding window of the time series variable T, T i denotes the second value, T i + 1 denotes the third value, D i 1 , i denotes the reduction rate from the first value to the second value in the sliding window, and D i + 1 , i denotes the reduction rate from the third value to the second value. Different from the sole use of the BISE method, Equation (3) is used to reassign the value of T only when Equations (4)–(6) are satisfied simultaneously.
Second, the WT re-filtering is performed on the annual time series of T. The wden function in MATLAB 2017a (MathWorks, Natick, MA, USA) is used to conduct the WT re-filtering for the annual time series data of T.
In the denoising process of the annual time series data, after the sliding window denoising, the WT (Wavelet Transform) is further used for re-filtering. In practice, the wden function performs wavelet decomposition on the signal and conducts threshold processing on the wavelet coefficients according to the set threshold rule, so as to achieve denoising. The parameter settings are as follows [31]:
T = w d e n T ,   T P T R ,   S O R H ,   S C A L ,   N ,   w n a m e
where T denotes the filtered time series data, T denotes the original data, TPTR denotes the threshold type, SORH denotes soft or hard thresholding, SCAL denotes the multiplicative threshold scaling factor, N denotes the decomposition level, and w n a m e denotes the mother wavelet type. In this study, the parameters are set as follows: TPTR is set to ‘minimax’ (minimax threshold); SORH is set to ‘s’ (soft threshold); SCAL is set to ‘mln’ (estimation related to level-dependent noise); the decomposition level N is set to 2; and w n a m e is set to ‘db7’.

2.4. Construction of the RRCI Under the Integrated Perspective of Morphology–Structure–Function Dimensions

This study constructed a mining area vegetation restoration evaluation model integrating multi-dimensional characteristics and full-cycle perspective. By integrating the massive data processing advantages of the GEE cloud platform and based on the “morphology–structure–function” three-dimensional collaborative evolution theoretical framework, an opencast mining area vegetation restoration evaluation system including three major system layers was established. Specifically, the morphological dimension adopted an improved mixed pixel decomposition model to invert VFC, the structural dimension constructed the MLRI to quantify land reclamation patterns, and the functional dimension innovatively introduced the RSEI to characterize the evolution of ecosystem service value.
(1)
Determination of indicator weights for each dimension
This study adopted the Delphi method and the Analytic Hierarchy Process (AHP) to determine the weights of each correction factor coefficient. By comprehensively considering the weights of all indicators, this approach integrates multi-dimensional data into a unified evaluation framework, thereby enabling a holistic assessment of the dynamic process of vegetation restoration [32,33]. Through three rounds of expert consultation (4 experts in open-pit mine land reclamation, 3 experts in vegetation restoration, and 3 experts in forestry; n = 10), a judgment matrix was established to rank the importance of VFC, MLRI, and RSEI. The ranking results are presented in Table 1.
Based on the qualitative ranking results presented in Table 1, this study employed the ratio assignment method to construct the judgment matrix. This approach directly uses the ratios of the importance scores assigned to each indicator as the matrix elements, based on the experts’ qualitative ranking of relative indicator importance. This method not only preserves the original ranking information from the expert opinions but also yields a judgment matrix that satisfies perfect consistency, thereby avoiding logical contradictions that may arise from intransitive pairwise comparison scales. The resulting judgment matrix N is presented as follows:
N = 1 4 5 4 3 5 4 1 5 3 3 4 3 5 1
Each row of the matrix consists of elements that are proportional to one another, satisfying the condition a i j = a i k · a k j , which indicates that the matrix exhibits perfect consistency. Consequently, its maximum eigenvalue λ m a x = 3 . Based on this, the consistency index (CI) and the consistency ratio (CR) were calculated as follows:
C I = λ m a x n n 1 = 3 3 3 1 = 0
C R = C I R I = 0 0.52 = 0
Specifically, n = 3 is the matrix order, and RI = 0.52 is the average random consistency index (obtained from standard reference tables). The calculated CR = 0 < 0.1, indicating that the matrix fully satisfies the consistency requirement, demonstrating a high degree of logical coherence in the expert judgments and confirming the credibility of the weighting results.
Calculated using the geometric mean method (root method) and the normalized column average method (sum method), the resulting eigenvector, after normalization, is shown as W:
W = M V F C , M M L R I , M R S E I T = 0.3333 0.4167 0.25
(2)
Construction of the RRCI
The final RRCI is obtained by calculating the weighted sum of the indicator weights across all dimensions. The RRCI calculation model is as follows:
R R C I = 0.333   F V C + 0.4167   M L R I + 0.25   R S E I

2.5. Rationale for Delineating Critical Stages in Reconstructed Vegetation Trajectories

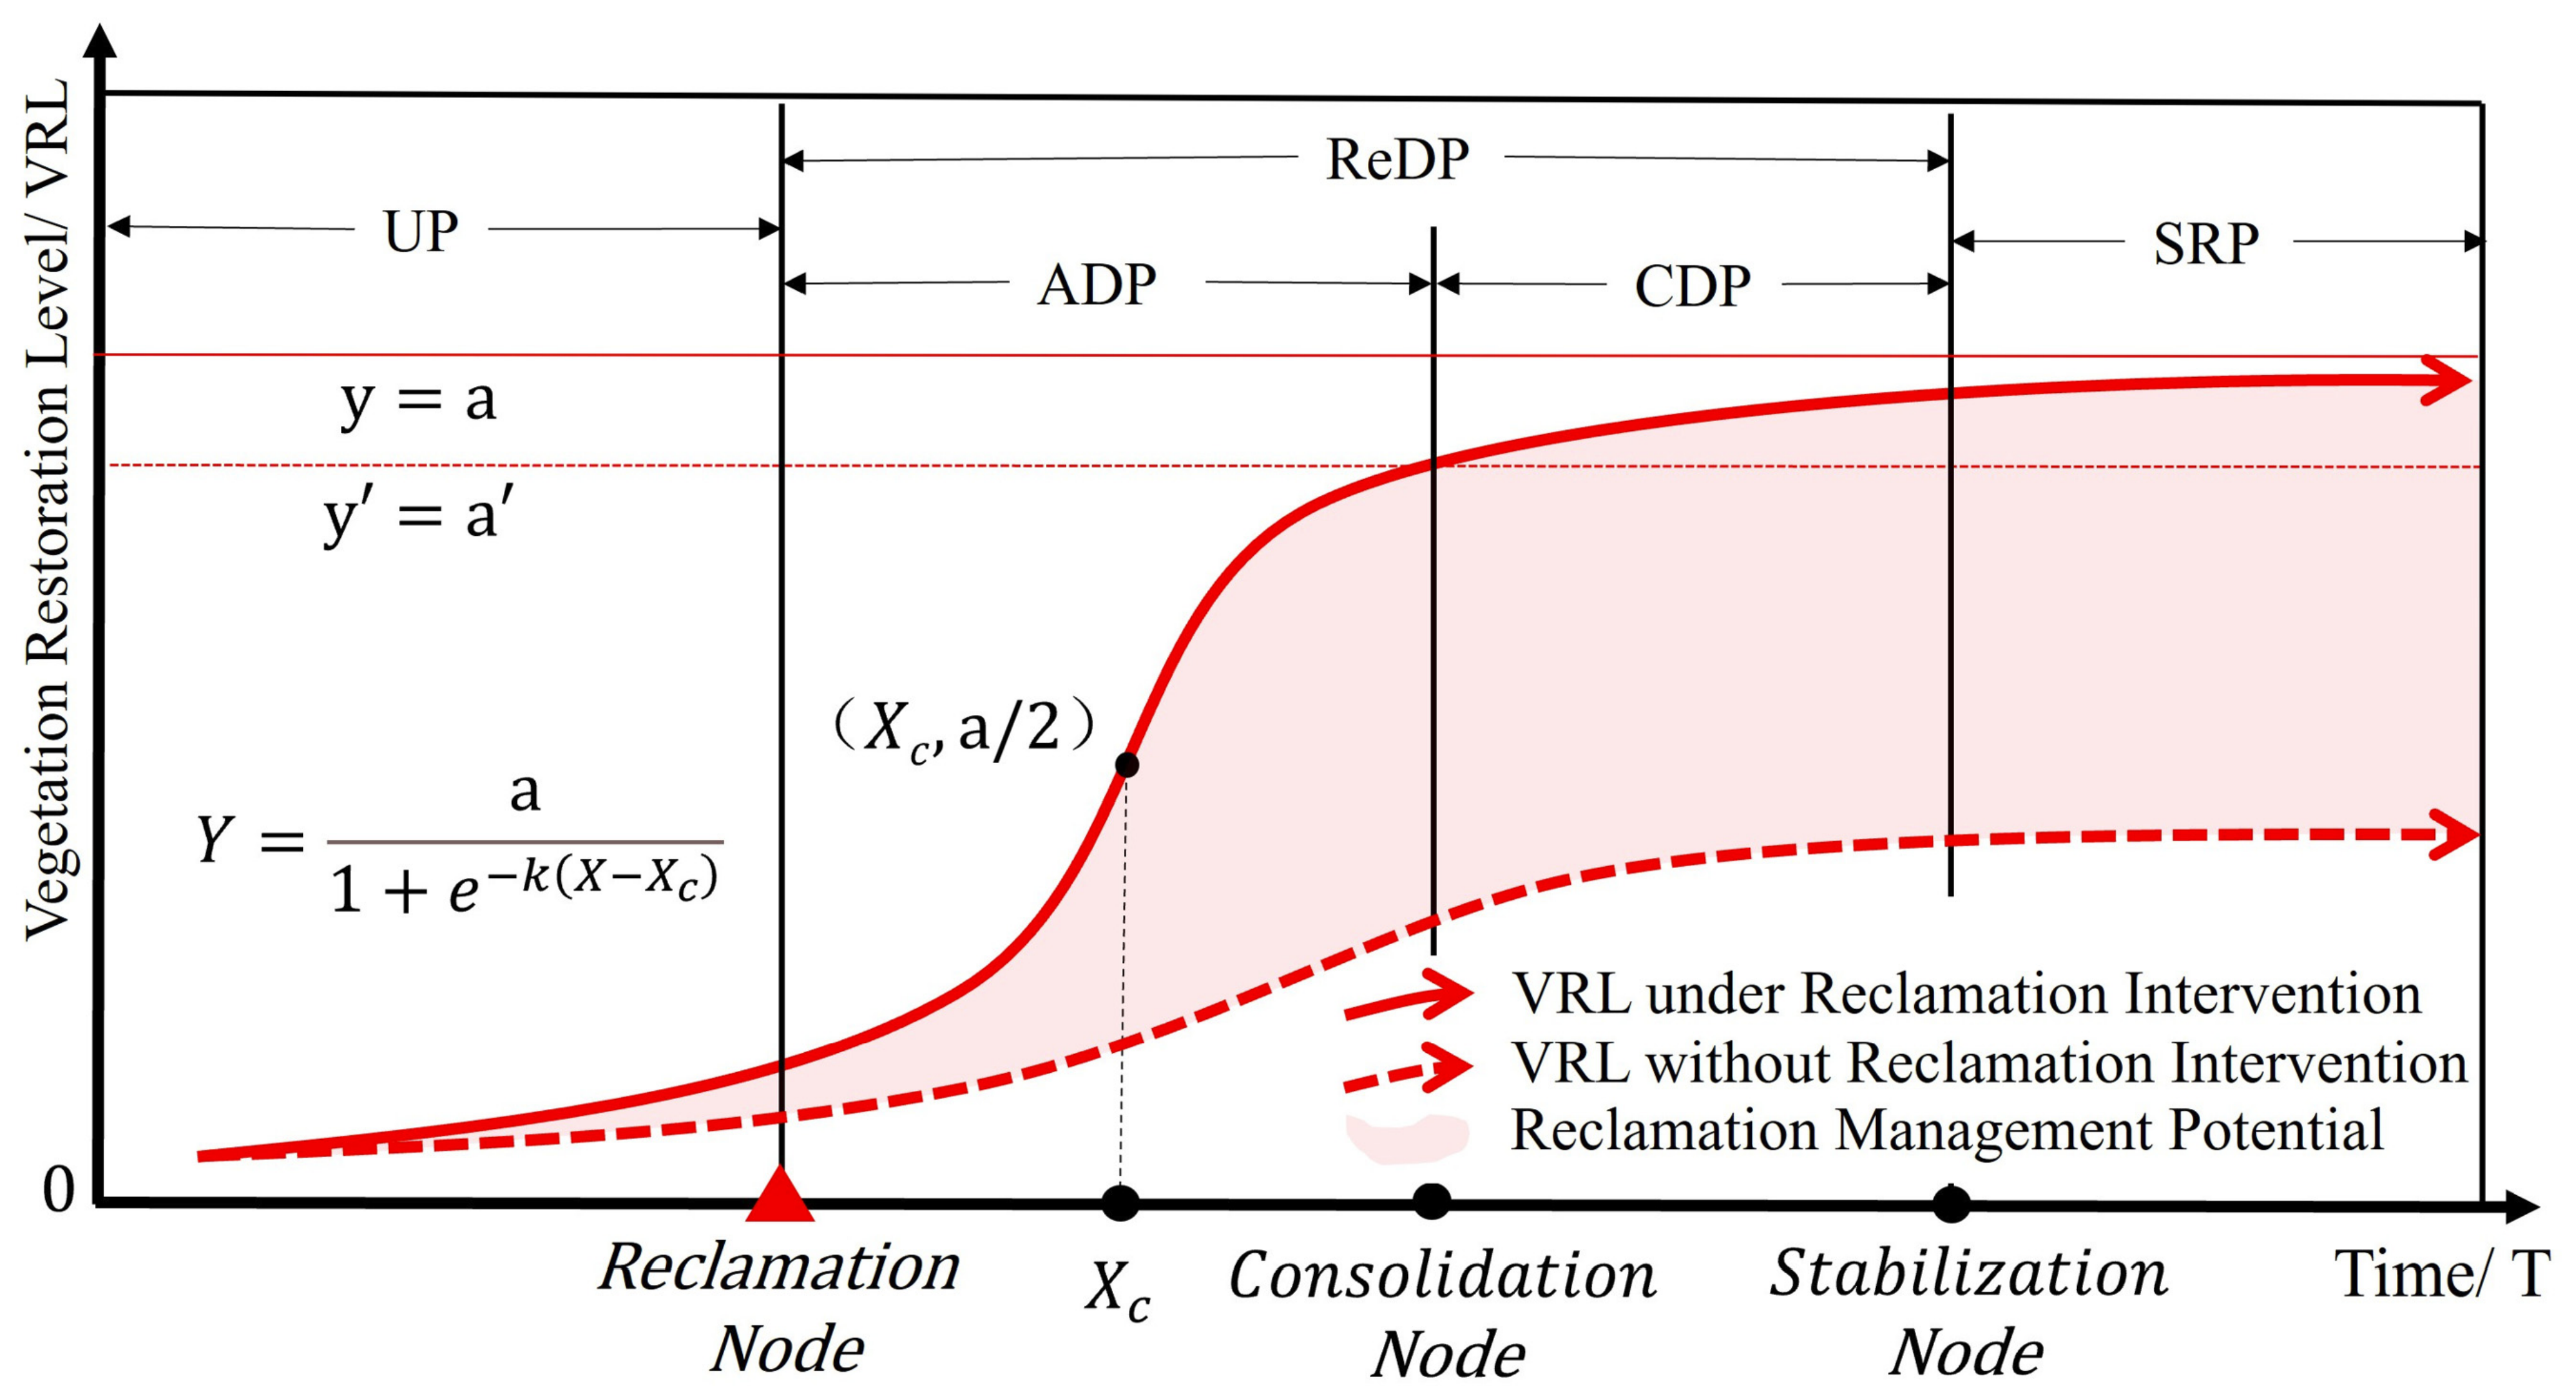
The successional trajectory of vegetation restoration is theoretically expected to conform to a typical S-shaped growth pattern. This tendency is especially pronounced in contexts involving anthropogenic interventions such as land reclamation, where proactive management practices are capable of significantly expediting the pace of vegetation recovery, thus bringing the actual succession into closer correspondence with the canonical S-curve form. This curve reveals the phased law of vegetation restoration: in the initial stage, due to harsh soil conditions, insufficient vegetation growth substrates, and stress from the surrounding ecological environment, vegetation restoration is relatively slow with low species richness and vegetation coverage. With the implementation of reclamation measures, reconstructed vegetation gradually adapts to the mining area environment, growth accelerates, and species richness and vegetation coverage increase significantly, entering a rapid growth stage. When the vegetation community structure tends to stabilize and reaches a certain balance with the surrounding ecological environment, the growth rate of reconstructed vegetation slows down gradually and finally tends to be stable, forming a relatively stable vegetation ecosystem [34,35]. Grounded in the foregoing theoretical framework, this study took relatively homogeneous reconstructed vegetation plots in typical reclamation dumps as research units, adopted the S-logistic function fitting method to calculate the time series evolutionary characteristics of the average RRCI value of each vegetation unit, and defined the identification rules for different stages to delineate the critical stages of reconstructed vegetation evolution: unreclaimed period, recovery development period (including accelerated development period and consolidation development period), and stable restoration period (Figure 2).
(1)
S-logistic Function Fitting Analysis
The S-logistic function curve is S-shaped, showing a flexible change in the dependent variable as the independent variable progresses smoothly. Many processes conform to the S-shaped exponential function change characteristics: starting with slow development in the preparation stage, accelerating rapidly when adapting to new conditions, and then gradually developing gently to a relatively stable state under various constraints. The fact that the reconstructed vegetation restoration process conforms to exponential function characteristics has been widely recognized by scholars [36,37,38]. In addition, on the basis of a series of experiments in the team’s previous research, it has been confirmed that the S-shaped exponential function has the best fitting effect on the time series data of reconstructed vegetation in typical reclamation dumps. Therefore, this study adopted the S-logistic function to reflect the evolutionary process of the RRCI. The specific calculation process is as follows:
Y = a 1 + e k ( X X c )
where Y represents the average RRCI value of a plot unit, X represents the land reclamation year, a represents the asymptotic value of the RRCI after stabilization, X c represents the year with the fastest RRCI restoration, and k represents the restoration speed of the RRCI. R2 is the goodness-of-fit coefficient of the function; a larger value indicates a better fitting effect of the function.
(2)
Screening Criterion Design for Research Units
Ensuring that selected research units can fully reflect the vegetation restoration process is crucial in land reclamation and vegetation restoration research. To accurately screen typical and representative research units, clear and strict screening criteria were formulated based on function fitting results. Through S-logistic function fitting analysis of vegetation restoration dynamics of each sample plot unit, three key screening criteria were set:
  • Exclude sample plot units with low goodness of fit. Only sample plot units with a goodness of fit (R2 coefficient) greater than 0.7 were retained; the R2 coefficient is an important indicator to measure the goodness of model fitting to data, and a higher R2 value indicates that the model can better explain the dynamic changes in vegetation restoration. Excluding sample plot units with R2 coefficient less than 0.7 ensures high data fitting accuracy of vegetation restoration processes in selected units, providing a reliable data basis for subsequent analysis.
  • Exclude sample plot units with excessively low vegetation restoration rates. In the vegetation restoration process, the restoration rate (k value) is a key parameter for measuring vegetation restoration efficiency. Sample plot units with ineffective vegetation restoration after reclamation (i.e., k ≤ 0.2) were excluded. This criterion is set based on an in-depth understanding of vegetation restoration dynamics; only when the vegetation restoration rate reaches a certain level can the vegetation restoration of the sample plot unit be considered effective. This screening excludes sample plot units where vegetation restoration stagnates due to harsh soil conditions, environmental stress, or other adverse factors, ensuring the ecological significance of vegetation restoration processes in research units.
  • Exclude sample plot units that have not reached the stability stage. The ultimate goal of vegetation restoration is to reach a relatively stable state, marking the improvement and perfection of ecosystem functions. The criterion of excluding sample plot units that have not reached the stability stage within the study period is mainly based on consideration of the long-term dynamics of vegetation restoration, ensuring that selected units can fully reflect the entire process from initial restoration to stability. This screening effectively excludes sample plot units that cannot fully display the full picture of vegetation restoration due to an overly short research period, improving the scientificity and representativeness of research results.
(3)
Definition of Critical Node Years for Reconstructed Vegetation Evolution Trajectories
  • Accelerated development node. In the vegetation restoration process, the accelerated development node ( X c ) represents the year when vegetation restoration reaches the maximum rate. Through S-logistic function fitting of time series RRCI data of vegetation restoration, the year corresponding to parameter X c was determined as the accelerated development year of vegetation restoration. X c is the inflection point of the S-logistic function, marking the transition of vegetation restoration from the initial stage to the rapid restoration stage. It should be noted that during RRCI calculation, raw data such as EVI and LST were filtered to reduce data noise and outliers. However, this processing may result in the rapid restoration period ( X c ) of some sample plots occurring in the year before or the same year as reclamation. Given that land reclamation and vegetation reconstruction of the southern dump were completed in 1994, sample plots with X c ≤ 1994 were excluded to ensure the explanatory significance of the fitting function for RRCI time series data.
  • Consolidation development node. To scientifically identify the consolidation development year of vegetation restoration, a quantitative method based on fitting parameters was adopted. First, the fitting parameter a value of each sample plot unit was calculated, representing the maximum value of the evolutionary trend of the RRCI fitting function and reflecting the final stable state of vegetation restoration. Subsequently, the year X’ when the RRCI reached 90% of the a value was determined and defined as the consolidation development node [39]. This time node marks the transition of vegetation restoration from the rapid growth stage to the slow development stage, a turning point where ecosystem functions gradually tend to stabilize.
  • Stable development node. To ensure the stability of vegetation restoration, a five-year consecutive observation period was introduced in this study. Starting from the consolidation development node, if the RRCI exceeds 90% of the a value in four of the five consecutive years, the fifth year is identified as the stable development node of reconstructed vegetation; if fewer than four years have an RRCI exceeding 90% of the a value, the observation continues backward until at least four years in the five consecutive observation years meet the requirement, and the fifth year of the observation period is identified as the stable development node. This rule not only ensures the sustainability and stability of vegetation restoration but also provides clear time nodes for long-term monitoring and management of ecological restoration.
(4)
Definition of Critical Stages for Reconstructed Vegetation Evolution Trajectories
Based on the above definition rules, each evolutionary stage of reconstructed vegetation restoration in opencast mining areas was clearly divided:
  • Accelerated development period: The land reclamation period from the land reclamation time node of the dump to the consolidation development time point. This stage is the initial restoration period of reconstructed vegetation under land reclamation guidance, with rapid increase in vegetation coverage and gradual restoration of ecosystem functions.
  • Consolidation development period: The land reclamation period from the consolidation development time point to the stable development time point. This stage is the transition period of reconstructed vegetation restoration, with gradually stable vegetation coverage and perfected ecosystem functions.
  • Recovery development period: The sum of the accelerated development period and the consolidation development period constitute the recovery development period of reconstructed vegetation. During this stage, vegetation remains in a continuous rapid growth state, which represents the most critical phase in the entire vegetation restoration process.
  • Stable restoration period: Land reclamation years after the stable development node belong to the stable development period. This stage is the mature period of reconstructed vegetation restoration, with high vegetation coverage and stable and mature ecosystem functions.

3. Results

3.1. Difference Analysis of Reconstructed Vegetation Evolution Trends Under Different Dimensions

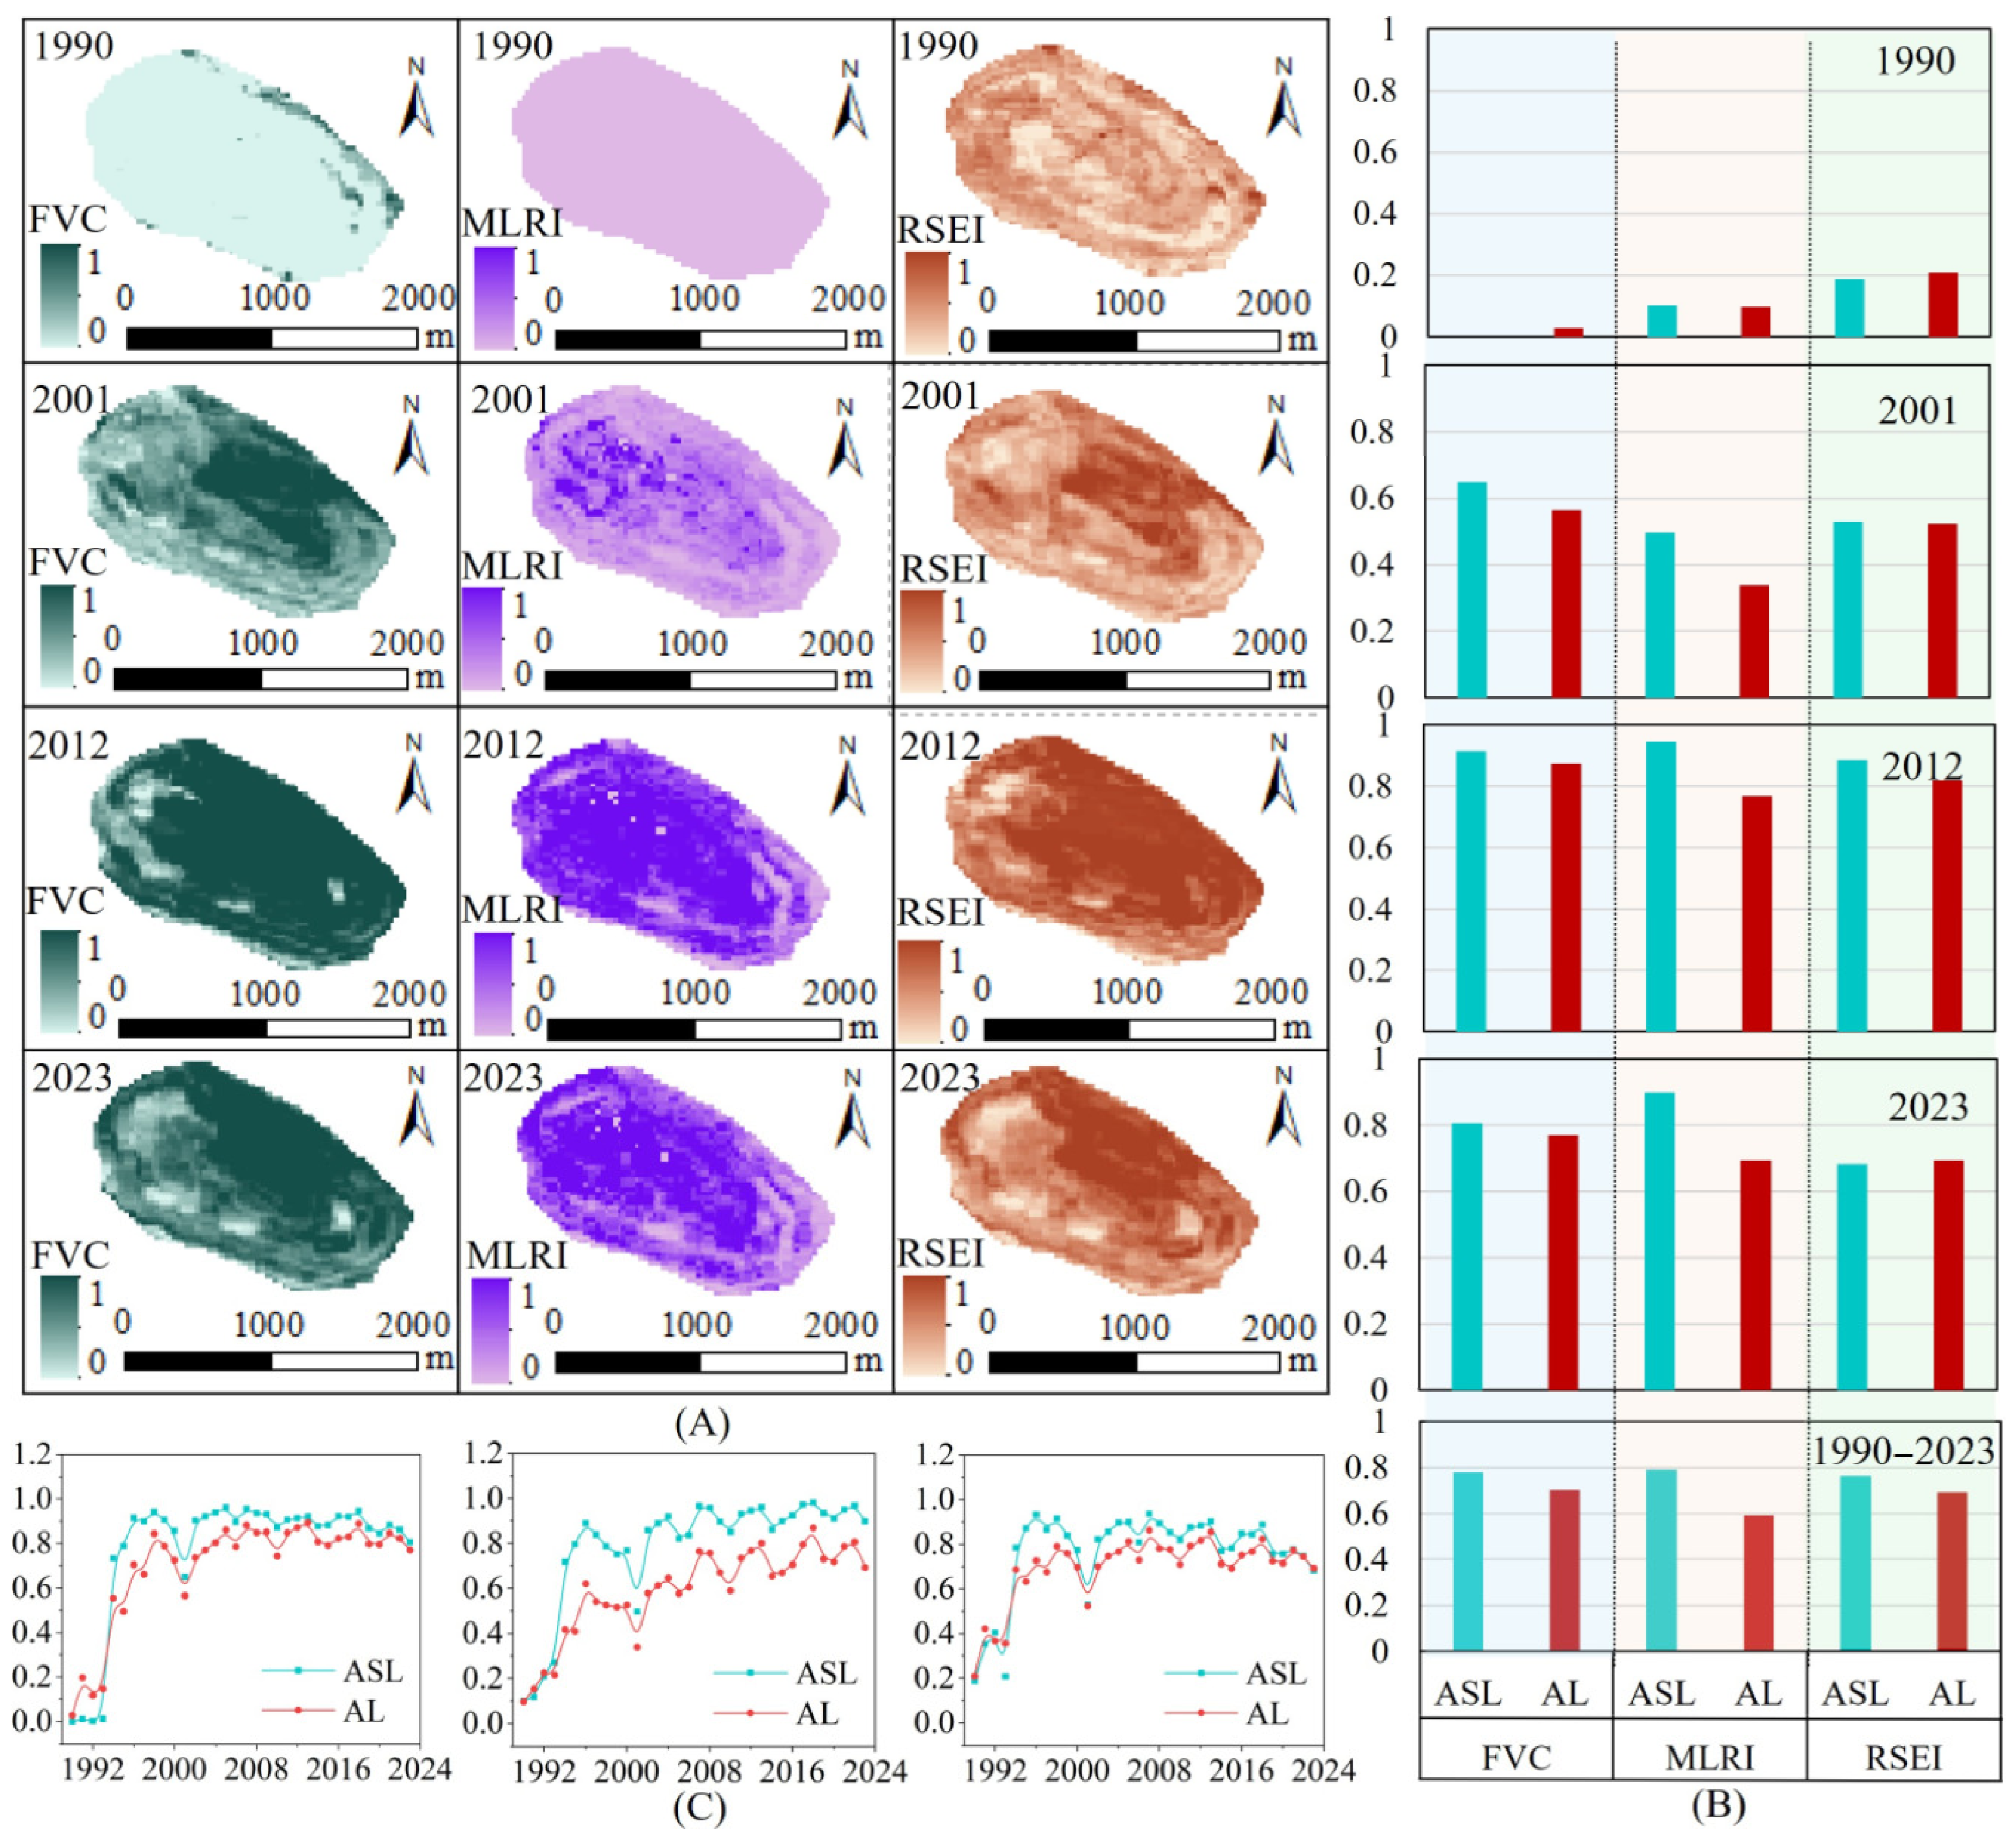
To systematically reveal the differences in recovery trajectories of reconstructed vegetation under varying vegetation configuration types in open-pit mining areas, a comparative analysis of the temporal succession trends between mixed forest of trees and shrubs and pure tree forest was conducted from three dimensions—morphology (FVC), structure (MLRI), and function (RSEI) (Figure 3). The results indicate that the successional trajectories exhibited across the three dimensions, as well as the interrelationships between the two vegetation types reflected by these trajectories, are not consistent but instead display pronounced dimensional differentiation. This empirical evidence corroborates that single-dimensional assessments are inherently inadequate for comprehensively characterizing the true status of vegetation recovery. In terms of absolute temporal trends across dimensions, the morphological and functional dimensions exhibited broadly similar “initial rise, followed by stabilization and a slight decline” trajectories—both underwent a rapid ascending phase during the early years following reclamation, and after reaching a relatively stable level, displayed a modest downward trend in the later successional stages. By contrast, the structural dimension revealed a markedly different evolutionary pattern, with MLRI values maintaining a sustained upward trajectory throughout the entire observation period, without exhibiting any clear saturation or declining inflection point. In the structural dimension, the two remain parallel after reaching a relatively stable stage. In terms of interaction, the FVC value of arbor forest lands is higher than that of arbor shrub forest lands in the early stage of the morphological dimension, while the factor values of arbor forest lands and arbor shrub forest lands are almost collinear in the early stage of the structural and functional dimensions, and then the factor values of arbor shrub forest lands are significantly higher than those of arbor forest lands.
To further corroborate these findings, statistical analyses were performed on the mean recovery values across the three dimensions for the years 1990, 2001, 2012, 2023, as well as for the entire 1990–2023 period (Figure 3B). The divergent patterns identified above were further confirmed. In the functional dimension, the differences between mixed forest and pure tree forest remained consistently negligible throughout, suggesting that the two vegetation types converged toward comparable levels of comprehensive ecosystem service efficacy. In the morphological dimension, a pronounced disparity was observed between the two forest types during the early recovery stage (1990); however, this difference gradually diminished over time as community development proceeded and canopy structures became increasingly similar. In the structural dimension, a persistent gap between the two forest types was evident at all statistical time points, further reinforcing the conclusion that the recovery of spatial pattern attributes is more strongly dependent on forest type.

3.2. Spatiotemporal Characteristic Analysis of Reconstructed Vegetation Evolution in Opencast Mining Areas Under Multi-Dimensional Integration

3.2.1. Spatial Characteristic of RRCI in the Study Area

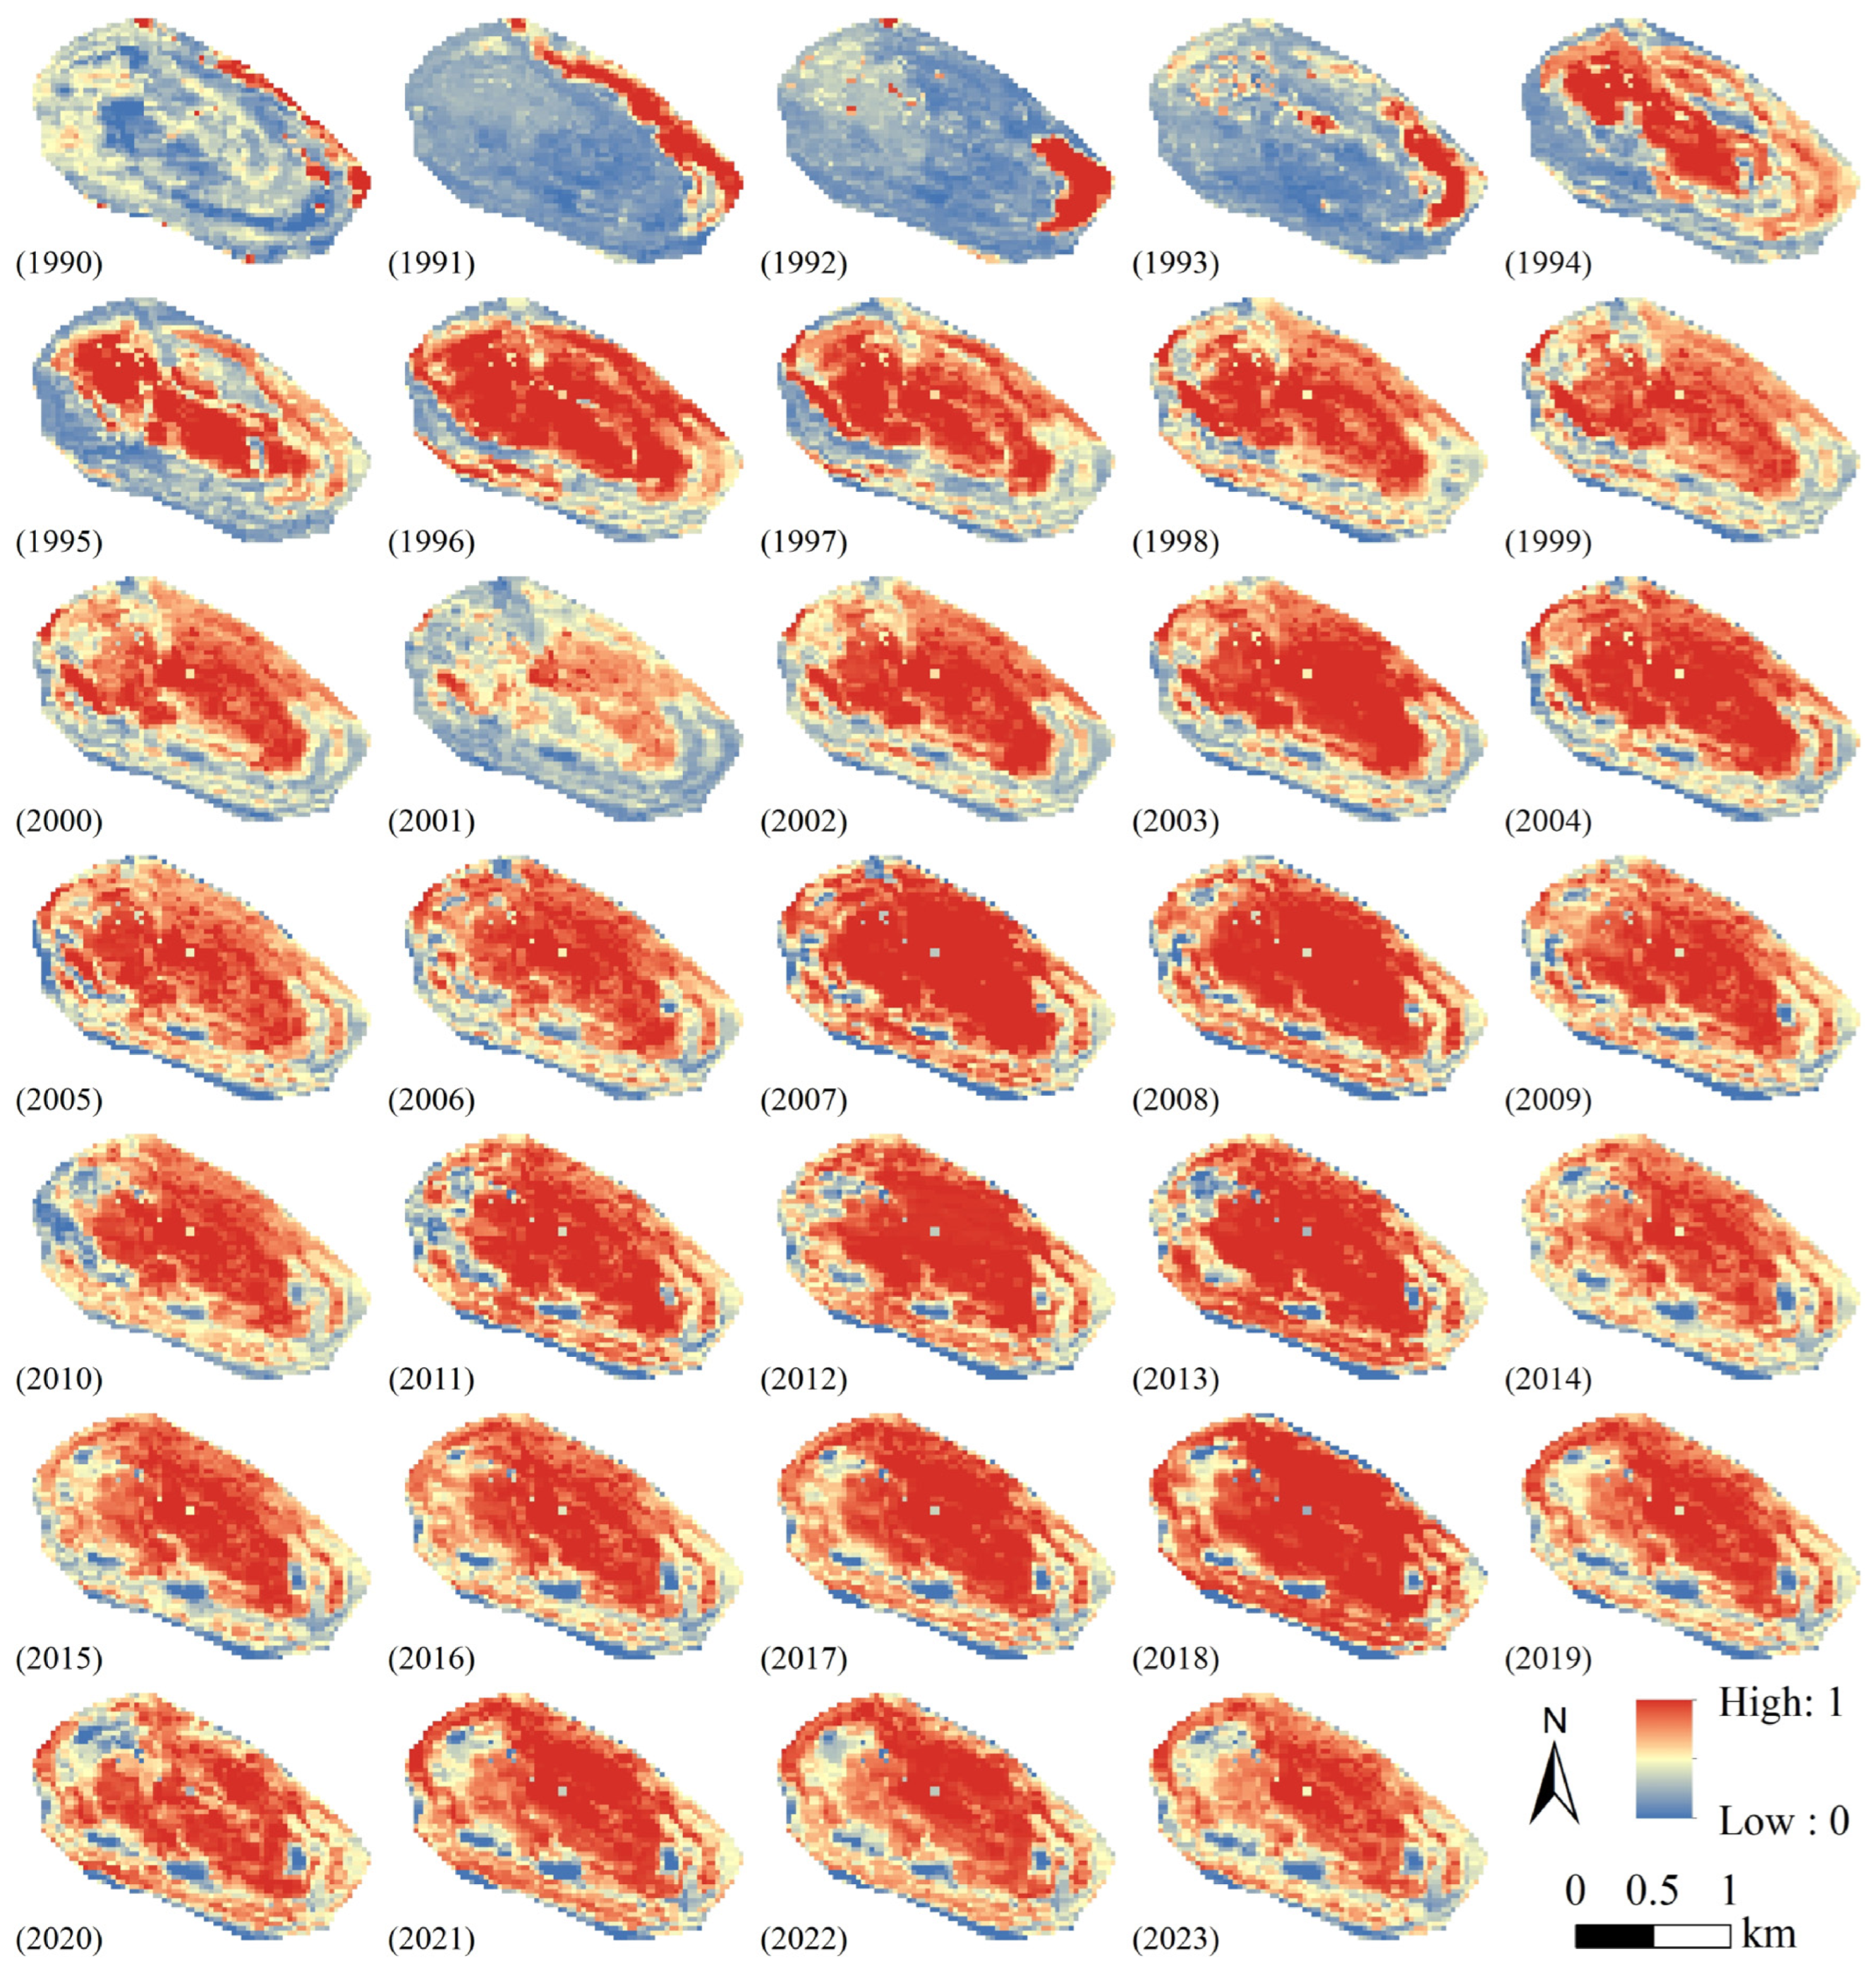
To further reveal the spatial distribution and dynamic characteristics of vegetation restoration, spatiotemporal evolutionary analysis was conducted on the RRCI of the southern dump of Antaibao Mine from 1990 to 2023, and the results are shown in Figure 4.
The results indicate that the RRCI of reconstructed vegetation in the southern dump shows significant spatiotemporal variation from 1990 to 2023. In the temporal dimension, the variation trend of the RRCI is closely related to the land reclamation process. From 1990 to 1994, the RRCI was dominated by low values, indicating that vegetation restoration was in the initial stage, reclamation work had not been fully carried out, and ecosystem function was at a low level. In 2014, land reclamation and vegetation restoration at the southern dump had been underway for 20 years, by which time the vegetation might reasonably be expected to have reached a well-recovered state. However, due to the severity of prior ecological disturbance and the slow recovery of soil fertility, vegetation restoration levels remained persistently low. Thereafter, with the passage of reclamation time, the RRCI began to rise rapidly, showing an accelerated trend of vegetation restoration. However, an overall temporary decline in the RRCI occurred in 2001, especially in the southern part of the dump, which may be related to abnormal climate, intensified soil erosion, or insufficient phased reclamation measures in that year. But from 2007 onward, vegetation restoration in the southern part of the dump gradually improved, and the RRCI rebounded, indicating that the ecosystem re-entered the restoration track after short-term fluctuations. From 2007 to 2018, most areas of the study area had a high RRCI, indicating remarkable vegetation restoration effects and gradual recovery of ecosystem functions. However, a few low-value patches appeared in the southwestern area during this period, and these patches showed a gradually expanding trend from 2019 to 2023, which may imply potential ecological degradation risks in this area requiring further attention.
In the spatial dimension, the RRCI shows obvious regional differences. Overall, vegetation restoration in the southern dump spreads from the center to the edges, with significant differences in restoration among local areas. For example, the southern part of the dump experienced a decline in the RRCI in 2001, while other areas remained relatively stable. This difference may be related to spatial heterogeneity of topography, soil texture, water conditions, and reclamation measures. In addition, most areas of the study area maintained a high RRCI from 2007 to 2018, with a few low-value patches in the southwestern area. The emergence and expansion of low-value patches in the southwestern area indicate that local areas may be affected by a combination of factors such as insufficient soil nutrients, unreasonable vegetation community structure, or alien species invasion during vegetation restoration, leading to a lag in restoration progress compared with other areas.

3.2.2. Time Series Characteristic of RRCI in the Study Area

To fully understand the changes in various statistical indicators during vegetation restoration, descriptive statistics were conducted on the RRCI of reconstructed vegetation in 25 plot units of the Antaibao southern dump from 1990 to 2023, and the results are shown in Table 2.
The results indicate that the RRCI of reconstructed vegetation in each plot unit of the southern dump shows a significant upward trend with the passage of reclamation time. Specifically, the maximum, minimum, mean, and median values of the RRCI continue to rise over time, indicating that the overall effect of vegetation restoration is continuously improving. The standard deviation of the RRCI of reconstructed vegetation in each plot unit shows certain stability between different years. Except for the initial year of 1990, the standard deviation in other years is stable between 0.1 and 0.25, indicating that the difference in vegetation restoration among plot units gradually tends to stabilize over time. In addition, the coefficient of variation in the RRCI peaks between 1990 and 1995 and then gradually stabilizes at around 0.2. This variation trend may be related to the uncertainty and complexity of vegetation restoration in the early stage of reclamation. In the early stage of reclamation, differences in soil conditions, vegetation seed banks, and environmental stress among different plot units lead to large differences in vegetation restoration speed and effects, resulting in a high coefficient of variation. However, over time, soil conditions gradually improve, vegetation restoration tends to stabilize, and the coefficient of variation decreases accordingly.

3.3. S-Logistic Function Fitting Results of RRCI

3.3.1. Selection of Sample Plot Units for Effective Restoration of Reconstructed Vegetation

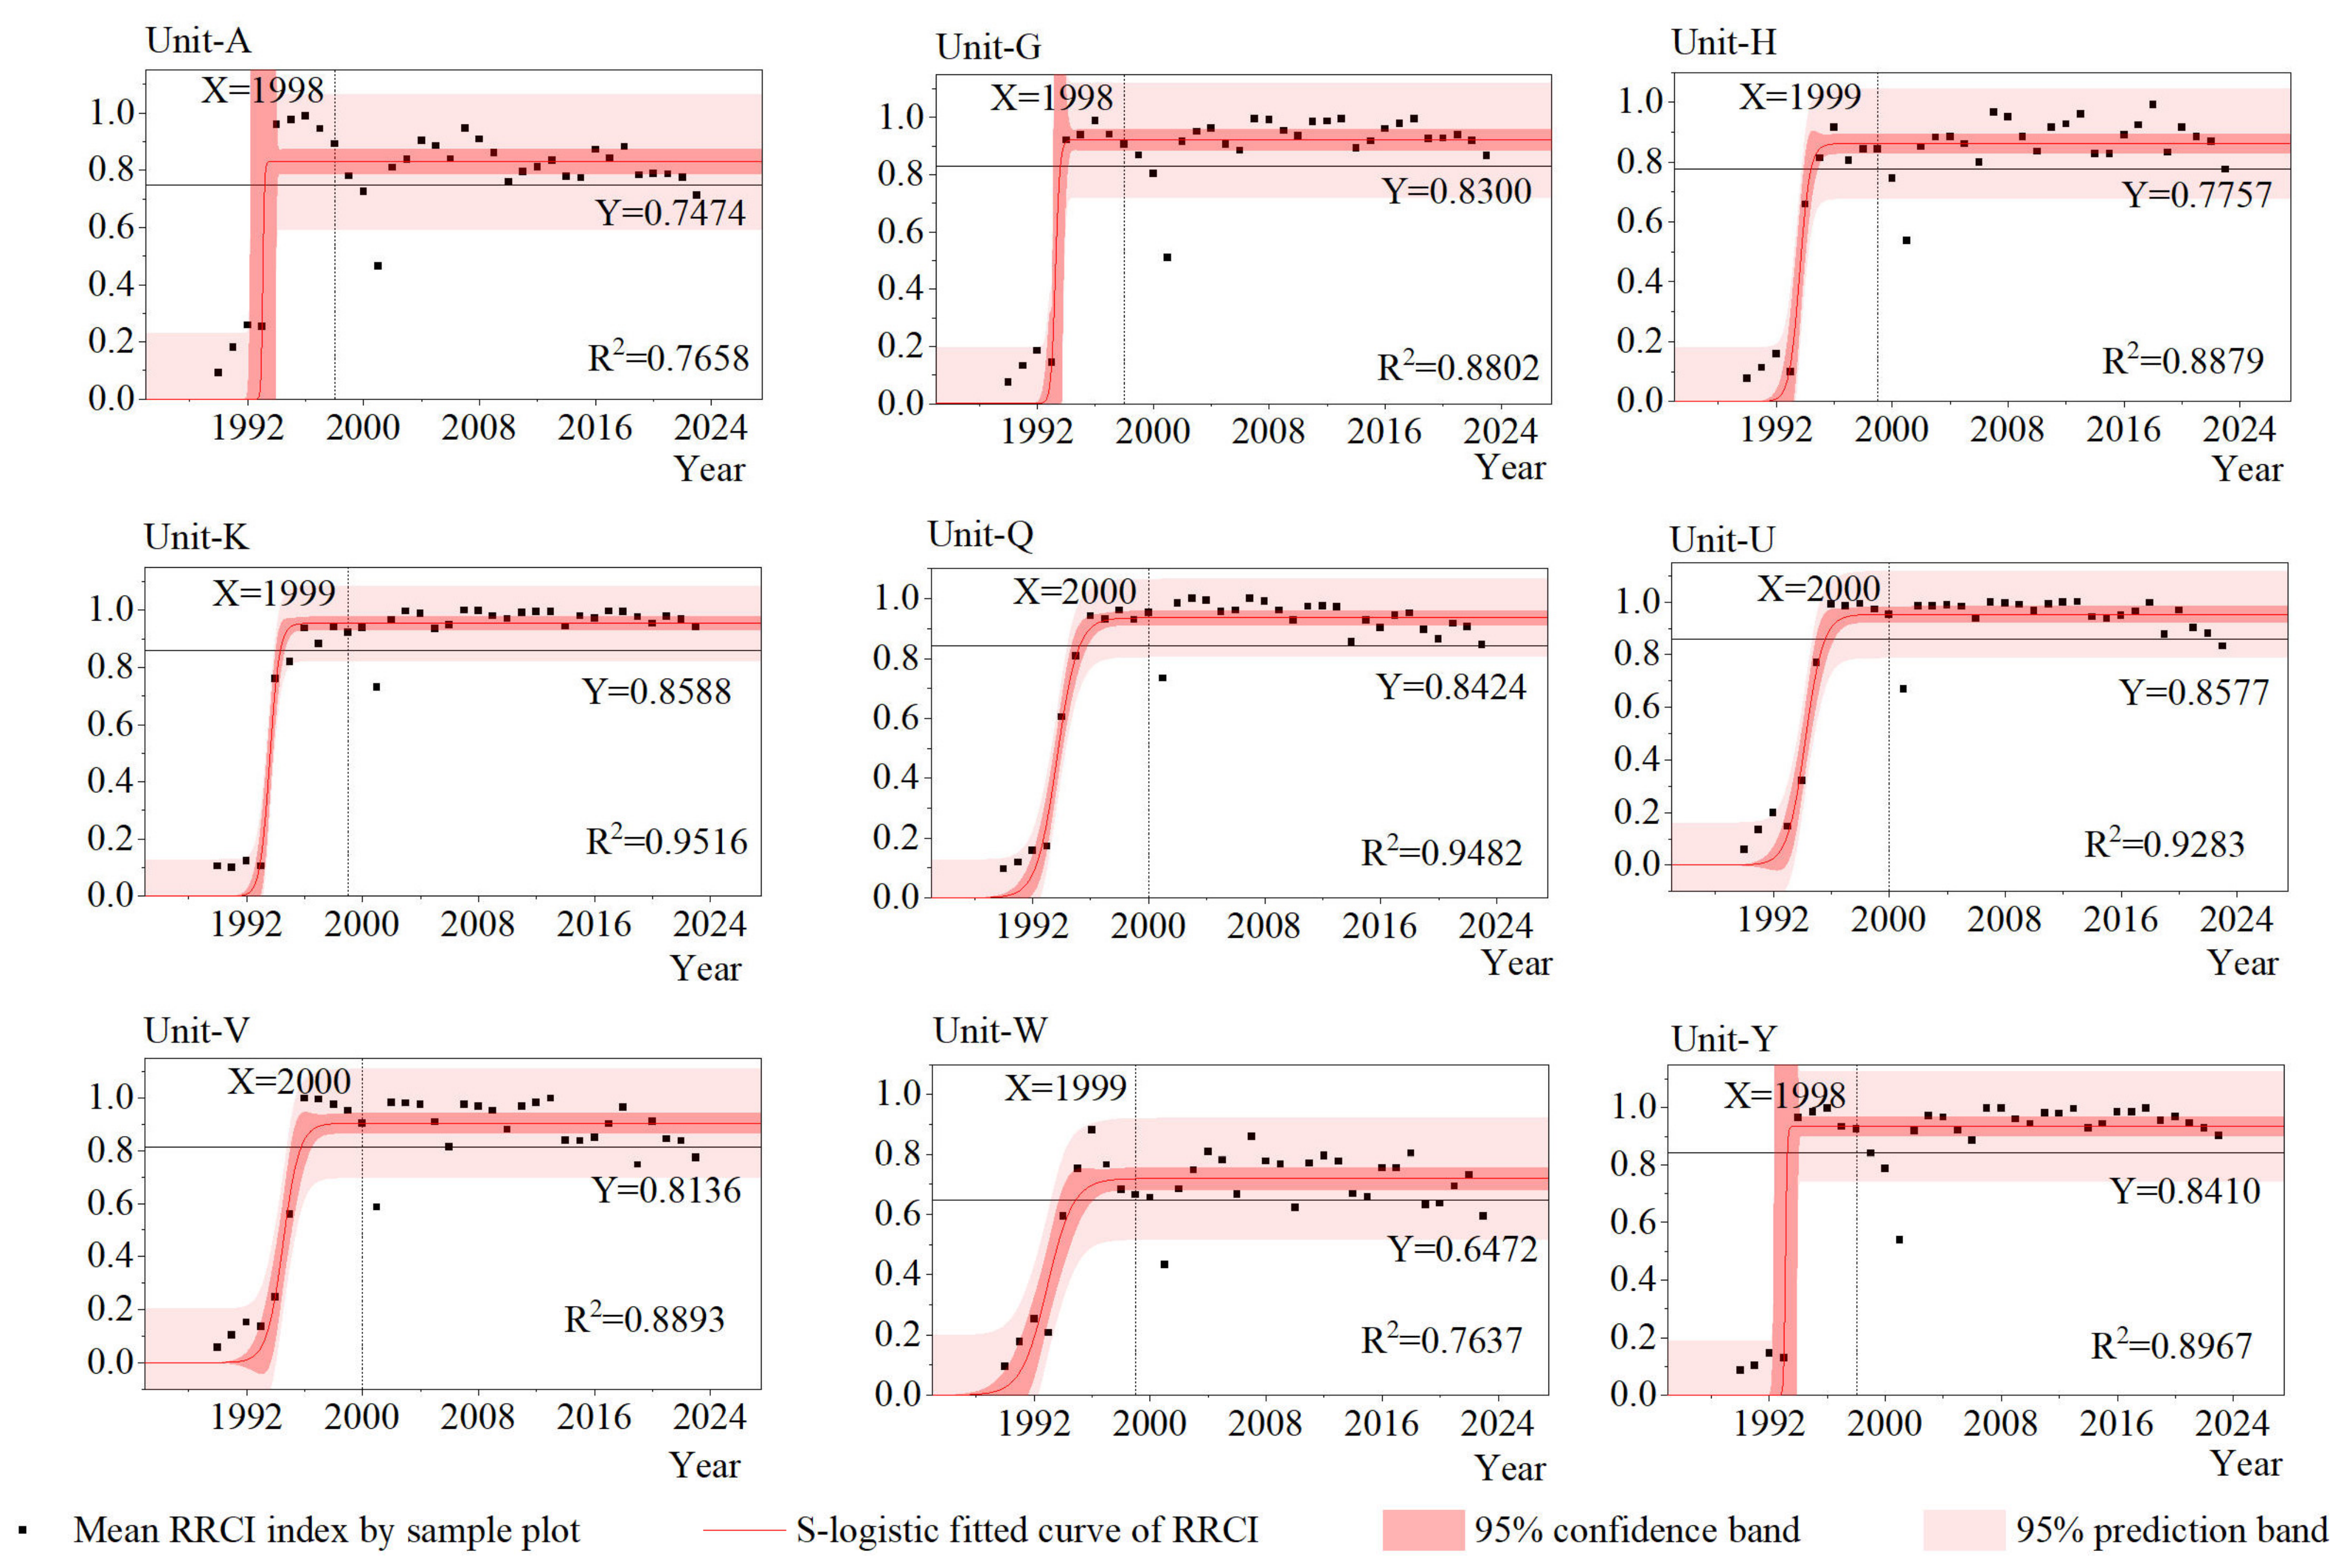
Based on the analysis of time series dynamic evolutionary characteristics of the RRCI in opencast mining areas, relatively homogeneous reclamation plots (with the same land reclamation years, land use types, and vegetation configuration modes) were taken as fitting units. The southern dump of Antaibao was divided into 25 plot units, labeled as Plot-A, Plot-B, Plot-C, …, Plot-Y. The S-logistic function was fitted to the 25 plot units, and the results are shown in Table 2. According to the function fitting results, screening criteria for research units were set (exclude plot units with R2 < 0.7; k value represents vegetation restoration rate, exclude plot units with ineffective vegetation restoration after reclamation (k ≤ 0.2), i.e., plot units that have not reached the stability stage within the study period). A total of six plot units were excluded (Plot-P, Plot-S, Plot-T, Plot-X with R2 < 0.7; Plot-M, Plot-E with ineffective vegetation restoration within the study period (k ≤ 0.2)), leaving 19 eligible plot units, including 10 arbor forest land units and nine arbor shrub forest land units (Table 3).

3.3.2. Trend Analysis of S-Logistic Function Fitting of RRCI in Screened Sample Plots

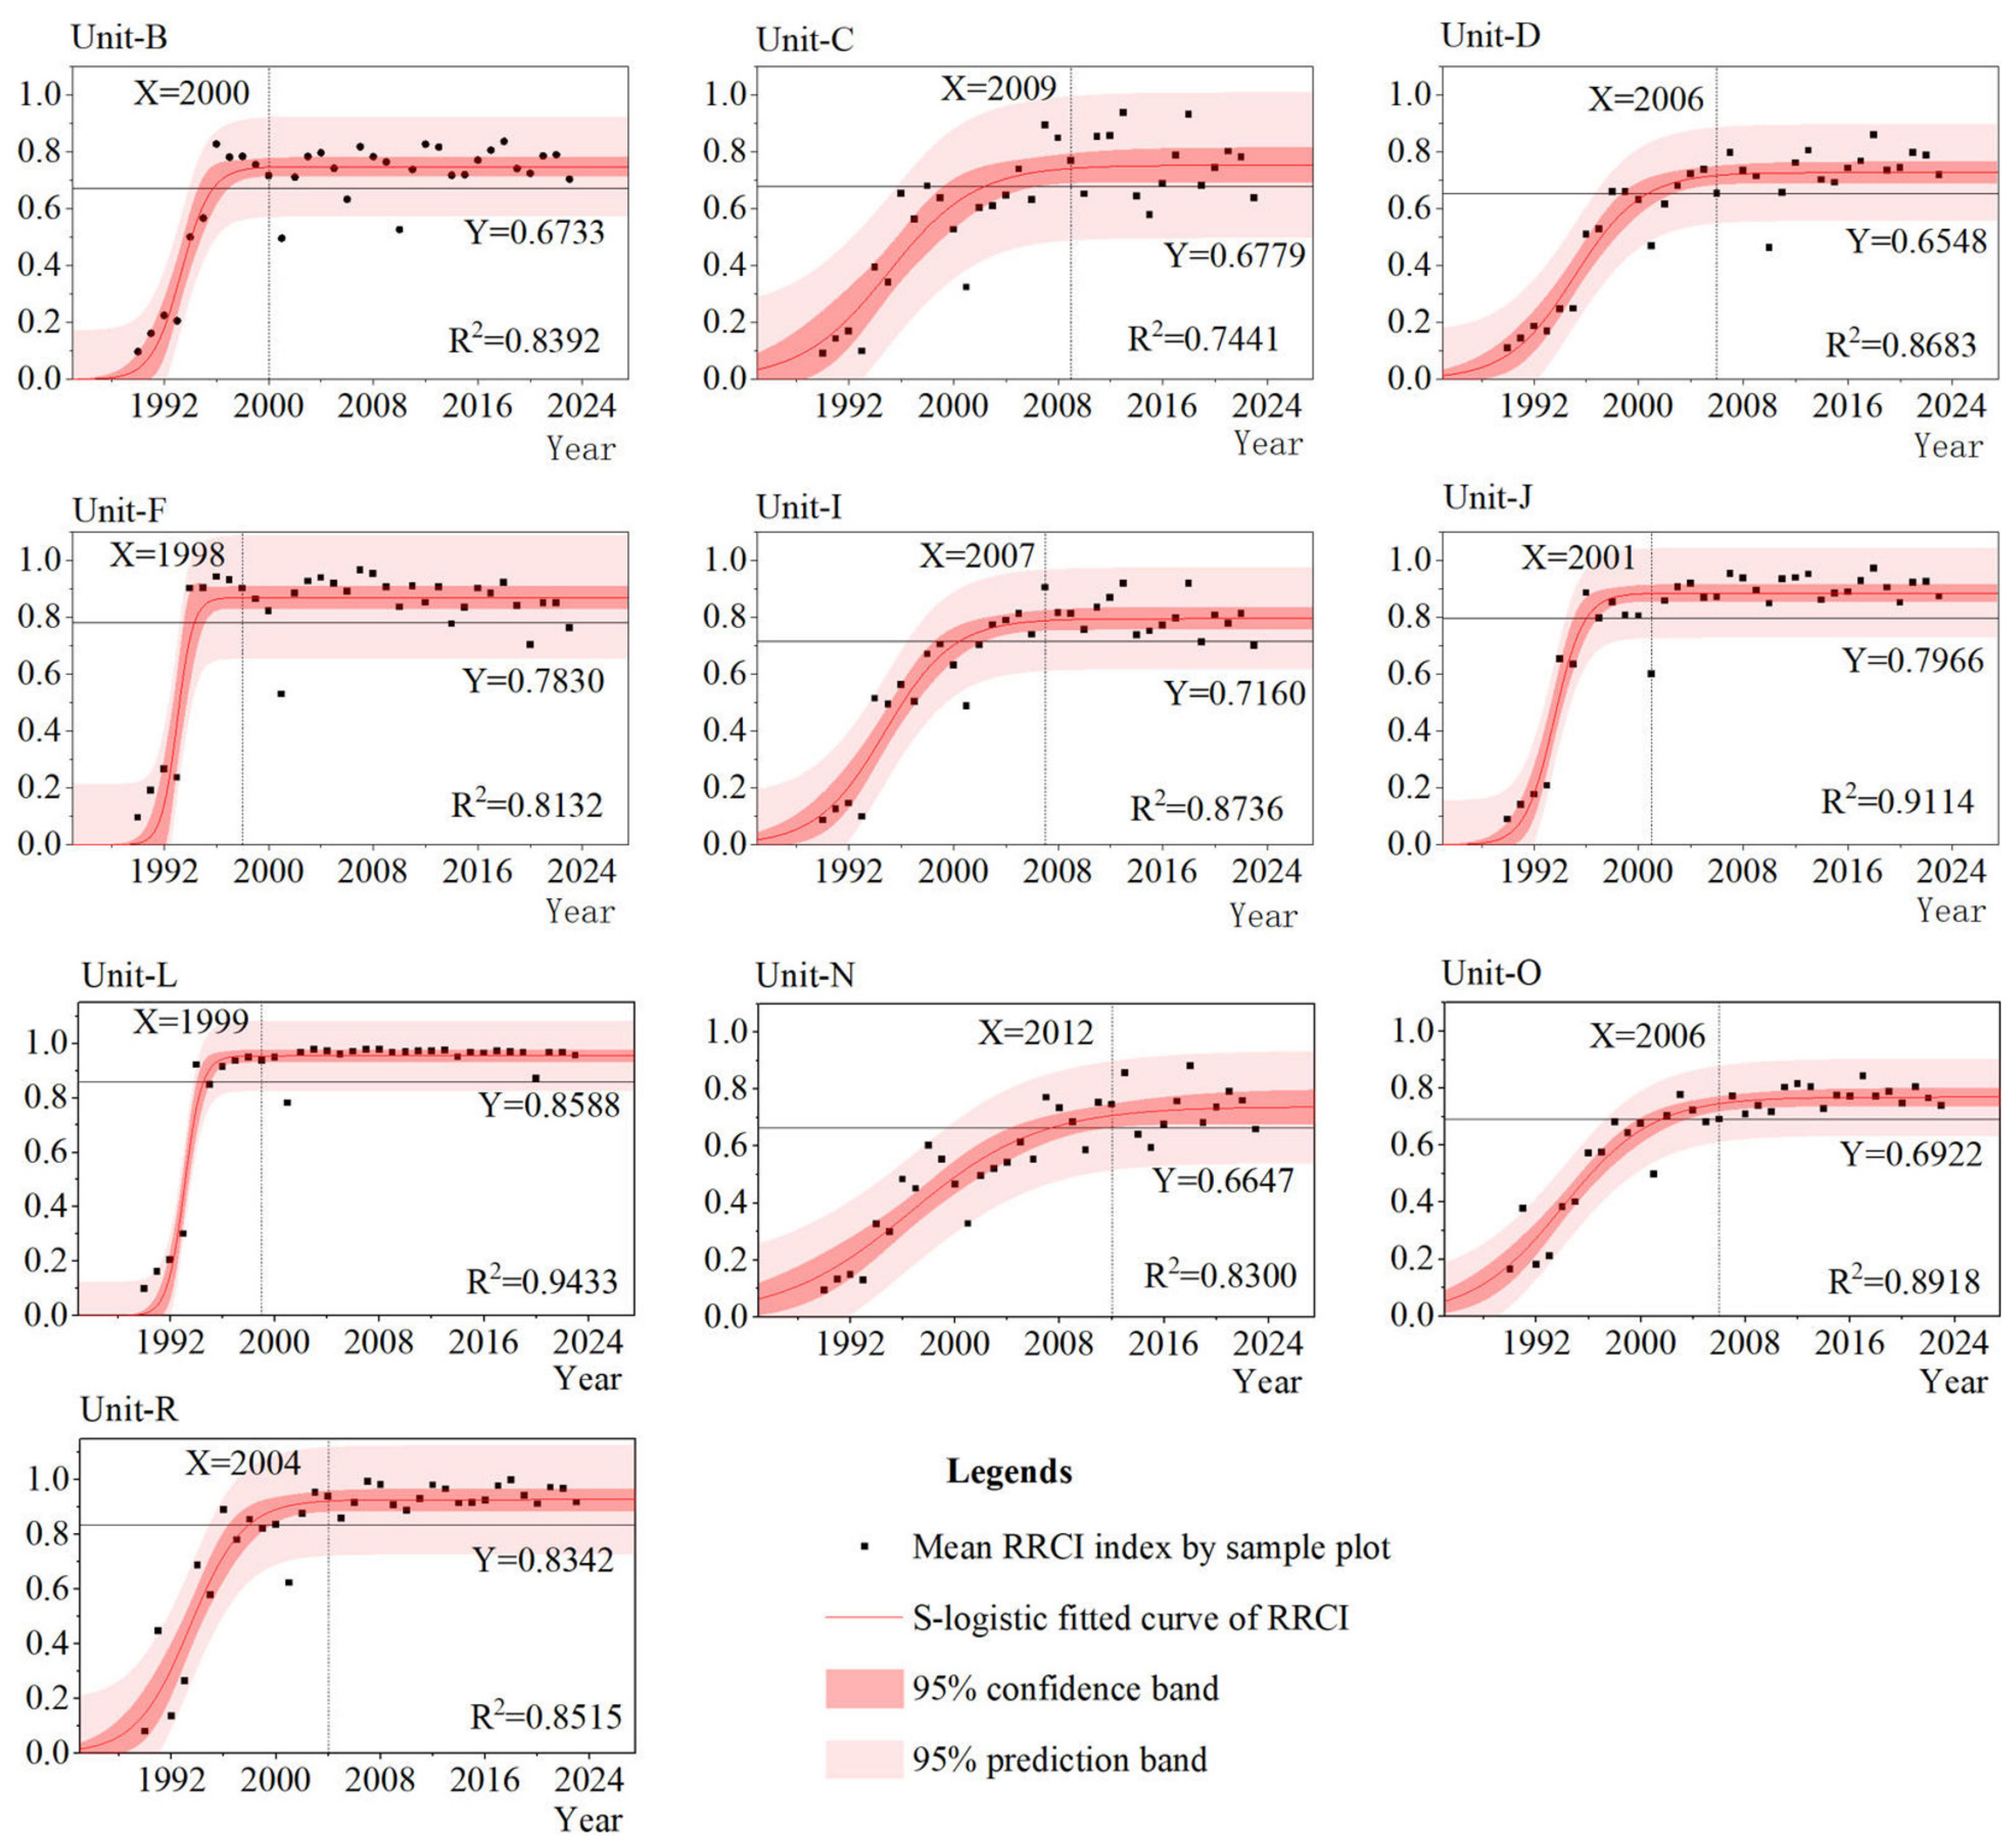
Based on the above screening criteria, a total of 10 arbor forest land units that met the requirements were selected for this study. S-logistic function fitting and cartographic analysis were performed on the time series RRCI data spanning 1990–2023 for these units, with the results presented in Figure 5. In terms of overall evolutionary morphology, the RRCI values for all 10 plots exhibited a typical S-shaped growth trajectory, indicating that the recovery process of reconstructed vegetation is characterized by distinct stage-dependent features. Specifically, this S-shaped curve can be partitioned into three consecutive ecological succession phases: an initial slow growth phase, a mid-term accelerated growth phase, and a later stabilization phase. In the early stage of reclamation, vegetation restoration is slow due to poor soil conditions, insufficient vegetation seed banks, and environmental stress. Over time, soil conditions gradually improve, vegetation seed banks gradually accumulate, and vegetation restoration accelerates and enters the accelerated growth stage. Finally, after vegetation coverage reaches a high level, the restoration rate gradually slows down and tends to be stable.
In terms of goodness of fit and model reliability, with the exception of short-term fluctuations in RRCI statistics for isolated years caused by extreme climatic events, the vast majority of plot observations fell within the 95% prediction band of the S-logistic fitting function. This finding indicates that the S-shaped curve model not only effectively captures the central tendency of the time series RRCI data for pure tree forests, but also reasonably delineates the normal range of variability. These results further validate the applicability and robustness of this functional form in characterizing the vegetation recovery trajectories of forested areas in the Loess Plateau mining region.
In the research of arbor shrub forest land sample plot units, nine eligible sample plot units were also selected, and the S-logistic function fitting and mapping analysis of the RRCI of these sample plot units from 1990 to 2023 were conducted, and the results are shown in Figure 6. Similar to arbor forest land sample plot units, the RRCI of most arbor shrub forest land sample plot units also presents an S-shaped evolutionary trend as a whole. However, it is worth noting that the RRCI of some sample plot units (such as Plot-A, Plot-G, and Plot-Y) shows a unique inverted Z-shaped evolutionary trend. This inverted Z-shaped evolutionary trend indicates that the reconstructed vegetation of these sample plots shows a rapid restoration trend in the year of reclamation and reaches a relatively stable state within the next one to two years. This rapid restoration may be related to the vegetation configuration mode of arbor shrub forest lands. The mixed planting of arbors and shrubs not only improves vegetation diversity but also enhances the adaptability of vegetation to soil and environmental stress. The rapid growth of shrubs provides good shading and soil improvement conditions for arbors, while the growth of arbors further stabilizes the ecosystem structure and promotes rapid vegetation restoration. This unique evolutionary trend provides important inspiration for ecological restoration practice: under certain specific conditions, the vegetation configuration mode of arbor shrub forest lands may be more conducive to the rapid restoration of vegetation and early stabilization of the ecosystem.
Through the S-logistic function fitting analysis of the RRCI of arbor forest land and arbor shrub forest land sample plot units, the vegetation restoration evolutionary trends under two different vegetation configuration modes are effectively revealed. The RRCI of arbor forest lands presents a typical S-shaped evolutionary trend, while the RRCI of arbor shrub forest lands shows more complex dynamic characteristics, including S-shaped and inverted Z-shaped evolutionary trends. These results indicate that the evolutionary trend of vegetation restoration is not only affected by vegetation configuration modes but also closely related to soil conditions, environmental stress, vegetation diversity and other factors. Therefore, in ecological restoration practice, more targeted ecological restoration strategies should be formulated according to specific environmental conditions and vegetation configuration modes to improve the efficiency and stability of vegetation restoration.

3.4. Analysis of Delineation Results of Critical Stages of Reconstructed Vegetation Evolution

According to the identification rules of reconstructed vegetation evolution in different stages, the eligible sample plot units were screened again, leaving 11 effective sample plot units, including six arbor forest lands and five arbor shrub forest lands. The delineation results of reconstructed vegetation evolution trajectories in each stage of each sample plot are shown in Table 4. The rapid restoration period of arbor forest lands ranges from 3 to 14 years, the consolidation restoration period ranges from 4 to 7 years, and the stable restoration period ranges from 7 to 18 years; the rapid restoration period of arbor shrub forest lands ranges from 1 to 2 years, the consolidation restoration period is 4 years, and the stable restoration period ranges from 4 to 6 years.
According to the descriptive statistical results of reconstructed vegetation evolution stages in each sample plot unit (Table 5), the average duration of the accelerated development period, consolidation development period, and recovery development period of reconstructed vegetation in the study area are 5.09 years, 4.64 years, and 9.73 years, respectively. Among them, the average duration of the accelerated development period of arbor forest lands is 8 years, the consolidation development period is 5.17 years, and the recovery development period is 13.17 years; the average duration of the accelerated development period of arbor shrub forest lands is 1.6 years, the consolidation development period is 4 years, and the recovery development period is 5.6 years. One-way ANOVA shows that except for the consolidation development period (p = 0.08 > 0.05), there are significant differences in the accelerated development period and recovery development period between arbor forest lands and arbor shrub forest lands (p = 0.003 < 0.05, p = 0.001 < 0.05), and the land reclamation years required for vegetation restoration to each stage in arbor forest lands are far longer than those in arbor shrub forest lands; in terms of coefficient of variation, the overall coefficient of variation in the consolidation development period in the study area is close to that of arbor forest lands, and the overall coefficient of variation in the study area in other stages is greater than that of arbor forest lands and arbor shrub forest lands.

4. Discussion

4.1. Stage Characteristics of Reconstructed Vegetation Evolution in Opencast Mining Areas from a Multi-Dimensional Perspective

By comparing the evolutionary trends of reconstructed vegetation in three dimensions (VFC, MLRI, RSEI) in opencast mining areas (Figure 3), it is found that the restoration of reconstructed vegetation in opencast mining areas is not a linear accumulation of a single index, but a nonlinear transition process of “morphology–structure–function” collaborative evolution. The time series responses of multi-dimensional indicators show a significant dislocation phenomenon [40]. For example, the morphological (VFC) and functional (RSEI) dimensions tend to converge or even merge in the later stage of succession, while the structural (MLRI) dimension maintains a continuous upward trend with significant differences between the two forest types. The internal ecological mechanism is that early reclamation is dominated by rapid surface coverage and basic habitat improvement, and canopy closure and microenvironment improvement can rapidly increase VFC and RSEI; however, the connectivity of landscape patterns, patch mosaic degree, and ecological network construction highly depend on soil maturation, community self-organization, and interspecific interactions, with obvious hysteresis and cumulative effects [41]. In addition, the slight decrease in VFC and RSEI in the stable stage may be caused by intensified understory competition or seasonal water stress due to excessive community closure, while the continuous increase in MLRI reflects the long-term optimization of spatial heterogeneity and ecological service supply potential. Single-dimensional evaluation is easy to fall into the cognitive bias of emphasizing green quantity, neglecting pattern, and weakening function, and multi-dimensional collaboration can fully depict the real threshold of the restoration process [42,43].
Through the S-logistic fitting analysis of time series RRCI data integrating “morphology–structure–function” multi-dimensions, the difference law of the years required for reconstructed vegetation restoration to each evolutionary stage under different configuration types is further revealed [44]. The average duration of the accelerated development period and consolidation development period of reconstructed vegetation in the study area are 5.09 years and 4.64 years (Table 5), respectively. This quantitative threshold profoundly reveals the nonlinear dynamic characteristics of reconstructed vegetation in the Loess Plateau mining area [45]. Further analysis of sample plot units under different vegetation configurations shows that there are significant differences between arbor forest lands and arbor shrub forest lands in the accelerated development period and recovery development period (p < 0.05), while the difference in the consolidation development period is not significant (p = 0.08). In the arid and semi-arid habitats of the Loess Plateau, the arbor shrub mixed mode can greatly shorten the substrate adaptation period and accelerate the transition from morphology to structure–function synergy by virtue of the pioneer colonization ability, drought resistance characteristics, and rapid soil fixation and improvement effect of shrubs [46]; pure arbor forest lands are limited by slow deep root development, high transpiration water consumption, and gradual improvement of soil physical and chemical properties [3], requiring a longer consolidation buffer and steady-state remodeling period [47]. The consolidation development period, as a common window for “water–soil–vegetation” coupling adaptation, both forest types face similar resource redistribution bottlenecks, so the stage duration tends to be consistent.
More significantly, the methodological contributions of the “morphology–structure–function” multi-dimensional coupling framework and its associated S-curve phase delineation approach are by no means confined to the reclamation landscapes of mine spoil heaps. At the methodological level, the framework establishes a generalizable analytical paradigm that fuses remote sensing time series observations with ecological succession theory. In any setting where vegetation recovery following anthropogenic disturbance requires evaluation, the analytical chain—encompassing multi-dimensional indicator development, nonlinear trajectory fitting, and critical threshold identification—can be readily adapted, thus facilitating a fundamental upgrade in methodological sophistication from static snapshots to dynamic process-oriented diagnostics. At the practical level, the three distinct phases identified by this framework—the rapid development phase, the consolidation phase, and the recovery development phase—offer a temporally explicit decision support system for tailoring management interventions across different ecological restoration initiatives. Specifically, the rapid development phase calls for accelerated surface cover establishment; the consolidation phase demands soil quality enhancement and structural refinement of plant communities; and the recovery development phase necessitates sustained improvement and resilience maintenance of ecosystem service provisioning. Relative to traditional fixed-duration management regimes, the proposed framework exhibits markedly greater ecological adaptability and cost efficiency, and is well-positioned to serve as a replicable technical instrument for evaluating restoration performance in support of the global land degradation neutrality framework.

4.2. Management Implications of Reconstructed Vegetation Evolution Stage Identification for Land Reclamation in Opencast Mining Areas

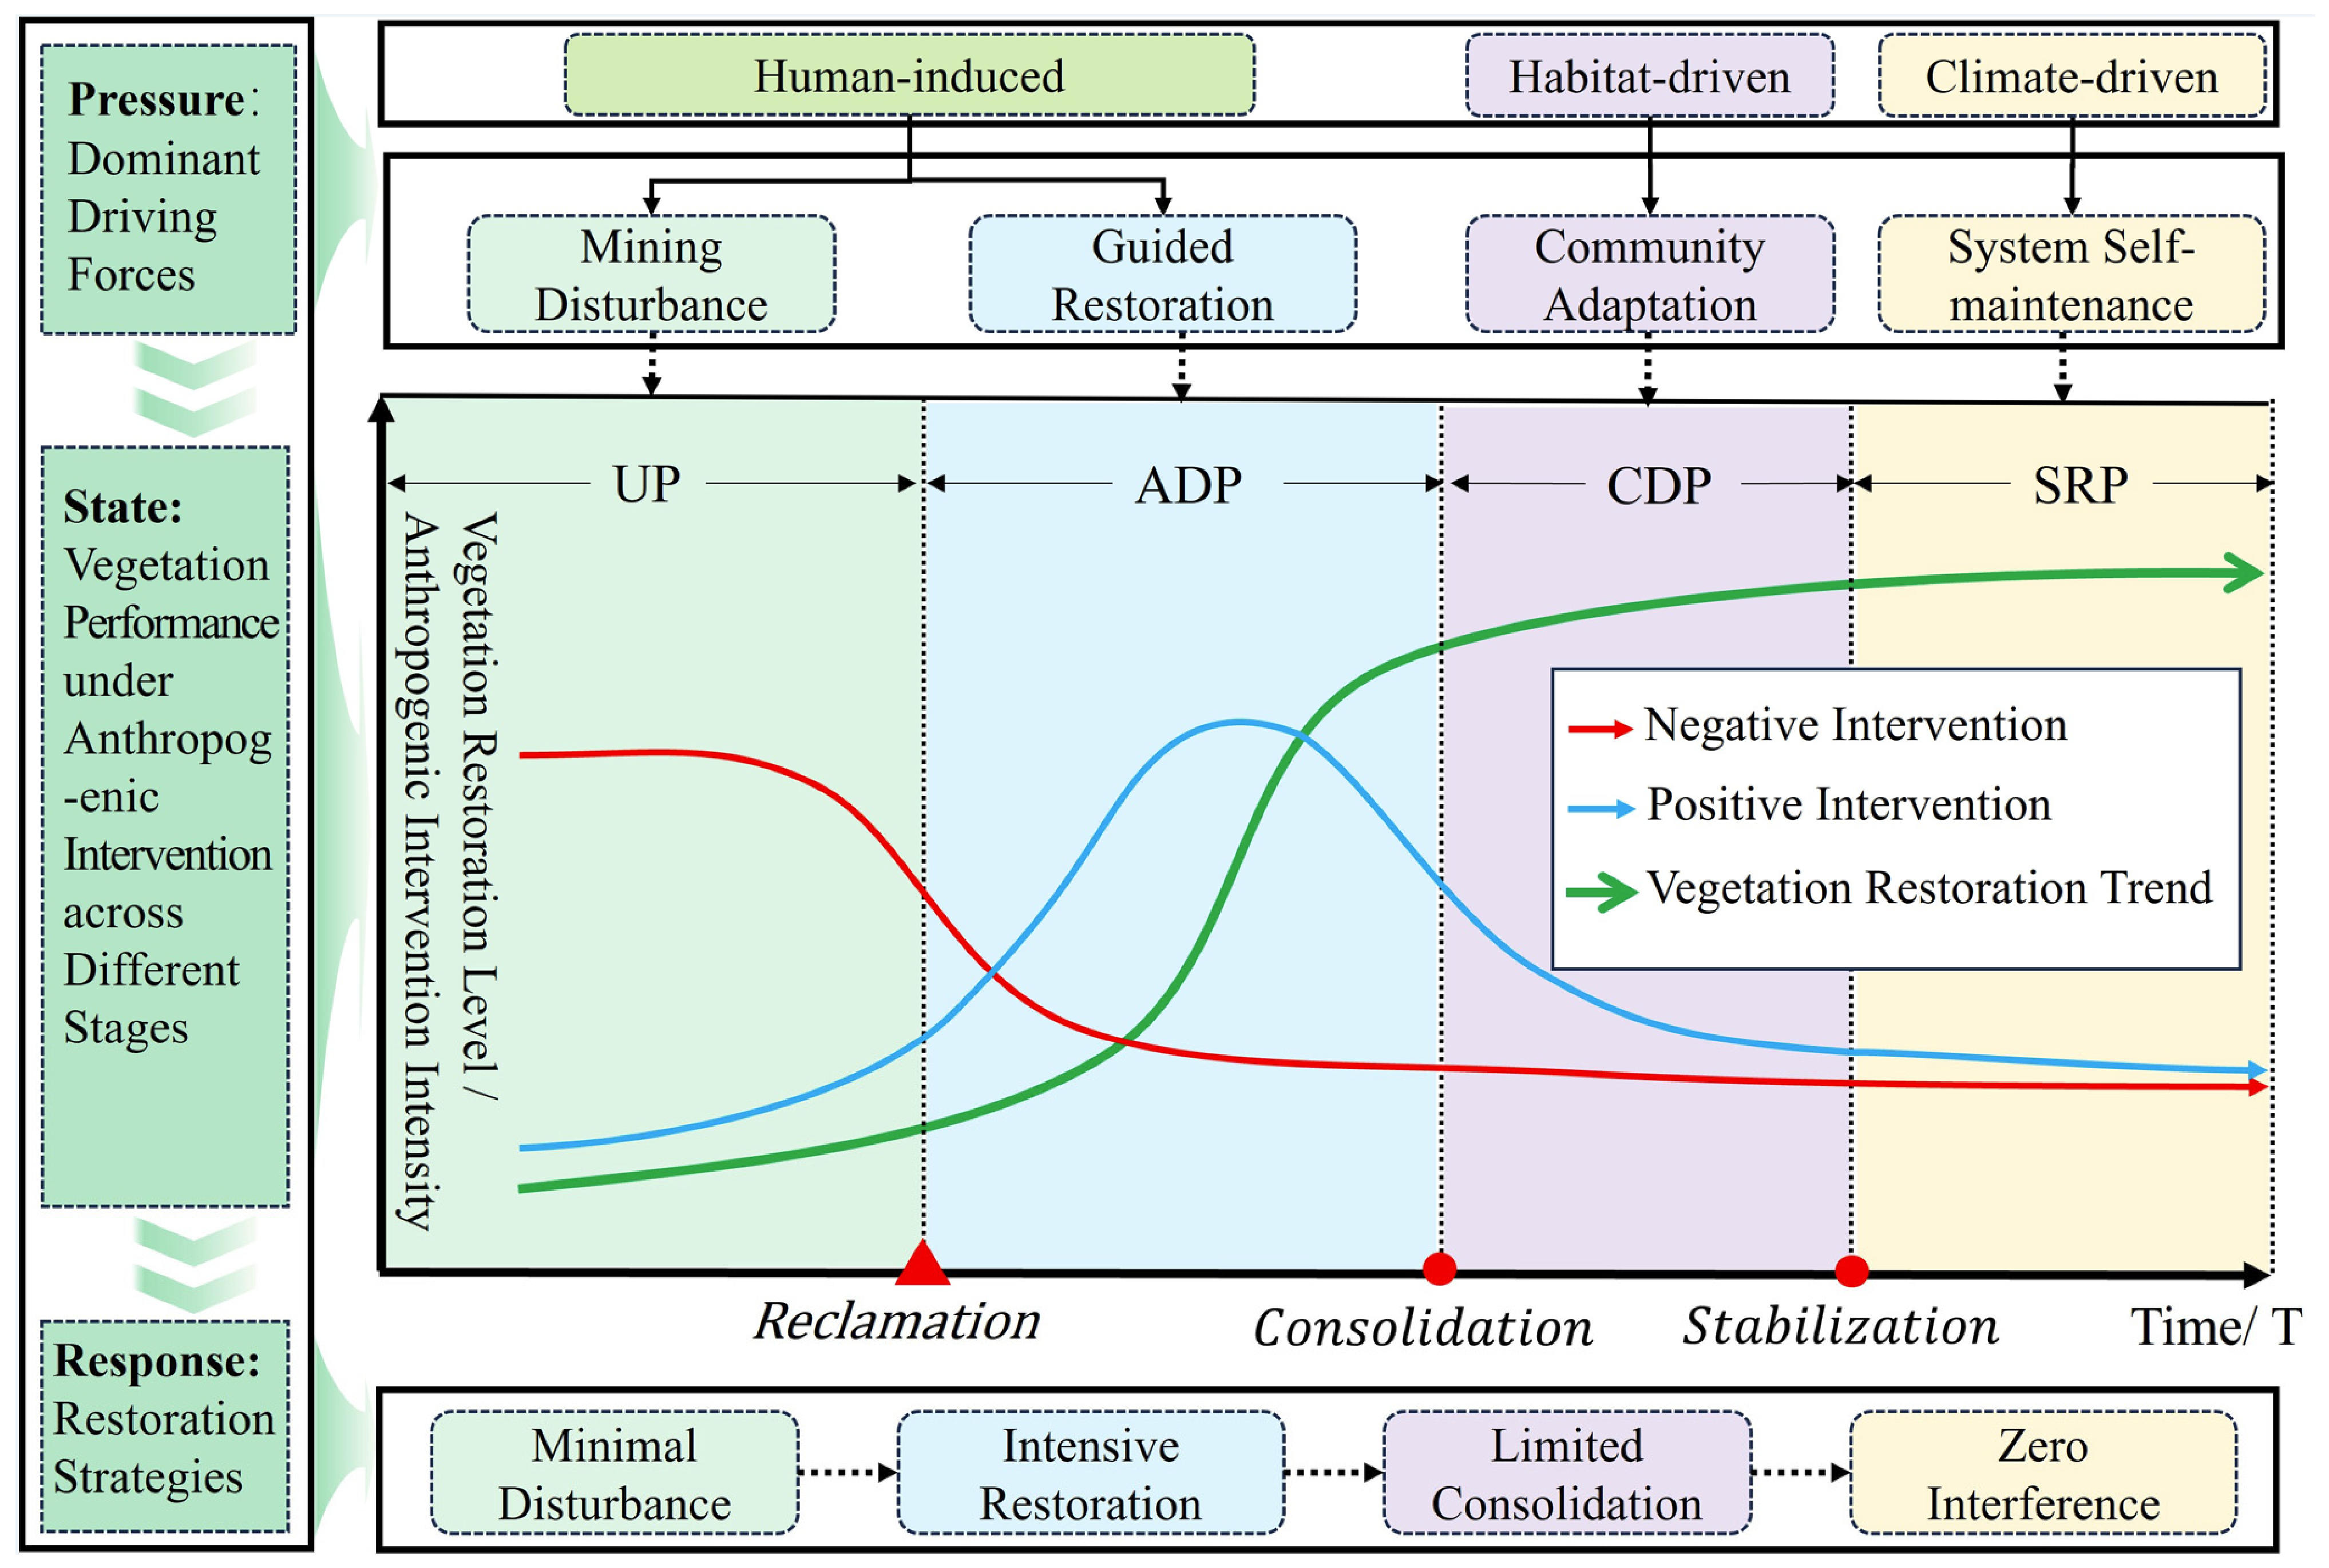
Ecosystem restoration is not a short-term, once-and-for-all engineering project [48], but rather a long-term process characterized by a dynamic transition from anthropogenic intervention to natural drivers. Based on the delineation results of critical stages of reconstructed vegetation evolution (Table 5) and combined with the “Pressure–State–Response” (PSR) theory [49,50], the spatiotemporal laws of reconstructed vegetation evolution and its implications for reclamation management can be systematically revealed (Figure 7). By accurately matching the response strategy of “minimal disturbance, intensive restoration, limited consolidation, and zero interference”, the optimal synergy of ecological benefits and management costs can be achieved [51].
Unreclaimed period: Source control strategy with minimal disturbance as the core. In the unreclaimed period, the system is mainly dominated by mining damage in artificial drive, showing high-intensity negative intervention (the red curve in Figure 7 runs at a high level). At this time, the vegetation restoration level is extremely low, and habitat fragmentation is serious. Based on the PSR framework, the management response at this stage should focus on controlling the pressure end, adopting the minimal disturbance strategy [52]. This means that before the official start of reclamation projects, non-essential land disturbance should be strictly limited, soil erosion and pollution source diffusion should be controlled, as many background resources and soil seed banks as possible should be preserved for subsequent ecological reconstruction, and further deterioration of the ecological base should be avoided.
Accelerated development period: Implement dominant artificial intervention of intensive restoration. With the arrival of the land reclamation time point, the system enters the rapid restoration period. This stage is the peak period of artificial intervention intensity (blue curve in Figure 7), corresponding to the guided restoration driving force. At this time, the vegetation restoration level (green curve) shows exponential growth. This stage must seize this key window period and implement the intensive restoration strategy. Due to harsh habitat conditions and insufficient natural resilience, managers need to invest a lot of resources in combining engineering reshaping and biological measures (such as foreign soil backfilling, irrigation and fertilization, pioneer species introduction), and rapidly improve vegetation coverage and biomass through high-intensity positive intervention to overcome the ecological threshold and lay the foundation for community succession.
Consolidation development period: Turn to adaptive management of limited consolidation. When the evolution enters the consolidation restoration period, the driving force gradually transforms from simple artificial guidance to community adaptation under habitat drive. Figure 7 shows that the positive intervention intensity begins to decrease significantly at this time, while the vegetation restoration level continues to rise but the growth rate slows down. This indicates that the ecosystem has begun to have preliminary self-regulation ability [10]. The management response at this stage should be adjusted to the limited consolidation strategy. Managers should gradually reduce high-intensity engineering intervention and focus on the optimization of community structure and the improvement of species diversity [53]. Through moderate tending management, they should promote the succession of plant communities from pioneer species to climax communities, enhance the system’s resistance to adversity, and prevent ecological dependence caused by excessive artificial intervention [54].
Stable restoration period: Realize system self-maintenance of zero interference. In the stable restoration period of evolution, the system is affected by climate drive and enters the system self-maintenance state. At this time, the vegetation restoration level reaches a high level and remains stable, and the artificial intervention intensity drops to the lowest (close to zero) [9]. The management implication of this stage is to adopt the zero interference strategy. This means that the reconstructed vegetation has complete ecological functions and self-renewal ability, and managers should withdraw from the dominant position and only retain long-term ecological monitoring [55]. The focus at this time is no longer construction but protection, allowing natural processes to dominate the material cycle and energy flow of the ecosystem, and realizing the long-term stability and sustainable service function of the mining area ecosystem [56].

4.3. Limitations and Prospects

Grounded in a multi-dimensional “morphology–structure–function” integrative framework, this study introduces a novel RRCI. The conceptual underpinning of this index extends beyond mine reclamation per se, being instead rooted in the general successional dynamics that govern vegetation ecosystem recovery. Through the quantitative delineation of three pivotal phases in the evolutionary trajectory of reconstructed vegetation, the proposed index offers essential scientific support for the precision-oriented management of ecological vegetation restoration efforts. However, this study has some limitations. First, a notable gap exists in the linkage between macro- and micro-scale observational data. This study relies primarily on remote sensing data to derive the RRCI, enabling a relatively systematic analysis of the macro-scale characteristics of vegetation recovery. However, it suffers from notable deficiencies in monitoring micro-scale ecological processes, particularly due to the lack of concurrent observations of key ecological parameters such as soil physicochemical properties, microbial activity, and plant community structure. This scale mismatch between macro- and micro-level data may constrain accurate understanding of the underlying drivers of vegetation recovery. In future work, extended field investigations within the mining area are planned, through which multi-source observational data will be leveraged to achieve cross-validation of the remotely sensed findings, thereby enhancing their ecological interpretability. Second, the generalizability of our findings beyond the current study area requires further validation. This study is based on a case analysis of the southern dump at the Antaibao opencast coal mine within the Pingshuo mining area. The stage division thresholds and configuration optimization conclusions derived herein are constrained by the specific hydrothermal conditions and reclamation practices characteristic of the semi-arid Loess Plateau region. As such, their applicability may be limited when extended to mining areas situated in different climatic zones, under contrasting geological conditions, or employing alternative reclamation approaches. Future work could pursue comparative studies across representative mining areas in different ecological regions, with the aim of progressively establishing more generalizable stage division criteria that can provide theoretical support for differentiated reclamation management in mining areas under varying climatic regimes [57,58].

5. Conclusions

Based on Landsat time series remote sensing data covering the Pingshuo opencast coal mine on the Loess Plateau from 1990 to 2023, this study constructed a multi-dimensionally integrated RRCI of “morphology–structure–function” and designed criteria for quantitatively identifying critical stages of reconstructed vegetation evolution based on the long-term evolutionary law of RRCI. The results show that there are 11 effective sample plot units in the study area that meet the screening conditions for simulating the reconstructed vegetation evolution process, including six arbor forest lands and five arbor shrub forest lands. The time series RRCI data of each screened sample plot unit can effectively characterize the spatiotemporal restoration dynamics of reconstructed vegetation, with a high model goodness of fit (R2 > 0.7). According to the criteria for delineating critical stages of reconstructed vegetation restoration, the average duration of the accelerated development period, consolidation development period, and recovery development period of reconstructed vegetation in the study area are 5.09 years, 4.64 years, and 9.73 years, respectively; among them, the average duration of the accelerated development period of arbor forest lands is 8 years, and the consolidation development period is 5.17 years; the average duration of the accelerated development period of arbor shrub forest lands is 1.6 years, and the consolidation development period is 4 years. There are significant differences in the accelerated development period and recovery development period between arbor forest lands and arbor shrub forest lands (p < 0.05), and the years required for vegetation restoration at each stage in arbor forest lands are longer than those in arbor shrub forest lands. The study shows that vegetation configuration mode is a key factor affecting vegetation restoration rate, and the vegetation restoration rate between different modes is also significantly different in different evolutionary stages. Based on this, this study proposes a dynamic management strategy of “minimal disturbance, intensive restoration, limited consolidation, and zero interference”, aiming to achieve organic synergy between artificial guidance and natural restoration through precise intervention matching vegetation succession laws, thereby providing scientific guidance for the long-term stability and sustainable development of opencast mining area ecosystems.

Author Contributions

Conceptualization, Y.G. and W.S.; methodology, J.Y. and K.Q.; software, J.Y.; validation, K.Q. and W.S.; formal analysis, K.Q.; investigation, J.Y.; resources, W.S.; data curation, J.Y.; writing—original draft preparation, Y.G.; writing—review and editing, W.S.; visualization, Z.B.; supervision, Z.B.; project administration, Y.G.; funding acquisition, Y.G. All authors have read and agreed to the published version of the manuscript.

Funding

This research was funded by Humanities and Social Science Fund of Ministry of Education of China (grant no. 23YJCZH060) and National Natural Science Foundation of China (grant nos. 42401333).

Data Availability Statement

The data that support the findings of this study are available on request from the corresponding author. The data are not publicly available due to privacy or ethical restrictions.

Conflicts of Interest

The authors declare no conflict of interest.

References

  1. Zhang, C.; Li, F.; Li, J.; Zhang, K.; Ran, W.; Du, M.; Guo, J.; Hou, G. Assessing the effect, attribution, and potential of vegetation restoration in open-pit coal mines’ dumping sites during 2003–2020 utilizing remote sensing. Ecol. Indic. 2023, 155, 111003. [Google Scholar] [CrossRef]
  2. Xiao, W.; Ren, H.; Sui, T.; Zhang, H.; Zhao, Y.; Hu, Z. A drone- and field-based investigation of the land degradation and soil erosion at an opencast coal mine dump after 5 years’ evolution of natural processes. Int. J. Coal Sci. Technol. 2022, 9, 42. [Google Scholar] [CrossRef]
  3. Buchbauerová, L.; Lange, C.A.; Heinkele, T.; Cajthaml; Frouz, J. Soil development under different tree species in relation to tree properties, a case study from post-mining sites in Eastern Germany. Ecol. Eng. 2026, 227, 107965. [Google Scholar] [CrossRef]
  4. Shi, Y.; Feng, Y.; Wang, J.; Bai, Z.; Feng, X.; Chen, B. Optimal allocation of technical reclamation and ecological restoration for a cost-effective solution in Pingshuo Opencast Coal Mine area of China. J. Environ. Manag. 2025, 373, 123951. [Google Scholar] [CrossRef]
  5. Hu, X.; Xu, H. A new remote sensing index based on the pressure-state-response framework to assess regional ecological change. Environ. Sci. Pollut. Res. Int. 2019, 26, 5381–5393. [Google Scholar] [CrossRef] [PubMed]
  6. Bai, Z.; Wang, W.; Li, J.; Lu, C. Ecological rehabilitation of drastically disturbed land at large opencut coal mine in loess area. Chin. J. Appl. Ecol. 1998, 9, 621–626. (In Chinese) [Google Scholar]
  7. Wang, J.; Ying, L.; Zhong, L. Thinking for the transformation of land consolidation and ecological restoration in the new era. J. Nat. Resour. 2020, 35, 26–36. (In Chinese) [Google Scholar] [CrossRef]
  8. Yuan, Y.; Li, Q.; Yuan, Y.; Zhao, J.; Yang, R.; Yang, Y.; Wu, Y. Synergistic effects of mixed Robinia-Pinus plantations enhance soil carbon sequestration and microbial functional potential in a 32-year-old reclaimed coal mine. Ecol. Eng. 2026, 223, 107837. [Google Scholar] [CrossRef]
  9. Xie, J.; Liu, Y.; Xie, M.; Xia, L.; Yang, R.; Li, J. Exploring the restoration stability of abandoned open-pit mines by vegetation resilience indicator based on the LandTrendr algorithm. Ecol. Indic. 2024, 166, 112392. [Google Scholar] [CrossRef]
  10. Guan, Y.; Wang, J.; Zhou, W.; Bai, Z.; Cao, Y. Delimiting supervision zones to inform the revision of land reclamation management modes in coal mining areas: A perspective from the succession characteristics of rehabilitated vegetation. Land Use Policy 2023, 131, 106729. [Google Scholar] [CrossRef]
  11. Xu, R.; Fan, Y.; Fan, B.; Feng, G.; Li, R. Classification and Monitoring of Salt Marsh Vegetation in the Yellow River Delta Based on Multi-Source Remote Sensing Data Fusion. Sensors 2025, 25, 529. [Google Scholar] [CrossRef] [PubMed]
  12. Wang, X.; Nian, Y.; Wang, H.; Chen, J.; Li, K.; Hu, T.; Li, Z. Monitoring of ecological environment changes in open-pit mines on the Loess Plateau from 1990 to 2023 based on RSEI. Ecol. Indic. 2025, 170, 113064. [Google Scholar] [CrossRef]
  13. Yang, Y.; Erskine, P.D.; Lechner, A.M.; Mulligan, D.; Zhang, S.; Wang, Z. Detecting the dynamics of vegetation disturbance and recovery in surface mining area via Landsat imagery and LandTrendr algorithm. J. Clean. Prod. 2018, 178, 353–362. [Google Scholar] [CrossRef]
  14. Song, W.; Song, W.; Gu, H.; Li, F. Progress in the Remote Sensing Monitoring of the Ecological Environment in Mining Areas. Int. J. Environ. Res. Public Health 2020, 17, 1846. [Google Scholar] [CrossRef] [PubMed]
  15. Jibananda, G.; Debajit, D. Application of pressure–state–response approach for developing criteria and indicators of ecological health assessment of wetlands: A multi-temporal study in Ichhamati floodplains, India. Ecol. Process. 2023, 12, 34. [Google Scholar] [CrossRef]
  16. Wang, H.; Xie, M.; Li, H.; Feng, Q.; Bai, Z. Monitoring ecosystem restoration of multiple surface coal mine sites in China via Landsat images on Google Earth Engine. Land Degrad. Dev. 2021, 32, 2936–2950. [Google Scholar] [CrossRef]
  17. Liu, X.; Cao, Y.; Bai, Z.; Wang, J.; Zhou, W. Evaluating relationships between soil chemical properties and vegetation cover at different slope aspects in a reclaimed dump. Environ. Earth Sci. 2017, 76, 805. [Google Scholar] [CrossRef]
  18. Fan, X.; Guan, Y.; Bai, Z.; Zhou, W.; Zhu, C. Optimization of Reclamation Measures in a Mining Area by Analysis of Variations in Soil Nutrient Grades under Different Types of Land Usage—A Case Study of Pingshuo Coal Mine, China. Land 2022, 11, 321. [Google Scholar] [CrossRef]
  19. Gorelick, N.; Hancher, M.; Dixon, M.; Ilyushchenko, S.; Thau, D.; Moore, R. Google Earth Engine: Planetary-scale geospatial analysis for everyone. Remote Sens. Environ. 2017, 202, 18–27. [Google Scholar] [CrossRef]
  20. Zhang, X.; Wang, T.; Han, X. Spatiotemporal monitoring in beidagang wetland using Landsat time-series images and Google Earth Engine during 2000–2022. Front. Remote Sens. 2025, 6, 1569617. [Google Scholar] [CrossRef]
  21. Lu, J.; Ma, C.; Cui, Z.; Ma, W.; Li, T. The Trend of Coal Mining-Disturbed CDR AVHRR NDVI (1982–2022) in a Plain Agricultural Region—A Case Study on Yongcheng Coal Mine and Its Buffers in China. Agriculture 2024, 14, 2051. [Google Scholar] [CrossRef]
  22. Lück, W.; Niekerk, A.V. Evaluation of a rule-based compositing technique for Landsat-5 TM and Landsat-7 ETM+ images. Int. J. Appl. Earth Obs. Geoinf. 2016, 47, 1–14. [Google Scholar] [CrossRef]
  23. Maxwell, S.K.; Sylvester, K.M. Identification of “ever-cropped” land (1984–2010) using Landsat annual maximum NDVI image composites: Southwestern Kansas case study. Remote Sens. Environ. 2012, 121, 186–195. [Google Scholar] [CrossRef] [PubMed]
  24. Chen, Q.; Chen, Y. A Study on Estimation of Vegetation Fraction by Using QuickBird Imagery. For. Res. 2005, 18, 375–380. (In Chinese) [Google Scholar]
  25. Liu, Y.; Huang, B.; Cheng, T.; Qu, L. Vegetation Coverage in Upper Huaihe River Basin Based on Binary Pixel Model of Remote Sensing. Bull. Soil Water Conserv. 2012, 32, 93–97+267. (In Chinese) [Google Scholar]
  26. Xie, M.; Gao, S.; Li, S.; Zhou, Y.; Bai, Z.; Zhang, Y. Construction and spatiotemporal variation of dump reclamation disturbance index. Trans. Chin. Soc. Agric. Eng. 2019, 35, 258–265. (In Chinese) [Google Scholar]
  27. Fan, D.; Qiu, Y.; Sun, W.; Zhao, X.; Mai, X.; Hu, Y. Evaluating ecological environment based on remote sensing ecological index in Shenfu mining area. Bull. Surv. Mapp. 2021, 7, 23–28. (In Chinese) [Google Scholar] [CrossRef]
  28. Ji, X.; Yan, Y.; Guo, W.; Teng, Y.; Zhao, C. Ecological environment assessment of Shanxi Province and planned mining area based on coupling Remote Sensing Ecological Index (RSEI) model. Coal Geol. Explor. 2023, 51, 103–112. (In Chinese) [Google Scholar]
  29. Chen, Y.; Cao, C.; Xu, M.; Xie, B.; Zhang, J. Remote sensing diagnosis of ecological health in typical coal mining areas. Bull. Surv. Mapp. 2023, 1, 71–76+94. (In Chinese) [Google Scholar]
  30. Viovy, N.; Arino, O.; Belward, A.S. The best index slope extraction (BISE)—A method for reducing noise in ndvi time-series. Int. J. Remote Sens. 1992, 13, 1585–1590. [Google Scholar] [CrossRef]
  31. Yang, Z.; Li, J.; Shen, Y.; Miao, H.; Yan, X. A denoising method for inter-annual NDVI time series derived from Landsat images. Int. J. Remote Sens. 2018, 39, 3816–3827. [Google Scholar] [CrossRef]
  32. Guan, Y.; Wang, J.; Zhou, W.; Cao, Y.; Bai, Z. Adaptive Management of Land Reclamation in Opencast Mining Areas: Connotation Analysis and Framework Construction. China Land Sci. 2023, 37, 102–112. (In Chinese) [Google Scholar]
  33. Lai, S.; Hu, J.; Kang, J.; Wang, X. Ecological evolution of coal resource-based regions: A case study of Shanxi Province. Remote Sens. Nat. Resour. 2024, 36, 62–74. (In Chinese) [Google Scholar] [CrossRef]
  34. Liu, Y. Study on Guided Restoration of Damaged Vegetation in Semi-Arid Coal Mine Area. Doctoral Dissertation, China University of Mining and Technology, Xuzhou, China, 2020. (In Chinese) [Google Scholar]
  35. Zhang, L.; Wang, J.; Liu, T. Landscape Reconstruction and Recreation of Damaged Land in Opencast Coal Mine: A Review. Adv. Earth Sci. 2016, 31, 1235–1246. (In Chinese) [Google Scholar] [CrossRef]
  36. Umbrello, G.; Pinzani, R.; Bandera, A.; Formenti, F.; Zavarise, G.; Arghittu, M.; Girelli, D.; Maraschini, A.; Muscatello, A.; Marchisio, P.; et al. Hookworm infection in infants: A case report and review of literature. Ital. J. Pediatr. 2021, 47, 26. [Google Scholar] [CrossRef] [PubMed]
  37. Kulkarni, A.; von Storch, H. Monte Carlo experiments on the effect of serial correlation on the Mann-Kendall test of trend. Meteorol. Z. 1995, 4, 82–85. [Google Scholar] [CrossRef]
  38. Shackelford, N.; Miller, B.; Erickson, T. Restoration of Open-Cut Mining in Semi-Arid Systems: A Synthesis of Long-Term Monitoring Data and Implications for Management. Land Degrad. Dev. 2018, 29, 994–1004. [Google Scholar]
  39. Yang, Y.; Tang, J.; Zhang, Y.; Zhang, S.; Zhou, Y.; Hou, H.; Liu, R. Reforestation improves vegetation coverage and biomass, but not spatial structure, on semi-arid mine dumps. Ecol. Eng. 2022, 175, 106508. [Google Scholar] [CrossRef]
  40. Guan, Y.; Zhou, W.; Bai, Z.; Cao, Y.; Wang, J. Delimitation of supervision zones based on the soil property characteristics in a reclaimed opencast coal mine dump on the Loess Plateau, China. Sci. Total Environ. 2021, 772, 145006. [Google Scholar] [CrossRef] [PubMed]
  41. Wang, J.; Ouyang, J.; Zhang, M. Spatial distribution characteristics of soil and vegetation in a reclaimed area in an opencast coalmine. Catena 2020, 195, 104773. [Google Scholar] [CrossRef]
  42. Zhou, W.; Guan, Y.; Liu, Q.; Fan, Y.; Bai, Z.; Shi, X.; Hu, Y.; Huang, Y.; Bai, D. Diagnosis of ecological problems and exploration of ecosystem restoration practices in the typical watershed of loess plateau: A case study of the pilot project in the middle and upper reaches of Fen River in Shanxi Province. ACTA Ecol. Sin. 2019, 39, 8817–8825. (In Chinese) [Google Scholar] [CrossRef]
  43. Yuan, Y.; Zhao, Z.; Bai, Z.; Wang, H.; Xu, Z.; Niu, S. Niche characteristics of dominant herbaceous species under different land reclamation patterns in Antaibao Opencast Coal Mine. Chin. J. Ecol. 2016, 35, 3215–3222. (In Chinese) [Google Scholar]
  44. Li, Y.; Huang, T.; Zhang, H.; Wen, C.; Yang, S.; Lin, Z.; Gao, X. Succession Characteristics of Algae Functional Groups and Water Quality Assessment in a Drinking Water Reservoir. Environ. Sci. 2020, 41, 2158–2165. [Google Scholar]
  45. Fan, X.; Song, Y.; Zhu, C.; Balzter, H.; Bai, Z. Estimating Ecological Responses to Climatic Variability on Reclaimed and Unmined Lands Using Enhanced Vegetation Index. Remote Sens. 2021, 13, 1100. [Google Scholar] [CrossRef]
  46. Shang, Y.; Wang, D.; Li, H. Identification of Priority Areas for Ecological Restoration Based on Ecosystem Service Bundles and Human Activity Footprint in Western Jilin, China. Land 2024, 13, 2061. [Google Scholar] [CrossRef]
  47. Vacek, Z.; Cukor, J.; Vacek, S.; Linda, R.; Prokůpková, A.; Podrázský, V.; Gallo, J.; Vacek, O.; Šimůnek, V.; Drábek, O.; et al. Production potential, biodiversity and soil properties of forest reclamations: Opportunities or risk of introduced coniferous tree species under climate change? Eur. J. For. Res. 2021, 140, 1243–1266. [Google Scholar] [CrossRef]
  48. Moreno-Mateos, D.; Alberdi, A.; Morrien, E.; Putten, W.H.; Rodriguez-Una, A.; Montoya, D. The long-term restoration of ecosystem complexity. Nat. Ecol. Evol. 2020, 4, 676–685. [Google Scholar] [CrossRef] [PubMed]
  49. Shi, P.; Liu, Y.; Yang, Z.; Guo, J.; Liu, H. Research Progress and Prospect of Vegetation Restoration in Mining Areas. J. Green Sci. Technol. 2022, 24, 189–194. (In Chinese) [Google Scholar]
  50. An, W.; Lu, Y.; Xie, W.; Gao, Y.; Yin, Z. Mixed Sowing of Arbor, Shrub and Herbs Seeds Based on Near Natural Vegetation Restoration. Soil Water Conserv. China 2021, 8, 40–43+9. (In Chinese) [Google Scholar]
  51. Yang, Z.; Li, J.; Yin, S.; Shen, Y. A method of identifying mining disturbance in arid or semi-arid steppe using inter-annual Landsat images-a case study in north-eastern China. Remote Sens. Lett. 2018, 9, 1224–1232. [Google Scholar] [CrossRef]
  52. Yang, Z.; Li, J.; Zipper, C.E.; Shen, Y.; Miao, H.; Donovan, P.F. Identification of the disturbance and trajectory types in mining areas using multitemporal remote sensing images. Sci. Total Environ. 2018, 644, 916–927. [Google Scholar] [CrossRef] [PubMed]
  53. Zhou, B.; Okin, G.S.; Zhang, J. Leveraging Google Earth Engine (GEE) and machine learning algorithms to incorporate in situ measurement from different times for rangelands monitoring. Remote Sens. Environ. 2020, 236, 111521. [Google Scholar] [CrossRef]
  54. Fang, X.; Xue, Z.; Li, B.; An, S. Soil organic carbon distribution in relation to land use and its storage in a small watershed of the Loess Plateau, China. Catena 2011, 88, 6–13. [Google Scholar]
  55. Aronson, J. Ecological restoration and ecological engineering: Complementary or indivisible? Ecol. Eng. 2016, 91, 392–395. [Google Scholar] [CrossRef]
  56. Yang, G.; Zhang, H.; Maus, V.; Su, C.; Zhang, X. Dynamic coupling of habitat quality and landscape ecological risk for sustainable ecosystem management in open-pit mining area. Environ. Monit. Assess. 2026, 198, 92. [Google Scholar] [CrossRef] [PubMed]
  57. Zhou, J.; Zhao, C.; Zhang, L.; Wang, L.; Wang, L. Research progress of land rehabilitation and soil remediation in mining area. J. N. Norm. Univ. (Nat. Sci. Ed.) 2023, 55, 151–156. (In Chinese) [Google Scholar]
  58. Li, Q.; Han, X.; Zhao, Y.; Lin, H.; Wang, X. Research on integration and application of key technologies of vegetation restoration in open-pit coal mine—A case study of external dump of Shengli opencast coal mine. Environ. Ecol. 2021, 3, 47–53. (In Chinese) [Google Scholar]
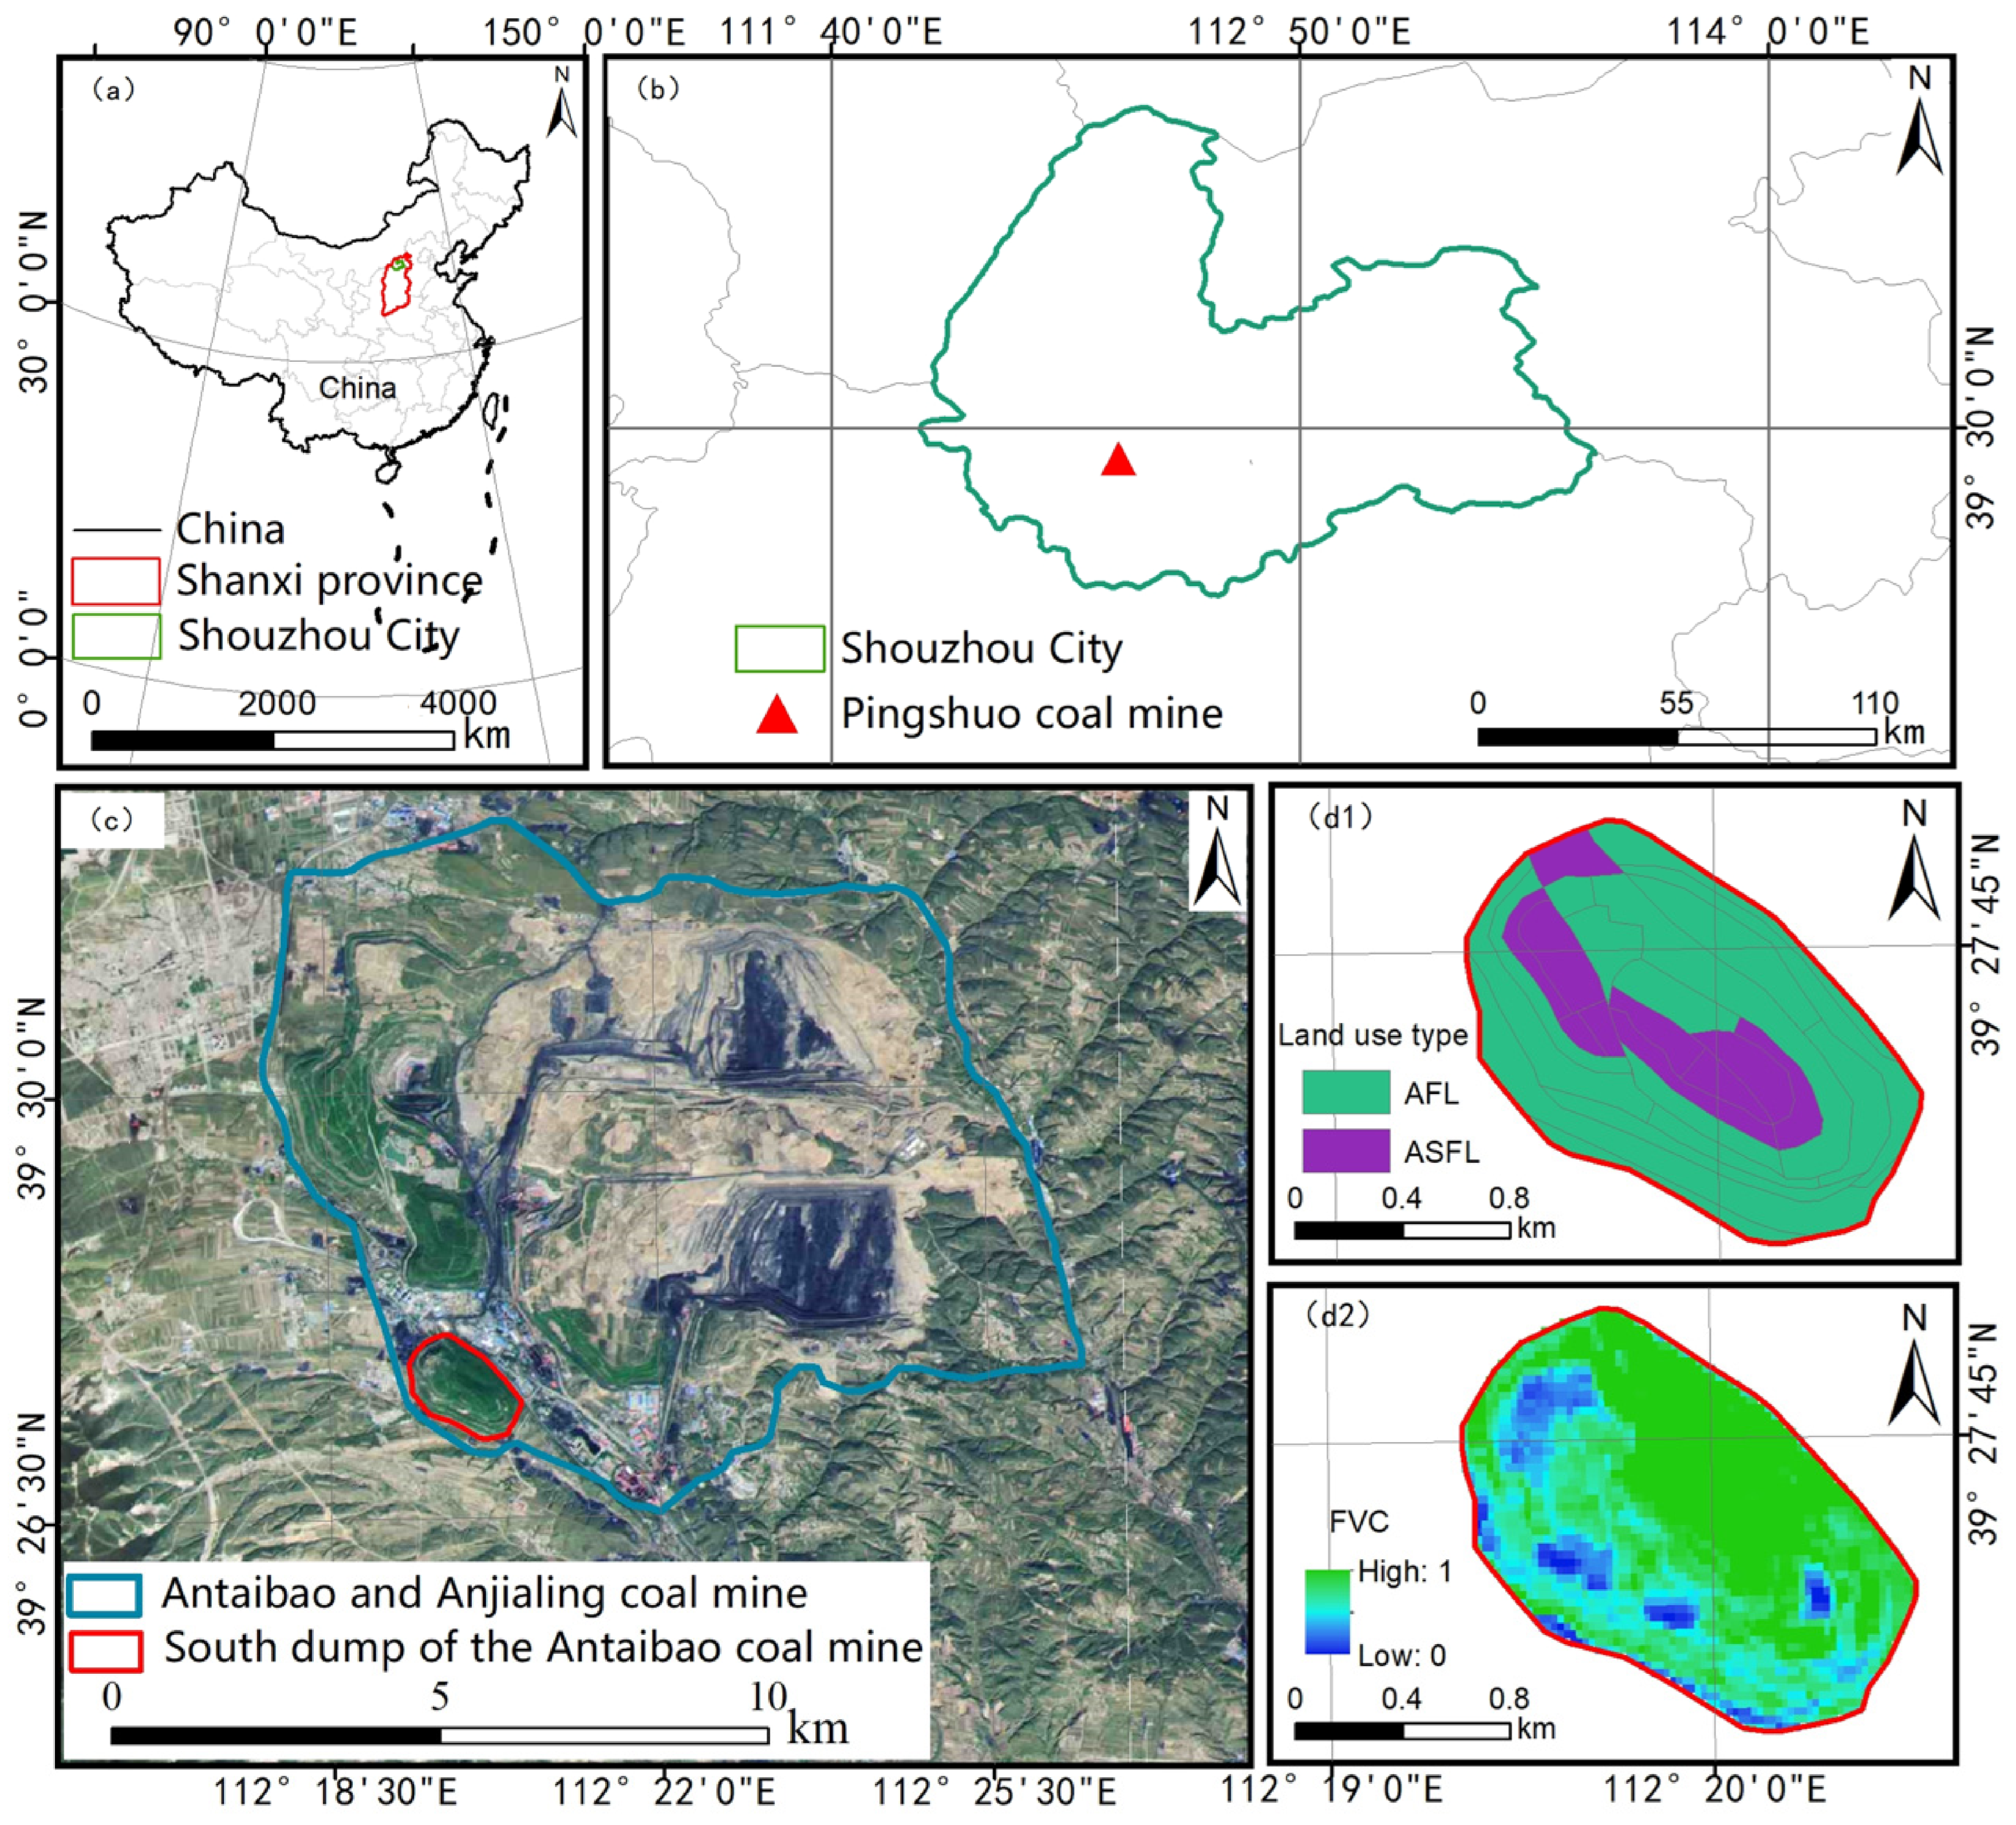
Figure 1. Location map of the Pingshuo opencast coal mine area. (a) The location of Shanxi Province in China; (b) the location of the Pingshuo opencast coal mine area in Shuozhou City; (c) remote sensing image of the Pingshuo opencast coal mine area, with the base map sourced from Gaode imagery via ArcGIS Online (ArcGIS 10.2); (d1) land use map and (d2) fractional vegetation cover (FVC) distribution map of the southern dump.
Land 15 01236 g001
Figure 2. Schematic diagram of critical stage division for the evolution trajectories of reconstructed vegetation. UP: unreclaimed period; ReDP: recovery development period; ADP: accelerated development period; CDP: consolidation development period; SRP: stable restoration period.
Land 15 01236 g002
Figure 3. Restoration trends of reconstructed vegetation in the study area from 1990 to 2023 across three dimensions. (A) Spatial distribution maps of three-dimensional restoration of reconstructed vegetation in the study area for 1990, 2001, 2012, and 2023; (B) statistical plots of mean values of three-dimensional restoration of reconstructed vegetation in the study area for 1990, 2001, 2012, 2023, and the entire period of 1990–2023; (C) temporal evolution trend plot of three-dimensional restoration of reconstructed vegetation in the study area from 1990 to 2023.
Land 15 01236 g003
Figure 4. Spatial distribution map of the RRCI for reconstructed vegetation at the southern dump from 1990 to 2023.
Land 15 01236 g004
Figure 5. S-logistic function fitting trend results for the RRCI of arbor forest land at the southern dump.
Land 15 01236 g005
Figure 6. S-logistic function fitting trend of the RRCI in the southern dump’ s arboreal forest.
Land 15 01236 g006
Figure 7. Schematic diagram of anthropogenic intervention intensity and vegetation restoration trajectories across different stages. UP: unreclaimed period; ADP: accelerated development period; CDP: consolidation development period; SRP: stable restoration period.
Land 15 01236 g007
Table 1. Importance ranking matrix of “morphology–structure–function” for reconstructed vegetation in opencast mining areas.
Vegetation IndicatorVFCMLRIRSEI
VFCEqually importantLess importantMore important
MLRIMore importantEqually importantStrongly important
RSEILess importantWeak importantEqually important
Table 2. Descriptive statistical analysis of the RRCI for reconstructed vegetation at the southern dump from 1990 to 2023.
YearMax.Min.MeanMedianSDCV
19900.16540.05710.09440.09440.02400.2538
19910.56980.10040.19370.14430.12250.6326
19920.73610.11140.21680.18440.12320.5686
19930.63510.09960.20450.17180.11440.5595
19940.96440.24640.61280.63870.23310.3804
19950.98450.24330.63350.63520.23760.3751
19960.99790.28030.77950.88660.21740.2789
19970.99480.26010.72890.78190.21760.2985
19980.99330.32120.77150.84400.17300.2243
19990.97180.29440.73830.77970.17090.2314
20000.95330.26620.70720.72630.18400.2602
20010.78190.20070.49810.49750.14770.2966
20020.98470.26400.74820.80710.20110.2687
20031.00000.28470.79640.83870.19160.2406
20040.99380.30140.81180.88490.18050.2223
20050.98310.36270.80030.85760.14760.1845
20060.97070.30430.75540.78560.16710.2212
20071.00000.43200.88200.94520.13350.1514
20080.99870.37060.84590.84880.15410.1821
20090.98960.34030.81410.81230.14980.1840
20100.97030.34240.73870.75600.18170.2460
20110.99160.42040.83650.83450.14100.1685
20120.99970.40580.85740.85650.13350.1557
20131.00000.46900.87950.90660.12070.1372
20140.95020.35200.76290.77710.14570.1909
20150.97970.35450.77160.77500.16130.2091
20160.98480.42240.81380.84860.14230.1748
20170.99620.43960.84360.84330.13570.1609
20180.99830.48220.89230.91970.11520.1291
20190.97700.41540.78480.78320.14620.1863
20200.96830.45190.77250.74800.14990.1941
20210.97870.52590.82470.80890.12120.1470
20220.96750.47160.82190.81340.11550.1405
20230.95630.40380.74170.73840.14480.1952
Note: SD, standard deviation; CV, coefficient of variation.
Table 3. S-logistic function fitting parameters table for the RRCI of reconstructed vegetation at various plots in the southern dump.
Land Use TypePlot NameaXckR2 (COD)Plot Exclusion
Arbor forest landPlot-B0.748191993.298530.885210.83916Retained
Plot-C0.753251995.024410.30090.74406Retained
Plot-D0.727581995.108430.390780.86833Retained
Plot-F0.870011993.001571.649430.81324Retained
Plot-I0.795521994.746090.384720.87363Retained
Plot-J0.885151993.539560.891730.91142Retained
Plot-L0.954221993.092611.515510.94334Retained
Plot-M0.511191998.04910.089320.81584Excluded
Plot-N0.738531996.598520.203240.82999Retained
Plot-O0.769061994.027490.290040.89177Retained
Plot-P0.760171990.913170.269740.66893Excluded
Plot-R0.926871993.415150.488170.85146Retained
Plot-S0.548921993.841080.234010.54264Excluded
Plot-T0.800921988.900710.096790.41035Excluded
Plot-X0.762441992.734981.469410.64013Excluded
Arbor shrub forest landPlot-A0.830541993.048816.842630.7658Retained
Plot-E0.887971996.498480.169190.8477Excluded
Plot-G0.922281993.259236.516360.88024Retained
Plot-H0.861881993.615112.822020.8879Retained
Plot-K0.954251993.59772.999740.95163Retained
Plot-Q0.936011993.678871.409990.94816Retained
Plot-U0.952981994.215091.617680.92826Retained
Plot-V0.903981994.521661.768460.88925Retained
Plot-W0.719111992.89771.119610.76371Retained
Plot-Y0.934451993.1080916.933720.89665Retained
Table 4. Critical stage results of reconstructed vegetation evolution for different land use types.
Land Use TypePlot NameAccelerated Development Node ( X c )Consolidation Development Node (G)Stable Development Node (W)Accelerated Development Period
(G-1994)
Consolidation Development Period (W-G)Recovery Development Period
(W-1994)
Arbor forest landPlot-C1995200320109716
Plot-D1995200120077613
Plot-I1995200120077613
Plot-J199419972001347
Plot-N19972008201214418
Plot-O1994200220068412
Arbor shrub forest landPlot-H199419951999145
Plot-K199419951999145
Plot-Q199419962000246
Plot-U199419962000246
Plot-V199519962000246
Table 5. Descriptive statistics of reconstructed vegetation evolution stages for different types.
Critical StagesLand Use TypeMax.Min.MeanSDSEMCV
Accelerated development period
  • Arbor forest land
1438.00 **3.571.460.45
  • Arbor shrub forest land
211.60 **0.550.240.34
  • Whole study area
1415.094.211.270.83
Consolidation development period
  • Arbor forest land
745.171.330.540.25
  • Arbor shrub forest land
444.000.000.000.00
  • Whole study area
744.641.120.340.24
Recovery development period
  • Arbor forest land
18713.17 **3.761.540.29
  • Arbor shrub forest land
655.60 **0.550.240.10
  • Whole study area
1859.734.781.440.49
Note: SD, standard deviation; SEM, standard error of the mean; CV, coefficient of variation; ** indicates highly significant differences in the years required for vegetation restoration to reach each stage between arbor forest land and arbor shrub forest land (p < 0.01).
Disclaimer/Publisher’s Note: The statements, opinions and data contained in all publications are solely those of the individual author(s) and contributor(s) and not of MDPI and/or the editor(s). MDPI and/or the editor(s) disclaim responsibility for any injury to people or property resulting from any ideas, methods, instructions or products referred to in the content.