Identifying Homogeneous Regions for Flash Floods Using Graph Clustering Neural Networks in Jiangxi Province, China


Abstract
1. Introduction
2. Materials and Methods
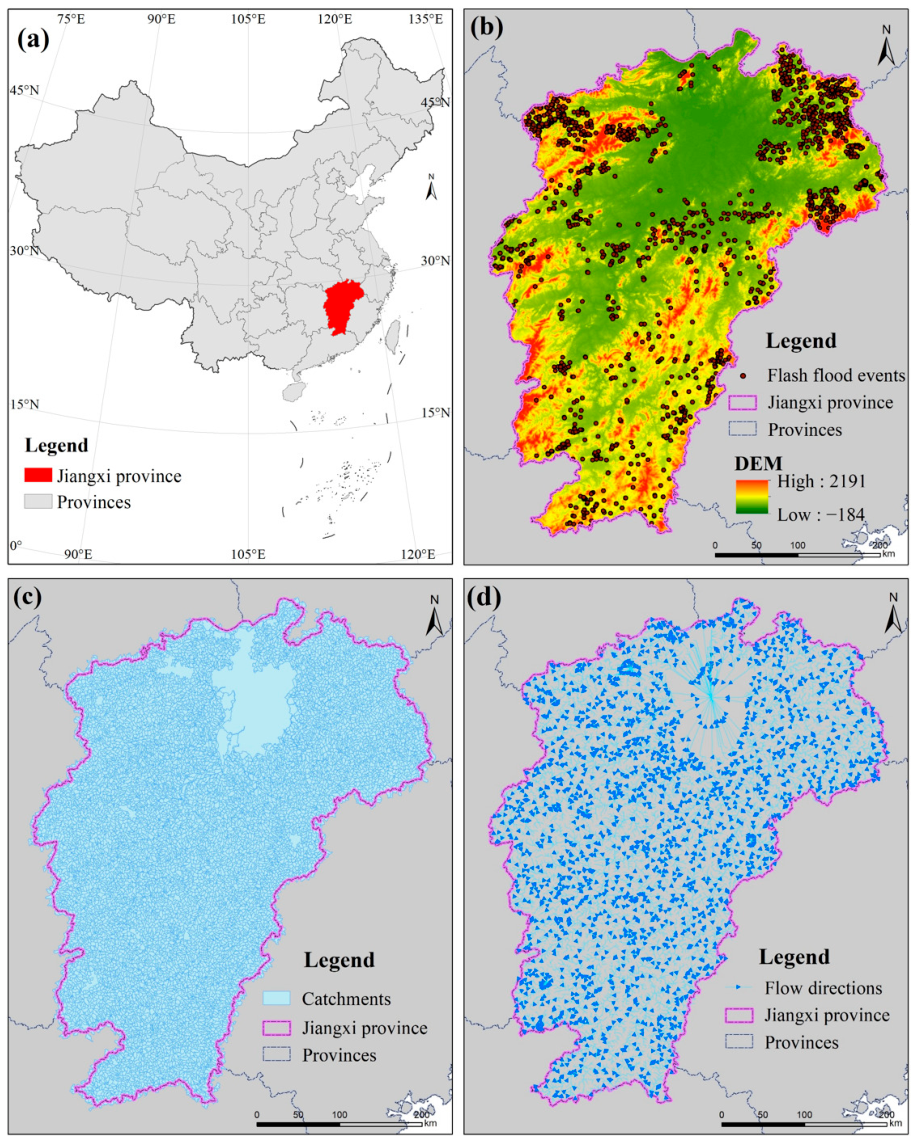
2.1. Case Study Area
2.2. Materials
2.2.1. Catchments and Their Flow Directions
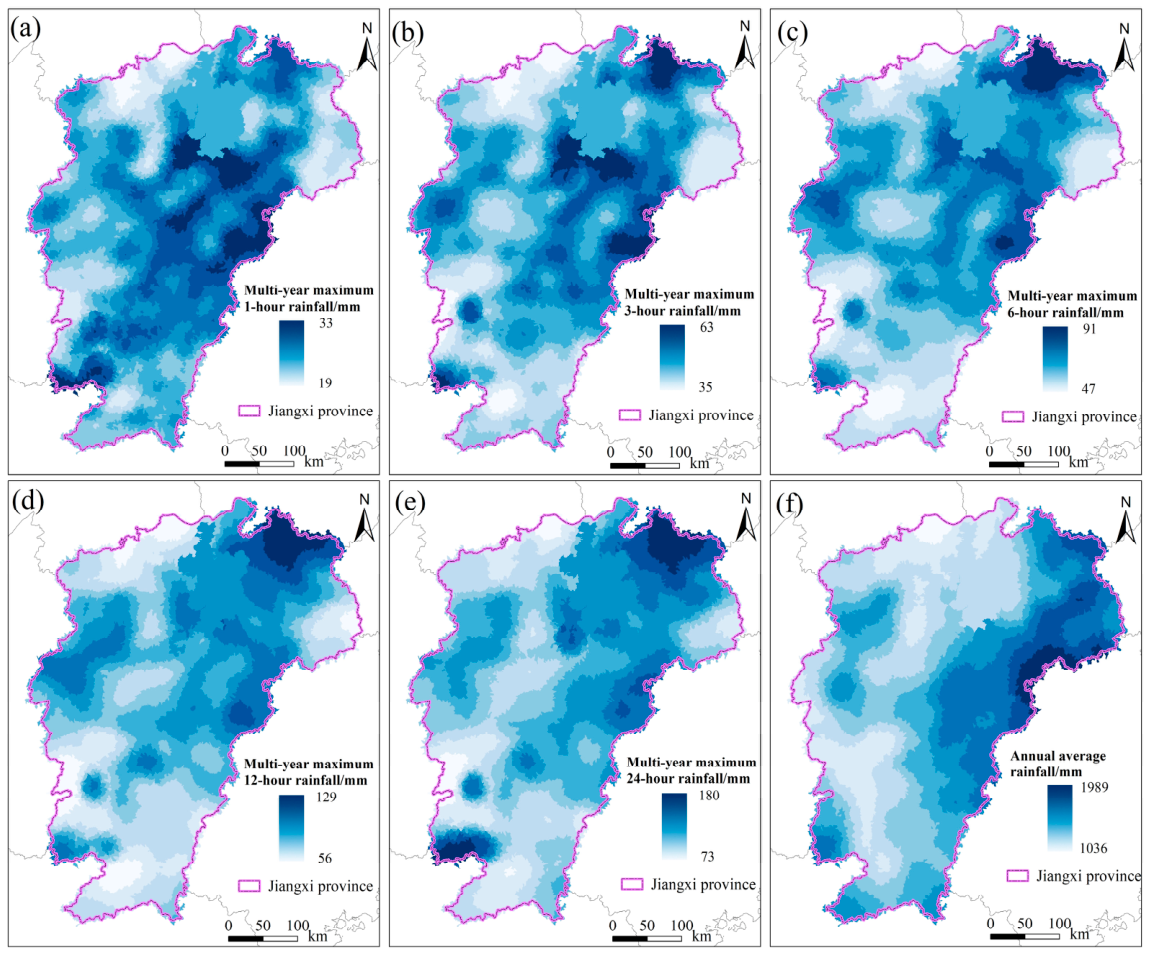
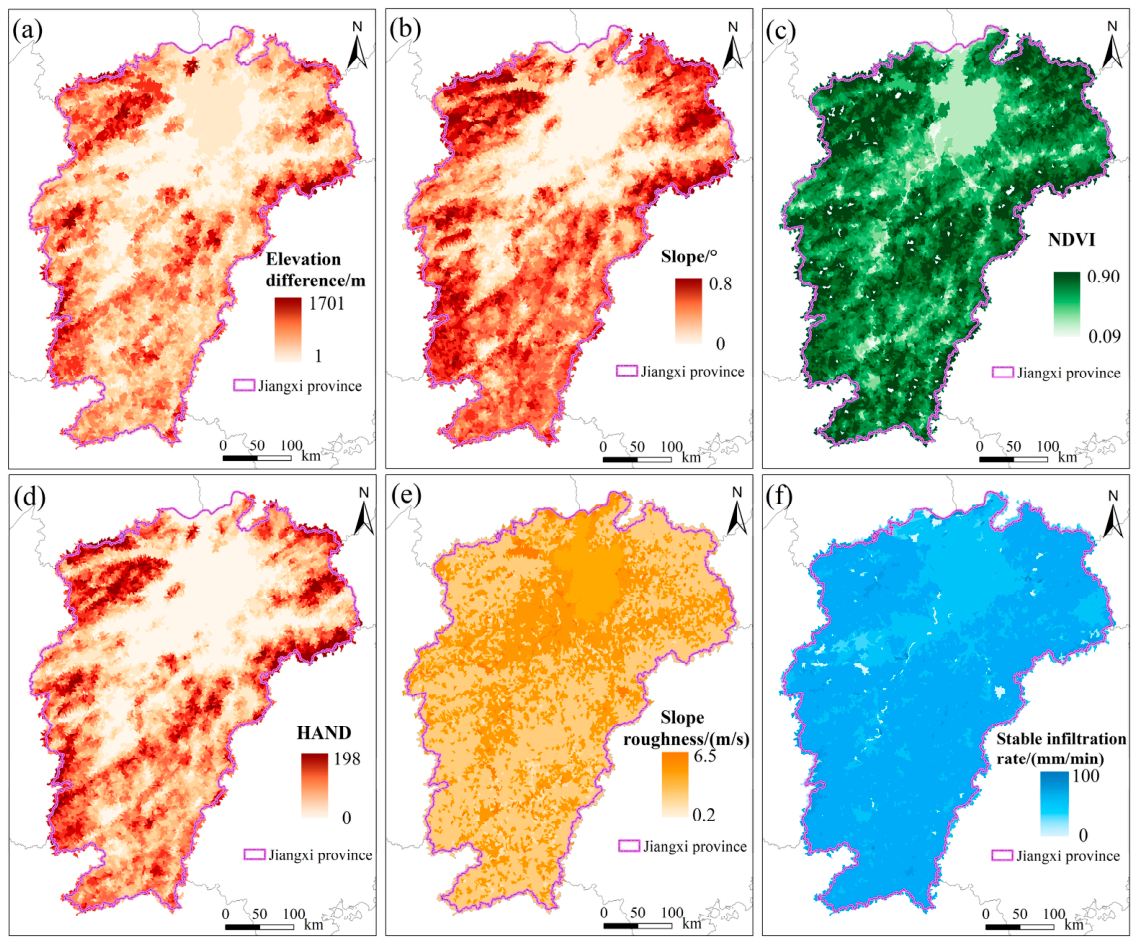
2.2.2. Flash Flood Factors
- (1)
- Meteorological factors
- (2)
- Underlying surface factors
2.2.3. Historical Flash Flood Events Inventory
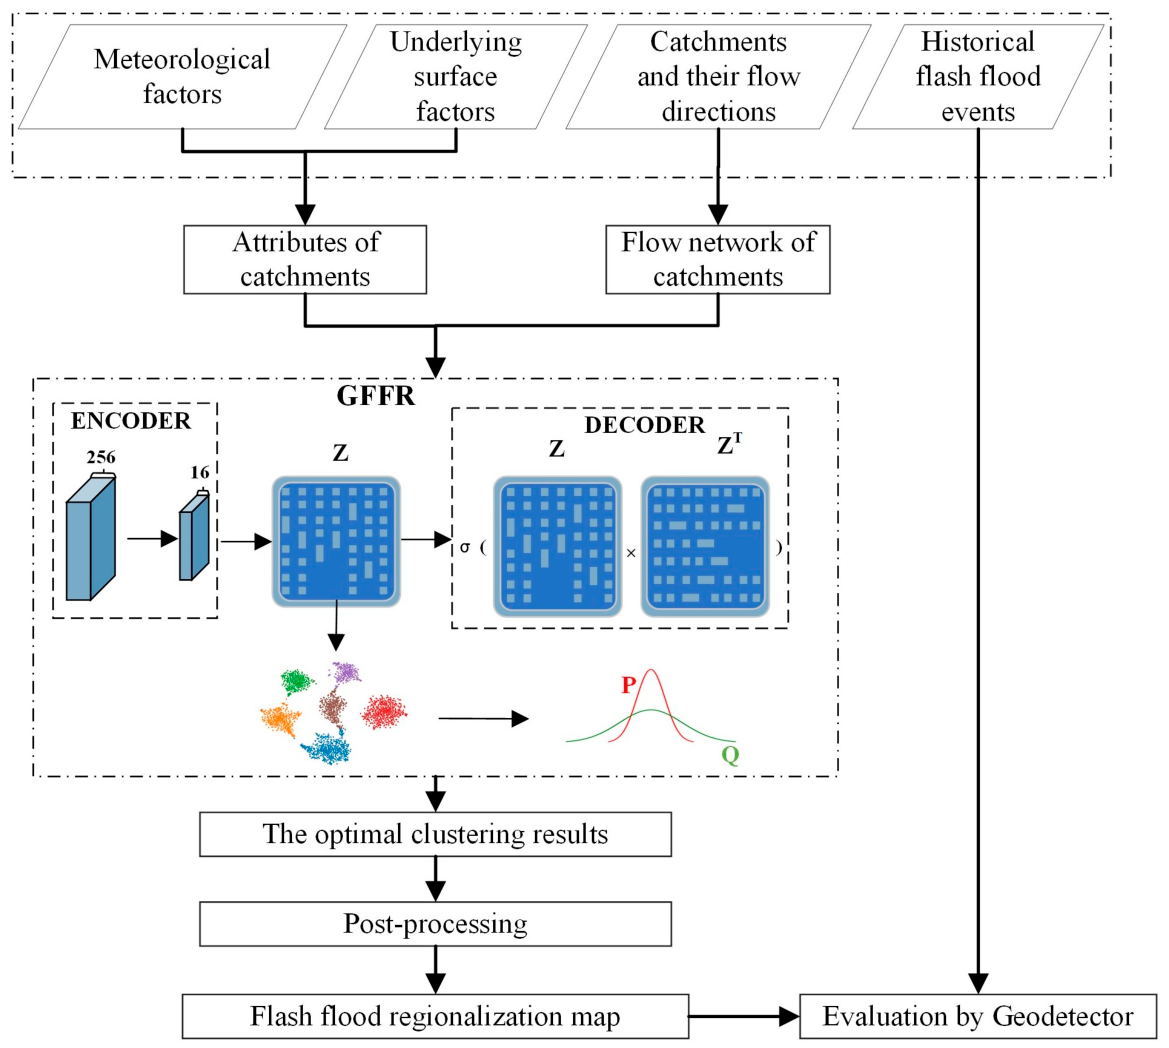
2.3. Methodology
- (1)
- Data preparation. Prepare data for flash flood regionalization, including catchments and their flow directions, meteorological factors, underlying surface factors, and historical flash flood events.
- (2)
- Data preprocessing. Preprocess the catchment-level meteorological and underlying surface factors as catchment attributes, and construct a directed graph using these attributes and flow directions.
- (3)
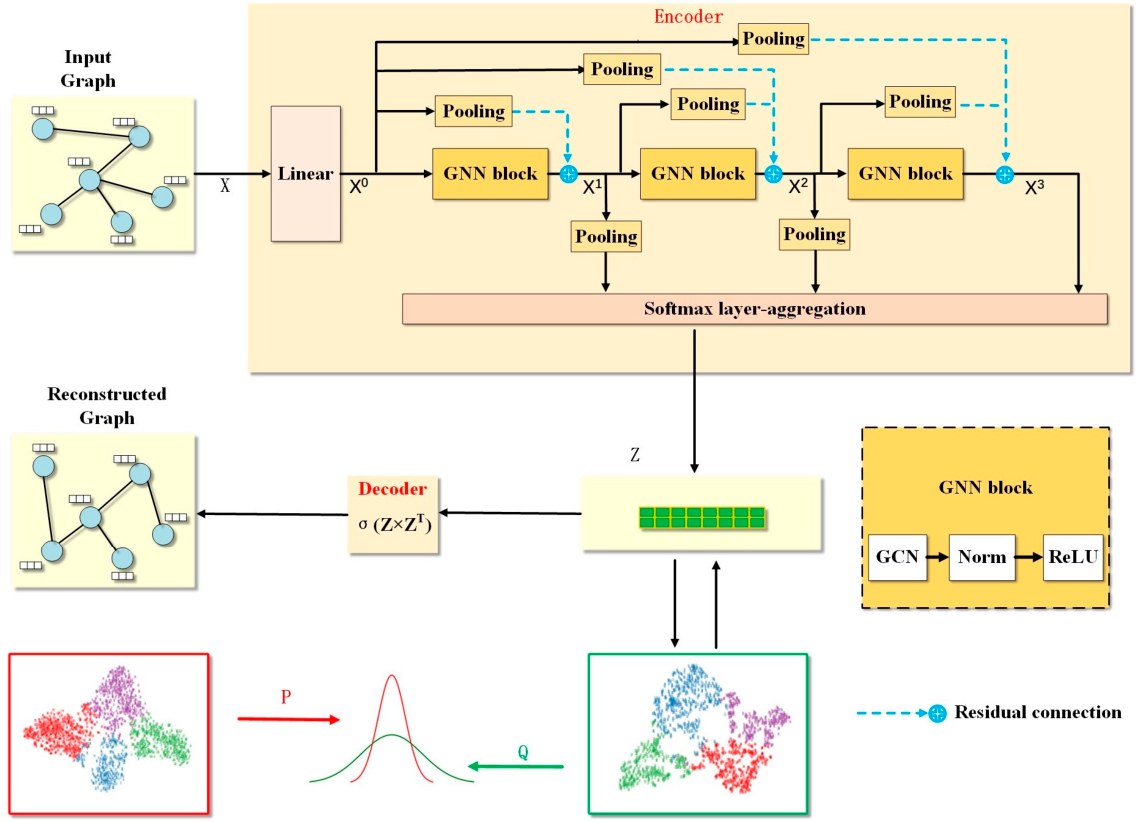
- Model construction and training. Build and train the GFFR on the directed graph to generate clustering results for flash floods in Jiangxi province using a predefined number of clusters. Inspired by the graph clustering [58], the GFFR inherits the widely used architecture of deep graph clustering models and consists of two main modules, an encoder module and a decoder module, as illustrated in Figure 4.
- (4)
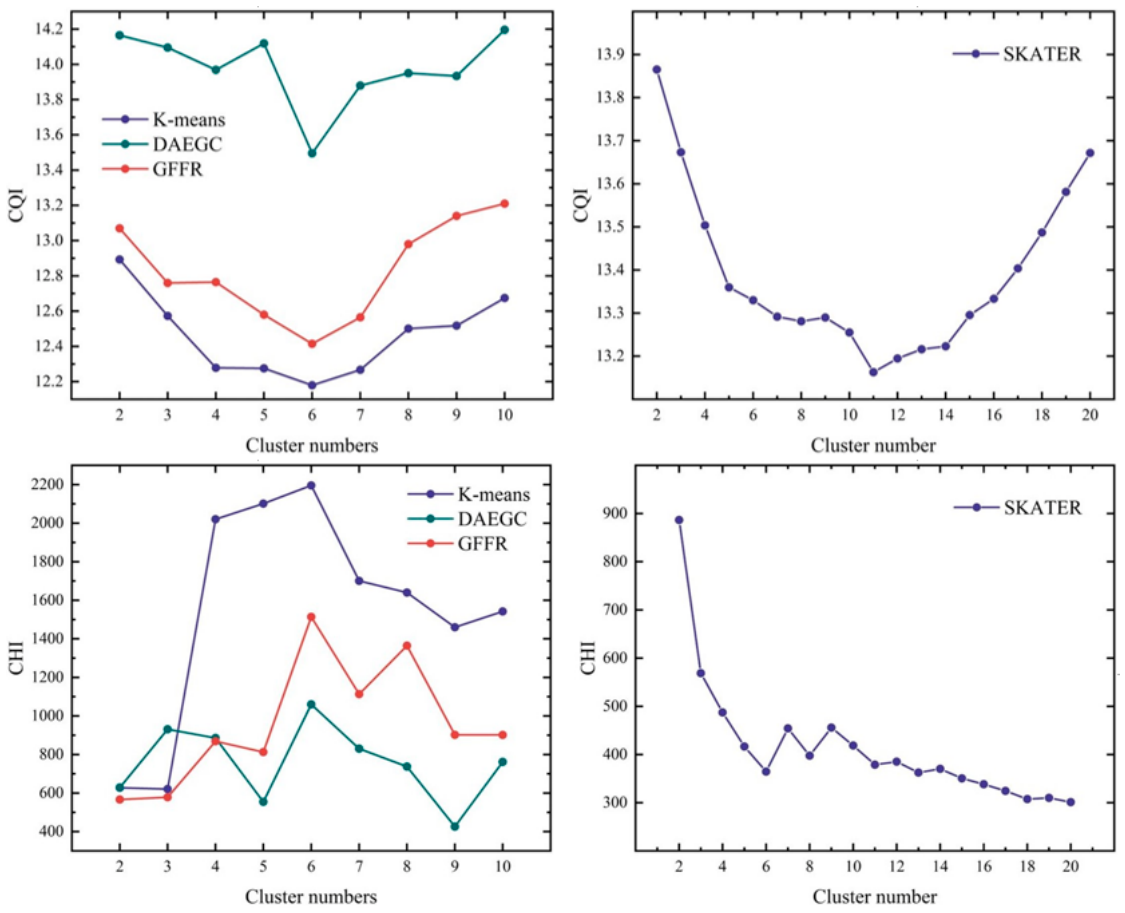
- Cluster optimization. Calculate the clustering validity indexes to determine the optimal number of clusters.
- (5)
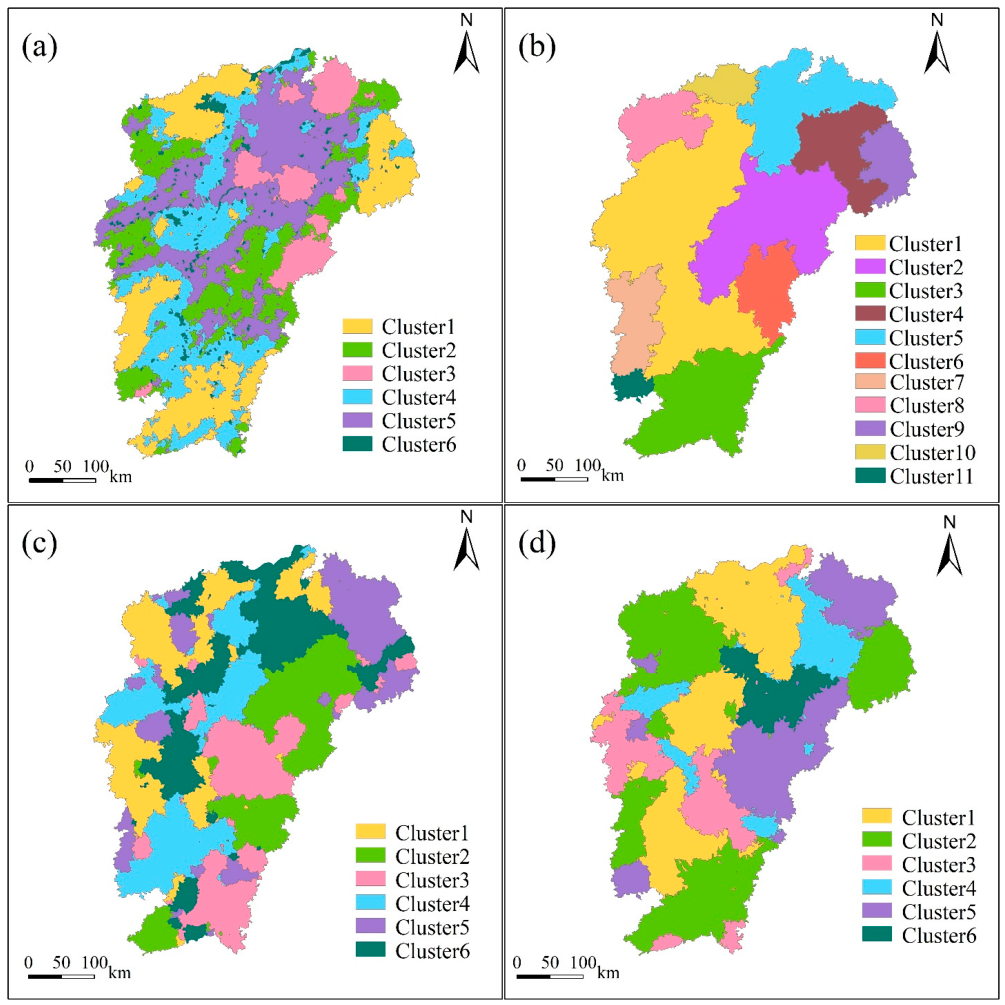
- Post-processing. Refine the optimal clustering results to produce the final flash flood regionalization map for Jiangxi province, China.
- (6)
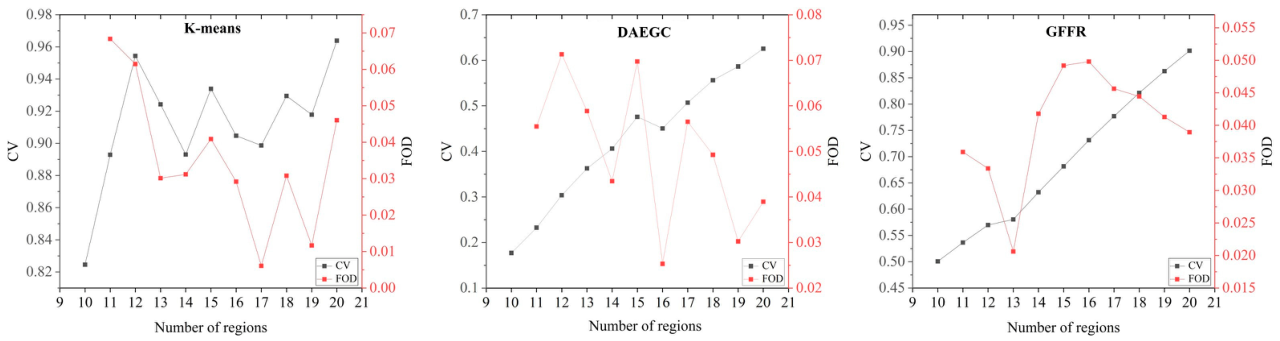
- Evaluation and analysis. Assess the regionalization results by applying the Geodector method to the historical flash flood events [59].
2.3.1. Construction of the Directed Graph
2.3.2. Proposed GFFR Method
- (1)
- The encoder module
- (2)
- The decoder module
- (3)
- Model implementation
2.3.3. Determining the Optimal Number of Clusters
2.3.4. Post-Processing
2.3.5. Evaluation Method for Regionalization Results
3. Results
3.1. Optimal Number of Clusters
3.2. Clustering Results of Flash Floods
3.3. Regionalization Maps of Flash Floods
3.4. Evaluation of Flash Flood Regionalization Maps
4. Discussion
4.1. Parameter Sensitivity Analysis
4.2. Ablation Analysis
4.3. Limitation and Future Work
5. Conclusions
Author Contributions
Funding
Data Availability Statement
Conflicts of Interest
References
- Keefer, D.K.; Wilson, R.C.; Mark, R.K.; Brabb, E.E.; Brown, W.M.; Ellen, S.D.; Harp, E.L.; Wieczorek, G.F.; Alger, C.S.; Zatkin, R.S. Real-time landslide warning during heavy rainfall. Science 1987, 238, 921–925. [Google Scholar] [CrossRef]
- Liu, J.; Xiong, J.; Chen, Y.; Sun, H.; Zhao, X.; Tu, F.; Gu, Y. An integrated model chain for future flood risk prediction under land-use changes. J. Environ. Manag. 2023, 342, 118125. [Google Scholar] [CrossRef]
- Yao, J.; Zhang, X.; Luo, W.; Liu, C.; Ren, L. Applications of stacking/blending ensemble learning approaches for evaluating flash flood susceptibility. Int. J. Appl. Earth Obs. Geoinf. 2022, 112, 102932. [Google Scholar] [CrossRef]
- Duan, H.; Cao, Z.; Luo, J.; Shen, M. Ai-driven opportunities and challenges in lake remote sensing. Inf. Geogr. 2025, 1, 100014. [Google Scholar] [CrossRef]
- Zhang, R.; Chen, Y.; Zhang, X.; Ma, Q.; Ren, L. Mapping homogeneous regions for flash floods using machine learning: A case study in jiangxi province, China. Int. J. Appl. Earth Obs. Geoinf. 2022, 108, 102717. [Google Scholar] [CrossRef]
- Liu, Y.; Huang, Y. Why flash floods occur differently across regions? A spatial analysis of China. Water 2020, 12, 3344. [Google Scholar] [CrossRef]
- Ma, M.; Zhao, G.; He, B.; Li, Q.; Dong, H.; Wang, S.; Wang, Z. Xgboost-based method for flash flood risk assessment. J. Hydrol. 2021, 598, 126382. [Google Scholar] [CrossRef]
- Garambois, P.A.; Roux, H.; Larnier, K.; Labat, D.; Dartus, D. Parameter regionalization for a process-oriented distributed model dedicated to flash floods. J. Hydrol. 2015, 525, 383–399. [Google Scholar] [CrossRef]
- Liu, C.; Ma, Q.; Zhang, X.; Li, C.; Li, Q.; Gourbesville, P.; Guo, L.; Ding, L. Identification and quantitative analysis of flash flood risks for small catchments in China: A new operational modelling approach. LHB 2022, 108, 2019561. [Google Scholar] [CrossRef]
- Beck, H.E.; van Dijk, A.I.J.M.; de Roo, A.; Miralles, D.G.; McVicar, T.R.; Schellekens, J.; Bruijnzeel, L.A. Global-scale regionalization of hydrologic model parameters. Water Resour. Res. 2016, 52, 3599–3622. [Google Scholar] [CrossRef]
- Ma, M.; Liu, C.; Zhao, G.; Xie, H.; Jia, P.; Wang, D.; Wang, H.; Hong, Y. Flash flood risk analysis based on machine learning techniques in the Yunnan province, China. Remote Sens. 2019, 11, 170. [Google Scholar] [CrossRef]
- Xiong, J.; Li, J.; Cheng, W.; Wang, N.; Guo, L. A gis-based support vector machine model for flash flood vulnerability assessment and mapping in China. ISPRS Int. J. Geo-Inf. 2019, 8, 297. [Google Scholar] [CrossRef]
- Ahmed, A.; Rahman, A.; Rafi, R.S.M.H.; Khan, Z.; Mannan, H. Statistical and physical significance of homogeneous regions in regional flood frequency analysis. Water 2025, 17, 1799. [Google Scholar] [CrossRef]
- Arseni, M.; Rosu, A.; Calmuc, M.; Calmuc, V.A.; Iticescu, C.; Georgescu, L.P. Development of flood risk and hazard maps for the lower course of the Siret River, Romania. Sustainability 2020, 12, 6588. [Google Scholar] [CrossRef]
- Wang, N.; Lombardo, L.; Tonini, M.; Cheng, W.; Guo, L.; Xiong, J. Spatiotemporal clustering of flash floods in a changing climate (China, 1950–2015). Nat. Hazards Earth Syst. Sci. 2021, 21, 2109–2124. [Google Scholar] [CrossRef]
- Cutter, S.L.; Golledge, R.; Graf, W.L. The big questions in geography. Prof. Geogr. 2002, 54, 305–317. [Google Scholar] [CrossRef]
- Aydin, O.; Janikas, M.V.; Assunção, R.M.; Lee, T.-H. A quantitative comparison of regionalization methods. Int. J. Geogr. Inf. Sci. 2021, 35, 2287–2315. [Google Scholar] [CrossRef]
- Tobler, W.R. A computer movie simulating urban growth in the Detroit region. Econ. Geogr. 1970, 46, 234–240. [Google Scholar] [CrossRef]
- Goodchild, M.F. The validity and usefulness of laws in geographic information science and geography. Ann. Assoc. Am. Geogr. 2004, 94, 300–303. [Google Scholar] [CrossRef]
- Zhu, A.X.; Lu, G.; Liu, J.; Qin, C.Z.; Zhou, C. Spatial prediction based on third law of geography. Ann. GIS 2018, 24, 225–240. [Google Scholar] [CrossRef]
- Song, Y. The second dimension of spatial association. Int. J. Appl. Earth Obs. Geoinf. 2022, 111, 102834. [Google Scholar] [CrossRef]
- Song, Y. Geographically optimal similarity. Math. Geosci. 2022, 55, 295–320. [Google Scholar] [CrossRef]
- Zhang, H.; Zhou, X.; Yang, Y.; Wang, H.; Ye, X.; Tang, G. Advancing process-oriented geographical regionalization model. Ann. Am. Assoc. Geogr. 2024, 114, 2388–2413. [Google Scholar] [CrossRef]
- Peel, M.C.; Finlayson, B.L.; McMahon, T.A. Updated world map of the köppen-geiger climate classification. Hydrol. Earth Syst. Sci. 2007, 11, 1633–1644. [Google Scholar] [CrossRef]
- Huang, X.; Liu, A.; Li, J. Mapping and analyzing the local climate zones in China’s 32 major cities using landsat imagery based on a novel convolutional neural network. Geo-Spat. Inf. Sci. 2021, 24, 528–557. [Google Scholar] [CrossRef]
- Bailey, R.G. Identifying ecoregion boundaries. Environ. Manag. 2004, 34, S14–S26. [Google Scholar] [CrossRef]
- Kearney, S.; Coops, N.; Stenhouse, G.; Nelson, T. Ecoanthromes of Alberta: An example of disturbance-informed ecological regionalization using remote sensing. J. Environ. Manag. 2019, 234, 297–310. [Google Scholar] [CrossRef]
- Agarwal, A.; Maheswaran, R.; Sehgal, V.; Khosa, R.; Sivakumar, B.; Bernhofer, C. Hydrologic regionalization using wavelet-based multiscale entropy method. J. Hydrol. 2016, 538, 22–32. [Google Scholar] [CrossRef]
- Nadoushani, S.; Dehghanian, N.; Saghafian, B. A fuzzy hybrid clustering method for identifying hydrologic homogeneous regions. J. Hydroinform. 2018, 20, 1367–1386. [Google Scholar] [CrossRef]
- Khajehei, S.; Ahmadalipour, A.; Shao, W.; Moradkhani, H. A place-based assessment of flash flood hazard and vulnerability in the contiguous United States. Sci. Rep. 2020, 10, 448. [Google Scholar] [CrossRef] [PubMed]
- Arganis, M.; Preciado, M.; Luna, F.D.; Cruz, L.; Domínguez, R.; Santana, O. Application of a regionalization method for estimating flash floods: Cuautepec basin, Mexico. Water 2023, 15, 303. [Google Scholar] [CrossRef]
- Duque, J.C.; Ramos, R.; Suriñach, J. Supervised regionalization methods: A survey. Int. Reg. Sci. Rev. 2007, 30, 195–220. [Google Scholar] [CrossRef]
- Roushangar, K.; Alizadeh, F. A multiscale spatio-temporal framework to regionalize annual precipitation using k-means and self-organizing map technique. J. Mt. Sci. 2018, 15, 1481–1497. [Google Scholar] [CrossRef]
- Ley, R.; Casper, M.C.; Hellebrand, H.; Merz, R. Catchment classification by runoff behaviour with self-organizing maps (som). Hydrol. Earth Syst. Sci. 2011, 15, 2947–2962. [Google Scholar] [CrossRef]
- Assunção, R.M.; Neves, M.C.; Câmara, G.; da Costa Freitas, C. Efficient regionalization techniques for socio-economic geographical units using minimum spanning trees. Int. J. Geogr. Inf. Sci. 2006, 20, 797–811. [Google Scholar] [CrossRef]
- Middleton, R.S. Geographical Distillation: Application of the p-Median, Traveling Salesman, and Regionalization Problems. Ph.D. Thesis, University of California, Santa Barbara, CA, USA, 2006. [Google Scholar]
- Lim, K.-L.; Jiang, X.; Yi, C. Deep clustering with variational autoencoder. IEEE Signal Process. Lett. 2020, 27, 231–235. [Google Scholar] [CrossRef]
- Wu, Z.; Pan, S.; Chen, F.; Long, G.; Zhang, C.; Philip, S.Y. A comprehensive survey on graph neural networks. IEEE Trans. Neural Netw. Learn. Syst. 2020, 32, 4–24. [Google Scholar] [CrossRef]
- Zhang, H.; Li, P.; Zhang, R.; Li, X. Embedding graph auto-encoder for graph clustering. IEEE Trans. Neural Netw. Learn. Syst. 2022, 34, 9352–9362. [Google Scholar] [CrossRef]
- Chen, Y.; Zhou, J.; Ge, Y.; Dong, J. Uncovering the rapid expansion of photovoltaic power plants in China from 2010 to 2022 using satellite data and deep learning. Remote Sens. Environ. 2024, 305, 114100. [Google Scholar] [CrossRef]
- Tsitsulin, A.; Palowitch, J.; Perozzi, B.; Müller, E. Graph clustering with graph neural networks. J. Mach. Learn. Res. 2023, 24, 1–21. [Google Scholar] [CrossRef]
- Chen, Y.; Zhou, J.; Xu, C.; Ma, Q.; Zhang, X.; Zhou, Y.; Ge, Y. Structure-aware deep learning network for building height estimation. Int. J. Appl. Earth Obs. Geoinf. 2025, 137, 104443. [Google Scholar] [CrossRef]
- Tian, F.; Gao, B.; Cui, Q.; Chen, E.; Liu, T.-Y. Learning deep representations for graph clustering. In Proceedings of the AAAI Conference on Artificial Intelligence; AAAI: Washington, DC, USA, 2014. [Google Scholar]
- Zhou, J.; Cui, G.; Hu, S.; Zhang, Z.; Yang, C.; Liu, Z.; Wang, L.; Li, C.; Sun, M. Graph neural networks: A review of methods and applications. AI Open 2020, 1, 57–81. [Google Scholar] [CrossRef]
- Li, X.; Hu, Y.; Sun, Y.; Hu, J.; Zhang, J.; Qu, M. A deep graph structured clustering network. IEEE Access 2020, 8, 161727–161738. [Google Scholar] [CrossRef]
- Peng, Z.; Liu, H.; Jia, Y.; Hou, J. Attention-driven graph clustering network. In Proceedings of the 29th ACM International Conference on Multimedia; ACM: New York, NY, USA, 2021; pp. 935–943. [Google Scholar]
- Tu, W.; Zhou, S.; Liu, X.; Guo, X.; Cai, Z.; Cheng, J. Deep fusion clustering network. arXiv 2020, arXiv:2012.09600. [Google Scholar]
- Yao, S.; Huang, B. Spatiotemporal interpolation using graph neural network. Ann. Am. Assoc. Geogr. 2023, 113, 1856–1877. [Google Scholar] [CrossRef]
- Zhu, D.; Zhang, F.; Wang, S.; Wang, Y.; Cheng, X.; Huang, Z.; Liu, Y. Understanding place characteristics in geographic contexts through graph convolutional neural networks. Ann. Am. Assoc. Geogr. 2020, 110, 408–420. [Google Scholar] [CrossRef]
- Li, Y.; Zhang, C.; Cui, P.; Hassan, M.; Duan, Z.; Bhattacharyya, S.; Yao, S.; Zhao, Y. Flash flood regionalization for the Hengduan mountains region, China, combining gnn and shap methods. Remote Sens. 2025, 17, 946. [Google Scholar] [CrossRef]
- Chen, Y.; Xu, C.; Ge, Y.; Zhang, X.; Zhou, Y.N. A 100 m gridded population dataset of China’s seventh census using ensemble learning and big geospatial data. Earth Syst. Sci. Data 2024, 16, 3705–3718. [Google Scholar] [CrossRef]
- Liu, S.; Feng, L.; Xie, J.; Ke, Y. Assessing urban flood resilience with unascertained measurement theory: A case study of Jiangxi province, China. Sustainability 2026, 18, 49. [Google Scholar] [CrossRef]
- Izinyon, O.; Ihimekpen, N.; Igbinoba, G. Flood frequency analysis of Ikpoba River catchment at Benin City using log Pearson type iii distribution. J. Emerg. Trends Eng. Appl. Sci. 2011, 2, 50–55. [Google Scholar]
- Liu, J.; Xiong, J.; Chen, Y.; Sun, H.; Zhao, X.; Tu, F.; Gu, Y. A new avenue to improve the performance of integrated modeling for flash flood susceptibility assessment: Applying cluster algorithms. Ecol. Indic. 2023, 146, 109785. [Google Scholar] [CrossRef]
- Zhang, M.; Zhang, D.; Jin, Y.; Wan, X.; Ge, Y. Evolution of soil moisture mapping from statistical models to integrated mechanistic and geoscience-aware approaches. Inf. Geogr. 2025, 1, 100005. [Google Scholar] [CrossRef]
- Cronshey, R. Urban Hydrology for Small Watersheds; US Department of Agriculture, Soil Conservation Service, Engineering Division: Washington, DC, USA, 1986.
- Li, X.; Chang, S.X.; Salifu, K.F. Soil texture and layering effects on water and salt dynamics in the presence of a water table: A review. Environ. Rev. 2014, 22, 41–50. [Google Scholar] [CrossRef]
- Wang, C.; Pan, S.; Hu, R.; Long, G.; Jiang, J.; Zhang, C. Attributed graph clustering: A deep attentional embedding approach. arXiv 2019, arXiv:1906.06532. [Google Scholar]
- Wang, J.F.; Li, X.H.; Christakos, G.; Liao, Y.L.; Zhang, T.; Gu, X.; Zheng, X.Y. Geographical detectors-based health risk assessment and its application in the neural tube defects study of the Heshun region, China. Int. J. Geogr. Inf. Sci. 2010, 24, 107–127. [Google Scholar] [CrossRef]
- Liu, Y.; Xia, J.; Zhou, S.; Yang, X.; Liang, K.; Fan, C.; Zhuang, Y.; Li, S.Z.; Liu, X.; He, K. A survey of deep graph clustering: Taxonomy, challenge, application, and open resource. arXiv 2022, arXiv:2211.12875. [Google Scholar]
- Chi, H.; Wang, Y.; Hao, Q.; Xia, H. Residual network and embedding usage: New tricks of node classification with graph convolutional networks. J. Phys. Conf. Ser. 2022, 2171, 012011. [Google Scholar] [CrossRef]
- Kipf, T.N.; Welling, M. Semi-supervised classification with graph convolutional networks. arXiv 2016, arXiv:1609.02907. [Google Scholar]
- Bo, D.; Wang, X.; Shi, C.; Zhu, M.; Lu, E.; Cui, P. Structural deep clustering network. In Proceedings of The Web Conference 2020; ACM: New York, NY, USA, 2020; pp. 1400–1410. [Google Scholar]
- Caliński, T.; Harabasz, J. A dendrite method for cluster analysis. Commun. Stat. 1974, 3, 1–27. [Google Scholar] [CrossRef]
- Song, Y.; Wang, J.; Ge, Y.; Xu, C. An optimal parameters-based geographical detector model enhances geographic characteristics of explanatory variables for spatial heterogeneity analysis: Cases with different types of spatial data. GISci. Remote Sens. 2020, 57, 593–610. [Google Scholar] [CrossRef]
- Yang, L.; Li, X.; Yang, Q.; Zhang, L.; Zhang, S.; Wu, S.; Zhou, C. Extracting knowledge from legacy maps to delineate eco-geographical regions. Int. J. Geogr. Inf. Sci. 2021, 35, 250–272. [Google Scholar]
- Cao, Y.; Jia, H.; Xiong, J.; Cheng, W.; Li, K.; Pang, Q.; Yong, Z. Flash flood susceptibility assessment based on geodetector, certainty factor, and logistic regression analyses in Fujian province, China. ISPRS Int. J. Geo-Inf. 2020, 9, 748. [Google Scholar] [CrossRef]
- Liu, Y.; Yang, Z.; Huang, Y.; Liu, C. Spatiotemporal evolution and driving factors of China’s flash flood disasters since 1949. Sci. China Earth Sci. 2018, 61, 1804–1817. [Google Scholar] [CrossRef]
- Randall, N.; Heisenberg, G.; Duval, J.L.R. Generating aerial flood prediction imagery with generative adversarial networks. In Proceedings of the 17th International Joint Conference on Knowledge Discovery, Knowledge Engineering and Knowledge Management—KDIR; SciTePress: Setúbal, Portugal, 2025; pp. 15–27. [Google Scholar] [CrossRef]
- Zlati, M.L.; Antohi, V.-M.; Ionescu, R.-V.; Iticescu, C.; Georgescu, L.P. Quantyfing the impact of the water security index on socio-economic development in eu27. Socio-Econ. Plan. Sci. 2024, 93, 101912. [Google Scholar] [CrossRef]



| Time Interval | Annual Exceedance Probability (AEP) | Rainfall Factors and Descriptions |
|---|---|---|
| 1 h, 3 h, and 6 h | 1%, 2%, 5%, 20%, 50% | Maximum 1 h, 3 h, and 6 h rainfall corresponding to 1%, 2%, 5%, 20%, and 50% AEP |
| 1 h, 3 h, 6 h, 12 h, and 24 h | - | Annual average maximum 1 h, 3 h, 6 h, 12 h and 24 h rainfall (2008–2018) |
| Year | - | Annual average rainfall and annual average number of rainstorm days |
| Underlying Surface Factors | Description |
|---|---|
| DEM | ASTER GDEM 30 m DEM |
| Elevation difference | Derived from 30 m DEM |
| Slope | Derived from 30 m DEM |
| NDVI | China Annual Vegetation Index Spatial Distribution Dataset in 2015 |
| HAND | Global Hydrography Datasets |
| Surface roughness | Surface roughness coefficient for each land use type from the National Flash Flood Investigation and Evaluation Project (NFFIEP) |
| Stable infiltration rate | Saturation infiltration coefficients for soil types from NFFIEP |
| Method | Number of Isolated Polygons | Maximum Compactness | Minimum Compactness | Average Compactness |
|---|---|---|---|---|
| K-means | 656 | 0.913 | 0.013 | 0.481 |
| SKATER | 0 | 0.912 | 0.052 | 0.606 |
| DAEGC | 158 | 0.914 | 0.198 | 0.697 |
| GFFR | 42 | 0.914 | 0.265 | 0.742 |
| CQI | CHI | |
|---|---|---|
| GFFR + Undirected graph | 11.888 | 622.389 |
| Baseline + GAT | 11.073 | 1094.364 |
| Baseline + GAT + RC | 10.588 | 816.028 |
| Baseline + GCN | 10.526 | 882.647 |
| Baseline + GCN + RC (GFFR) | 9.715 | 1513.771 |
Disclaimer/Publisher’s Note: The statements, opinions and data contained in all publications are solely those of the individual author(s) and contributor(s) and not of MDPI and/or the editor(s). MDPI and/or the editor(s) disclaim responsibility for any injury to people or property resulting from any ideas, methods, instructions or products referred to in the content. |
© 2026 by the authors. Licensee MDPI, Basel, Switzerland. This article is an open access article distributed under the terms and conditions of the Creative Commons Attribution (CC BY) license.
Share and Cite
Chen, Y.; Li, Y.; Zhang, X.; Ma, Q. Identifying Homogeneous Regions for Flash Floods Using Graph Clustering Neural Networks in Jiangxi Province, China. Land 2026, 15, 1235. https://doi.org/10.3390/land15071235
Chen Y, Li Y, Zhang X, Ma Q. Identifying Homogeneous Regions for Flash Floods Using Graph Clustering Neural Networks in Jiangxi Province, China. Land. 2026; 15(7):1235. https://doi.org/10.3390/land15071235
Chicago/Turabian StyleChen, Yuehong, Yunqiang Li, Xiaoxiang Zhang, and Qiang Ma. 2026. "Identifying Homogeneous Regions for Flash Floods Using Graph Clustering Neural Networks in Jiangxi Province, China" Land 15, no. 7: 1235. https://doi.org/10.3390/land15071235
APA StyleChen, Y., Li, Y., Zhang, X., & Ma, Q. (2026). Identifying Homogeneous Regions for Flash Floods Using Graph Clustering Neural Networks in Jiangxi Province, China. Land, 15(7), 1235. https://doi.org/10.3390/land15071235