Article

Long-Term Dynamics and Climatic Drivers of Vegetation Cover on the Loess Plateau (2000–2024)

College of Grassland Agriculture, Northwest A&F University, Xinong Road 22, Yangling 712100, China
*
Author to whom correspondence should be addressed.
Land 2026, 15(7), 1206; https://doi.org/10.3390/land15071206
Submission received: 31 March 2026 / Revised: 26 June 2026 / Accepted: 29 June 2026 / Published: 5 July 2026

Abstract

Vegetation is a key component of ecosystems and a core indicator for monitoring terrestrial ecosystem changes. Studying its spatio-temporal dynamics and natural drivers is essential for ecological restoration and management in the Loess Plateau, a region with fragile ecology and complex human-land interactions. Using data from 2000 to 2024, this study systematically investigated the spatio-temporal evolution patterns, future trends, and primary influencing factors of Fractional Vegetation Cover (FVC) by integrating the Dimidiate Pixel Model, trend analysis, Hurst index, and optimal parameter geographic detector methods. The results show that: (1) Over the 25 years, FVC on the Loess Plateau showed an overall fluctuating upward trend, with a spatial distribution pattern characterized as “low in the northwest and high in the southeast”, and notable variations across different land use types. (2) The FVC change trend was dominated by extremely significant and significant increases, accounting for 67.92% of the total area, while areas with no significant change accounted for 31.27%. Spatially, the central region exhibited strong persistence in its increasing trend, whereas the northwestern and southeastern margins tended to remain stable. (3) Precipitation was the most important single factor affecting FVC (explanatory power q = 0.4199). The interactive explanatory power of factors was higher than that of single factors, with precipitation and elevation having the strongest interaction (q = 0.5124). Land use type, as an anthropogenic proxy, also plays a significant regulatory role in FVC patterns. Using conventional remote sensing methods (dimidiate pixel model, trend analysis, Hurst index, and optimal parameter geographic detector), this study primarily contributes by extending the analysis period to 2024 and providing a focused assessment of post-2020 vegetation dynamics. This study systematically analyzes the spatio-temporal evolution patterns of FVC and quantifies the explanatory power of natural factors and land use as a human activity proxy on the Loess Plateau, providing a scientific basis for assessing regional ecological restoration effectiveness and optimizing ecological management strategies.

1. Introduction

The Loess Plateau, located in the inland region of northern China, is an integral part of the Yellow River Basin. Severe soil erosion, the most prominent environmental challenge in the area, not only hinders local socio-economic development but also poses significant threats to flood control safety in the lower reaches, attracting considerable attention from scholars worldwide [1,2,3,4]. The main causes of this severe erosion include intense rainstorms [5], loose loess soil [6], low vegetation coverage [7] and intensive human activities [8]. Fractional Vegetation Cover (FVC), a key parameter characterizing surface vegetation growth, directly reflects the health and stability of regional ecosystems [9,10]. Quantitatively analyzing its spatio-temporal evolution, predicting future trends, and exploring natural driving factors and land-use-mediated human-land interaction effects [11,12] can provide precise scientific support for local ecological restoration efforts—including desertification control and soil erosion management—and offer a theoretical basis for optimizing land resource allocation and advancing sustainable use decisions [13].
Remote sensing technology has become a primary tool for estimating vegetation cover, offering advantages such as high efficiency, cost-effectiveness, wide spatial coverage, and the capacity for continuous monitoring [14,15]. Common methods for estimating FVC from remote sensing data include regression models, machine learning [16], physical models [17] and spectral mixture analysis [18]. The first three methods generally depend on ground-measured data, which can limit their applicability under certain conditions. In contrast, the Dimidiate Pixel Model (DPM), as the simplest linear spectral mixture model, has been widely used for FVC estimation due to its straightforward implementation and clear physical meaning [19,20]. In recent years, numerous studies have employed the DPM with remote sensing imagery to derive FVC and explore its spatio-temporal changes [21,22,23]. On this basis, some studies have further explored the mechanisms underlying the spatial heterogeneity of FVC using the optimal parameter geographic detector [24,25,26]. Although significant progress has been made in FVC research, there remains an urgent need for large-scale, high-resolution, long-term vegetation monitoring in ecologically fragile regions [27].
As the world’s largest and deepest loess deposit area, the Loess Plateau is not only defined by its geographical extent but also by its extreme ecological vulnerability. Prolonged exposure to climate change and intensive human disturbances have rendered it one of the most severe soil erosion regions in China [2]. Many studies have investigated vegetation changes and influencing factors in this region. The existing literature generally agrees that vegetation on the Loess Plateau exhibits significant spatial heterogeneity and vertical zonality, with its evolution primarily shaped by the combined effects of climatic factors and human activities [11,13,28,29]. Although these studies reveal the impacts of natural factors like climate and elevation on FVC changes, several limitations remain. These include fragmented spatio-temporal scales, a lack of long-term time-series data to capture the lagged response of vegetation to policies like the Grain for Green program, insufficient quantification of interactive effects between human activities and terrain factors, and inadequate attribution analysis of FVC heterogeneity across different land use types.
Existing vegetation studies on the Loess Plateau are mostly limited to datasets ending before 2020 and rely primarily on linear correlation analysis, which fails to capture the nonlinear coupling between climate and terrain over a longer period [30,31]. This critical gap restricts understanding of recent vegetation changes and their complex drivers. Accordingly, this study extends the period to 2024 and applies the optimal parameter geographic detector to quantify nonlinear interactions between precipitation and elevation, providing updated evidence for regional ecological governance. It focuses on natural factors with land use as a proxy, without direct anthropogenic variables, to avoid mismatches between research objectives and methods. Although land use type is included as a proxy for human activity, direct anthropogenic variables are not incorporated, limiting the inference of full driving mechanisms [30].
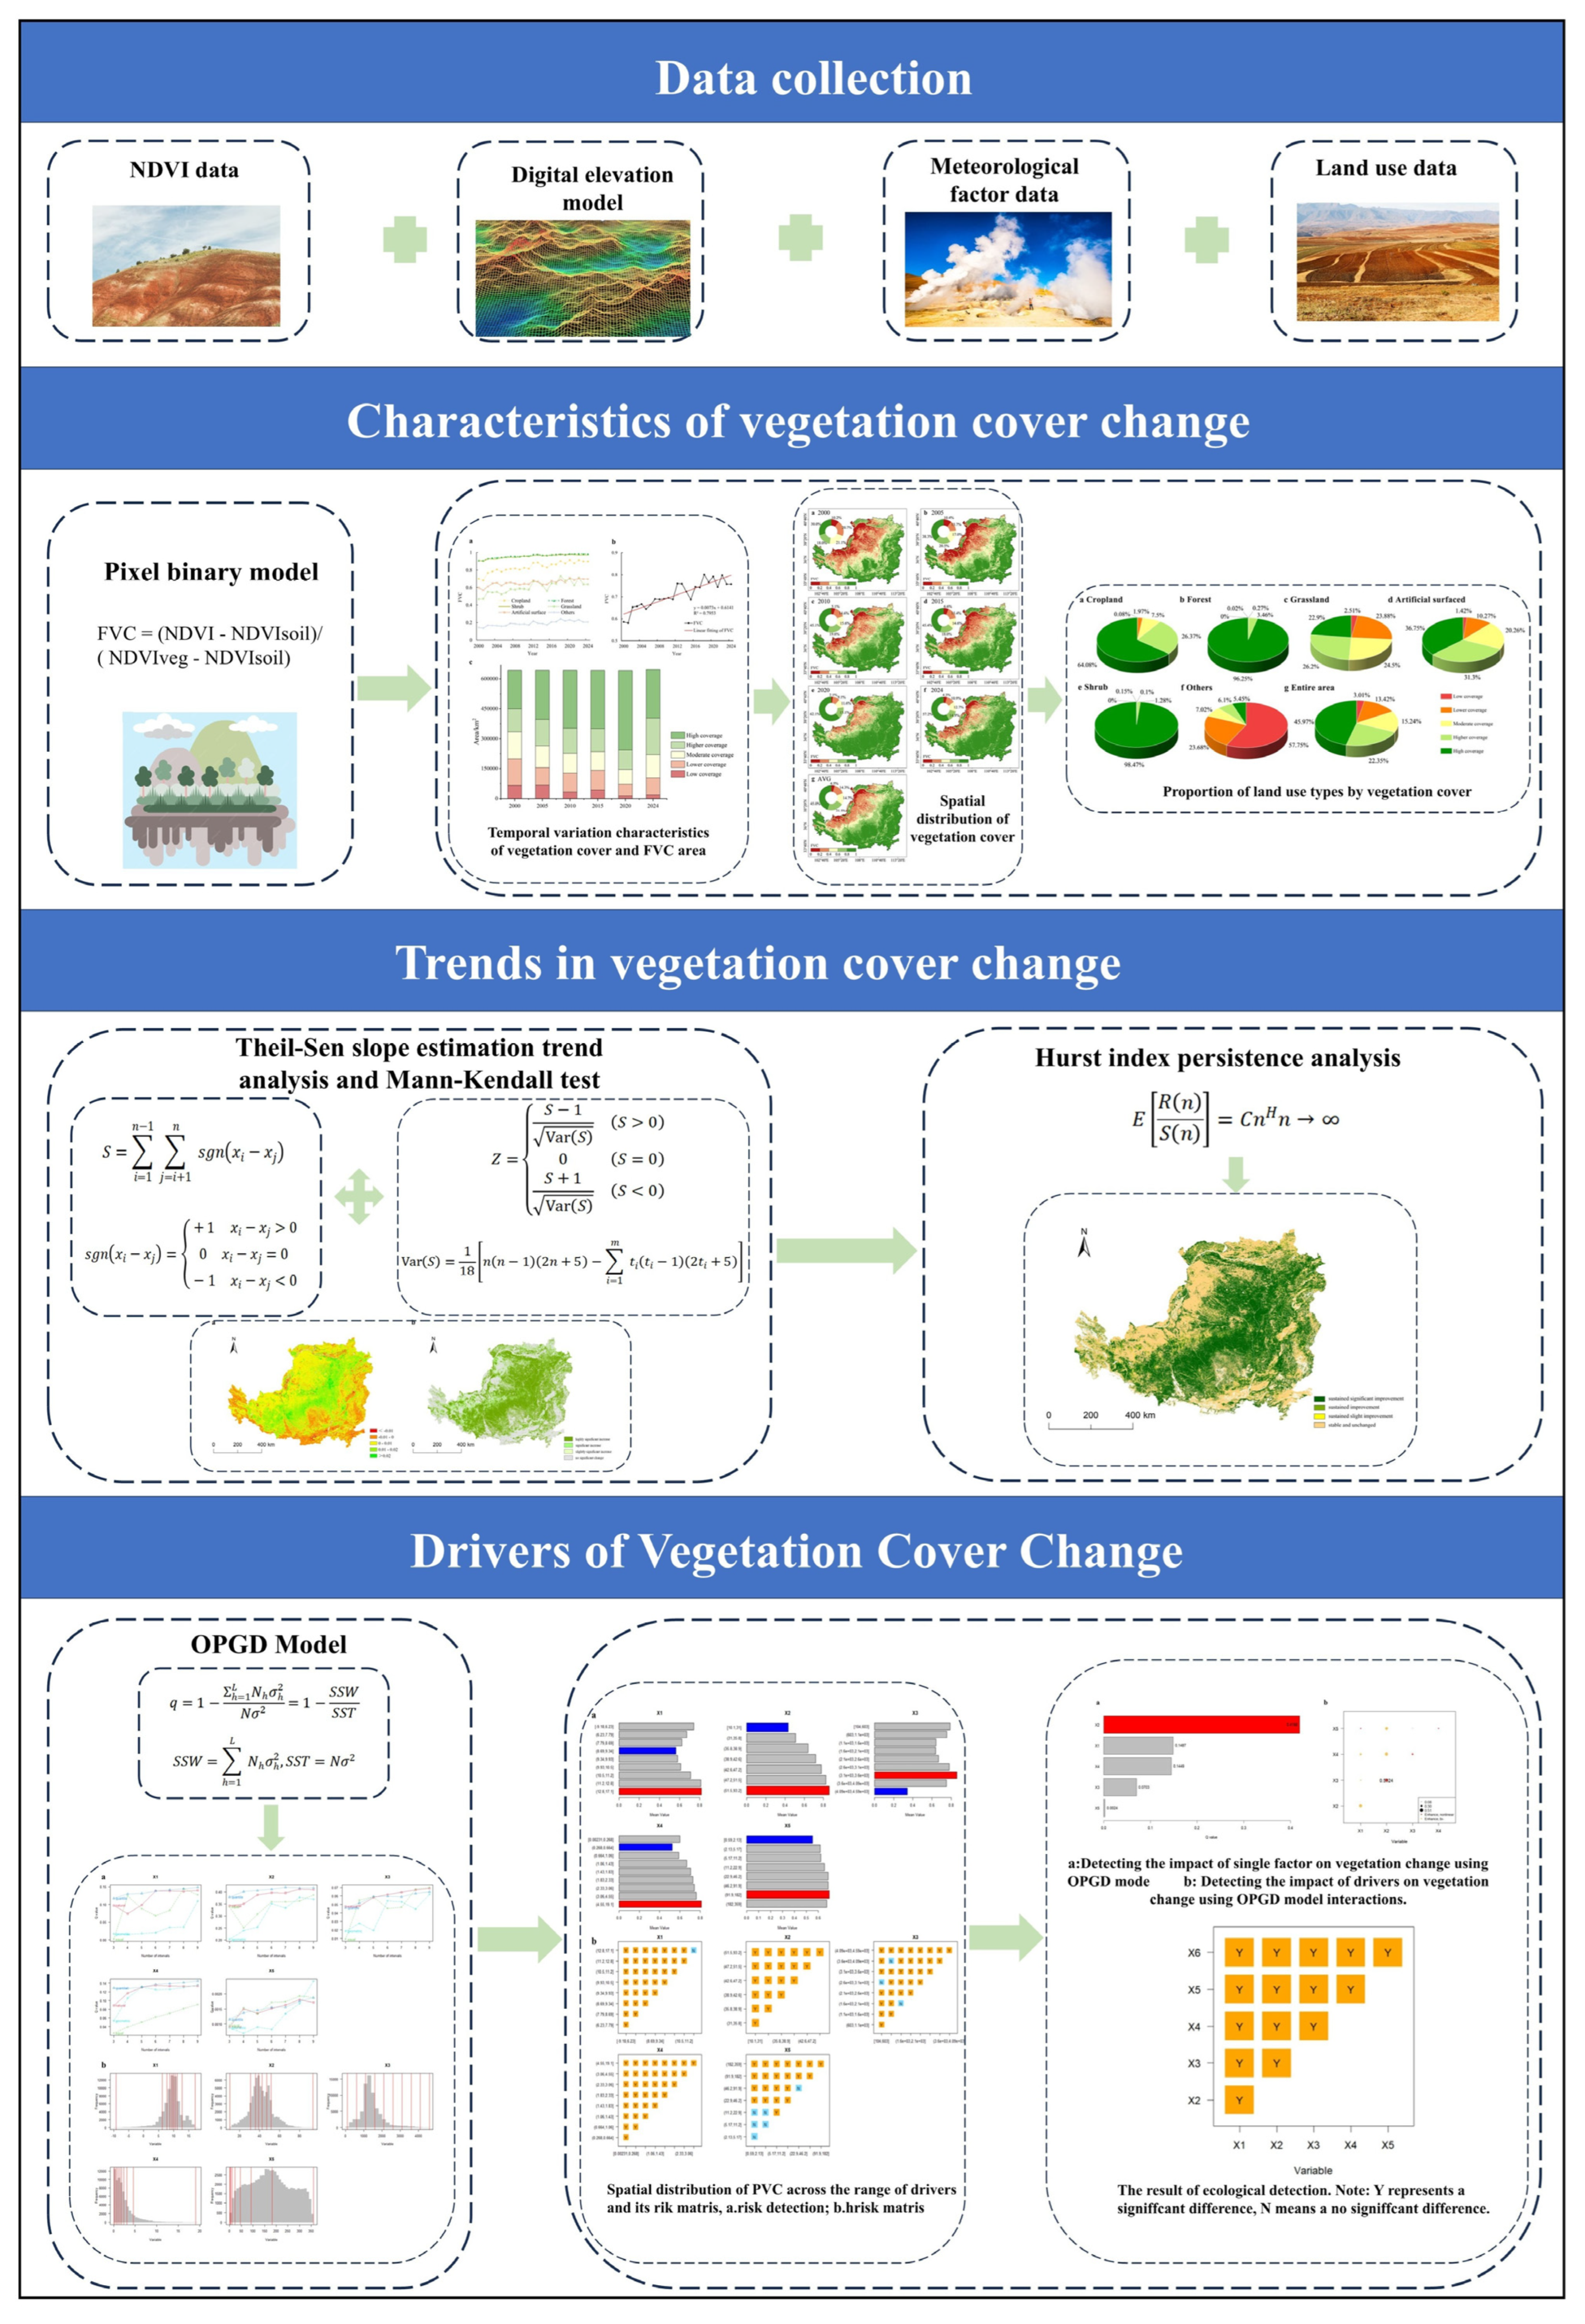
To address these gaps, this study integrates Sen’s slope estimator, Mann–Kendall (MK) trend analysis and the Hurst index to characterize the spatio-temporal evolution and future trends of FVC on the Loess Plateau. Additionally, the optimal parameter geographic detector model is employed to attribute the key geographical factors influencing FVC variations (Figure 1). This paper aims to reveal the spatio-temporal patterns and underlying driving mechanisms of vegetation cover change, thereby providing theoretical support for delineating ecological protection redlines and guiding restoration of degraded ecosystems in this region.
Most existing studies focus solely on climatic factors without quantitative representation of human activities. This study introduces land use type as an anthropogenic proxy to systematically assess the relative contributions of natural and human factors.

2. Materials and Methods

2.1. Study Area

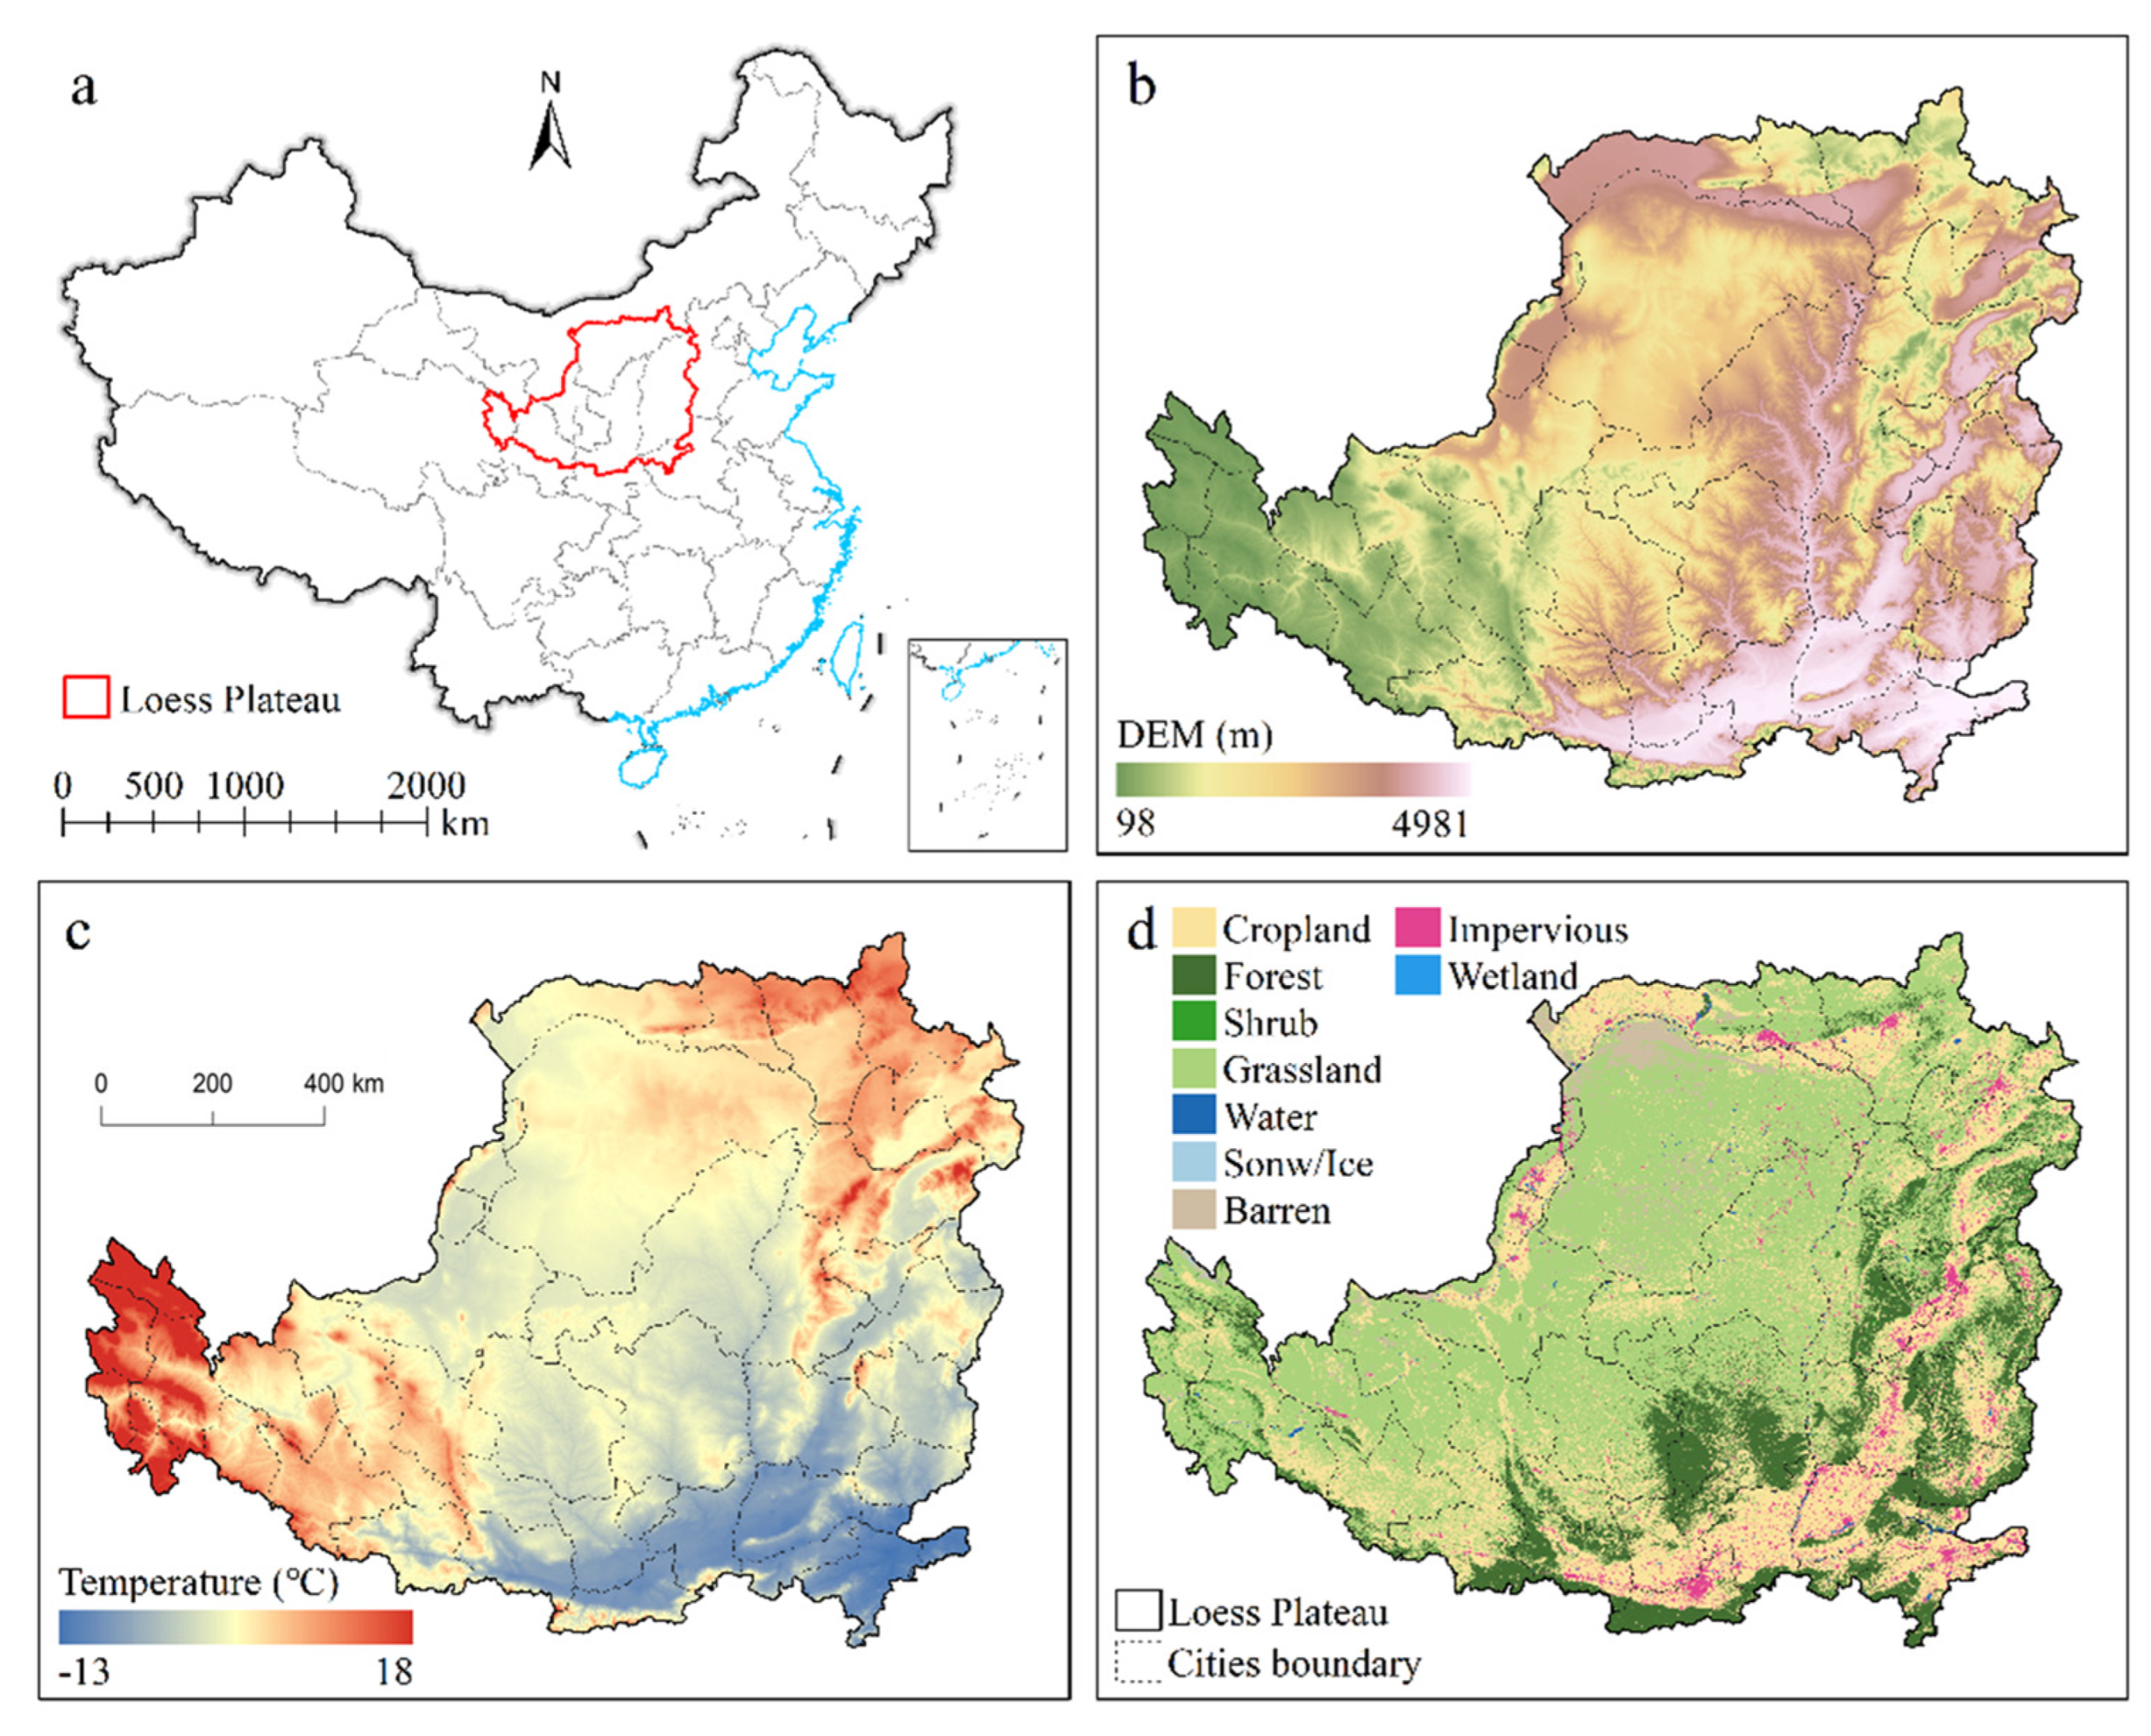
The Loess Plateau, situated in north-central China (100°52′–114°33′ E, 33°41′–41°16′ N), spans approximately 640,000 km2 and represents the largest loess accumulation area on Earth (Figure 2). The terrain descends from the northwest to the southeast, with elevations ranging from 98 to 4981 m and loess deposits reaching thicknesses of tens to hundreds of meters. The region experiences a temperate continental monsoon climate. Annual precipitation varies from 150 to 750 mm and is characterized by considerable spatial and temporal variability, with most rainfall occurring in summer, often in the form of rainstorms [32,33]. The mean annual temperature ranges from 3 to 14 °C, accompanied by pronounced diurnal fluctuations. Evaporation substantially exceeds precipitation, contributing to an overall arid to semi-arid climate [34]. As a quintessential ecologically fragile region, the Loess Plateau faces critical challenges such as severe soil erosion and water scarcity. Increasing frequency of extreme climate events, combined with anthropogenic disturbances, further exacerbates the risk of vegetation degradation and complicates ecological management efforts [35].

2.2. Data Sources and Processing

The study period is 2000–2024. Monthly maximum composite FVC data were calculated using the Normalized Difference Vegetation Index (NDVI) based Dimidiate Pixel Model. Pure vegetation and bare soil pixel values were determined according to land use types for FVC calculation. Five explanatory variables were selected for geographic detector analysis, with consistent definitions throughout the study: (1) Mean annual temperature (MAT): Average annual temperature (°C); (2) Mean annual precipitation (MAP): Total annual precipitation (mm); (3) Elevation (ELE): Terrain elevation (m); (4) Slope (SLO): Terrain slope (°); (5) Land use type (LUT): Categorical anthropogenic proxy. All variables were standardized to 250 m resolution and selected based on their documented relevance to FVC dynamics. Annual average temperature and annual precipitation data were calculated from monthly 1km-resolution temperature and precipitation data obtained from the National Tibetan Plateau Data Center. Elevation data came from the Geospatial Data Cloud platform. Data were mosaicked, clipped, and the slope was extracted using version 10.8 of ArcGIS software. Other data details are shown in Table 1. All data were resampled to a uniform 250 m resolution for subsequent calculations. In this study, multi-source data at 30 m, 90 m, and 1 km resolutions were unified to 250 m using bilinear interpolation. This harmonization ensures spatial alignment but may introduce mild aggregation effects and uncertainty propagation; impacts are limited in heterogeneous landscapes and do not alter regional spatiotemporal patterns.

2.3. Research Methods

2.3.1. Dimidiate Pixel Model

The Dimidiate Pixel Model is a vegetation cover inversion method based on linear spectral unmixing theory, representing the simplest linear mixture model. It assumes a pixel is linearly composed of only two components: pure vegetation and bare soil. The fraction of vegetation cover (FVC) is calculated as follows:
F V C = N D V I N D V I s o i l N D V I v e g N D V I s o i l  
Variable definitions:
NDVI: Pixel-level normalized difference vegetation index.
NDVIsoil: Bare soil NDVI, defined as the 5th percentile of all study-area NDVI values (spatially and temporally fixed).
NDVIveg: Pure vegetation NDVI, defined as the 95th percentile of all study-area NDVI values (spatially and temporally fixed).
FVC: Fractional Vegetation Cover, ranging 0–1. Classified into five grades: Low (0–0.2), Relatively Low (0.2–0.4), Medium (0.4–0.6), Relatively High (0.6–0.8), High (0.8–1.0).
Where NDVIsoil and NDVIveg represent the NDVI values of bare soil and pure vegetation, respectively. In this study, a fixed percentile-based method was adopted to ensure reproducibility: NDVIsoil was defined as the 5th percentile of NDVI values across the study area, representing bare soil; NDVIveg was defined as the 95th percentile, representing fully vegetated pixels. These two parameters were kept spatially and temporally constant for the entire study period (2000–2024) to maintain consistency. This percentile approach minimizes the influence of outliers and noise. A brief uncertainty analysis indicates that FVC errors induced by parameter selection are generally <5%, which is acceptable for regional-scale vegetation monitoring. To evaluate the accuracy of the DPM-derived FVC, we compared it against the standard MODIS FVC product (MOD44B, version 6, 250 m resolution). For the period 2000–2024, we randomly selected 500 sample points across the Loess Plateau, stratifying by major land use types (cropland, forest, grassland, shrubland, and artificial surfaces) to ensure representativeness. For each sample point and each year, we extracted the annual mean FVC value from both our DPM result and the MODIS product. A linear regression was then performed on the paired dataset (n = 500 × 25 = 12,500). The validation yielded a coefficient of determination (R2) of 0.87 and a root mean square error (RMSE) of 0.042. The R2 value indicates that 87% of the spatial variation in our DPM-derived FVC is explained by the MODIS reference product, demonstrating strong agreement. The RMSE of 0.042 corresponds to an average absolute error of approximately 4.2% in fractional vegetation cover (on a 0–1 scale), which is acceptable for regional-scale vegetation monitoring in heterogeneous landscapes. This cross-validation confirms that our FVC estimates are reliable for analyzing the spatiotemporal dynamics of vegetation on the Loess Plateau. Referring to existing research and the study area’s conditions, FVC was classified into five levels: Low (0 ≤ FVC < 0.2); Relatively Low (0.2 ≤ FVC < 0.4); Medium (0.4 ≤ FVC < 0.6); Relatively High (0.6 ≤ FVC < 0.8); High (0.8 ≤ FVC < 1.0).

2.3.2. Trend Analysis

(1)
Theil-Sen slope estimation and Mann–Kendall test
To analyze the changing trend and its spatio-temporal characteristics over the 20 years, Sen’s slope estimator combined with the Mann–Kendall (MK) test was used. The Theil-Sen Median (Sen’s slope estimator) is a robust non-parametric statistical method for trend calculation. It is efficient and insensitive to measurement errors and outliers, suitable for trend analysis of long-term time series data [36]. The Mann–Kendall test is a non-parametric method for detecting trends in time series. It does not require data to follow a normal distribution and is unaffected by missing values or outliers, making it suitable for testing the significance of trends in long-term series [37].
The test statistic S is calculated as:
S = i = 1 n 1 j = i + 1 n s g n x i x j
The Theil-Sen slope quantifies the median trend magnitude, robust to outliers. The Mann–Kendall (MK) test assesses trend significance, non-parametric and distribution-free.
S statistic: Measures monotonic trend.
Z statistic: Standardized MK statistic, |Z| > 1.96 = significant at p < 0.05.
Trend classification: Based on slope (β) and Z (Table 2), ensuring reproducibility.
Where x i , x j are data points in the time series, i and j are their indices, n is the series length, and s g n   is the sign function:
s g n x i x j = + 1 x i x j > 0 0 x i x j = 0 1 x i x j < 0
For time series length n > 10, S approximately follows a normal distribution. The standardized test statistic Z is constructed:
Z = S 1 V a r S S > 0 0 S = 0 S + 1 V a r S S < 0
V a r S = 1 18 n n 1 2 n + 5 i = 1 m t i t i 1 2 t i + 5
where n is the sample size, m is the number of tied groups, and t i is the number of data points in the i -th tied group.
A significance level α = 0.05 , Z 1 α 2 = Z 0.975 = 1.96 . When | Z | 1.96 , the trend is not significant. When | Z | > 1.96 , a significant trend exists, with higher Z indicating greater significance. To further quantify trend significance, three threshold levels corresponding to α = 0.10, 0.05, 0.01 (critical Z values 1.65, 1.96, 2.58) were used for classification (Table 2).
(2)
Hurst Index Persistence Analysis
The Hurst index analyzes the long-term dependence and persistence of a time series [38]; this study used the Rescaled Range (R/S) analysis method for calculation:
E R n S n = C n H n
where E [ ] is the expectation, n is the time span, R ( n ) is the range of the cumulative deviation series for the first n periods, S n is the standard deviation series and C is a constant. If a constant H exists, the time series exhibits Hurst phenomenon, and H is the Hurst index ( H [ 0 , 1 ] ). When H < 0.5 , the series shows anti-persistence. When H > 0.5 , it shows positive persistence. When H = 0.5 , it indicates a random, uncorrelated series.

2.3.3. Optimal Parameter Geographic Detector Model

The Optimal Parameter Geographic Detector (OPGD) model adds a parameter optimization module to the base geographical detector. It automatically selects the best parameter combination through algorithms, revealing the patterns, processes, and mechanisms of geographical phenomena from different perspectives [26]. The q statistic quantifies the influence of five factors—temperature, precipitation, elevation, slope, aspect—on FVC q ( q 0 , 1 ) . A higher q value indicates greater explanatory power of the factor.
q = 1 h = 1 L N h σ h 2 N σ 2 = 1 S S W S S T
S S W = h = 1 L N h σ h 2 , S S T = N σ 2
where q is the explanatory power of an influencing factor on FVC; h is the stratification of the independent variable; N h and N are the number of units in stratum h and the entire region, respectively; σ 2 is the variance; S S W is the within-stratum variance sum; S S T is the total variance.
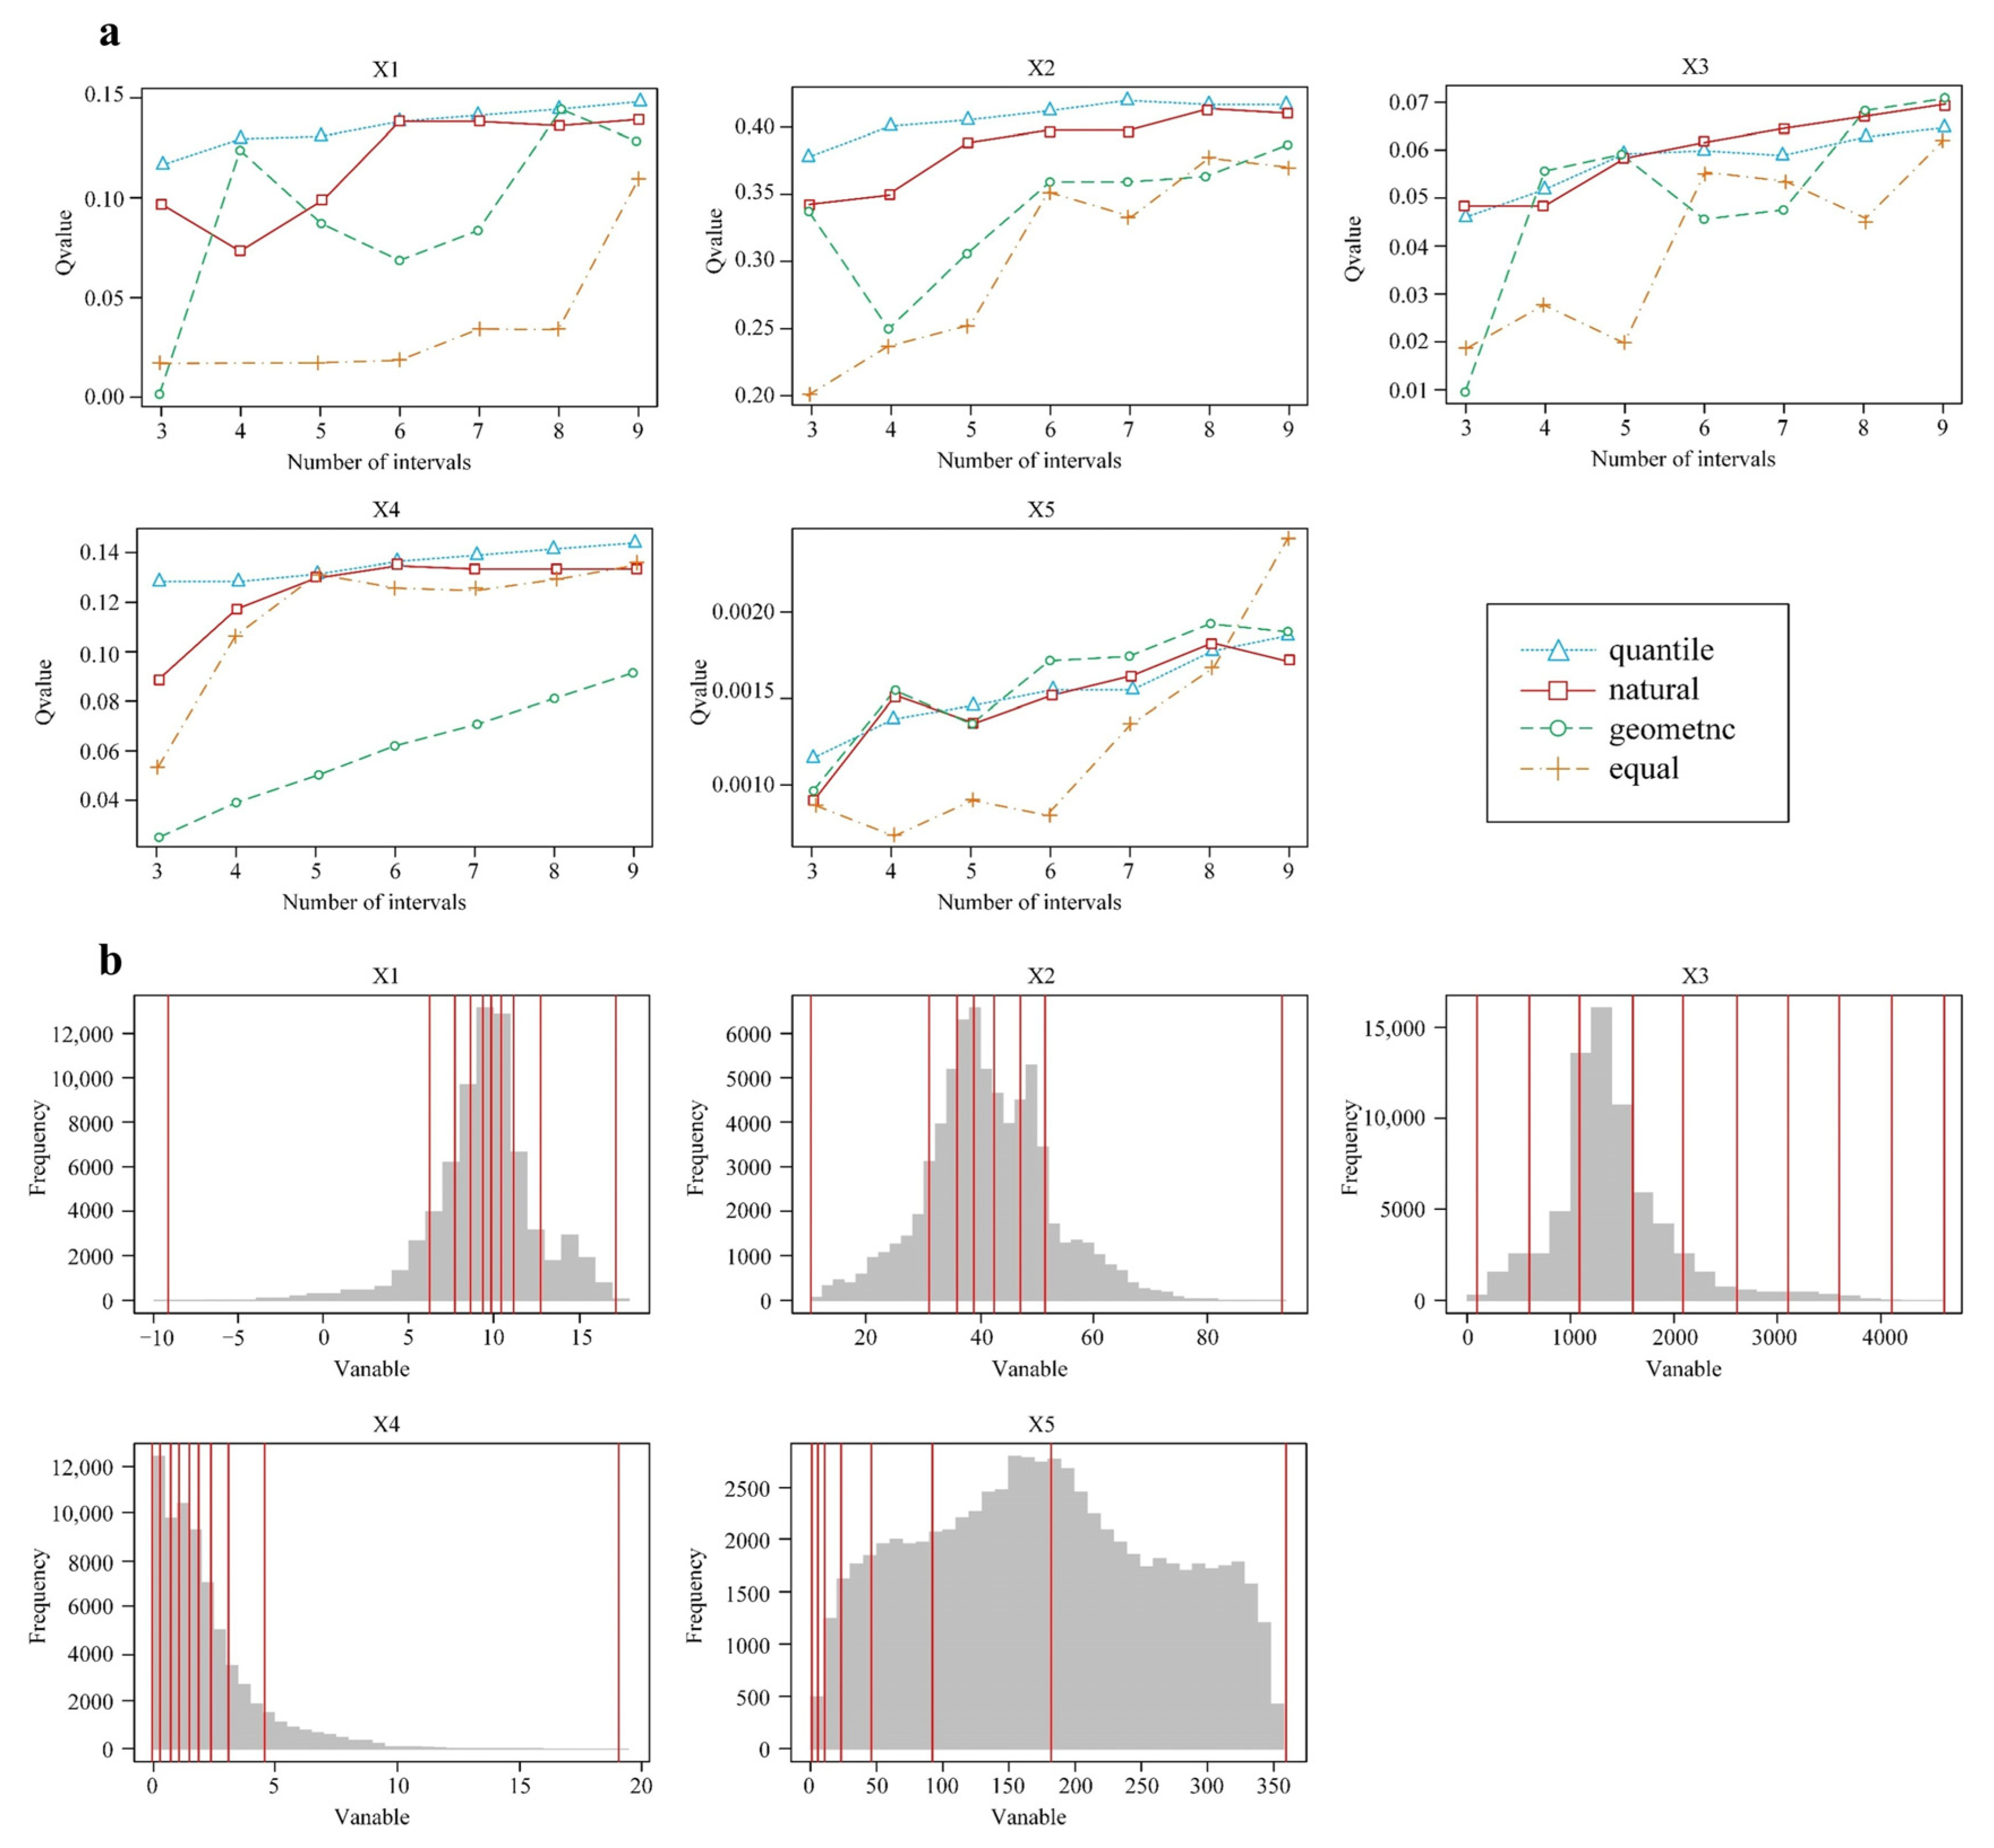
In this study, as Figure 3, continuous variables were discretized using the natural breaks method [39]. The optimal scheme was selected by testing 3–9 classification levels and comparing q values. Parameter sensitivity analysis was conducted, showing that the coefficient of variation in q values was less than 0.05 under different discretization levels, indicating stable explanatory power and reliable results (Table 3).

2.3.4. Spatial Autocorrelation and Robustness Analysis

To quantify the spatial clustering pattern of fractional vegetation cover (FVC), we calculated the Global Moran’s I and Local Indicators of Spatial Association (LISA) based on the annual mean FVC from 2000 to 2024. Global Moran’s I measures overall spatial autocorrelation, with values ranging from −1 to 1; positive values indicate clustering of similar values (high–high or low–low). LISA identifies local clusters and outliers. Statistical significance was assessed using 999 permutations.
For robustness testing, we performed two complementary analyses. First, we conducted a sensitivity analysis of the optimal parameter geographic detector (OPGD) model by varying the number of discretization classes from 3 to 9 and recomputing the q-values for each driving factor. The coefficient of variation in the q-values across different discretization levels was calculated to evaluate stability.

2.3.5. Residual Analysis

Residual analysis constitutes an important methodological branch in ecological remote sensing and global change research [13]. Its core principle lies in constructing a climate–vegetation relational model to predict vegetation conditions driven solely by climatic factors; the discrepancy between climate-predicted vegetation status and remotely sensed observed vegetation status is defined as residuals, which are primarily interpreted as signals reflecting anthropogenic impacts. The corresponding calculation formula is expressed as follows:
N P P P = a × T + b × P + C
N P P H = N P P N P P P
where N P P P is the predicted NPP value based on temperature and precipitation, representing the impact of climate change on NPP; N P P H is the residual, which reflects the impact of human activities on NPP; T and P denote temperature and precipitation, respectively; and a , b and C are model parameters.

2.3.6. Spatial Autocorrelation Analysis

Spatial autocorrelation analysis is used to measure whether the distribution of spatial variables exhibits clustering, and it includes two aspects: global spatial autocorrelation and local spatial autocorrelation [40]. To reveal the spatial correlation between multiple variables, Anselin further proposed bivariate spatial autocorrelation, which quantifies the correlation between the attribute value of a spatial unit and other attribute values in adjacent spaces.
Global spatial autocorrelation reflects the overall similarity between each geographical unit and its neighboring units across the entire study area. Global Moran’s I is a widely used statistic for global autocorrelation, calculated as follows:
I = i = 1 n j = 1 n w i j ( x i x ¯ ) ( x j x ¯ ) S 2 ( i j w i j )
Local spatial autocorrelation indicators, often referred to as Local Indicators of Spatial Association (LISA), are commonly measured using the local Moran’s I statistic. This metric is used to accurately capture the clustering and differentiation characteristics of local spatial features. LISA distribution maps are drawn based on the z-test (p < 0.05), and the calculation formula is:
I i = ( x i x ¯ ) j = 1 n w i j ( x i x ¯ ) S 2
where n is the number of spatial units; x i and x j represent the observed values of unit i and unit j, respectively; ( x i x ¯ ) is the deviation between the observed value of the i-th spatial unit and the mean value; w i j is the spatial weight matrix constructed based on the spatial k-neighboring relationship; and the variance S 2 = 1 n i = 1 n ( x i x ¯ ) 2 .

3. Results and Analysis

3.1. Vegetation Coverage Change Characteristics

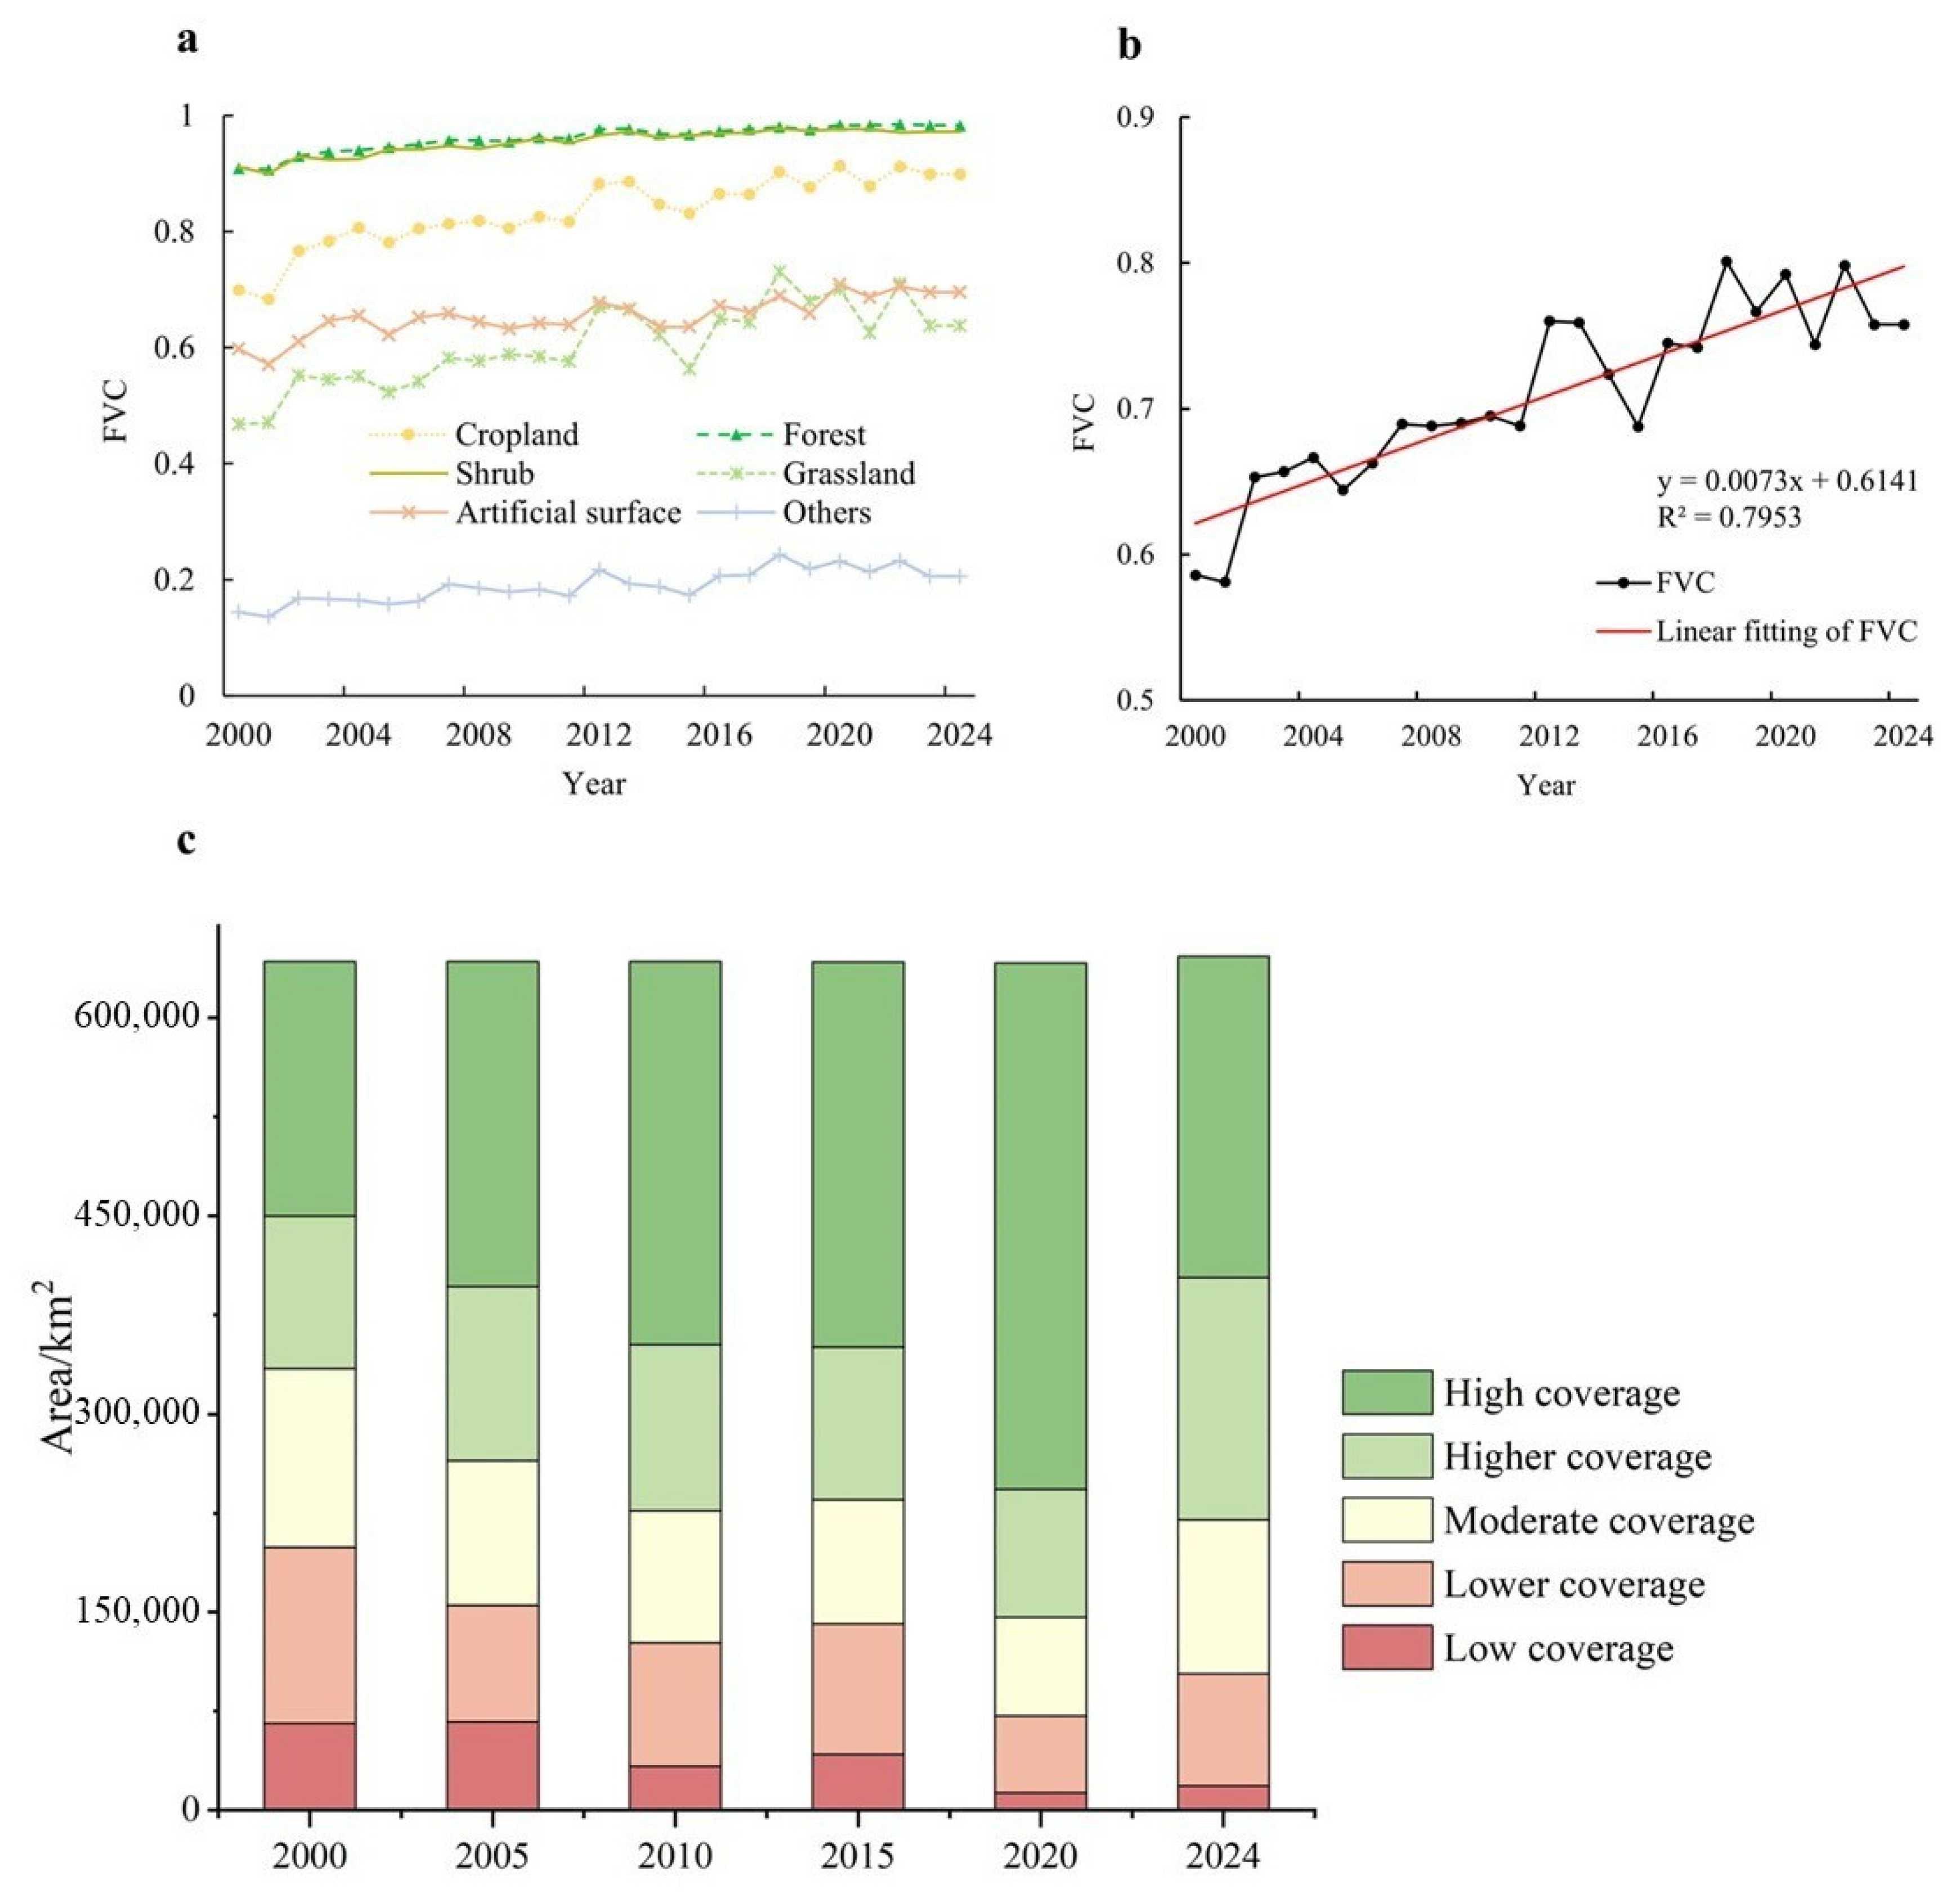
Figure 4 illustrates the interannual variation in the Fractional Vegetation Cover (FVC) across the Loess Plateau from 2000 to 2024. Overall, FVC values exhibited marked differences among land use types. Forests and shrublands maintained consistently high FVC levels with stable trends throughout the 25-year period. In contrast, croplands and grasslands displayed fluctuating upward trends, with notable variability around 2016 (Figure 4a). As shown in Figure 4b, FVC across the Loess Plateau fluctuated considerably, generally ranging between 0.55 and 0.80, with a mean value of 0.71, indicating a relatively high vegetation cover level. FVC increased from 0.59 in 2000 to 0.76 in 2024, corresponding to an average annual increase of 0.0073 per year, reflecting an overall upward but fluctuating trajectory. The lowest FVC (0.58) was recorded in 2001, while the highest (0.80) occurred in 2018.
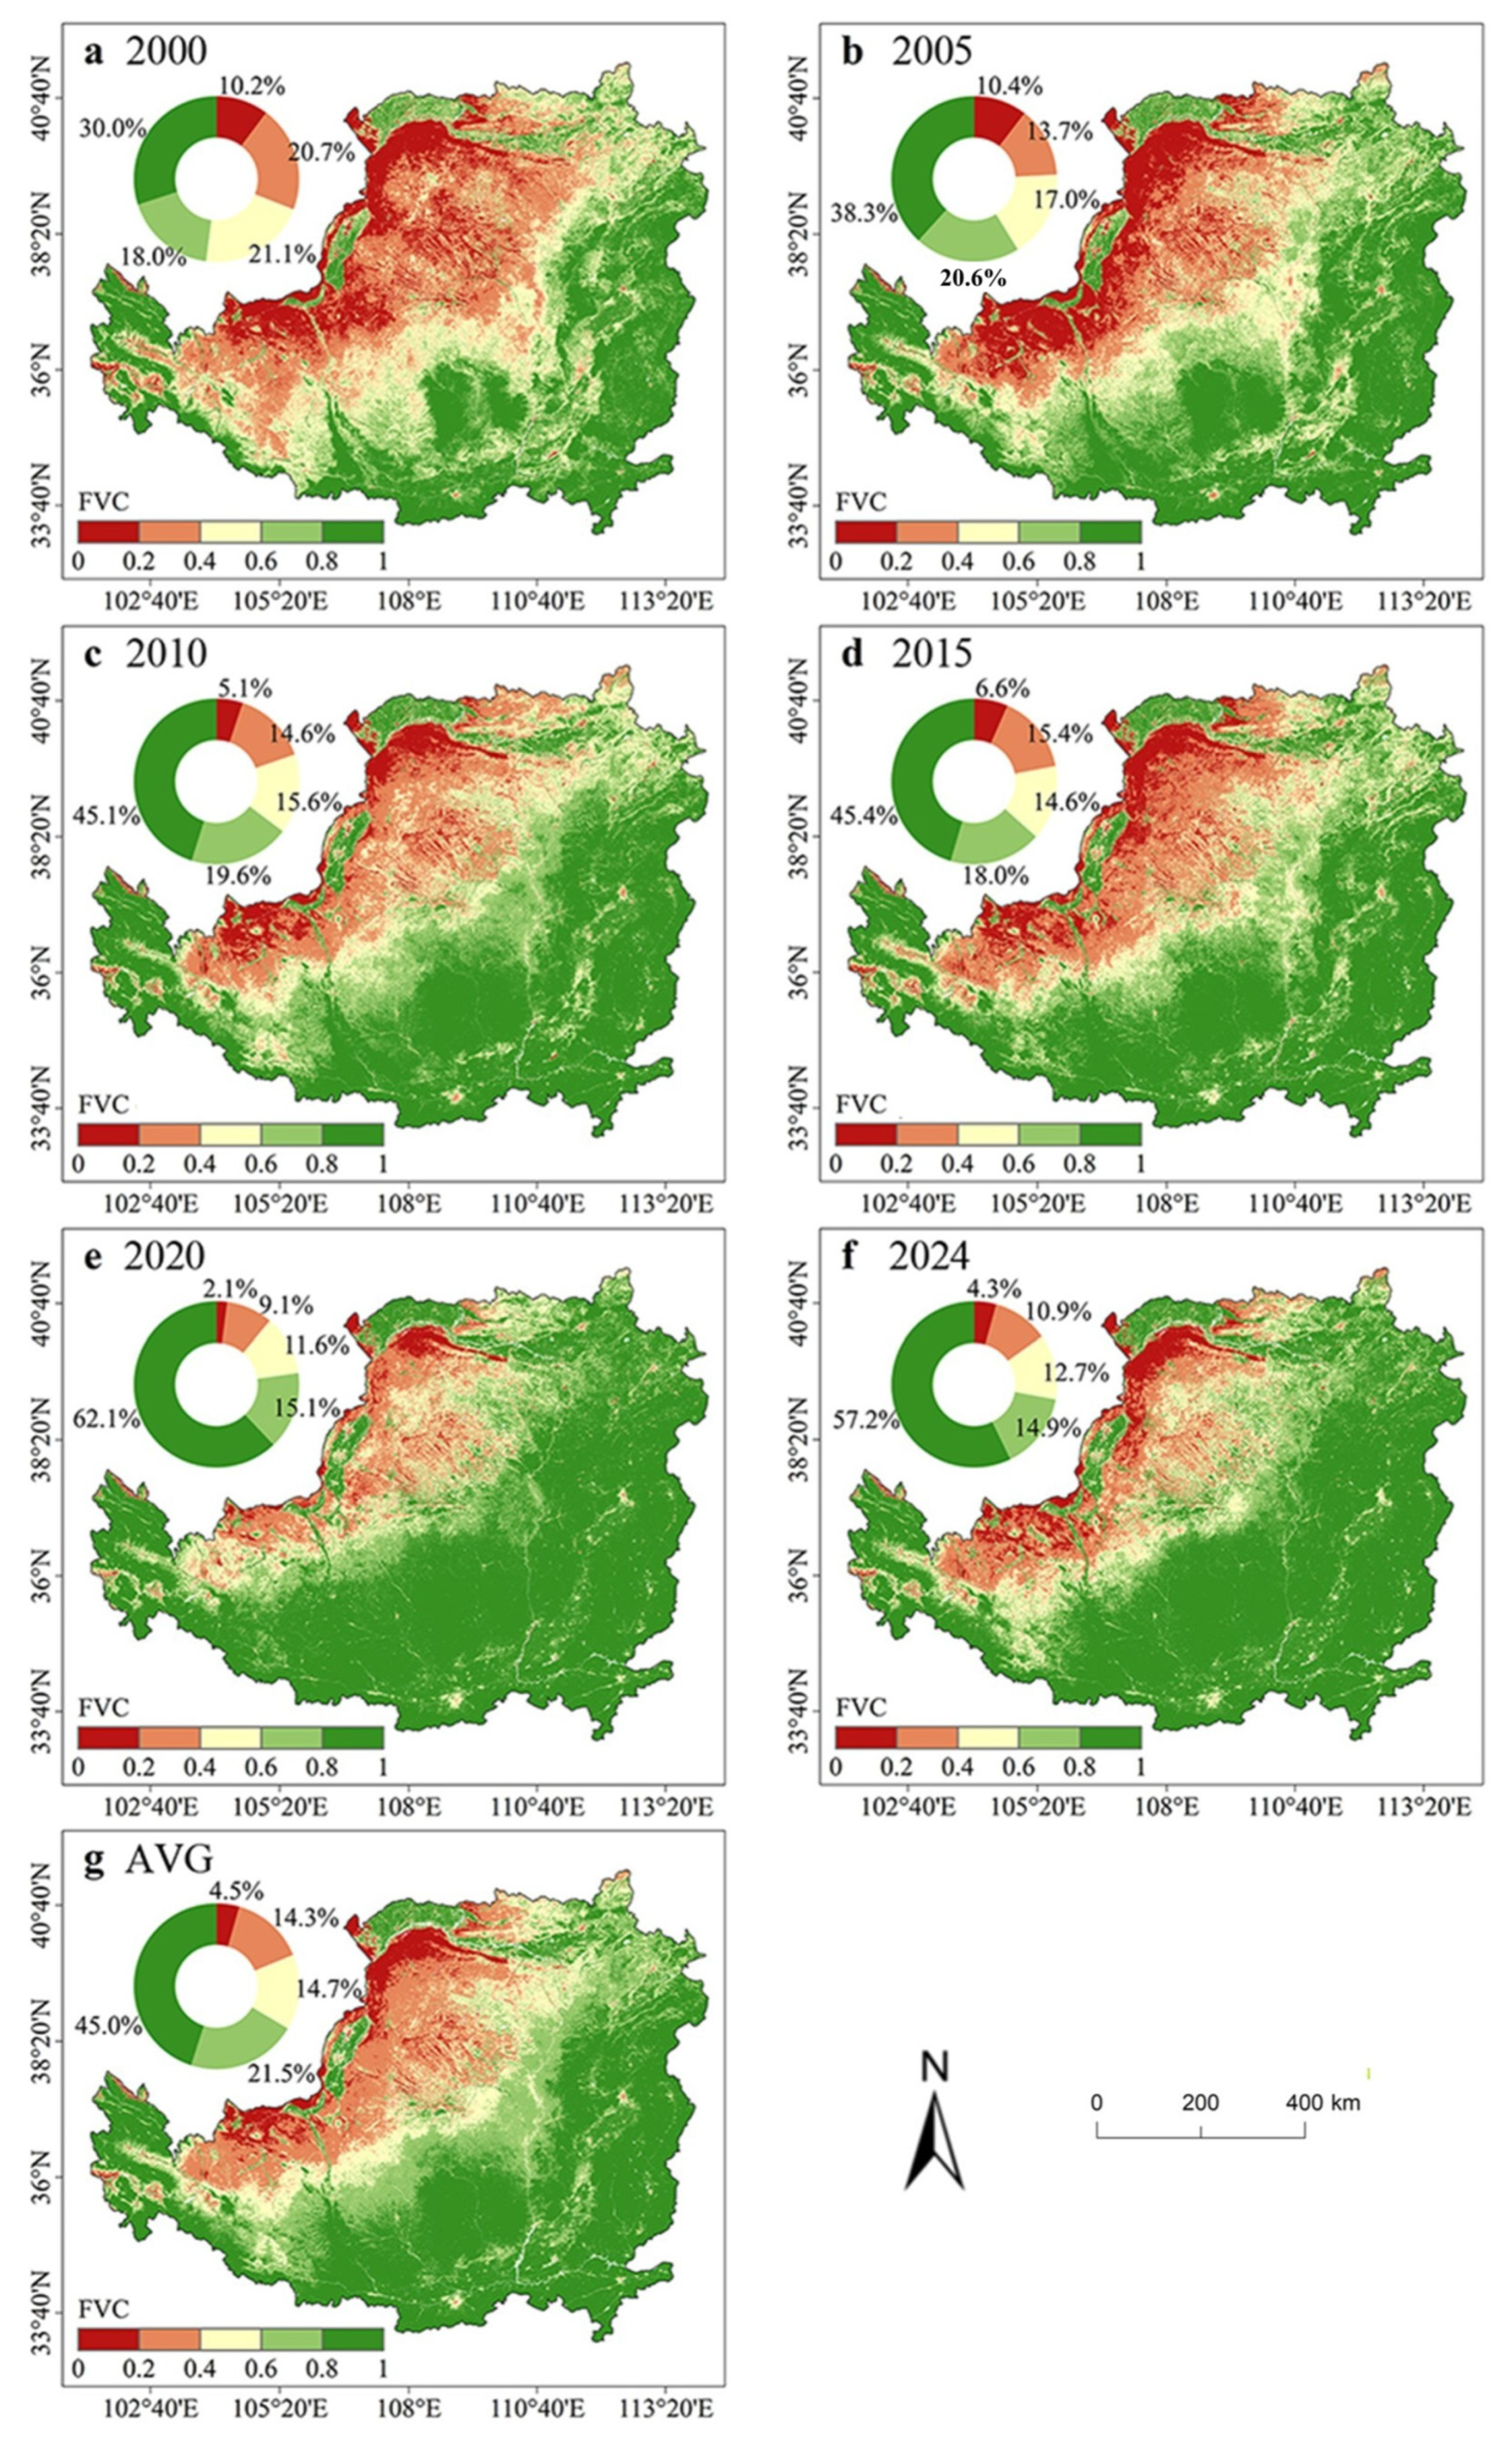
Figure 4c presents the areal statistics for different FVC levels. From 2000 to 2024, areas classified as Medium, Relatively High, and High FVC exhibited fluctuating upward trends, whereas those with Relatively Low and Low FVC showed fluctuating declines. Over the 25-year period, the area of Low FVC decreased substantially from 65,900.50 km2 in 2000 to 18,397.36 km2 in 2024, representing a reduction of 72.08%. Conversely, the area of High FVC expanded from 192,937.56 km2 to 243,260.44 km2 over the same period, an increase of 26.08%. Notably, the High FVC area peaked at 398,296.56 km2 (approximately 62.1% of the total study area) in 2020, then declined sharply to 243,260.44 km2 by 2024, a reduction of 38.9% compared with the 2020 maximum. This abrupt post-2020 drop represents a critical turning point in regional vegetation dynamics. The results reveal the following patterns: (1) The northwestern region exhibited a continuous increasing trend in FVC throughout the study period. (2) The central region displayed distinct phase-based fluctuation characteristics, with rapid growth (2000–2010), a slight decline (2010–2015), significant recovery (2015–2020), and another minor decrease (2020–2024). (3) Spatially, the mean FVC in the southeastern part was substantially higher than that in the northwest. Over the 25 years, the overall spatial pattern of FVC across the region followed a clear southeast-to-northwest gradient, characterized by a “High–Medium–Low” distribution.
Statistical analysis by FVC grade (Figure 5) reveals a pronounced transformation in vegetation coverage patterns over the 25-year period. In 2000, High FVC areas constituted only 10.2% of the region, whereas Medium and Low FVC areas each exceeded 38%, exhibiting an imbalanced spatial pattern characterized as “low in the northwest, high in the southeast.” By 2024, the proportion of High FVC areas had increased substantially to 57.2%, maintaining a high level with only localized patches of Medium and Low FVC remaining. Overall, vegetation coverage across the Loess Plateau progressively transitioned from an initial state marked by significant spatial heterogeneity and low-coverage dominance to a pattern characterized by region-wide high coverage and more balanced spatial distribution. The continuous and substantial expansion of high-coverage areas, coupled with the concurrent contraction of medium- and low-coverage areas, reflects the effectiveness of ecological restoration efforts from a spatial perspective.
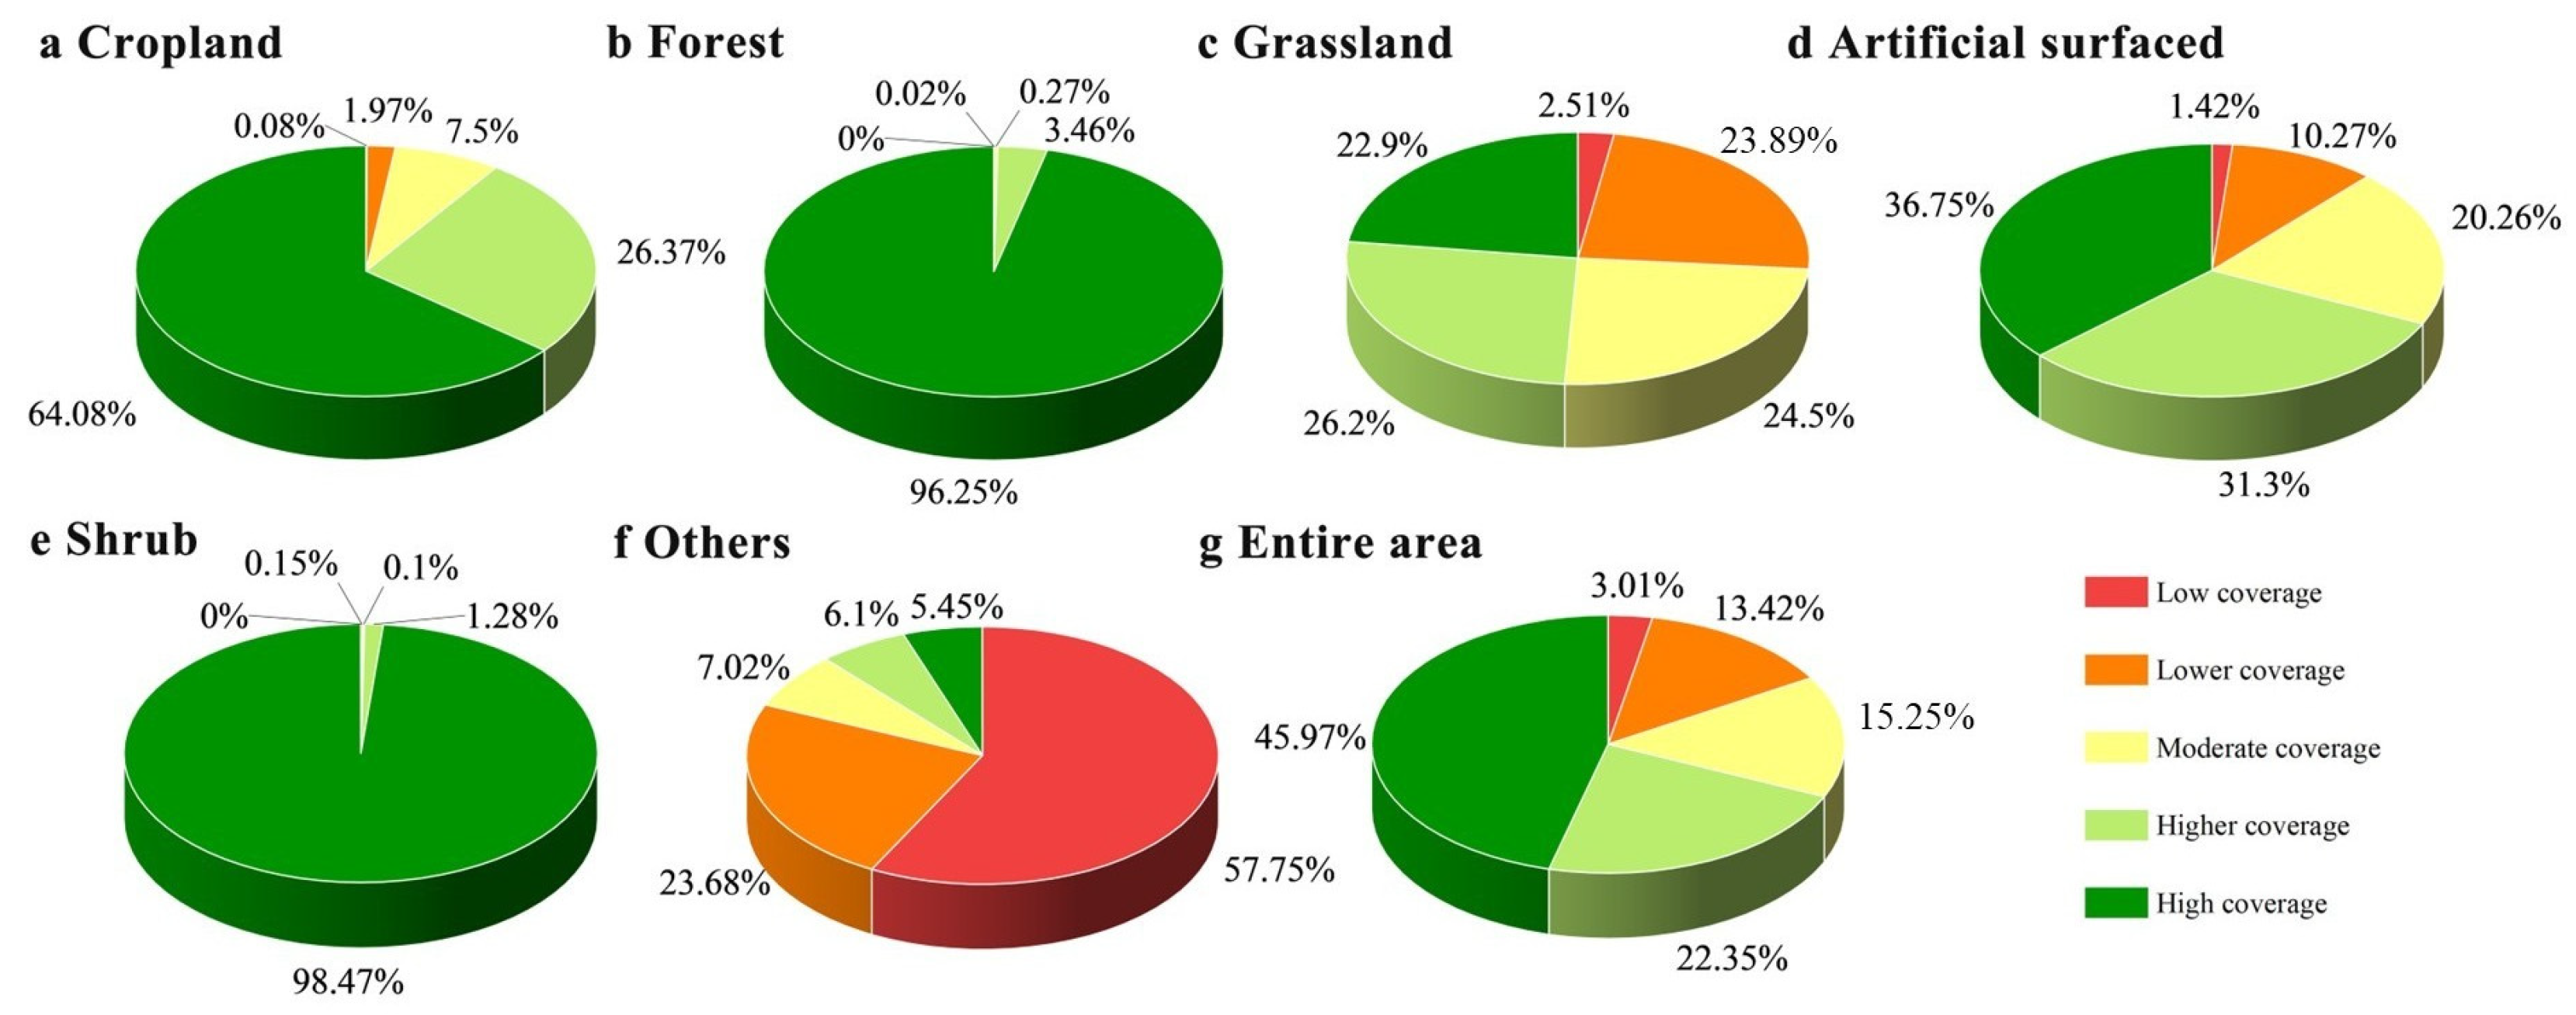
Overlay analysis of FVC with land use types (Figure 6) reveals the proportional distribution of different FVC levels within each land cover category. For cropland, FVC spans all levels due to variations in crop types. Forestland and shrubland are overwhelmingly dominated by High FVC, accounting for 96.25% and 98.47% of their respective areas. Grassland exhibits a relatively even distribution of FVC between 0.2 and 1.0, with Low FVC areas comprising only 2.51%. This distribution pattern reflects the Loess Plateau’s position as a transition zone between China’s eastern humid region and western arid region, where hydrothermal gradients support diverse grassland types ranging from meadow steppe to desert steppe. For artificial surfaces, FVC is primarily concentrated in the High (36.75%), Relatively High (31.30%), and Medium (20.26%) levels. In contrast, other land use types are predominantly characterized by Low and Relatively Low FVC, accounting for 57.75% and 23.68% respectively. Region-wide, 45.97% of the total area exhibits High FVC.

3.2. Vegetation Coverage Change Trend

3.2.1. Interannual Change Trend of FVC

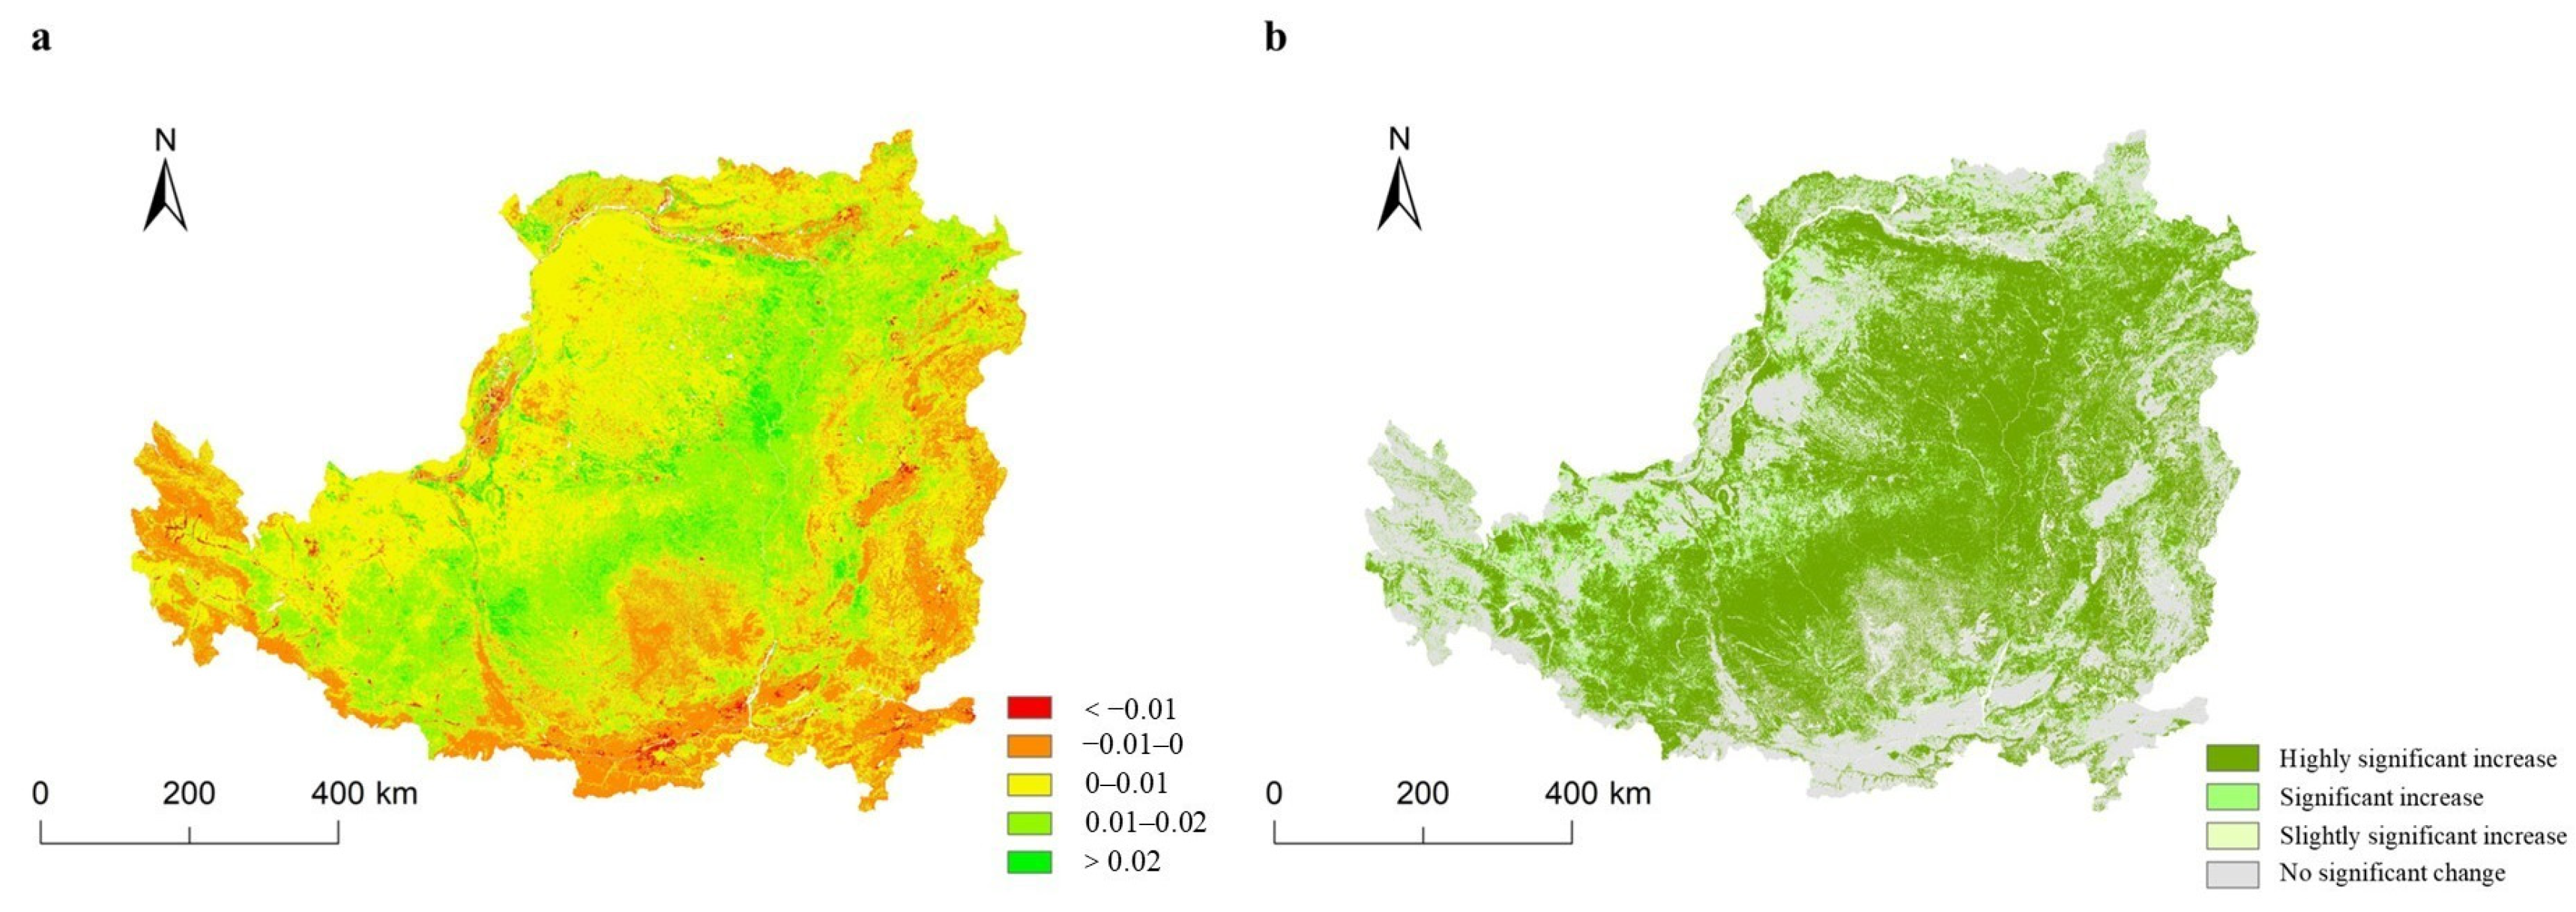
The spatial distribution of interannual FVC change trends from 2000 to 2024 was analyzed by calculating Sen’s slope per pixel, combined with significance testing using the Mann–Kendall method and Hurst Index (Figure 7). As shown in Figure 7a, FVC change rates across the Loess Plateau ranged from −0.027 to 0.024, with a mean value of 0.006, indicating an overall increasing trend. Spatially (Figure 7b), areas exhibiting Extremely Significant Increase and Significant Increase accounted for the largest proportion (67.92%), primarily concentrated in the central and southwestern parts of the study area. Areas with No Significant Change were distributed in patches throughout the southeast, northwest, and some marginal zones, comprising 31.27% of the region. Areas with Slightly Significant Increase occupied only a minimal proportion. These findings reflect the substantial effectiveness of recent ecological protection and restoration measures implemented across the Loess Plateau.

3.2.2. Long-Term Persistence of FVC Trends

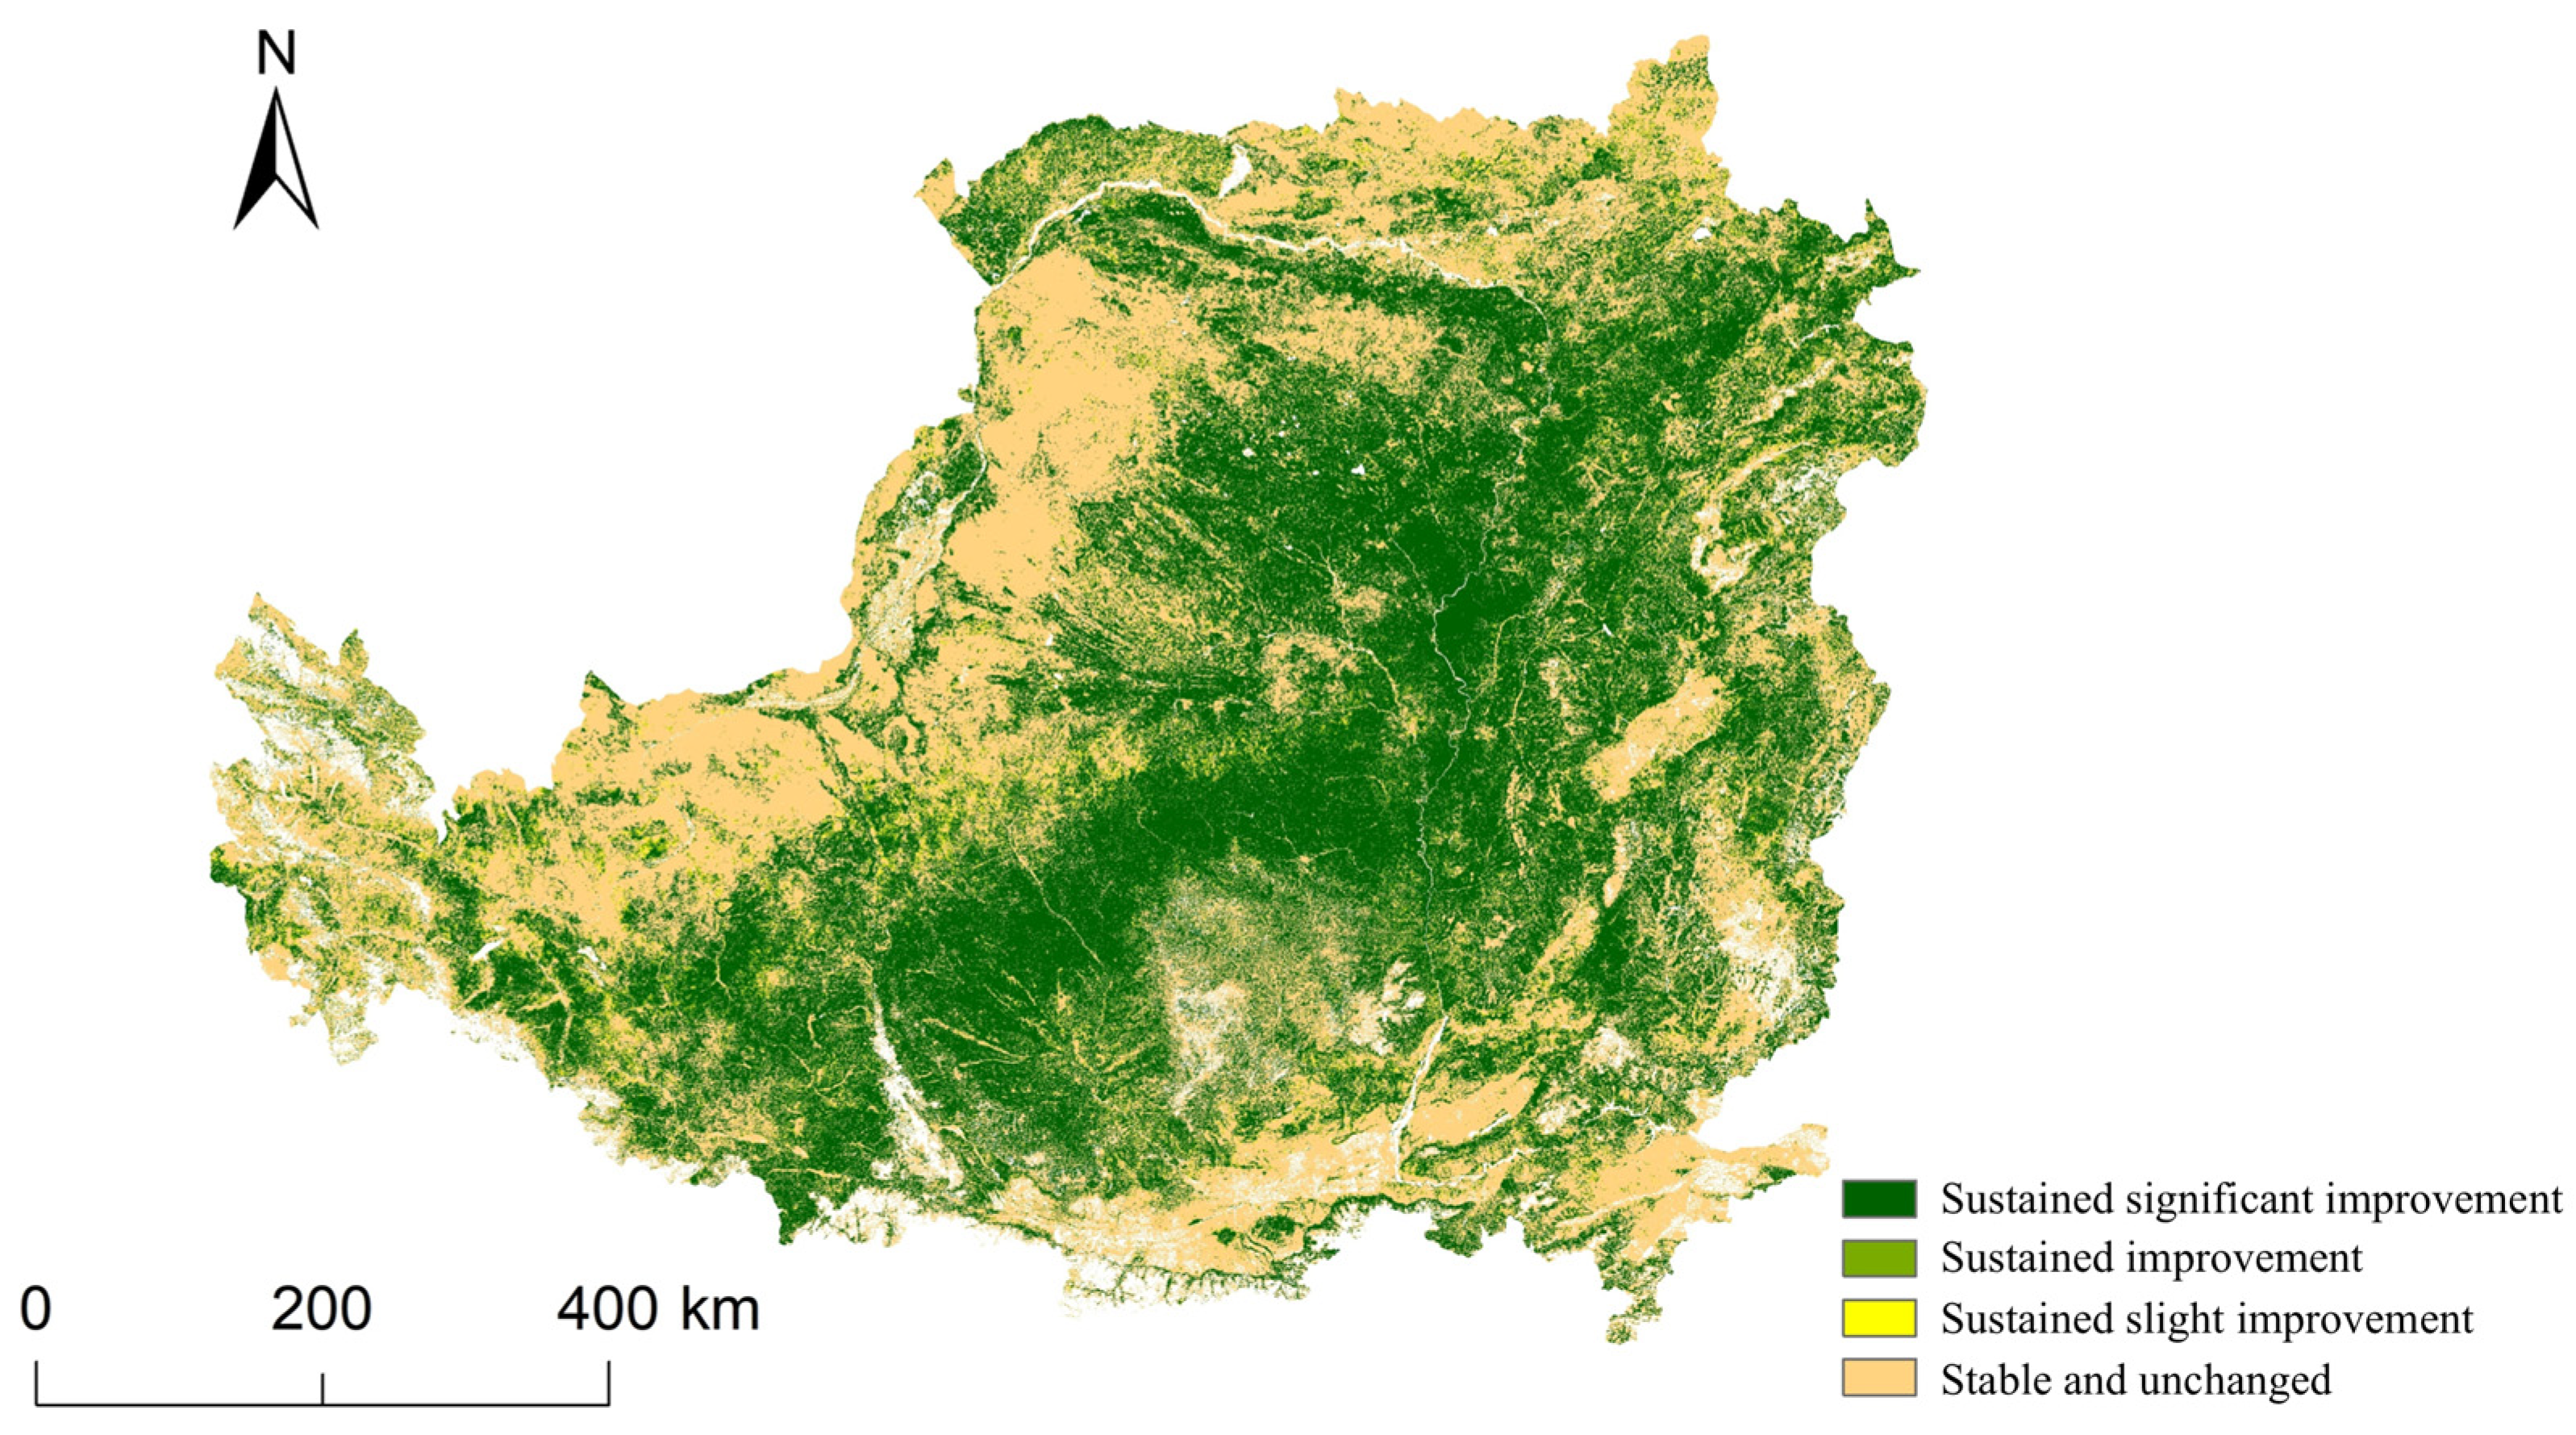
The Hurst index was calculated using FVC data from 2000 to 2024. The resulting spatial distribution map (Figure 8) represents the long-term persistence or anti-persistence of historical FVC trends, rather than a direct forecast of future changes (Figure 8). The analysis reveals distinct regional patterns: the central area exhibits strong persistence in its increasing trend, while the northwestern and southeastern marginal zones demonstrate stable trends. The FVC change trend displays significant spatial heterogeneity, characterized by a center-radiating pattern with decreasing intensity outward. Within the study area, 60.99% of the region shows a tendency toward FVC improvement (dominant trend), while 38.86% exhibits a tendency to remain stable. Given this pronounced spatial heterogeneity, peaking at 398,296.56 km2, implementing hierarchical management and control strategies is recommended. Areas where the historical declining trend exhibits positive persistence warrant special attention, as past decreases may continue. Targeted vegetation protection and restoration measures should be formulated for these locations.

3.3. Spatial Autocorrelation of FVC

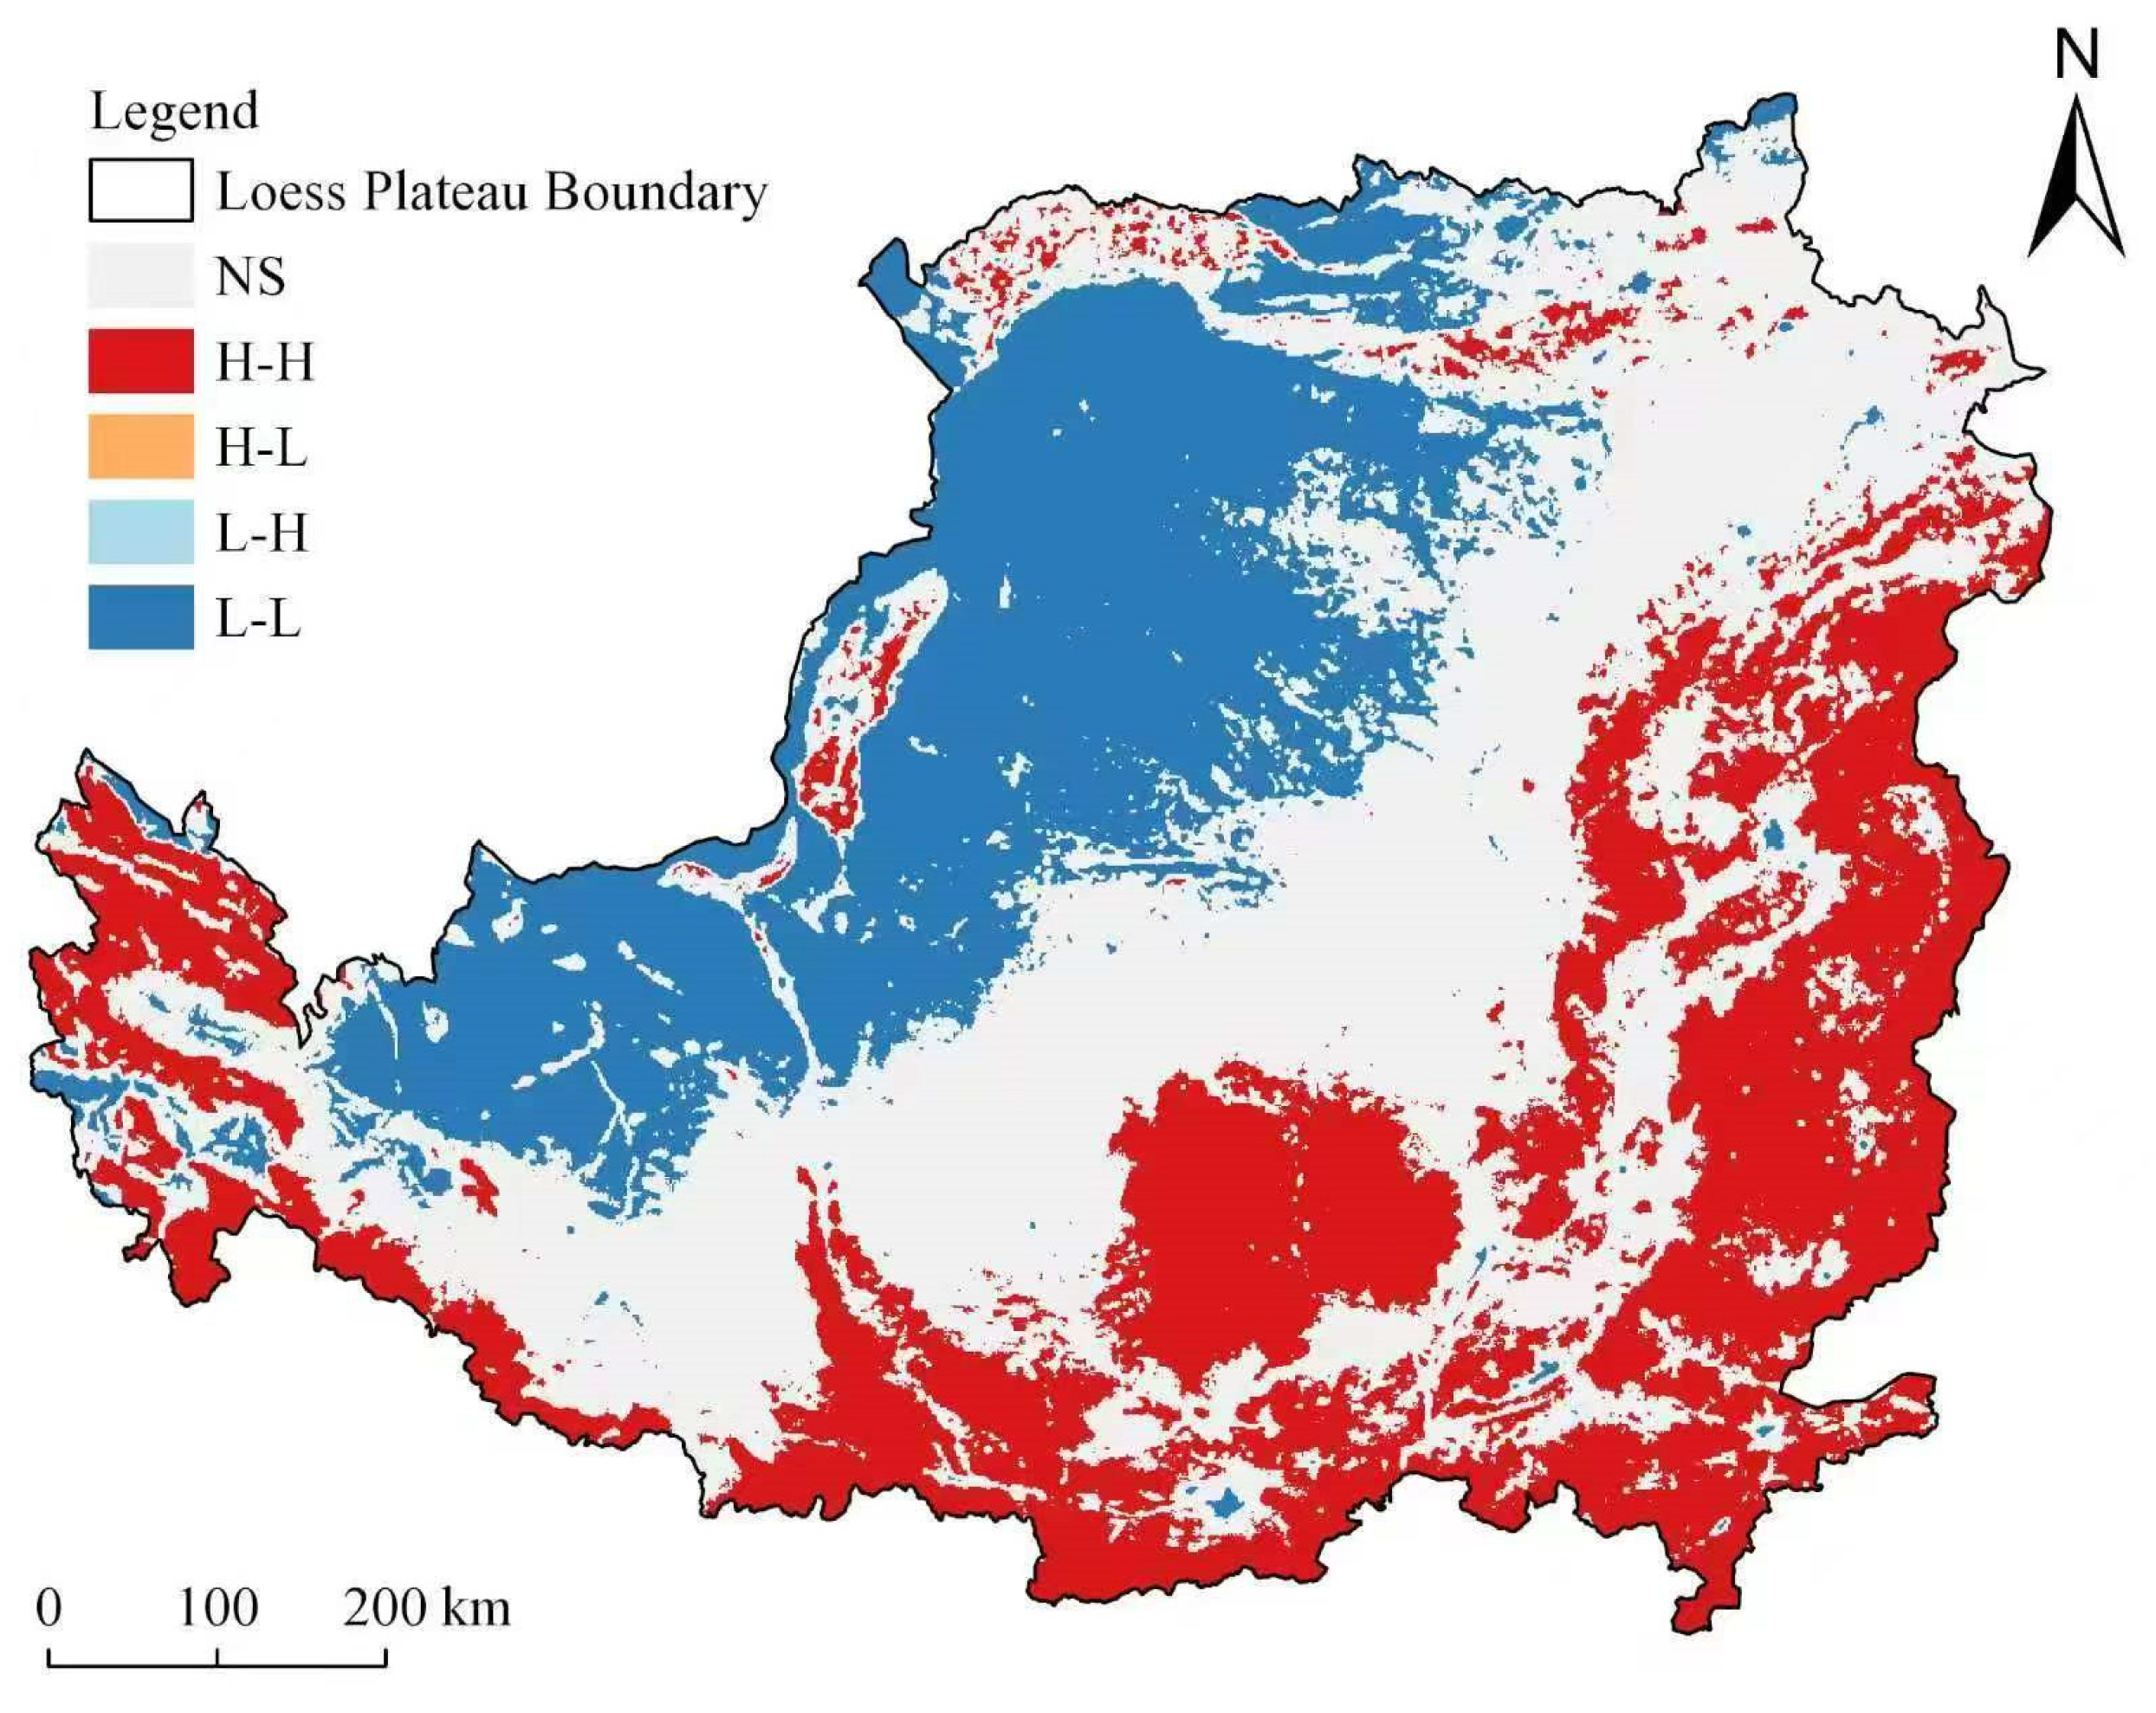
The Global Moran’s I for annual mean FVC over the Loess Plateau from 2000 to 2024 was 0.37 (p < 0.01), indicating significant positive spatial autocorrelation. This means that pixels with similar FVC values tend to cluster together rather than being randomly distributed. The LISA cluster map (Figure 9) shows that high–high clusters (red) are mainly concentrated in the southeastern part of the study area, while low–low clusters (blue) dominate the northwestern part. This pattern is consistent with the “northwest low–southeast high” gradient of vegetation coverage.
Variance decomposition further revealed that spatial structural differences contributed 39.2% to the overall spatial variation in FVC. This result confirms that the observed spatial pattern is a real ecological phenomenon rather than an artifact of data processing or methodological choices. The spatial autocorrelation analysis thus provides a quantitative basis for the subsequent factor detection and supports the need for regionally differentiated ecological management.

3.4. Optimal Parameter Geographic Detector Analysis of FVC Change Drivers

3.4.1. Factor Detection Analysis

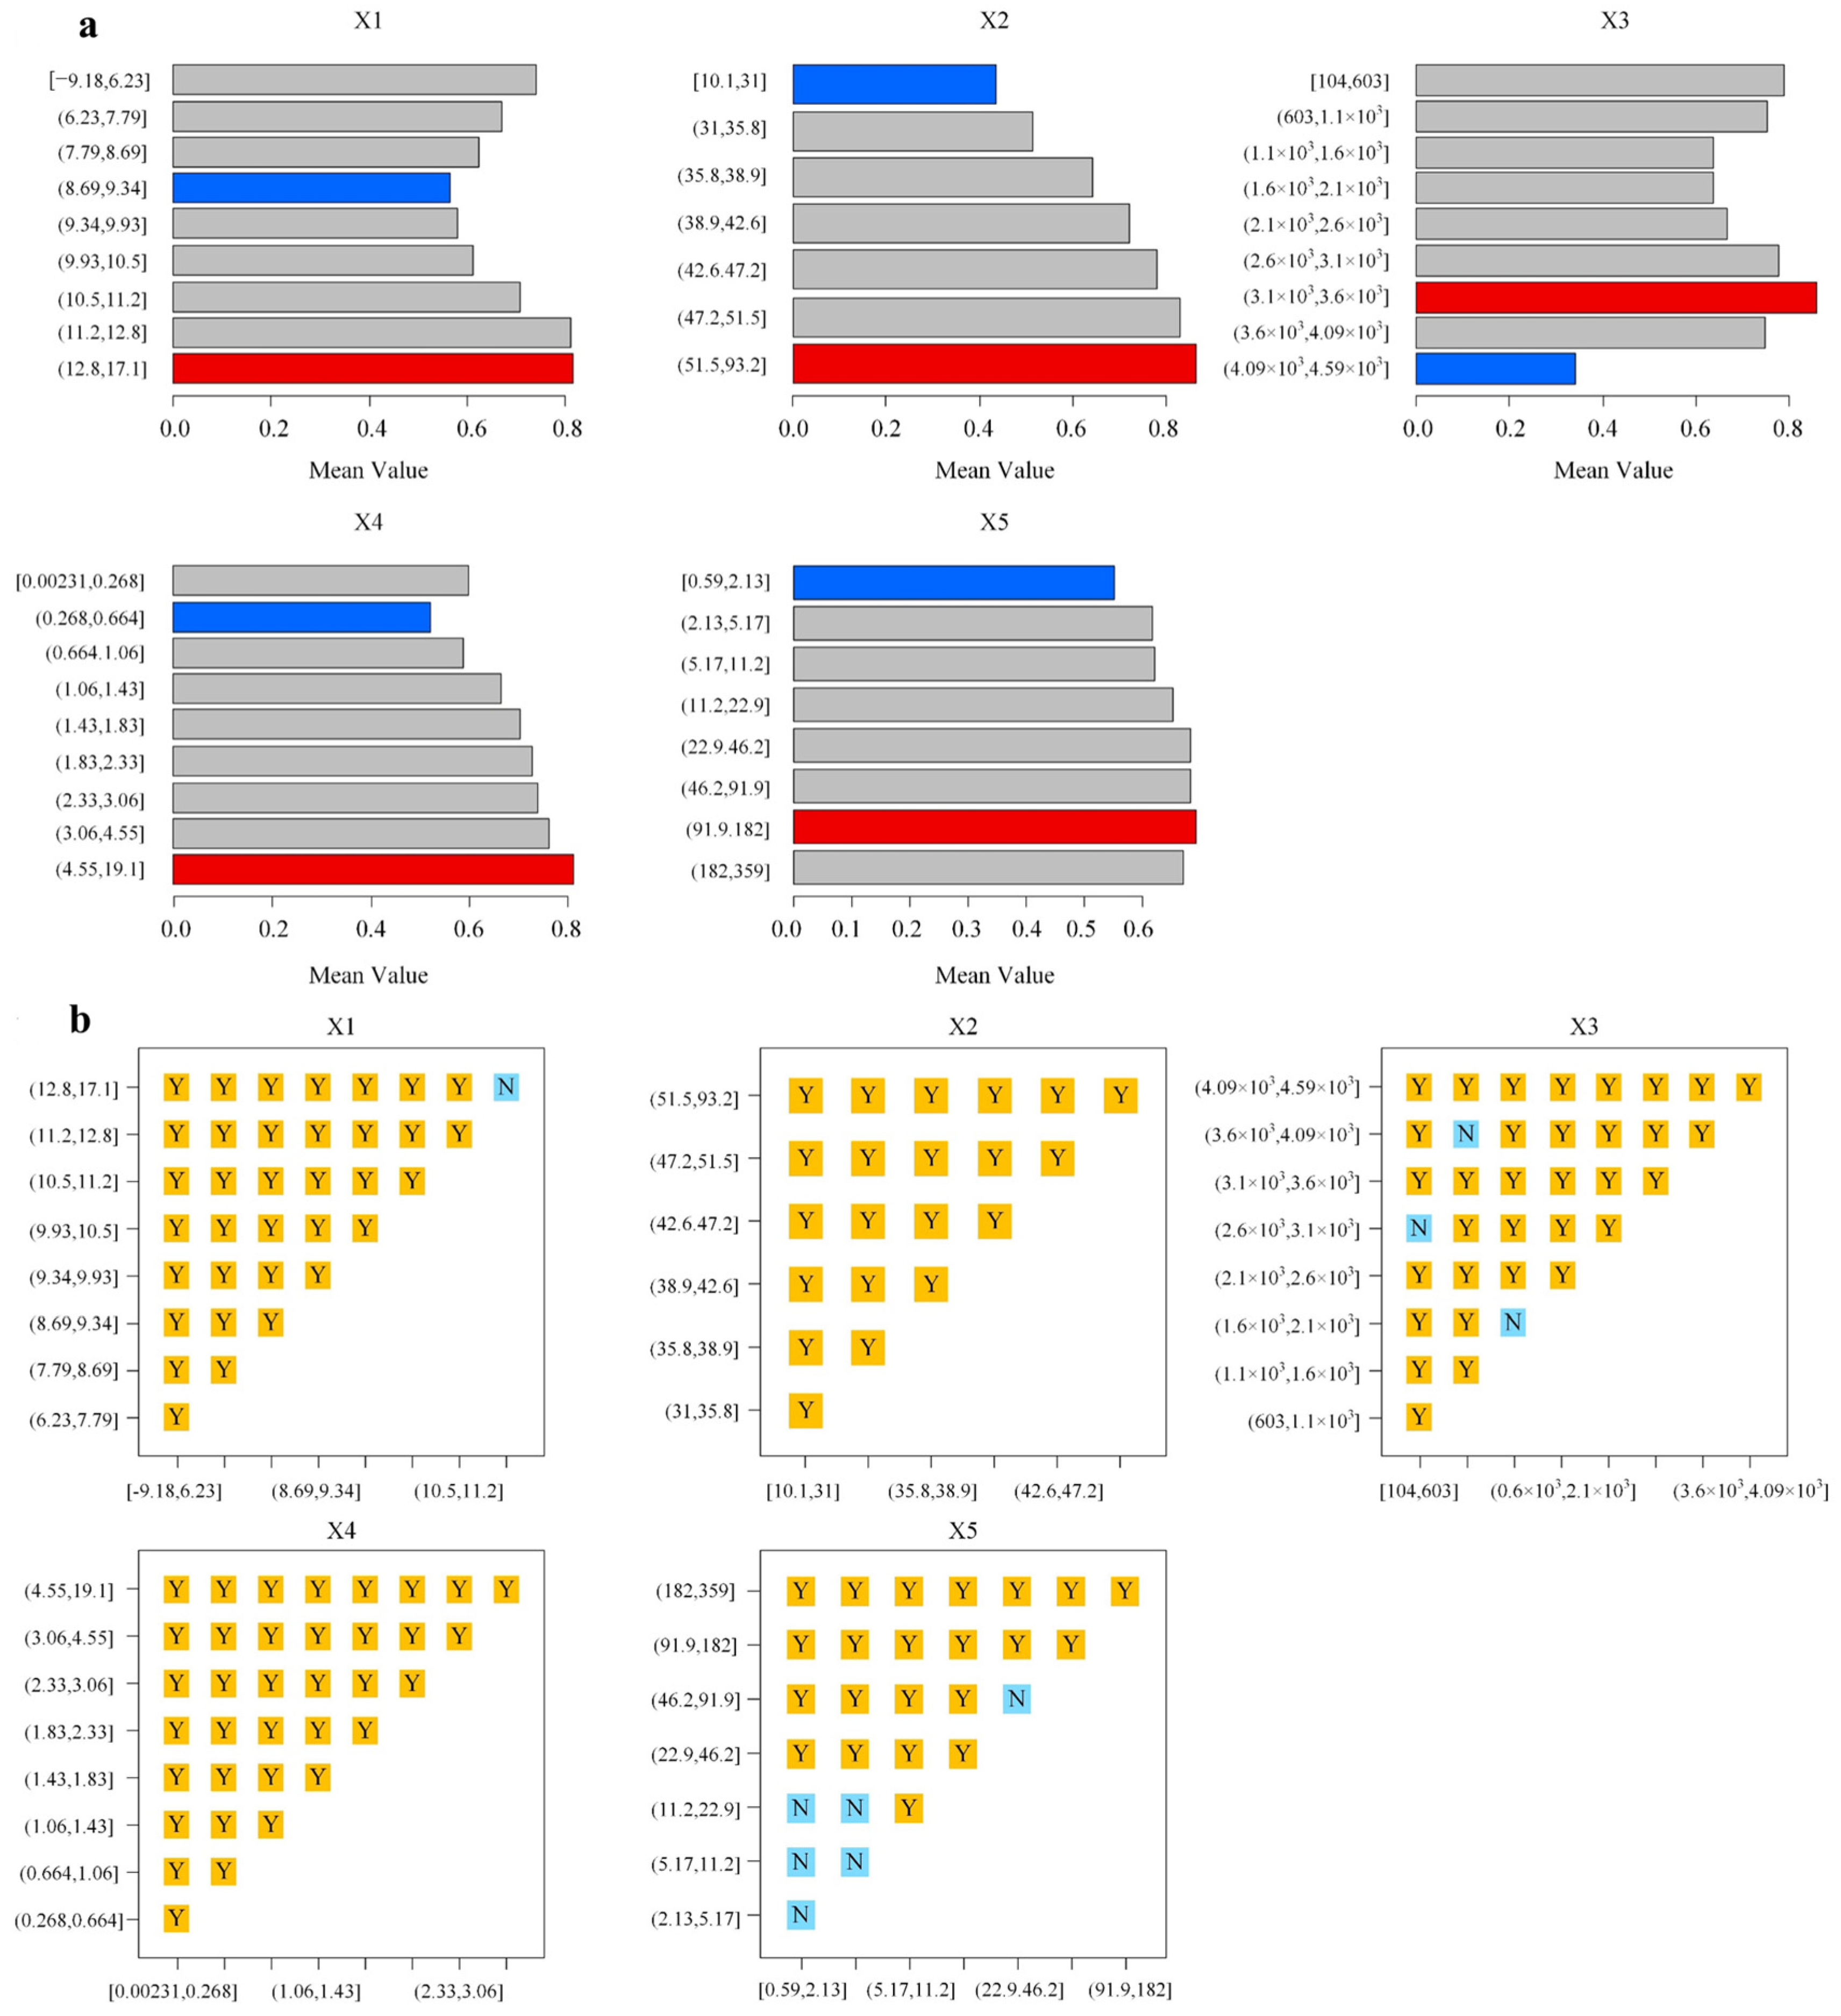
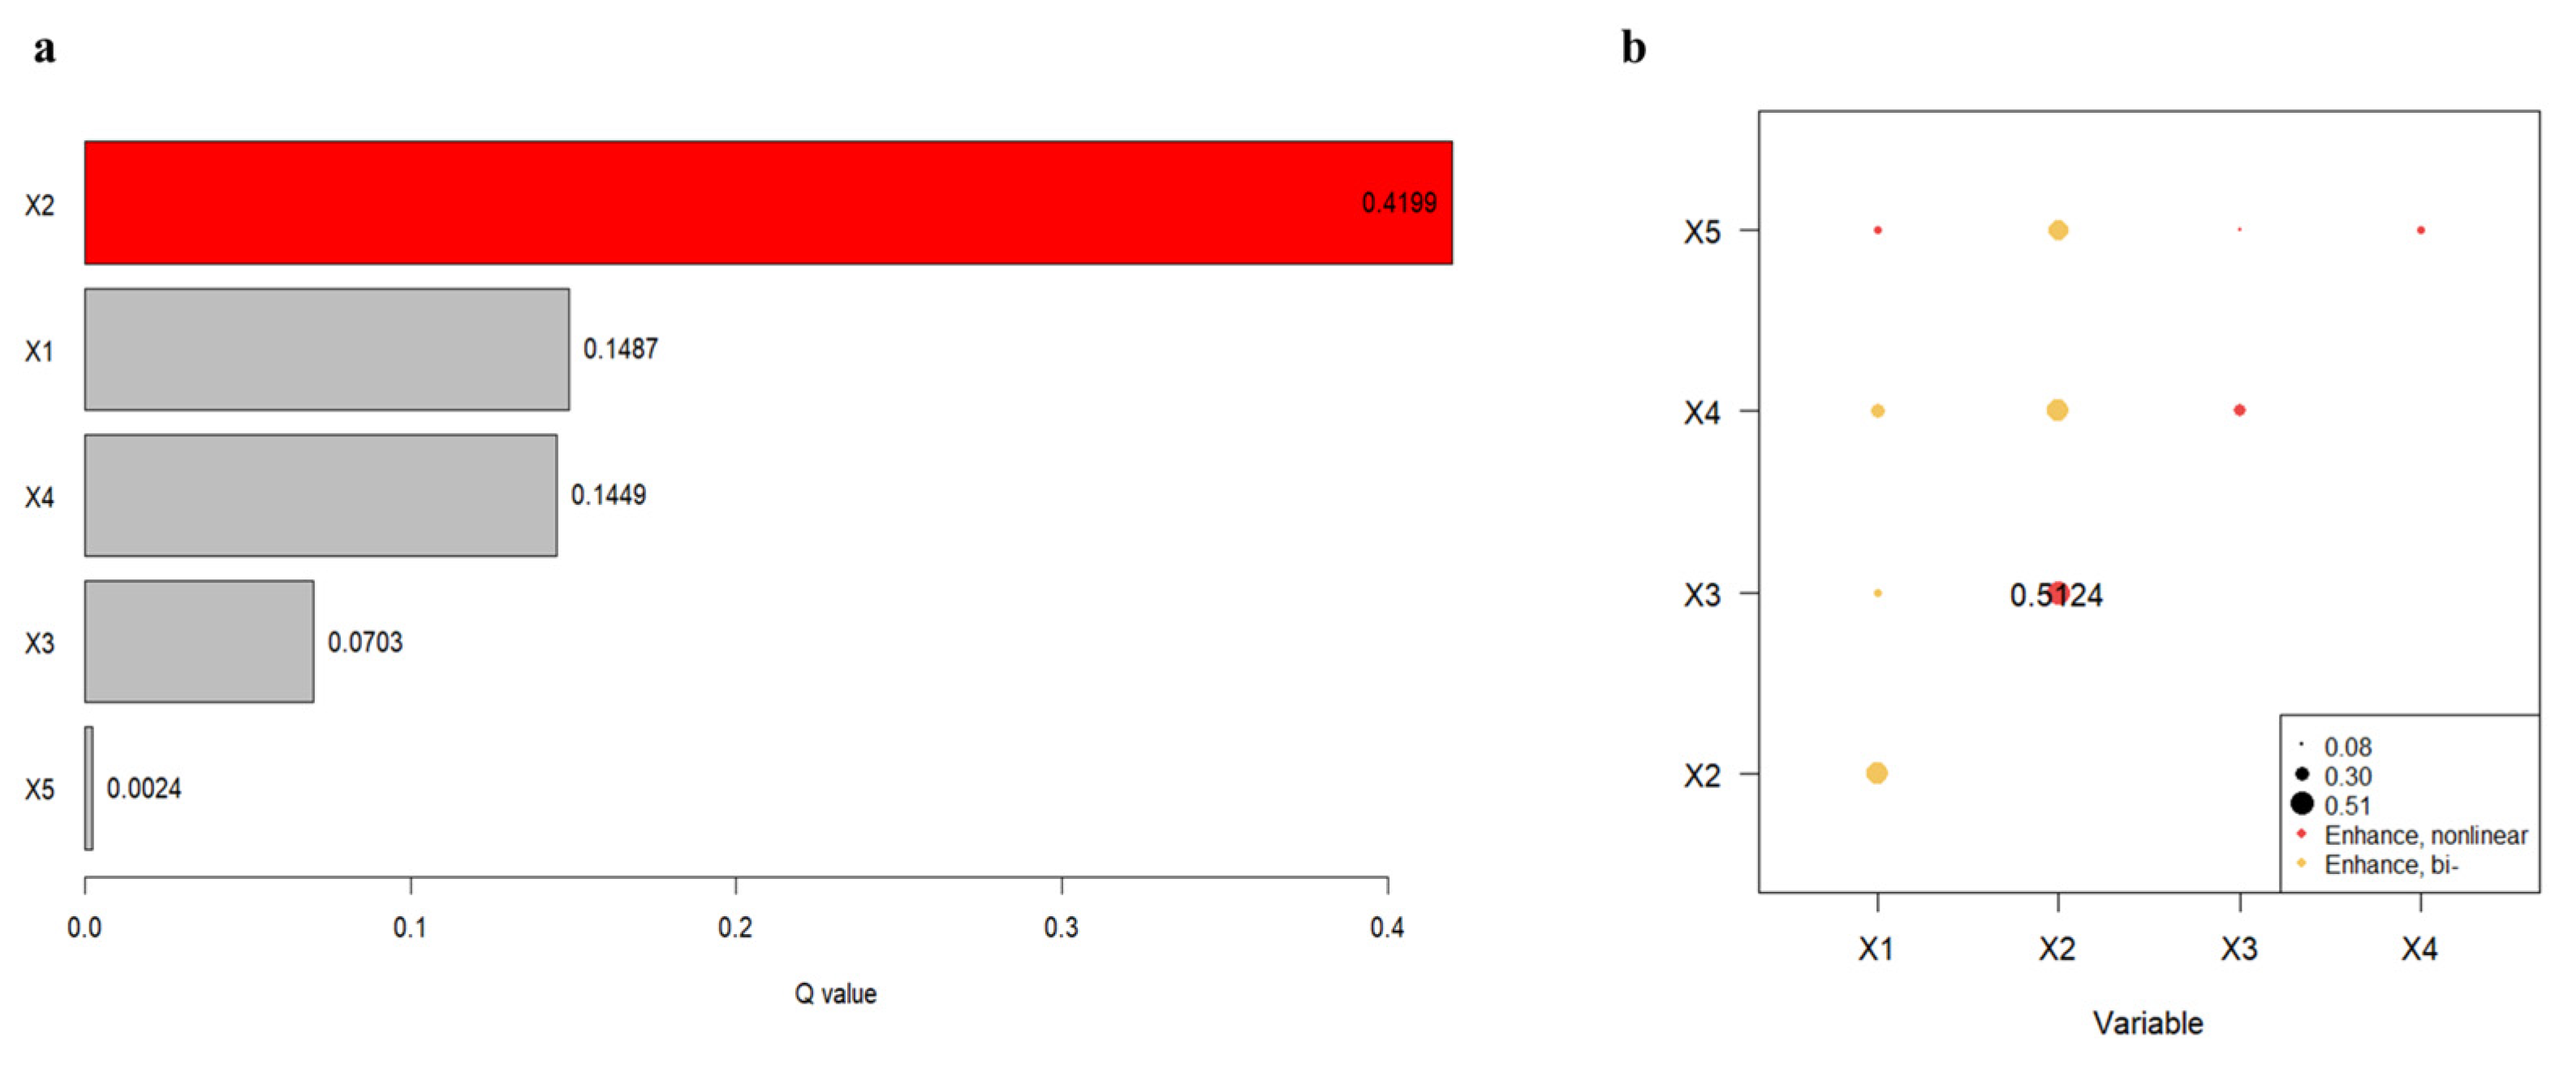
Five geographical factors were selected from climatic and topographic perspectives: temperature (X1), precipitation (X2), elevation (X3), slope (X4), and aspect (X5). Factor detection results (Figure 10a) reveal the explanatory power (q-value) of each factor for FVC spatial heterogeneity, ranked in descending order: MAP (X2, 0.4199), MAT (X1, 0.1487), SLO (X4, 0.1449), ELE (X3, 0.0703), and aspect (X5, 0.0210). Precipitation emerges as the dominant driver of FVC variation on the Loess Plateau, with explanatory power exceeding 40%. In contrast, elevation and aspect exhibit relatively minor direct influences on vegetation growth, both with explanatory power below 10%. These findings indicate that FVC spatial heterogeneity on the Loess Plateau is governed by a combination of meteorological and topographical factors.

3.4.2. Interaction Detection Analysis

Interaction detector analysis was employed to examine the effects of pairwise interactions among driving factors on FVC change (Figure 10b). The results reveal that interactions between any two factors predominantly exhibit “bilinear enhancement” and “nonlinear enhancement” effects, with no independent interactions detected. The q-values of all pairwise interactions exceeded those of individual factors, indicating that factor interactions further amplify their influence on the spatiotemporal heterogeneity of FVC.

3.4.3. Risk Detection Analysis

By quantifying the impact of different classification intervals of driving factors on vegetation growth, the types or ranges of factors favorable for vegetation growth were identified (Figure 11a). Significant differences exist in the effects of different factor intervals on FVC. Generally, higher factor values (within the studied ranges) are more conducive to vegetation growth. For the primary meteorological factors, vegetation growth accelerates when annual average temperature ranges from 12.8 °C to 17.1 °C, and annual average precipitation ranges from 515 mm to 932 mm. Furthermore, FVC exceeds 0.8—indicating a high level—when slope ranges from 4.55° to 19.5° and elevation ranges from 3100 m to 3600 m. These patterns are closely linked to the Loess Plateau’s natural environment, topographic features, and farming culture: Low-elevation areas show distinct FVC differences: intensively cultivated southeastern lowlands maintain high FVC due to cropland vegetation and ecological restoration, while northwestern lowlands suffer from sparse precipitation and intensive human disturbance, resulting in low FVC. In contrast, the natural environment of high-elevation steep slope areas is more favorable for vegetation growth. The risk matrix for vegetation change across different intervals of single factors is presented in Figure 10b, revealing varying levels of significance in the impact of different driver intervals on FVC spatial distribution.

3.4.4. Ecological Detection Analysis

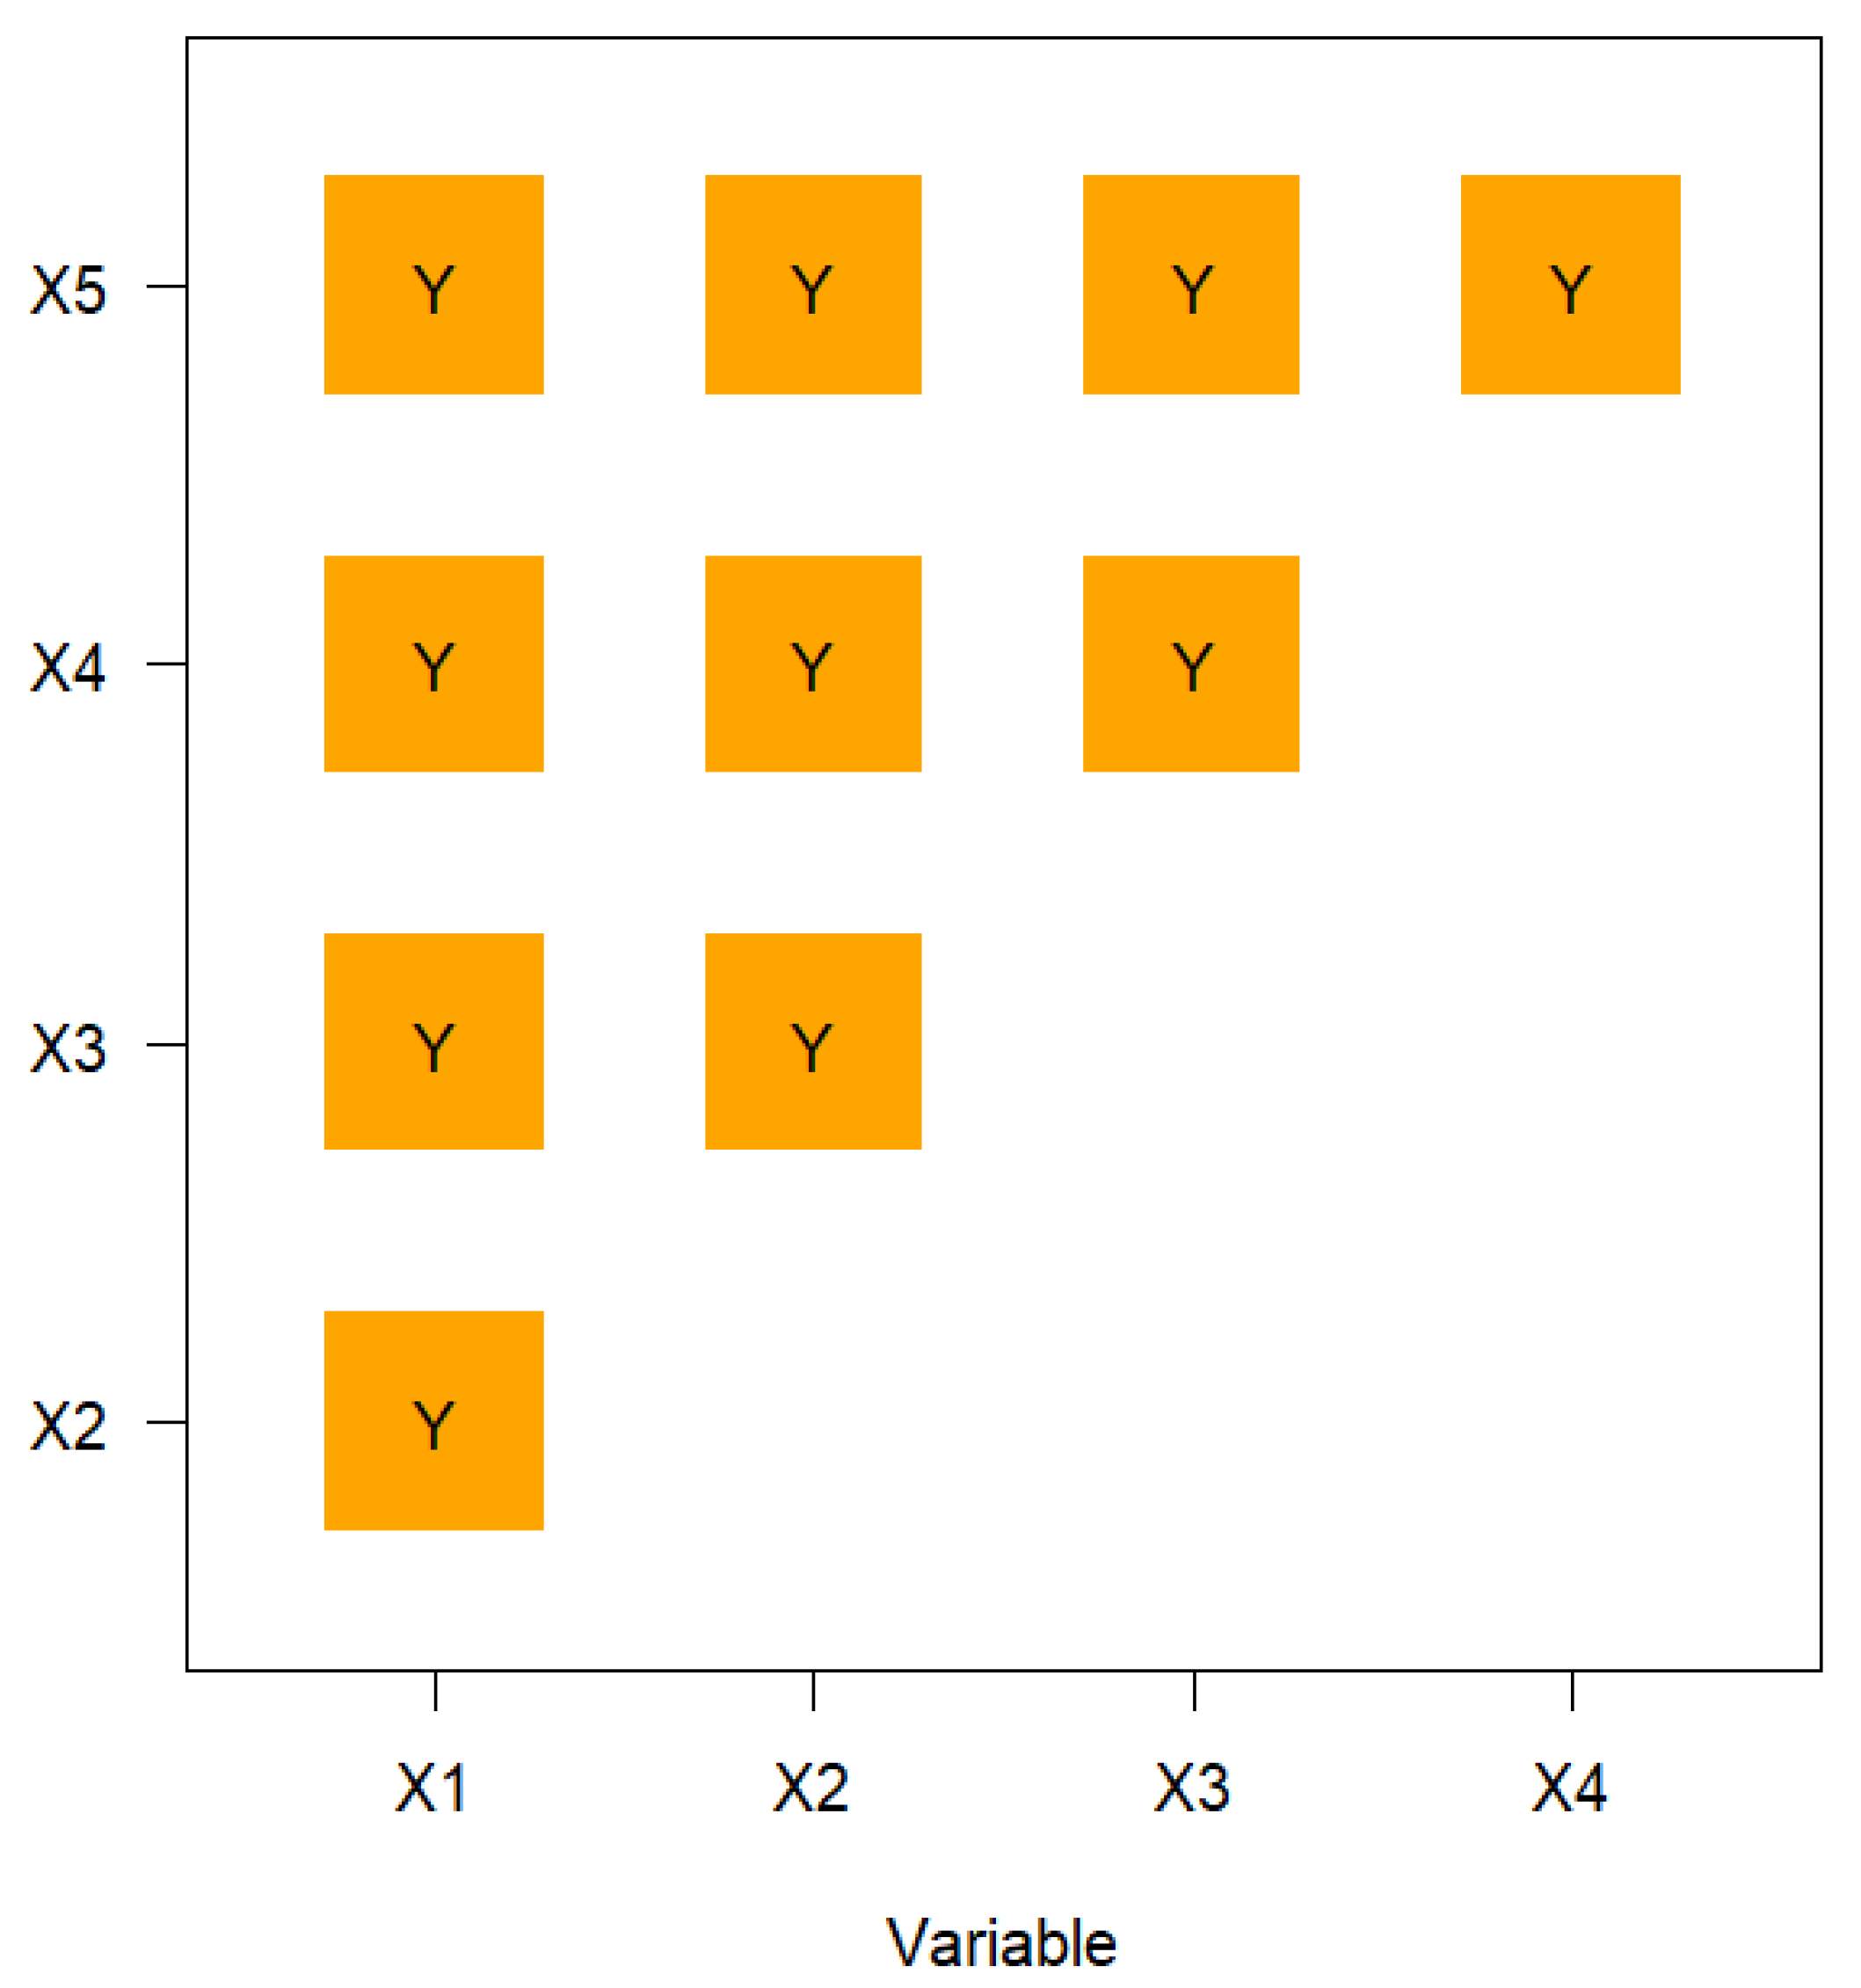
Ecological detector analysis was employed to determine whether the influences of any two factors on the spatial distribution of vegetation differ significantly. The results (Figure 12) indicate that the effects of all pairwise factor combinations exhibit significant differences. Among the factors examined, annual average precipitation, temperature, and slope emerge as key determinants shaping the spatial pattern and evolutionary trend of FVC on the Loess Plateau.
To avoid insufficient robustness of spatial analysis caused by simple qualitative description and distinguish real ecological effects from methodological artifacts, this study introduces Global Moran’s I and variance decomposition as spatial diagnostic statistical indicators to quantify the spatial agglomeration characteristics and heterogeneity sources of vegetation cover, providing quantitative support for spatial pattern analysis.
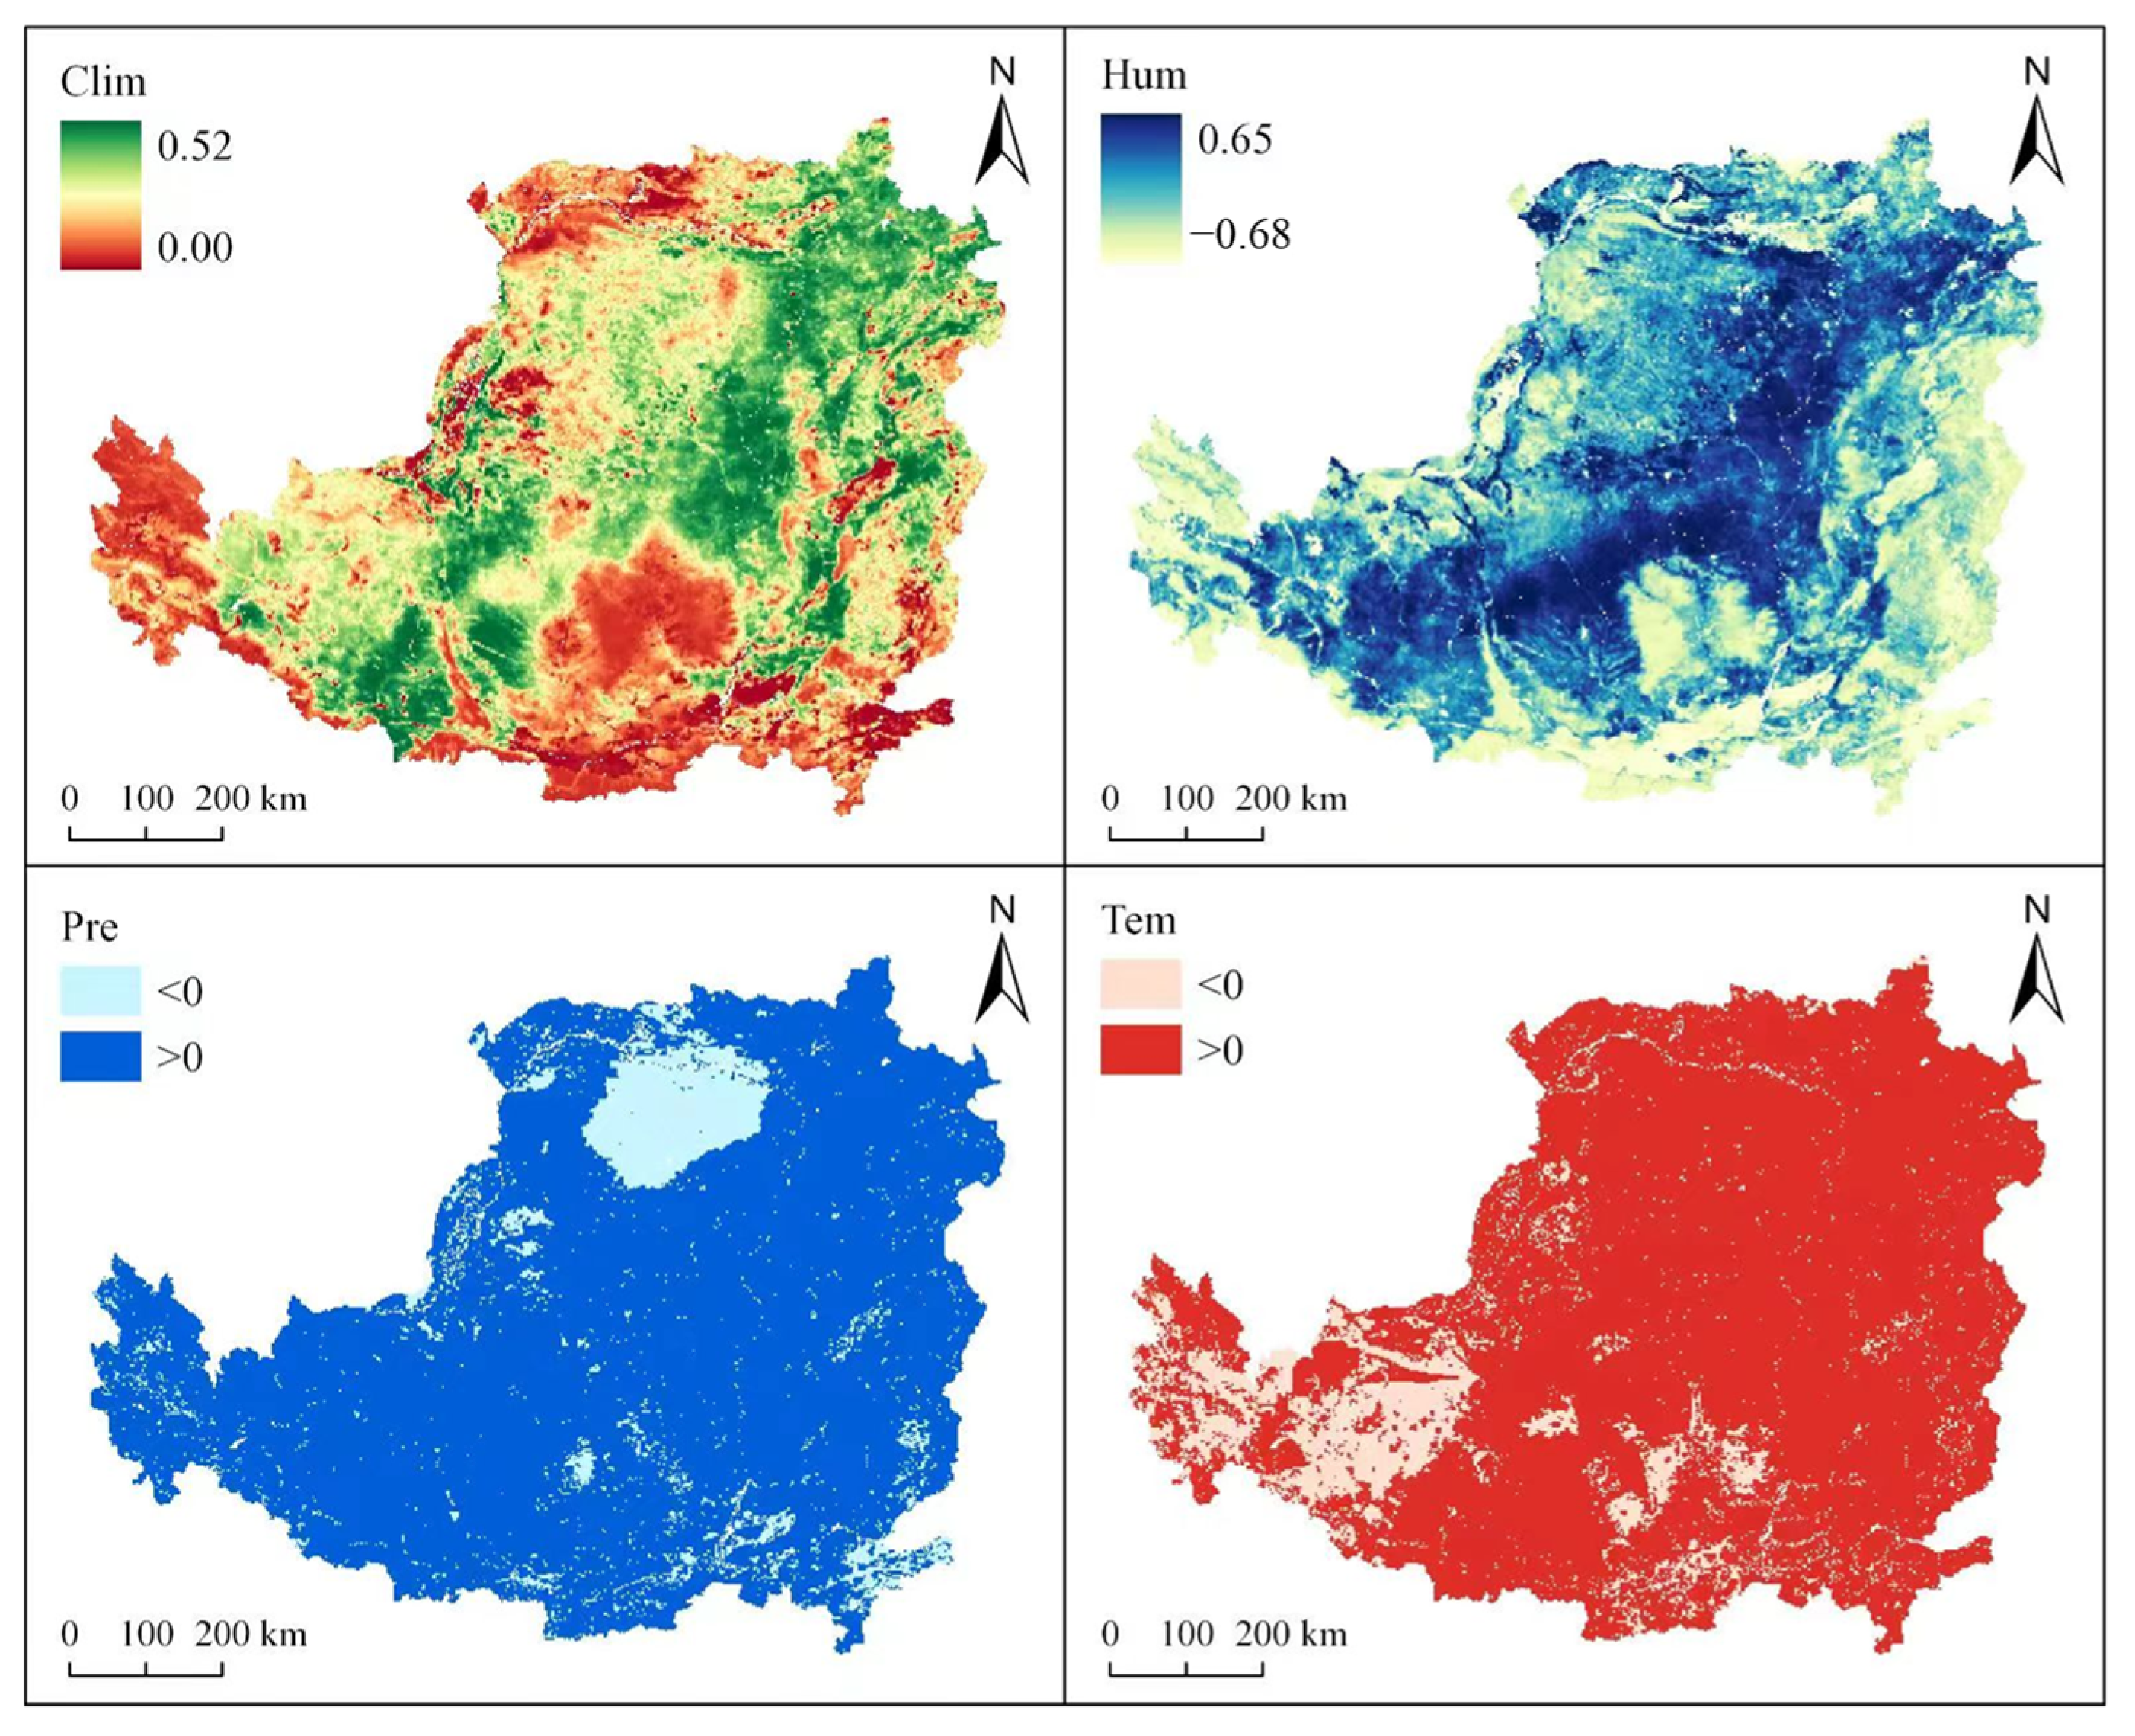
To eliminate the confounding effects of topography and human activities and extract the pure climatic-driven spatial differentiation of FVC, residual analysis was adopted to decouple non-climatic factors. As shown in Figure 13, the comprehensive climate residual index (Clim) exhibited positive residual values in southeastern regions with favorable hydrothermal conditions, while western high-altitude areas showed negative residuals constrained by harsh climate. Humidity (Hum) presented widespread negative residual autocorrelation across the central-western plateau, indicating its inhibitory effect on vegetation restoration in high-humidity mountainous zones. Precipitation (Pre) displayed nearly universal positive residual signals, with only sporadic negative areas, verifying precipitation as the dominant climatic driver independent of terrain interference. Temperature (Tem) showed positive residual effects in most regions, whereas scattered negative residuals occurred in cold western areas where low temperature restricted vegetation development. These residual spatial patterns further validated the “northwest-low, southeast-high” gradient of FVC from a pure climatic perspective, which was highly consistent with the LISA spatial clustering characteristics in the preceding section.

4. Discussion

Compared with existing studies, this study is not a mere repetition of existing methods but makes three practical contributions using a standard analytical framework: (1) extension of the time series to 2024, which allows systematic observation of the post-2020 vegetation decline after the peak; (2) quantitative characterization of the nonlinear precipitation–elevation threshold effect using the OPGD model; (3) differentiation of low-elevation vegetation patterns between the arid northwest and cultivated southeast, clarifying the coupled effects of human activities and climate. The studies by Nie et al. [30] and Xie et al. [31] did not include data after 2020 nor quantify the topographic regulation of climate effects. This study supplies updated evidence for assessing ecological restoration effectiveness on the Loess Plateau. The dominant nonlinear precipitation–temperature threshold confirms synergistic topographic-climatic responses, while also indicating that ecological restoration remains constrained by climate variability. Uncertainties in data resampling, endmember selection, and model parameters may affect local results; multi-source cross-validation is recommended for future work.

4.1. Analysis of the Spatio-Temporal Patterns of FVC on the Loess Plateau

As a typical ecologically fragile region, the Loess Plateau has long been a focus of vegetation restoration research. Previous studies generally reported an overall increasing trend in FVC from 2000 to 2020, attributing it primarily to ecological policies and climate change [30,31]. However, most existing studies were limited to datasets ending before 2020 and focused on linear trend analysis, lacking long-term monitoring of post-2020 vegetation dynamics and non-linear responses to hydrothermal conditions. This study extends the study period to 2024 and confirms that FVC on the Loess Plateau continued to rise with fluctuations, from 0.59 in 2000 to 0.76 in 2024, with high-coverage areas expanding from 10.2% to 57.2%. These results not only align with prior findings but also provide the latest evidence for the sustained effectiveness of ecological restoration.
Spatially, the consistent “northwest low–southeast high” gradient reflects the fundamental control of hydrothermal zonality, which is widely recognized in semi-arid regions [1]. The LISA results confirm this persistent spatial gradient: the southeastern high-high cluster corresponds to the natural forest zone with favorable hydrothermal conditions, while the central and northwestern low-low clusters correspond to historically degraded areas. Notably, the central low-low cluster is precisely the region where the most significant increasing trends (Figure 7) are concentrated, illustrating the classic pattern of ecological restoration—low initial state but high recovery rate. Compared with earlier studies that only described spatial patterns, this study further reveals that the central and southwestern regions are the core zones of vegetation improvement, closely linked to the long-term implementation of the Grain for Green Program. In contrast, the northwest remains constrained by low precipitation and intensive human activities, representing a common challenge for semi-arid ecological restoration globally. The 25-year transition from low-dominated to high-balanced coverage not only demonstrates regional ecological progress but also provides a typical case for understanding vegetation responses in semi-arid environments worldwide.
Combined with spatial diagnostic results, the FVC on the Loess Plateau presents significant positive spatial autocorrelation (Global Moran’s I = 0.37, p < 0.01), indicating that the spatial agglomeration characteristics of vegetation cover are not randomly distributed. Variance decomposition results show that spatial structural differences contribute 39.2% to the spatial differentiation of FVC, confirming that the above-identified “northwest low–southeast high” spatial pattern and core improvement zone characteristics are real ecological effects rather than methodological artifacts, which significantly improves the robustness of spatial analysis results.
A striking post-2020 decline in high FVC deserves attention. Climatic variability is the primary driver: 2021–2024 witnessed frequent extreme droughts and reduced precipitation across the Loess Plateau [15], limiting vegetation growth. Methodologically, while the 250 m resolution and consistent NDVI thresholds ensure reliability, interannual NDVI fluctuations in arid zones may amplify FVC sensitivity. This reversal reflects the fragile balance between ecological restoration and climate constraints.

4.2. Analysis of Drivers of FVC Change

Beyond climatic anomalies, anthropogenic factors may also contribute to the post-2020 decline. The Grain for Green program, which drove most of the vegetation increase before 2020, had largely saturated available land for conversion by 2020. Existing artificial forests, especially densely planted black locust and shrublands, have increasingly suffered from soil moisture deficit due to high evapotranspiration exceeding local precipitation recharge. This long-term water imbalance has likely reduced the resilience of high-cover vegetation to subsequent drought years, leading to a measurable decline after 2020. Thus, the post-2020 decrease represents not merely a climatic fluctuation but a signal of ecosystem overshoot relative to the region’s water carrying capacity.
Although aspect showed a negligible direct effect in the OPGD model, land use type (Figure 6) clearly modulates FVC patterns, with forest and shrubland dominated by high coverage and cropland/grassland showing more variable cover. This suggests that human activities, mediated by land use change, play a significant regulatory role. This study, through factor and interaction detection using the OPGD model incorporating both natural and anthropogenic factors, reveals a driving mechanism for FVC change on the Loess Plateau characterized by “climate dominance, topographic regulation, and multi-factor synergy. “The dominant role of precipitation (q = 0.4199) reflects the fundamental water-limited nature of this semi-arid region, where precipitation directly determines soil moisture availability and thus vegetation growth potential. The strongest interaction between precipitation and elevation (q = 0.5124) highlights a critical hydrothermal coupling mechanism: at low elevations (<1500 m), intense human disturbance and high evaporation reduce water-use efficiency, limiting FVC despite relatively abundant precipitation; at mid-to-high elevations (1500–2800 m), moderate temperatures, reduced evaporation, and orographic rainfall enhancement optimize water-thermal synchrony, promoting high vegetation coverage. In contrast, high elevations (>2800 m) suffer from low temperatures and short growing seasons, restricting vegetation development even with sufficient precipitation. This elevation-dependent precipitation-thermal balance creates a clear zonal vegetation pattern, representing a typical semi-arid ecological response. Other interactions, such as precipitation-slope, further modulate water redistribution and soil retention capacity, jointly shaping the spatial heterogeneity of FVC. Collectively, these coupled processes emphasize that vegetation dynamics in semi-arid regions are not controlled by single factors but by the synergistic regulation of climate and topography, which is consistent with the eco-hydrological characteristics of the Loess Plateau.
Explanatory variables were strictly defined and screened to ensure consistency and reproducibility, with weak factors (e.g., aspect) excluded to avoid analytical noise.
Driving factors selected for the OPGD model in this study include five natural factors (X1 temperature, X2 precipitation, X3 elevation, X4 slope and X5 aspect), which consider natural driving effects.
Based on the OPGD model, the driver set includes five natural factors (temperature, precipitation, elevation, slope, aspect), enabling comprehensive analysis of both natural and human-induced drivers. Existing studies on vegetation drivers on the Loess Plateau mainly focused on single-factor linear correlations or simple pairwise interactions, lacking systematic quantification of non-linear mechanisms and human activity contributions [31,41]. This study addresses these gaps by applying the OPGD model and introducing land use as an anthropogenic proxy. The results show that precipitation is the dominant factor (q = 0.4199), consistent with the water-limited nature of semi-arid ecosystems worldwide [42]. The strongest interaction between precipitation and elevation (q = 0.5124) is a key advancement over previous work: it reveals an elevation-dependent hydrothermal threshold, where mid-elevations (1500–2800 m) optimize water-heat synchrony, while low/high elevations are constrained by evaporation or temperature. This non-linear mechanism explains the zonal vegetation pattern and provides a generalized model for semi-arid mountainous regions.
Land use type (Figure 6) clearly modulates FVC patterns, with forest and shrubland dominated by high coverage, indicating a regulatory role of human activities. Based on coupling detection results of anthropogenic and natural factors from the OPGD model, the synergistic effect of climate and human factors further indicates that vegetation recovery in semi-arid regions cannot rely solely on natural conditions; targeted human interventions are essential to amplify restoration benefits. These findings advance the theoretical framework of “climate–topography–human co-regulation” and provide a scientific basis for understanding vegetation dynamics in similar semi-arid regions globally.
From the perspective of underlying processes, the nonlinear threshold effect between precipitation and elevation is essentially an eco-hydrological process regulating vegetation growth through regional hydrothermal redistribution and evapotranspiration differences along elevation gradients, rather than direct driving by a single climatic factor. As alternative explanations, underlying surface conditions such as regional soil water-holding capacity differences and slope runoff redistribution may simultaneously amplify the coupling effect of elevation-precipitation. Nevertheless, our results confirm that climate-topography coupling is the dominant process, while local factors such as soil properties only play a partial regulatory role.
Although the factor detection model adopted in this study has been widely used in regional vegetation research, the elevation-precipitation coupling threshold effect identified with the latest time-series data serves as a key incremental contribution different from traditional linear analysis, which effectively reveals the nonlinear vegetation response to hydrothermal conditions across elevation gradients.

4.3. Research Limitations and Implications

While this study provides updated and systematic insights, several limitations remain. First, driving factors are limited to climate and topography plus land use, without including socio-economic indicators (e.g., GDP, population density) or soil properties, which may affect the comprehensiveness of driver analysis. Second, the study focuses on interannual changes, lacking seasonal dynamic analysis, which is important for understanding vegetation stability under climate variability. In addition, this study adopts remotely sensed fractional vegetation cover (FVC) as a proxy indicator for vegetation status, which can only characterize surface vegetation coverage rather than changes in vegetation species composition, biomass and community structure. Meanwhile, explanatory variables are limited to climate, topography and land-use factors, excluding soil physicochemical properties and micro-hydrological processes, which constrains the comprehensiveness of driving mechanism analysis to a certain extent. These limitations should be addressed in future work by integrating multi-source data and multi-scale analysis.
Even so, the findings carry broad implications for ecosystem management and global sustainability. For the Loess Plateau, zoned management is critical: central-southwest areas should prioritize consolidation to avoid over-restoration beyond water capacity; northwest areas should adopt drought-tolerant species and natural enclosure; mid-elevation zones are optimal for ecological projects. For semi-arid regions worldwide, the “water-heat-human synergy” model provides a replicable framework for balancing ecological restoration and socio-economic development. This study not only supports the high-quality development of the Yellow River Basin but also offers empirical evidence for global semi-arid ecological governance and climate adaptation, highlighting its broader scientific and practical significance.
It should be noted that the results of this study contain inherent uncertainties arising from data sampling bias, measurement errors and model estimation. This paper adopts 95% confidence intervals to quantify the fluctuation range of estimated results, and considers the impact of sample heterogeneity on conclusion stability, so as to reduce the interference of uncertainty on the credibility of reported patterns. The above-reported regularities are valid within a reasonable uncertainty range.
Although the factor detection model adopted in this study can effectively identify the interactions among driving factors, the complexity of the method leads to relatively limited quantification of result uncertainty. The conclusions of driving mechanisms derived from model outputs are susceptible to remote-sensing data noise, NDVI threshold selection, factor discretization grading and other parameter settings. Fluctuations in data quality and differences in parameter sensitivity may alter factor explanatory power and interaction intensity to a certain extent. Further multi-parameter scenario simulation can be adopted to verify conclusion stability in future research.
Aiming at the above limitations in data and model aspects, future research can further expand the methodological system. On the one hand, higher-resolution field observation data such as soil physicochemical properties and micro-hydrological monitoring can be incorporated to make up for the singularity of remote-sensing data sources. On the other hand, ecological process models can be introduced for mechanism simulation to refine the dynamic coupling processes among vegetation, climate and topography. Meanwhile, refined anthropogenic indicators including population density and policy implementation intensity can be improved to achieve more comprehensive analysis of natural and human-driven mechanisms.
Additionally, while trend detection and spatial visualization were used to identify overall patterns, the analytical framework remains largely descriptive. Future work should incorporate spatial autoregressive models and Monte Carlo simulation to quantify uncertainty and enhance analytical rigor.
Furthermore, two analytical aspects are not covered in this study and are acknowledged as limitations that merit future investigation. First, this study focuses only on interannual FVC dynamics, without a seasonal analysis. Given the uneven seasonal distribution of precipitation and frequent extreme rainfall events on the Loess Plateau, the phenological characteristics of vegetation growth and their responses to climate fluctuations remain unclear. Future work should employ higher-temporal-resolution remote sensing data to systematically examine seasonal FVC variations and their climate drivers. Second, although land use type was included as a static anthropogenic proxy in the factor detection, we did not perform a quantitative analysis of dynamic land-use transitions. Future studies should integrate multi-temporal land use transition matrices and change detection methods to directly quantify the contribution of land-use transitions to FVC change. Explicitly identifying these limitations provides clear directions for subsequent research.

5. Conclusions

(1)
From 2000 to 2024, vegetation coverage (FVC) on the Loess Plateau exhibited an overall fluctuating upward trend, with an annual increase rate of 0.0073 and a mean value of 0.71. The maximum FVC (0.80) occurred in 2018, while the minimum (0.58) was recorded in 2001. Spatially, FVC initially presented a distinct pattern of “low in the northwest, high in the southeast.” Over the study period, the proportion of High FVC areas increased substantially and continuously, while Medium and Low FVC areas progressively contracted. High FVC areas accounted for only 10.2% of the region in 2000, surged to 62.1% in 2020, then declined markedly to 57.2% in 2024. From a long-term perspective, the 2024 high-coverage proportion is still far higher than the 2000 baseline, which fully proves the overall remarkable ecological restoration achievement; the drop from 2020 to 2024 only indicates short-term vegetation degradation caused by consecutive extreme droughts rather than a reversal of long-term restoration benefits. This dual change reflects climate-driven vegetation vulnerability of restored ecosystems.
(2)
The FVC change trend and its significance from 2000 to 2024 exhibited pronounced spatial heterogeneity. The majority of the study area demonstrated significant improvement trends, with change slopes predominantly exceeding 0.01 in large areas, while only localized areas in the northwest remained stable. Hurst index analysis reveals the persistence and long-term memory of historical FVC trends, rather than predicting future changes. Strong persistence in the southeastern and central regions means past increasing trends are likely to continue; some areas show weak persistence, reflecting unstable historical dynamics.
(3)
FVC change on the Loess Plateau is governed by natural drivers with land-use-mediated human-land interactions, characterized by “climate dominance, topographic regulation, and multi-factor synergy.” Precipitation emerges as the most important driver, with explanatory power exceeding 0.4. Temperature also exerts a measurable influence, while elevation and slope have comparatively smaller direct impacts. Factor interactions are significant across all pairs, with the interactions between precipitation and elevation—as well as between precipitation and other topographic factors—exerting particularly pronounced effects on FVC change. Land use type, as a key anthropogenic factor, significantly regulates vegetation patterns and complements climatic drivers.
Overall, this study systematically reveals the spatiotemporal evolution and driving mechanisms of vegetation cover on the Loess Plateau from 2000 to 2024. Vegetation shows an overall fluctuating increasing trend with a stable spatial gradient of low coverage in the northwest and high coverage in the southeast, which is dominated by the nonlinear hydrothermal threshold effect of precipitation-elevation coupling and jointly affected by human activities mediated by land-use change. By updating long-term series data and quantitatively identifying terrain-climate coupling relationships, this study improves the understanding of nonlinear drivers of vegetation dynamics in semi-arid regions and provides integrated scientific support for zonal ecological restoration management on the Loess Plateau and similar areas.

Author Contributions

Conceptualization and methodology: J.M.; data curation: J.M.; funding acquisition: Z.W.; project administration: Z.W.; software: J.M.; supervision: J.M.; validation and visualization: J.M.; writing—review and editing: Z.W. and J.M.; formal analysis and writing—original draft: J.M. All authors have read and agreed to the published version of the manuscript.

Funding

This work was supported by the Research on Biodiversity Monitoring, Ecosystem Service Assessment and Collaborative Optimization Technology in the “Omega” Bend of the Yellow River in Inner Mongolia (Inner Mongolia Autonomous Region Science and Technology Program, No. 2025YFHH0224).

Data Availability Statement

The data sources are listed in the text.

Acknowledgments

We also acknowledge the data support from “National Tibetan Plateau Data Center and Geospatial Data Cloud”.

Conflicts of Interest

The authors declare that they have no known competing financial interests or personal relationships that could have appeared to influence the work reported in this paper.

References

  1. Ma, T.; Liu, B.; He, L.; Dong, L.; Yin, B.; Zhao, Y. Response of soil erosion to vegetation and terrace changes in a small watershed on the Loess Plateau over the past 85 years. Geoderma 2024, 443, 116837. [Google Scholar] [CrossRef]
  2. Yu, Z.; Deng, X.; Fu, P.; Grebby, S.; Mangi, E. Assessment of land degradation risks in the Loess Plateau. Land Degrad. Dev. 2024, 35, 2409–2424. [Google Scholar] [CrossRef]
  3. Wu, Q.; Jiang, X.; Shi, X.; Zhang, Y.; Liu, Y.; Cai, W. Spatiotemporal evolution characteristics of soil erosion and its driving mechanisms—A case Study: Loess Plateau, China. Catena 2024, 242, 108075. [Google Scholar] [CrossRef]
  4. Tian, P.; Tian, X.; Geng, R.; Zhao, G.; Yang, L.; Mu, X.; Gao, P.; Sun, W.; Liu, Y. Response of soil erosion to vegetation restoration and terracing on the Loess Plateau. Catena 2023, 227, 107103. [Google Scholar] [CrossRef]
  5. Fu, S.; Liao, R.; Zhang, G. Effects of event rainfall properties on permanent gully erosion on the Loess Plateau of China. Catena 2025, 260, 109428. [Google Scholar] [CrossRef]
  6. Dan, C.; Liu, G.; Zhao, Y.; Shu, C.; Shen, E.; Liu, C.; Tan, Q.; Zhang, Q.; Guo, Z.; Zhang, Y. The effects of typical grass cover combined with biocrusts on slope hydrology and soil erosion during rainstorms on the Loess Plateau of China: An experimental study. Hydrol. Process. 2023, 37, e14794. [Google Scholar] [CrossRef]
  7. Song, Y.; Yao, Y.; Kong, W.; Guo, L.; Bao, K.; Qiu, L.; Shao, M.; Wei, X. Effects of vegetation loss and soil erosion intensity on soil carbon dynamics across landscape position: Evidence from China’s Loess Plateau. Agric. Ecosyst. Environ. 2026, 396, 109992. [Google Scholar] [CrossRef]
  8. Shi, S.; Zheng, W.; Han, J.; Zhan, X.; Wang, F. Dominance of human activities in reducing soil erosion on the Loess Plateau. J. Hydrol. 2025, 662, 133835. [Google Scholar] [CrossRef]
  9. Liu, W.; Mo, X.; Liu, S.; Lu, C. Impacts of climate change on grassland fractional vegetation cover variation on the Tibetan Plateau. Sci. Total Environ. 2024, 939, 173320. [Google Scholar] [CrossRef] [PubMed]
  10. Zhou, Q.; Chen, W.; Wang, H.; Wang, D. Spatiotemporal evolution and driving factors analysis of fractional vegetation coverage in the arid region of northwest China. Sci. Total Environ. 2024, 954, 176271. [Google Scholar] [CrossRef] [PubMed]
  11. Fan, K.; Liu, Y.; Zhang, X.; Chen, X.; Li, Y.; Zhou, Y.; Shen, W.; Tao, H.; Gong, C.; Lei, S. Assessing the relative contribution of climate change and human activity factors to spatiotemporal distributions of sand fixation service in the Loess Plateau. GISci. Remote Sens. 2025, 62, 2444630. [Google Scholar] [CrossRef]
  12. Li, S.; He, W.; Che, X.; Wang, L.; Zhang, Z.; Zhang, D. Urban ecological security assessment framework and its driving mechanism—A case study of Anhui Province. Land Degrad. Dev. 2025; in press. [CrossRef]
  13. Cheng, M.; Wang, Z.; Wang, S.; Liu, X.; Jiao, W.; Zhang, Y. Determining the impacts of climate change and human activities on vegetation change on the Chinese Loess Plateau considering human-induced vegetation type change and time-lag effects of climate on vegetation growth. Int. J. Digit. Earth 2024, 17, 2336075. [Google Scholar] [CrossRef]
  14. Bian, J.; Li, A.; Zhang, Z.; Zhao, W.; Lei, G.; Yin, G.; Jin, H.; Tan, J.; Huang, C. Monitoring fractional green vegetation cover dynamics over a seasonally inundated alpine wetland using dense time series HJ-1A/B constellation images and an adaptive endmember selection LSMM model. Remote Sens. Environ. 2017, 197, 98–114. [Google Scholar] [CrossRef]
  15. Li, L.; Mu, X.; Jiang, H.; Chianucci, F.; Hu, R.; Song, W.; Qi, J.; Liu, S.; Zhou, J.; Chen, L.; et al. Review of ground and aerial methods for vegetation cover fraction (fCover) and related quantities estimation: Definitions, advances, challenges, and future perspectives. ISPRS J. Photogramm. Remote Sens. 2023, 199, 133–156. [Google Scholar] [CrossRef]
  16. Schug, F.; Pfoch, K.A.; Pham, V.-D.; van der Linden, S.; Okujeni, A.; Frantz, D.; Radeloff, V.C. Land cover fraction mapping across global biomes with Landsat data, spatially generalized regression models and spectral-temporal metrics. Remote Sens. Environ. 2024, 311, 114260. [Google Scholar] [CrossRef]
  17. Gao, L.; Wang, X.; Johnson, B.A.; Tian, Q.; Wang, Y.; Verrelst, J.; Mu, X.; Gu, X. Remote sensing algorithms for estimation of fractional vegetation cover using pure vegetation index values: A review. ISPRS J. Photogramm. Remote Sens. 2020, 159, 364–377. [Google Scholar] [CrossRef] [PubMed]
  18. He, B.; Zhu, W.; Zhao, C.; Xie, Z.; Zhuang, H. A novel index for directly indicating fractional vegetation cover based on spectral differences between vegetation and soil. Remote Sens. Environ. 2025, 331, 115056. [Google Scholar] [CrossRef]
  19. Ma, X.; Ding, J.; Wang, T.; Lu, L.; Sun, H.; Zhang, F.; Cheng, X.; Nurmemet, I. A pixel dichotomy coupled linear Kernel-driven model for estimating fractional vegetation cover in arid areas from high-spatial-resolution images. IEEE Trans. Geosci. Remote Sens. 2023, 61, 4406015. [Google Scholar] [CrossRef]
  20. Mu, X.; Yang, Y.; Xu, H.; Guo, Y.; Lai, Y.; McVicar, T.R.; Xie, D.; Yan, G. Improvement of NDVI mixture model for fractional vegetation cover estimation with consideration of shaded vegetation and soil components. Remote Sens. Environ. 2024, 314, 114409. [Google Scholar] [CrossRef]
  21. Fan, X.; Qu, Y.; Zhang, J.; Bai, E. China’s vegetation restoration programs accelerated vegetation greening on the Loess Plateau. Agric. For. Meteorol. 2024, 350, 109994. [Google Scholar] [CrossRef]
  22. Zhao, J.; Li, J.; Liu, Q.; Xu, B.; Mu, X.; Dong, Y. Generation of a 16 m/10-day fractional vegetation cover product over China based on Chinese GaoFen-1 observations: Method and validation. Int. J. Digit. Earth 2023, 16, 4229–4246. [Google Scholar] [CrossRef]
  23. Wang, B.; Si, J.; Jia, B.; He, X.; Zhou, D.; Zhu, X.; Liu, Z.; Ndayambaza, B.; Bai, X. Monitoring spatial-temporal variability of vegetation coverage and its influencing factors in the Yellow River Source Region from 2000 to 2020. Remote Sens. 2024, 16, 4772. [Google Scholar] [CrossRef]
  24. Ge, L.; Zheng, H.; Fu, Z.; Cai, C.; Wei, Y. Uncovering interactive impacts of climate extremes and land use change on soil erosion using a coupled RUSLE-OPGD framework. Catena 2025, 261, 109507. [Google Scholar] [CrossRef]
  25. Yan, F.; Guo, X.; Zhang, Y.; Shan, J.; Miao, Z.; Li, C.; Huang, X.; Pang, J.; Chen, Y. Analysis of the multiple drivers of vegetation cover evolution in the Taihangshan-Yanshan region. Sci. Rep. 2024, 14, 15306. [Google Scholar] [CrossRef] [PubMed]
  26. Zhao, X.; Tan, S.; Li, Y.; Wu, H.; Wu, R. Quantitative analysis of fractional vegetation cover in southern Sichuan urban agglomeration using optimal parameter geographic detector model, China. Ecol. Indic. 2024, 158, 111529. [Google Scholar] [CrossRef]
  27. Fu, F.; Zhao, M.; Yang, C.; Huang, X.; Xu, Y.; Liu, Y.; Jia, S. Spatiotemporal variations of fractional vegetation cover and its response to topography on the Loess Plateau of China from 1995 to 2024. Geomat. Nat. Hazards Risk 2025, 16, 2543455. [Google Scholar] [CrossRef]
  28. Zhang, X.; Wu, T.; Du, Q.; Ouyang, N.; Nie, W.; Liu, Y.; Gou, P.; Li, G. Spatiotemporal changes of ecosystem health and the impact of its driving factors on the Loess Plateau in China. Ecol. Indic. 2025, 170, 113020. [Google Scholar] [CrossRef]
  29. Wang, Z.; Fu, B.; Wu, X.; Wang, S.; Li, Y.; Feng, Y.; Zhang, L.; Hu, Y.; Cheng, L.; Li, B. Distinguishing trajectories and drivers of vegetated ecosystems in China’s Loess Plateau. Earths Future 2024, 12, e2023EF003769. [Google Scholar] [CrossRef]
  30. Nie, T.; Dong, G.; Jiang, X.; Lei, Y. Spatio-temporal changes and driving forces of vegetation coverage on the Loess Plateau of Northern Shaanxi. Remote Sens. 2021, 13, 613. [Google Scholar] [CrossRef]
  31. Xie, B.; Jia, X.; Qin, Z.; Shen, J.; Chang, Q. Vegetation dynamics and climate change on the Loess Plateau, China: 1982–2011. Reg. Environ. Change 2016, 16, 1583–1594. [Google Scholar] [CrossRef]
  32. Qiu, L.; Wu, Y.; Yu, M.; Shi, Z.; Yin, X.; Song, Y.; Sun, K. Contributions of vegetation restoration and climate change to spatiotemporal variation in the energy budget in the loess plateau of china. Ecol. Indic. 2021, 127, 107780. [Google Scholar] [CrossRef]
  33. Zhang, Y.; Li, P.; Xu, G.; Min, Z.; Li, Q.; Li, Z.; Wang, B.; Chen, Y. Temporal and spatial variation characteristics of extreme precipitation on the Loess Plateau of China facing the precipitation process. J. Arid Land 2023, 15, 439–459. [Google Scholar] [CrossRef]
  34. Chen, M.; Yang, X.; Zhang, X.; Bai, Y.; Shao, M.a.; Wei, X.; Jia, Y.; Wang, Y.; Jia, X.; Zhu, Y.; et al. Response of soil water to long-term revegetation, topography, and precipitation on the Chinese Loess Plateau. Catena 2024, 236, 107711. [Google Scholar] [CrossRef]
  35. Li, S.; Tu, B.; Zhang, Z.; Wang, L.; Zhang, Z.; Che, X.; Wang, Z. Exploring new methods for assessing landscape ecological risk in key basin. J. Clean. Prod. 2024, 461, 142633. [Google Scholar] [CrossRef]
  36. Ren, Z.; Tian, Z.; Wei, H.; Liu, Y.; Yu, Y. Spatiotemporal evolution and driving mechanisms of vegetation in the Yellow River Basin, China during 2000–2020. Ecol. Indic. 2022, 138, 108832. [Google Scholar] [CrossRef]
  37. Agbo, E.P.; Nkajoe, U.; Edet, C.O. Comparison of Mann–Kendall and Şen’s innovative trend method for climatic parameters over Nigeria’s climatic zones. Clim. Dyn. 2023, 60, 3385–3401. [Google Scholar] [CrossRef]
  38. Zhong, H.; Guo, Y. Long-term persistence in observed temperature and precipitation series. Fract. Fract. 2025, 9, 385. [Google Scholar] [CrossRef]
  39. Song, Y.; Wang, J.; Ge, Y.; Xu, C. An optimal parameters-based geographical detector model enhances geographic characteristics of explanatory variables for spatial heterogeneity analysis: Cases with different types of spatial data. GISci. Remote Sens. 2020, 57, 593–610. [Google Scholar] [CrossRef]
  40. Gao, F.; Pan, J.; Gong, Z. Detection of spatial and temporal variation characteristics of vegetation cover in the Lower Mekong region and the influencing factors. Sci. Rep. 2024, 14, 26673. [Google Scholar] [CrossRef] [PubMed]
  41. Ren, Y.; Zhang, B.; Chen, X.; Liu, X. Analysis of spatial-temporal patterns and driving mechanisms of land desertification in China. Sci. Total Environ. 2024, 909, 168429. [Google Scholar] [CrossRef] [PubMed]
  42. Smith, M.D.; Wilkins, K.D.; Holdrege, M.C.; Wilfahrt, P.; Collins, S.L.; Knapp, A.K.; Sala, O.E.; Dukes, J.S.; Phillips, R.P.; Yahdjian, L.; et al. Extreme drought impacts have been underestimated in grasslands and shrublands globally. Proc. Natl. Acad. Sci. USA 2024, 121, e2309881120. [Google Scholar] [CrossRef] [PubMed]
Figure 1. Framework used for the present study.
Land 15 01206 g001
Figure 2. Study region. (a) Study region location; (b) elevation; (c) average temperature; (d) land cover types.
Land 15 01206 g002
Figure 3. Partitioning effects based on the OPGD model. (a) Variable discretization; (b) Partitioning results. temperature (X1), precipitation (X2), elevation (X3), slope (X4), and aspect (X5).
Land 15 01206 g003
Figure 4. Temporal variation characteristics of vegetation coverage and FVC area from 2000 to 2024. (a) Interannual variation in FVC by land use type; (b) Trend of annual mean FVC; (c) Area statistics of different FVC grades.
Land 15 01206 g004
Figure 5. Spatial distribution of vegetation cover on the Loess Plateau from 2000 to 2024. AVG: average.
Land 15 01206 g005
Figure 6. Proportion of vegetation coverage by different land use types.
Land 15 01206 g006
Figure 7. (a) Trend analysis of vegetation coverage changes; (b) Significance analysis of vegetation coverage changes.
Land 15 01206 g007
Figure 8. Persistence analysis of vegetation coverage trends on the Loess Plateau based on the Hurst index.
Land 15 01206 g008
Figure 9. LISA spatial clustering pattern of FVC on the Loess Plateau.
Land 15 01206 g009
Figure 10. (a) Detecting the impact of single factor on vegetation change using OPGD model; (b) detecting the impact of drivers on vegetation change using OPGD model interactions. temperature (X1), precipitation (X2), elevation (X3), slope (X4), and aspect (X5).
Land 15 01206 g010
Figure 11. Spatial distribution of FVC across the range of drivers and its risk matrix. (a) Risk detection; (b) risk matrix. temperature (X1), precipitation (X2), elevation (X3), slope (X4), and aspect (X5). Y represents a significant difference and N means a no significant difference.
Land 15 01206 g011
Figure 12. The result of ecological detection. Y represents a significant difference.
Land 15 01206 g012
Figure 13. Residual spatial distribution patterns of climatic factors for FVC on the Loess Plateau.
Land 15 01206 g013
Table 1. Data sources.
Data TypeSpatial ResolutionData Source
NDVI250 mNational Tibetan Plateau Data Center (https://data.tpdc.ac.cn, accessed on 17 May 2025.)
Digital elevation model90 mGeospatial Data Cloud (https://www.gscloud.cn/)
Meteorological factor1 kmNational Tibetan Plateau Data Center (https://data.tpdc.ac.cn)
Land use30 mGlobe Land 30 (https://www.resdc.cn/DOI/DOI.aspx?DOIID=54, accessed on 17 May 2025)
Table 2. Sen+MK significance trend test category.
β Z TypeTrend Characteristic
β > 0 Z > 2.58 1Highly significant increase
1.96 < Z 2.58 2Significant increase
1.65 < Z 1.96 3Marginally significant increase
Z 1.65 4Non-significant increase
β = 0 Z = 0 5No change
β < 0 Z 1.65 6Non-significant decrease
1.65 < Z 1.96 7Marginally significant decrease
1.96 < Z 2.58 8Significant decrease
Z > 2.58 9Highly significant decrease
Table 3. Optimal discretization methods and interval numbers for each factor in the OPGD model.
FactorsOptimal Discretization MethodNumber of Intervals
temperature (X1)equal9
precipitation (X2)quantile9
elevation (X3)natural8
slope (X4)geometric9
aspect (X5)quantile9
Disclaimer/Publisher’s Note: The statements, opinions and data contained in all publications are solely those of the individual author(s) and contributor(s) and not of MDPI and/or the editor(s). MDPI and/or the editor(s) disclaim responsibility for any injury to people or property resulting from any ideas, methods, instructions or products referred to in the content.