Article

A Spatial Assessment Framework for Identifying Workation-Suitable Mountain Villages in Depopulation Regions


Forest Circular Management Research Division, National Institute of Forest Science, Seoul 02455, Republic of Korea
*
Author to whom correspondence should be addressed.
Land 2026, 15(7), 1154; https://doi.org/10.3390/land15071154
Submission received: 2 June 2026 / Revised: 22 June 2026 / Accepted: 23 June 2026 / Published: 26 June 2026
(This article belongs to the Section Land Planning and Landscape Architecture)

Abstract

This study addresses the limited nationwide examination of Mountain Villages as strategic targets for regional revitalization amid rapid depopulation and population aging. Focusing on Mountain Villages located within Depopulation Regions in the Republic of Korea, this study quantitatively assessed workation suitability at the Eup-Myeon-Dong level and identified priority areas and differentiated policy directions. A workation suitability index was calculated using the CRITIC (Criteria Importance Through Intercriteria Correlation) method, and spatial clustering and potential–demand characteristics were examined through LISA (Local Indicators of Spatial Association) and quadrant analysis. The results showed that transportation accessibility indicators, including travel time to expressway interchanges and railway stations, had high information content in differentiating workation suitability among Mountain Villages. Suitability was high in the border areas between Gyeonggi-do and Gangwon State and parts of the central inland region, whereas low suitability was observed in northern Gangwon State and northern Gyeongsangbuk-do. High–High clusters tended to overlap with high-potential and high-demand areas, while Low–Low clusters were mainly associated with low-potential areas. By integrating suitability, spatial clustering, and demand conditions, this study provides an empirical framework for spatial decision-making. The findings suggest that workation policies for Mountain Villages should distinguish priority implementation areas from foundation-building areas according to accessibility, infrastructure, and demand levels.

1. Introduction

Rural depopulation and population aging have become widely observed structural challenges in rural, peripheral, and remote regions worldwide. According to the United Nations [1], the global rural population is expected to approach its peak in the 2040s and decline thereafter, while many rural communities are increasingly exposed to aging and outmigration. In OECD countries, demographic decline also has a strong territorial dimension, with remote regions generally facing more pronounced population loss than metropolitan regions [2]. Similar patterns have been observed in Europe, where many predominantly rural regions are projected to continue shrinking [3], and in East Asia, where Japan, the Republic of Korea, and China have experienced rural shrinkage associated with aging, outmigration, service decline, and weakening local capacity [4]. These international trends suggest that rural depopulation should be understood not merely as a national demographic issue, but as a broader process of peripheral shrinkage that affects the social, economic, and service functions of rural communities.
Republic of Korea reflects this broader pattern, but its demographic challenges are further intensified by low fertility, rapid population aging, and the concentration of population and economic activity in the Seoul metropolitan area [5,6]. These changes extend beyond a simple reduction in population size and weaken local economic activity, the maintenance of daily life services, and the overall capacity of communities to reproduce themselves [7]. In particular, peripheral non-metropolitan areas are experiencing a combination of youth outmigration, intensified aging, and weakened living infrastructure, and these trends are observed more acutely in Mountain Villages. According to the Korea Forest Service [8], the male population of Mountain Villages decreased from 796,027 in 2013 to 737,557 in 2024, while the female population declined from 778,813 to 705,301 over the same period. This indicates that the population of Mountain Villages has continued to decline over the past decade (Figure 1), with the decline becoming more pronounced after 2018, highlighting the need for proactive responses to the potential extinction of Mountain Villages. Mountain Villages should therefore be understood not merely as declining areas, but as policy targets requiring strategic management and revitalization, as they are both vulnerable areas undergoing rapid depopulation and aging and spaces that perform important functions in forest resource management, ecosystem service maintenance, and national environmental conservation [7,8,9].
Based on this recognition, recent regional policy in the Republic of Korea has shifted beyond a resident population-centered approach toward one that also encompasses “living population” and “relationship population” [6]. The living population refers to people who do not permanently reside in a specific area but stay there for a certain period while engaging in consumption, service use, and the formation of social relationships. The relationship population refers to people who maintain continuous and repetitive ties with a region through visits, exchanges, local participation, or other forms of engagement. These concepts have attracted attention as policy resources that can contribute to maintaining local functions and restoring regional vitality even under conditions of resident population decline [10,11]. In particular, they are important because they expand the scope of regional revitalization from the simple attraction of temporary visitors to the formation of repeated and sustained relationships between external populations and local communities. In this context, policy approaches that attract external populations, encourage extended stays, and enhance local consumption and revisit intentions have increasingly been emphasized as means of promoting regional revitalization [12,13,14,15,16,17,18]. Under conditions of sustained resident population decline in Depopulation Regions, a one-time inflow of short-term visitors alone is unlikely to sustain local functions or restore regional vitality. By contrast, the accumulation of living and relationship populations may contribute to sustaining local economies, maintaining daily life services, encouraging repeat visits, and creating potential pathways for future settlement. Accordingly, revitalization strategies for Depopulation Regions need to move beyond a narrow focus on securing the resident population and instead expand toward promoting the inflow, retention, and accumulation of living and relationship populations [10,11,12].
Meanwhile, research on local extinction has mainly accumulated around diagnosing the risk of decline using demographic and socioeconomic indicators. Since the so-called “Masuda Report” in Japan, local extinction has been discussed through expanded concepts such as shrinking regions, regional decline, and rural shrinkage [4,19,20,21], and a number of studies have proposed frameworks for quantitatively assessing regional vulnerability by combining multiple indicators with spatial analysis [22,23,24,25,26].
At the same time, studies on regional revitalization have proposed various response strategies, including tourism, cultural regeneration, community governance, the attraction of external populations, and industrial transformation [27,28,29,30,31,32,33,34]. For example, Wolff et al. [27] argued that regrowth in shrinking cities does not occur uniformly across urban areas, but rather through spatially uneven restructuring processes. Sakamoto et al. [28] and Chen et al. [29] analyzed urban regrowth following policy interventions and urban development planning, showing that the revitalization of declining areas is linked not to a single policy instrument but to complex processes of spatial restructuring. In addition, studies focusing on rural and peripheral areas have suggested that tourism promotion, the use of local endogenous resources, community-based operation, and the accommodation of external populations can play important roles in restoring regional vitality [30,31,32,33,34].
In addition to these economic and infrastructural approaches, rural revitalization also depends on social and community-based conditions. Social capital, including local trust, networks, cooperation, and collective capacity, can influence whether externally introduced revitalization strategies are accepted, adapted, and sustained within local communities [35,36]. Recent studies on rural depopulation have also emphasized that demographic decline should not be understood only through population statistics or service provision, but also through residents’ perceptions of their local environment, place attachment, and community identity [37,38]. These social and perceptual dimensions are closely related to residents’ willingness to remain, participate in local initiatives, and accept external populations or new development strategies [38,39,40,41]. Therefore, revitalization strategies for depopulating rural and mountainous regions need to consider not only physical infrastructure and external inflows, but also the social conditions that support local acceptance and implementation.
Furthermore, studies on mountain ecological villages and mountain village promotion projects have shown that the revitalization of Mountain Villages depends not only on strengthening internal capacities, such as forest resources, local distinctiveness, and community activation, but also on utilizing external capital and human resources [9,42]. Taken together, these discussions suggest that regional revitalization is not simply a matter of population growth, but a process achieved through the recovery of regional functions and the sustained inflow of external resources.
In this context, workation has emerged as one of the strategies attracting increasing attention. Workation, a concept combining “work” and “vacation,” refers to a form of stay in which workers temporarily reside outside their usual home or office environment and combine work with leisure activities [43,44]. Previous studies on workation and related concepts, such as digital nomadism, coworkation, and coworking spaces, have examined from various perspectives how work and temporary stays in non-urban areas may contribute to regional revitalization [45,46,47,48,49]. Alongside this trend, a growing body of research has directly linked workation to regional revitalization. Lee and Lee [17], through a comparative analysis of island regions in the Republic of Korea and Japan, emphasized the importance of local distinctiveness, work and stay infrastructure, and long-stay programs. Matsushita [50] showed that collaborative workation between local communities and urban firms in Kamaishi, Japan, can contribute to the inflow of external human resources and the resolution of local issues. Park and Kim [51] and Sánchez-Vergara et al. [52] also suggested that stay-based infrastructure and coworking networks in rural and non-urban areas can positively affect local economic revitalization and the strengthening of place identity. These studies indicate that workation should be understood not merely as a form of flexible work, but as a policy instrument that can stimulate local economies and social relations through the temporary stay of external populations.
However, these studies have several limitations. First, many have focused on specific municipalities or case-study areas, making it difficult to compare and evaluate the relative potential of regions at the national scale. Second, most studies have employed relatively large spatial units, such as Si-Gun-Gu. However, because local extinction often exhibits more pronounced spatial heterogeneity at smaller spatial scales [53], an Eup-Myeon-Dong-level approach is required to identify practical policy target areas and establish differentiated response strategies. Third, compared with studies on rural and fishing villages, relatively little research has treated Mountain Villages as an independent analytical object [9]. Nevertheless, Mountain Villages require a distinct policy approach not only because of their demographic vulnerability, but also because of their forest and environmental functions. Therefore, their potential and limitations need to be assessed through a more refined analytical framework. Mountain Villages also warrant attention because they possess distinctive locational assets that can be linked to workation. Based on forest landscapes and a pleasant natural environment, Mountain Villages can offer stay experiences that are differentiated from the everyday work environment of cities, while also providing strong potential for integration with recreation, healing, and nature-based experiences. In this respect, Mountain Villages are consistent with the underlying rationale of workation, in that they can provide not merely a place for work, but an environment in which work, leisure, and restorative experiences can be combined. In other words, the strength of Mountain Villages lies not simply in their status as non-urban areas, but in their ability to offer distinctive stay experiences grounded in forest and environmental resources.
In the Republic of Korea, it is important to note that Mountain Villages are not merely a topographical category, but are institutionally defined as Eup-Myeon-Dong-level areas that meet specific criteria under the Framework Act on Forestry [54]. Accordingly, analysis at the Eup-Myeon-Dong level is not simply a matter of data availability, but an approach consistent with both the institutional definition of Mountain Villages and the unit of policy implementation. In addition, workation suitability is not determined by a single factor, but by the combined effects of multiple indicators, including transportation, digital infrastructure, living convenience, accommodation base, and the potential to attract external populations. This calls for an objective analytical framework capable of integrating these factors. In this regard, the CRITIC (Criteria Importance Through Intercriteria Correlation) method is useful because it derives weights by simultaneously considering the discriminatory power of each indicator and the degree of redundancy among indicators [55]. Since CRITIC can generate objective importance weights based on the structure of the data while minimizing arbitrary researcher judgment, it is considered an appropriate method for nationwide multi-criteria spatial assessment. Furthermore, identifying the spatial distribution and clustering characteristics of the derived suitability index requires LISA (Local Indicators of Spatial Association) analysis based on Local Moran’s I, while enhancing policy applicability additionally requires a typology that combines potential with actual demand.
Accordingly, the purpose of this study is to quantitatively assess workation suitability at the Eup-Myeon-Dong level for Mountain Villages located within Depopulation Regions across the Republic of Korea and, based on this assessment, to identify priority areas and differentiated policy directions. To achieve this, the study first constructs key indicators affecting the introduction of workation in Mountain Villages; second, it estimates indicator weights using the CRITIC method and calculates a workation suitability index; and third, it identifies spatial clusters and policy types through LISA analysis and potential–demand quadrant analysis. In sum, this study extends the existing case area-centered discussion to the national scale and empirically identifies the spatial heterogeneity within Mountain Villages at the more disaggregated Eup-Myeon-Dong level rather than at the broader Si-Gun-Gu level. This gives the study academic significance in that it treats Mountain Villages, which have received relatively limited scholarly attention, as an independent analytical object. Moreover, by presenting a spatial assessment framework that integrates suitability and demand, the study reinterprets Mountain Villages not simply as vulnerable areas but as strategic targets for revitalization, and provides an empirical basis for setting priorities in population-based regional policy. The findings are expected to provide practical information for national and local governments, regional planners, and tourism and rural development agencies seeking to identify priority areas for workation-related policy interventions and to allocate limited revitalization resources more effectively.

2. Data and Methods

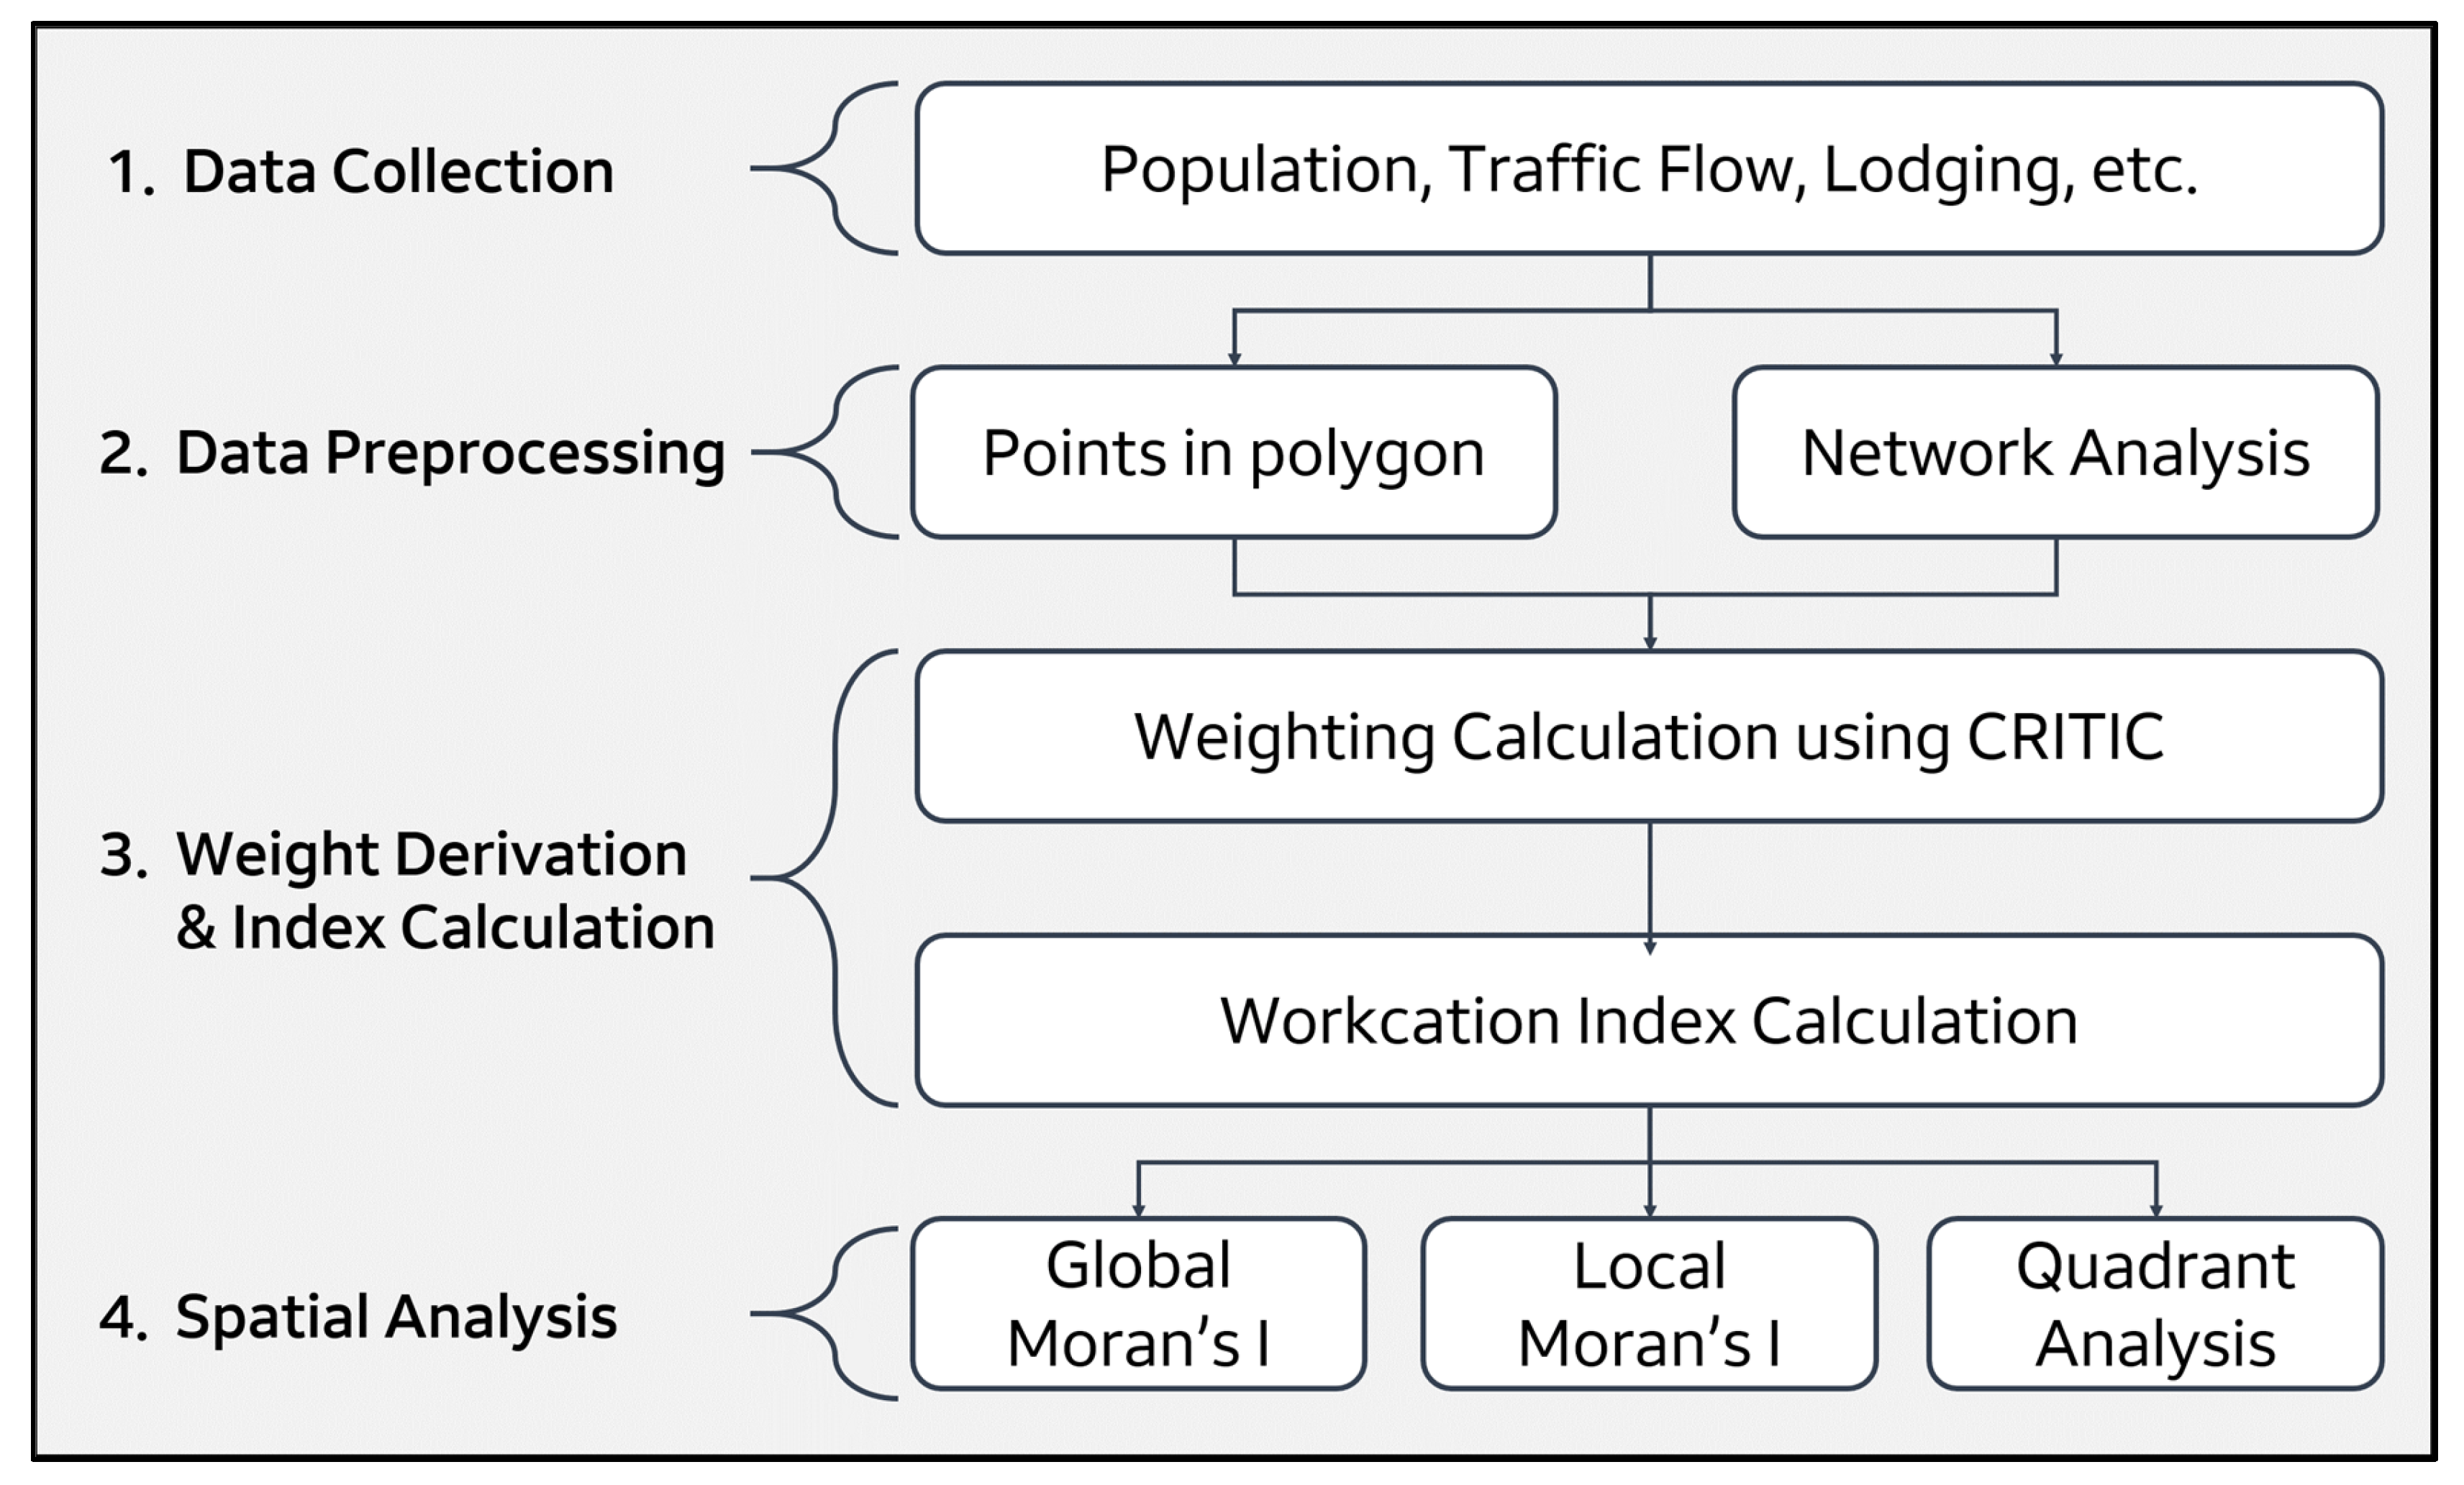
As shown in Figure 2, this study was conducted in the following sequence: Data Collection, Data Preprocessing, Weight Derivation and Index Calculation, and Spatial Analysis. All analyses, except for point-in-polygon counting, LISA analysis, and cartographic visualization, were conducted using Python. Python was used for data preprocessing, geocoding, network-based accessibility analysis, CRITIC weighting, and suitability index calculation. QGIS 3.44 was used for point-in-polygon counting and cartographic visualization, while GeoDa 1.22 was used to calculate global Moran’s I and conduct LISA analysis based on local Moran’s I. In Python 3.13, Pandas 2.2.3, NumPy 2.1.3, GeoPandas 1.1.1, and NetworkX 3.4.2 were used for tabular data processing, numerical computation, spatial data processing, and multi-source Dijkstra shortest-path analysis, respectively.

2.1. Study Area

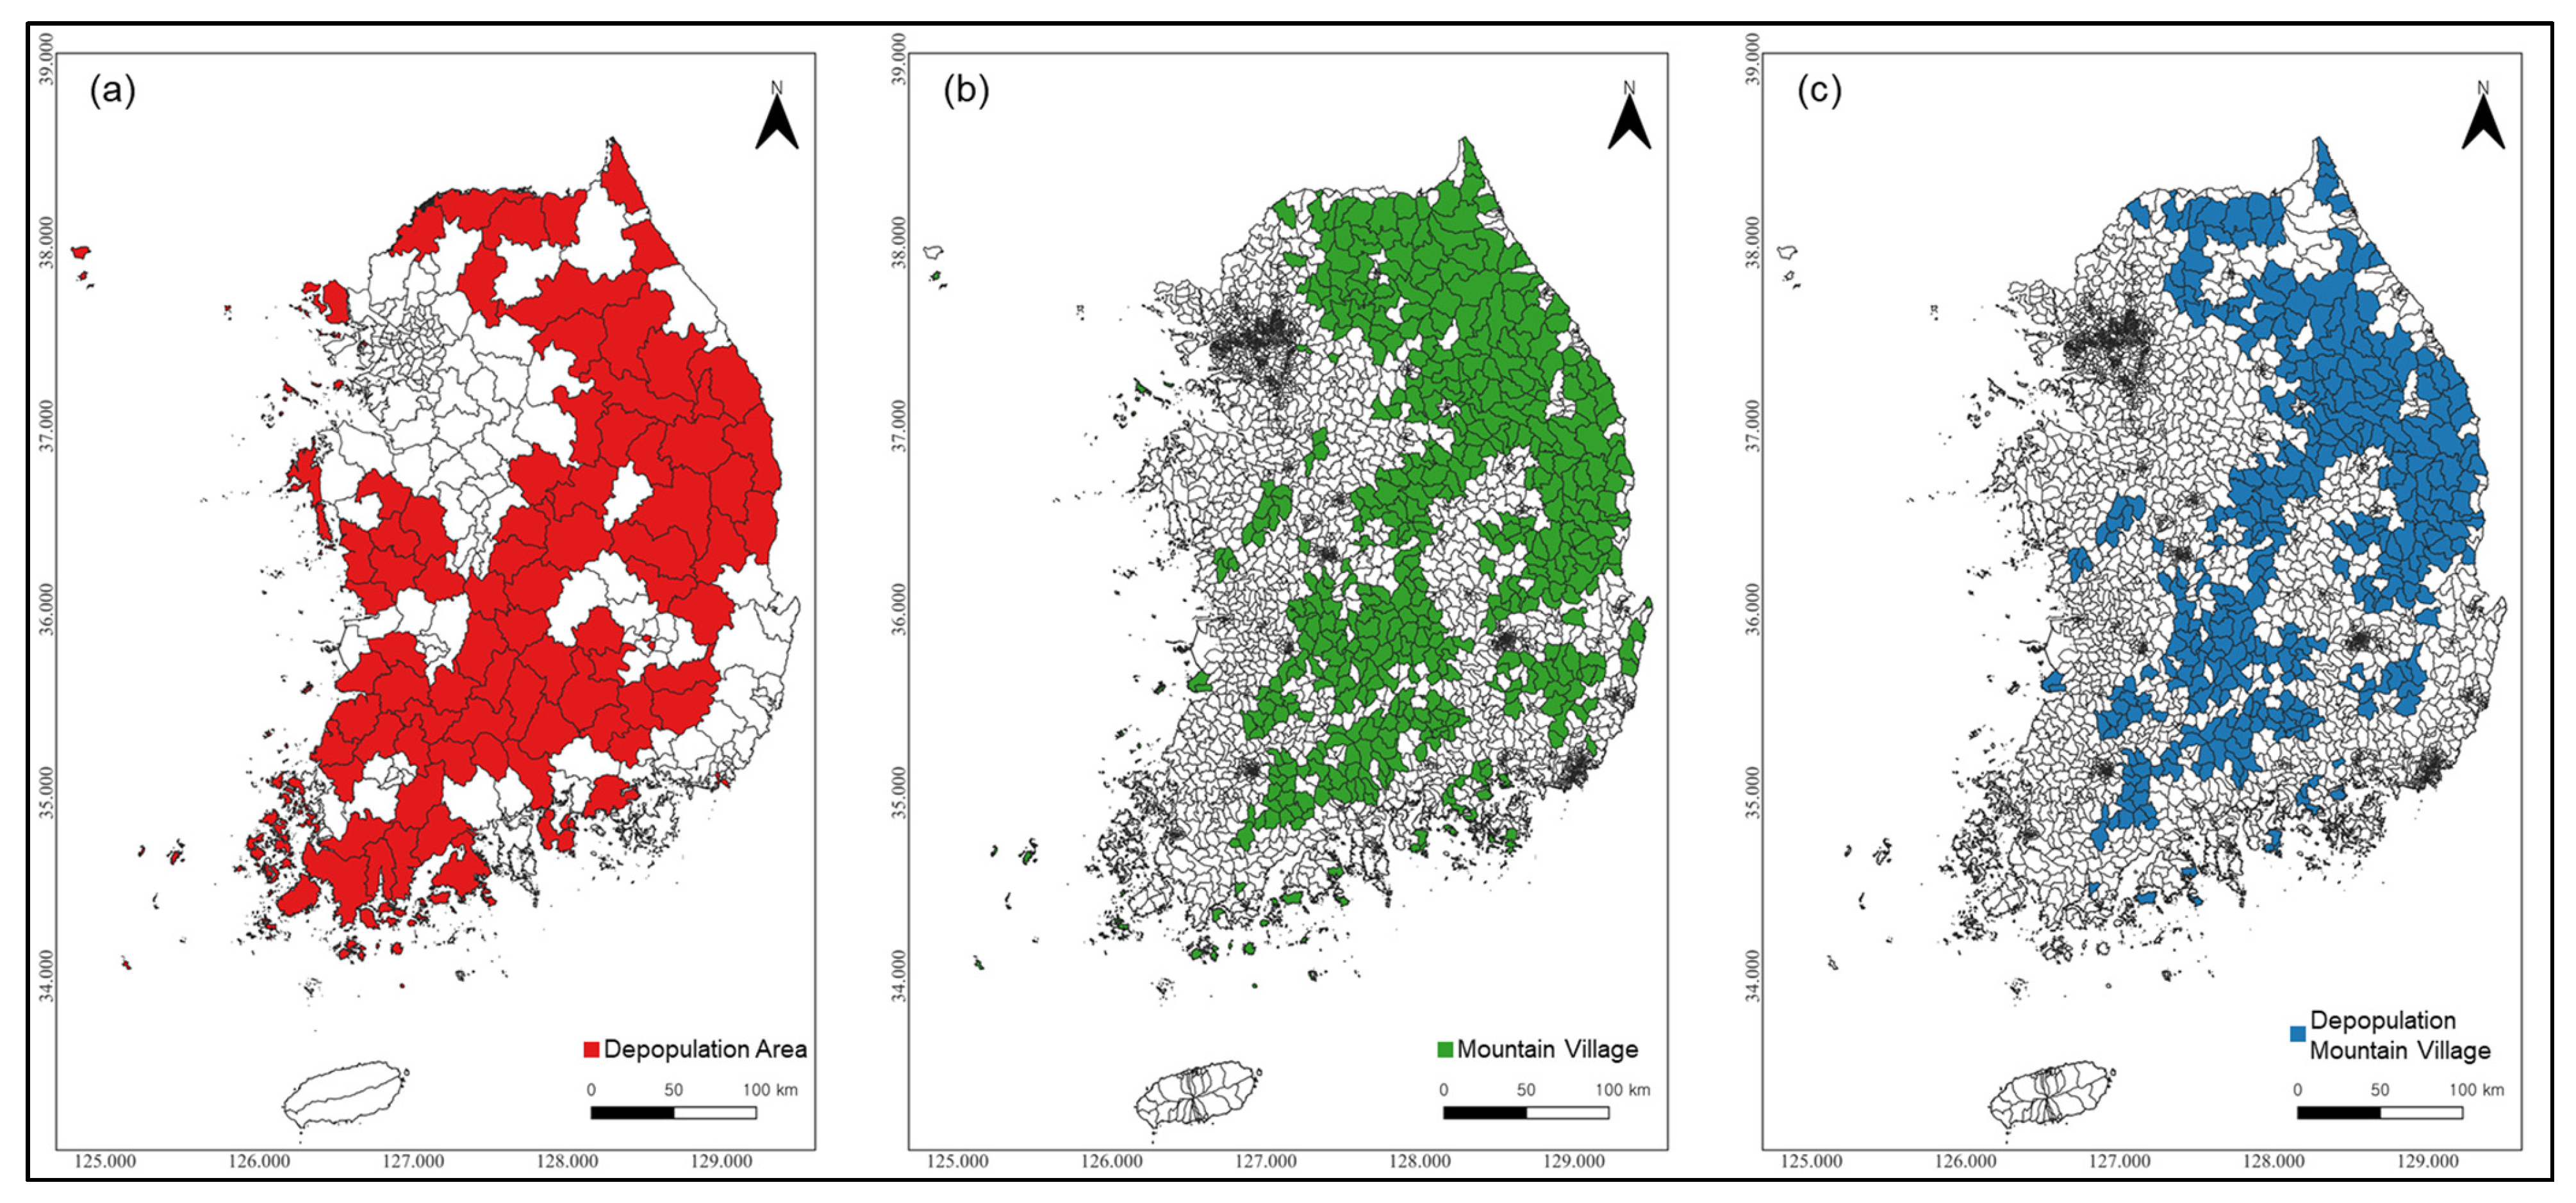
The spatial scope of this study is presented in Figure 3. The study area comprises Mountain Villages located within Depopulation Regions in the Republic of Korea. Although Mountain Villages are representative vulnerable areas experiencing rapid depopulation and population aging, they have received relatively less scholarly attention than rural and fishing villages, which warrants separate analysis. At the same time, Mountain Villages are important spaces in terms of forest resource management, ecosystem service maintenance, and national environmental conservation, and therefore their potential for revitalization needs to be empirically assessed.
In this study, Mountain Villages were selected according to the criteria set forth in the Framework Act on Forestry [54]. The criteria are as follows: (1) the ratio of forest area to the total administrative district area is at least 70%; (2) the population density is below the national average for Eup and Myeon areas; and (3) the ratio of farmland area to the total administrative district area is below the national average for Eup and Myeon areas. Depopulation Regions, meanwhile, are areas defined under the Special Act on Local Autonomy And Decentralization, and Balanced Growth, enacted in 2021 [56]. Based on eight indicators, including the annual population growth rate, population density, net migration rate of young adults, daytime population, aging rate, youth population ratio, crude birth rate, and fiscal self-reliance, a total of 89 Si-Gun-Gu were designated as Depopulation Regions. In this study, Mountain Villages located within these Si-Gun-Gu were extracted for analysis. In addition, areas with missing data and island Mountain Villages not connected to the mainland by road were excluded, as they were considered to have limitations in terms of accessibility estimation and comparability. As a result, a total of 343 Mountain Villages were ultimately selected as the study areas.

2.2. Data Collection

To assess workation suitability in Mountain Villages, this study collected public datasets reflecting population, external inflow, transportation accessibility, digital infrastructure, living convenience facilities, and accommodation bases. The most recent nationwide datasets available at the time of analysis were used, and all data were constructed to enable analysis at the Eup-Myeon-Dong level. Table 1 summarizes the main variables, data descriptions, and sources used in this study.
The collected data can be broadly classified into three categories. First, Population, Visitor, Traffic Flow, and Visitor Spending were used as indicators reflecting population size, external visitation, mobility, and tourism consumption. These variables were included to capture the demographic base, external inflow, and demand conditions of each area, all of which are relevant to regional revitalization strategies centered on the living and relationship population [10,11,12]. Population refers to the registered resident population by Eup-Myeon-Dong and was used as a variable that indirectly reflects the basic living base and the potential for maintaining local services. Visitor represents the number of out-of-town visitors and was used to reflect external visitation demand for each area. Traffic Flow refers to passenger origin–destination travel volume and was regarded as an indicator of interregional mobility and accessibility-related activity. Visitor Spending refers to tourism spending by non-residents at the local government level and was used as a proxy variable reflecting actual external demand based on consumption activity.
Second, Public Wi-Fi, Bus Stop, Rail Station, Expressway IC, Road Network, and Road Speed were used as infrastructure indicators for evaluating remote work conditions and regional accessibility. Public Wi-Fi was included because digital connectivity is a basic condition for remote work and is widely regarded as an essential component of workation and related stay-based work practices [45,46,47,48,49]. Bus Stop, Rail Station, Expressway IC, Road Network, and Road Speed were selected to capture transportation accessibility, which has been identified as a key condition for workation participation and regional attractiveness [17,18]. Public Wi-Fi was constructed based on public Wi-Fi location data and was used as a variable representing the level of digital work environment required for workation. Bus Stop was used to reflect local public transportation accessibility based on nationwide bus stop location data. Rail Station and Expressway IC were used to assess access to wide-area transportation infrastructure based on Korea Railroad Corporation station location data and expressway interchange location data, respectively. Road Network and Road Speed were used as base data for network analysis to calculate travel times to railway stations and expressway interchanges, using the national standard node-link dataset and average vehicle speed by road type.
Third, Cafe/Snack, General Restaurant, Hospital, Pharmacy, Lodging, and Rural Lodging were used as variables reflecting living convenience and accommodation bases that support temporary stay and daily life. These variables were included because workation requires not only a work environment but also everyday service and lodging conditions that can sustain medium- to long-term stays [17,50,51,52]. Cafe/Snack and General Restaurant refer to snack/cafe facilities and general restaurants, respectively, and were used as indicators of food and beverage convenience facilities. Hospital and Pharmacy were used to reflect basic medical accessibility and living stability based on data on medical clinics and pharmacies. Lodging refers to general accommodation businesses, while Rural Lodging refers to rural lodging businesses; both were used as variables for evaluating the availability and diversity of accommodation options for workation participants. These variables were selected in consideration of the fact that workation is not a simple visit, but an activity that combines work and daily life during a certain period of stay.
Facility data provided in address or location-information format were aggregated at the Eup-Myeon-Dong level through geocoding and spatial overlay. In addition, road network and average speed data were used to calculate travel times to railway stations and expressway interchanges. The detailed preprocessing procedures and accessibility calculation methods are described in the following section.

2.3. Data Preprocessing

Data preprocessing in this study consisted of two main steps: calculating point counts within polygons and conducting network analysis.

2.3.1. Calculation of Point Counts Within Polygons

For Public Wi-Fi, Bus Stop, Cafe/Snack, General Restaurant, Hospital, Pharmacy, Lodging, and Rural Lodging, point counts within polygons were calculated to identify the number of facilities located within each Mountain Village. Address-based data were first converted into latitude and longitude coordinates through geocoding. The resulting point data were then overlaid with Mountain Village boundaries in QGIS, and the number of facilities was aggregated for each Eup-Myeon-Dong polygon. Through this process, the spatial distribution of digital infrastructure, living convenience facilities, and accommodation bases required for workation and temporary stays was quantitatively measured.

2.3.2. Network Analysis

To evaluate road network-based accessibility, the collected Node-Link data were converted into a graph structure, and a time weight was assigned to each link by considering link length and average travel speed by road grade, as shown in Equation (1).
w e = L e v e
where w e represents the travel time of link e, L e is link length, and v e represents the average travel speed by road grade.
Road grade-specific average speeds were applied as shown in Table 2 to reflect differences in vehicle travel speeds by road type. This enabled the construction of more realistic accessibility conditions that account for movement characteristics by road type.
The locations of Expressway IC and Rail Stations were snapped to the nearest nodes on the road network and defined as the source node set S. Subsequently, the shortest travel time from every road node x to the nearest source node was calculated using the multi-source Dijkstra algorithm [64], a representative shortest-path algorithm, as shown in Equation (2).
d ( x ,   S ) = min s S min p P ( x , s ) e p w e
P ( x ,   s ) is the set of all possible paths from node x to source node s, and p represents one path. d(x, S) is the shortest travel time from node x to the nearest Expressway IC or Rail Station.
Finally, the representative accessibility time for each Eup-Myeon-Dong was summarized using the lower 10th percentile ( p 10 ) of the node travel-time distribution, as shown in Equation (3).
T T p 10 ( i ) = Q 0.10 d ( x ,   S ) 60   :   x V i
Q 0.10 ( · ) represents the 10th percentile, V i is the set of road nodes included in Eup-Myeon-Dong i, and T T p 10 ( i ) is the representative accessibility time of Eup-Myeon-Dong i.
Because Mountain Villages often cover large areas and contain dispersed settlements, accessibility based on a single centroid may not sufficiently reflect actual accessibility. Therefore, this study used the lower 10th percentile as the representative value to capture relatively accessible locations within each Eup-Myeon-Dong.

2.4. Weight Estimation and Suitability Assessment

After preprocessing, all variables were normalized for use as indicators. Min–Max normalization was applied to all indicators within a range of 0 to 1. Time- and distance-related variables were treated as cost-type indicators, for which lower values were considered more favorable, whereas all other variables were treated as benefit-type indicators, for which higher values were considered more favorable.
Benefit   type :   z i j = x i j min i x i j m a x i x i j min i x i j         Cost   type :   z i j = m a x i x i j x i j m a x i x i j min i x i j
Next, the weights of the indicators were estimated using the CRITIC method. CRITIC is an objective weighting method that derives weights by simultaneously considering the contrast intensity of each criterion and the conflict among criteria, thereby minimizing subjective researcher judgment while providing reproducible results [55]. Because this study compares and integrates multiple indicators across Mountain Villages nationwide, a data-driven objective weighting approach was considered more appropriate than subjective weighting, and the CRITIC method was therefore adopted.
First, the standard deviation of the normalized values was calculated to assess the amount of information provided by each criterion j.
σ j = 1 n i = 1 n ( x i j x ¯ j ) 2
x i j is the normalized score of alternative i for criterion j, x ¯ j is the mean normalized score for criterion j and σ j is the standard deviation of criterion j. A larger standard deviation indicates that the criterion has greater discriminatory power across alternatives.
The correlation between criteria was then calculated using the Pearson correlation coefficient.
r j k = i n ( x i j x ¯ j ) ( x i k x ¯ k ) i n ( x i j x ¯ j ) 2 i n ( x i k x ¯ k ) 2
r j k is the correlation coefficient between criteria j and k. A higher correlation coefficient indicates that the two criteria share more similar information, whereas a lower coefficient suggests that they provide more distinct information.
Conflict was calculated as follows. S j represents the overall degree to which criterion j conflicts with all other criteria. A larger value of S j indicates that the criterion contains relatively independent information with less redundancy relative to the other criteria.
S j = k = 1 m ( 1 r j k )
The amount of information for criterion j, represented by C j , was then calculated by combining the standard deviation and the conflict value.
C j = σ j × S j = σ j k = 1 m ( 1 r j k )
Finally, the objective weight w j for each criterion was calculated as follows:
w j = C j k = 1 m C k
The estimated weights represent the relative information content of each criterion based on the structure of the data, with larger values indicating a greater discriminatory contribution to the final suitability index. These weights were then applied to the normalized indicators to calculate the final workation suitability index for each Eup-Myeon-Dong, which was linearly transformed to a scale of 0–100 for ease of interpretation.
S i = j = 1 m w j z i j ,         S i ( 0 100 ) = S i m i n i S i m a x i S i m i n i S i × 100
S i is the workation suitability index, w j is the weight of criterion j, z i j is the normalized value of indicator for area i.

2.5. Spatial Analysis

2.5.1. Spatial Autocorrelation Analysis

Moran’s I is a representative statistic used to measure spatial autocorrelation [65] and is based on Tobler’s first law of geography: “Everything is related to everything else, but near things are more related than distant things” [66]. Moran’s I is generally divided into global Moran’s I and local Moran’s I. Global Moran’s I is used to identify overall clustering tendencies [67], whereas local Moran’s I is used to detect clusters and spatial outliers at the individual-area level [68]. Moran’s I has been widely used in previous studies as a powerful tool for statistically examining spatial clustering, detecting hot spots, and analyzing spatial similarity among regions [69,70,71,72,73,74,75,76]. Since this study aims to identify the locations of regional clusters for policy application, it focuses on LISA analysis based on local Moran’s I. The spatial weight matrix was constructed using a k-nearest neighbors approach, connecting the six nearest neighbors based on the centroid of each Eup-Myeon-Dong, and row-standardization was applied. Statistical significance was tested using 999 permutations, with the significance level set at p < 0.05.
I i = x i X ¯ S i 2 j = 1 ,   j i n w i , j ( x j X ¯ ) ; S i 2 = j = 1 .   j i n ( x j X ¯ ) 2 n 1
x i is the value of the i-th area, X ¯ is the mean value across all areas, w i , j is the spatial weight between locations i and j, n is the number of areas.
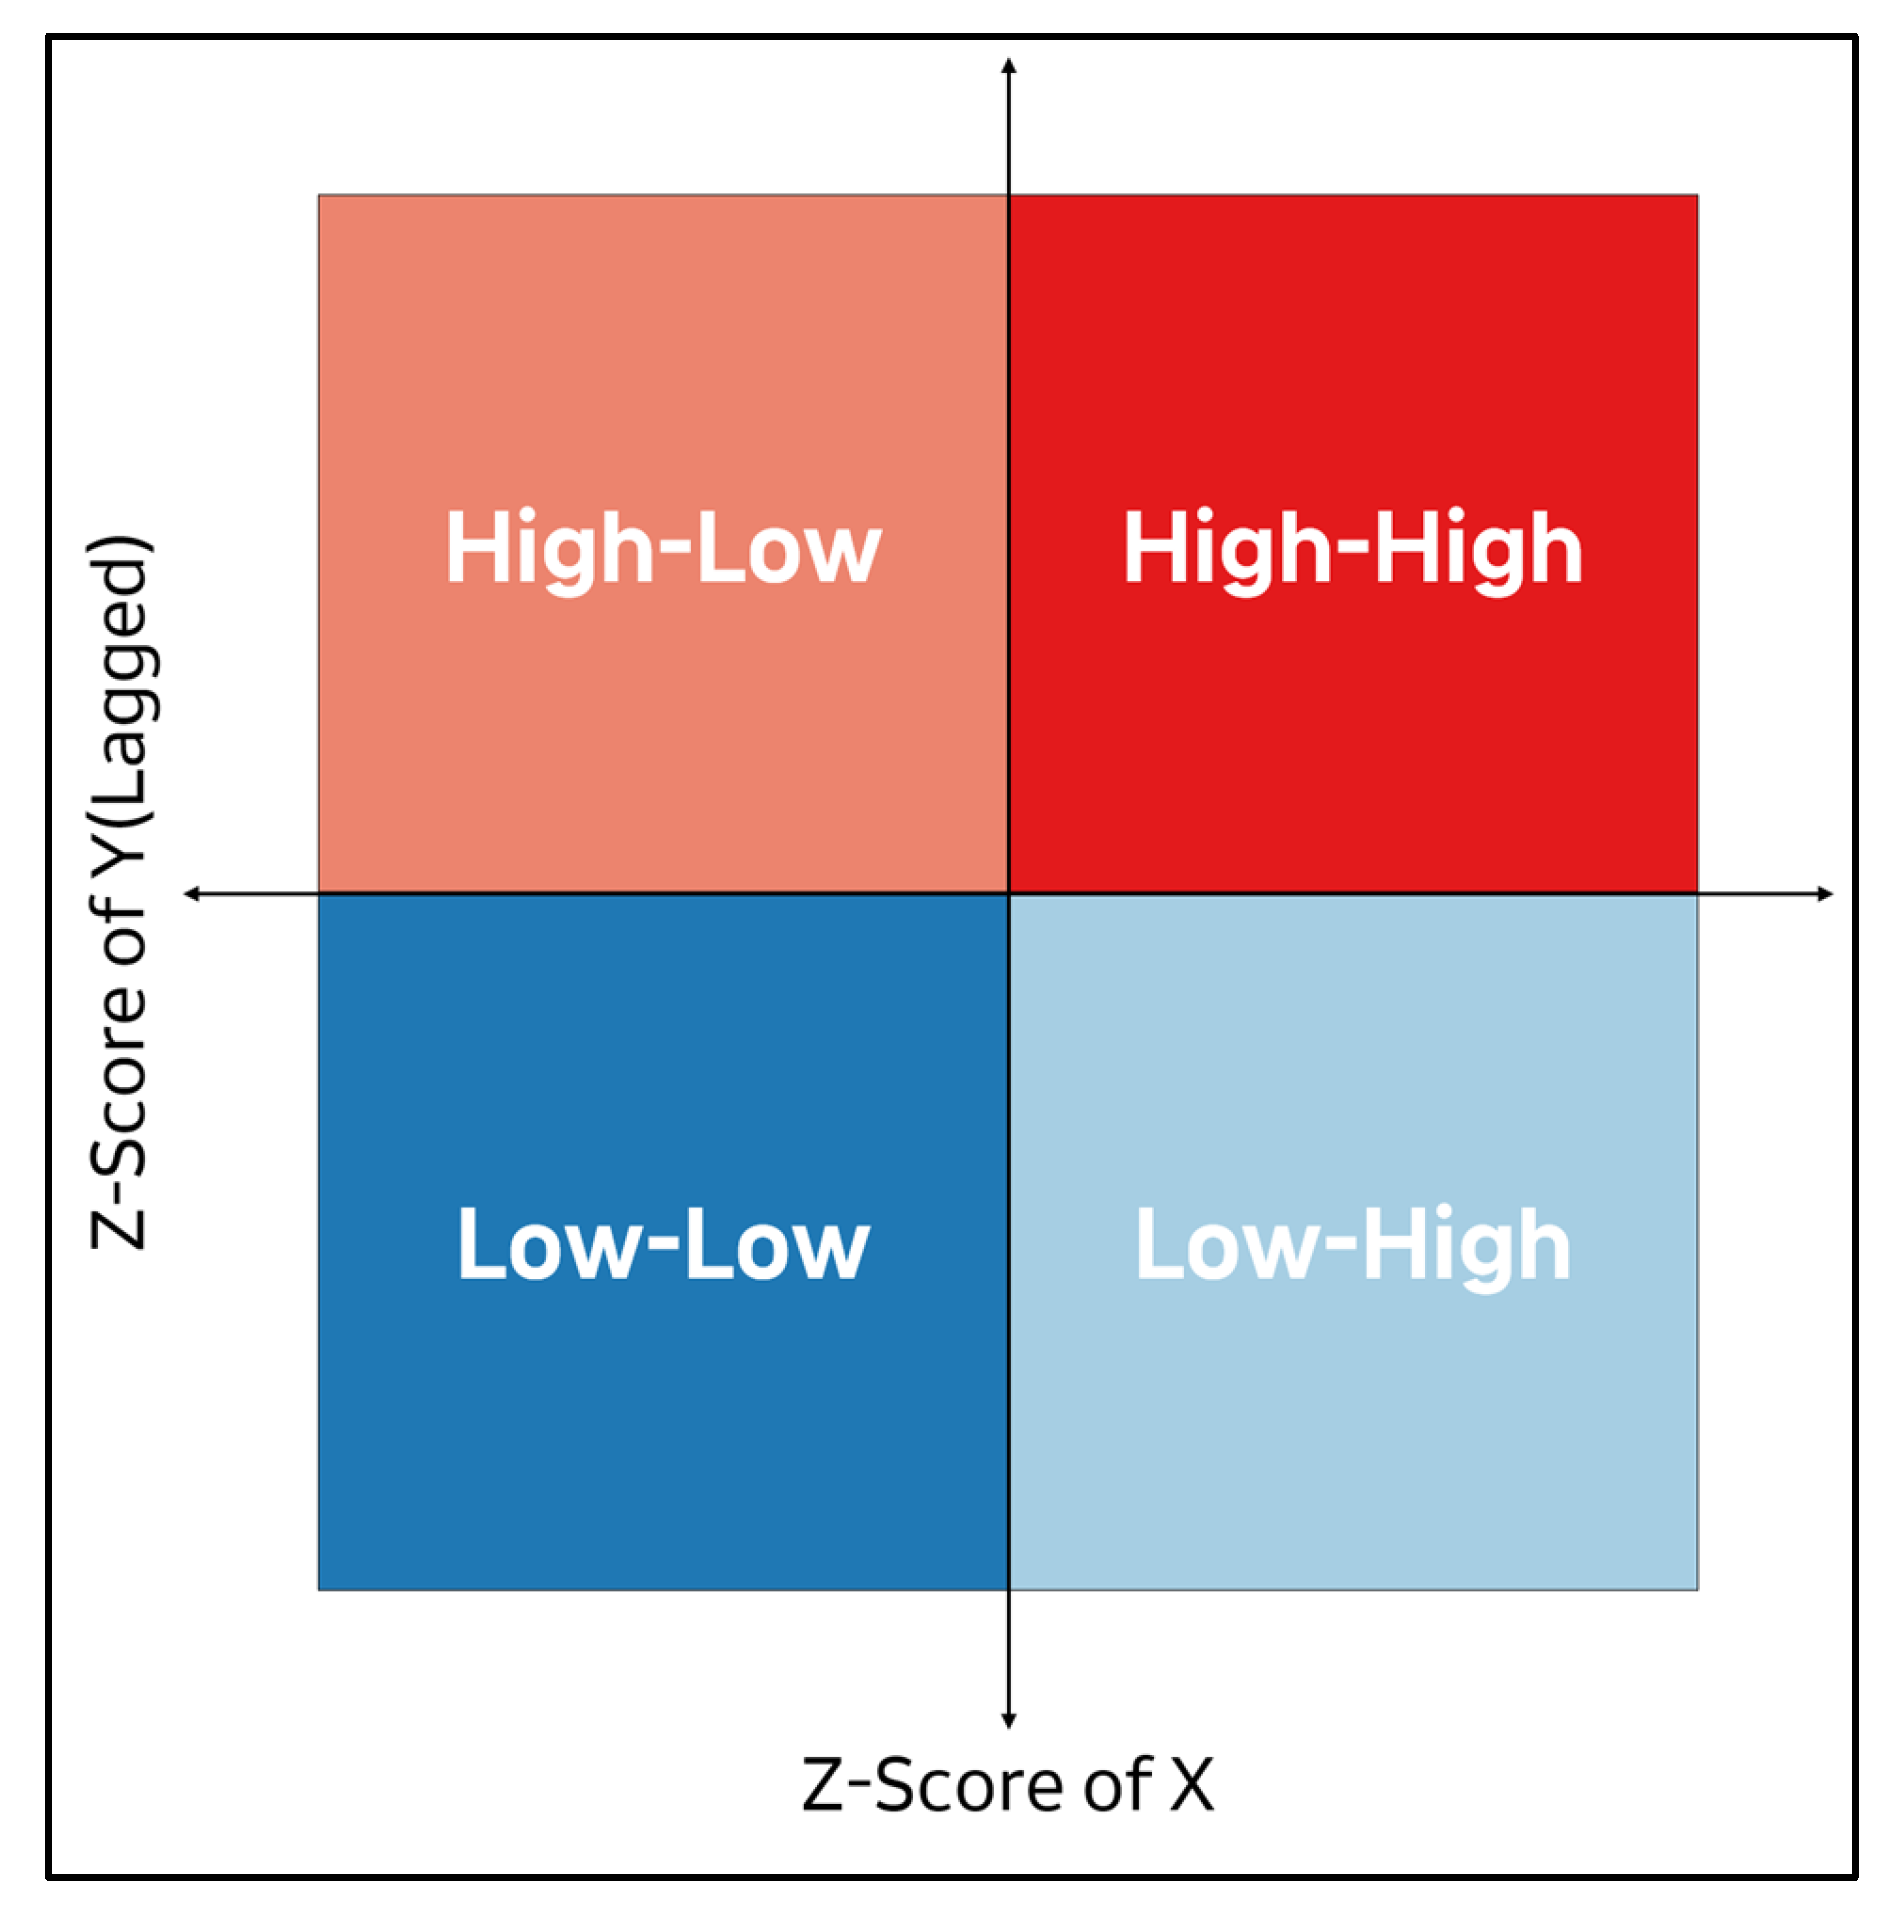
The LISA results were classified into four types, as shown in Figure 4: HH (High–High), LL (Low–Low), HL (High–Low), and LH (Low–High).
HH indicates an area with a high value surrounded by neighboring areas with high values, whereas LL indicates an area with a low value surrounded by neighboring areas with low values. In contrast, HL and LH are interpreted as spatial outliers with values that differ from those of neighboring areas. This analysis was used to identify local clusters and outlier areas in the workation suitability index.

2.5.2. Potential–Demand Quadrant Analysis

To enhance the policy applicability of the results, this study classified each Mountain Village into quadrants based on two axes: potential and demand. The potential axis was represented by the workation suitability index calculated above, while the demand axis was constructed using non-resident card spending. Specifically, demand was calculated by applying a log transformation to the card spending data and then performing Min–Max normalization.
D i = M i n M a x ( ln ( 1 + V i s i t o r S p e n d i n g i ) )
D i is the demand score of area i, V i s i t o r S p e n d i n g i is non-resident card spending.
Quadrant classification was conducted based on the median values of the potential and demand scores. The four quadrants were defined as Q1 (high potential, high demand), Q2 (high potential, low demand), Q3 (low potential, high demand), and Q4 (low potential, low demand). The classification criteria and strategic implications of the four quadrants are summarized in Table 3. Q1 was interpreted as the Immediate Promotion Type, where both suitability and demand conditions are favorable. Q2 was defined as the Promising Potential Type, indicating areas with favorable suitability but limited current demand. Q3 was defined as the Condition Improvement Type, representing areas where demand exists but suitability conditions remain insufficient. Q4 was defined as the Strategic Transition Type, indicating areas where both potential and demand are currently limited and where direct workation promotion may be less effective in the short term. For these areas, alternative or preceding strategies, such as improving basic living conditions, strengthening local service functions, and enhancing community capacity, may be required. Because quadrant analysis enables the classification of regions according to the relative combination of two key dimensions and supports the formulation of differentiated strategies by type, it has been widely used in previous studies [77,78,79] and was also adopted in this study.

3. Results

3.1. Weights for Calculating Workation Suitability

The results of the variable weights derived using the CRITIC method are presented in Table 4. ICTT showed the highest weight at 0.161, followed by STATT (0.132), Bus Stop (0.093), Public Wi-Fi (0.079), and Traffic Flow (0.076). In contrast, Population (0.045), General Restaurant (0.052), and Cafe/Snack (0.053) showed relatively low weights. The standard deviation was relatively high for ICTT (0.218), STATT (0.168), and Bus Stop (0.157), indicating strong discriminatory power among regions. Conflict values were high for STATT (12.436), ICTT (11.676), and Traffic Flow (10.904), suggesting that these indicators provided relatively distinct information with less overlap with other variables.

3.2. Workation Suitability Index Assessment

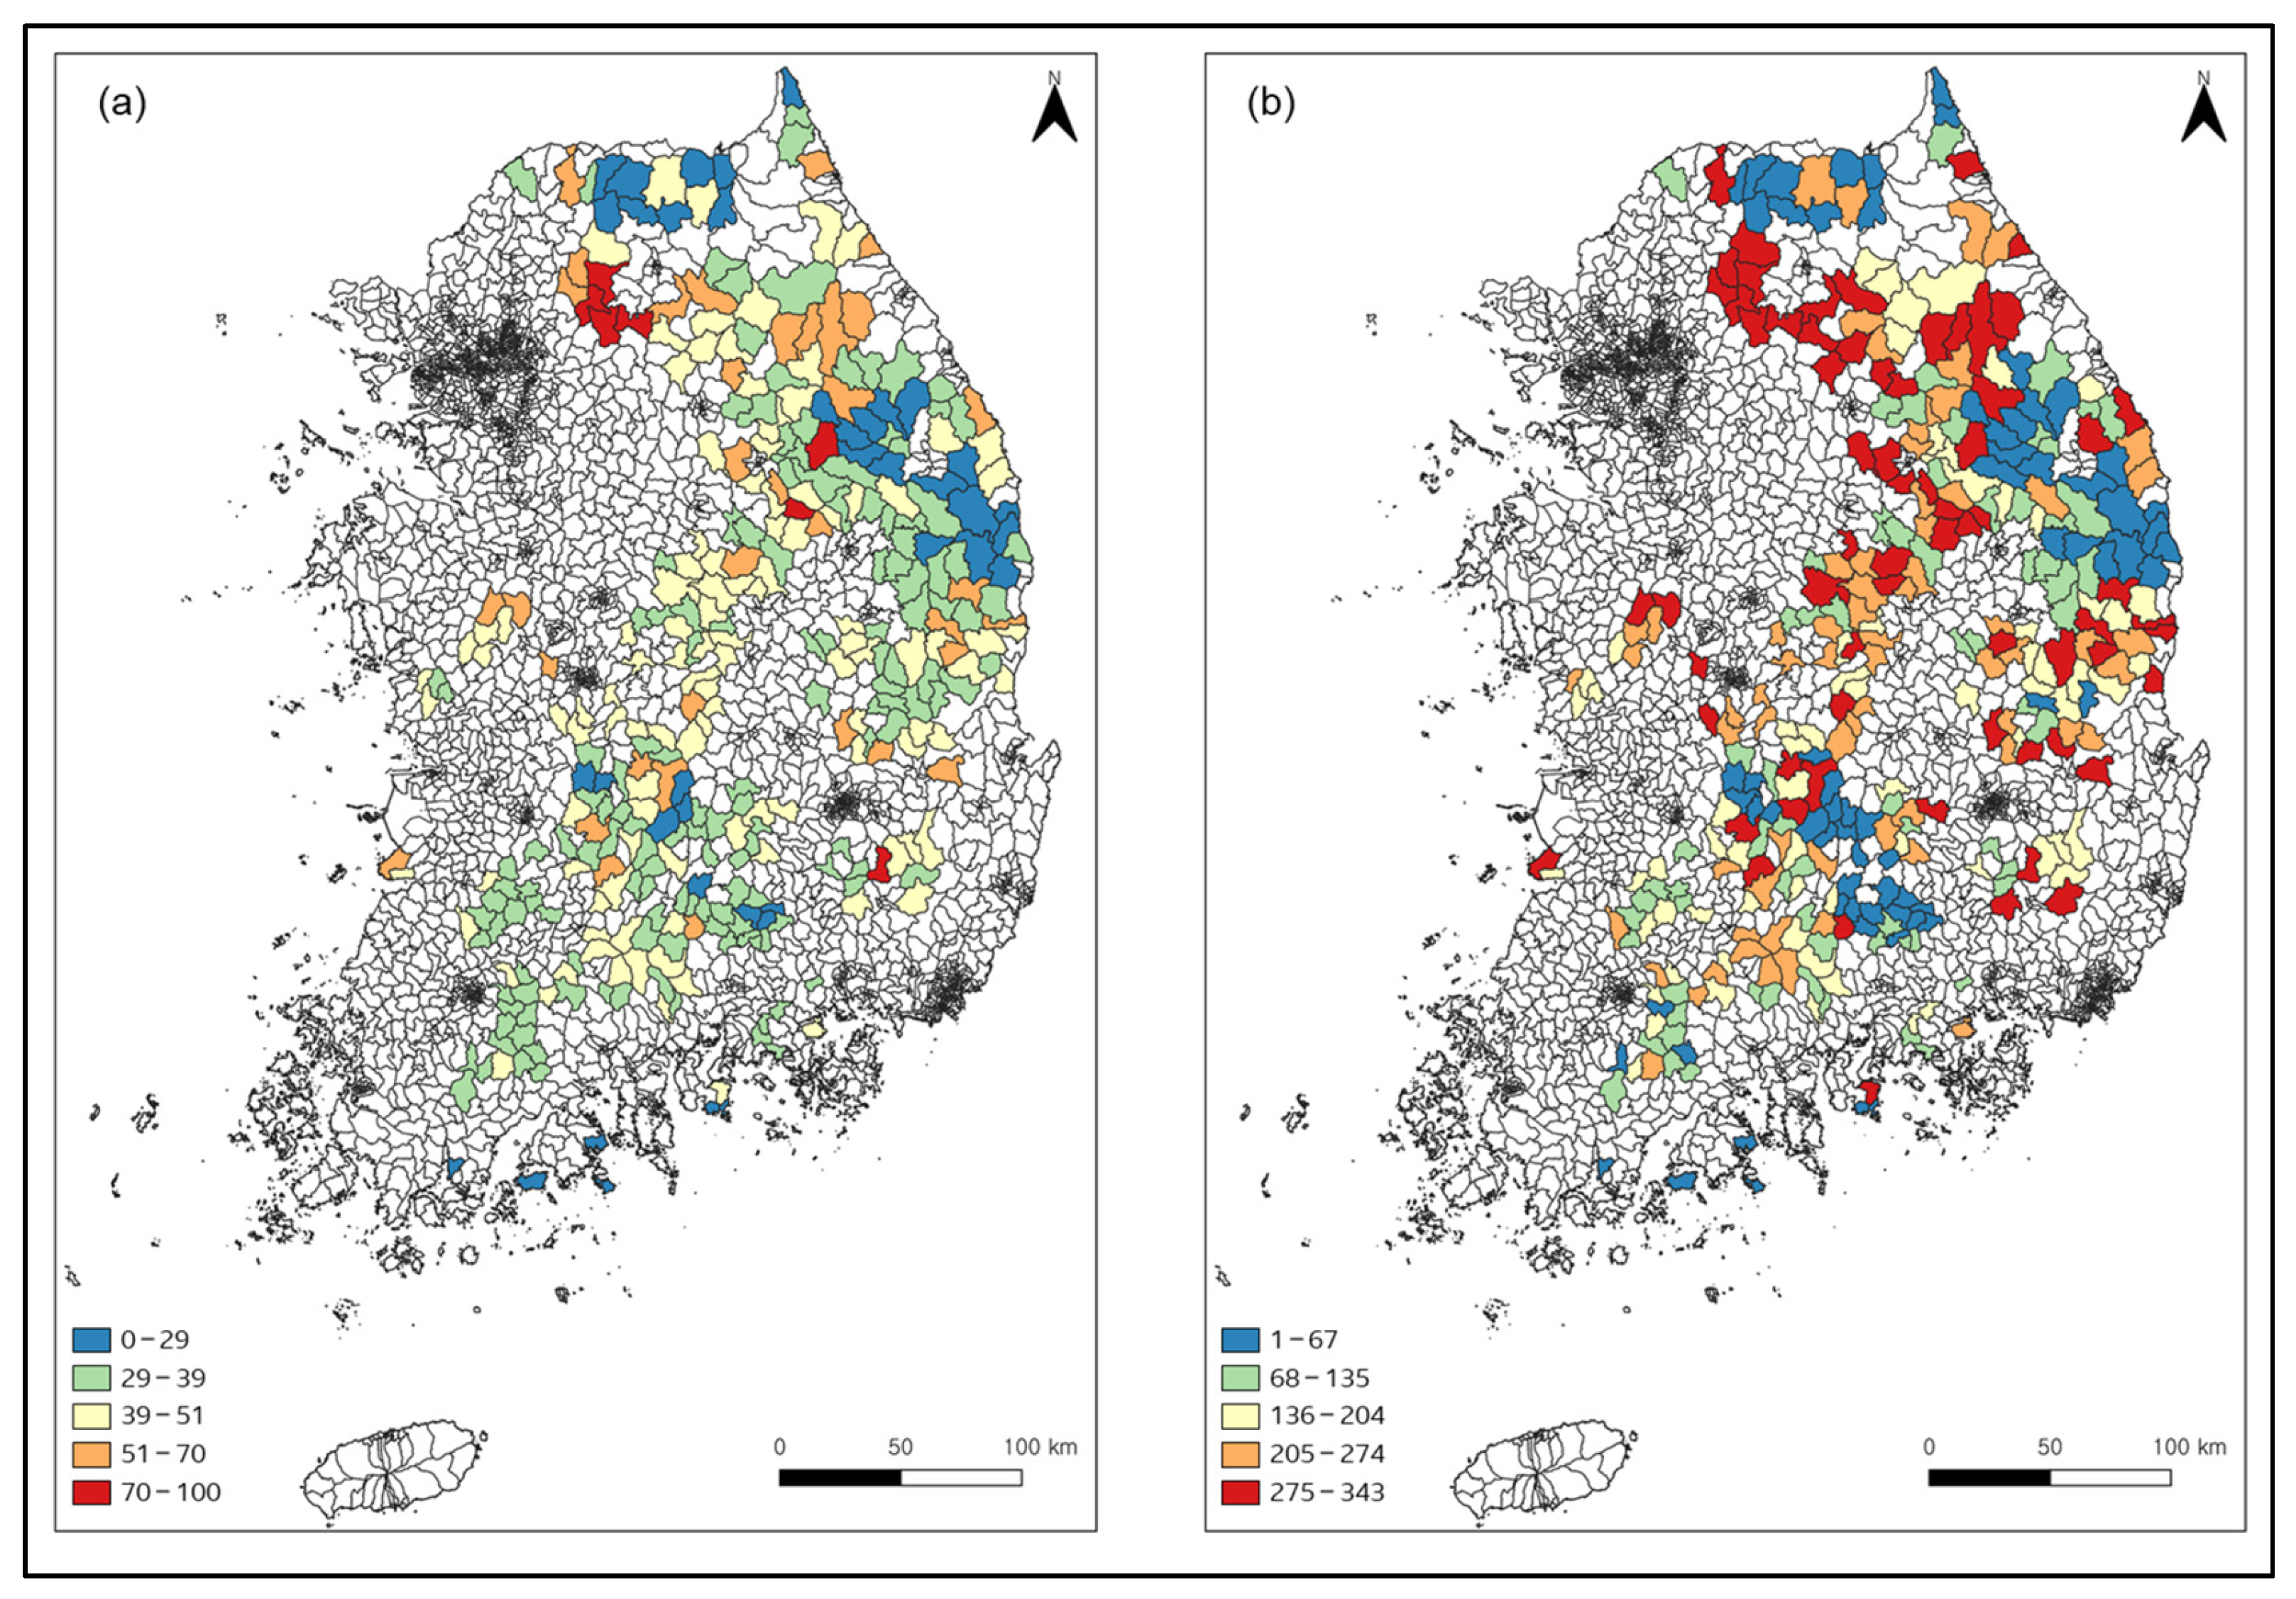
The workation suitability index calculated based on the estimated weights is shown in Figure 5. The index was not evenly distributed across Mountain Villages nationwide, but instead exhibited clear regional differences, with relatively high values concentrated in several areas.
Table 5 presents the top 10 and bottom 10 regions in terms of the workation suitability index. Among the highest-ranked regions, several Mountain Villages in Gapyeong-gun, Gyeonggi-do, were included, with Gapyeong-eup, Cheongpyeong-myeon, and Seorak-myeon ranking particularly high. Yeongwol-eup, Cheongdo-eup, and Danyang-eup also showed high suitability scores. In contrast, the lower-ranked regions included several areas in Yanggu-gun, Cheorwon-gun, and Jeongseon-gun in Gangwon State, with Bangsan-myeon recording the lowest value.

3.3. Spatial Autocorrelation of Workation Suitability

To examine whether the workation suitability index exhibited spatial clustering, Moran’s I was calculated. The results showed a Moran’s I value of 0.346, a z-score of 11.625, and a p-value of 0.001 (Table 6). This indicates that the workation suitability index has statistically significant positive spatial autocorrelation, meaning that similar values tend to cluster spatially.
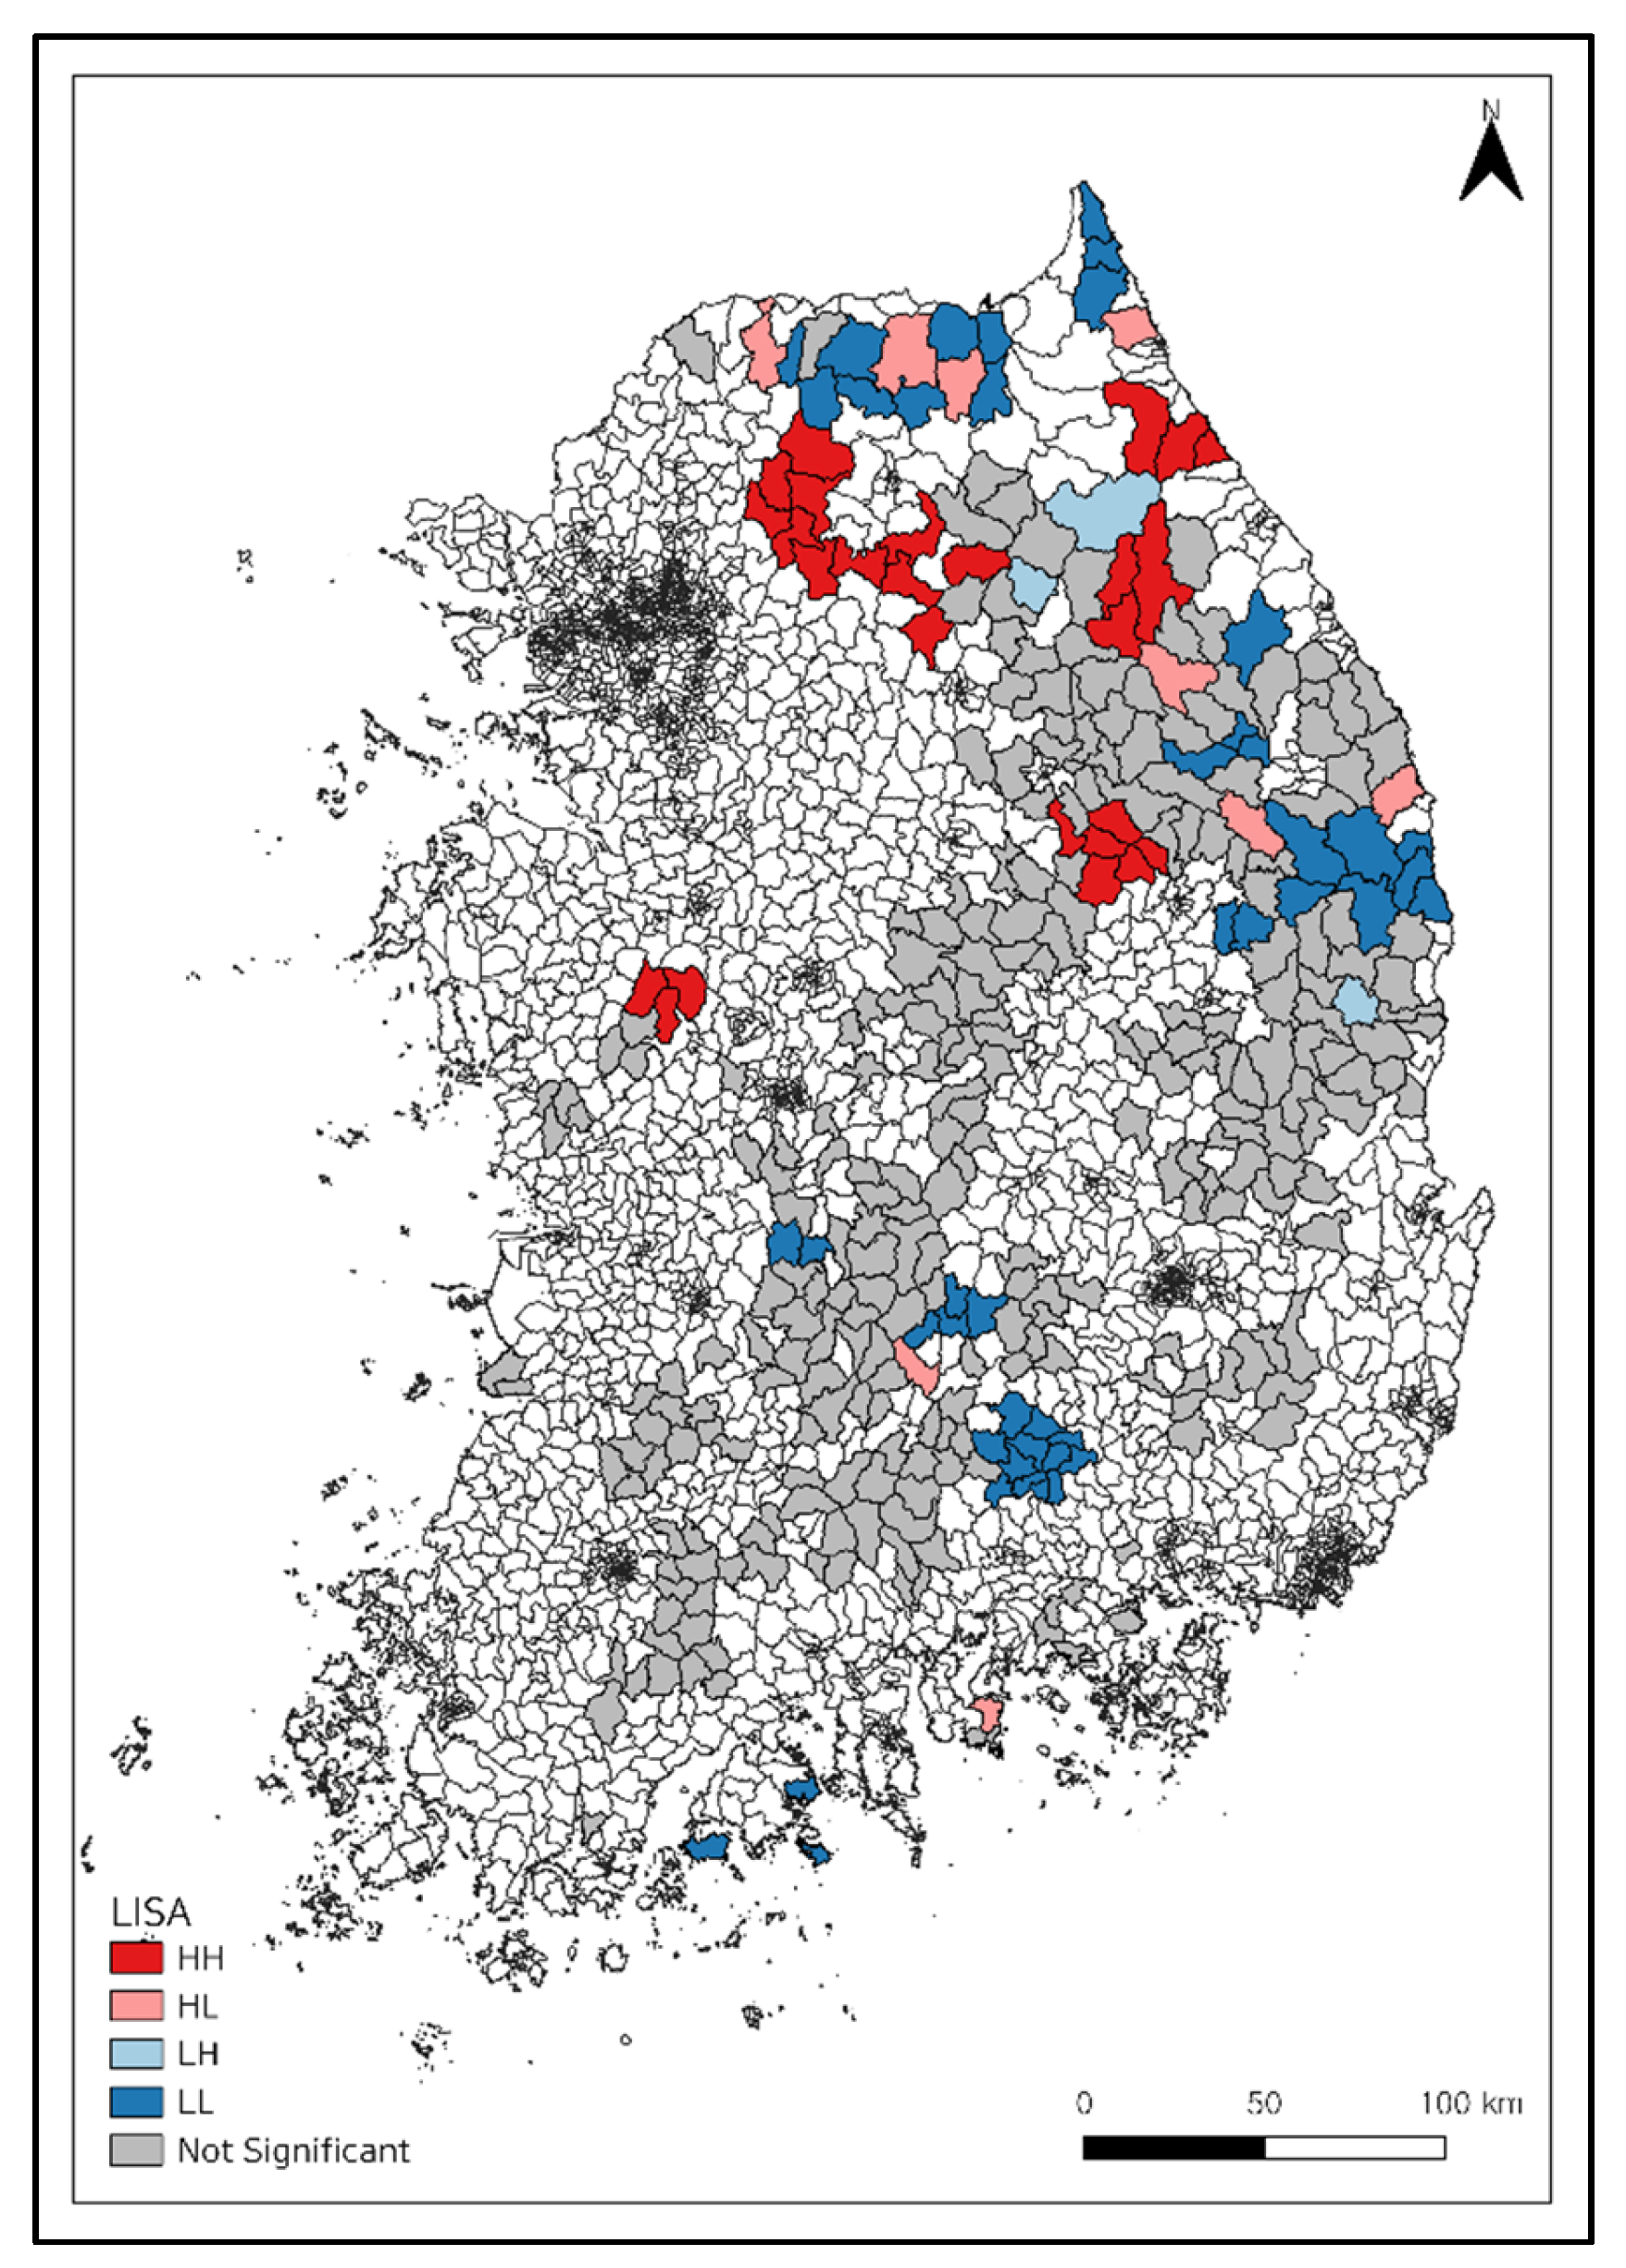
To further identify the locations of specific clusters, LISA analysis based on local Moran’s I was conducted, and the results are presented in Figure 6 and Table 7. HH clusters were identified in the border areas between Gyeonggi-do and Gangwon State, central Gangwon State and some northeastern parts, as well as northeastern Chungcheongbuk-do and central Chungcheongnam-do. In contrast, LL clusters appeared in northern Gangwon State, northern Gyeongsangbuk-do, western Gyeongsangnam-do, and southern Jeollanam-do. More specifically, HH clusters were distributed in areas such as Gapyeong-gun, Hongcheon-gun, Yangyang-gun, Pyeongchang-gun, Gongju-si, and Danyang-gun, whereas LL clusters were identified in Yanggu-gun, Hwacheon-gun, Cheorwon-gun, Jeongseon-gun, Yeongwol-gun, Uljin-gun, Yeongyang-gun, and Bonghwa-gun.

3.4. Results of Potential–Demand Quadrant Analysis

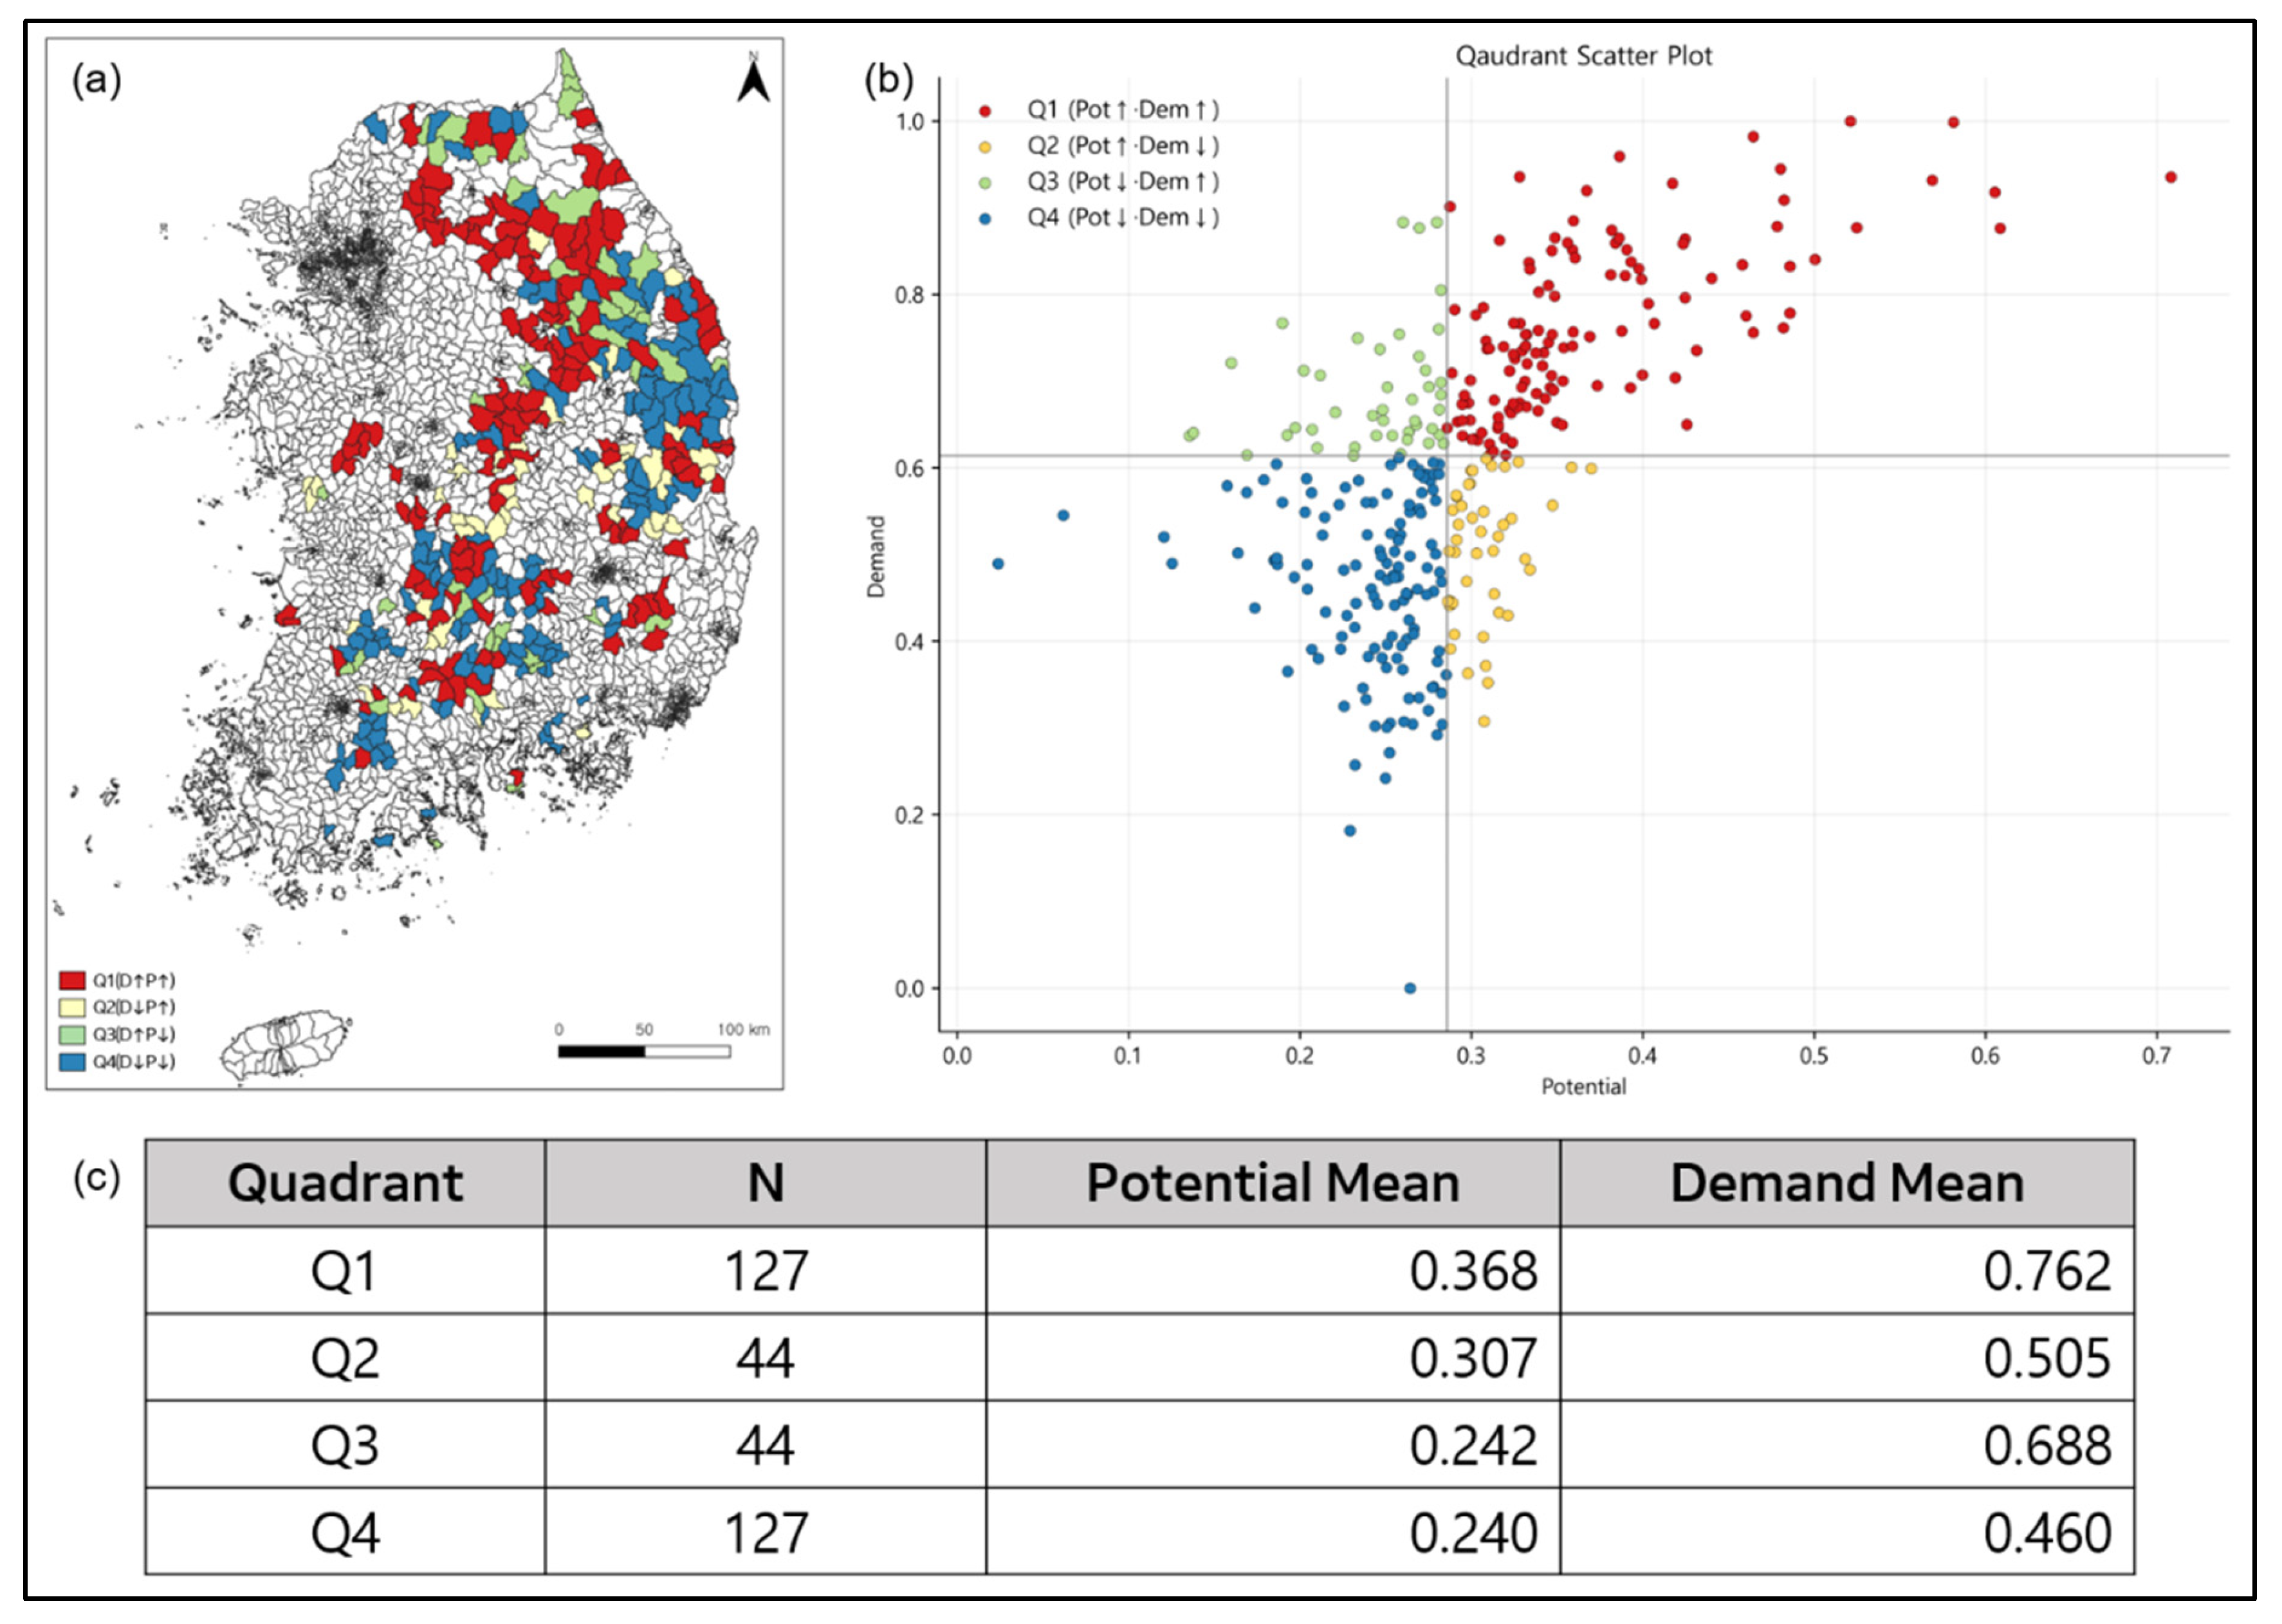
The results of the potential–demand quadrant analysis are shown in Figure 7. A total of 128 regions were classified into Q1, with mean potential and demand scores of 0.368 and 0.762, respectively. Q2 included 44 regions, with a mean potential score of 0.307 and a mean demand score of 0.505. Q3 also contained 44 regions, with mean potential and demand scores of 0.242 and 0.688, respectively. Finally, Q4 included 127 regions, with a mean potential score of 0.240 and a mean demand score of 0.460.
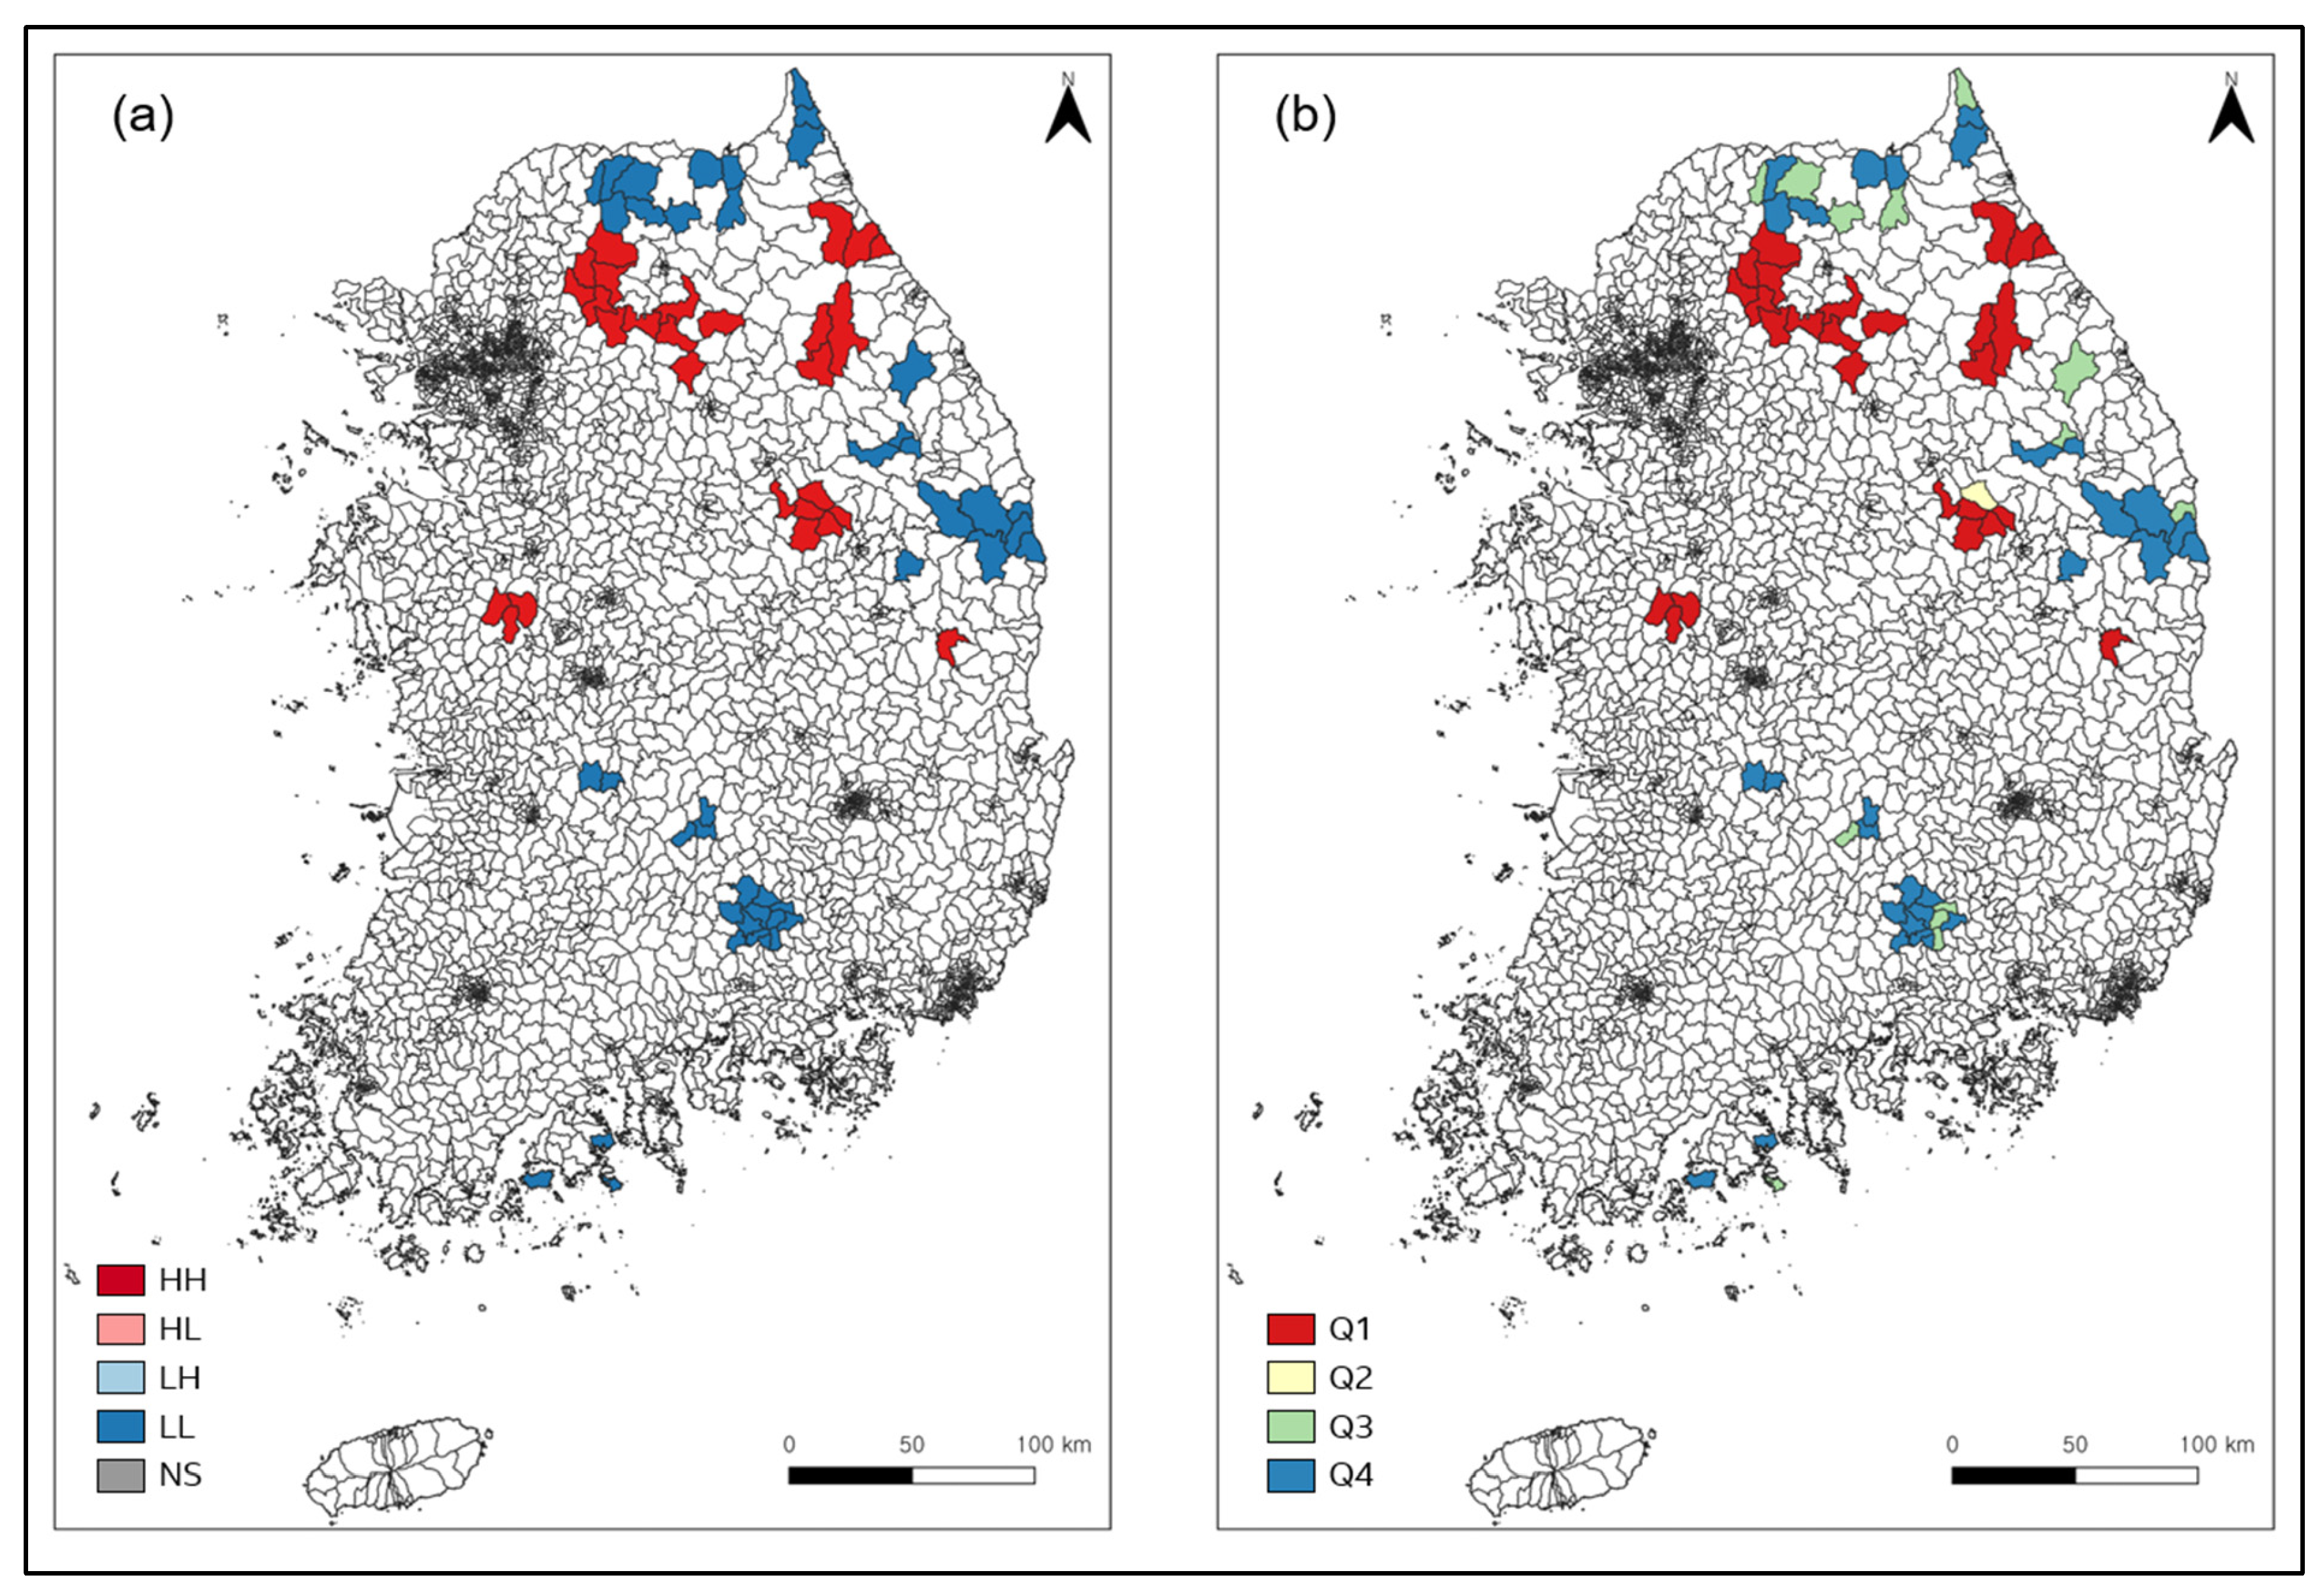
The overlay of the LISA results and the quadrant analysis is presented in Figure 8. Most areas overlapping with HH clusters were found to belong to Q1, whereas areas overlapping with LL clusters were mainly classified into Q3 and Q4.

4. Discussion

This study assessed workation suitability in Mountain Villages located within Depopulation Regions across the Republic of Korea and analyzed their spatial clusters and potential–demand types. The results showed that transportation accessibility indicators, including ICTT and STATT, had relatively high CRITIC weights. This suggests that accessibility to wide-area transportation networks functions as an important enabling condition for workation suitability in Mountain Villages. Nevertheless, the role of accessibility should be considered in conjunction with other factors that support the overall workation experience. While convenient transportation may facilitate access to Mountain Villages, its contribution is likely to be enhanced when accompanied by adequate digital connectivity, accommodation capacity, living convenience facilities, local programs, and community-level readiness. In this respect, the findings are broadly consistent with previous studies emphasizing accessibility, work infrastructure, and accommodation bases as key conditions for attracting workation participants [18,46,80], while also indicating that broader socio-cultural and place-based factors need to be considered in actual implementation.
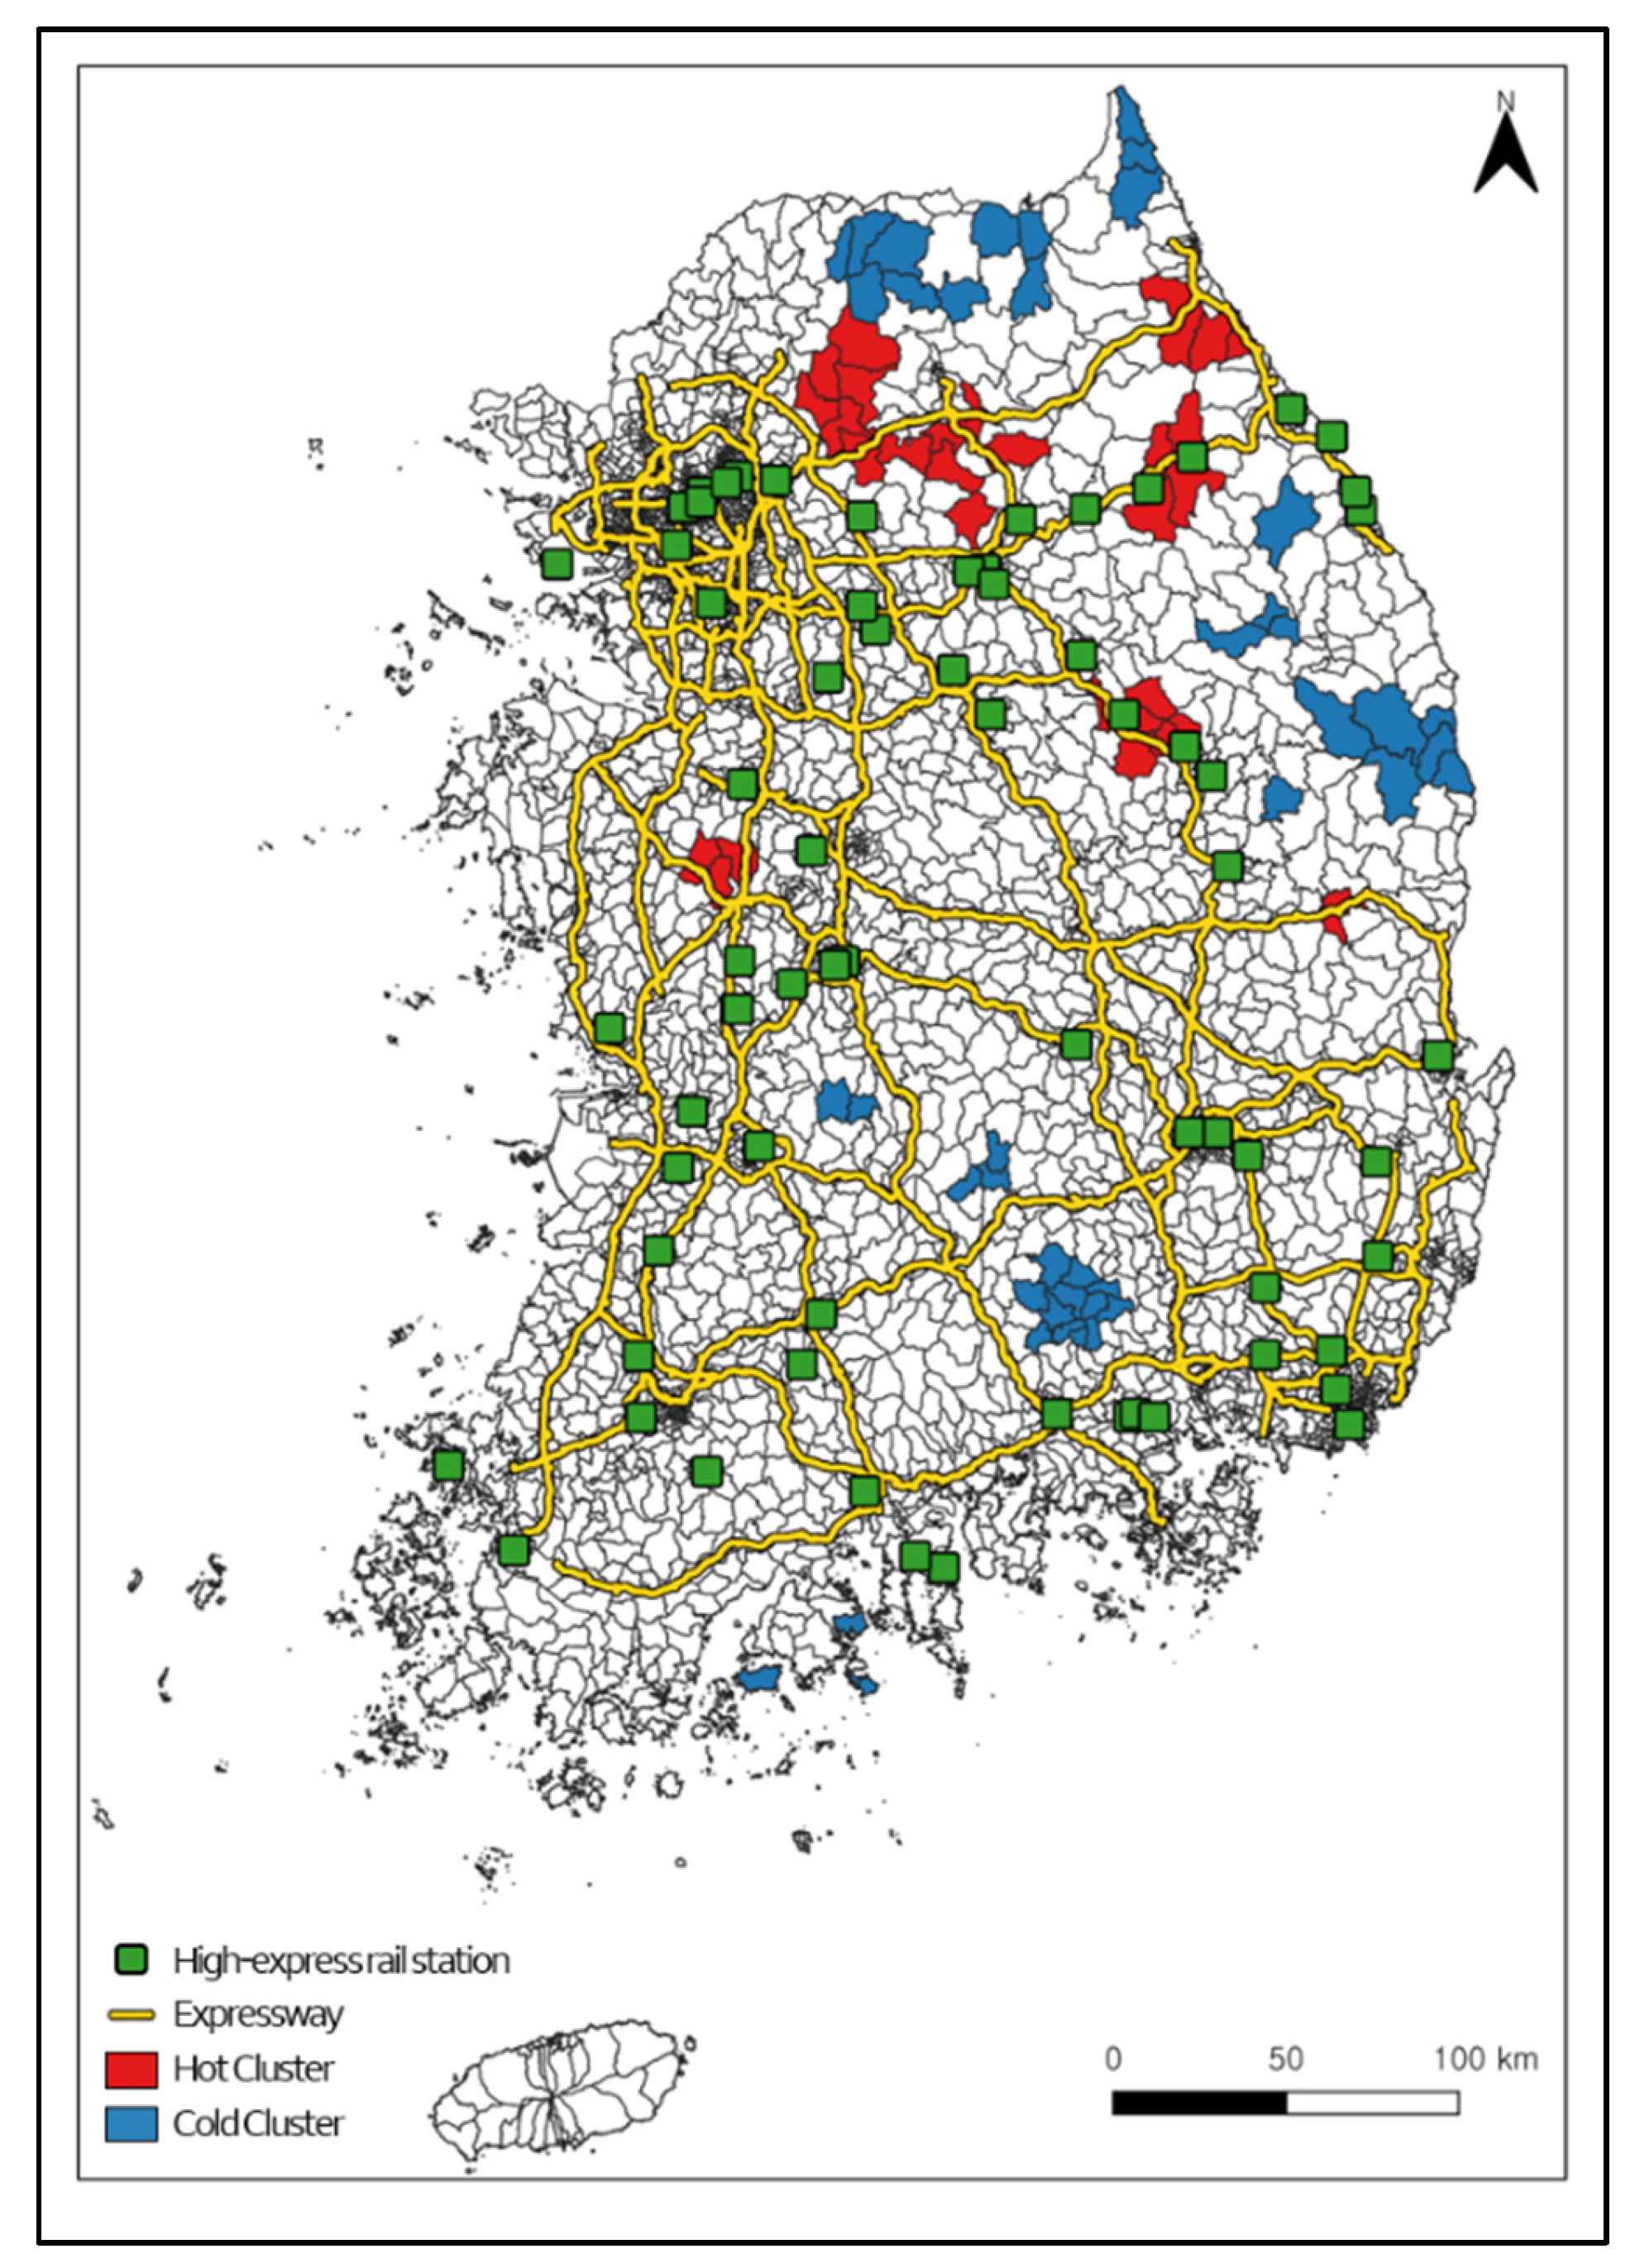
The spatial clustering results further support this interpretation. In the LISA analysis, HH clusters were formed in the border areas between Gyeonggi-do and Gangwon State, central Gangwon State and some northeastern areas, northeastern Chungcheongbuk-do, and central Chungcheongnam-do, whereas LL clusters appeared in northern Gangwon State, northern Gyeongsangbuk-do, western Gyeongsangnam-do, and southern Jeollanam-do. Figure 9 presents the spatial distribution of the workation suitability index together with major transportation infrastructure, showing that areas corresponding to HH clusters tended to be located relatively close to expressways and railway stations. In contrast, LL clusters were mainly located in areas with low accessibility to transportation infrastructure. This suggests that transportation accessibility is one of the key factors explaining workation suitability in Mountain Villages, and that the spatial clustering of the suitability index is closely related to the distribution of transportation infrastructure.
The potential–demand quadrant analysis provides additional policy implications for interpreting these spatial differences. The fact that most areas overlapping with HH clusters belonged to Q1 indicates that regions with spatially high suitability often also have an advantage in terms of actual external demand. In contrast, areas overlapping with LL clusters were mainly distributed in Q3 and Q4, suggesting that areas with low suitability often have limited demand or require improvements in their potential conditions. This implies that workation policies for Mountain Villages cannot be applied uniformly, but should be designed differentially according to regional potential and demand levels.
Specifically, areas classified as HH clusters or Q1 already have relatively favorable transportation infrastructure, digital work environments, and accommodation bases. Therefore, demand-stimulation strategies, such as promotion, branding, local program development, and the expansion of long-stay content, may be more effective than large-scale new infrastructure investment. However, even in these areas, policy effectiveness depends on local contextual conditions, including the presence of local operating bodies, residents’ acceptance of external users, community participation, and the capacity to connect workation programs with local resources.
In contrast, LL-cluster areas belonging to Q3 or Q4 require different policy sequencing. Q3 areas, which have relatively high demand but low suitability, can be interpreted as Condition Improvement Types. In these areas, targeted improvements in digital connectivity, accommodation quality, living convenience facilities, and local program capacity may help convert existing external demand into longer stays. Q4 areas, defined as Strategic Transition Types, should not be regarded simply as areas with low policy value. Rather, they represent areas where direct workation promotion may be premature and where basic living conditions, local service functions, community capacity, and alternative revitalization strategies should be prioritized before workation-oriented investment is introduced. In other words, workation policies for Mountain Villages need to move beyond a simple high-priority versus low-priority distinction and instead adopt a staged strategy that reflects regional potential, demand conditions, and local implementation capacity.
However, this study has several limitations. First, workation suitability was assessed using quantitative indicators derived from publicly available spatial data. Therefore, qualitative and subjective factors that may influence the actual attractiveness and feasibility of workation destinations could not be fully reflected. These include the quality of life, socio-cultural offerings, cost of stay, preferences of potential workation participants, residents’ self-perception of their local environment, social capital, community acceptance, and program operation capacity. Accordingly, the results of this study should be interpreted as a spatial screening framework for identifying candidate areas rather than as a comprehensive evaluation of actual workation destination attractiveness. Second, although non-resident card spending was used as a proxy variable for demand, it reflects general external visitation and consumption rather than direct workation demand, which requires caution in interpretation. Third, because this study assessed relative suitability at the Eup-Myeon-Dong level, additional field surveys, interviews with residents and local stakeholders, and site-level examinations are needed before actual project implementation.

5. Conclusions

This study quantitatively assessed workation suitability in Mountain Villages located within Depopulation Regions across the Republic of Korea and integrated spatial clustering characteristics with potential–demand types. The results showed that transportation accessibility-related indicators had high information content in differentiating suitability among Mountain Villages, suggesting that connectivity to wide-area transportation networks functions as an important enabling condition for workation suitability. The suitability index also exhibited statistically significant spatial clustering, which was closely associated with the distribution of transportation and digital infrastructure.
This study presents an analytical framework for comparing and evaluating workation suitability in Mountain Villages at the national scale, moving beyond previous studies that were primarily focused on specific case areas. In addition, by conducting analysis at the Eup-Myeon-Dong level, which is more detailed than the Si-Gun-Gu level, this study empirically identified spatial heterogeneity within Mountain Villages. By combining suitability and actual demand through a potential–demand typology, the study also provides a basis for setting policy priorities. These findings contribute to reinterpreting Mountain Villages not merely as vulnerable areas, but as strategic spaces for regional management and revitalization.
From a policy perspective, strategies for revitalizing workation in Mountain Villages need to be designed according to regional conditions. In areas with favorable suitability and demand conditions, demand stimulation, branding, program enhancement, and the development of long-stay content may be effective. In contrast, in areas with insufficient suitability conditions, improvements in fundamental conditions, such as transportation, digital infrastructure, accommodation, living services, and local implementation capacity, should be prioritized. In particular, Strategic Transition Type areas require careful policy sequencing, as direct workation promotion may be less effective without prior improvements in basic living conditions, local service functions, and community capacity. Therefore, workation policy should not be implemented as a uniform intervention across all Mountain Villages, but as a staged and place-based strategy that reflects regional potential, demand conditions, and local readiness.
Nevertheless, the findings should be interpreted as a spatial screening framework based on publicly available quantitative data, rather than as a comprehensive assessment of workation destination attractiveness. Future research should incorporate qualitative and behavioral factors, including user preferences, residents’ perceptions, social capital, socio-cultural resources, cost conditions, and local implementation capacity, through surveys, interviews, and site-level case studies.

Author Contributions

Conceptualization, S.K. and C.K.; Methodology, S.K. and C.K.; Software, S.K.; Validation, S.K. and C.C.; Formal analysis, C.K. and C.C.; Investigation, C.K. and C.C.; Resources, C.K.; Data curation, S.K. and C.C.; Writing—Original Draft, S.K.; Writing—Review and Editing, C.K. and C.C.; Visualization, S.K. All authors have read and agreed to the published version of the manuscript.

Funding

This research was funded by the National Institute of Forest Science, under grant number FM0500-2024-02-2026.

Data Availability Statement

The original contributions presented in the study are included in the article; further inquiries can be directed to the corresponding author.

Conflicts of Interest

The authors declare no conflicts of interest.

References

  1. United Nations, Department of Economic and Social Affairs, Population Division. World Urbanization Prospects 2025: Key Messages; United Nations: New York, NY, USA, 2025. [Google Scholar]
  2. OECD. Shrinking Smartly and Sustainably: Strategies for Action; OECD Publishing: Paris, France, 2025. [Google Scholar] [CrossRef]
  3. ESPON. Shrinking Rural Regions in Europe: Towards Smart and Innovative Approaches to Regional Development Challenges in Depopulating Rural Regions; ESPON EGTC: Luxembourg, 2017. [Google Scholar]
  4. Li, W.; Zhang, L.; Lee, I.; Gkartzios, M. Overview of social policies for town and village development in response to rural shrinkage in East Asia: The cases of Japan, South Korea and China. Sustainability 2023, 15, 10781. [Google Scholar] [CrossRef]
  5. Ministry of Finance and Economy. Available online: https://mofe.go.kr (accessed on 6 March 2026).
  6. Ministry of Data and Statistics. Available online: https://mods.go.kr (accessed on 6 March 2026).
  7. National Assembly Budget Office. Available online: https://www.nabo.go.kr (accessed on 2 March 2026).
  8. Korea Forest Service. Available online: https://www.forest.go.kr (accessed on 2 March 2026).
  9. Kang, B.H.; Kim, S.H.; Chae, J.H. Importance-performance analysis of mountain village promotion projects in the forest sector by upper-level local governments. J. People Plants Environ. 2021, 24, 707–718. [Google Scholar] [CrossRef]
  10. Niu, H.J.; Wu, E.T.; Yen, C.Y.; Chen, M.J.; Yu, C.C. From visitors to vitality: How relational populations support regional revitalization in aging urban and rural areas. Sustain. Futures 2025, 9, 100669. [Google Scholar] [CrossRef]
  11. Wang, W.; Cheng, Y.; Saito, Y. Can the relationship population contribute to sustainable rural development? A comparative study of out-migrated family support in depopulated areas of Japan. Sustainability 2025, 17, 2142. [Google Scholar] [CrossRef]
  12. Korea Tourism Organization. Analysis of Tourism Problems and Visitor Characteristics for Tourism Response in Population Declining Areas; Korea Tourism Organization: Wonju, Republic of Korea, 2023. [Google Scholar]
  13. Ministry of Culture, Sports and Tourism. Available online: https://www.mcst.go.kr (accessed on 9 March 2026).
  14. Jo, H.; Kim, Y. A study on the countermeasures for the extinction of local cities through workation: Focused on Jeollanam-do. J. Converg. Tour. Contents. 2022, 8, 75–90. [Google Scholar] [CrossRef]
  15. Lee, J.; Kim, N.J.; Hong, S. The impact of workation tourism experience in Gyeongbuk region on satisfaction, local revisit intention, and e-WOM. J. Daegu Gyeongbuk Stud. 2023, 22, 37–59. [Google Scholar] [CrossRef]
  16. Kim, Y.; Yang, B. A study on identifying workcation-potential areas in Gangwon Province using spatial statistics. J. Korean Soc. Surv. Geod. Photogramm. Cartogr. 2024, 42, 679–690. [Google Scholar] [CrossRef]
  17. Lee, T.G.; Lee, J. Comparative insights on workcation providers: Applying Japanese models to Korean islands. J. Mar. Isl. Cult. 2024, 13, 52–66. [Google Scholar] [CrossRef]
  18. Shin, H.; Lee, J.; Kim, N. Workcation travel experiences, satisfaction and revisit intentions: Focusing on conceptualization, scale development, and nomological network. J. Travel Res. 2024, 63, 1150–1168. [Google Scholar] [CrossRef]
  19. Masuda, H. Extinction of Rural Municipalities: Rapid Population Decline and Policy Implications in Japan; Chuokoron-Shinsha: Tokyo, Japan, 2014. [Google Scholar]
  20. Martinez-Fernandez, C.; Audirac, I.; Fol, S.; Cunningham-Sabot, E. Shrinking cities: Urban challenges of globalization. Int. J. Urban Reg. Res. 2012, 36, 213–225. [Google Scholar] [CrossRef] [PubMed]
  21. OECD. Shrinking smartly and sustainably in Korea: Spatial planning and housing policy. OECD Reg. Dev. Pap. 2025, 165, 1–41. [Google Scholar] [CrossRef]
  22. Nordregio. Available online: https://nordregio.org (accessed on 4 March 2026).
  23. Hidalgo-Arellano, I.; Fernández-Avilés, G. Spatial depopulation risk assessment through spatial principal component analysis and indicator kriging in Castilla-La Mancha (Spain). J. Rural Stud. 2025, 119, 103771. [Google Scholar] [CrossRef]
  24. Lee, S. Seven analysis of local extinction in Korea. Reg. Employ. Trends Brief. 2016, 3–17. Available online: https://www.keis.or.kr (accessed on 10 January 2026).
  25. Korea Research Institute for Local Administration. A Study on the Designation Criteria and Simulation of Population Declining Areas; Korea Research Institute for Local Administration: Wonju, Republic of Korea, 2017. [Google Scholar]
  26. Korea Research Institute for Local Administration. Model and Business Development by Population Decline Area Type; Korea Research Institute for Local Administration: Wonju, Republic of Korea, 2019. [Google Scholar]
  27. Wolff, M.; Haase, A.; Haase, D.; Kabisch, N. The impact of urban regrowth on the built environment. Urban Stud. 2017, 54, 2683–2700. [Google Scholar] [CrossRef]
  28. Sakamoto, K.; Iida, A.; Yokohari, M. Spatial patterns of population turnover in a Japanese Regional City for urban regeneration against population decline: Is Compact City policy effective? Cities 2018, 81, 230–241. [Google Scholar] [CrossRef]
  29. Chen, Y.; Silva, E.A.; Reis, J.P. Measuring policy debate in a regrowing city by sentiment analysis using online media data: A case study of Leipzig 2030. Reg. Sci. Policy Pract. 2021, 13, 675–693. [Google Scholar] [CrossRef]
  30. Gao, J.; Wu, B. Revitalizing traditional villages through rural tourism: A case study of Yuanjia Village, Shaanxi Province, China. Tour. Manag. 2017, 63, 223–233. [Google Scholar] [CrossRef]
  31. Gao, J. Cultural industry development from entrepreneurship under the background of rural revitalization strategy. Front. Psychol. 2022, 13, 959226. [Google Scholar] [CrossRef] [PubMed]
  32. Liu, Y.; Qiao, J.; Xiao, J.; Han, D.; Pan, T. Evaluation of the effectiveness of rural revitalization and an improvement path: A typical old revolutionary cultural area as an example. Int. J. Environ. Res. Public Health 2022, 19, 13494. [Google Scholar] [CrossRef] [PubMed]
  33. Zheng, Z.Q.; Chou, R.J. Rebuilding the resilience of mountainous rural communities by enhancing community capital through industrial transformation: A case study from rural Fujian, China. Habitat Int. 2024, 149, 103086. [Google Scholar] [CrossRef]
  34. Hu, Y.; Wang, Y.; Zhang, P. Anti-urbanization and rural development: Evidence from return migrants in China. J. Rural Stud. 2023, 103, 103102. [Google Scholar] [CrossRef]
  35. Lee, J.; Arnason, A.; Nightingale, A.; Shucksmith, M. Networking: Social capital and identities in European rural development. Sociol. Rural. 2005, 45, 269–283. [Google Scholar] [CrossRef]
  36. Gálvez-García, M.C.; Jaraíz-Arroyo, G.; Ruiz-Ballesteros, E. Homecoming tourism and community social capital. Ann. Tour. Res. 2025, 110, 103886. [Google Scholar] [CrossRef]
  37. Jaraíz-Arroyo, G.; Ruiz-Ballesteros, E.; Gálvez-García, M.C. Eco-Esteem and Depopulation: Broadening the Perspective on the Demographic Challenge in the Rural World. Rural Sociol. 2025, 90, 46–63. [Google Scholar] [CrossRef]
  38. Zwiers, S.; Markantoni, M.; Strijker, D. The role of change- and stability-oriented place attachment in rural community resilience: A case study in south-west Scotland. Community Dev. J. 2018, 53, 281–300. [Google Scholar] [CrossRef]
  39. Stylidis, D. Place attachment, perception of place and residents’ support for tourism development. Tour. Plan. Dev. 2018, 15, 188–210. [Google Scholar] [CrossRef]
  40. Tešin, A.; Pivac, T.; Lukić, T.; Blešić, I.; Kovačić, S.; Obradović, S. Quality of Life and Attachments to Rural Settlements: The Basis for Regeneration and Socio-Economic Sustainability. Land 2024, 13, 1364. [Google Scholar] [CrossRef]
  41. Ruiz-Ballesteros, E.; Gálvez-García, C.; Jaraíz-Arroyo, G. Community-based tourism and rural demographic decline: Reflections from Extremadura, Spain. Curr. Issues Tour. 2025, 28, 2329–2342. [Google Scholar] [CrossRef]
  42. Kang, H.M.; Choi, S.I.; Jeon, S.H.; Lee, C.K.; Kim, H. Revitalization plans for mountain ecological villages in South Korea. Environ. Dev. Sustain. 2021, 23, 17060–17076. [Google Scholar] [CrossRef]
  43. Pecsek, B. Working on holiday: The theory and practice of workcation. Balk. J. Emerg. Trends Soc. Sci. 2018, 1, 1–13. [Google Scholar] [CrossRef]
  44. Yoshida, T. How has workcation evolved in Japan? Ann. Bus. Adm. Sci. 2021, 20, 19–32. [Google Scholar] [CrossRef]
  45. Chevtaeva, E.; Denizci-Guillet, B. Digital nomads’ lifestyles and coworkation. J. Destin. Mark. Manag. 2021, 21, 100633. [Google Scholar] [CrossRef]
  46. Hölzel, M.; de Vries, W.T. Digitization as a driver for rural development—An indicative description of German coworking space users. Land 2021, 10, 326. [Google Scholar] [CrossRef]
  47. Merrell, I.; Füzi, A.; Russell, E.; Bosworth, G. How rural coworking hubs can facilitate well-being through the satisfaction of key psychological needs. Local Econ. 2021, 36, 606–626. [Google Scholar] [CrossRef]
  48. Rex, A.; Westlund, H. Coworking and local development outside metropolitan areas in Sweden. J. Rural Stud. 2024, 105, 103185. [Google Scholar] [CrossRef]
  49. Zhang, X.; Liang, H.; Yin, Z. Spaces of collaboration? Geography and functionality of coworking spaces in China. Appl. Geogr. 2025, 175, 103507. [Google Scholar] [CrossRef]
  50. Matsushita, K. Social problem-solving workation through collaboration between local regions and urban companies: The case of Kamaishi in Japan. Front. Sustain. Tour. 2024, 3, 1337097. [Google Scholar] [CrossRef]
  51. Park, M.; Kim, S. Tourism cooperatives and adaptive reuse: A comparative case study of circular economy practices in rural South Korea. Land 2025, 14, 2145. [Google Scholar] [CrossRef]
  52. Sánchez-Vergara, J.I.; Orel, M.; Ferreira-Gregorio, V. Revitalizing rural landscapes through coworking spaces: An exploration of narratives and discourses on place identity. In Collaborative Workspaces Beyond the Urban: Economy, Community and Regional Development; Springer Nature: Singapore, 2026; pp. 189–207. [Google Scholar] [CrossRef] [PubMed]
  53. Tateishi, E. The spatiotemporal socio-demography of the Tokyo capital region: A data-driven explorative approach. Rev. Reg. Res. 2023, 43, 467–519. [Google Scholar] [CrossRef]
  54. Republic of Korea. Framework Act on Forestry. Available online: https://elaw.klri.re.kr/kor_service/lawView.do?hseq=64166&lang=ENG (accessed on 9 March 2026).
  55. Diakoulaki, D.; Mavrotas, G.; Papayannakis, L. Determining objective weights in multiple criteria problems: The critic method. Comput. Oper. Res. 1995, 22, 763–770. [Google Scholar] [CrossRef]
  56. Republic of Korea. Special Act on Local Autonomy and Decentralization, and Balanced Growth. Available online: https://elaw.klri.re.kr/eng_service/lawView.do?hseq=67070&lang=ENG (accessed on 9 March 2026).
  57. Korean Statistical Information Service. Available online: https://kosis.kr (accessed on 19 January 2026).
  58. Korea Tourism Organization Data Lab. Available online: https://datalab.visitkorea.or.kr (accessed on 21 January 2026).
  59. Korea Transport Institute. Available online: https://www.koti.re.kr/index.do (accessed on 19 January 2026).
  60. Public Wi-Fi. Available online: https://www.wififree.kr (accessed on 19 January 2026).
  61. Open Data Portal. Available online: https://www.data.go.kr (accessed on 19 January 2026).
  62. View-T. Available online: https://viewt.ktdb.go.kr (accessed on 19 January 2026).
  63. HIRA Open Data Portal. Available online: http://opendata.hira.or.kr (accessed on 20 January 2026).
  64. Dijkstra, E.W. A note on two problems in connexion with graphs. Numer. Math. 1959, 1, 269–271. [Google Scholar] [CrossRef]
  65. O’Sullivan, D.; Unwin, D.J. Geographic Information Analysis, 2nd ed.; John Wiley & Sons: Hoboken, NJ, USA, 2010. [Google Scholar]
  66. Tobler, W.R. A computer movie simulating urban growth in the Detroit region. Econ. Geogr. 1970, 46, 234–240. [Google Scholar] [CrossRef] [PubMed]
  67. Moran, P.A.P. Notes on continuous stochastic phenomena. Biometrika 1950, 37, 17–23. [Google Scholar] [CrossRef]
  68. Anselin, L. Local indicators of spatial association—LISA. Geogr. Anal. 1995, 27, 93–115. [Google Scholar] [CrossRef]
  69. Talen, E.; Anselin, L. Assessing spatial equity: An evaluation of measures of accessibility to public playgrounds. Environ. Plan. A 1998, 30, 595–613. [Google Scholar] [CrossRef]
  70. Tsou, K.W.; Hung, Y.T.; Chang, Y.L. An accessibility-based integrated measure of relative spatial equity in urban public facilities. Cities 2005, 22, 424–435. [Google Scholar] [CrossRef]
  71. Day, J.; Lewis, B. Beyond univariate measurement of spatial autocorrelation: Disaggregated spillover effects for Indonesia. Ann. GIS 2013, 19, 169–185. [Google Scholar] [CrossRef]
  72. Yun, H.J. Spatial relationships of cultural amenities in rural tourism areas. Tour. Plan. Dev. 2014, 11, 452–462. [Google Scholar] [CrossRef]
  73. Van Holsbeeck, S.; Srivastava, S.K. Feasibility of locating biomass-to-bioenergy conversion facilities using spatial information technologies: A case study on forest biomass in Queensland, Australia. Biomass Bioenergy 2020, 139, 105620. [Google Scholar] [CrossRef]
  74. Herfort, B.; Lautenbach, S.; Porto de Albuquerque, J.; Anderson, J.; Zipf, A. A spatio-temporal analysis investigating completeness and inequalities of global urban building data in OpenStreetMap. Nat. Commun. 2023, 14, 3985. [Google Scholar] [CrossRef] [PubMed]
  75. Lee, K.S.; Eom, J.K. Spatiotemporal dynamics of visitors to Jeju Island: Hotspot and spatial autocorrelation analyses using mobile phone data. PLoS ONE 2025, 20, e0321694. [Google Scholar] [CrossRef] [PubMed]
  76. Pregi, L.; Novotný, L. Spatial autocorrelation methods in identifying migration patterns: Case study of Slovakia. Appl. Spat. Anal. Policy 2025, 18, 12. [Google Scholar] [CrossRef]
  77. Yu, J.; Yi, L.; Xie, B.; Li, X.; Li, J.; Xiao, J.; Zhang, L. Matching and coupling coordination between the supply and demand for ecosystem services in Hunan Province, China. Ecol. Indic. 2023, 157, 111303. [Google Scholar] [CrossRef]
  78. Deng, Y.; Liu, J.; Luo, A.; Wang, Y.; Xu, S.; Ren, F.; Su, F. Spatial mismatch between the supply and demand of urban leisure services with multisource open data. ISPRS Int. J. Geo-Inf. 2020, 9, 466. [Google Scholar] [CrossRef]
  79. Luo, C.; Li, X. Assessment of ecosystem service supply, demand, and balance of urban green spaces in a typical mountainous city: A case study on Chongqing, China. Int. J. Environ. Res. Public Health 2021, 18, 11002. [Google Scholar] [CrossRef] [PubMed]
  80. Zhou, L.; Buhalis, D.; Fan, D.X.; Ladkin, A.; Lian, X. Attracting Digital Nomads: Smart Destination Strategies, Innovation and Competitiveness. J. Destin. Mark. Manag. 2024, 31, 100850. [Google Scholar] [CrossRef]
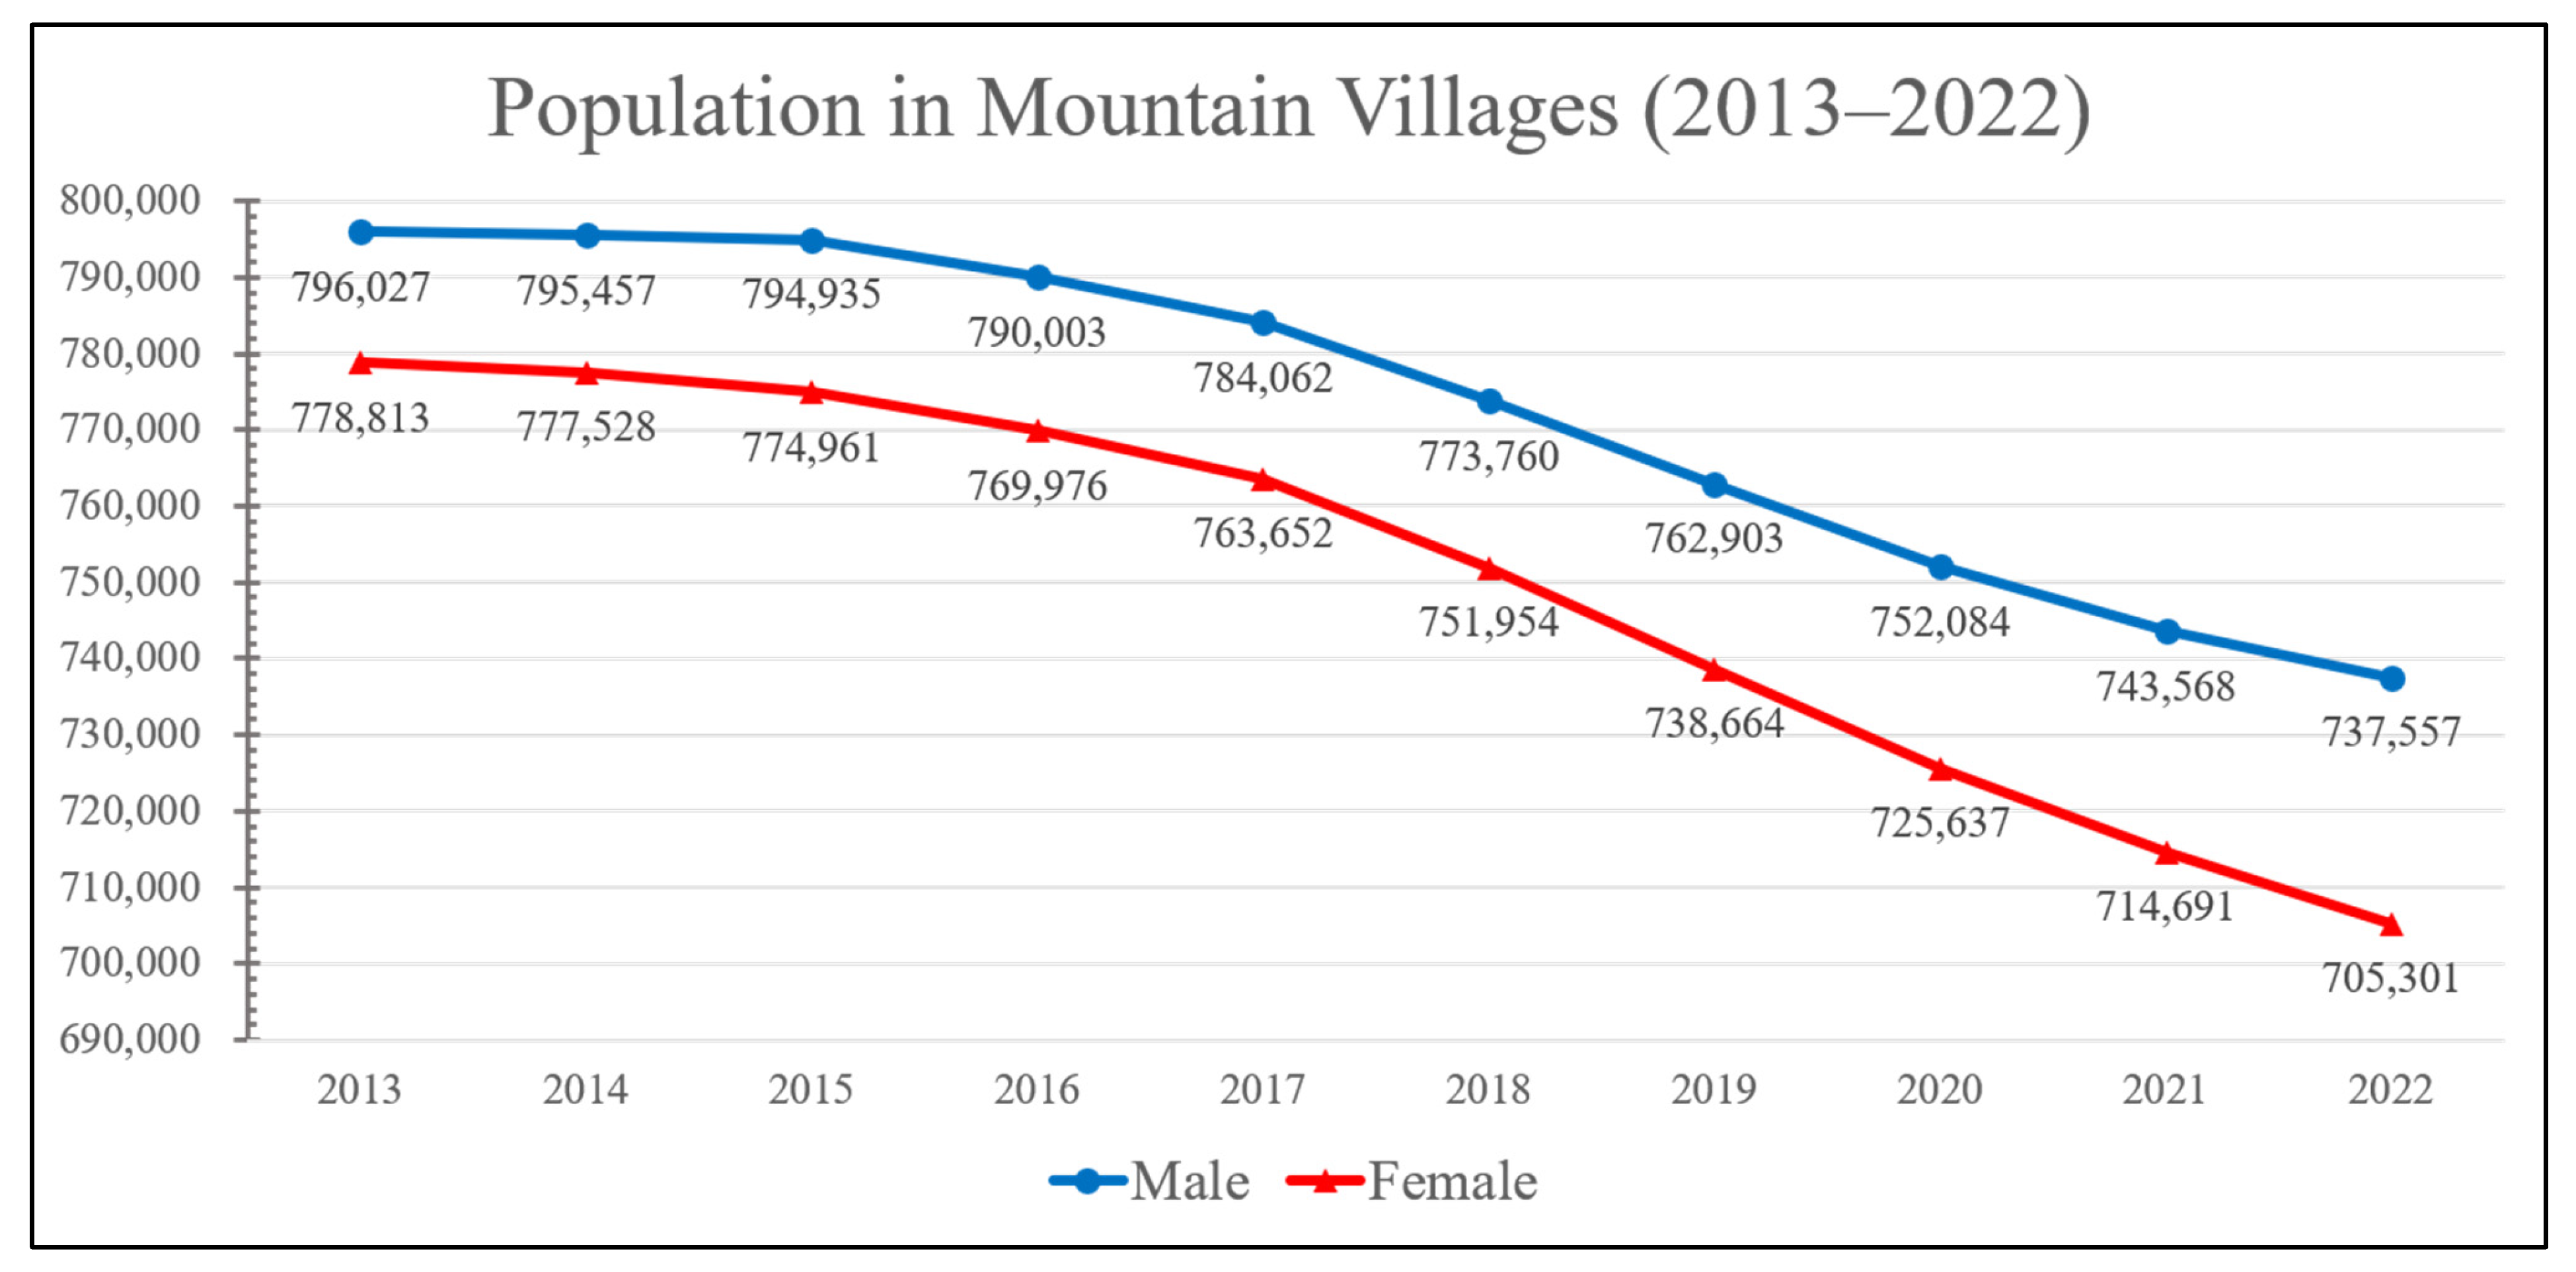
Figure 1. Population in Mountain Villages.
Land 15 01154 g001
Figure 2. Workflow of this research.
Land 15 01154 g002
Figure 3. Study area: (a) Depopulation Region; (b) Mountain Village; (c) Depopulation Mountain Village.
Land 15 01154 g003
Figure 4. Diagram of Local Moran’s I.
Land 15 01154 g004
Figure 5. Workation suitability index: (a) linear scaled workation suitability index; (b) ranking of workation suitability.
Land 15 01154 g005
Figure 6. Spatial distribution of the workation suitability index.
Land 15 01154 g006
Figure 7. Quadrant analysis results: (a) Quadrant map; (b) Quadrant scatter plot; (c) Count and mean for each quadrant. Note: D and P indicate demand and potential, respectively; ↑ and ↓ indicate high and low values, respectively.
Land 15 01154 g007
Figure 8. Overlay of LISA cluster and quadrant analysis: (a) LISA overlay results; (b) quadrant overlay results.
Land 15 01154 g008
Figure 9. Spatial distribution of the workation suitability index and major transportation infrastructure.
Land 15 01154 g009
Table 1. Datasets used in this study.
CategoryReferenceVariableDescriptionSource
Demand and Inflow[10,11,12]PopulationResident Population (2025)[57]
VisitorNumber of out-of-town visitors (2025)[58]
Traffic FlowNationwide passenger
Origin–Destination travel volume (2025)
[59]
Visitor SpendingRegional Tourism Spending
by Non-residents (2025)
[58]
Accessibility and
Digital Infrastructure
[17,18,45,46,47,48,49]Public Wi-FiPublic Wi-Fi Location Database (2026)[60]
Bus StopLocation data of
Bus Stop Nationwide (2025)
[61]
Rail StationKorea Railroad Corporation
Station Location Information (2025)
[61]
Expressway ICExpressway Interchange
Location Information (2025)
[61]
Road NetworkNational Standard Node-Link (2025)[61]
Road SpeedAverage traffic speed by road type (2023)[62]
Stay and
Living Convenience
[17,50,51,52]Cafe/SnackCafe/Snack Location data (2025)[61]
General RestaurantGeneral Restaurant Location data (2025)[61]
HospitalHospital Location data (2025)[63]
PharmacyPharmacy Location data (2025)[63]
LodgingLodging Location data (2025)[61]
Rural LodgingRural Lodging Location data (2025)[61]
Table 2. Average speed by road type.
Road GradeRoad TypeAverage Speed (km/h)Source
101National Expressways92[62]
102Urban Expressways53
103General National Highways48
104Metropolitan City Roads25
105State-funded Local Highways53
106Local Highway52
107Road of a Si-Gun-Gu34
108Ramp, Link Road, etc.51
Table 3. Types of workation quadrants.
CategoryCriteriaType
Q1Potential↑ Demand↑Immediate Promotion Type
Q2Potential↑ Demand↓Promising Potential Type
Q3Potential↓ Demand↑Condition Improvement Type
Q4Potential↓ Demand↓Strategic Transition Type
Note: ↑ and ↓ indicate high and low values, respectively.
Table 4. Weights of variables derived from the CRITIC method.
CriteriaWeightStandard DeviationConflict
ICTT 10.1610.21811.676
STATT0.1320.16812.436
Bus Stop0.0930.1579.389
Public Wi-Fi0.0790.1508.269
Traffic Flow0.0760.11010.904
Rural Lodging0.0750.1428.319
Visitor0.0620.1436.912
Hospital0.0580.1436.442
Lodging0.0580.1187.748
Pharmacy0.0540.1525.628
Cafe/Snack0.0530.1445.722
General Restaurant0.0520.1445.722
Population0.0450.1195.937
1 TT means Travel Time.
Table 5. Top and bottom 10 regions of the workation suitability index.
RankSi-DoSi-Gun-GuEup-Myeon-DongIndexScaled Index
1Gyeonggi-doGapyeong-gunGapyeong-eup0.708100
2Gangwon StateYeongwol-gunYeongwol-eup0.60885.439
3Gyeonggi-doGapyeong-gunCheongpyeong-myeon0.60584.979
4Gyeonggi-doGapyeong-gunSeorak-myeon0.58181.464
5Gyeongsangbuk-doCheongdo-gunCheongdo-eup0.56779.657
6Chungcheongbuk-doDanyang-gunDanyang-eup0.52573.196
7Gangwon StateHongcheon-gunSeo-myeon0.52172.668
8Jeonbuk StateJinan-gunJinan-eup0.50069.648
9Gyeongsangbuk-doYeongju-siPunggi-eup0.48667.527
10Gyeongsangbuk-doMungyeong-siMungyeong-eup0.48667.525
334Jeollanam-doGoheung-gunGeumsan-myeon0.16921.203
335Gangwon StateJeongseon-gunHwaam-myeon0.16420.456
336Gangwon StateGoseong-gunHyeonnae-myeon0.16019.880
337Gyeongsangbuk-doBonghwa-gunSeokpo-myeon0.15719.540
338Jeollanam-doGoheung-gunBongnae-myeon0.13816.649
339Gangwon StateYanggu-gunGuktojeongjungang-myeon0.13516.325
340Gangwon StateCheorwon-gunGeunnam-myeon0.12514.830
341Gangwon StateYeongwol-gunSangdong-eup0.12114.146
342Gangwon StateYanggu-gunDong-myeon0.0625.563
343Gangwon StateYanggu-gunBangsan-myeon0.0240
Table 6. Analysis results of Moran’s I for workation suitability.
CategoryMoran’s Iz-Scorep-Value
Value0.34611.6250.001
Table 7. Results of LISA.
CategoryRegions (Si-Gun-Gu)
HHGapyeong-gun·Hongcheon-gun; Yangyang-gun·Pyeongchang-gun;
Gongju-si·Danyang-gun
LLYanggu-gun·Hwacheon-gun·Cheorwon-gun; Jeongseon-gun·Yeongwol-gun;
Uljin-gun·Yeongyang-gun·Bonghwa-gun; Geochang-gun;
Hapcheon-gun·Uiryeong-gun; Jinan-gun; Andong-si
Disclaimer/Publisher’s Note: The statements, opinions and data contained in all publications are solely those of the individual author(s) and contributor(s) and not of MDPI and/or the editor(s). MDPI and/or the editor(s) disclaim responsibility for any injury to people or property resulting from any ideas, methods, instructions or products referred to in the content.