Article

Transitions of Urban–Rural Integration in the Yellow River Basin: Spatiotemporal Heterogeneity and Driving Mechanisms

1
College of Geography and Environment, Shandong Normal University, Jinan 250358, China
2
Public Management Teaching and Research Department, Party School of the CPC Shandong Provincial Committee (Shandong Academy of Governance), Jinan 250100, China
3
Key Research Institute of Yellow River Civilization and Sustainable Development & Yellow River Civilization by Provincial and Ministerial Co-Construction of Collaborative Innovation Center, Henan University, Kaifeng 475001, China
*
Author to whom correspondence should be addressed.
Land 2026, 15(7), 1136; https://doi.org/10.3390/land15071136
Submission received: 26 May 2026 / Revised: 19 June 2026 / Accepted: 23 June 2026 / Published: 25 June 2026

Abstract

Urban–rural integration (URI) represents a pivotal pathway to realizing sustainable development within urban–rural spatial systems. It is of paramount importance in addressing the challenge of reconciling ecological conservation with high-quality development in the Yellow River Basin. Leveraging panel data from 78 cities in the Yellow River Basin spanning the years 2006–2023, this research constructs an evaluation index system that encompasses five dimensions: population, economy, society, ecology, and space. Through the comprehensive application of kernel density estimation, exploratory spatiotemporal data analysis, and panel quantile regression models, a systematic analysis of the spatiotemporal evolution patterns and transition mechanisms of URI is conducted. The results disclose that URI in the Yellow River Basin demonstrates a trend of “overall enhancement with regional disparities”. From 2006 to 2023, the URI of the basin witnessed an average annual growth rate of 2.86%. Spatially, it presented distinct features: high-level agglomeration in the lower reaches, accelerating-growth path dependency accompanied by internal divergence in the middle reaches, and balanced yet low-level development in the upper reaches. The local spatial evolution of URI follows a pattern characterized as “predominant stability and limited transitions”. In detail, high-level regions sustain their advantages, low-level regions encounter obstacles in achieving breakthroughs, and the spillover effects between adjacent regions remain relatively restricted. The driving mechanisms exhibit significant “phase-spatial” dual heterogeneity, with four distinct patterns identified. In light of these findings, policy recommendations are put forward, including the establishment of a multi-scale, coordinated spatial governance system.

1. Introduction

Urban–rural integration (URI) stands as a crucial pathway for attaining the sustainable development of urban–rural territorial systems. These dynamic, open, and multi-tiered composite systems seamlessly integrate human economic and social activities with the natural ecological environment within specific geographical spaces. The stable operation of such systems hinges upon the bidirectional circulation and interactive linkage of material, energy, information, and value flows [1,2]. This system not only encompasses the structural frameworks within urban and rural subsystems, including industrial structure, population distribution, ecological foundations, and public service provision, but also places emphasis on the factor allocation and functional coupling between these two subsystems [3].
As a core issue in a nation’s modernization process, the evolving dynamics of urban–rural relations exert a profound influence on the sustainable development of urban–rural regional systems [4]. In China, the development pattern of urban–rural relationships has experienced multi-stage iterative evolution. Starting from a traditional dichotomy marked by isolation, it progressed through coordinated development aimed at narrowing fundamental urban–rural gaps, and has now entered a new stage of integrated urban–rural development that emphasizes comprehensive, symbiotic collaboration across the entire territory. This evolutionary trajectory closely aligns with the core principles of United Nations Sustainable Development Goal 10 (SDG 10), which focuses on bridging urban–rural gaps in infrastructure, education, healthcare, and rights [5,6,7].
The concept of URI can be traced back to the 16th century. Thomas More, the founder of utopian socialism, proposed the idea of URI [8]. Since then, research on URI has continued to develop. In terms of the evaluation of urban–rural integrated development, existing studies mainly present two paradigms. One is the qualitative research path. Through methods such as theoretical deduction, field research, and structured interviews, it deeply analyzes the micro-mechanisms in urban–rural relations and the evolution process of relevant policies [9,10]. The other is the quantitative measurement path, mainly adopting two evaluation methods: single indicators and comprehensive indicators. In the evaluation of single indicators, the academic community generally uses indicators such as the income gap between urban and rural residents, the consumption gap, the Engel coefficient, and the Gini coefficient to represent the degree of inequality in urban and rural living standards [11,12,13,14]. Given that the urban–rural regional system has significant multi-dimensional and hierarchical characteristics, the comprehensive indicator evaluation has increasingly gained attention from the academic community due to its comprehensiveness and systematic advantages.
Through a systematic review of the existing literature, the measurement of integrated urban–rural development can generally be classified into three major types. The first type conceptualizes the urban–rural geographical system as an integrated whole and primarily employs urban–rural ratio-based indicators, such as the urban–rural income ratio, to assess the degree of balance and interconnectedness in urban–rural development [15,16]. This approach emphasizes the reduction in urban–rural disparities and reflects the overall integration status of the urban–rural system. The second type constructs separate evaluation frameworks for urban and rural development and subsequently applies quantitative approaches, such as coupling coordination models, to assess the degree of coordinated development between the two subsystems. This approach effectively captures the developmental differences between urban and rural areas at different stages while revealing their synergistic evolution processes. Its key advantage lies in simultaneously highlighting the relative independence of urban and rural subsystems and their interactive relationships [17,18]. The third type integrates the strengths of the previous two approaches by establishing a comprehensive evaluation framework that combines the assessment of urban–rural disparities with the measurement of urban and rural development levels. By incorporating both comparative and developmental dimensions, this approach not only reflects the quality and level of development in urban and rural areas but also captures the underlying mechanisms of factor flows, functional complementarity, and coordinated interactions between urban and rural systems [19,20]. Consequently, it provides a more holistic and accurate representation of the multidimensional nature and dynamic evolution of integrated urban–rural development.
From a systems theory perspective, integrated urban–rural development is the outcome of synergistic interactions among multiple factors. Economic factors, including the level of economic development [15], degree of urbanization [21], and resource allocation efficiency [22], along with institutional and physical factors such as political institutional arrangements and infrastructure completeness [23,24], shape the evolutionary path and quality of URI. Research shows that urban–rural industrial interaction effectively promotes coordinated industrial development and optimizes the industrial structure at the county level, thereby enhancing the quality and efficiency of the rural economy and driving integrated urban–rural development. Scholars are increasingly utilizing advanced quantitative analytical methods, such as quantile regression [25], geodetector [26], obstacle degree model [27,28], and machine learning [29], to empirically test key influencing factors.
Despite the growing body of literature on URI, important limitations persist. Existing research has mainly concentrated on evaluating the level and spatial disparities of URI from a static perspective, whereas the dynamic evolution of its spatial configuration has received comparatively less attention. In particular, the evolutionary characteristics of local spatial associations, transition dynamics, and spatial path dependence remain insufficiently explored, limiting a comprehensive understanding of the processes underlying spatial restructuring in URI. Furthermore, current studies on driving mechanisms are predominantly grounded in mean-effect frameworks, which focus on the average influence of explanatory variables. Given the pronounced regional heterogeneity in development conditions, factor endowments, and institutional contexts, the effects of external drivers are likely to vary across different levels of URI and exhibit nonlinear response patterns.
In addition, as an important birthplace of Chinese civilization and a crucial ecological barrier in China, the Yellow River Basin has profound historical and cultural heritage and unique geographical advantages [30]. This basin not only carries the long-standing tradition of farming civilization but also has a well-developed modern animal husbandry foundation, and it is an important agricultural and animal husbandry production base in China. In the process of regional development, the Yellow River Basin faces multiple structural contradictions: there is a significant difference in the economic development level between the eastern and western regions, the pressure on the ecological environment continues to increase, and the urban–rural dual-structure problem is prominent [31]. At the same time, the Yellow River Basin is confronted with the dual imperative of ecological conservation and high-quality development. As a key pathway toward coordinated regional development, URI not only reflects the degree of synergy between urban and rural systems but also plays a crucial role in achieving ecological sustainability and common prosperity. Therefore, a systematic investigation of the spatiotemporal evolution and driving mechanisms of URI in the Yellow River Basin is of considerable theoretical and practical significance.
Against this background, drawing upon the theoretical framework of the urban–rural geographical system, this study examines the evolutionary dynamics and formation mechanisms of URI in the Yellow River Basin. Specifically, it seeks to address three key research questions. First, what are the spatiotemporal evolution characteristics of URI in the Yellow River Basin during the period 2006–2023, and how have its regional disparities and spatial agglomeration patterns changed over time? Second, have the local spatial associations of URI undergone dynamic adjustments? In particular, have spatial relationship types experienced transitions, and does the evolutionary process exhibit characteristics of spatial lock-in and path dependence? Third, which factors significantly influence URI, and do the driving mechanisms vary across different stages of development?
To answer these questions, this study develops a comprehensive evaluation framework for URI based on urban–rural geographical system theory. Kernel density estimation is employed to reveal the dynamic distribution and evolutionary trends of URI levels. Furthermore, exploratory spatiotemporal data analysis is used to investigate the evolution of local spatial associations, spatial transitions, and path dependence from a spatial perspective. Finally, panel quantile regression models are applied to identify the key determinants of URI and to examine the heterogeneous effects of these driving factors across different development stages.
By integrating analyses of spatiotemporal evolution, spatial dynamics, and heterogeneous driving mechanisms, this study aims to enrich the theoretical understanding of the dynamic evolution of urban–rural geographical systems. It also provides scientific evidence for formulating differentiated URI strategies, promoting coordinated regional development, and advancing the realization of common prosperity in the Yellow River Basin.
The subsequent sections of this paper are structured as follows: Section 2 offers a detailed overview of the research methods and data sources; Section 3 systematically depicts the spatiotemporal evolution of URI in the Yellow River Basin from 2006 to 2023; Section 4 explores the mechanisms driving the transformation of URI in the basin; and Section 5 summarizes the research findings and presents targeted policy recommendations based on these findings.

2. Research Methods and Data Sources

2.1. Research Methods

2.1.1. Development of an Indicator System for the Level of URI

URI represents the advanced stage of the evolution of urban–rural spatial systems from an unbalanced to a balanced state. It is the core pathway to break the urban–rural dichotomy and achieve coordinated regional development. The goal is to promote a multidimensional and equitable restructuring of urban–rural spatial systems, characterized by functional complementarity, structural balance, and symbiotic development, through the two-way flow and optimal allocation of urban and rural elements like population, economy, society, space, and ecology. Considering comprehensiveness, scientific rigor, and data availability, the level of URI in the study area is measured in five dimensions [6,19,32,33,34,35]: population, economy, society, ecology, and space (Table 1).
Specifically, urban–rural population integration represents the demographic dimension of the urban–rural regional system and serves as a key driver of population factor restructuring. It promotes the free mobility and efficient allocation of population resources by reducing barriers to migration and employment, thereby facilitating a dynamic alignment between population distribution and socioeconomic development. This process is reflected in the orderly migration of rural populations to urban areas, increasing urbanization levels, the growing share of non-agricultural employment, and the gradual convergence of urban–rural employment structures. These changes contribute to narrowing disparities in employment opportunities, income levels, and development capacities between urban and rural residents [36]. Accordingly, the urbanization rate and employment structure indicators are employed to measure this dimension. The urbanization rate captures population agglomeration and urbanization development, whereas employment structure indicators reflect labor allocation and structural transformation across urban and rural areas.
Urban–rural economic integration reflects the coordinated development of urban and rural economies through the efficient circulation of capital, technology, labor, and land resources [37]. By promoting industrial linkages, technological spillovers, and factor mobility, it facilitates complementary development and strengthens economic interactions between urban and rural areas [38]. Cities generate growth spillovers through industrial agglomeration, technological innovation, and market expansion, while rural areas utilize resource endowments and ecological advantages to integrate into regional value chains. As a result, urban–rural economic integration is manifested in narrowing development disparities, industrial upgrading, and increasing economic interdependence. GDP per capita and industrial output value ratios are selected to measure this dimension. GDP per capita reflects regional economic development and growth capacity, whereas industrial output indicators capture industrial restructuring and the degree of economic integration.
Urban–rural social integration represents the coordinated development of social welfare and public service systems across urban and rural areas. Its primary objective is to reduce social disparities through the equalization of public services, the integration of social security systems, and the equitable sharing of development outcomes. As urban–rural interactions intensify, disparities in healthcare, education, social security coverage, and public participation gradually diminish, enhancing social equity, inclusiveness, and residents’ well-being [39,40]. To measure this dimension, indicators including the number of physicians per 10,000 population, the number of teachers per 10,000 population, and the coverage rates of medical and pension insurance are employed. These indicators reflect the accessibility of public services, educational and healthcare resources, and the level of social welfare provision.
Urban–rural spatial integration provides the physical foundation for factor mobility and functional interaction between urban and rural areas [41]. Through coordinated spatial planning, infrastructure development, and enhanced connectivity, it promotes the efficient circulation and allocation of population, capital, technology, and information [42]. By optimizing transportation networks, land-use patterns, and digital infrastructure, spatial integration strengthens functional complementarity, reduces mobility costs, and improves resource allocation efficiency. Road area per capita, highway network density, and the number of mobile phone subscribers are selected to measure this dimension. These indicators capture transportation accessibility, spatial connectivity, and digital infrastructure development, thereby reflecting the spatial conditions that support URI.
Urban–rural ecological integration constitutes the ecological foundation of coordinated urban–rural development. It emphasizes ecological resource sharing, collaborative environmental governance, and the enhancement of ecosystem services to achieve a balance between ecological conservation, resource utilization, and socioeconomic development [43,44]. Through integrated environmental management and ecological protection, it promotes green, low-carbon, and resource-efficient development. This dimension is measured using the proportion of green coverage area in urban built-up areas, electricity consumption per unit of GDP, and industrial SO2 emissions. These indicators capture ecosystem quality, resource-use efficiency, environmental pressure, and pollution control performance, providing a comprehensive assessment of ecological sustainability within the URI process.
Indicator weights are calculated using the entropy-weighting method, and the level of URI is obtained through linear weighting.

2.1.2. Kernel Density Estimation

Using kernel density estimation, this study analyzes the absolute disparities in urban–rural integration across the Yellow River Basin and the temporal dynamics of its polarization trends. Kernel density estimation is a nonparametric statistical analysis method that estimates the distribution characteristics of a random variable by constructing a smoothed probability density curve. It uses smoothing techniques to fit known data points, simulating a probability distribution curve that intuitively illustrates the distribution shape of the random variable and its characteristics over time [45]. The formula is as follows:
f x = 1 n h ∑ i = 1 n K X i − x h
In the equation: K X i − x h represents the kernel density function, and a Gaussian kernel density function is used for the analysis; n denotes the number of cities under study; h is the bandwidth used to determine the smoothness of the function.

2.1.3. Exploratory Data Analysis

Use exploratory data analysis to investigate whether there is a distinct spatial clustering in the level of integrated urban–rural development in the Yellow River Basin, and to identify which regions have formed clusters with high and low levels of integrated urban–rural development. Spatial autocorrelation analysis examines whether there is a correlation between the spatial distribution of a particular attribute in a given area and its neighboring areas, as well as the degree of that correlation. It is primarily divided into two categories: global spatial autocorrelation (Global Moran’s I) and local spatial autocorrelation (Local Moran’s I) [46].
Global spatial autocorrelation assesses, from a holistic perspective, whether there is significant spatial correlation in URI values across the entire Yellow River Basin; local spatial autocorrelation is used to reveal local spatial clustering patterns, identify areas with high or low concentrations, and precisely locate regions where urban and rural areas are integrated.

2.1.4. Exploratory Spatio-Temporal Data Analysis

Using spatial association (LISA) time paths, this study investigates the dynamic evolution of spatial associations between URI levels in cities and prefectures of the Yellow River Basin and those of their neighboring regions. Specifically, it examines whether these local spatial relationships remained stable throughout the study period, the magnitude of their temporal changes, and the degree to which the evolutionary trajectories exhibited path dependence or tortuous fluctuations.
The Local indicators of LISA time path is a continuous representation of the spatial displacement of a URI within a Moran’s I scatter plot. It reflects the geometric characteristics of the LISA time path through relative length, curvature, and direction of movement. Relative length and curvature explain the dynamics and variability of local spatial structure, respectively [47]. The calculation formulas are as follows:
d i = N ∑ t = 1 T − 1 d ( L i , t , L i , t + 1 ) ∑ i = 1 N ∑ t = 1 T − 1 d ( L i , t , L i , t + 1 )
f i = ∑ t = 1 T − 1 d ( L i , t , L i , t + 1 ) d ( L i , t , L i , T )
In the equation, d i represents the relative length; f i represents the curvature; N represents the number of cities; T represents the time interval; L i , t is the position coordinate of city i in the Moran scatter plot in year t ; d ( L i , t , L i , t + 1 ) is the distance city i moves from year t to year t + 1 ; d ( L i , t , L i , T ) is the distance city i moves from the first year (2006) to the last year (2023).
The LISA spatio-temporal transition method constitutes a continuous representation of a Markov chain that effectively characterizes the geometric evolution of spatial units within a Moran’s I scatter plot over specified temporal intervals. This study employs the LISA spatio-temporal transition method to elucidate the dynamic variations in local spatial relationships among cities in the Yellow River Basin and their corresponding neighboring units URI. Through this analytical framework, sixteen distinct transition patterns were identified and systematically classified into four fundamental categories (Table 2).

2.1.5. Panel Quantile Regression

Compared with conventional mean regression models, panel quantile regression can capture the heterogeneous effects of explanatory variables across different conditional distributions of URI development. It is less sensitive to outliers and heteroscedasticity, thereby providing more robust parameter estimates. Furthermore, by integrating quantile regression with spatiotemporal transition analysis, this approach enables the identification of differentiated driving mechanisms underlying various transition types and spatial lock-in effects.
Panel quantile regression is a method for estimating the linear relationship between explanatory and dependent variables at different quantiles. Compared with standard regression models, it offers greater robustness and is less susceptible to the influence of outliers; furthermore, it can be deeply nested with various types of spatiotemporal transitions, effectively explaining the transitional changes in geographical phenomena [25]. The panel quantile regression model is constructed as follows:
Q Y i t τ X i t = α i + φ ( τ ) X i t
In the equation: α is a constant term; Q Y i t τ X i t denotes the τ -conditional quantile of the dependent variable Y given the independent variable X ; φ ( τ ) denotes the quantile regression coefficient, which can be obtained by solving the following objective function:
τ = min ( α , β ) ∑ k = 1 q ∑ j = 1 n ∑ i = 1 m ω k ρ τ k Y i t − α i − φ ( τ ) X i t
In the equation, ω k represents the weight corresponding to each quantile; in this paper, the 10th, 25th, 50th, 75th and 90th quantiles are selected in turn for model regression.

2.2. Data Sources

This study uses panel data from 78 cities in the Yellow River Basin covering the period from 2006 to 2023 as the research sample. The data sources primarily include the China Urban Statistical Yearbook, the China Urban Construction Statistical Yearbook, statistical yearbooks of various provinces, municipalities, and autonomous regions, and statistical bulletins on national economic and social development issued by each city. A small amount of missing data in certain years was scientifically estimated and imputed using linear interpolation. Nighttime light data were derived by integrating and calibrating DMSP-OLS and SNPP-VIIRS data.

3. Spatio-Temporal Evolution of URI in the Yellow River Basin

3.1. Temporal Evolution of URI in the Yellow River Basin

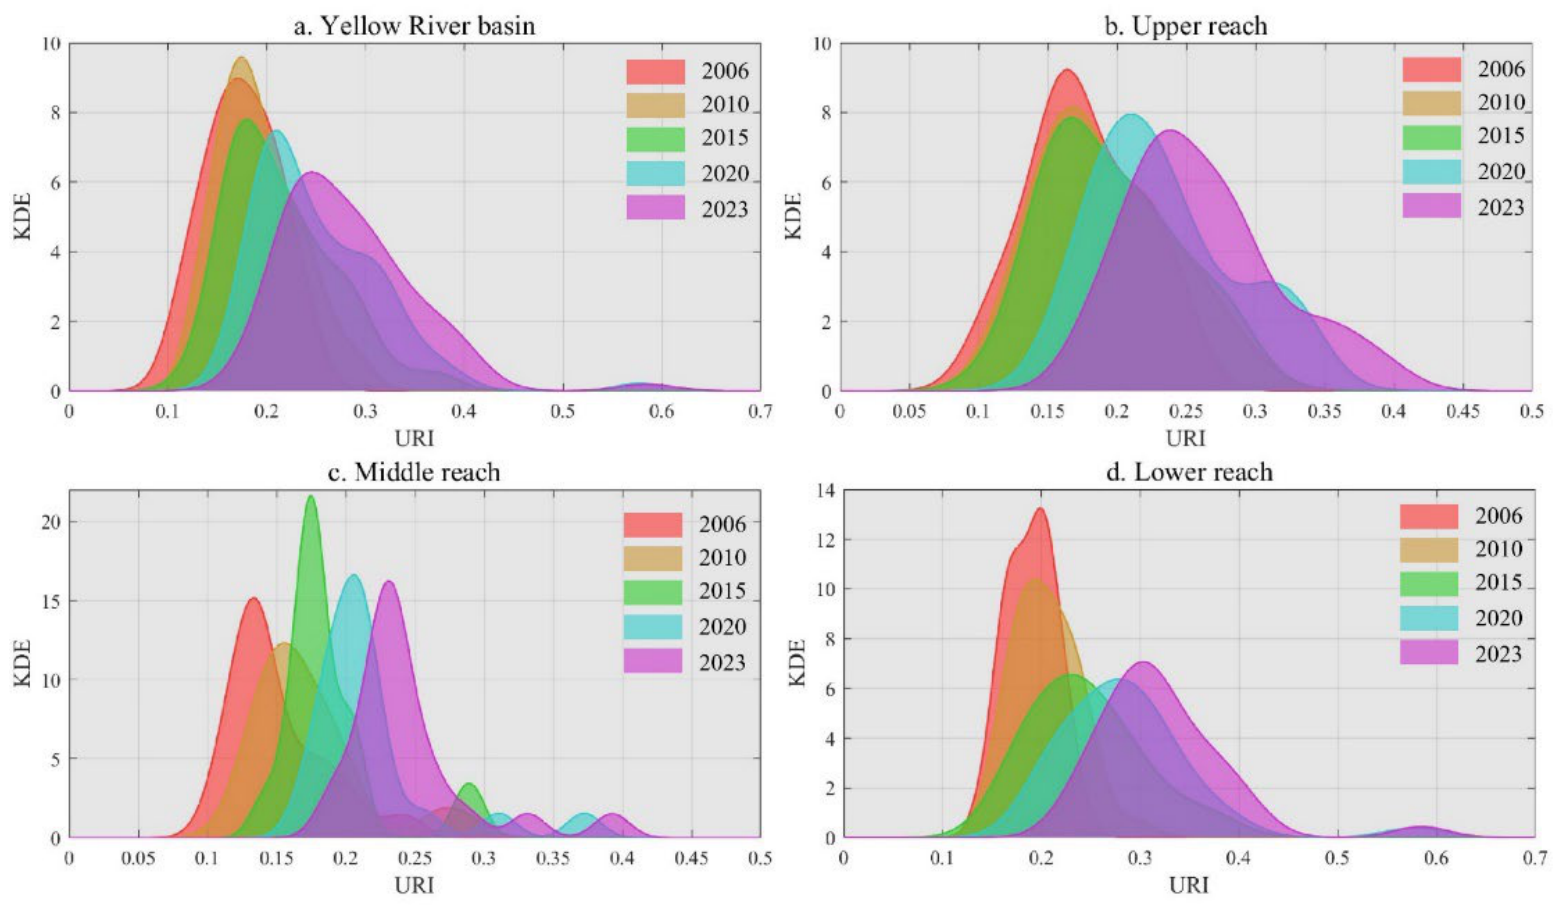
From 2006 to 2023, the URI of the Yellow River Basin experienced fluctuations but overall increased from 0.175 to 0.283, with an average annual growth rate of 2.86%, indicating a significant rise. According to the kernel density estimation results (Figure 1), the distribution curve for the Yellow River Basin shifted noticeably to the right, with the concentration center moving from a low range of 0.1–0.2 to a medium range of 0.2–0.3. This suggests a steady enhancement in the overall level of integrated urban–rural development across the basin. The curve mainly shows a single peak, where the height of the main peak initially increased and then decreased, while the curve’s width gradually narrowed and the right tail weakened. This pattern indicates that disparities in URI within the basin are decreasing, converging toward a more balanced and higher level.
In the upstream area, the center of the URI kernel density curve also moved toward higher values. The main peak’s height continued to decline, and the curve remained unimodal with a right tail but no multiple peaks. This implies that although the overall URI in the upstream region has improved, development remains relatively uniform without significant core-periphery differences, reflecting a well-balanced development.
For the middle reaches, the URI kernel density curve shifted markedly to the right, with the concentration center rising from 0.1 to 0.15 to 0.2–0.25. Additionally, the main peak’s height was notably higher than in the upstream and downstream areas. After 2015, a slight secondary peak appeared near 0.3, and a pronounced right tail was observed. This indicates that the midstream region is experiencing the fastest growth in integrated urban–rural development. Some cities have already reached relatively high levels, creating a development gradient within the region and signaling emerging internal differentiation.
In the downstream region, the URI kernel density curve’s center moved from 0.1 to 0.2 to 0.2–0.3, with the main peak showing a pattern of first decreasing and then increasing, but overall trending downward. By 2023, a main peak appeared around 0.3, alongside a secondary peak near 0.6 on the right. This suggests that while the downstream region’s URI has generally improved, certain areas have developed more rapidly than others, leading to disparities and a degree of internal imbalance in development.

3.2. Spatial Pattern of URI in the Yellow River Basin

A global spatial autocorrelation analysis was performed on the URI for 78 cities within the Yellow River Basin spanning the years 2006 to 2023, subsequently followed by a spatial autocorrelation test as presented in Table 3. The results demonstrated that the test was significant at the 5% level across all years, with Moran’s I index consistently exceeding zero. This indicates that the URI displays pronounced spatial clustering and a positive spatial correlation in its spatial distribution.
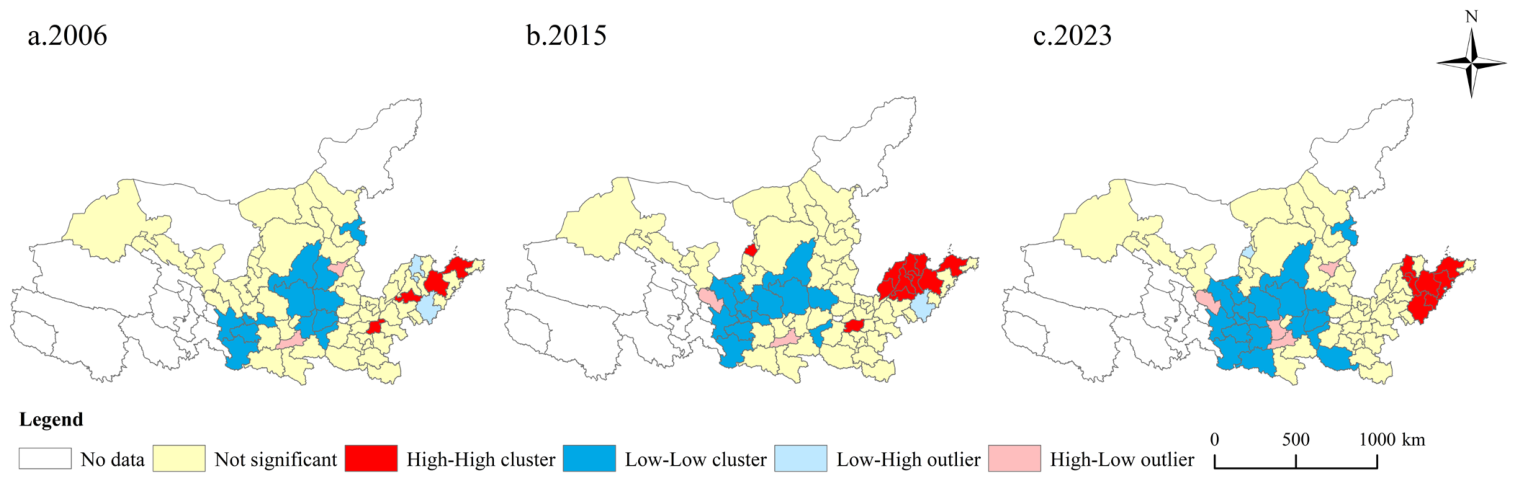
Utilizing cross-sectional data from the years 2006, 2015, and 2023, a local spatial autocorrelation analysis was performed (Figure 2), which identified distinct patterns of local spatial clustering in the URI, resulting in the classification of four spatial typologies. The High-High (H-H) clusters are characterized by elevated URI levels both within the city and its adjacent areas. The prevalence of these clusters has increased over time, with a primary concentration in the Shandong Peninsula region. Conversely, the Low-Low (L-L) clusters exhibit low URI in both the city and neighboring regions, forming pronounced low-value agglomeration zones. These L-L clusters are widely dispersed and constitute the dominant spatial pattern, predominantly situated in the “J” bend area of the Yellow River basin. The High-Low (H-L) outlier, defined by high URI in the city but low values in surrounding areas, are relatively scarce and display a spatially scattered distribution. Lastly, the Low-High (L-H) outlier, characterized by low URI within the city but high values in adjacent regions, were primarily located around H-H t cities in 2006 and 2015; however, by 2023, only Shizuishan City remained classified under this category.

3.3. Spatio-Temporal Interaction Characteristics of URI in the Yellow River Basin

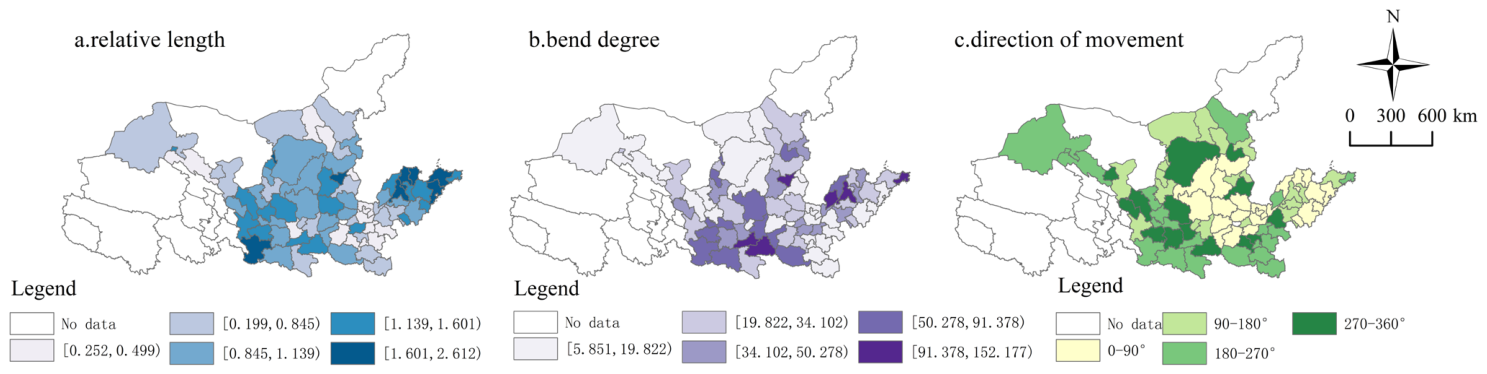
The relative length and curvature of LISA time paths for each city from 2006 to 2023 were calculated and categorized into five groups using the natural breaks method (Figure 3). Due to data limitations, Xining has no adjacent nodes in the constructed adjacency matrix and is therefore excluded from subsequent analyses.
The relative length closely mirrors the spatial distribution pattern of URI, with areas of high values aligning strongly with regions exhibiting high URI levels. Regions with lower URI values tend to have more stable spatial structures and shorter travel paths. There are 42 cities with a relative length below 1, making up 53.85% of the total, which suggests that the spatial pattern of URI in the Yellow River Basin remains relatively stable. Among these, cities like Luohe, Pingdingshan, Hohhot, and Yangquan have relatively short LISA travel paths, with Luohe having the shortest relative length at just 0.252. Conversely, cities such as Taiyuan, Yantai, Jinan, and Qingdao show longer LISA time-path movements, with Qingdao having the longest relative length at 2.611.
During the same timeframe, the LISA time-path curvature of URI within the Yellow River Basin (Figure 3b) predominantly exhibited a spatial configuration characterized by elevated values centrally and diminished values peripherally. This pattern indicates that the spatial dependency direction of URI at the basin’s margins remained relatively stable, accompanied by weak spatial dependency effects. Conversely, cities situated within the basin demonstrated pronounced spatial dependency, rendering them more susceptible to URI fluctuations in adjacent prefectures and municipalities. Between 2006 and 2023, 46 prefecture-level cities (58.97%) were classified within the first two curvature intervals, [5.851, 19.822) and [19.822, 34.102), suggesting that the developmental trajectories of URI in the Yellow River Basin are largely autonomous with limited spatial dependency influences. This finding further implies the existence of opportunities to strengthen interactions between cities exhibiting higher URI curvature and their neighboring regions. Notably, cities such as Zhoukou, Yangquan, and Baotou displayed relatively lower curvature values, whereas Jinan, Xi’an, and Taiyuan were characterized by higher curvature measures.
The directional movement of the LISA scatter plot coordinates for the URI of the Yellow River Basin from 2006 to 2023 (Figure 3c) was calculated to assess the synergistic growth relationship between the URI of each city within the basin and that of its neighboring cities. The directional angles were interpreted as follows: 0–90° signifies a positive synergy trend between a city and its neighbors; 90–180° indicates a low growth trend in the city itself coupled with a high growth trend in neighboring cities; 180–270° reflects a negative synergy trend between the city and its neighbors; and 270–360° denotes a high growth trend in the city itself alongside a low growth trend in neighboring cities. Among the prefecture-level cities analyzed, 43 demonstrated URI synergy, representing 55.128% of the total. Of these, 23 cities exhibited positive synergy, while 20 displayed negative synergy. Cities with positive synergy, such as Zhengzhou, Luoyang, Qingdao, and Rizhao, were predominantly located in the hinterland and coastal areas of the Yellow River Basin. Conversely, cities showing negative synergy, including Lanzhou and Xianyang, were mainly situated in the upper reaches of the basin. These findings suggest that the evolution of URIs within the Yellow River Basin is characterized by strong spatial integration, with positive synergistic interactions slightly surpassing negative ones.
Utilizing LISA spatiotemporal transition analysis to elucidate the dynamics of local spatial association types for URI within the Yellow River Basin, we computed the transition probability matrix of Local Moran’s I for URI spanning the period from 2006 to 2023 (Table 4). An inspection of the main diagonal reveals that all diagonal elements exceed 0.6, signifying a relative stability in the type transitions of URI across the Yellow River Basin, indicative of a “path dependency” phenomenon (Stabilized in the current state under the influence of certain factors and difficult to break through). Analysis of the off-diagonal elements shows that the transition probabilities for HLt → LLt+1, HHt → HLt+1, and LLt → LHt+1 are below 0.05, whereas those for HHt → LLt+1, HLt → LHt+1, HLt → HHt+1, LHt → HLt+1, and LLt → HLt+1 fall under 0.02. These findings suggest a pronounced “Matthew effect” (“The strong get stronger, and the weak get weaker.”) within the Yellow River Basin: urban areas exhibiting higher URI values demonstrate a low propensity to decline to lower levels, whereas those with lower URI values face considerable challenges in enhancing their indices and are minimally influenced by spillover effects from adjacent cities.

4. Mechanisms of URI Spatio-Temporal Transitions in the Yellow River Basin

4.1. Selection of Driving Factors

Integrated urban–rural development is a dynamic process driven by the interaction between market mechanisms and government regulation, involving the bidirectional flow and optimized allocation of population, capital, technology, information, and public resources across urban and rural spaces [48]. According to urban–rural regional system theory, the evolution of urban–rural integration is fundamentally shaped by the coordinated operation of demographic, economic, institutional, and industrial subsystems. Existing studies have shown that population agglomeration, human capital accumulation, economic growth, governmental support, external openness, and industrial transformation constitute the major forces influencing urban–rural integration and coordinated regional development [16,25].
Moreover, the Yellow River Basin is characterized by substantial regional disparities in population distribution, economic development, public resource allocation, industrial transformation, and openness to external markets. These differences have been widely recognized as key factors shaping the spatial heterogeneity of urban–rural integration within the basin. Therefore, drawing upon urban–rural regional system theory, the endogenous–exogenous development framework, and findings from previous studies [26,28,29,34,49], six representative driving factors were selected for empirical analysis: population density (POP), education expenditures (EDU), economic development (ECO), opening up (OPE), fiscal investment level (FIN), and industrial structure (IND). Together, these variables capture the demographic foundation, human capital support, economic development capacity, external linkage intensity, governmental intervention strength, and industrial transformation dynamics that jointly influence the evolution of urban–rural integration.
① Population Density (POP): Population density is a key indicator reflecting the spatial concentration patterns and distributional equilibrium of the population within urban–rural regional systems. It directly impacts the efficiency of public service resource allocation, the effectiveness of infrastructure utilization, and the costs of inter-regional factor movement between urban and rural areas [50]. From the perspective of urban–rural system co-evolution, a moderate level of population agglomeration can generate economies of scale in urban centers, boost the input-output efficiency of public resources, and support the implementation and spread of public services in rural areas. This helps avoid inefficiencies caused by a dispersed rural population and is a fundamental condition for the orderly restructuring of population elements and the balanced development of the urban–rural system. In this study, population density is calculated as the ratio of the registered population in a given region to the area of its administrative boundaries.
② Education Expenditures (EDU): The scale and distribution of government education spending are fundamental determinants of the equity in public education resource allocation between urban and rural regions. By promoting human capital development and knowledge dissemination, education expenditures significantly enhance the overall quality and employability of the urban and rural labor force. This, in turn, supports the transfer of rural labor to non-agricultural sectors and promotes orderly urbanization, thus reducing income and development gaps between urban and rural communities [51]. Therefore, education expenditures play a crucial role in the integrated development of urban and rural social and demographic systems. The proportion of education expenditures in the total government budget is used as an indicator of the education investment level.
③ Economic Development (ECO): The level of economic development is the material basis and internal impetus for the integrated development of urban and rural areas. It provides essential support for the continuous transformation of the urban–rural spatial framework. Increasing the overall regional economic output and improving development quality offer necessary fiscal resources for the coordinated construction of urban–rural infrastructure, such as transportation and communication networks, and for the equitable provision of public services [15,52]. At the same time, economic development strengthens the ability of cities and towns to influence and stimulate surrounding rural areas, expands market opportunities for agricultural products, and helps increase farmers’ income. It also promotes the two-way flow of key production factors like capital, technology, and labor between urban and rural sectors, effectively breaking down the barriers of the urban–rural dual economic structure. Regional GDP is used as the measurement indicator.
④ Opening Up (OPE): Opening up is a vital mechanism that enables urban–rural regional systems to break through internal closed-loops and connect with high-quality external resources and advanced factors, demonstrating the system’s openness and external connectivity [53]. Through channels like foreign trade and foreign direct investment attraction, opening up promotes the iterative upgrading of regional industries and the optimization of employment structures. This process improves the efficiency of resource allocation across urban and rural areas, stimulates industrial development vitality, and injects external impetus into URI. The degree of openness is quantified by the ratio of actual utilized foreign investment to the regional GDP.
⑤ Fiscal Investment Level (FIN): The fiscal investment level is a fundamental government tool for guiding the integrated development of urban and rural regions and regulating the distribution of resources and production factors between them. It is crucial for strengthening infrastructure support in the urban–rural spatial framework and addressing rural development deficiencies [54]. As a direct form of government intervention in urban–rural development, fiscal investment focuses on sectors such as urban–rural infrastructure, public services, and ecological management. This focus helps improve infrastructure networks including transportation, water conservancy, and digital technologies, enhances rural public service provision, promotes coordinated urban–rural ecological environment governance, and encourages social capital participation in URI initiatives. As a result, fiscal investment helps reduce urban–rural development disparities and promotes the comprehensive and coordinated progress of the urban–rural system. The ratio of fixed-asset investment to total government general budget expenditures is used as the metric for this dimension.
⑥ Industrial Structure (IND): The industrial structure is the fundamental framework of the urban–rural economic system. Its optimization and upgrading are essential for facilitating efficient resource allocation between urban and rural areas and achieving complementary functions [55]. The evolution of the industrial structure towards more advanced and rational forms promotes the systematic reorganization and effective movement of production factors among different industrial sectors in urban and rural areas. This process fosters the deep integration of urban secondary and tertiary industries with rural primary industries, creating a collaborative development model featuring mutual reinforcement between industry and agriculture, urban-led rural development, and symbiotic urban–rural industries. Such integration is a key strategy for addressing urban–rural industrial fragmentation and achieving coordinated functional synergy within the system. In this study, the proportion of the tertiary industry’s value-added to the regional GDP is used as a representative indicator.
To address the issue of heteroscedasticity, logarithmic transformations were applied to the dependent variable URI as well as to all explanatory variables (Table 5).

4.2. Results of Panel Quantile Regression

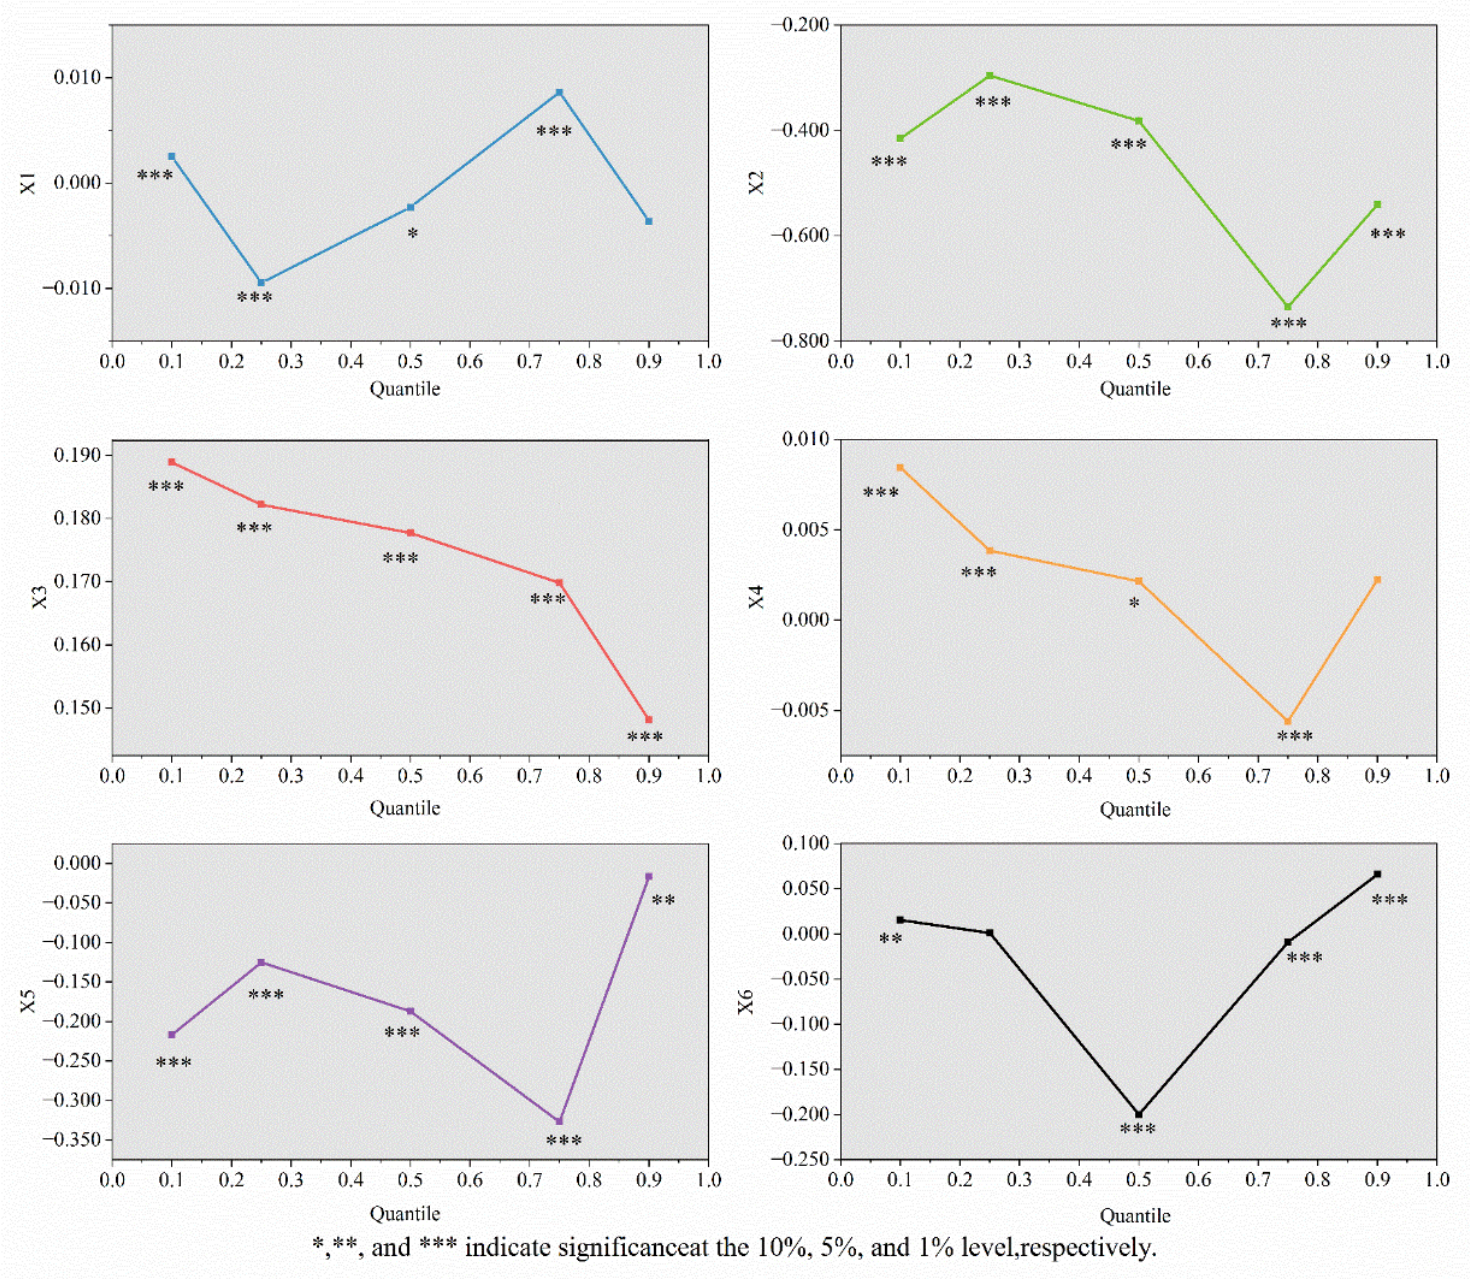
A multicollinearity assessment was performed on the quantile regression panel data model, revealing that all variance inflation factor (VIF) values were below 5, thereby indicating the absence of significant multicollinearity among the explanatory variables. Five quantile levels—0.1, 0.25, 0.5, 0.75, and 0.9—were selected to categorize the URI index, as illustrated in Figure 4. The coefficient for POP exhibited a significantly positive effect at the 0.1 and 0.75 quantiles, a significantly negative effect at the 0.25 and 0.5 quantiles, and was not statistically significant at the 0.9 quantile; consequently, the latter was excluded from further consideration. Overall, the coefficient displayed a “V”-shaped pattern across the 0.1 to 0.75 quantiles, suggesting that population agglomeration facilitates URI during both the initial and advanced stages, while its marginal effect diminishes temporarily at the intermediate stage, likely due to the necessity for distributional optimization. The coefficient associated with EDU was significantly negative across all quantiles, with the greatest absolute magnitude observed at the 0.75 quantile. This finding implies that EDU consistently exerts a suppressive influence on cities at all stages of URI, with a more pronounced effect in cities exhibiting higher levels of integration. In contrast, the ECO coefficient was significantly positive throughout all quantile intervals, exhibiting a monotonically decreasing trend as the quantile increased. This pattern reflects a “catch-up effect,” whereby ECO has a stronger impact on cities with lower URI levels, and its marginal contribution diminishes as integration advances. Regarding OPE, the coefficient was significantly positive at the 0.1, 0.25, and 0.5 quantiles, significantly negative at the 0.75 quantile, and not statistically significant at the 0.9 quantile; thus, the latter was disregarded. These results indicate a distinct threshold effect for OPE: external shocks may promote integration at lower stages, but beyond a certain development threshold, they exert an inhibitory effect on cities with higher degrees of URI. The coefficient for FIN intensity was significantly negative across all quantiles, exhibiting an “N”-shaped trend in its inhibitory effect, with the largest absolute value at the 0.75 quantile. This suggests the presence of a critical threshold for fiscal investment: at low to medium integration levels, dispersed or inefficient investment tends to produce a crowding-out effect, whereas at higher integration levels, targeted investment in key areas becomes an effective driver of integration. Finally, the IND coefficient was significantly positive at the 0.1 quantile, turned negative at the 0.5 and 0.75 quantiles, and reverted to a significantly positive value at the 0.9 quantile. This pattern indicates that the impact of IND adjustment is stage-dependent: it promotes integration in the early phase through optimized spatial layout; exerts short-term suppressive effects during the intermediate phase due to challenges associated with traditional industrial upgrading; and regains a positive influence in the advanced phase as the modern industrial system matures.

4.3. Driving Mechanisms of Spatiotemporal Transitions

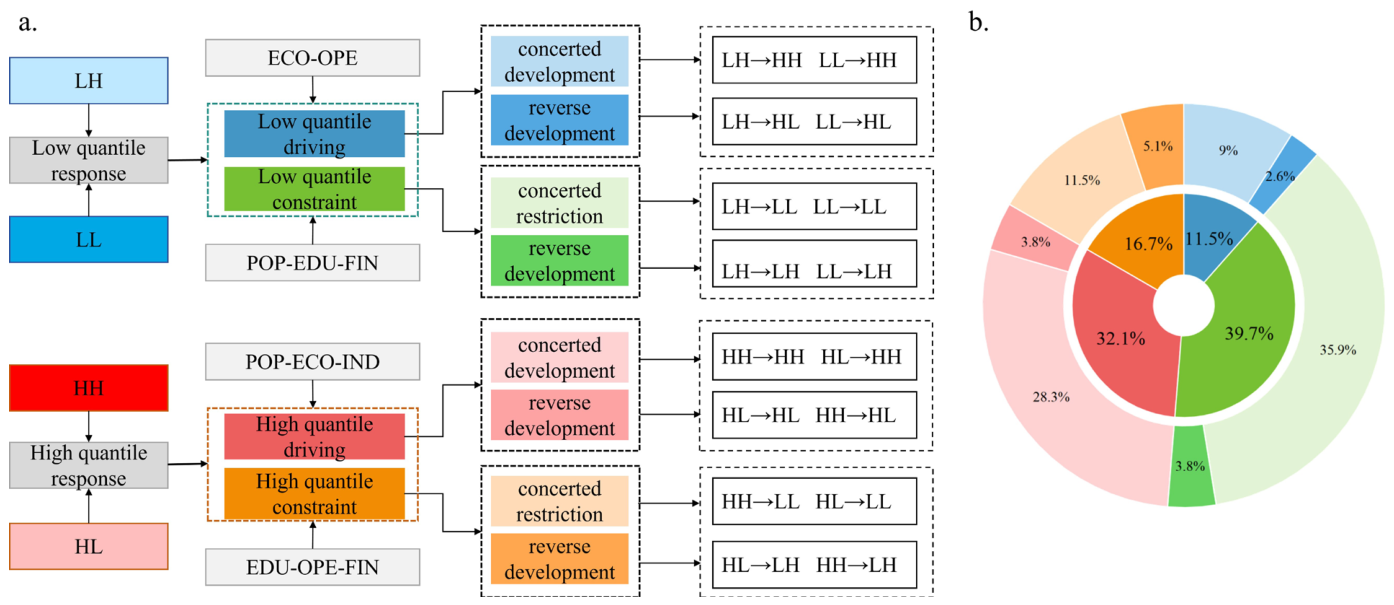
By employing nested quantile regression models that incorporate spatio-temporal transition categories, this study elucidates the driving mechanisms of URI across various cities within the Yellow River Basin and its adjacent regions. Response types are categorized according to quantile levels and the directional signs of the regression coefficients (Figure 5). Specifically, low-quantile models correspond to the 0.1, 0.25, and 0.5 quantiles, reflecting phases characterized by relatively low URI levels; these models encompass both low-quantile drivers and constraints. Conversely, high-quantile models pertain to the 0.75 and 0.9 quantiles, indicative of advanced stages of URI, and include high-quantile drivers as well as high-quantile constraints.
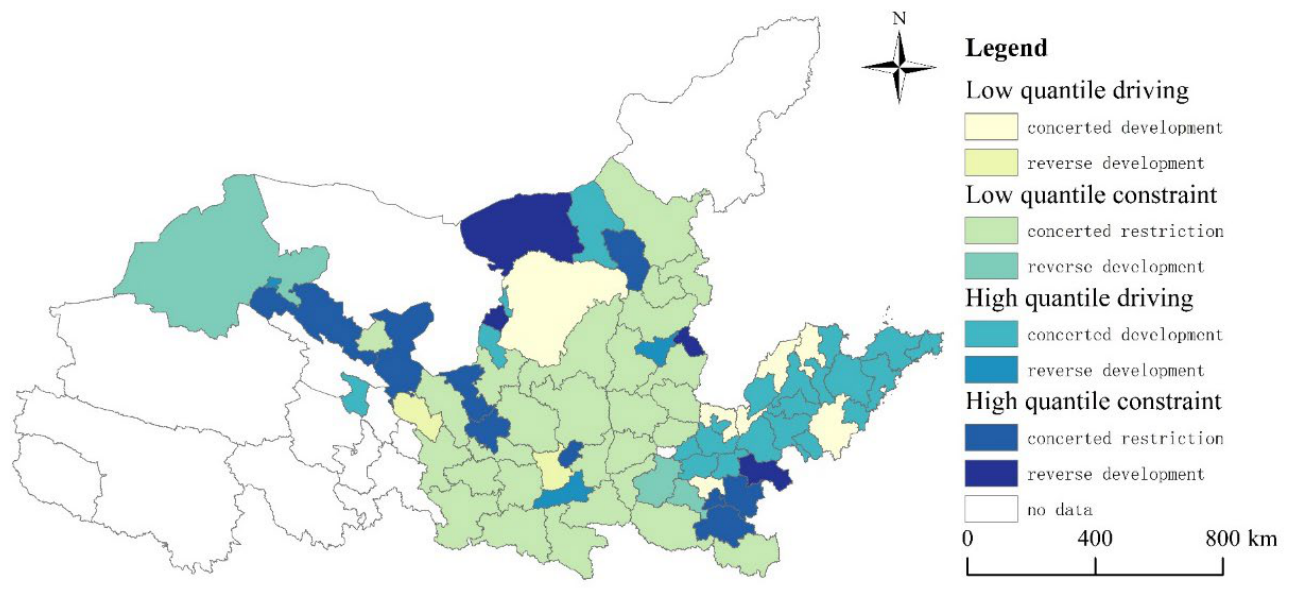
Based on the results of nested analysis combining quantile regression and spatio-temporal transition, the driving factors of spatio-temporal changes in URI within the Yellow River Basin are classified into four spatio-temporal transition driving mechanism patterns: “ECO-OPE” low-quantile drivers, “POP-EDU-FIN” low-quantile constraints, “POP-ECO-IND” high-quantile drivers, and “EDU-OPE-FIN” high-quantile constraints. The spatial distribution of quantile response types is visualized (Figure 6).
Low-quintile driving model: “ECO-OPE.” This model identifies ECO and OPE as the principal determinants facilitating the upward progression of the URI. ECO contributes to the accumulation of momentum for URI by establishing a robust foundation for coordinated development through industrial agglomeration and economic advancement. Concurrently, enhancements in OPE effectively promote the unrestricted movement and optimal allocation of urban–rural resources, thereby facilitating the transfer and dissemination of high-quality assets to rural areas. This dynamic plays a crucial role in accelerating the URI process and improving the URI. From a spatial distribution standpoint, this driving model influences a limited number of cities, representing 11.5% of the total. Cities exhibiting synchronous development under this model are predominantly located in Shandong and Henan provinces, whereas only Xianyang and Lanzhou demonstrate divergent developmental trajectories.
Low-quintile constraint model: “POP-EDU-FIN.” In this constraint model, POP, EDU, and FIN are the primary factors limiting the integrated development of urban and rural areas. The imbalanced distribution of POP—characterized by excessive rural out-migration and excessive urban concentration—exacerbates the hollowing out of the rural labor force and places a steeply increasing burden on urban public resources, directly disrupting the equilibrium in the allocation of urban–rural factors; the insufficient total volume of EDU and its uneven distribution between urban and rural areas, coupled with a shortage of funding for rural education, results in low levels of cultural literacy and skills among the rural labor force. This makes it difficult for them to meet the demands of coordinated urban–rural industrial development and hinders the rational flow of labor between urban and rural areas; FIN is limited in scale and exhibits significant bias, with funds largely concentrated on urban infrastructure construction. Insufficient investment in rural sectors such as transportation, healthcare, and education makes it difficult to address rural development shortcomings, further solidifying the urban–rural dual structure and constraining the fundamental process of two-way factor flow and integrated development. From a spatial distribution perspective, this type of city is the most numerous, clustered in the Yellow River’s Jiziwan region, with most exhibiting co-directional constraints.
High-quintile driving model: “POP-ECO-IND.” Under this model, POP, ECO, and IND serve as the core drivers for promoting the upward transition of the URI. Specifically, a high level of POP facilitates the formation of a factor agglomeration effect, promotes the efficient provision of urban and rural public services and the intensive use of infrastructure, and provides spatial support for deep URI; high-quality economic development can accumulate sufficient material resources for URI, using the outcomes of high-efficiency development to comprehensively advance balanced urban–rural development; The optimization and upgrading of industrial structures, along with the coordinated layout of urban and rural industries, can strengthen industrial linkages and division of labor between urban and rural areas, driving the efficient allocation of factors such as population and capital across urban and rural regions, which has a significant positive impact on improving the URI score. In terms of spatial distribution, a significant number of cities—accounting for 32.1%—are influenced by this driving model. Among them, cities with parallel development are concentrated in a strip-like pattern in downstream regions, while cities with counter-directional development are relatively few, comprising only Taiyuan, Xi’an, and Jiayuguan.
High-quintile constraint model: “EDU-OPE-FIN.” In this model, EDU, OPE, and FIN are the primary factors constraining the high-level development of URI. Structural imbalances persist in the allocation of education expenditures between urban and rural areas, with relatively insufficient funding for rural education. This makes it difficult to fundamentally narrow the gap in human capital accumulation between urban and rural areas, thereby constraining rural innovation and industrial transformation; The dividends from openness—including factors, technology, and market opportunities—are concentrated primarily in urban areas, while rural areas have limited integration into both domestic and international dual circulation, making it difficult for them to fully share the fruits of open development; Furthermore, the coordination efficiency and precision of fiscal funds are insufficient, resulting in weak long-term support for rural public services and functional upgrades. This fails to fully meet the demands of high-quality integrated urban–rural development, thereby continuously constraining the URI process during the high-level development stage. In terms of spatial distribution, 12 cities exhibit this pattern, scattered across the upper, middle, and lower reaches of the Yellow River basin. Cities with co-directional constraints are concentrated in Gansu and Ningxia provinces, while cities with counter-directional development are predominantly distributed around the high-ranking, co-directional development cities.

5. Conclusions and Policy Implications

5.1. Conclusions

Based on the theoretical framework of the urban–rural regional system, this study constructs an URI indicator system and systematically analyzes the spatiotemporal evolution patterns and transition mechanisms of the URI in the Yellow River Basin from 2006 to 2023, reaching the following key conclusions:
① The URI in the Yellow River Basin exhibits a spatiotemporal evolution characterized by “overall improvement and regional differentiation.” Between 2006 and 2023, the basin’s URI rose steadily from 0.175 to 0.283, with an average annual growth rate of 2.86%. The kernel density curve shifted continuously to the right while its bandwidth narrowed, indicating that while the overall level improved, internal disparities gradually decreased. However, spatial differentiation is significant: the lower reaches have formed a high-level cluster, the middle reaches have shown the fastest rate of improvement but are beginning to exhibit internal differentiation, and the upper reaches demonstrate relatively balanced development but remain at a lower overall level. Spatial autocorrelation analysis reveals significant positive spatial correlation in URI, with Moran’s I index rising from 0.273 in 2006 to 0.415 in 2023. High-high clusters are primarily distributed on the Shandong Peninsula, while low-low clusters are concentrated in the Jiziwan region.
② The local spatial dynamics of URI exhibit an evolutionary pattern characterized by “dominant stability and limited transitions.” LISA time-path analysis indicates that 53.85% of prefecture-level cities have a relative length less than 1, suggesting that their spatial patterns remain relatively stable; 58.97% of prefecture-level cities exhibit low curvature, indicating that their URI development paths are relatively independent, with weak spatial dependency effects. The transition probability matrix shows that all elements on the main diagonal are greater than 0.6, confirming the existence of a “path dependency” effect; simultaneously, transition probabilities such as HL → LL, HH → HL, and LL → LH are less than 0.05, revealing the “Matthew effect” in urban–rural integrated development—high-level regions are more likely to maintain their advantages, while low-level regions struggle to break through development bottlenecks, and spillover effects between adjacent regions are relatively limited.
③ The driving mechanisms of URI exhibit significant “stage-space” dual heterogeneity. Quantile regression results reveal the nonlinear impact of driving factors: population density exhibits a “V”-shaped curve effect, significantly promoting integration at low and high quantiles while exerting an inhibitory effect at the intermediate stage; education expenditure exhibits a negative effect across all quantile intervals, with the strongest inhibitory effect on high-level regions; economic development has a positive promotional effect across all quantile intervals, but its marginal effect diminishes as the quantile rises; openness to the outside world promotes integration in the low-quantile stage but turns inhibitory at the 0.75 quantile; fiscal investment is negative across all quantile stages, exhibiting an “N”-shaped trend; and the impact of industrial structure shows stage-specific fluctuations. Based on this, four spatio-temporal transition driving patterns have been identified: “ECO-OPE” low-quantile driving, “POP-EDU-FIN” low-quantile constraint, “POP-ECO-IND” high-quantile driving, and “EDU-OPE-FIN” high-quantile constraint. Each pattern exhibits distinct regional differentiation in spatial distribution.

5.2. Policy Implications

Based on the above conclusions, and in light of the regional variations and developmental characteristics of URI in the Yellow River Basin, the following differentiated policy recommendations are proposed:
Establish a multi-scale, coordinated spatial governance system. Given the spatial heterogeneity of URI in the Yellow River Basin, a three-tiered coordinated governance system encompassing the basin, regional, and local levels should be established. At the basin level, establish the Yellow River Basin Urban–Rural Integrated Development Committee to coordinate the coordinated development of the upper, middle, and lower reaches and formulate systematic planning and policy coordination mechanisms; at the regional level, delineate three functional zones (high-level integration zone, medium-level integration zone, and low-level integration zone) and implement differentiated governance strategies; at the local level, establish a “one county, one policy” dynamic adjustment mechanism to enhance the adaptability and flexibility of local governance. High-level integration zones should implement a strategy to improve quality and efficiency. The focus should be on optimizing the spatial distribution of the population, promoting a shift from excessive concentration to balanced distribution; deepening industrial restructuring, vigorously developing modern service industries and strategic emerging industries, and building a system for the coordinated development of urban and rural industries; and innovating fiscal investment mechanisms, directing fiscal funds primarily toward improving rural public services and building digital infrastructure to break the constraints of the high-level interdependence among education, openness, and finance. It is recommended to establish demonstration zones for innovative URI to explore new mechanisms for the equal exchange and two-way flow of urban and rural factors. Medium-level integration zones should implement a balanced coordination strategy. In response to internal polarization trends, a development pattern of “core leadership and multi-point support” should be established. The radiating and driving roles of core cities such as Zhengzhou and Xi’an should be strengthened, while secondary growth poles such as Luoyang and Taiyuan should be cultivated; the structure of education expenditure should be optimized, with a focus on strengthening the rural teacher workforce and vocational education and training to enhance the skill levels of the rural labor force; moderately control excessive population concentration and guide the orderly transfer of population to small and medium-sized towns and key townships; improve the construction of platforms for opening up to the outside world, promote the extension of the benefits of openness to rural areas, and prevent the premature decline of the “economy-opening up” driving effect. In low-level integration zones, implement a strategy of breakthroughs in foundational areas. Prioritize foundational and pioneering sectors: increase investment in infrastructure, with a focus on improving basic conditions in transportation, water conservancy, and communications; revitalize the low-level “economy-opening-up” driving effect by fostering economic growth points through investment promotion and industrial relocation; optimize population distribution to prevent excessive rural population outflow while controlling disorderly urban expansion; and innovate fiscal investment methods to address constraints in the “population-education-fiscal” low-level cycle.
Establish a dynamic, adaptive phased evolution mechanism. The initial phase focuses on the activation of key factors. Efforts will concentrate on strengthening infrastructure development to improve the physical environment for development; implementing proactive investment promotion policies to cultivate new growth drivers; advancing household registration system reforms to facilitate orderly population mobility; and increasing investment in basic education to raise the standard of rural education. The development phase centers on structural optimization. Promote industrial upgrading and develop distinctive, competitive industries; optimize the spatial distribution of the population and guide migration toward key towns; deepen opening-up and integrate into the regional economic division of labor; improve the public service system, with a focus on enhancing the quality of services in healthcare, culture, and education. The advanced stage centers on systemic coordination. Promote the equal exchange and two-way flow of urban and rural factors; build a modern industrial system to achieve deep integration of urban and rural industries; innovate social governance models to enhance the level of coordination in urban and rural governance; and strengthen coordinated ecological and environmental governance to build beautiful and livable urban and rural areas.
This study has several limitations. First, while the study constructed an URI index system covering five dimensions—population, economy, society, ecology, and space—it did not sufficiently address soft dimensions such as cultural integration and governance coordination. Future research could incorporate social network analysis to examine the process of restructuring urban–rural social networks. Second, the spatial analysis units primarily focused on prefecture-level cities, lacking detailed depictions at the county and township levels. Future work could further integrate remote sensing data and micro-level surveys to construct a multi-scale analytical framework. Third, this study employs static cross-sectional and time-series analyses, which remain limited in identifying the dynamic feedback mechanisms and causal relationships of URI; the application of methods such as system dynamics modeling could better simulate the complex evolutionary processes of urban–rural spatial systems.


Author Contributions

Data curation, K.M.; writing—original draft preparation, K.M. and S.Z.; writing—review and editing, Z.J. and W.Y.; visualization, K.M.; supervision, S.Z. and C.W.; funding acquisition, C.W. All authors have read and agreed to the published version of the manuscript.

Funding

This work was supported by General Project of Shandong Provincial Natural Science Foundation (grant number ZR2024MD034). Taishan Scholars Project Special Funding [grant number tstp20240821]. Zhongke Shandong Dongying Institute of Geographic Sciences Open Fund 202503.

Data Availability Statement

The data used to support the findings of this study are available from the corresponding author upon request.

Acknowledgments

The authors would like to thank anonymous reviewers for helpful comments to earlier versions of the article.

Conflicts of Interest

The authors declare no conflicts of interest.

Abbreviations

The following abbreviations are used in this manuscript:
URIUrban–rural integration
LISALocal indicators of spatial association
POPPopulation Density
EDUEducation Expenditures
ECOEconomic Development
OPEOpening Up
FINFiscal Investment Level
INDIndustrial Structure

References

  1. Zhan, L.; Wang, S.; Xie, S.; Zhang, Q.; Qu, Y. Spatial Path to Achieve Urban-Rural Integration Development-Analytical Framework for Coupling the Linkage and Coordination of Urban-Rural System Functions. Habitat Int. 2023, 142, 102953. [Google Scholar]
  2. Berkhout, E.; Sovová, L.; Sonneveld, A. The Role of Urban–Rural Connections in Building Food System Resilience. Sustainability 2023, 15, 1818. [Google Scholar] [CrossRef] [Scilit]
  3. Han, D.; Ma, Y.; Wang, K.; Li, S.; Zhang, F.; Zhu, Q. Reciprocal Feedback Mechanism Between Multidimensional Performance of Small Towns and Urban–Rural Integration: A Complex System Perspective on Traditional Agricultural Areas in Central China. Systems 2026, 14, 383. [Google Scholar] [CrossRef] [Scilit]
  4. Fang, C.; Sun, B. The Geographical Connotations of New Quality Productivity and the Key Directions for Driving Urban-rural Integrated Development. Acta Geogr. Sin. 2024, 79, 1357–1370. (In Chinese) [Google Scholar]
  5. Wang, P.; Guo, B.; Sun, Z. Sustainable Urban-Rural Symbiosis in China: A Study from the Symbiosis Theory Perspective on Level Measurement and Spatial Difference Analysis. Sustainability 2025, 17, 2790. [Google Scholar] [CrossRef] [Scilit]
  6. Wang, X.; Wang, W.; Wang, C.; Jiao, X.; Teng, C. The Spatial Relationship Between Urban–Rural Integration and Economic Development: A Case Study of Urban Agglomeration in the Yellow River Basin. Sustainability 2025, 17, 1438. [Google Scholar] [CrossRef] [Scilit]
  7. Liu, B.; Qi, C.; Xue, B.; Yang, Z. Measuring Urban-Rural Integration through the Lenses of Sustainability and Social Equity: Evidence from China. Habitat Int. 2025, 165, 103559. [Google Scholar] [CrossRef] [Scilit]
  8. Rondinelli, D.A. Secondary Cities in Developing Countries: Policies for Diffusing Urbanization; SAGE Publications Inc.: Beverly Hills, CA, USA, 1983; Volume 59, pp. 461–462. [Google Scholar]
  9. Castle, E.; Wu, J.; Weber, B.A. Place Orientation and Rural-Urban Interdependence. Appl. Econ. Perspect. Policy 2011, 33, 179–204. [Google Scholar] [CrossRef] [Scilit]
  10. Kule, L. Urban-Rural Interactions in Latvian Changing Policy and Practice Context. Eur. Plan. Stud. 2014, 22, 758–774. [Google Scholar]
  11. Shen, C.; Wu, X.; Shi, L.; Wan, Y.; Hao, Z.; Ding, J.; Wen, Q. How Does the Digital Economy Affect the Urban-Rural Income Gap? Evidence from Chinese Cities. Habitat Int. 2025, 157, 103327. [Google Scholar] [CrossRef] [Scilit]
  12. Tong, W.; Guo, J.; Lo, K.; Xu, W. Bridging the Gap to Common Prosperity: Rural Development and Urban-Rural Income Disparities in Zhejiang Province, China. Chin. Geogr. Sci. 2026, 36, 207−221. [Google Scholar] [CrossRef] [Scilit]
  13. Fu, C.; Zhou, S.; Yan, X.; Gu, J. The Spatiotemporal Changes of the Gap in Living Standards between Urban and Rural Residents in China and Its Influencing Factors. World Reg. Stud. 2015, 24, 67–77. (In Chinese) [Google Scholar]
  14. Lu, J.; Chen, J. High-Quality Financial Development and Rural–Urban Economic Integration: Coordinated Measurement and Spatiotemporal Evolution. Sustainability 2025, 17, 5750. [Google Scholar] [CrossRef] [Scilit]
  15. Zhang, Y.; Zhang, P.; Lu, Z.; Chen, Z. Coupling Coordination and Typology Analysis of High-Quality Urban Economic Development and Integrated Urban–Rural Development: A Case Study of Zhejiang Province, China. Sustainability 2026, 18, 4045. [Google Scholar] [CrossRef] [Scilit]
  16. Zhou, J.; Qin, F.; Liu, J.; Zhu, L.; Zou, W. Measurement, spatial-temporal evolution and influencing mechanism of urban-rural integration level in China from a multidimensional perspective. China Popul. Resour. Environ. 2019, 29, 166–176. (In Chinese) [Google Scholar] [CrossRef] [Scilit]
  17. Wang, Y.; Sun, P.; Li, C.; Liu, H.; Zhou, J. Spatial-Temporal Evolution Features of Urban and Rural Harmonious in Northeast China Since 2003. Econ. Geogr. 2018, 38, 59–66. (In Chinese) [Google Scholar]
  18. Guo, Y.; Wang, J. Spatio-temporal patterns of urban-rural transformation and optimal decision-making in China. Prog. Geogr. 2021, 40, 1799–1811. (In Chinese) [Google Scholar] [CrossRef] [Scilit]
  19. Fang, C.; Wang, K.; Chen, Z.; Liu, Z.; Liu, M.; Sun, B.; Liao, X.; Meng, L.; Yang, Z. Uncovering the Urban-Rural Integration of China over the Past 40 Years: Measurement Framework and Spatial-Temporal Evolution. Geogr. Sustain. 2026, 7, 100424. [Google Scholar] [CrossRef] [Scilit]
  20. Yang, Y.; Bao, W.; Wang, Y.; Liu, Y. Measurement of urban-rural integration level and its spatial differentiation in China in the new century. Habitat Int. 2021, 117, 102420. [Google Scholar] [CrossRef] [Scilit]
  21. Chen, C.; LeGates, R.; Zhao, M.; Fang, C. The changing rural-urban divide in China’s megacities. Cities 2018, 81, 81–90. [Google Scholar] [CrossRef] [Scilit]
  22. Su, K.; He, D.; Wang, R.; Han, Z.; Deng, X. Assessment of Natural Resource Endowment and Urban-Rural Integration for Sustainable Development in Xinjiang, China. J. Clean. Prod. 2024, 450, 142046. [Google Scholar] [CrossRef] [Scilit]
  23. Xiang, B.; Chen, Y.; Zhang, Y. Effects of the Pilot Policy on Integrated Urban-Rural Development in China: A Quasi-Natural Experiment Analysis. Cities 2026, 168, 106420. [Google Scholar] [CrossRef] [Scilit]
  24. Li, F.; Ma, G.; Zhang, G. Does the National Key Ecological Function Zones Policy Promote Leapfrog Development in Urban–Rural Integration? Land 2026, 15, 128. [Google Scholar] [CrossRef] [Scilit]
  25. Li, L.; Yang, L.; Wang, H.; Yang, S.; Yan, Z. Spatiotemporal Evolution Characteristics and Impact Factors of Urban-rural Integrated Development in China. Chin. Geogr. Sci. 2025, 35, 802–818. [Google Scholar] [CrossRef] [Scilit]
  26. Dong, Y.; Li, L.; Huang, X. Spatiotemporal Differentiation and Driving Factors of Urban–Rural Integration in Counties of Yangtze River Economic Belt. Land 2025, 14, 889. [Google Scholar] [CrossRef] [Scilit]
  27. Du, B.; Wang, Y.; He, J.; Li, W.; Chen, X. Spatio-Temporal Characteristics and Obstacle Factors of the Urban-Rural Integration of China’s Shrinking Cities in the Context of Sustainable Development. Sustainability 2021, 13, 4203. [Google Scholar] [CrossRef] [Scilit]
  28. Wu, Q.; Chang, W.; Song, M.; Zhu, H. Measurement of Urban–Rural Integration Development Level and Diagnosis of Obstacle Factors: Evidence from the Beijing–Tianjin–Hebei Urban Agglomeration, China. Land 2025, 14, 261. [Google Scholar] [CrossRef] [Scilit]
  29. Gan, W.; Wang, H.; Li, P.; Liu, J.; Chen, J. Revealing Urban-Rural Sustainability Dynamics Based on Multi-Source Data and Machine Learning: Spatio-Temporal Hotspots, Driving Mechanisms, and Non-Linear Thresholds in Suzhou, China. Front. Environ. Sci. 2026, 13, 1712246. [Google Scholar]
  30. Li, Y.; Hao, H.; Sun, L.; Liu, M.; Wang, D. The Development of Economic–Social–Ecological Complex Systems in the Yellow River Basin, China. Sustainability 2025, 17, 511. [Google Scholar] [CrossRef] [Scilit]
  31. Guo, F.; Li, R.; Yin, P.; Sun, Y. Spatio-temporal differentiation and driving mechanism of urban-rural integrated development in the Yellow River Basin based on GTWR model. Geogr. Sci. 2024, 44, 2166–2175. (In Chinese) [Google Scholar]
  32. Zhu, B.; Zhang, S.; Chen, W.; Shi, H.; Wang, Y. The Positive Impact of Urban-Rural Integration on Consumption Gap among Residents in China. Cities 2026, 168, 106454. [Google Scholar]
  33. Chen, K.; Long, H.; Liao, L.; Tu, S.; Li, T. Land use transitions and urban-rural integrated development: Theoretical framework and China’s evidence. Land Use Policy 2020, 92, 104465. [Google Scholar] [CrossRef] [Scilit]
  34. Pan, W.; Wang, J.; Li, Y.; Chen, S.; Lu, Z. Spatial pattern of urban-rural integration in China and the impact of geography. Geogr. Sustain. 2023, 4, 404–413. [Google Scholar] [CrossRef] [Scilit]
  35. Zheng, Y.; Tan, J.; Huang, Y.; Wang, Z. The Governance Path of Urban–Rural Integration in Changing Urban–Rural Relationships in the Metropolitan Area: A Case Study of Wuhan, China. Land 2022, 11, 1334. [Google Scholar] [CrossRef] [Scilit]
  36. Liu, Y.; Zhang, X.; Xu, M.; Zhang, X.; Shan, B.; Wang, A. Spatial Patterns and Driving Factors of Rural Population Loss under Urban–Rural Integration Development: A Micro-Scale Study on the Village Level in a Hilly Region. Land 2022, 11, 99. [Google Scholar] [CrossRef] [Scilit]
  37. Bosworth, G.; Venhorst, V. Economic linkages between urban and rural regions–what’s in it for the rural? Reg. Stud. 2018, 52, 1075–1085. [Google Scholar]
  38. Han, J.; Jiang, S. Does the adjustment of industrial structure restrain the income gap between urban and rural areas. Economics 2024, 18, 20220112. [Google Scholar] [CrossRef] [Scilit]
  39. Ran, H.; Liu, R.; Xing, L.; Zhao, Y.; Zhang, K. Can urban-rural public services drive the realization of sustainable development goals? An empirical study of a typical rural–urban integration pilot area in China. J. Rural Stud. 2025, 120, 103818. [Google Scholar] [CrossRef] [Scilit]
  40. Niu, K.; Xu, H. Urban–rural integration and poverty: Different roles of urban–rural integration in reducing rural and urban poverty in China. Soc. Indic. Res. 2023, 165, 737–757. [Google Scholar]
  41. Wang, J.; Meng, F.; Dong, L.; Yu, S.; Zhang, Y. A Comparative Study on the Identification Methods of Urban–Rural Integration Zones from the Perspective of Symbiosis Theory and Urban Expansion Theory. Land 2023, 12, 1272. [Google Scholar] [CrossRef] [Scilit]
  42. Liang, G.; Xing, M.; Zhao, J. Simulation study on the urban-rural integration circulatory mechanism system in China: Based on system dynamics model and multi-objective genetic algorithm. Sustain. Futures 2025, 10, 101074. [Google Scholar] [CrossRef] [Scilit]
  43. Wang, Z.; Deng, X.; Wang, P.; Chen, J. Ecological intercorrelation in urban–rural development: An eco-city of China. J. Clean. Prod. 2017, 163, S28–S41. [Google Scholar] [CrossRef] [Scilit]
  44. Zhao, W.; Jiang, C. Analysis of the Spatial and Temporal Characteristics and Dynamic Effects of Urban-Rural Integration Development in the Yangtze River Delta Region. Land 2022, 11, 1054. [Google Scholar] [CrossRef] [Scilit]
  45. Wang, H.; Liu, L.; Li, J. Regional Disparities, Dynamic Evolution, and Convergence of Natural Disaster Emergency Management Efficiency in China. Systems 2026, 14, 344. [Google Scholar] [CrossRef] [Scilit]
  46. Liu, Y.; Lu, S.; Chen, Y. Spatio-temporal change of urban-rural equalized development patterns in China and its driving factors. J. Rural Stud. 2013, 32, 320–330. [Google Scholar] [CrossRef] [Scilit]
  47. Wang, X.; Wang, C.; Shi, J. Spatial and temporal evolution of urban resilience and its transition mechanism in Zhongyuan Urban Agglomeration. Geogr. Sci. 2024, 44, 1206–1216. (In Chinese) [Google Scholar]
  48. Xu, J.; Zeng, Z.; Xi, Z.; Peng, Z.; Chen, G.; Zhu, X.; Chen, X. Research on Sustainable Urban–Rural Integration Development: Measuring Levels, Influencing Factors, and Exploring Driving Mechanisms—Taking Eight Cities in the Greater Bay Area as Examples. Sustainability 2024, 16, 3357. [Google Scholar] [CrossRef] [Scilit]
  49. An, X.; Meng, L.; Zeng, X.; Ma, L. How Urban–Rural Integration Symbiosis Can Ameliorate the Socioeconomic Inequity in Ecological Space: Evidence from Yunnan, China. Sustainability 2025, 17, 2895. [Google Scholar] [CrossRef] [Scilit]
  50. Pénzes, J.; Hegedűs, L.D.; Makhanov, K.; Túri, Z. Changes in the Patterns of Population Distribution and Built-Up Areas of the Rural–Urban Fringe in Post-Socialist Context—A Central European Case Study. Land 2023, 12, 1682. [Google Scholar] [CrossRef] [Scilit]
  51. Zhang, Y.; Ma, G.; Tian, Y.; Dong, Q. Nonlinear Effect of Digital Economy on Urban–Rural Consumption Gap: Evidence from a Dynamic Panel Threshold Analysis. Sustainability 2023, 15, 6880. [Google Scholar] [CrossRef] [Scilit]
  52. Zhang, F.; Zhang, Q.; Xu, M. Remote Sensing Insights into Urban–Rural Imbalance and Sustainable Development: A Case Study in Guangdong, China. Sustainability 2025, 17, 2247. [Google Scholar] [CrossRef] [Scilit]
  53. Chen, Y.; Wang, Y.; Mei, D.; Wang, L. Coupling Coordination and Influencing Factors Between Digital Economy and Urban–Rural Integration in China. Sustainability 2025, 17, 7828. [Google Scholar] [CrossRef] [Scilit]
  54. Wu, M.; Yang, S.; Chen, X.; Cui, G. Research on the quality evaluation, spatial and temporal differentiation, and driving factors of urban-rural integration from a spatial perspective. Res. Agric. Mod. 2026, 47, 1–13. (In Chinese) [Google Scholar]
  55. Li, Y.; Ma, X.; Liu, Y.; Zhong, F. Can China’s New Infrastructure Promote Urban–Rural Integrated Development? Evidence from 31 Chinese Provinces. Buildings 2024, 14, 3978. [Google Scholar] [CrossRef] [Scilit]
Figure 1. Estimated URI density in the Yellow River Basin, 2006–2023.
Land 15 01136 g001
Figure 2. LISA Agglomeration Map of URI in the Yellow River Basin, 2006–2023.
Land 15 01136 g002
Figure 3. Spatial distribution of the LISA-derived geometric characteristics of URI in the Yellow River Basin.
Land 15 01136 g003
Figure 4. Quantile regression of influencing factors.
Land 15 01136 g004
Figure 5. Spatiotemporal transition patterns of URI in the Yellow River Basin. (a) driving patterns; (b) proportion of each type.
Land 15 01136 g005
Figure 6. Types of quantile responses for URI in the Yellow River Basin.
Land 15 01136 g006
Table 1. Indicator system for evaluating the level of URI.
AspectsIndicatorsSign
Population IntegrationUrbanization rate+
Employment structure+
Economic IntegrationRegional GDP per capita+
Ratio of Urban to rural per capita income−
Comparison of industrial output value+
Average nighttime illumination+
Social IntegrationNumber of hospital physicians per 10,000 people+
Number of teachers per 10,000 people+
Ratio of urban to rural engel’s coefficients+
Urban health insurance coverage+
Urban registered unemployment rate−
Urban pension insurance coverage rate+
Spatial IntegrationRoad area per capita+
Road network density+
Number of mobile phone subscribers+
Ecological IntegrationGreen coverage rate in built-up areas+
Electricity consumption per 10,000 yuan of GDP−
Industrial SO2 emissions−
Table 2. Types of LISA spatial-temporal transition.
Transition TypesMeaningsTransition States
Type IThe city itself has undergone a transformationHHt → LHt+1, HLt → LLt+1, LHt → HHt+1, LLt → HLt+1
Type IIA transition has occurred in a neighboring cityHHt → HLt+1, HLt → HHt+1, HLt → LLt+1, LLt → LHt+1
Type IIIA transition has occurred within the city itself and in neighboring citiesHHt → LLt+1, HLt → LHt+1, HLt → HHt+1, LHt → HLt+1
Type IVThe city itself and neighboring cities remain stableHHt → HHt+1, HLt → HLt+1, HLt → HHt+1, LLt → HLt+1
Table 3. Results of global spatial autocorrelation for URI in the Yellow River Basin, 2006–2023.
YearMoran’s IZYearMoran’s IZ
20060.2733.782 ***20150.4415.841 ***
20070.2473.403 **20160.4516.226 ***
20080.2813.836 **20170.4926.685 ***
20090.2383.256 **20180.5247.098 ***
20100.2913.935 **20190.4025.524 ***
20110.3554.803 ***20200.3524.886 ***
20120.4495.921 ***20210.3965.474 ***
20130.5507.558 ***20220.4075.521 ***
20140.5026.521 ***20230.4155.647 ***
Note: ** and *** indicate that the statistics are significant at the 5% and 1% levels, respectively.
Table 4. Transition Probability Matrix of Local Moran’s I from 2006 to 2023.
t/t + 1HHt+1LHt+1LLt+1HLt+1TypeNumber (Units)Percentage (%)
HHt0.910.0380.0070.045I634.81%
LHt0.1260.6610.1970.016II836.34%
LLt0.010.0350.9240.032III120.92%
HLt0.1150.0060.1720.707IV115187.83%
Table 5. Descriptive statistics.
VariableCodeMaxMinMeanStd. Dev.Sample Size
YlnURI−0.54−2.25−1.550.271404
X1lnPOP7.301.375.691.081404
X2lnEDU0.320.040.180.041404
X3lnECO18.8813.1616.291.021404
X4lnOPE−4.14−12.03−6.411.261404
X5lnFIN3.21−1.531.570.621404
X6lnIND−0.22−1.85−0.900.221404
Disclaimer/Publisher’s Note: The statements, opinions and data contained in all publications are solely those of the individual author(s) and contributor(s) and not of MDPI and/or the editor(s). MDPI and/or the editor(s) disclaim responsibility for any injury to people or property resulting from any ideas, methods, instructions or products referred to in the content.