Article

Geospatial Mapping of Urban and Peri-Urban Morphology: A Foundation for Ecosystem- and Evidence-Based Land-Use Planning


Faculty of Geology and Geography, Sofia University “St. Kliment Ohridski”, 1504 Sofia, Bulgaria
*
Author to whom correspondence should be addressed.
Land 2026, 15(6), 1031; https://doi.org/10.3390/land15061031
Submission received: 30 April 2026 / Revised: 3 June 2026 / Accepted: 8 June 2026 / Published: 11 June 2026
(This article belongs to the Special Issue Urban Land Use Dynamics and Smart City Governance)

Abstract

In the context of dynamic environmental changes, accurate geospatial information is fundamental for evidence-based decision-making in land-use planning. As urban areas undergo rapid structural transformations, characterizing their spatial morphology becomes essential for assessing ecosystem conditions and identifying pressure points within the urban–rural gradient. Drawing on the indicators for ecosystem condition and pressure recommended by the Mapping and Assessment of Ecosystem Services (MAES) framework, reflecting their trends, this study presents a methodology for comprehensive geospatial mapping of urban and peri-urban morphology, using the Functional Urban Area (FUA) of Burgas, Bulgaria, as a case study. The approach enables multi-scale spatial analysis (regional and local), integrates the structure and functions of urban ecosystems, and reveals the spatial heterogeneity of complex socio-economic systems. At the regional level, ecosystems within the FUA were identified using the national land-use/land-cover database. At the local level, within the city of Burgas, urban morphology was classified by combining building and land-cover types into 14 distinct urban morphological zones (local climate zones—LCZs) using high-resolution unmanned aerial vehicle (UAV)-based orthophotos. This precise spatial data allowed for a detailed assessment of the balance between pervious and impervious surfaces within each LCZ. By integrating Google Earth Engine (GEE) data, the appropriate conditions and pressure indicators in the case study are assessed. Regional ecosystem pressure is effectively captured through the spatial distribution of the Final Pressure Index (IPr). Concurrently, the Urban Ecosystem Performance Index (UEPI) highlights sharp spatial polarization, with critical stress concentrated in the industrial and port zones of the urban core. The results provide policy-makers and stakeholders with critical insights into current pressures and environmental changes in urban and peri-urban ecosystems, offering a robust foundation for evidence-based management and climate change adaptation strategies.

1. Introduction

In the context of dynamic environmental changes, accurate geospatial information is fundamental for evidence-based decision-making in land-use planning. Consequently, the integration of ecosystem-based approaches into spatial and, in particular, urban planning has emerged as a cornerstone of the contemporary international strategic agenda. At the global level, this priority is directly aligned with United Nations Sustainable Development Goal 11, which aims to enhance urban safety and resilience by embedding nature into the planning process. In the European context, its relevance is shaped by the ambitious goals of the European Green Deal [1] and the Biodiversity Strategy 2030 [2]. A particularly significant development is the entry into force of the Nature Restoration Law [3], which requires member states to take urgent measures to improve ecosystem health, with at least 20% of degraded natural areas to be restored by 2030.
All of these strategic documents note that cities are the most vulnerable environments, as they constitute complex socio-ecological–technological systems [4,5]. In these urban settings, high population density and intense anthropogenic pressure make the loss of natural capital critical to public health [6,7,8]. As these areas undergo rapid structural transformations, characterizing their spatial morphology becomes essential for assessing ecosystem conditions and identifying pressure points within the urban–rural gradient. Therefore, the precise mapping of urban morphology is no longer merely a technical task but a fundamental requirement for the development of operational geospatial models. Such models are indispensable for identifying critical pressure points and implementing ecosystem-based strategies that ensure the climate resilience of modern urban environments.
To mitigate these impacts, decisive actions must be taken toward the restoration and resilient management of the natural capital upon which urban societies depend. In recent decades, urban planners and policy-makers have increasingly strived to embed urban green infrastructure (UGI), ecosystem services (ES), and nature-based solutions (NBS) into development processes [9,10,11]. However, a more robust emphasis is required to transform these efforts into the creation of sustainable and “vibrant” cities [12]. The convergence of these three concepts offers a transformative perspective, providing a path toward enhanced urban resilience [13]. Furthermore, ES assessment can serve as a potent policy tool, bridging strategic national and regional guidelines with concrete actions at the municipal level. Establishing a unifying framework that integrates national, regional, and municipal tiers through a consistent spatial foundation would significantly streamline this process [14]. Such a framework, underpinned by the synergy between urban ecosystems, ES and NBS, enables the quantitative measurement of nature-based interventions, thereby ensuring the sustained provision of essential ES [14].
This shift highlights the fundamental need to move from political declarations to territorially grounded decisions. As the ESPON 2030 initiative emphasizes [15], objective territorial data and scientific evidence are paramount to transforming political goals into practical instruments. It is through the synergy of ecosystem-based approaches and advanced geospatial technologies that data-driven decision-making becomes the only viable response to these multifaceted challenges. Ultimately, there is an urgent need to analyze community requirements and support sustainable growth through rigorous spatial analyses. Applications at the municipal levels must be closely aligned with the way municipal environmental administration is organized to meet the specific needs of policy and planning [14].
Geospatial technologies, remote sensing, and Geographic Information Systems (GIS) have become indispensable to contemporary landscape and ecological research, playing a pivotal role in mapping ES and NBS management [16,17]. The strategic importance of UGI in climate-adaptive planning is increasingly recognized, primarily due to its intrinsic potential to deliver regulating ES that mitigate environmental hazards. As emphasized by Di Palma et al. (2024) [18], remote-sensing technologies provide a transformative analytical approach by enabling the transition from traditional 2D mapping to multi-dimensional assessments of UGI, which is essential for capturing the structural attributes that define ES provision. The advances in remote-sensing technologies for mapping and monitoring urban and other ecosystems represent a key opportunity to deepen the ecological features of existing green areas as a potential planning asset to respond to climate impacts [18]. They implement a new data-driven planning approach that enables models and simulations of different project scenarios by supporting planning decisions and reducing the risk of failure [18].
There are now established methodologies and sufficient examples of mapping urban morphology (pervious and impervious areas), UGI, and ES, using both remote-sensing technologies and high-resolution airborne imagery [19,20,21,22,23,24,25,26,27,28,29]. A variety of methods are used, including the normalized difference vegetation index (NDVI), extracted from high-resolution airborne imagery (0.20 m), with a combination of Digital Elevation Models (DEMs) [23,30]. According to the data used, useful statistics are gained like the percentage of pervious surfaces by land-cover units or classification of vegetation [23]. A recent systematic review of geospatial methods highlights that despite the increasing use of remote sensing, there is still a critical need for integrated, multi-source approaches to overcome data inconsistencies and accurately map the diverse services provided by urban ecosystems [16].
Recent practical applications of geospatial technologies demonstrate the potential of 3D digital twins to provide accurate data on ecosystem structures and functions [31]. The example of Nottingham [31] shows how combining detailed spatial data with policies for a net increase in biodiversity facilitates communication among stakeholders and ensures the integration of NBS into the urban fabric.
By default, ecosystems as a spatial unit for assessing ecological units differ from the traditional planning units used in territorial planning. This is precisely what lies at the heart of one of the major challenges in the practical application of concepts for mapping and assessing ES. Launched in 2013, the Working Group on Mapping and Assessment of Ecosystems and their Services (MAES) initiative has developed a standardized methodology that bridges ecosystem conditions with human well-being through a selection of specific indicators. By 2016, this framework was further refined to provide a comprehensive assessment of pressures and trends across European ecosystems, based on integrated environmental datasets [6,32,33,34,35]. Building upon this foundation, the most recent advancements focus on establishing a “minimum set” of spatially explicit ecosystem condition indicators, as detailed in the SELINA project [36], which derives these metrics from a comprehensive review of diverse data sources and expert-driven surveys across various ecosystem types [37,38].
The study is being conducted in response to the recommendations of the MAES for real-world examples and applications of how the conceptual framework for mapping and assessing ES can be applied at the urban and peri-urban scale. At the same time, the so-called “thematic urban pilot” [6,35] identifies future challenges in this field, as well as certain gaps in the research: a lack of consistency at the European level regarding the collection of detailed spatial data and reporting units necessary for analyzing pressures and the condition of urban ecosystems, such as concentrations of air pollutants, the capacity of vegetation to remove pollutants, monitoring of protected areas and zones within the boundaries of the Functional Urban Areas (FUAs), urban biodiversity, monitoring of green systems in cities, etc. According to the MAES framework, the ecosystem typology is derived through the spatial integration (cross-tabulation) of land-cover classes and habitat types [32]. While the updated EUNIS framework provides better insights into man-made vegetated habitats, it has yet to offer a comprehensive solution for capturing the complex spatial and structural diversity of dense urban fabrics. This challenge necessitates the integration of advanced geospatial technologies and high-resolution mapping techniques to accurately characterize these complex urban structures for ecosystem assessment purposes [39]. At the national level, the Methodology for Assessing and Mapping the Condition of Urban Ecosystems and Their Services in Bulgaria [40] provides essential strategic guidelines; however, local-scale applications demonstrate a critical need for greater specificity. This underscores the necessity of aligning administrative boundaries, where planning and management occur, with the functional boundaries of ecosystems to ensure evidence-based decision-making.
This research bridges critical methodological gaps highlighted by the need to enhance the ecological assessment of green areas for climate adaptation [18] and to resolve data inconsistencies via multi-source integration [16]. By addressing the lack of European-wide consistency in high-resolution ecosystem monitoring datasets [6,35], this study aims to propose a methodology for comprehensive geospatial mapping of urban and peri-urban morphology, drawing on the indicators for ecosystem condition and pressure recommended by the MAES framework and reflecting their trends. The FUA of Burgas, Bulgaria, has been selected as a case study. The research objectives outlined in the study include (1) spatial heterogeneity mapping of urban and peri-urban morphology at a multi-scale level, identifying the structure and functions of ecosystems, and (2) accounting for the current condition and trends of ecosystems, including exposure to current anthropogenic pressures through selected condition and pressure indicators. The results provide policy-makers and stakeholders with critical insights into current pressures and environmental changes in urban and peri-urban ecosystems, offering a robust foundation for evidence-based management and climate change adaptation strategies.

2. Materials and Methods

2.1. Integrated Multiscale Mapping Framework

The inherent heterogeneity of urban environments imposes stringent requirements for high-resolution spatial data, particularly regarding quantitative modeling and aggregation. A recent systematic review of quantitative indicators of urban morphology related to sustainability [41] encourages future studies to seek and use updated high-resolution datasets for investigating sustainable urban morphological studies at different spatial scales and geographic locations globally.
The research is aligned with the recommendations of the working group on MAES for real-world examples and applications of how the conceptual framework for mapping and assessing ES can be applied at the urban scale. The methodological approach operationalizes the MAES conceptual framework for mapping and assessing urban ecosystem services (by evaluating the ecosystem condition and pressure [34]) and serves as a basis for future research on the MAES recommendations to use the results for GI regional planning and NBS design to support policy-making. Furthermore, the study adheres to the “System of Environmental-Economic Accounting—Ecosystem Accounting (SEEA-EA)” [42] guidelines for delineating spatial ecosystem units. These units are defined based on ecological principles that integrate biotic and abiotic components from diverse spatial sources, ensuring reliability and cross-regional comparability [42].
This research builds upon the national “TUNESinURB” project [43], the initial methodology at the national level, and the one currently under development, the Methodology for Assessment and Mapping of the Condition of Urban Ecosystems and Their Services on the Territory of the Natura 2000 Ecological Network in Bulgaria [40,44]. It enhances the established framework by incorporating high-resolution databases and multi-temporal pressure assessments. The integrated approach enables multi-scale analysis at the regional and local level and integrates ecosystem structures and functions.
This methodology captures the spatial heterogeneity of complex urban socio-ecological systems [4,5], aiming to optimize urban planning and management. At the regional level, ecosystems within the FUA are identified through the national land-use/land-cover database (geographical coverage of the specialized layers of the agricultural parcel identification system for physical blocks) [45]. Conversely, at the local level within the city of Burgas, urban morphology is classified using the LCZ framework [46]. This classification is refined through high-resolution unmanned aerial vehicle (UAV) orthophotos, providing the precise spatial data required for a detailed assessment of the balance between pervious and impervious surfaces within each LCZ. Furthermore, by integrating Google Earth Engine (GEE) data [47], relevant ecosystem condition and pressure indicators are assessed.
As cities are inherently dependent on their surroundings for provisioning, regulatory, and cultural ES flows, it is essential to examine these relationships along the rural–urban gradient. Leading research [48,49] and the methodological recommendations of the fourth and fifth MAES reports [6,34] emphasize the FUA as the optimal scale for unbiased city performance comparison. In this study, analyzing the urbanized space of Burgas from a regional perspective treats the peri-urban system as a critical buffer zone that maintains optimal ecosystem conditions and serves as a vital resource for sustainable territorial use.
The spatial unit for mapping at the regional level is based on the integration of ecosystem types with physical block classes [45], following previous national methodologies [43,50]. Urban ecosystem types are assessed at Level 3 of the MAES typology to provide the granularity needed for the primary study focus. In contrast, the remaining ecosystem types within the commuting zone are assessed at Level 2 to preserve their functional homogeneity as landscape units.
For an integrated analysis of urban areas, the climate classification methodology for urban territories developed by Stewart and Oke (2012) [46]—LCZs—has been selected. In this regard, LCZs serve as a unified working framework for conducting territorial assessments based on the following grounds:
  • Morphological integrity: LCZs reflect specific spatial combinations of built-up density and land-cover types [46].
  • Climate relevance: They determine key thermal patterns, including the Urban Heat Island (UHI) effect and surface air quality [51,52,53].
  • Sustainability framework: The objectivity of the LCZ framework facilitates its use as a tool for climate-responsive urban planning [54].
  • Methodological consistency: LCZs have been established as primary units for urban ecosystem typology within the Bulgarian national methodology [40,55].
The LCZ classification methodology has been successfully implemented across diverse urban environments, gradually establishing itself as a leading framework for urban morphological and ecological studies [51,56]. The system categorizes urban and peri-urban landscapes into 17 standardized classes, defined through the synergistic interaction of built-up structures and land-cover properties that regulate air and surface temperatures [46]. Specifically, the classification distinguishes between ten “built types” (LCZ 1 to 10) and seven “land-cover types” (LCZ A to G), providing a comprehensive matrix for geospatial analysis [46].
To address the potential classification overlap between built-type and natural-type (land cover) ecosystems such as LCZ 5 (open mid-rise) and LCZ 6 (open low-rise), this study establishes a clear methodological priority rule based on anthropogenic modulation and 3D aerodynamic roughness. Although these units mathematically intersect with the biophysical criteria for forest or scattered trees (MAES class tree-covered areas), they are systematically retained within the urban ecosystem category (MAES Class J). This decision is justified by the fact that the spatial matrix is fundamentally governed by built structures, which act as the primary drivers of localized environmental processes.
Furthermore, the integration of building height as a structural proxy is critical; the vertical complexity of mid- and low-rise architectures alters the surface roughness length, thereby modulating wind profiles, mechanical turbulence, and vertical heat fluxes. Consequently, even under a dominant vegetation canopy, the underlying urban morphology significantly deforms the aerodynamic boundary layer, accelerating or decelerating microclimatic and hydrological processes (such as runoff concentration and heat island formation) in a manner distinct from natural forests. Therefore, anthropogenic infrastructure is treated as the primary sorting criterion, while high-density vegetation within these zones is modeled as an internal regulatory component providing critical ES rather than defining an independent natural ecosystem entity.
Building on extensive research projects conducted in Burgas since 2021, the current methodological approach leverages advanced geospatial technologies and remote sensing. Previous studies have addressed critical urban challenges, such as the detailed mapping of the UHI [52] and the identification of strategic sites for green infrastructure interventions to mitigate secondary dust emissions [53]. This study advances the existing body of work by integrating new high-resolution statistical data on natural elements within the LCZ framework, effectively incorporating biophysical parameters into the LCZ structure as proposed by Bartesaghi-Koc et al. (2019) [57].

2.2. Study Area

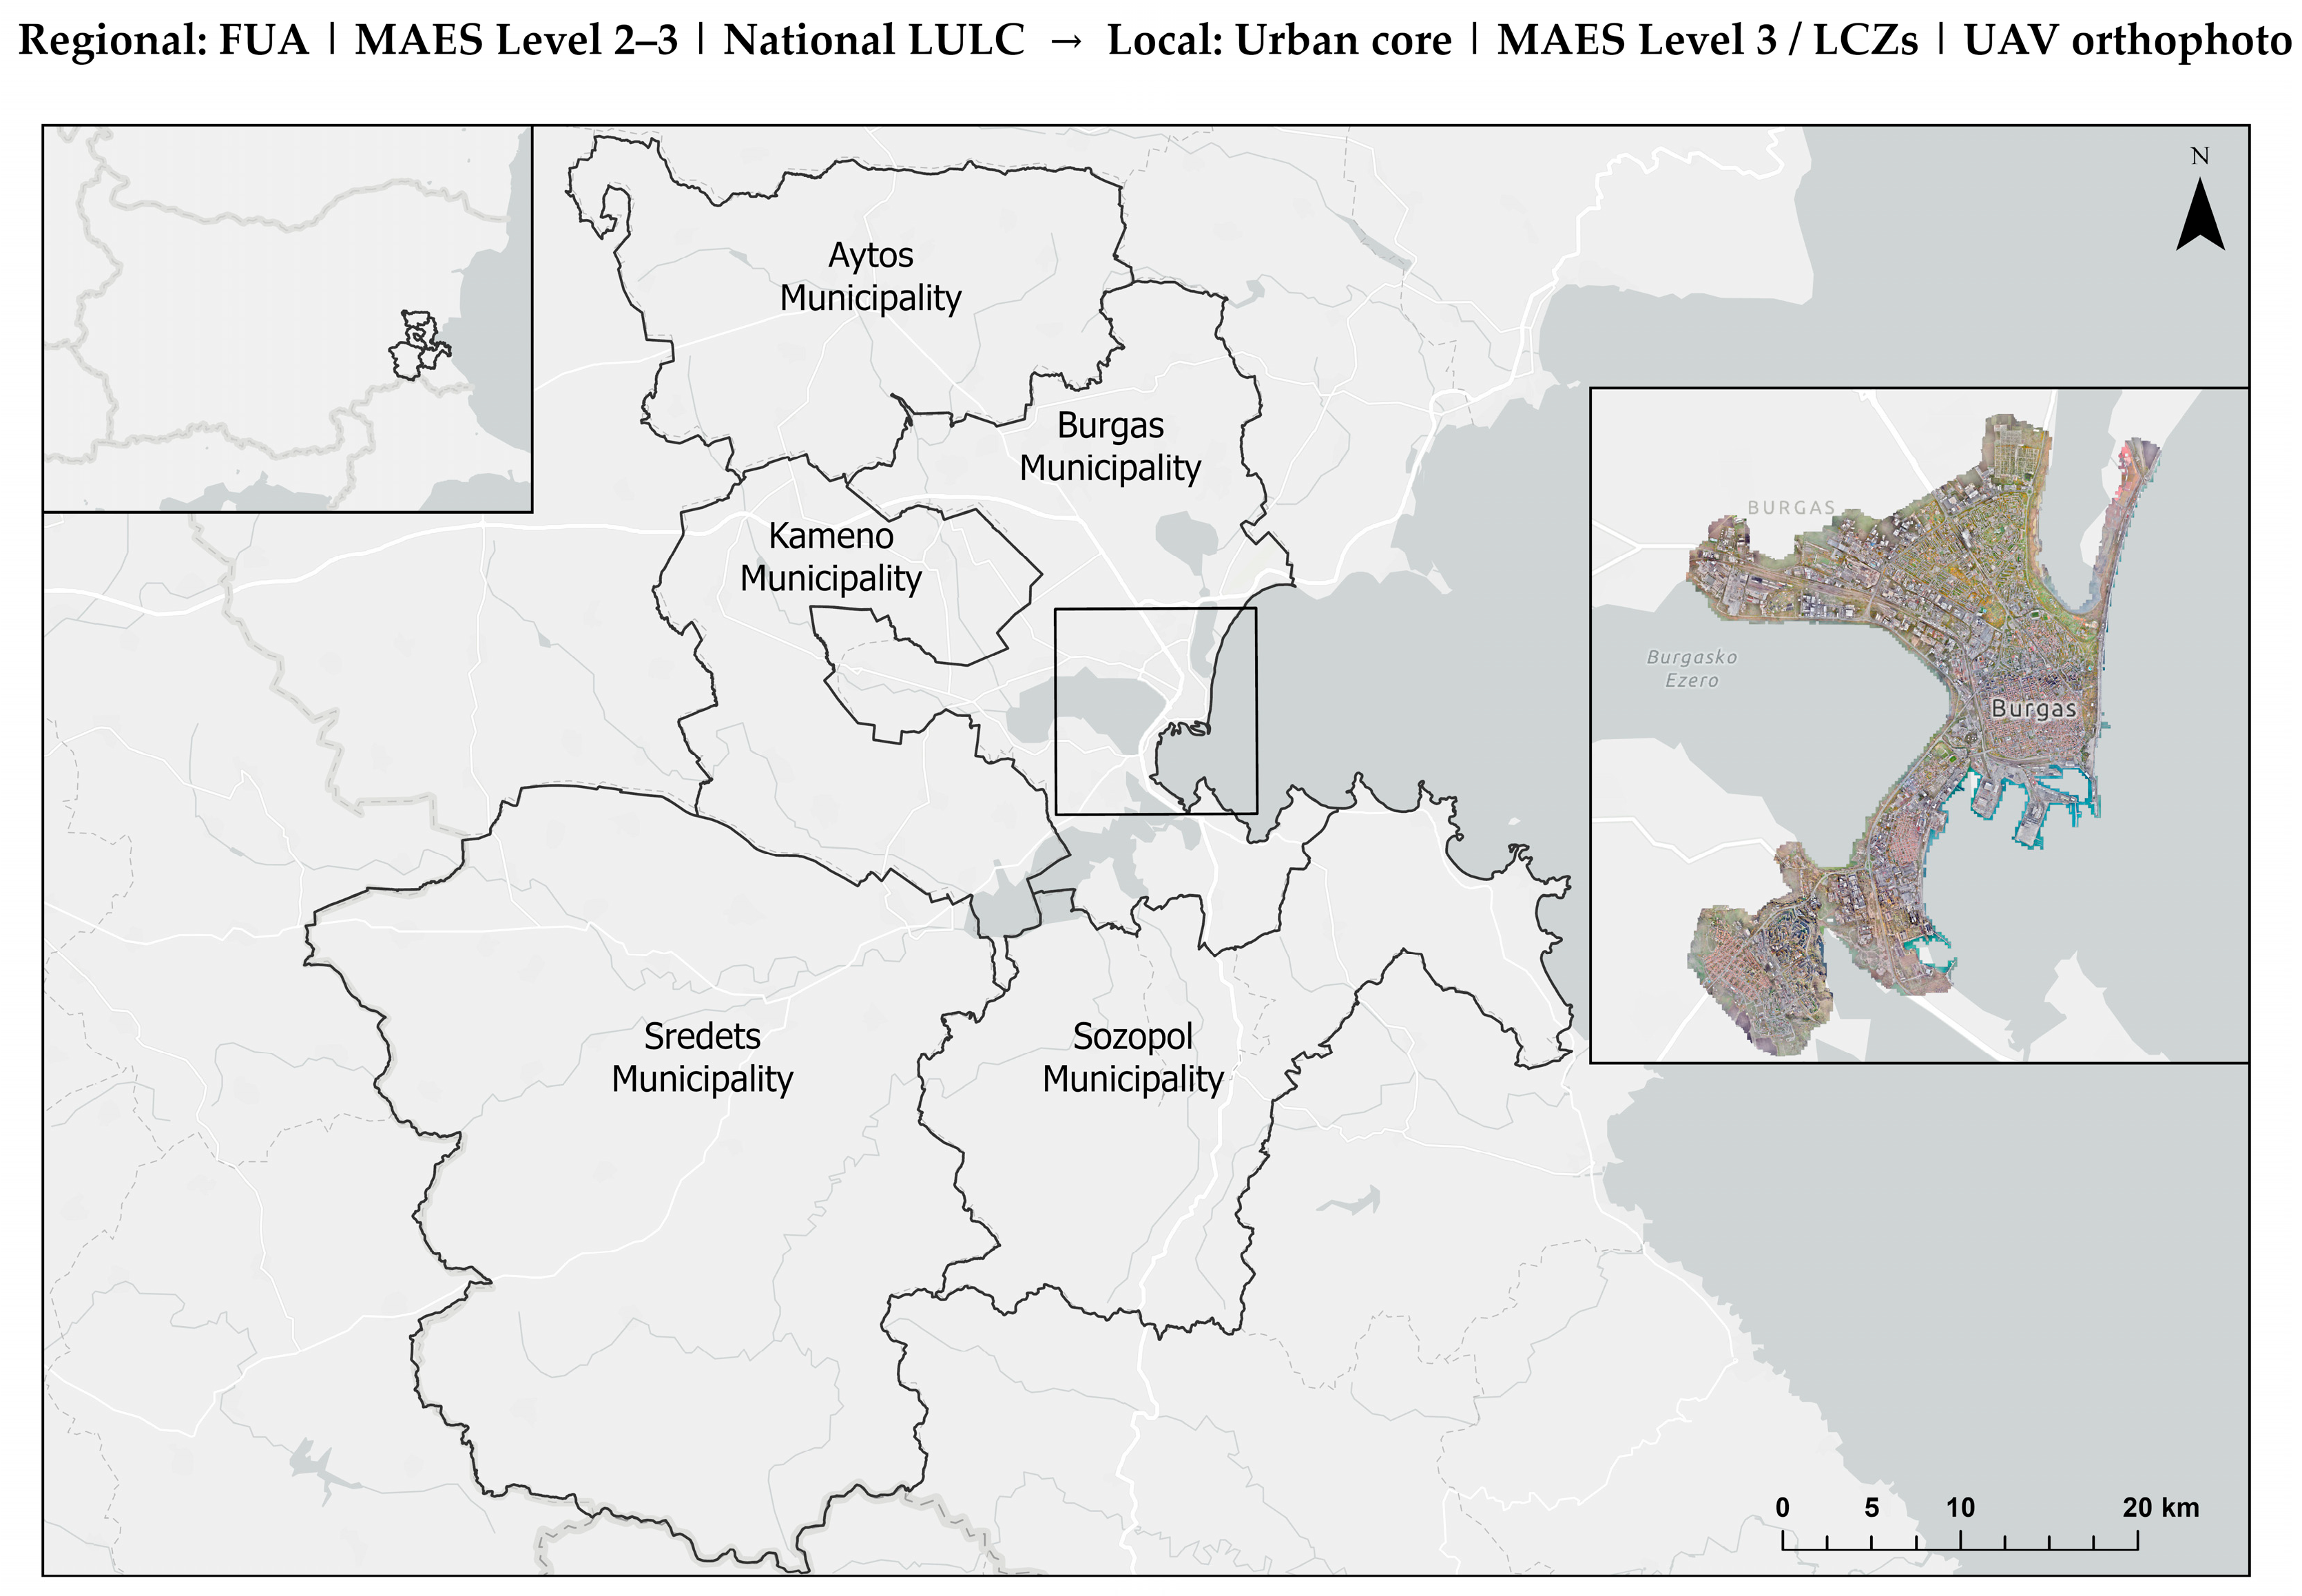
The FUA-Burgas covers five municipalities with a total extent of 2947 km2, representing 3.8% of Bulgaria’s national territory. It is the second-largest urban functional area in the country by size and the fourth by population [58]. The core city, Burgas, ranks second in area only to the capital, Sofia, reflecting a significant trend of spatial expansion and peri-urbanization in recent decades (Figure 1).
The region is characterized by a uniquely complex urban morphology and geographical settings. High-density residential, industrial, and public zones are interspersed within a sensitive ecological system comprising coastal lagoons, estuaries, and wetlands, situated along the western coast of the Black Sea (Burgas Bay). This fragmented spatial structure, primarily dictated by large water bodies, has historically shaped the settlement network and socio-economic development. The strategic maritime location, providing direct access to international transport corridors, offers a major comparative advantage, influencing both the functional–economic and spatial evolution of the municipality [59].
In response to climate change challenges, Burgas has positioned itself as a leading Bulgarian innovation hub. Long-term climate scenarios [59] indicate that the Mediterranean-influenced climate of the region poses increasing risks of persistent droughts, wildfires, and flash floods. To mitigate these threats, the municipality has actively engaged in European and national projects for GI, urban regeneration, and climate resilience. By integrating smart city solutions and NBS, Burgas serves as a primary case study for evaluating the effectiveness of integrated geospatial frameworks in achieving climate neutrality and sustainable urban growth [60].

2.3. Indicators and Data Sources

Healthy ecosystems provide vital services that enhance urban resilience and societal well-being. By regulating microclimates and reducing air pollution, functioning ecosystems mitigate heat island effects and flood risks while delivering significant health benefits, such as lower mortality and respiratory disease rates. Furthermore, high-quality green spaces improve urban quality of life by fostering social integration, safety, and cultural enrichment [61,62,63].
Sustainable change depends on two interacting components: the environmental variable, representing the potential of ecosystems and NBS to provide services, and the human variable, determining their actual utilization to address societal challenges. A reliable analysis must integrate both dimensions, as focusing solely on quantitative biophysical metrics can result in misleading policy recommendations [14].
The current guidelines adhere to the fundamental definitions of the fifth MAES report, where ecosystem condition is defined as the physical, chemical, and biological state or quality of an ecosystem at a specific point in time, and pressure refers to human-induced processes that alter this state [32]. Furthermore, the 2020 MAES report emphasizes the necessity of monitoring condition trends and mitigating factors that directly or indirectly influence them. Such assessments must reflect changes in pressure intensity over time, requiring the establishment of baseline values to serve as reference points for trend identification [35]. Within this framework, a ten-year trend (e.g., 2015–2025) is classified as short-term, while long-term trends extend back to 2000 or earlier, depending on data availability. In instances where historical baselines are absent, initial values or thresholds are defined to facilitate the determination of current trends [35]. The rigorous selection of indicators and expert interpretation of derivative information are thus essential for supporting the restoration and expansion of green spaces—a core objective of the EU Biodiversity Strategy for 2030 [35].
Ecosystem structures vary significantly between urban centers and their surrounding commuting zones, making the selection of an appropriate spatial dataset crucial for boundary identification. While the Copernicus Urban Atlas database [64] is a standard for European-level urban ecosystem studies [6,65], this study utilizes national databases—physical blocks [41] and the Cadastre [66]—to achieve higher accuracy and timeliness. Specifically, the Cadastre was selected as the primary source for delineating urban boundaries due to its superior spatial granularity and high geometric and thematic precision. Furthermore, integrating cadastral data with physical blocks enables semi-automated mapping by aligning their respective nomenclatures with standardized ecosystem types and subtypes.
Early MAES assessments often integrated condition and pressure indicators; however, their recent conceptual separation marks a significant methodological refinement. This shift aligns with current efforts by working groups, such as the SELINA project, to establish a streamlined set of core indicators, facilitating more practical and accessible ecosystem assessments for stakeholders and policy-makers [67].
These regulatory and methodological frameworks provide the necessary baseline for operationalizing ecosystem mapping and assessment. By defining minimum criteria for “good ecosystem condition,” they translate the high-level ambitions of European biodiversity policies into a standardized technical approach for measuring ecosystem capacity and service provision [35].
To identify ecosystem structure and track multi-temporal pressure trends, this study defines a comprehensive set of condition and pressure indicators (Table 1). By utilizing diverse variables and composite indices, the framework provides an unambiguous assessment of ecosystem components while identifying critical pressures and their impact on the capacity to deliver essential services. These indicators are specifically aligned with threats inherent to urban development, reflecting their influence on abiotic parameters, biodiversity, and landscape structural characteristics. Ultimately, this indicator set serves as a strategic tool for stakeholders to clarify the causal links between environmental pressures and policy responses, guiding adaptive management and monitoring the effectiveness of sustainable urban development policies [34,37,38].
To ensure rigorous adherence to the principles of validity and reliability while achieving a high-precision characterization of urban and peri-urban morphology, this methodology prioritizes remote-sensing variables and long-term analytical processing via the Google Earth Engine (GEE) platform and the Dynamic World (DW) V1 global land-cover dataset [47]. The selection of this framework is based on two key strategic advantages:
  • Global coverage and scalability: It provides comprehensive geospatial coverage, ensuring that the assessment framework remains consistent across diverse geographical contexts.
  • Temporal consistency and comparability: As a unique source of harmonized, long-term data series, it enables the analysis of ecosystem changes over time. This directly addresses the recommendations of Maes et al. (2020) [35] for multi-temporal assessments in ecosystem monitoring [28].
DW provides a high-resolution, near-real-time global land-use and land-cover product, derived from 10 m Sentinel-2 imagery through a deep learning modeling approach. This dataset was specifically selected for its superior spatial resolution and its capacity to resolve fine-grained land-use processes such as settlement boundary shifts and small-scale vegetation changes, which are typically obscured in coarser annual land-cover products. The technical validation of the DW model demonstrates high global consistency, achieving approximately 73.8% agreement with expert consensus annotations [68]. This level of accuracy provides a robust foundation for identifying critical pressure points within the urban–rural gradient of the FUA-Burgas.
The methodological framework deviates from single-date acquisition in favor of a temporal probability averaging approach, generating composite images for 2018 and 2025. This seven-year scope was established using 2018 as the earliest available baseline for high-resolution DW data. Although the MAES framework [35] ideally suggests a 2010 starting point for short-term trends, this study utilizes the earliest harmonized satellite series to ensure maximum geometric consistency, effectively approximating the recommended decadal monitoring interval. By calculating the arithmetic mean of individual probability bands during the peak growing season (June to August), the impact of phenological noise (intra-seasonal variability due to short-term meteorological fluctuations or seasonal shifts) is effectively minimized. This period represents the phenological maximum, during which the trees are clearly distinguishable from other classes. Furthermore, seasonal averaging filters out transient artifacts, such as cloud shadows or atmospheric haze, which frequently compromise the integrity of single-timestamp classifications.
Technical processing was conducted within the GEE environment, leveraging cloud-computing capabilities to manage the extensive Sentinel-2 archive. Rather than applying static probability thresholds, which often result in no-data gaps within the raster grid, this study implemented relative dominance classification logic. In this approach, each pixel is assigned to the class with the highest mean probability derived from the temporal composite. This ensures a continuous, gap-free raster surface, which is essential for accurate area balance calculations and subsequent data utilization. The finalized datasets for 2018 and 2025 were exported in GeoTIFF format, projected to the UTM Zone 35N EPSG:32635 coordinate system.
The indicators selected for this study are synthesized in Table 1. Given the primary research focus, urban indicators are assigned higher thematic granularity to capture the complex anthropogenic pressures within the urban–rural gradient. Each indicator is scored on a 5-point scale (1–5) aligned with national methodology [40,44], where 1 signifies the highest pressure (worst condition) and 5 represents the lowest pressure (best condition). Classification methods tailored to the specific statistical distribution of each indicator are applied.
Urban ecosystem condition is assessed through vegetation cover and spatial structure, the latter being defined by the LCZ framework to account for regulatory service drivers [6,32,46]. Spatial structure serves as a proxy for ecosystem quality within the national methodological framework [40,55]. The spatial structure was assessed utilizing the land-cover mosaics as a primary indicator. By analyzing the interaction between the majority land-cover class and the internal patch richness (based on the diversity count of distinct land-cover classes), the model evaluates the qualitative state of each urban ecosystem subtype. Within this framework, a higher diversity count within urban-dominated units signifies an improved condition due to the integration of natural elements, whereas in natural-dominated units, the same metric indicates habitat fragmentation and structural degradation.
Vegetation cover is a critical condition indicator for urban areas, directly influencing regulatory functions such as microclimate cooling and air purification [69]. To evaluate it, the DW raster datasets were initially subjected to reclassification within the ArcGIS Pro 3.3.0 environment. The procedure involved a reclassification process—aggregating trees, grass, shrubs, and scrub into a single class, assigned a value of 1, while all other land-cover categories were reclassified to 0. To ensure high-precision data extraction for small-scale ecosystem zones, the rasters were resampled from 10 m to 2 m resolution. This downsampling step was implemented strictly as a technical optimization to align the raster grids with highly fragmented vector geometries. This refinement prevents area miscalculations along narrow borders, such as roads and rivers, during zonal statistical extractions:
C o n d i t i o n v e g = P e r c 2025
where Conditionveg represents the vegetation cover index and Perc2025 denotes the vegetation percentage for the year 2025.
Tree cover change (TCC) serves as a direct pressure indicator, reflecting the loss of regulatory service provision over time. The procedure involved a similar reclassification process—aggregating trees into a single class and resampling them to a 2 m resolution. The first stage of the analysis involved calculating the absolute spatial magnitude of change S:
S = P e r c 2025 P e r c 2018 100 × A r e a t o t a l
where S represents the physical area change expressed in hectares, Perc2025 is the percentage tree cover for the year 2025, Perc2018 is the percentage tree cover for the same land-cover type for the baseline year 2018, and Areatotal is the total area of each ecosystem type.
To quantify the magnitude of impact, a pressure index was developed:
P I t r e e = min 0 , S S m a x _ l o s s
where PItree is the pressure index used to quantify the magnitude of impact from tree cover loss, normalized within a range of 0 to 1, min (0, S) is the function used to isolate negative values, which represent ecosystem losses, and Smax_loss is the maximum observed loss within each ecosystem, used for scaling the index to ensure comparability.
The majority of the selected pressure indicators for all ecosystems focus on land conversion and habitat degradation. From this perspective, LULC changes reflect the overexploitation of natural resources, primarily manifested through the conversion of green spaces into impervious (gray) surfaces.
The soil sealing indicator monitors the anthropogenic transformation of natural landscapes into impervious surfaces. Following the same reclassification and resampling procedures as described for the previous indicators, specifically isolating the built-area class, the pressure index was calculated as follows:
P I s o i l = max 0 , S S m a x _ i n c
where PIsoil is the pressure index for soil sealing, which monitors the anthropogenic transformation of natural landscapes into impervious surfaces, max (0, S) is the function used to isolate instances of built-up area expansion, where values below zero are assigned a pressure score of 0, indicating a lack of active sealing pressure, and Smax_inc is the maximum recorded increase against which the expansion instances are normalized.
Structural landscape changes in LULC were identified using the compute change raster tool, applied to the same multitemporal DW dataset. This method enables simultaneous quantification of the percentage of changed areas and identification of the dominant transition type for each zone. It can effectively highlight the transitions from natural to urbanized covers that carry the greatest spatial weight.
Effective mesh density (Seff) measures the degree to which landscape connectivity is disrupted by fragmentation geometry. This geometry is defined by impervious surfaces and transport infrastructure, including medium-to-high capacity road networks. Higher Seff values indicate increased landscape partitioning and, consequently, greater fragmentation [70]. Following the European-level assessment methodology [71], this study identifies primary and secondary anthropogenic fragmentation elements within the FUA-Burgas. Technical implementation utilized road and railway network data from OpenStreetMap and impervious surface layers from the DW dataset to generate composite fragmentation geometry. This layer was erased within the ecosystem map to calculate the effective mesh size (Meff) and subsequent Seff. Finally, the Seff values were reclassified into the 5-point pressure scale to identify critical disruptions in ecological connectivity.
To assess the effect of pressure on air quality, high-resolution 1 km fine PM2.5 data were utilized, pre-processed, and extracted via the GEE platform:
Δ P M 2.5 = P M 2.5 \ 2022 P M 2.5 \ 2018
where Δ PM2.5 reflects the shift in annual mean concentrations of PM2.5, based on gapless datasets generated through advanced machine learning models [72], PM2.5\2022 is the annual mean concentration of PM2.5 recorded for the year 2022, and PM2.5\2018 is the annual mean concentration of PM2.5 recorded for the year 2018.
As a final step, an ecosystem pressure index (IPr) is utilized [44], calculated as the ratio of the sum of the minimum possible scores to the sum of the actual assigned scores for all indicators:
I P r = n i m i n n i
where Σ ni represents the sum of the scores assigned to the pressure indicators and Σ ni(min) denotes the sum of the minimum possible scores for the same set of indicators.
Specifically for urban ecosystem subtypes, an Urban Ecosystem Performance Index (UEIP) is utilized:
U E P I = C i m i n + P i m i n C i + P i
where C i is the sum of the actual condition scores assigned to the specific urban ecosystem subtype, P i is the sum of the actual pressure scores assigned to the same feature, and C i m i n and P i m i n denote the sums of the minimum possible scores (representing the worst condition and maximum pressure, respectively)—used as a reference to identify the most severe cumulative stress.
While national methodologies in Bulgaria typically evaluate condition and pressure independently [40,44], this study integrates both dimensions into a single aggregated index, following the recommendations of Maes et al. (2020) [35] to merge these metrics for mapping ecosystem change. By combining the lowest condition scores with the highest pressure intensities for each ecosystem type, the framework identifies areas under the most severe cumulative anthropogenic stress. This integrated approach serves the primary research objective: delineating spatial hotspots where environmental degradation and human-induced pressures intersect most critically.
At the local level, the LCZ mapping for Burgas strictly follows the established national methodological framework for LCZ mapping [52,56]. To ensure consistency with regional standards during the initial pilot studies in Burgas city (in 2021), the study area was discretized into a uniform 250 m × 250 m grid, standardizing the spatial units to facilitate robust geostatistical and spatial interpolation [56]. Initial LCZ classification was performed remotely using high-resolution UAV orthophotos (2020), where functional zones were assigned based on the predominant percentage of the building type in each cell and its distinctive combination with the land-cover type within each cell. This was followed by a targeted verification phase: “disputed” cells with ambiguous characteristics were identified and subsequently validated through field observations, ensuring full alignment with national classification criteria.
Building upon previous pilot studies, the framework was further refined in 2024 for UGI interventions [53], resulting in the identification of 14 LCZ types within a standardized 100 m × 100 m grid (1 ha per unit), totaling 3468 cells. While the cells were initially defined using 2022 orthophotos, for the present study, they were further updated with high-resolution UAV orthophotos from 2023. The LCZ framework is also enhanced with parameters reflecting urban ecosystem morphology—specifically natural elements within green and blue infrastructure—which function as primary sources for ES provision (Table 2).
The indicators for the city of Burgas were derived from high-resolution spatial databases provided by the Municipality of Burgas. These datasets, generated through the manual digitization of orthophotos from 2023, provide precise layers for built-up areas and individual tree locations. This municipal database was further enriched and updated with high-resolution classified surface layers derived from a 2023 UAS-based photogrammetric survey using the fixed-wing EbeeX platform (AgEagle Systems, Wichita, KS, USA). A S.O.D.A. A 3D sensor (AgEagle Aerial Systems, Wichita, KS, USA) was employed to gather the high-fidelity RGB data necessary to generate precise 3D urban models. The integration of these datasets ensures exceptional thematic and geometric precision, allowing for a state-of-the-art mapping of the ecosystem structure within the urban core.
The Green-Gray Coefficient (GGC) is adapted from the conceptual framework of Jiang & Menz (2025) [73] to assess how urban configuration affects connectivity and spatial resilience. This indicator evaluates the ratio between pervious (green/blue) and impervious (gray) surfaces, where the “green” component primarily includes vegetation, relevant water bodies, and a small number of cells with predominantly vegetation-free territories such as sandbars and other sandy areas, while the “gray” component encompasses all sealed surfaces and built structures.
The GGC, representing the ratio between pervious and impervious surfaces, is calculated as follows:
G G C = A g r e e n A g r a y
where Agreen denotes the total green (pervious) area and Agray represents the total gray (impervious) area within the LCZs.
High proportions of impervious surfaces act as a primary driver for the resuspension of PM, while simultaneously altering the local thermal and hydrological regimes in ways that favor the trapping of pollutants within the near-ground air layer [53]. Furthermore, soil sealing suppresses the natural self-purification capacity of the urban environment. Consequently, this indicator is assigned the highest weight in the morphological assessment, as it provides a realistic measure of the physical area available for ES provision. By quantifying these surfaces, the model captures the core potential of the urban ecosystems to regulate microclimate and mitigate anthropogenic pressures.
In contrast to impervious surfaces, urban tree cover plays a paramount role in air pollutant reduction, significantly outperforming other vegetation types due to its complex plant morphology [69]. The tree canopy coverage was quantified by integrating individual tree data into the comprehensive green area layer. To convert point data into spatial areas, buffers were applied based on tree height: a 3.6 m radius (approx. 40 m2) for trees exceeding 5 m, and a 2.5 m radius (approx. 20 m2) for those below 5 m. These parameters align with the “Regulation on the Construction, Maintenance, and Protection of the Green System of the Sofia Municipality” [74], ensuring a standardized estimation of canopy area.
The finalized layer of impervious and pervious surfaces was generated by sequentially applying the erase operation to ensure topological integrity. The process followed a hierarchical priority (from bottom to top): green areas → built-up surfaces → tree canopies → buildings (cadastral data). This layering approach effectively resolves spatial overlaps, ensuring that dominant urban structural elements are accurately represented within the final morphology.

3. Results

3.1. Ecosystem Mapping at the Regional Scale

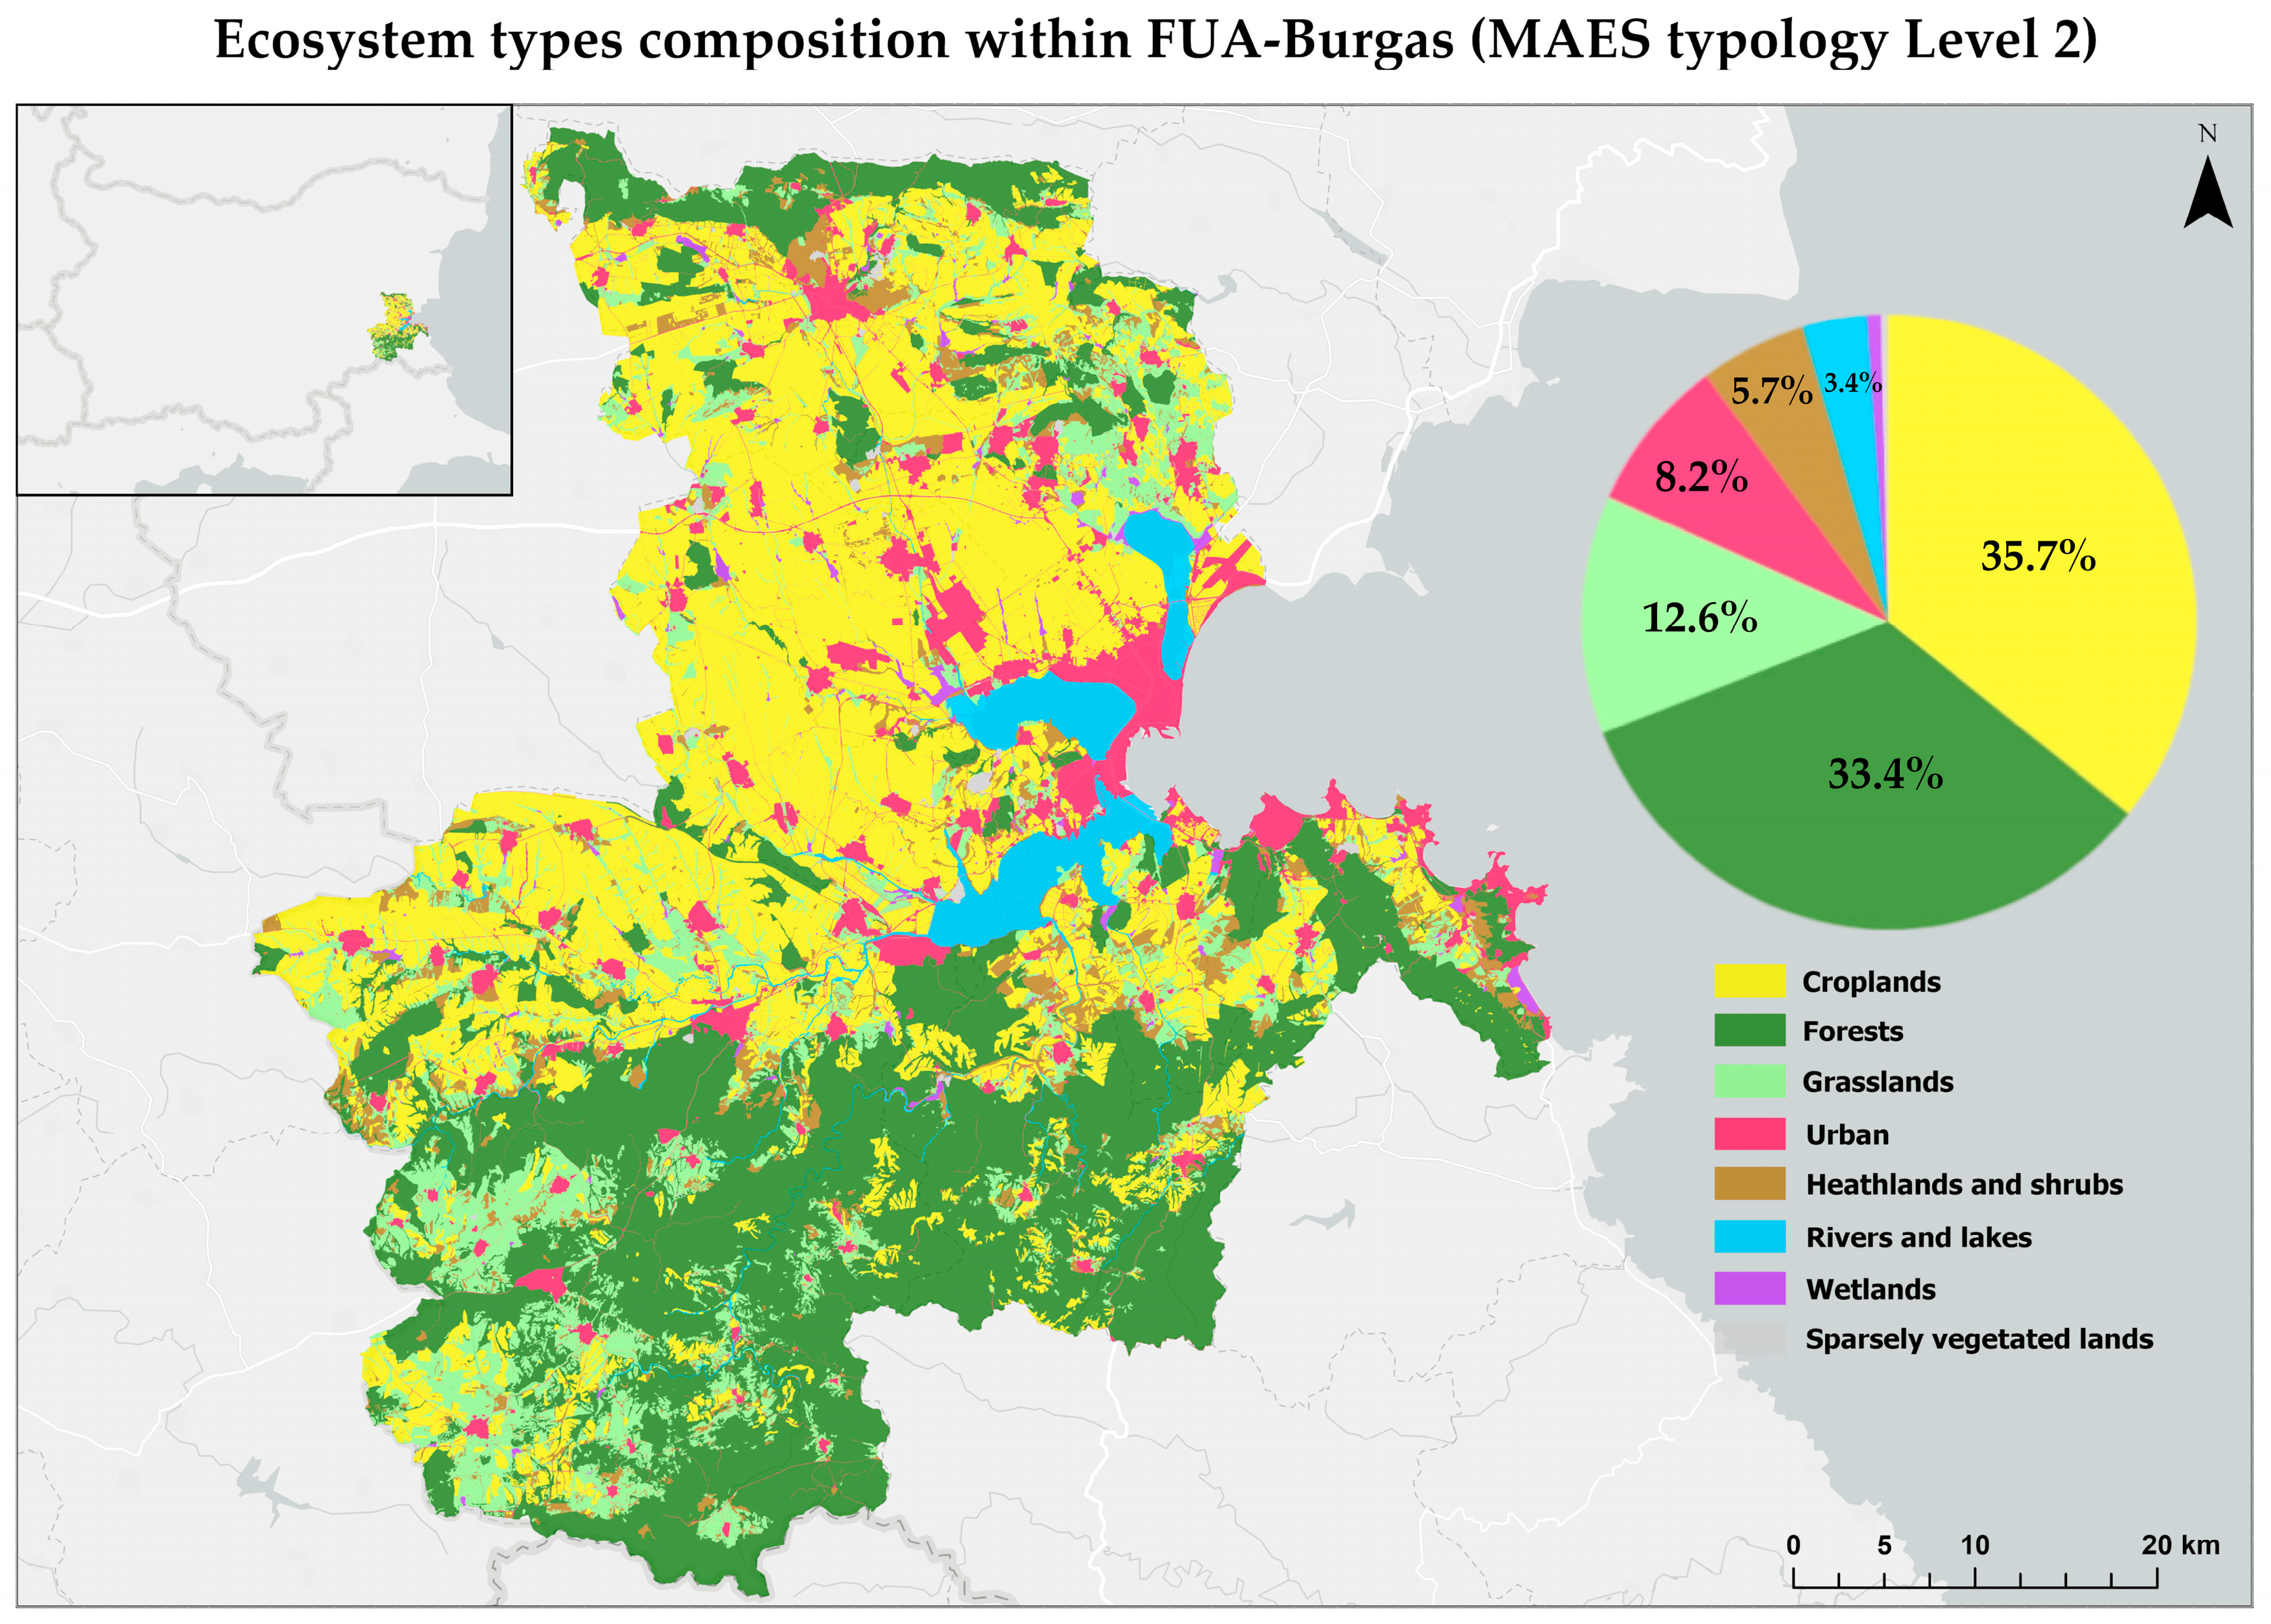
Table 3 present the procedure of aligning the cadastral data and physical blocks with the corresponding MAES ecosystem types and subtypes (Levels 2 and 3) in the FUA-Burgas. To ensure data integrity, all automated outputs were cross-verified. Inconsistencies were particularly frequent in the physical block units, which required a more exhaustive and careful refinement process compared to the cadastral data. Figure 2 shows the Level 2 ecosystem types of the MAES that occur within the boundaries of the FUA-Burgas.The percentage distribution of ecosystem types is also represented in the figure, with the graph showing the ecosystem types that account for the largest share.
The mapping of MAES Level 2 ecosystem types, achieved through the integration of cadastral data and physical blocks, reveals a distinct spatial distribution within the case study area. In accordance with national trends, croplands and forests constitute the largest shares of the regional landscape. However, a defining characteristic of the FUA-Burgas is the exceptionally high proportion of the rivers and lakes ecosystem type, reflecting the region’s unique spatial diversity of coastal lagoons and wetlands. This dominance of inland and coastal waters underscores the regional ecological significance of the territory within the national ecosystem network.

3.2. Local Scale Mapping: Urban Morphology and Local Climate Zones

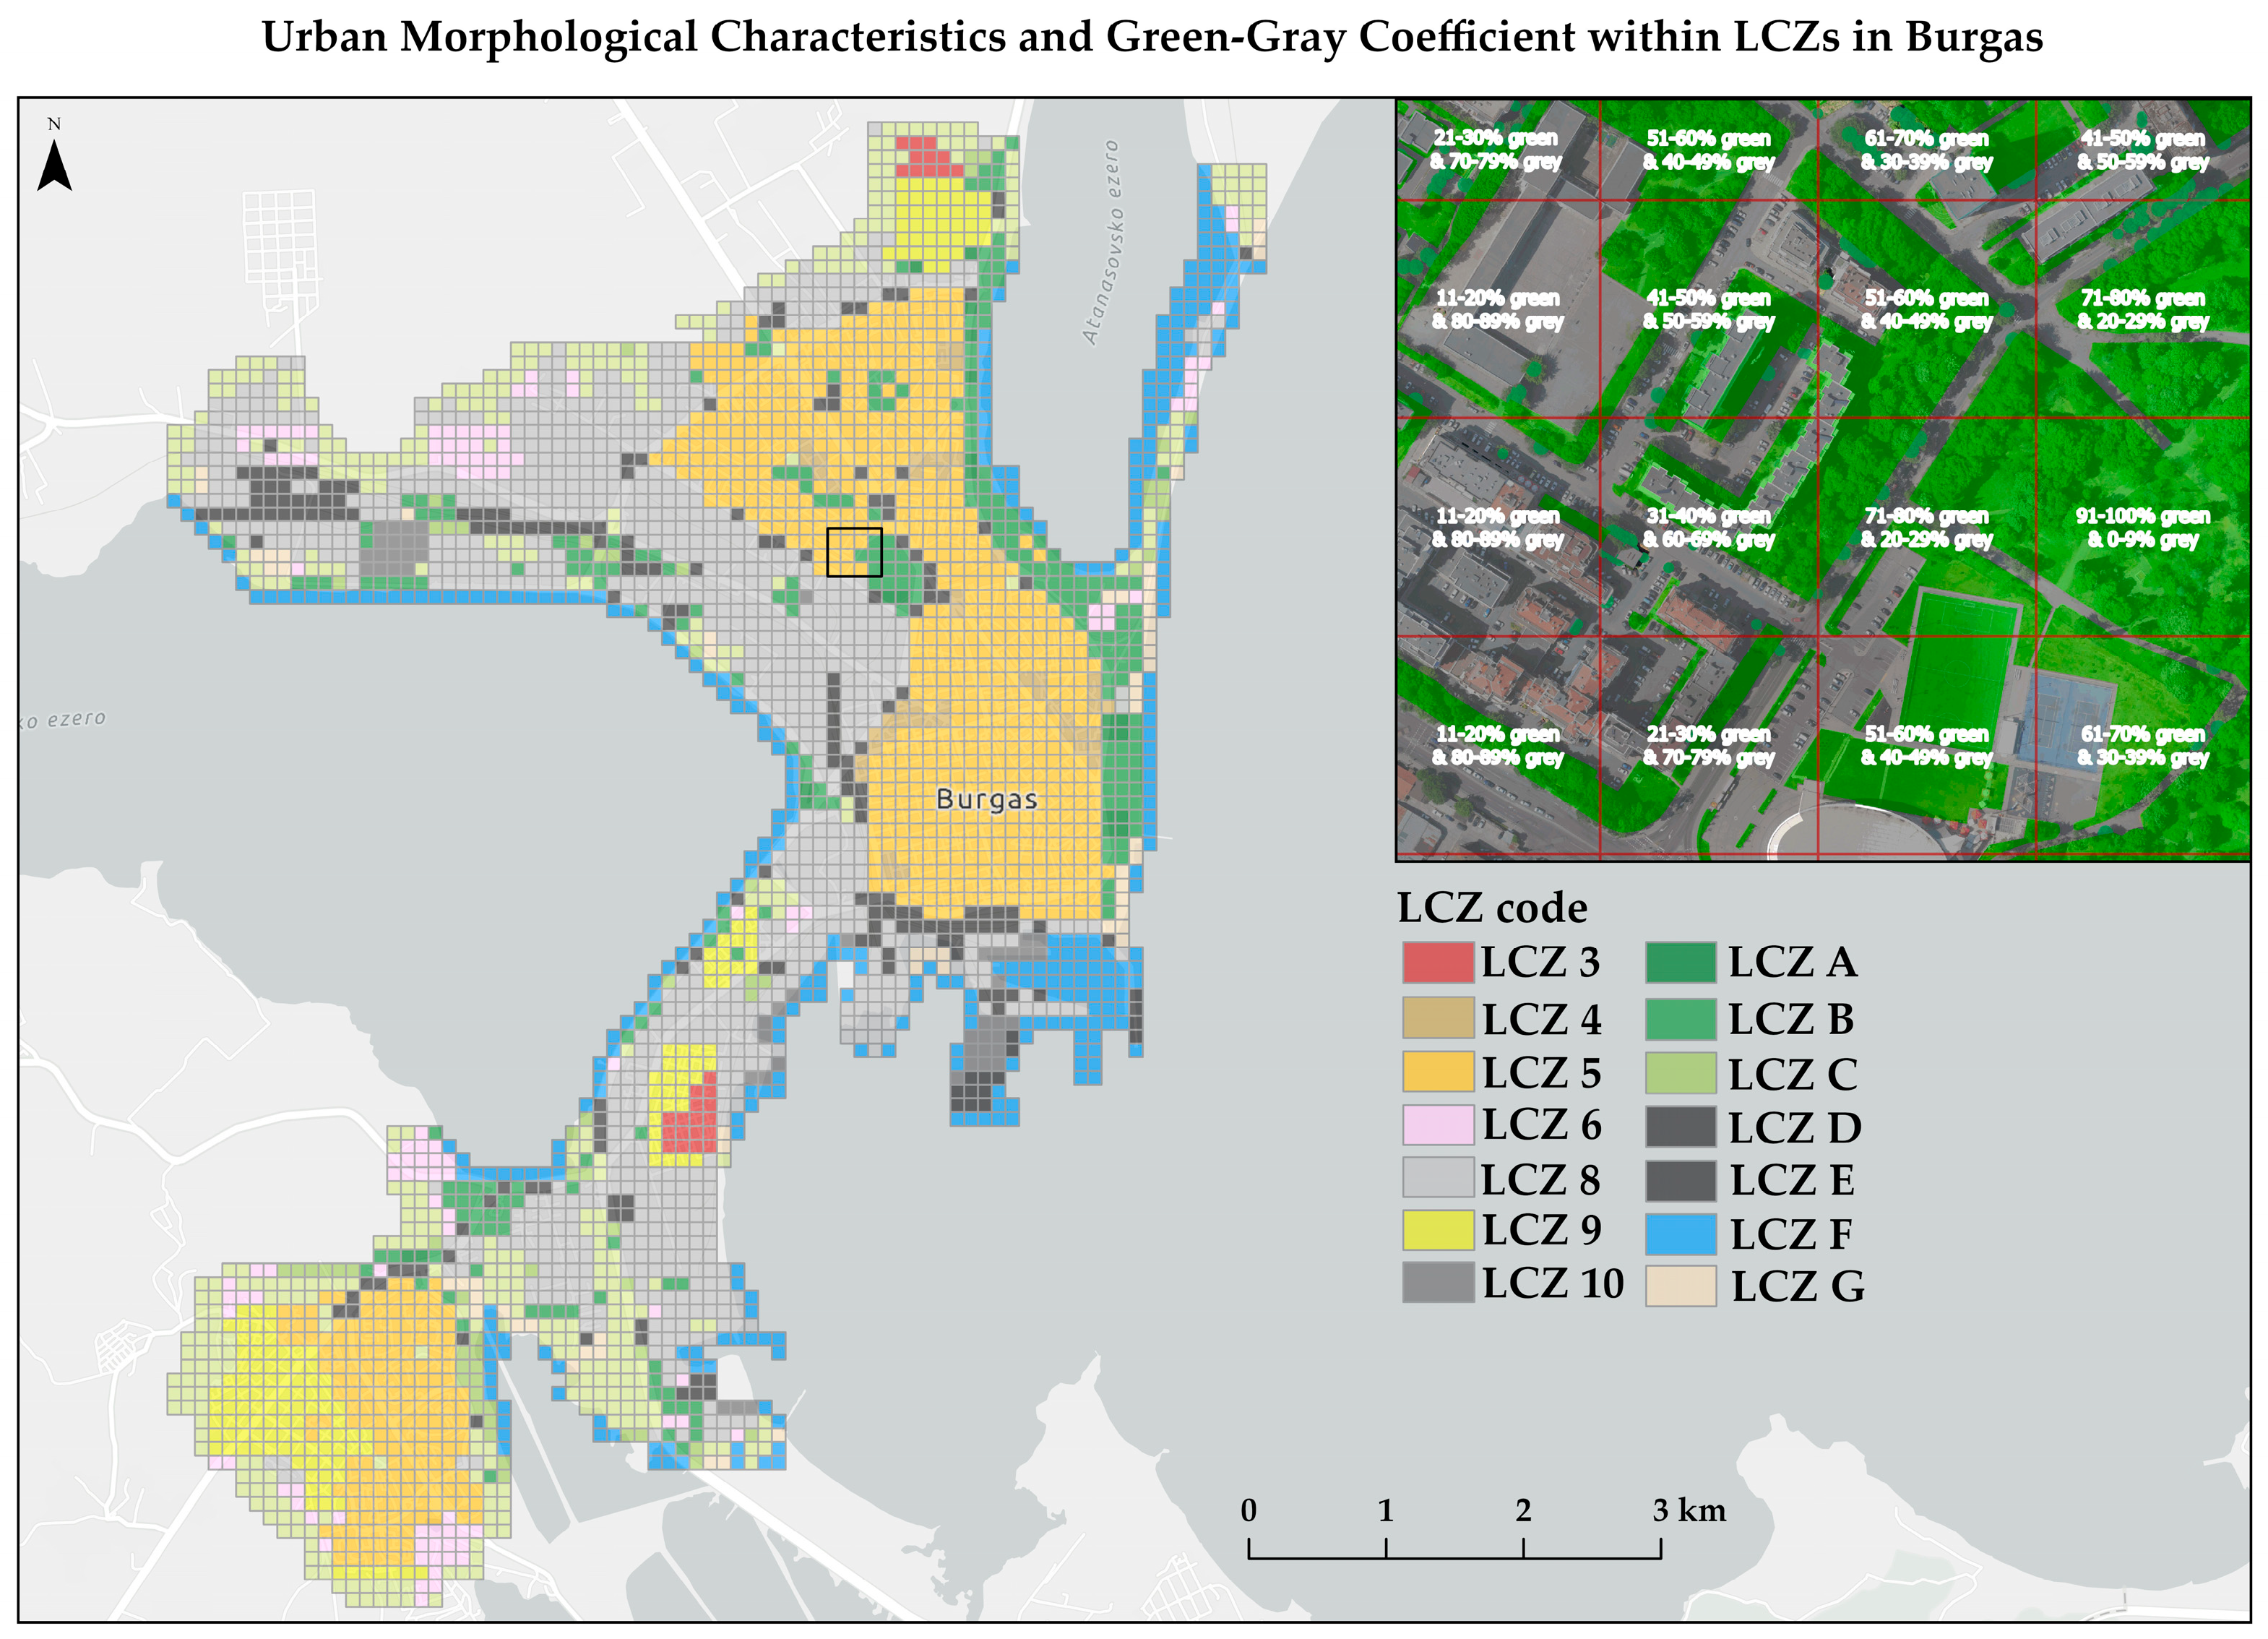
A total of 14 LCZs are identified within Burgas city (Table 4 and Figure 3).
Statistical synthesis of local parameters reveals distinct morphological profiles for the identified LCZs. Residential zones (LCZ 3–6) maintain a permeability balance of 25–43%, yet stand out with significant tree canopy density within their green spaces—reaching 50% in LCZ 5 (open mid-rise) and 57% in LCZ 6 (open low-rise). These areas function as critical regulatory hubs within the urban fabric. Conversely, industrial and commercial sectors (LCZ 8 and 10) exhibit high soil sealing, with permeability below 37% and limited tree cover (26–32%). While LCZ D (low plants) shows the highest permeability (95%), its low tree density (17%) highlights a strategic potential for future afforestation to enhance the urban fabric. These findings confirm that urban morphology is a direct indicator of an ecosystem’s capacity to provide essential regulating ES.

3.3. Data Verification and Quality Control

To evaluate the reliability of the prepared DW data, a rigorous accuracy assessment was performed. Technical validation is a prerequisite for ensuring that the spatial foundation used for ecosystem indicators is statistically sound, particularly when utilizing near-real-time deep learning products like DW.
The assessment utilized an equalized stratified random sampling design, with a total of 104 validation points distributed across the FUA-Burgas for the two reference periods. Ground-truth verification was conducted through visual interpretation of Sentinel-2 RGB composites and normalized difference vegetation index layers, specifically mosaicked for the last days of August.
Statistical performance was quantified using confusion matrices, yielding high reliability for both temporal datasets (Table 5). The results for the 2018 period showed an overall accuracy of 80.8% and a Kappa coefficient of 0.78. The 2025 period demonstrated a robust performance with an overall accuracy of 76.9% and a Kappa coefficient of 0.74. Both sets of results exceed the global performance benchmark of the DW model, set at 73.8% [68], validating the effectiveness of the local temporal averaging and classification logic.
Crucially, the reliability of the classes most relevant to the study’s indicators remained high. The precision for identifying “urban structures—built area” was recorded at 76.9% in 2018, improving to 84.6% in 2025. Similarly, the mapping precision for “forest cover—trees” maintained a consistent level of 84.6% across both study periods. These metrics confirm that the detected trends in urban expansion and vegetation change are statistically credible and provide a solid basis for evidence-based ecosystem assessment.
Final LCZ verification was conducted using the digital orthophoto map from the Ministry of Agriculture and Food (2025), which identified significant LCZ transitions (transition from natural-type (land cover) LCZ to built-type LCZ), particularly along the city’s periphery, driven by intensive construction and rapid regional development. This multi-temporal and multi-source approach ensures that the spatial model reflects the most recent anthropogenic shifts in the urban ecosystems.
Validation of the GGC confirmed the highest geometric accuracy within the densely built-up urban core, where cadastral and municipal data provided precise footprints of impervious surfaces. However, initial discrepancies were observed in the urban periphery, where certain green spaces were underrepresented in the municipal database. To resolve these, a systematic cross-verification between LCZ classes and surface coverage was performed. In cases where the land-cover mosaic deviated from the structural definition of the LCZ—for instance, an LCZ “D” (low plants) unit showing a disproportionately low percentage of pervious area—the values were manually adjusted to align with the observed morphology. This iterative refinement process ensured that the final dataset accurately reflects the actual permeability balance across all urban structural types.

3.4. Assessment of Ecosystem Condition and Pressure

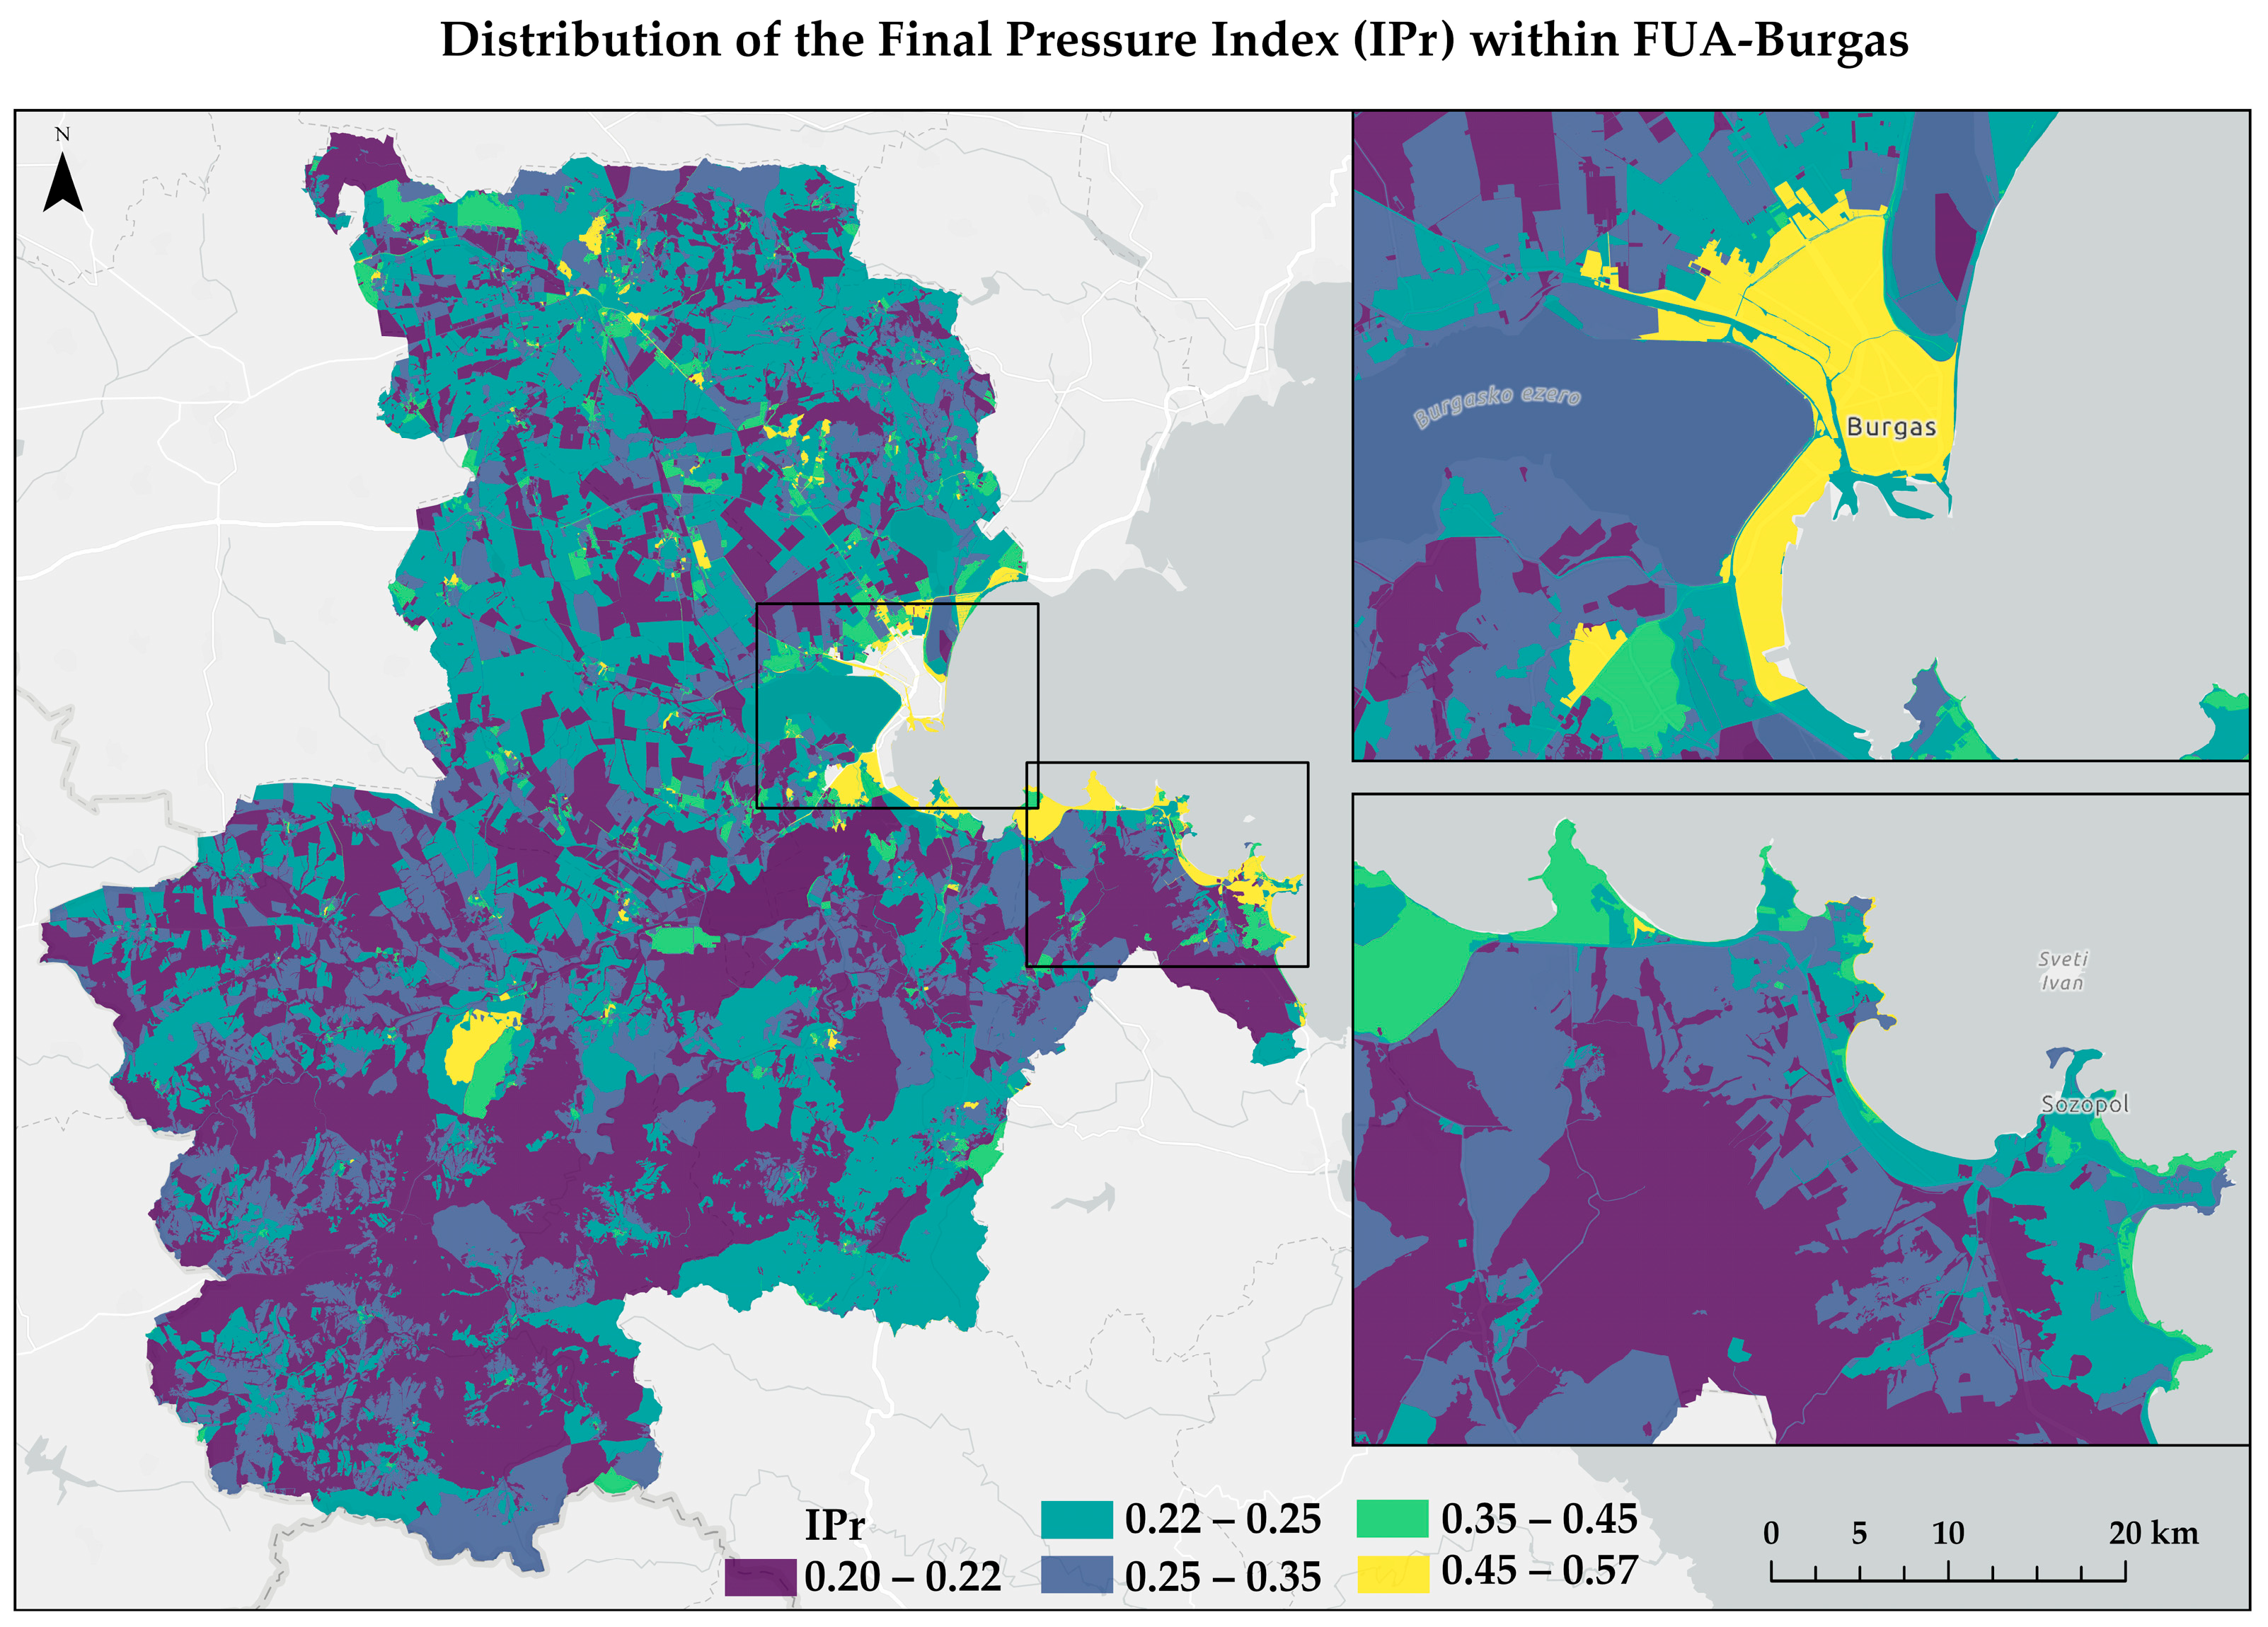
Figure 4 presents the spatial distribution of the Final Pressure Index (IPr) across the case study area. The results highlight a clear divergence between the highly impacted urban–industrial core and the more resilient natural periphery, providing a quantitative basis for targeted environmental mitigation strategies in the FUA-Burgas.
The soil sealing indicator exhibits exceptionally low average values for the FUA-Burgas territory, demonstrating that over 90% of the polygons have remained stable. However, where changes do occur, they are highly concentrated within specific ecosystem types. Urban areas are by far the most affected, followed by croplands and grasslands, which reflect the primary zones of infrastructure expansion and new construction within the FUA.
The LULC change indicator reveals a complex landscape dynamic with 49 transition combinations, where urban areas, heathlands and shrubs, and grasslands emerge as the three most transformed ecosystem types by cumulative intensity. Excluding stable areas, natural succession and extensification dominate the periphery, led by crops to trees and grass to shrub/scrub. Conversely, urbanization is primarily driven by the loss of arable land, with transitions from crops to built-up significantly outnumbering transitions from semi-natural areas like trees to built-up. This confirms that urban expansion at the expense of agriculture is the main driver of the high pressure values observed at the FUA-Burgas fringes.
Landscape fragmentation is most intense in areas with dense settlements and transport infrastructure, centered around the urban core of Burgas. In contrast, large sections of the northern, western, and southern FUAs exhibit high homogeneity and connectivity. This lack of fragmentation results from the prevailing landscape structure—extensive arable lands in the north and the forested foothills of the Strandzha Mountains in the south. The analysis identifies that high pressure scores are directly linked to the barrier effect of major transport corridors, which disrupt ecological corridors and isolate natural habitats.
The difference in PM2.5 levels reveals a general air quality improvement across the FUA-Burgas, with predominantly negative values. The most significant reductions are concentrated in the urban–industrial core and coastal zones, suggesting effective emission controls. Conversely, the agricultural peripheries show the least improvement; while air quality has not necessarily declined, these areas exhibit much slower recovery rates compared to the urban center.
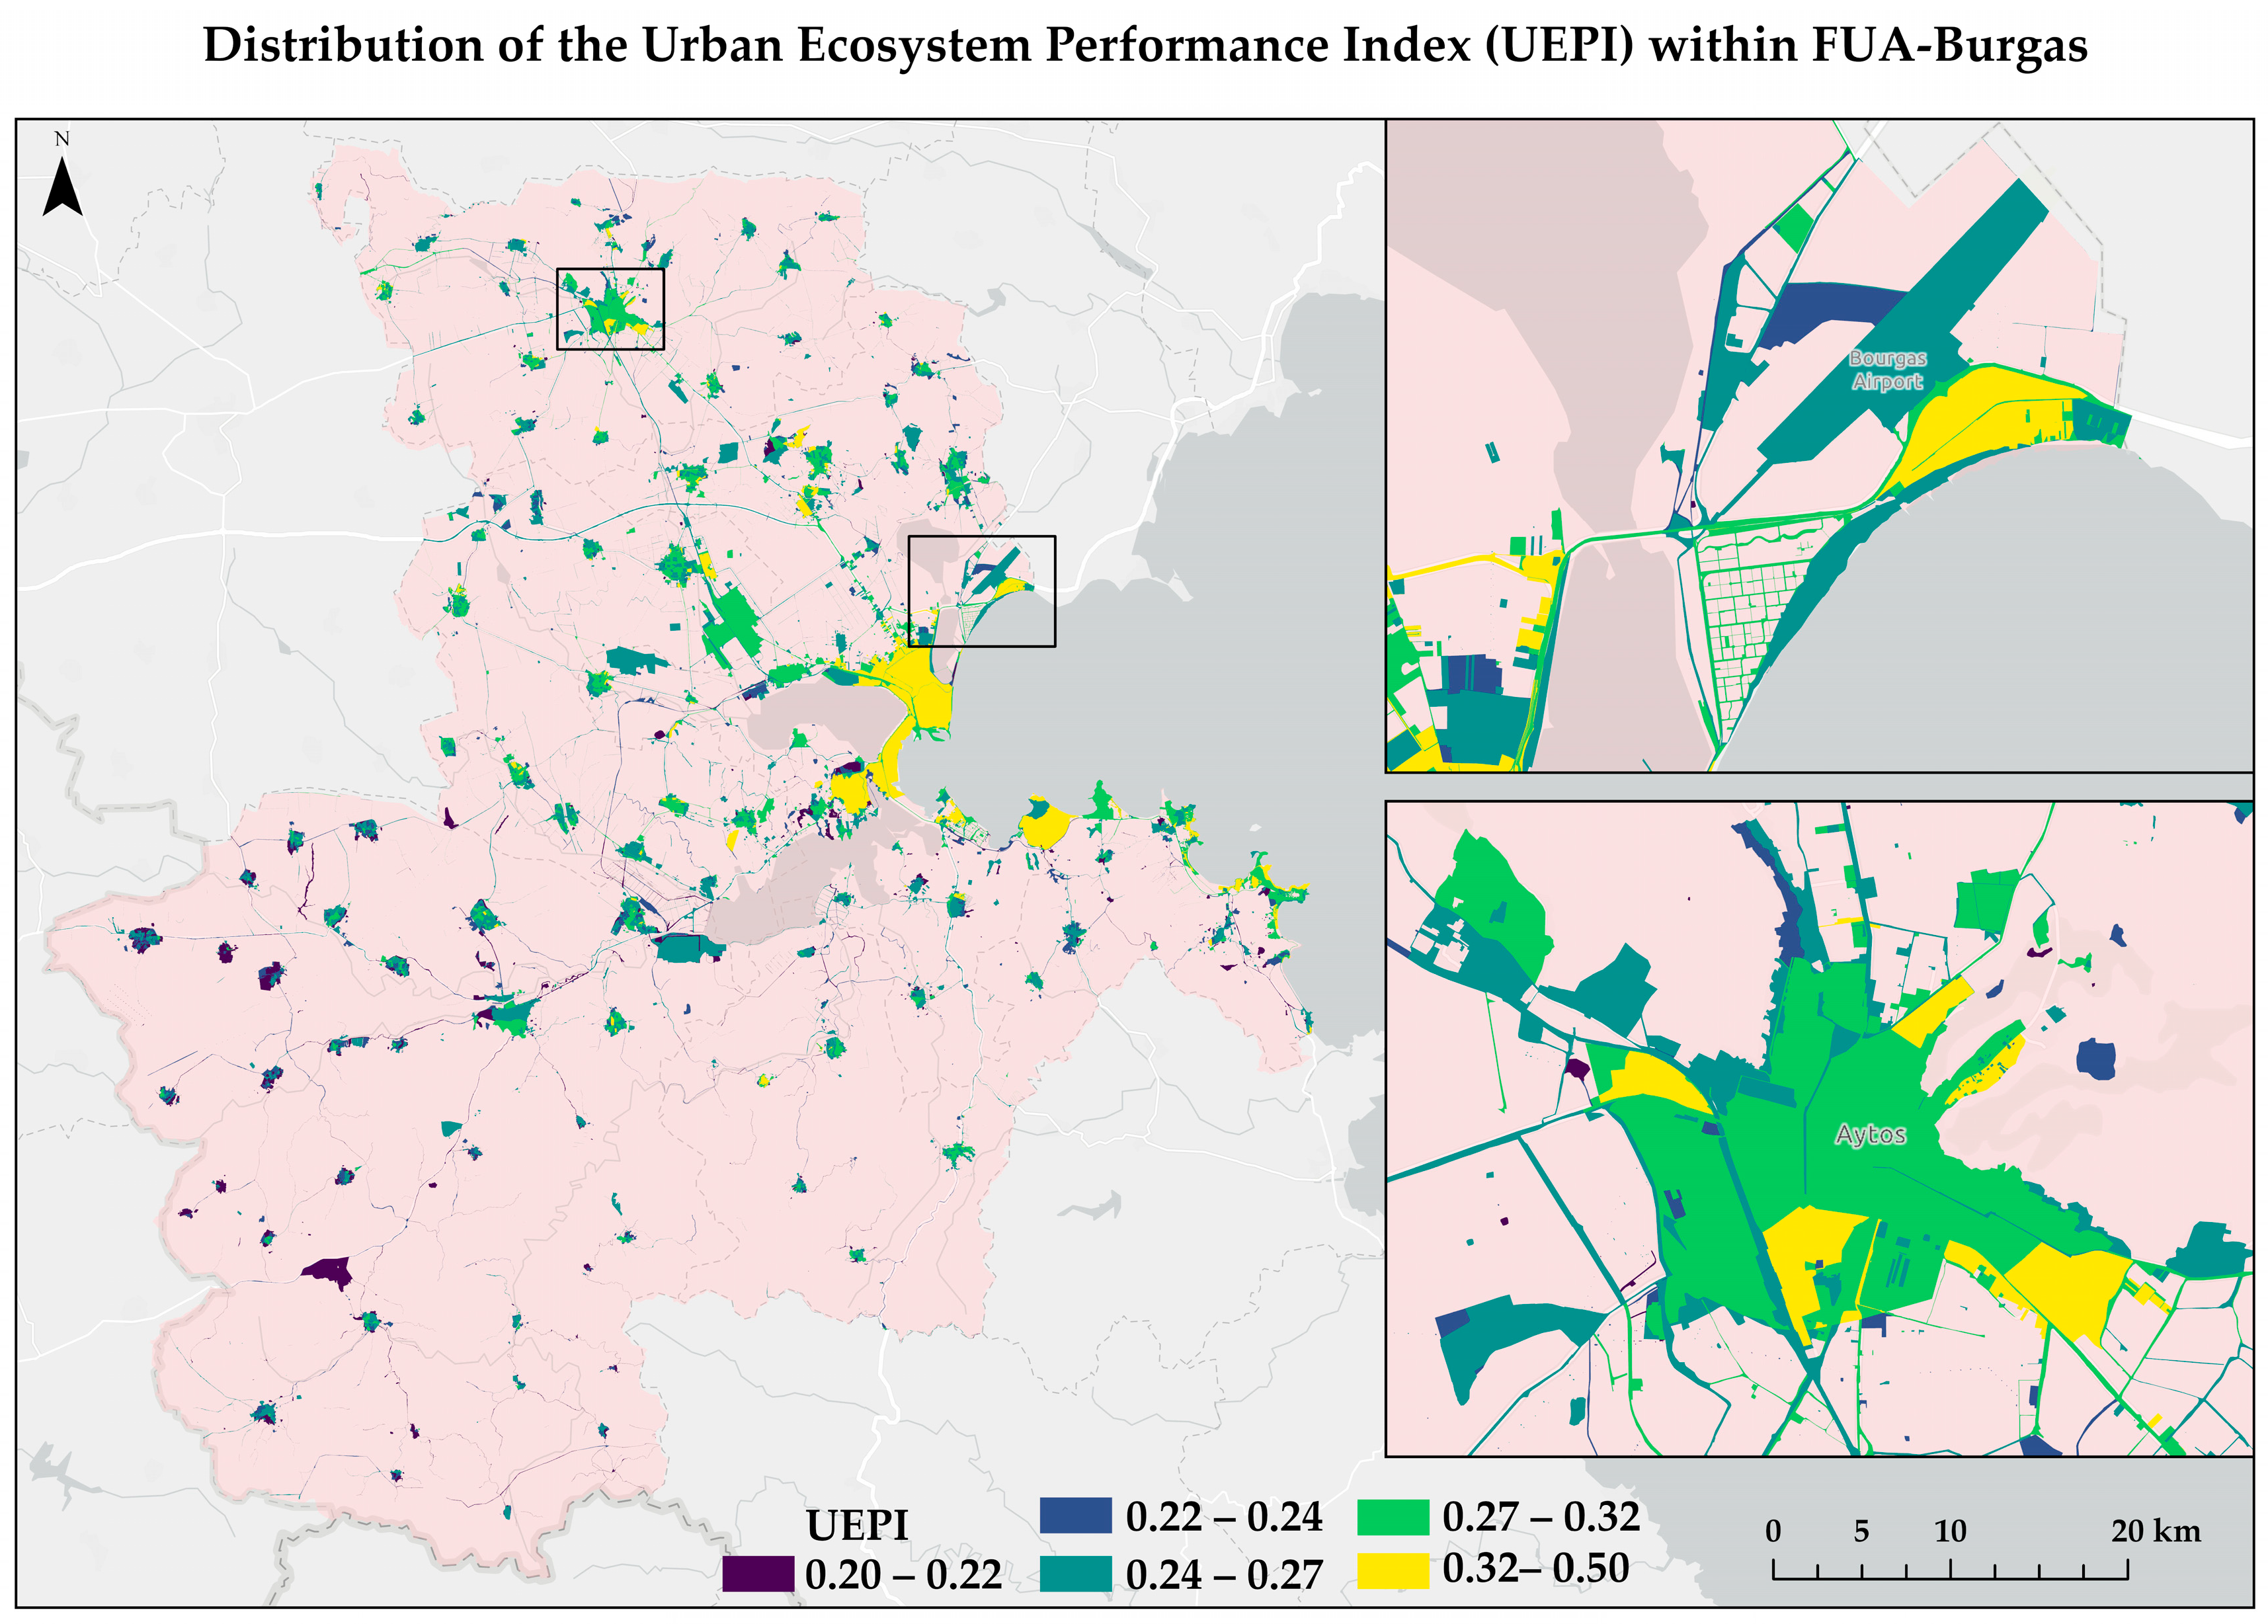
The UEPI presented in Figure 5 reveals sharp spatial polarization, with critical pressure values concentrated in the industrial and port zones of the urban core.
The spatial structure component of the urban ecosystems identifies 236 unique interaction scenarios between dominant ecosystem types and their constituent classes. This high level of diversity reflects a complex urban mosaic, where the fragmentation of land-cover types creates a multifaceted environmental matrix. The highest landscape variety, featuring up to eight distinct classes, is identified within the urban core. This maximum heterogeneity confirms that the city center acts as a complex spatial mosaic. While this diversity reflects intense human modification, it also indicates a multifaceted structural composition that defines the urban ecosystem’s character in Burgas.
In addition to the indicators presented above, a literature analysis of the condition of and pressure on ecosystems in the FUA-Burgas based on the results of the European-level [35] is conducted. In summary of the literature review, the following conclusions can be drawn:
  • Long-term trends in the urban ecosystem assessments for the FUA-Burgas are above the EU average for most indicators (worse values).
  • Short-term trends in the assessments are more neutral or slightly improving, particularly in the areas of air quality and urban densification.
  • Air quality in the FUA-Burgas is under serious pressure, with most pollutants consistently high and above EU average values.
  • The expansion of urban areas contributes to the ongoing loss of land and fragmentation of habitats, with no significant improvements observed in reducing areas of soil sealing.
  • Slight improvements are observed in the structure and stability of vegetation cover.

4. Discussion

4.1. Spatial Data and Multi-Level Urban Heterogeneity

A fundamental limitation of most urban ecosystem assessment frameworks lies in their reliance on static and highly generalized spatial datasets that are insufficient to capture the complex, dynamic, and heterogeneous nature of urban and peri-urban ecosystems [75]. Widely used products such as Copernicus Urban Atlas [64] and GHS-BUILT [76] provide valuable standardized information; however, their relatively coarse spatial resolution and rigid classification schemes limit their ability to detect fine-scale changes and transitional processes. In contrast, the integration of DW-GEE introduces a fundamentally different analytical paradigm, replacing static mapping with a temporally explicit and probabilistic representation of land surface dynamics. This shift is particularly important in peri-urban environments, where the dominant processes are not large-scale land transformations but gradual and spatially fragmented changes. The DW-GEE framework offers distinct analytical advantages over traditional global datasets like Copernicus or GHS-BUILT-C. While standard annual maps often generalize landscape patterns and suffer from significant processing lags, DW provides NRT land-use and land-cover classification at a high 10 m spatial resolution [68]. Furthermore, processing within the GEE environment allows for temporal probability averaging, which effectively filters out phenological noise and atmospheric artifacts. Consequently, this approach provides a robust, high-resolution foundation for capturing the fine-scale urban dynamics and anthropogenic pressures that static annual products typically obscure.
The results for the FUA-Burgas clearly show that urban expansion does not occur as a uniform process, but rather through dispersed and discontinuous spatial patterns, primarily driven by the conversion of agricultural land. Such dynamics are often underestimated or entirely overlooked in conventional datasets, leading to a structural underrepresentation of anthropogenic pressure in strategic planning. The use of high-resolution and temporally consistent data enables a much more precise detection of these processes. In the peri-urban zones of Burgas, the results reveal subtle but functionally significant dynamics, including natural succession and fragmented urban growth. These small-scale transitions form a complex “urban mosaic” characterized by the coexistence and interaction of agricultural, semi-natural, and built-up elements. Capturing this structure enables a more accurate spatial assessment of anthropogenic pressure compared to conventional thematic mapping. The findings indicate that the peri-urban landscape has undergone a sustained transformation driven by expanding construction and increasing investment pressure, representing a structural reconfiguration rather than isolated or episodic changes.
Building upon previous research, this study confirms a significant transformation in LULC types directly resulting from expanding construction and intensifying investment pressure. The use of high-resolution data provided the necessary precision to explicitly identify these shifts, which were previously noted as emerging trends. This confirms that the physical landscape in the peri-urban areas of Burgas has been fundamentally altered by the rapid pace of urban development and commercial investment.

4.2. Methodological Advances and Operational Limitations of the UAV-GEE Integration

The proposed framework offers several key methodological advantages. The integration of DW within the GEE environment enables continuous monitoring of land-use dynamics, capturing both gradual and fragmented spatial processes that are typically missed by static datasets. The high spatial resolution significantly improves the detection of fine-scale transformations, particularly in heterogeneous peri-urban areas. In addition, the probabilistic nature of the DW classification allows for the representation of transitional states and mixed land-use conditions, providing a more realistic depiction of evolving geosystems. The multi-scale structure of the framework, combining regional ecosystem mapping with local analysis based on LCZs, enables the integration of structural and functional characteristics of urban systems and establishes a direct link between spatial morphology and ES capacity. Furthermore, the use of a reduced but targeted set of indicators enhances the operational applicability of the approach, positioning it as an efficient spatial diagnostic tool for planning and environmental management.
Despite these advantages, several limitations should be acknowledged. The reliance on remotely sensed data, particularly DW, introduces uncertainty associated with machine-learning-based classification, especially in spectrally complex urban environments. The temporal compositing approach, while improving consistency, may smooth short-term or abrupt changes, making the method more suitable for detecting long-term trends than episodic events. In addition, resampling raster data to higher spatial resolutions does not increase their intrinsic informational value and may create an apparent increase in precision that requires careful interpretation. However, it should be noted that such technically optimized downsampling does not enhance the sensor’s fundamental physical resolution.
To further enhance the reliability of deep learning land-cover products like DW, future iterations should integrate localized automated data cleaning workflows alongside targeted manual corrections to systematically address boundary misclassifications. Furthermore, incorporating multi-seasonal imagery outside the peak growing season could reduce spectral confusion between highly fragmented urban surfaces and natural vegetation. Implementing such automated workflows alongside targeted, expert-driven manual corrections based on cadastral data will significantly reduce boundary misclassifications and decrease the reliance on intensive manual adjustments.
The reduced set of indicators, although advantageous for operational purposes, does not fully capture certain ecosystem dimensions such as biodiversity, soil processes, and hydrological dynamics. Moreover, the effectiveness of the approach depends on the availability and quality of auxiliary datasets, particularly at the local level. It should also be emphasized that this study does not aim to employ a fully representative set of indicators covering the entire spectrum of ecosystem conditions and pressures. Instead, it adopts a minimal but informative set of indicators capable of capturing maximum pressure while ensuring operational efficiency. As suggested by Zhiyanski et al. (2018) [40], integrated indices such as the IP index are particularly suitable for supporting targeted strategic decision-making. In this context, the proposed framework provides a streamlined yet robust evidence base for municipal planning and the integration of ecosystem-based objectives into regional development policies. Acknowledging that aggregating condition and pressure indicators carries governance risks by potentially obscuring distinct causal relationships, a challenge that contemporary frameworks address by separating these dimensions, the UEPI index is intentionally designed to isolate hotspots of maximum cumulative stress where the poorest environmental condition intersects with the highest anthropogenic pressure. Nevertheless, for effective strategic application, decision-makers must still decouple these underlying processes to determine whether specific interventions should prioritize protecting a healthy ecosystem condition or actively mitigating external pressures.
The results indicate that no persistent negative trends are observed across most of the FUA-Burgas, suggesting a relatively high degree of landscape resilience. The spatial distribution of ecosystem conditions highlights a well-developed network of multifunctional green spaces capable of delivering a wide range of ES with direct benefits for environmental quality and human well-being. This suggests that the existing GI provides a solid foundation for sustainable urban development. Nevertheless, further improvements are needed to enhance its functionality. Increasing the connectivity and spatial continuity of GI should be a priority in future urban development plans. Such measures are essential for maintaining ecological capacity and ensuring more equitable access to ES within the urban environment.
The proposed two-level spatial framework demonstrates strong potential for scalability and transferability. By combining universally applicable spatial units with freely available datasets, it can be adapted to other FUAs across Europe, supporting cross-regional comparisons and harmonized ecosystem assessments. At the local level, the balance between impervious and pervious surfaces is a key determinant of environmental conditions and climate adaptation capacity. The findings directly follow the recommendations on how future research should focus more on natural features and ecosystem health as part of sustainable urban morphology [41].
A high proportion of sealed surfaces is associated with reduced air quality and diminished climate regulation potential. In this context, urban tree cover emerges as a critical factor, with a clear relationship between canopy extent and urban cooling capacity. This underscores the importance of targeted afforestation measures to mitigate the UHI effect. The high-resolution geospatial dataset developed in this study offers substantial potential for practical application, particularly in the planning and implementation of NBS.

4.3. Spatial Trajectories of Ecosystem Stress: Local Implications for Land-Use Planning

The multi-scale structure of the framework allows for the alignment of strategic planning with local-level interventions. By capturing spatial variations in ecosystem structure and condition, the model enables the assessment of ES dynamics in relation to specific LCZ types and supports the identification of areas most vulnerable to land-use change [77,78,79,80,81]. This provides a basis for prioritizing restoration, intervention measures and implementation of NBS [82,83]. The findings also highlight the need for further research on the social dimensions of ES, including equitable access for vulnerable population groups and the impact of seasonal population fluctuations, particularly in coastal urban systems. Finally, the developed geospatial database provides a valuable foundation for institutional use in the planning, maintenance, and expansion of GI. Future work should focus on refining its typology and morphological characterization, as well as integrating more detailed geospatial and field-based data on vegetation structure and condition. This would enable more precise quantification of ES benefits and support the development of spatially explicit thresholds for sustainable ecosystem management.
Furthermore, the results provide a diagnostic tool for assessing the vulnerability of ES to land-use change, aligning with the findings at the local scale, these data serve as a foundation for identifying the potential for restoration and expansion of GI. By pinpointing areas where ecological capacity is compromised, urban planners can strategically prioritize interventions to enhance GI connectivity, thereby securing the long-term provision of vital regulatory and supporting services within the FUA-Burgas. The results obtained will be used in an ongoing project to upgrade the existing Methodology for Assessment and Mapping of Urban Ecosystems Condition and Their Services in Bulgaria [40] into a Methodology for Assessment and Mapping of the Condition of Urban Ecosystems and Their Services on the Territory of the Natura 2000 Ecological Network in Bulgaria [44].

5. Conclusions

This study addresses a significant challenge in applying concepts for mapping and assessing ecological resources in urban environments: determining the basic spatial unit for evaluating ES. It argues that the quality of urban morphology data is essential for accurately reflecting the relationship between structure and function in urban settings. By cartographically interpreting this data, the study creates operational spatial models that identify ecological constraints and highlight areas of significant human impact, capturing the delicate balance between anthropogenic discreteness and ecological continuity.
The study evaluates the MAES recommendations for mapping urban and sub-urban morphology using a two-level hierarchical model that includes both regional and local levels within the FUA, while maintaining the integrity of spatial units. This refinement in spatial focus is achieved by integrating high-resolution UAV data with analytical processing through the GEE platform, utilizing the DW V1 global land-cover dataset to assess selected indicators of ecological state and pressure for two time periods: 2018 and 2025. An ecosystem stress index is calculated and mapped for the study area, demonstrating a clear spatial distribution of environmental loading along the urban–peri-urban gradient. The results indicate that this approach is highly effective for tracking long-term structural trends, though it has limitations when diagnosing isolated, rapid-onset environmental events.
Making effective strategic decisions into successful local practices is achievable, but it relies on accurate data and the ability to record and track changes over time. This study demonstrates that integrating an ecosystem approach with advanced geospatial technologies for assessing ecosystem functionality and services leads to precise spatial data. This, in turn, provides a solid informational foundation for evidence-based decision-making in the planning, management, and climate resilience adaptation of diverse and rapidly changing urban areas.

Author Contributions

Conceptualization, L.S., B.B., M.I. and S.D.; methodology, L.S., B.B., M.I. and S.D.; software, M.I., L.T. and S.P.; validation, M.I. and L.S.; formal analysis, L.S., M.I., L.T. and S.P.; resources, L.S., M.I., L.T. and S.P.; data curation, M.I., L.S., L.T. and S.P.; writing—original draft preparation, L.S. and M.I.; writing—review and editing, B.B. and S.D.; visualization, L.S.; supervision, B.B. and S.D. All authors have read and agreed to the published version of the manuscript.

Funding

This study is financed by the European Union-NextGenerationEU, through the National Recovery and Resilience Plan of the Republic of Bulgaria, Project No. BG-RRP-2.004-0008-C01 “SUMMIT—Sofia University Marking Momentum for Innovation and Technological Transfer”.

Data Availability Statement

The original contributions presented in the study are included in the article; further inquiries can be directed to the corresponding author.

Acknowledgments

We are very grateful to the Municipality of Burgas for providing the necessary data and for their excellent collaborative effort throughout the research process. We also thank the reviewers and the academic editors for their valuable comments that helped to improve the paper’s quality.

Conflicts of Interest

The authors declare that the research was conducted in the absence of any commercial or financial relationships that could be construed as potential conflicts of interest.

Abbreviations

The following abbreviations are used in this manuscript:
DEMDigital Elevation Model
DWDynamic World
EEAEuropean Environment Agency
ESEcosystem Services
FUAFunctional Urban Area
GEEGoogle Earth Engine
GGCGreen-Gray Coefficient
GIGreen Infrastructure
GISGeographic Information Systems
IPrEcosystem Pressure Index
LCZLocal Climate Zone
MAESMapping and Assessment of Ecosystem Services
NBSNature-Based Solution
NDVINormalized Difference Vegetation Index
NRTNear-Real-Time
PM2.5Particulate Matter/Fine Particulate Matter
RGBRed, Green, Blue
SEEA-EASystem of Environmental-Economic Accounting—Ecosystem Accounting
TCCTree Cover Change
UAVUnmanned Aerial Vehicle
UEPIUrban Ecosystem Performance Index
UGIUrban Green Infrastructure
UHIUrban Heat Island

References

  1. The European Green Deal. Available online: https://commission.europa.eu/strategy-and-policy/priorities-2019-2024/european-green-deal_en (accessed on 24 April 2026).
  2. European Commission: Biodiversity Strategy for 2030. Available online: https://environment.ec.europa.eu/strategy/biodiversity-strategy-2030_en (accessed on 24 April 2026).
  3. EUR-Lex: Regulation (EU) 2024/1991 of the European Parliament and of the Council of 24 June 2024 on Nature Restoration and Amending Regulation (EU) 2022/869 (Text with EEA Relevance). Available online: https://eur-lex.europa.eu/eli/reg/2024/1991/oj/eng (accessed on 24 April 2026).
  4. Qian, Y.; Zhou, W.; Pickett, S.T.; Yu, W.; Xiong, D.; Wang, W.; Jing, C. Integrating structure and function: Mapping the hierarchical spatial heterogeneity of urban landscapes. Ecol. Process. 2020, 9, 59. [Google Scholar] [CrossRef]
  5. McPhearson, T.; Cook, E.; Berbés-Blázquez, M.; Cheng, C.; Grimm, N.B.; Andersson, E.; Barbosa, O.; Chandler, D.G.; Chang, H.; Chester, M.V.; et al. A social-ecological-technological systems approach to urban ecosystem services. One Earth 2022, 5, 505–518. [Google Scholar] [CrossRef]
  6. Maes, J.; Zulian, G.; Thijssen, M.; Castell, C.; Baró, F.; Ferreira, A.M.; Melo, J.; Garrett, C.P.; David, N.; Alzetta, C.; et al. Mapping and Assessment of Ecosystems and Their Services; Urban Ecosystems; Publications Office of the European Union: Luxembourg, 2016; Available online: https://ec.europa.eu/environment/nature/knowledge/ecosystem_assessment/pdf/102.pdf (accessed on 27 April 2026).
  7. Elliot, T.; Goldstein, B.; Gómez-Baggethun, E.; Proença, V.; Rugani, B. Ecosystem service deficits of European cities. Sci. Total Environ. 2022, 837, 155875. [Google Scholar] [CrossRef]
  8. European Committee of the Regions. The State of Regions and Cities—EU Annual Report 2025; European Committee of the Regions: Brussels, Belgium, 2025. Available online: https://data.europa.eu/doi/10.2863/7493859 (accessed on 27 April 2026).
  9. Geneletti, D.; Cortinovis, C.; Zardo, L.; Esmail, B.A. Planning for Ecosystem Services in Cities; Springer Briefs in Environmental Science; Springer International Publishing: Cham, Switzerland, 2020; pp. 3–5. [Google Scholar] [CrossRef]
  10. Longato, D.; Cortinovis, C.; Albert, C.; Geneletti, D. Practical applications of ecosystem services in spatial planning: Lessons learned from a systematic literature review. Environ. Sci. Policy 2021, 119, 72–84. [Google Scholar] [CrossRef]
  11. Almenar, J.B.; Elliot, T.; Rugani, B.; Philippe, B.; Gutierrez, T.N.; Sonnemann, G.; Geneletti, D. Nexus between nature-based solutions, ecosystem services and urban challenges. Land Use Policy 2021, 100, 104898. [Google Scholar] [CrossRef]
  12. Maes, J.; Zulian, G.; Gunther, S.; Thijssen, M.; Raynal, J. Enhancing Resilience of Urban Ecosystems Through Green Infrastructure; Final Report, EUR 29630 EN; Publications Office of the European Union: Luxembourg, 2019. [Google Scholar] [CrossRef]
  13. Haase, D. Integrating Ecosystem Services, Green Infrastructure and Nature-Based Solutions—New Perspectives in Sustainable Urban Land Management. In Sustainable Land Management in a European Context; Weith, T., Barkmann, T., Gaasch, N., Rogga, S., Strauß, C., Zscheischler, J., Eds.; Human-Environment Interactions; Springer: Cham, Switzerland, 2021; Volume 8. [Google Scholar] [CrossRef]
  14. Croci, E.; Lucchitta, B. Nature-Based Solutions for More Sustainable Cities—A Framework Approach for Planning and Evaluation; Emerald Publishing Limited: Leeds, UK, 2021. [Google Scholar] [CrossRef]
  15. European Union. ESPON Programme 2030. Available online: https://www.espon.eu/ (accessed on 27 April 2026).
  16. Zaman-ul-Haq, M.; Saqib, Z.; Kanwal, A.; Naseer, S.; Shafiq, M.; Akhtar, N.; Bokhari, S.A.; Irshad, A.; Hamam, H. The Trajectories, Trends, and Opportunities for Assessing Urban Ecosystem Services: A Systematic Review of Geospatial Methods. Sustainability 2022, 14, 1471. [Google Scholar] [CrossRef]
  17. Leopold, U.; Pinheiro, P.; Braun, C.; Elliot, T.; Rugani, B. iGuess4ESTIMUM: A Geospatial Ecosystem Service and Urban Metabolism Platform Based on iGuess®. In Introduction to Designing Environments; Springer: Cham, Switzerland, 2023; pp. 159–182. [Google Scholar]
  18. Di Palma, M.; Rigillo, M.; Leone, M.F. Remote Sensing Technologies for Mapping Ecosystem Services: An Analytical Approach for Urban Green Infrastructure. Sustainability 2024, 16, 6220. [Google Scholar] [CrossRef]
  19. Grunwald, L.; Heusinger, J.; Weber, S. A GIS-based mapping methodology of urban green roof ecosystem services applied to a Central European city. Urban For. Urban Green. 2017, 22, 54–63. [Google Scholar] [CrossRef]
  20. Pan, H.; Zhang, L.; Cong, C.; Deal, B.; Wang, Y. A Dynamic and Spatially Explicit Modeling Approach to Identify the Ecosystem Service Implications of Complex Urban Systems Interactions. Ecol. Indic. 2019, 102, 426–436. [Google Scholar] [CrossRef]
  21. Baker, F.; Smith, G.R.; Marsden, S.J.; Cavan, G. Mapping regulating ecosystem service deprivation in urban areas: A transferable high-spatial resolution uncertainty aware approach. Ecol. Indic. 2021, 121, 107058. [Google Scholar] [CrossRef]
  22. Chrysoulakis, N.; Somarakis, G.; Stagakis, S.; Mitraka, Z.; Wong, M.-S.; Ho, H.-C. Monitoring and Evaluating Nature-Based Solutions Implementation in Urban Areas by Means of Earth Observation. Remote Sens. 2021, 13, 1503. [Google Scholar] [CrossRef]
  23. Codemo, A.; Pianegonda, A.; Ciolli, M.; Favargiotti, S.; Albatici, R. Mapping Pervious Surfaces and Canopy Cover Using High-Resolution Airborne Imagery and Digital Elevation Models to Support Urban Planning. Sustainability 2022, 14, 6149. [Google Scholar] [CrossRef]
  24. Demuzere, M.; Kittner, J.; Martilli, A.; Mills, G.; Moede, C.; Stewart, I.D.; van Vliet, J.; Bechtel, B. A global map of local climate zones to support earth system modelling and urban-scale environmental science. Earth Syst. Sci. Data 2022, 14, 3835–3873. [Google Scholar] [CrossRef]
  25. Langenkamp, J.-P.; Rienow, A. Exploring the Use of Orthophotos in Google Earth Engine for Very High-Resolution Mapping of Impervious Surfaces: A Data Fusion Approach in Wuppertal, Germany. Remote Sens. 2023, 15, 1818. [Google Scholar] [CrossRef]
  26. Baker, F.; Smith, G.; Marsden, S.; Cavan, G. Assessing Fine-Scale Urban Green and Blue Infrastructure Change in Manchester, UK: A Spatiotemporal Analysis Framework to Support Environmental Land Use Management. Land 2025, 14, 1077. [Google Scholar] [CrossRef]
  27. Hasan, M.; Pramanik, M.; Alam, I.; Kumar, A.; Avtar, R.; Zhran, M. Assessing the efficacy of artificial intelligence based city-scale blue green infrastructure mapping using Google Earth Engine in the Bangkok metropolitan region. J. Urban Manag. 2025, 14, 434–450. [Google Scholar] [CrossRef]
  28. Stamou, A.; Karachaliou, E.; Tavantzis, I.; Bakousi, A.; Dosiou, A.; Tsifodimou, Z.-E.; Stylianidis, E. Satellite Imagery for Comprehensive Urban Morphology and Surface Roughness Analysis: Leveraging GIS Tools and Google Earth Engine for Sustainable Urban Planning. Urban Sci. 2025, 9, 213. [Google Scholar] [CrossRef]
  29. Mosso, B.; Nino, A.; Salata, S. How to Plan Climate-Adaptive Cities: An Experimental Approach to Address Ecosystem Service Loss in Ordinary Planning Processes. Land 2025, 14, 532. [Google Scholar] [CrossRef]
  30. Szafarczyk, A.; Agbasi, O. Emerging trends in GIS and remote sensing technologies for environmental monitoring: Innovations, applications, and future directions. Geoinform. Pol. 2025, 2025, 25–41. [Google Scholar] [CrossRef]
  31. Nottingham City Council GIS Team. Available online: https://3d-hub-nottmcitycouncil.hub.arcgis.com/pages/our-3d-journey (accessed on 27 April 2026).
  32. Maes, J.; Teller, A.; Erhard, M.; Liquete, C.; Braat, L.; Berry, P.; Egoh, B.; Puydarrieux, P.; Fiorina, C.; Santos, F.; et al. Mapping and Assessment of Ecosystems and Their Services. An Analytical Framework for Ecosystem Assessments Under Action 5 of the EU Biodiversity Strategy to 2020; Publications office of the European Union: Luxembourg, 2013. [Google Scholar]
  33. Maes, J.; Teller, A.; Erhard, M.; Murphy, P. Mapping and Assessment of Ecosystems and Their Services. In Indicators for Ecosystem Assessments Under Action 5 of the EU Biodiversity Strategy to 2020; Publications Office of the European Union: Luxembourg, 2014. [Google Scholar]
  34. Maes, J.; Teller, A.; Erhard, M.; Grizzetti, B.; Barredo, J.I.; Paracchini, M.L.; Condé, S.; Somma, F.; Orgiazzi, A.; Jones, A.; et al. Mapping and Assessment of Ecosystems and Their Services: An Analytical Framework for Ecosystem Condition; Publications Office of the European Union: Luxembourg, 2018. [Google Scholar]
  35. Maes, J.; Teller, A.; Erhard, M.; Condé, S.; Vallecillo, S.; Barredo, J.I.; Paracchini, M.L.; Abdul Malak, D.; Trombetti, M.; Vigiak, O.; et al. Mapping and Assessment of Ecosystems and Their Services: An EU Ecosystem Assessment; EUR 30161 EN; Publications Office of the European Union: Luxembourg, 2020; JRC120383; ISBN 978-92-76-17833-0. [Google Scholar] [CrossRef]
  36. SELINA (Science for Evidence-Based and Sustainable Decisions about Natural Capital) Project EU. Available online: https://project-selina.eu/ (accessed on 27 April 2026).
  37. Walther, F.; Barton, D.N.; Schwaab, J.; Kato-Huerta, J.; Immerzeel, B.; Adamescu, M.; Andersen, E.; Coyote, M.V.A.; Arany, I.; Balzan, M.; et al. Uncertainties in ecosystem services assessments and their implications for decision sup-port—A semi-systematic literature review. Ecosyst. Serv. 2025, 73, 101714. [Google Scholar] [CrossRef]
  38. Seguin, J.; Thomas, I.N.; Rendón, P.; Cortinovis, C.; Arany, I.; Czúcz, B.; Duchková, H.; Geneletti, D.; Grondard, N.; Goñi, V.G.; et al. Towards Integrated Ecosystem Assessments: A literature review on linking ecosystem condition indicators to ecosystem services. One Ecosyst. 2026, 11, e184299. [Google Scholar] [CrossRef]
  39. European Environment Agency. Habitat Types. Available online: https://eunis.eea.europa.eu/habitats-code-browser-revised.jsp (accessed on 27 April 2026).
  40. Zhiyanski, M.; Nedkov, S.; Mondeshka, M.; Yarlovska, N.; Borisova, B.; Vassilev, V.; Bratanova-Doncheva, S.; Gocheva, K.; Chipev, N. Methodology for Assessment and Mapping of Urban Ecosystems Condition and Their Services in Bulgaria; Clorind: Sofia, Bulgaria, 2018; ISBN 978-619-7379-03-7. Available online: https://www.researchgate.net/publication/322313619_2_METHODOLOGY_FOR_ASSESSMENT_AND_MAPPING_OF_URBAN_ECOSYSTEMS_CONDITION_AND_THEIR_SERVICES_IN_BULGARIA_ISBN_978-619-7379-03-7 (accessed on 20 April 2026).
  41. Zhang, P.; Ghosh, D.; Park, S. Spatial measures and methods in sustainable urban morphology: A systematic review. Landsc. Urban Plan. 2023, 237, 104776. [Google Scholar] [CrossRef]
  42. Czúcz, B.; Keith, H.; Jackson, B.; Maes, J.; Driver, A.; Nicholson, E.; Bland, L. Discussion Paper 2.3: Proposed Typology of Condition Variables for Ecosystem Accounting and Criteria for Selection of Condition Variables, Version of 18 October 2019; United Nations: New York, NY, USA, 2019; pp. 1–27. Available online: https://seea.un.org/sites/seea.un.org/files/documents/EEA/ec_discussionpaper23_typology-v22-clean.pdf (accessed on 27 April 2026).
  43. Toward Better UNderstanding the Ecosystem Services in Urban Environments Trough Assessment and Mapping (TUNESinURB) Project. Available online: https://eeagrants.org/en/fmo/areas-work/programmes-and-projects-information/archive/2009-2014/projects/bg03-0019 (accessed on 27 April 2026).
  44. Methodology for Assessment and Mapping of the Condition of Urban Ecosystems and Their Services on the Territory of the Natura 2000 Ecological Network in Bulgaria. Project BG16FFPR002-3.023-0001 “Integrating the Ecosystem Approach and Applying Nature-Based Solutions in the Conservation of Protected Areas Within the Natura 2000 Network”. Ministry of Environment and Water. 2025. Available online: https://www.moew.government.bg/bg/startira-proekt-bg16ffpr002-3-023-0001-integrirane-na-ekosistemniya-podhod-i-prilagane-na-prirodosuobrazni-resheniya-pri-opazvaneto-na-zastitenite-zoni-ot-mrejata-natura-2000/ (accessed on 27 April 2026).
  45. Ministry of Agriculture and Food: Geographical Coverage of the Specialized Layers from the Integrated Administration and Control System (IACS) for Physical Blocks (PB), Areas Eligible for Support (AES), and Permanent Grassland (PG). Available online: https://www.mzh.government.bg/bg/politiki-i-programi/programi-za-finansirane/direktni-plashaniya/identifikaciya-na-zemedelski-parceli/ (accessed on 27 April 2026).
  46. Stewart, I.D.; Oke, T.R. Local Climate Zones for Urban Temperature Studies. Bull. Am. Meteorol. Soc. 2012, 93, 1879–1900. [Google Scholar] [CrossRef]
  47. Google Earth Engine (GEE) Platform and the Dynamic World (DW) V1 Global Land Cover Dataset. Available online: https://developers.google.com/earth-engine/datasets/catalog/GOOGLE_DYNAMICWORLD_V1 (accessed on 27 April 2026).
  48. Haase, D.; Nuissl, H. The urban-to-rural gradient of land use change and imperviouscover: A long-term trajectory for the city of Leipzig. J. Land Use Sci. 2010, 5, 123–142. [Google Scholar] [CrossRef]
  49. Larondelle, N.; Haase, D. Urban ecosystem services assessment along a rural-urban gradient: A cross-analysis of European cities. Ecol. Indic. 2013, 29, 179–190. [Google Scholar] [CrossRef]
  50. Hristova, D.; Stoycheva, V. Mapping of ecosystems in Bulgaria for the needs of natural heritage assessment. J. Bulg. Geogr. Soc. 2021, 45, 89–98. [Google Scholar] [CrossRef]
  51. Aslam, A.; Rana, I.A. The use of local climate zones in the urban environment: A systematic review of data sources, methods, and themes. Urban Clim. 2022, 42, 101120. [Google Scholar] [CrossRef]
  52. Dimitrov, S.; Borissova, B.; Iliev, M.; Semerdzhieva, L. Application of thermal photogrammetry in local climate zones definition for urban heat island effect assessment and mapping of the city of Burgas, Bulgaria. In Proceedings of the Ninth International Conference on Remote Sensing and Geoinformation of the Environment (RSCy2023), Ayia Napa, Cyprus, 3–5 April 2023. [Google Scholar]
  53. Borisova, B.; Semerdzhieva, L.; Dimitrov, S.; Valchev, S.; Iliev, M.; Georgiev, K. Geospatial Prioritization of Terrains for “Greening” Urban Infrastructure. Land 2024, 13, 1487. [Google Scholar] [CrossRef]
  54. Han, J.; Hu, Z.; Sajadi, P.; Li, S.; Zhang, Y.; Cui, R.; Pilla, F. Evaluating urban development in China’s resource-based cities: A new perspective using nighttime light data. Int. J. Digit. Earth 2024, 17, 2349747. [Google Scholar] [CrossRef]
  55. Nedkov, S.; Zhiyanski, M.; Dimitrov, S.; Borisova, B.; Popov, A.; Ihtimanski, I.; Yaneva, R.; Nikolov, P.; Bratanova-Doncheva, S. Mapping and assessment of urban ecosystem condition and services using integrated index of spatial structure. One Ecosyst. 2017, 2, e14499. [Google Scholar] [CrossRef]
  56. Popov, A.; Dimitrov, S.; Borisova, B.; Iliev, M. Research and Mapping of the Urban Heat Island Effect on the Territory of Sofia and Study of Good Practices to Mitigate Its Manifestation. 2019. Available online: https://www.researchgate.net/publication/337830859_PROUCVANE_NA_DOBRI_PRAKTIKI_ZA_TOPLINNITE_OSTROVI_NA_TERITORIATA_NA_STOLICNA_OBSINA_IZSLEDVANE_I_KARTOGRAFIRANE_NA_EFEKTA_NA_GRADSKIA_TOPLINEN_OSTROV_NA_TERITORIATA_NA_SOFIA_I_PROUCVANE_NA_DOBRI_PRAKT?channel=doi&linkId=5dede70d299bf10bc34c5eea&showFulltext=true (accessed on 27 April 2026).
  57. Bartesaghi-Koc, C.; Osmond, P.; Peters, A. Mapping and classifying green infrastructure typologies for climate-related studies based on remote sensing data. Urban For. Urban Greenery 2019, 37, 154–167. [Google Scholar] [CrossRef]
  58. National Statistical Institute. Available online: https://www.nsi.bg/en (accessed on 27 April 2026).
  59. Plan for Integrated Development of Burgas Municipality. Available online: https://plan.smartburgas.eu/%D0%BF%D0%B8%D1%80%D0%BE-2021-2027/ (accessed on 27 April 2026).
  60. Burgas Municipality. Available online: https://www.burgas.bg/en/ (accessed on 27 April 2026).
  61. World Health Organisation. Urban Green Spaces and Health: A Review of Evidence; World Health Organization—Regional Office for Europe: Bonn, Germany, 2016. [Google Scholar]
  62. World Health Organisation. Urban Green Spaces: A Brief for Action; World Health Organization, Regional Office for Europe: Bonn, Germany, 2017; Available online: https://www.who.int/europe/publications/i/item/9789289052498 (accessed on 27 April 2026).
  63. Konijnendijk, C.C. Evidence-based guidelines for greener, healthier, more resilient neighbourhoods: Introducing the 3–30–300 rule. J. For. Res. 2023, 34, 821–830. [Google Scholar] [CrossRef] [PubMed]
  64. Copernicus Land Monitoring Service: Urban Atlas Database. Available online: https://land.copernicus.eu/en/products/urban-atlas (accessed on 27 April 2026).
  65. Burkhard, B.; Maes, J. Mapping Ecosystem Services; Pensoft Publishers: Sofia, Bulgaria, 2017; ISBN 978-954-642-830-1. [Google Scholar]
  66. Agency for Geodesy, Cartography and Cadastre, Bulgaria. Available online: https://kais.cadastre.bg/en (accessed on 27 April 2026).
  67. Nicholson Thomas, I.; Bernardo, F.; Cazacu, C.; Cernecký, J.; Gret-Regamey, A. Towards a standardised monitoring of ecosystem condition: A literature review on indicators and their data sources. Ecol. Indic. 2025, 178, 113952. [Google Scholar] [CrossRef]
  68. Brown, C.F.; Brumby, S.P.; Guzder-Williams, B.; Birch, T.; Hyde, S.B.; Mazzariello, J.; Czerwinski, W.; Pasquarella, V.J.; Haertel, R.; Ilyushchenko, S.; et al. Dynamic World, Near real-time global 10 m land use land cover mapping. Sci. Data 2022, 9, 251. [Google Scholar] [CrossRef]
  69. Grylls, T.; van Reeuwijk, M. How trees affect urban air quality: It depends on the source. Atmos. Environ. 2022, 290, 119275. [Google Scholar] [CrossRef]
  70. European Environment Agency. Landscape Fragmentation in Europe. Available online: https://www.eea.europa.eu/en/analysis/maps-and-charts/landscape-fragmentation-in-europe-data-viewers (accessed on 27 April 2026).
  71. European Environment Agency; Swiss Federal Office for the Environment (FOEN). Landscape Fragmentation in Europe—Joint EEA-FOEN Report; Publications Office: Hong Kong, China, 2011; Available online: https://data.europa.eu/doi/10.2800/78322 (accessed on 27 April 2026).
  72. Wei, J.; Li, Z.; Lyapustin, A.; Wang, J.; Dubovik, O.; Schwartz, J.; Sun, L.; Li, C.; Liu, S.; Zhu, T. First close insight into global daily gapless 1 km PM2.5 pollution, variability, and health impact. Nat. Commun. 2023, 14, 8349. [Google Scholar] [CrossRef]
  73. Jiang, Y.; Menz, S. Green Infrastructure and Integrated Optimisation Approach Towards Urban Sustainability: Case Study in Altstetten-Albisrieden, Zurich. Land 2025, 14, 724. [Google Scholar] [CrossRef]
  74. Sofia Municipality: Regulation on the Construction, Maintenance, and Preservation of the Green System of the Sofia Municipality. Available online: https://sofia.obshtini.bg/doc/275207 (accessed on 27 April 2026).
  75. Bai, J.; Wang, X.; Tu, Y.; Zhou, J.; Wang, X.; Yao, W.; Sun, Z. Integration of ecosystem service composite index and driving thresholds for ecological zoning management: A case study of Qinling-Daba Mountain, China. J. Environ. Manag. 2025, 384, 125309. [Google Scholar] [CrossRef]
  76. Pesaresi, M.; Panagiotis, P. GHS-BUILT-C R2023A—GHS Settlement Characteristics, Derived from Sentinel2 Composite (2018) and Other GHS R2023A Data. European Commission, Joint Research Centre (JRC), 2023, PID. Available online: http://data.europa.eu/89h/3c60ddf6-0586-4190-854b-f6aa0edc2a30 (accessed on 27 April 2026).
  77. Metzger, M.J.; Rounsevell, M.D.A.; Acosta-Michlik, L.; Leemans, R.; Schroter, D. The vulnerability of ecosystem services to land use change. Agric. Ecosyst. Environ. 2006, 114, 69–85. [Google Scholar] [CrossRef]
  78. Shi, C.; Zhan, J.; Yuan, Y.; Wu, F.; Li, Z. Land Use Zoning for Conserving Ecosystem Services under the Impact of Climate Change: A Case Study in the Middle Reaches of the Heihe River Basin. Adv. Meteorol. 2015, 2015, 496942. [Google Scholar] [CrossRef]
  79. Das, M.; Das, A. Estimation of ecosystem services (EESs) loss due to transformation of local climatic zones (LCZs) in Sriniketan-Santiniketan planning area (SSPA), West Bengal, India. Sustain. Cities Soc. 2019, 47, 101474. [Google Scholar] [CrossRef]
  80. Das, A.; Das, M.; Houqe, R.; Pereira, P. Mapping ecosystem services for ecological planning and management: A case from a tropical planning region, Eastern India. Environ. Sci. Pollut. Res. 2023, 30, 7543–7560. [Google Scholar] [CrossRef]
  81. Deng, Z.; Cao, J. Incorporating ecosystem services into functional zoning and adaptive management of natural protected areas as case study of the Shennongjia region in China. Sci. Rep. 2023, 13, 18870. [Google Scholar] [CrossRef] [PubMed]
  82. Almenar, J.B.; Petucco, C.; Sonnemann, G.; Geneletti, G.; Elliot, T.; Rugani, B. Modelling the net environmental and economic impacts of urban nature-based solutions by combining ecosystem services, system dynamics and life cycle thinking: An application to urban forests. Ecosyst. Serv. 2023, 60, 101506. [Google Scholar] [CrossRef]
  83. Longato, D.; Cortinovis, C.; Balzan, M.; Geneletti, D. Identifying suitable policy instruments to promote nature-based solutions in urban plans. Cities 2024, 154, 105348. [Google Scholar] [CrossRef]
Figure 1. Case study area and approach for ecosystem assessment at two spatial scales.
Land 15 01031 g001
Figure 2. Ecosystem types at MAES Level 2 within the FUA borders.
Land 15 01031 g002
Figure 3. Urban morphological characteristics and Green-Gray Coefficient within LCZs in Burgas.
Land 15 01031 g003
Figure 4. Distribution of the final IPr within the FUA-Burgas.
Land 15 01031 g004
Figure 5. Distribution of the UEPI within the FUA-Burgas.
Land 15 01031 g005
Table 1. Selected condition and pressure indicators calculated for all ecosystem types.
IndicatorParameterDataTools Used in ESRI ArcGIS Pro 3.3.0
Urban condition: spatial structureLand-cover compositionGEE 2025Zonal statistics as a table
Raster to polygon
Dissolve
Spatial join
Urban condition: vegetation cover (trees, grass, shrub & scrub)% Vegetation cover GEE 2025Resample
Reclassify
Zonal statistics as a table
Urban pressure: tree cover changeRate of tree cover lossGEE 2018 and 2025Resample
Reclassify
Tabulate area
Field calculator
Join fields
Soil sealing% Increase in sealed surfaces GEE 2018 and 2025Resample
Reclassify
Tabulate area
Field calculator
Join fields
Land-use/land-cover (LULC) change % LULC change & dominant transition types GEE 2018 and 2025 Resample
Compute change raster
Field calculator
Zonal statistics as a table
Erase
Grid index features
Identify
Fragmentation Effective mesh densityGEE 2025
Open Street Map
Zonal Statistics as a Table
Air pollution Δ Average particulate matter PM2.5 concentration GEE 2018 and 2022 Zonal Statistics as a Table
Field Calculator
Table 2. Additional parameters included in the structure of the LCZs.
IndicatorParameter (Calculated for Each LCZ)Data and SourcesTools Used in ESRI ArcGIS Pro 3.3.0
Green-Gray Coefficient% of impervious gray areas and permeable green areasSpatial layer of impervious areas in the city of Burgas for 2023
(Burgas Municipality database)
Erase
Analysis tools—summarize within
The proportion of tree cover in existing green spaces% of tree canopy coverPoint layer with trees in Burgas for 2022 (Burgas Municipality databaseAnalysis tools—buffer
Analysis tools—summarize within
Table 3. Alignment of physical blocks nomenclature with the MAES typology (Level 2 and Level 3) for the FUA-Burgas.
MAES Level 2
Ecosystem Type
Physical Blocks
Urban J1. Residential and public areas of cities and towns & J3. Residential and public low-density areas: Urban area
J2. Sub-urban areas: Arable land; area with poor vegetation; area with other (non-agricultural) purpose; bare and eroded land; cemeteries and graveyards; courtyards; forest area; greenhouses; mixed land use; orchards; other perennials; permanent grassland, pastures and meadows; scrub, shrubs and weeds; disturbed terrain; vineyards
J4. Recreation area outside cities and towns: Archaeological sites, monuments, and tombs
J5. Urban green areas (incl. sport and leisure facilities): Sports and recreation
J6. Industrial sites (incl. commercial sites): Urban area
J7. Transport networks and other constructed hard-surfaced sites: Country roads, land paths and tracks; electric supply and communication facilities; transport territory
J10. Highly artificial man-made waters and associated structures: Gullies, ravines, ditches; irrigation/water engineering facilities; rivers and riverbeds; water areas and wetlands
CroplandArable land; greenhouses; orchards; other perennials; vineyards
GrasslandsPermanent grassland, pastures and meadows; gullies, ravines, ditches
ForestsForest area
Heathland and shrubScrub, shrubs, and weeds
Sparsely vegetated landsArea with poor vegetation; bare and eroded land; territory dispersed/disturbed terrain
WetlandsWater areas and wetlands
Rivers and lakesRivers and riverbeds
Table 4. Local climate zones in Burgas city.
LCZNumber of CellsArea %Mean Pervious Areas %Mean Tree Canopy %
LCZ_3 Compact low-rise buildings212541
LCZ_4 Open high-rise buildings4913944
LCZ_5 Open mid-rise buildings814233650
LCZ_6 Open low-rise buildings18054357
LCZ_8 Large low-rise buildings871252732
LCZ_9 Sparsely built11437922
LCZ_10 Heavy industry513726
LCZ_A Dense trees2118647
LCZ_B Scattered trees24678335
LCZ_C Bush, scrub6329117
LCZ_D Low plants427129517
LCZ_E Bare rock or paved19962134
LCZ_F Bare soil or sand528216
LCZ_G Water34810958
Total346810
Table 5. LULC class-specific recall and overall verification metrics derived from the stratified random sampling assessment (n = 104) for the 2018 and 2025 reference periods.
LULC Class Description2018 Recall (%)2025 Recall (%)
Water92.3092.30
Trees78.6091.70
Grass75.0050.00
Flooded vegetation91.7087.50
Crops61.9060.00
Shrub and scrub80.0070.00
Built area100.00100.00
Bare ground83.3085.70
Overall accuracy80.8076.90
Kappa coefficient0.780.74
Disclaimer/Publisher’s Note: The statements, opinions and data contained in all publications are solely those of the individual author(s) and contributor(s) and not of MDPI and/or the editor(s). MDPI and/or the editor(s) disclaim responsibility for any injury to people or property resulting from any ideas, methods, instructions or products referred to in the content.