Article

Long-Term Vegetation Dynamics and Their Climatic and Non-Climatic Drivers in the Indus River Basin During the 1982–2022 Period

1
Key Laboratory of Geographic Information Science (Ministry of Education), School of Geographic Sciences, East China Normal University, Shanghai 200241, China
2
Yulong Snow Mountain Cryosphere and Sustainable Development National Field Science Observation and Research Station/State Key Laboratory of Cryospheric Sciences and Frozen Soil Engineering, Northwest Institute of Eco-Environment and Resources, Chinese Academy of Sciences, Lanzhou 730000, China
3
Center for Geopolitical and Strategic Studies, East China Normal University, Shanghai 200062, China
4
China Meteorological Administration, Beijing 100081, China
5
European School of Sustainability Science and Research, Faculty of Life Sciences, Hamburg University of Applied Sciences, Ulmenliet 20, D-21033 Hamburg, Germany
6
Laboratory for Monitoring and Modelling the Climate System (LAMMOC), Department of Agricultural and Environmental Engineering, Universidade Federal Fluminense, São Domingos, Niterói 24210-240, RJ, Brazil
7
Center for Food Security Studies and Development, College of Development Studies, Addis Ababa University, Addis Ababa P.O. Box 1176, Ethiopia
8
Department of Environmental Sciences, Karakoram International University, Gilgit 15100, Pakistan
*
Author to whom correspondence should be addressed.
Land 2026, 15(5), 803; https://doi.org/10.3390/land15050803
Submission received: 16 March 2026 / Revised: 30 April 2026 / Accepted: 2 May 2026 / Published: 8 May 2026
(This article belongs to the Section Land–Climate Interactions)

Abstract

Using GIMMS NDVI3g+ data (1982–2022) together with ERA5-Land temperature and precipitation, this study examined long-term vegetation dynamics in the Indus River Basin (IRB) and used a residual trend framework for cautious first-order attribution. Basin-averaged NDVI increased significantly at 0.0061 per decade (p < 0.05), and 65.5% of the basin showed greening, mainly in irrigated croplands and river-adjacent agricultural zones, whereas 12.6% showed degradation concentrated in rapidly urbanizing areas, cryosphere margins, and desert fringes. Partial correlation and residual analyses indicate that climate-related enhancement was most evident in upper-elevation cryosphere transition zones and some lower-basin barren lands, whereas non-climatic residual effects were especially important in intensively managed agricultural landscapes. Because the attribution model includes only temperature and precipitation, the residual component is interpreted here as a non-climatic residual rather than a direct measure of human activity. The study, therefore, provides a spatially explicit basin-wide assessment of vegetation change while highlighting the uncertainty and interpretation limits of residual-based attribution.

1. Introduction

Vegetation plays a vital role in energy exchange, material cycling, soil and water conservation, climate regulation, and the carbon cycle within terrestrial ecosystems, and thus exerts an irreplaceable influence on ecosystem stability and environmental sustainability [1,2]. As a bridge among the Earth’s various spheres, vegetation is a key indicator in global change research because it sensitively reflects variations in ecological and environmental conditions [3,4]. Climate change, as a dominant abiotic control on vegetation distribution and evolution, affects vegetation physiological activity, productivity, and spatial patterns by regulating temperature and precipitation. Under the background of ongoing global climate change, terrestrial ecosystems are undergoing substantial transformations, and vegetation growth patterns and distributions are correspondingly shifting [5]. Meanwhile, human activities, such as urban and rural construction, industrial land expansion, cultivated land development, animal husbandry, and desertification control, have significantly altered vegetation growth processes, phenology, structure, and function. Changes in land-use patterns directly affect the amount and spatial distribution of vegetation, and recent changes in vegetation coverage increasingly reflect the imprint of human intervention [5,6]. Therefore, systematic and quantitative investigation of the spatiotemporal dynamics of vegetation and their responses to climate change and human activities is of major scientific value for understanding terrestrial ecosystem processes and for supporting ecological protection and environmental management.
The Normalized Difference Vegetation Index (NDVI) is one of the most widely used indicators for evaluating vegetation growth conditions and coverage, and it has been extensively applied in studies of vegetation change and its driving factors because of its broad spatial coverage, long temporal continuity, and ease of acquisition [7]. Previous studies based on NDVI time series have shown that, among climatic variables, temperature and precipitation are often the primary factors influencing vegetation growth and development [4]. At the same time, the effects of human activities on vegetation are becoming increasingly prominent, particularly under rapid urban expansion, intensified agricultural activities, and the implementation of ecological restoration projects [6]. In this context, remote sensing (RS) and Geographic Information Systems (GISs) have become indispensable tools for monitoring vegetation dynamics. RS provides long-term, multi-scale, and spatially continuous observations of vegetation conditions, while GIS supports the integration of multi-source datasets, spatial analysis, and visualization of vegetation change patterns. The combination of RS and GIS, therefore, provides an effective basis for detecting temporal variations, mapping spatial heterogeneity, and exploring the relative roles of climatic and anthropogenic drivers. Such analysis is especially important in ecologically fragile regions, where vegetation is highly sensitive to both hydroclimatic variability and human disturbance.
The Indus River Basin (IRB) is a typical vulnerable socio-ecological system characterized by pronounced hydroclimatic gradients, extensive irrigated agriculture, rapid urbanization, and fragile mountain and desert ecosystems. Because the IRB plays a critical role in regional water security, food production, and human livelihoods, understanding how climate variability and non-climatic influences jointly shape vegetation dynamics is of clear importance for basin-scale ecological restoration and sustainable resource management. Vegetation dynamics in the basin are strongly constrained by water availability, heat stress, and cryosphere–hydrology interactions, while irrigation expansion, agricultural intensification, urban development, and ecological engineering may amplify or offset climatic influences.
Several studies have investigated vegetation change and its climatic or anthropogenic controls within the IRB. Abbas et al. [8], focusing on the Upper Indus Basin, demonstrated strong correlations between NDVI and seasonal rainfall and showed that the timing and amount of precipitation critically shape grassland productivity across elevation gradients. Immerzeel et al. [9] highlighted the importance of snow cover and snowmelt as key water inputs sustaining downstream vegetation growth in arid and semi-arid environments. Uereyen et al. [10] reported significant positive NDVI trends in irrigated croplands and linked these trends to improved irrigation practices, land-use change, and favorable climatic conditions, emphasizing the intertwined roles of human and natural factors. More recent basin-scale studies likewise show that vegetation dynamics in the IRB reflect coupled hydroclimatic and land management processes. Mehmood et al. [11] analyzed NDVI growth rates across the IRB and confirmed strong climate controls, while Waseem et al. [12] documented simultaneous vegetation expansion, glacier retreat, and reductions in permanent water bodies. Dharpure et al. [13] further identified groundwater depletion associated with both climate change and intensified irrigation as a critical factor affecting vegetation health, and Rahman et al. [14] developed optimized remote sensing indices to monitor vegetation responses to climate variability and land-use change. In addition, related regional studies have also provided useful insights into the impacts of climate and human intervention on vegetation dynamics in the basin [15].
Although these studies have generated valuable knowledge, three important gaps remain. First, many existing studies focus primarily on spatiotemporal NDVI mapping or on specific subregions, while basin-wide comparison of climatic and non-climatic controls remains limited. Second, although recent full-basin analyses have improved trend characterization, the spatial differentiation of attribution uncertainty is still insufficiently addressed, particularly in high mountains, deserts, and irrigation-dominated plains where vegetation–climate relationships may be weak or non-stationary. Third, many studies interpret residual trends directly as evidence of human influence, but the assumptions and limitations of this residual-based attribution framework are often not fully clarified. In particular, the residual trend (RESTREND) approach may be sensitive to model structure and predictor selection, and unexplained residual variation cannot be equated mechanically with human activities without caution.
Relative to recent IRB studies such as Mehmood et al. [11] and Waseem et al. [12], the contribution of the present study is not merely to re-map NDVI trends. Instead, this study combines long-term basin-scale trend detection for 1982–2022 with a spatially explicit residual trend attribution framework to identify where climatic signals are comparatively strong, where non-climatic residuals dominate, and where interpretation should remain cautious. By doing so, it extends previous descriptive analyses by placing stronger emphasis on attribution logic, uncertainty awareness, and the contrasting vegetation responses of cryosphere margins, irrigated croplands, urbanizing corridors, and desert transition zones within a unified basin-scale framework. Importantly, the study does not interpret residual variation mechanically as direct human activity; rather, it treats the residual as a first-order non-climatic component that requires contextual interpretation.
Accordingly, this study aims to: (1) quantify long-term NDVI trends across the IRB; (2) assess the spatial relationships between NDVI and the dominant climatic variables available consistently for the full study period; and (3) estimate the relative roles of climate-related and non-climatic residual components in vegetation change while explicitly acknowledging the methodological limits of residual attribution. By integrating multi-source remote sensing, climate, hydrological, and land-cover datasets, this research seeks to provide a more cautious and spatially explicit understanding of vegetation dynamics in the IRB and to offer an empirical basis for future multi-factor studies that incorporate irrigation, land-use change, atmospheric moisture demand, and other direct indicators of human influence.

2. Study Area

The IRB is one of the world’s major river systems and has long supported dense settlement, irrigation agriculture, and regional cultural development [16]. Originating near Lake in Tibet, China, the Indus River flows through the Himalayas, traverses Pakistan, and ultimately empties into the Arabian Sea. Along its course, the river nourishes fertile plains that form the backbone of the regional agricultural economy. The basin’s hydrological network is extensive, with major tributaries including the Jhelum, Chenab, Ravi, Beas, and Sutlej rivers in the east, and the Kabul, Shyok, Gilgit, and Swat rivers in the north and west. Together, these rivers sustain vast irrigation systems, support diverse ecosystems, and connect communities across multiple countries.
Under the current pressures of global warming, the Indus River Basin faces multiple challenges, including water scarcity, pollution, and the intensification of climate change impacts. Rapid population growth and the rising demand for sustainable development have placed increasing strain on the basin’s resources. In response, governments, communities, and international partners are working to improve basin management, aiming to safeguard the livelihoods of millions while preserving the river’s ecological integrity for future generations.
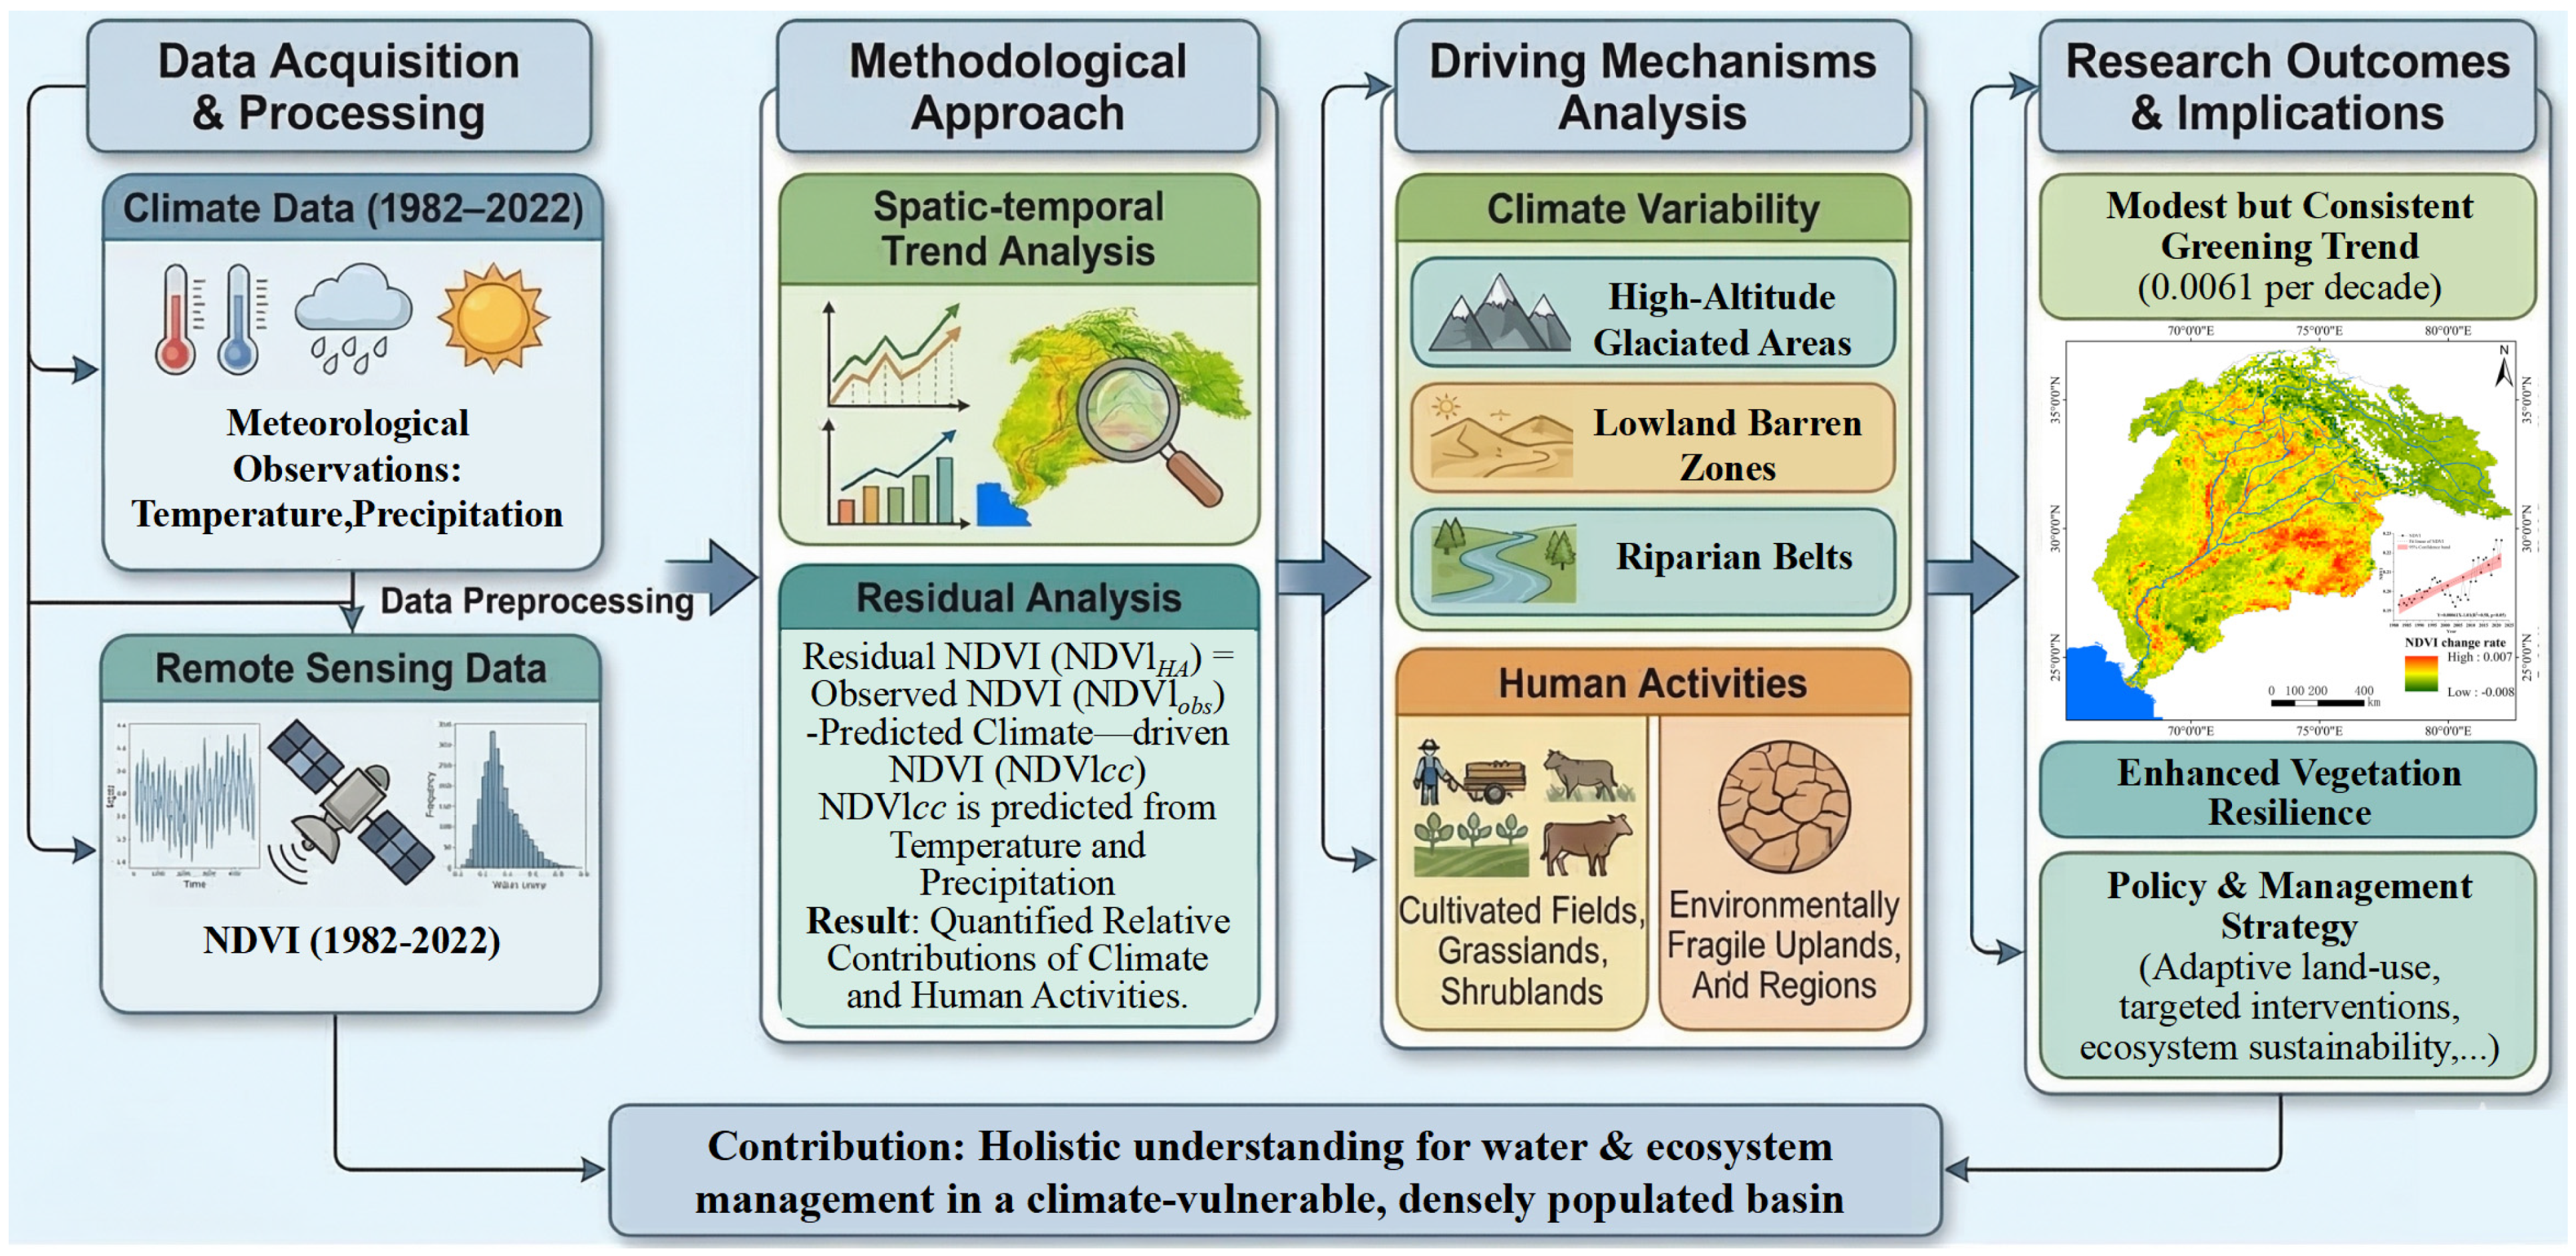
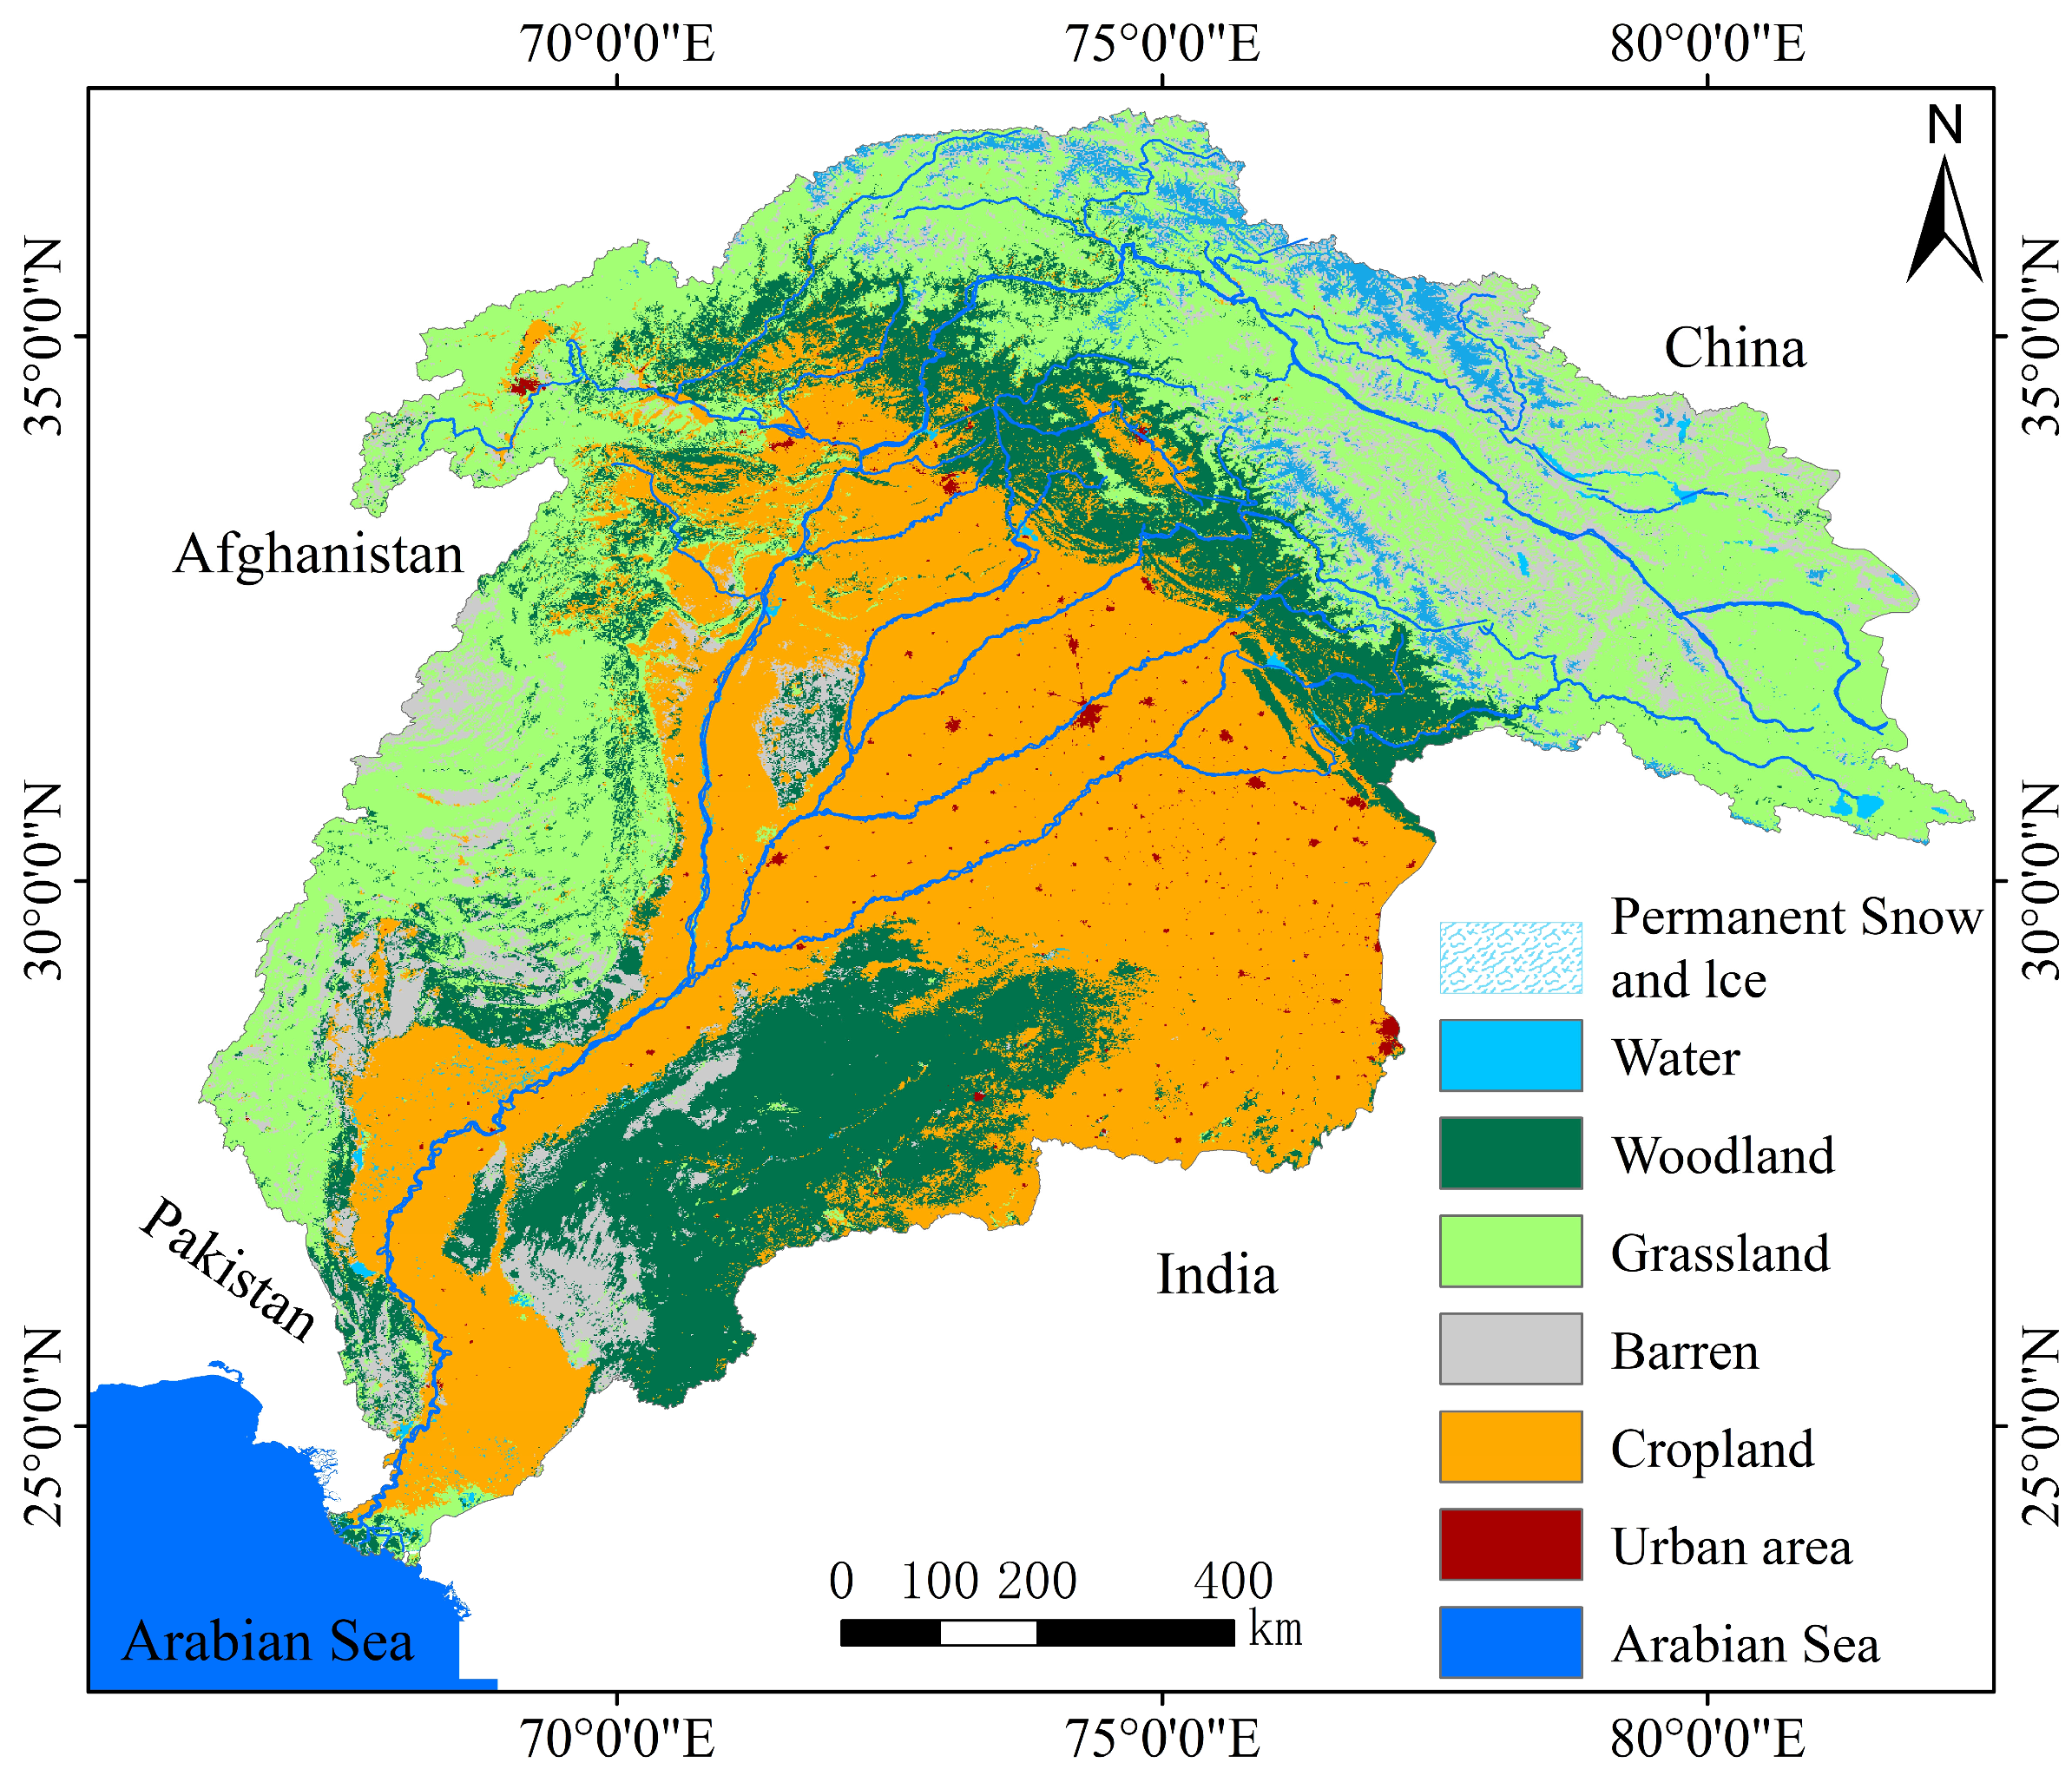
Figure 1 shows the geographic location, land use, and major river network of the IRB. Figure 2 presents the analytical framework used in this study, including data sources, NDVI preprocessing, trend detection, climate–vegetation relationship analysis, and residual-based attribution of vegetation change. Together, these two figures provide the spatial and methodological context for understanding long-term vegetation dynamics and their climatic and non-climatic drivers across the basin.

3. Materials and Methods

3.1. Data

3.1.1. Vegetation Data Processing

This study used the GIMMS-3G+ biweekly NDVI record derived from AVHRR observations for 1982–2022 at 0.0833-degree spatial resolution. The dataset incorporates corrections for inter-sensor calibration differences, orbital drift, sensor degradation, and major atmospheric contamination, thereby improving temporal consistency across the long AVHRR record (Pinzon & Tucker, 2014 [17]; Li et al., 2023 [18]). To reduce residual cloud contamination and bidirectional reflectance effects, biweekly NDVI was first composited to monthly values using the Maximum Value Composite (MVC) method and then aggregated to annual NDVI for trend and attribution analysis.
Basin-wide averages were used to characterize interannual variation, whereas pixel-level analyses were used to identify spatial heterogeneity in NDVI change. This processing workflow follows widely used long-term vegetation-monitoring practice and helps explain why the observed basin-scale trend magnitude is modest but reasonable relative to previous large-area NDVI studies in dryland and mountain basins.

3.1.2. Climate Data Extraction and Processing

Monthly ERA5-Land reanalysis data for 2 m air temperature and total precipitation were obtained at 0.1-degree spatial resolution for 1982–2022 and resampled to the NDVI grid using bilinear interpolation. Temperature was converted from Kelvin to degrees Celsius and precipitation from meters to millimeters. Temperature and precipitation were selected because they are the two most consistently available basin-wide climatic variables across the full study period and because they represent the dominant thermal and water-supply constraints emphasized in prior NDVI studies of arid and semi-arid basins. Nevertheless, this two-variable representation does not capture the full climatic control on vegetation. Variables such as vapor pressure deficit, solar radiation, soil moisture, humidity, snowmelt timing, and drought indices may also influence NDVI, especially in the IRB, where atmospheric water demand and cryosphere processes are important. The present climate dataset should therefore be interpreted as a first-order baseline for basin-scale comparison rather than a complete representation of climate forcing.

3.2. Methodology

3.2.1. Theil–Sen Median Trend Test and Mann–Kendall Test Method

Theil–Sen median trend analysis is a robust non-parametric statistical method for calculating trends, also known as Sen-slope estimation (Yang et al., 2019) [19]. Because it is relatively insensitive to measurement errors and outliers, it is widely used in long-term meteorological, hydrological, and ecological trend analysis (Wei et al., 2022) [20]. The Sen-slope is defined as follows:
S N D V I = M e d i a n ( N D V I j N D V I i j i ) ( 1 i j n )
When SNDVI > 0, NDVI shows an increasing trend, whereas SNDVI < 0 indicates a decreasing trend. Median denotes the median value, i and j represent years, NDVIi is the NDVI value in year i, and n is the number of observations in the time series.
The Mann–Kendall (MK) test is a non-parametric significance test that does not require a specific data distribution. After calculating Sen’s slope, the MK test was used to determine whether the trend was statistically significant. The formulas are as follows.
Set   the   { NDVI i } ,   i   =   1982 ,   1983 ,   ,   2022
Define the Z-statistic as
Z = S 1 var ( S ) , S > 0 0 , S = 0 S + 1 var ( S ) , S < 0
S = j = 1 n 1 i = j + 1 n sgn ( N D V I j N D V I i )
sgn ( N D V I j N D V I i ) = 1 ,   N D V I j N D V I i > 0 0 , N D V I j N D V I i = 0 1 , N D V I j N D V I i < 0
v ar ( S ) = n ( n 1 ) ( 2 n + 5 ) 18
where n is the number of datapoints in the sequence, NDVIi and NDVIj represent the NDVI values in the ith year and jth year, respectively. Sgn is a sign function. At the given significance level, when |Z| > u1 − α/2, it indicates a significant change in time series data in the study at the level of α. This study judged the significance of the NDVI time-series change trend at the confidence level of α = 0.05.

3.2.2. Partial Correlation Analysis Method

Vegetation growth is jointly influenced by temperature and precipitation, and partial correlation analysis was used to quantify the independent relationship between NDVI and each climatic factor while statistically controlling for the other variable [21]. This approach helps reduce confounding caused by covariance between temperature and precipitation, but it does not fully remove multicollinearity or capture nonlinear interactions.
R x y z = ( R x y R x z × R y z ) ( 1 R x z 2 ) × ( 1 R y z 2 )
where Rxy·z is the partial correlation coefficient between x and y when z is held constant; Rxy, Ryz, and Rxz are the pairwise correlation coefficients among the variables; x denotes NDVI; y denotes temperature; and z denotes precipitation.
This analysis was used to determine whether temperature and precipitation exerted positive or negative effects on NDVI and whether these relationships were statistically significant. To improve interpretive rigor, areas with weak or insignificant NDVI–climate relationships were regarded as higher-uncertainty zones in the subsequent discussion, particularly in high-mountain and desert regions where climate–vegetation coupling may be unstable. Accordingly, the partial correlation results are interpreted as first-order linear diagnostics rather than as complete descriptions of vegetation–climate interactions.
It is important to note that partial correlation analysis controls for linear relationships among variables but does not fully eliminate multicollinearity or account for nonlinear interactions. Therefore, the results should be interpreted as first-order approximations of the relationships between NDVI and climatic variables.

3.2.3. Multiple Linear Regression and Residual Analysis Method

Multiple linear regression was used to estimate NDVICC, that is, the NDVI component predicted from temperature and precipitation [22]. For each grid cell, annual NDVI was regressed against annual temperature and precipitation over 1982–2022, and the fitted values were taken as the climate-related NDVI component.
N D V I C C = a × T + b × P + c
where NDVICC is the predicted vegetation NDVI, P is annual total precipitation (mm), T is annual mean temperature (°C), a and b are the regression coefficients estimated from the observed annual time series at each grid cell, and c is the intercept term. These coefficients were calculated in this study rather than adopted from previous work.
Residual analysis was then used to separate observed NDVI change into a climate-related fitted component and an unexplained residual component. In this study, NDVIHA denotes the residual term obtained as NDVIobs minus NDVICC. Because the regression includes only temperature and precipitation, NDVIHA is interpreted as a non-climatic residual rather than as a direct and exclusive measure of human activity.
The formula is as follows:
N D V I H A = N D V I o b s N D V I C C
NDVIobs is satellite-observed NDVI (combined climate and non-climatic effects), and NDVICC is climate-predicted NDVI. The residual method has been widely used to provide a first-order distinction between climate-related and residual vegetation change [23], but the interpretation of the residual depends on model structure, predictor choice, and data quality.
In this study, the residual component is interpreted cautiously as a first-order proxy for non-climatic effects rather than as a direct and exclusive measure of human influence. This distinction is important because the residual may also reflect model misspecification, omitted climate variables, nonlinear responses, and lagged vegetation effects. Although the residual trend (RESTREND) framework remains useful for basin-wide comparative analysis because it provides a transparent decomposition of observed vegetation change into climate-related and residual components, its explanatory power depends strongly on model design. Therefore, this study does not assume that all unexplained variance is anthropogenic in a strict causal sense. Instead, the residual trend is used to identify locations where observed NDVI change cannot be adequately explained by the selected climatic predictors alone.
Because NDVI may respond to climatic forcing with delayed effects, especially in snow-fed and moisture-limited environments, the linear contemporaneous model used here should be regarded as a simplified representation. Future studies should test lag structures, nonlinear response functions, and expanded predictor sets, and should report grid-level or regional regression diagnostics together with significance masks for attribution maps. Following Shi et al. [24], the relative contributions of climate change and non-climatic residual effects to NDVI change were assessed by comparing annual variations in NDVIobs, NDVICC, and NDVIHA. Based on the framework of Liu YF [25], the relative impacts of climate change and non-climatic effects in the IRB during 1982–2022 were classified into six scenarios (Table 1).

4. Results and Discussion

4.1. Change Characteristics of NDVI in Spatial and Temporal Scales over the Indus River Basin

4.1.1. Change Characteristics of NDVI in Temporal Scales over the Indus River Basin

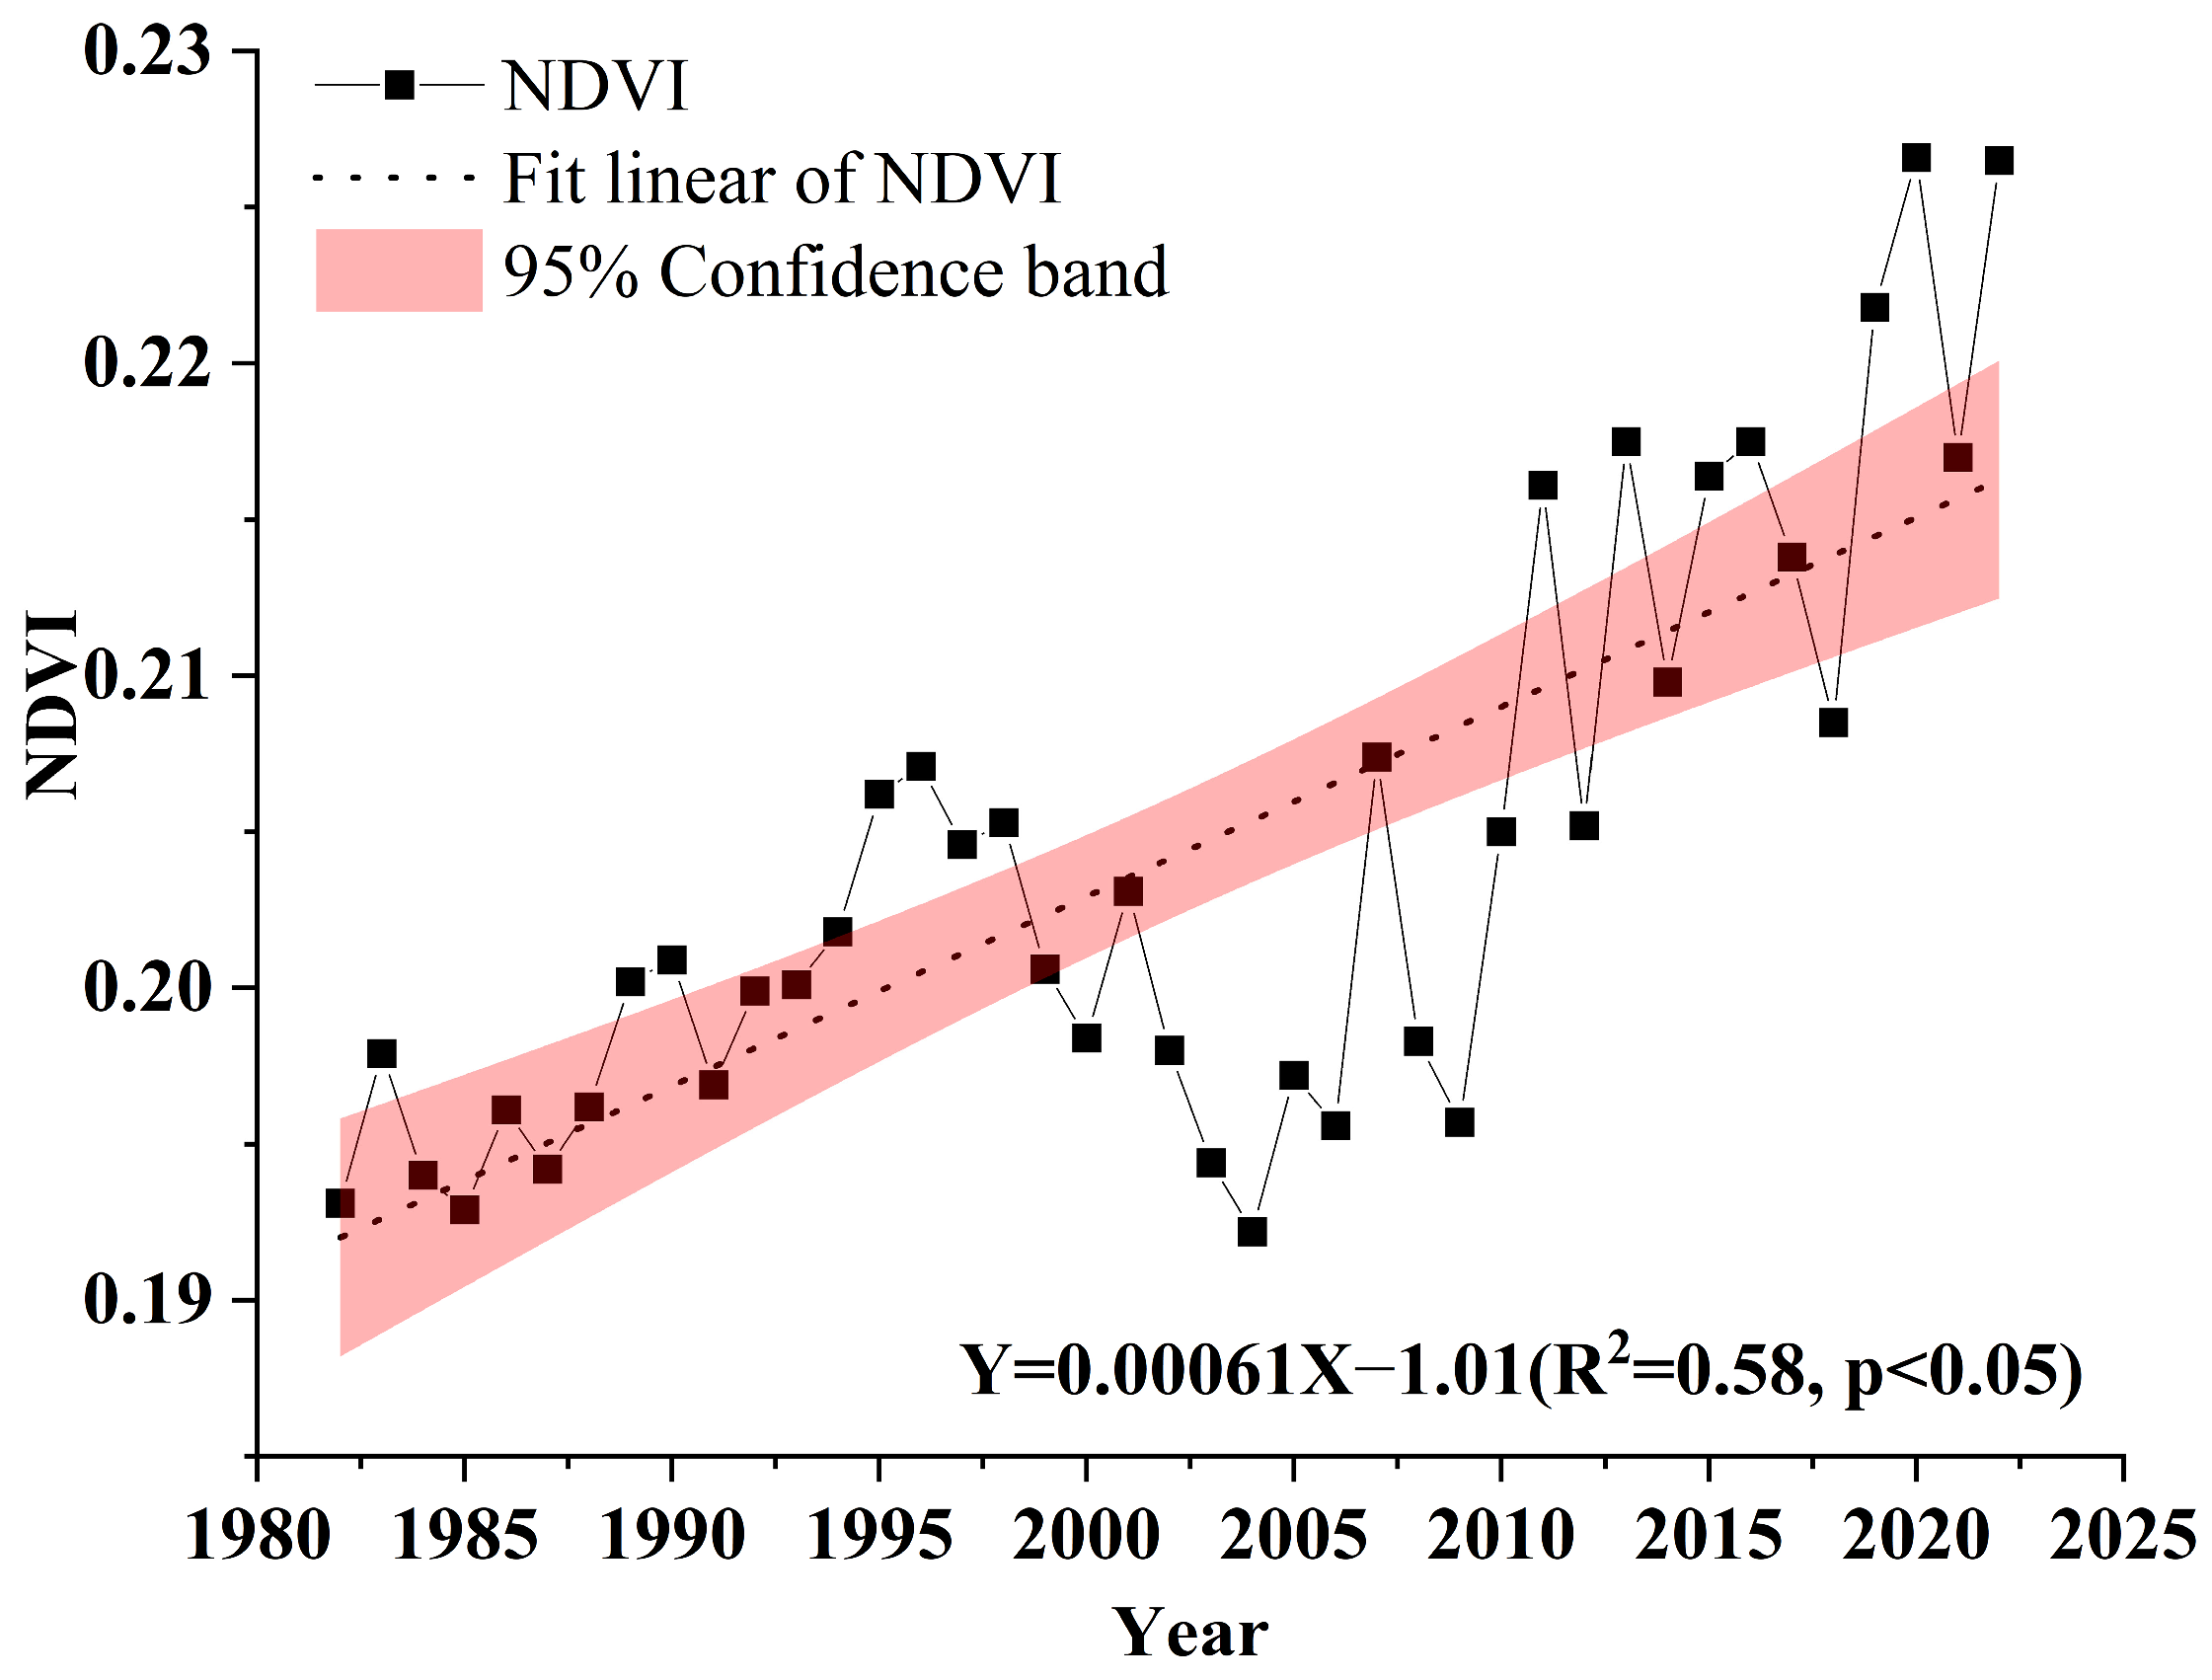
Figure 3 shows a significant increasing trend in basin-averaged NDVI across the IRB during 1982–2022, with a rate of 0.0061 per decade (R2 = 0.58, p < 0.05). Although this increase is modest in absolute magnitude, it is reasonable for a large heterogeneous basin containing extensive deserts, high mountains, and intensively managed croplands. Comparable studies in large dryland regions have likewise reported relatively small but statistically meaningful NDVI trends, indicating that the value observed here is within a plausible range. Interannual variation can be divided into four phases. From 1982 to 1988, NDVI remained low and reached a minimum of 0.192 in 1985. From 1989 to 1999, NDVI recovered slightly and stabilized around 0.202. During 2000–2009, NDVI declined slightly to about 0.198, suggesting a stagnation period under elevated environmental stress rather than demonstrating a basin-wide drought diagnosis by itself. From 2010 to 2022, NDVI increased again and reached 0.227 in 2022, indicating a renewed recovery in vegetation activity.
Overall, the IRB exhibited a long-term greening trend, but this increase was not monotonic. The temporary stagnation during the early 2000s suggests that vegetation dynamics remained sensitive to water stress, land degradation, and hydroclimatic variability. Thus, greening in the basin coexisted with ecological instability, especially in water-limited environments where warming may enhance vegetation growth in some cold-limited areas but intensify stress in already fragile ecosystems.

4.1.2. Change Characteristics of NDVI in Spatial Scales over the Indus River Basin

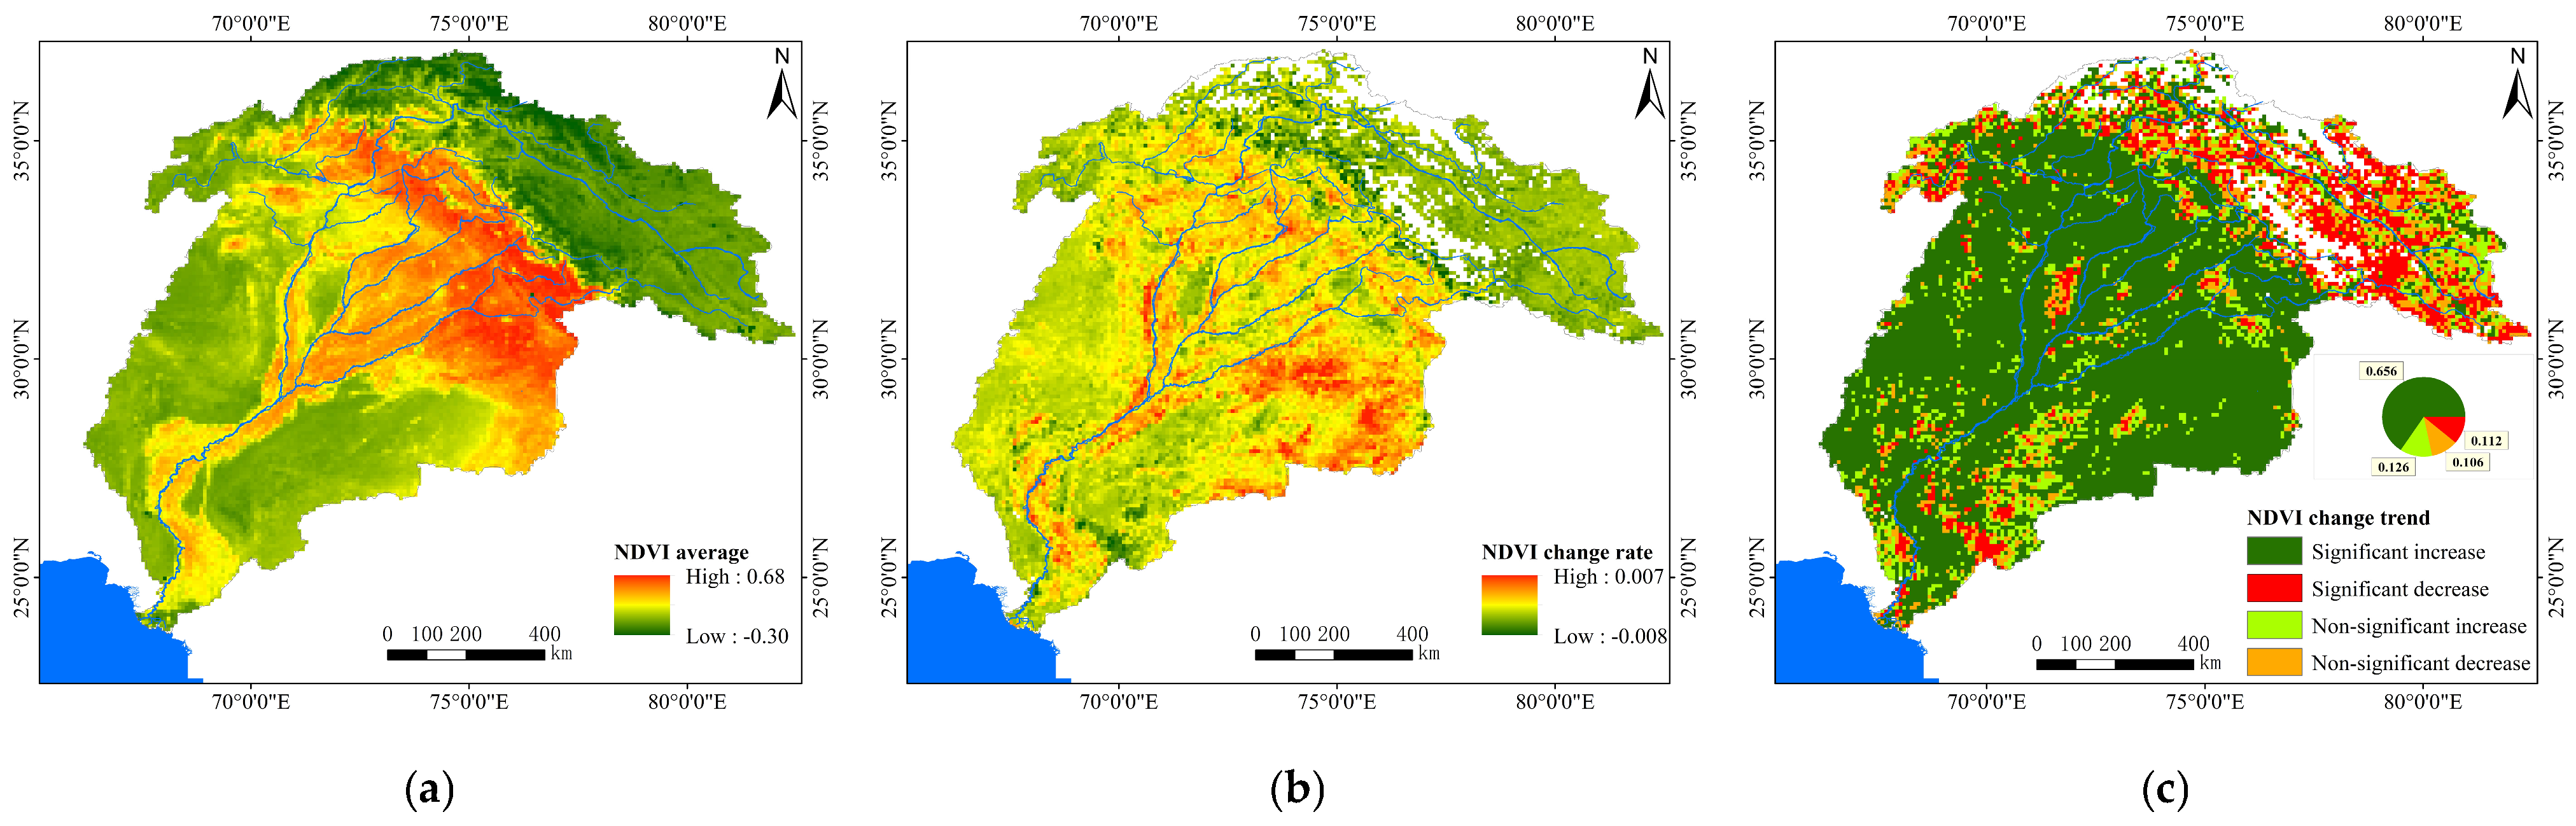
Figure 4 presents the spatial distribution of mean NDVI, trend magnitude, and trend significance in the Indus River Basin during 1982–2022 based on the Theil–Sen median slope estimator. As a nonparametric and robust method, the Theil–Sen approach is particularly suitable for long-term remote sensing analyses because it reduces the influence of outliers compared to ordinary least squares regression. The results show that the interannual NDVI change rate ranged from −0.08 to 0.07 per decade, indicating pronounced spatial variability in vegetation dynamics across the basin.
Overall, areas with increasing NDVI clearly exceeded those with decreasing trends, confirming a general greening tendency over the past four decades. However, this greening is not spatially uniform. Regions exhibiting significant increases in NDVI are generally associated with areas of greater water availability and more intensive land use, particularly in the middle reaches along riverbanks and floodplains, where favorable hydrothermal conditions and agricultural development support higher vegetation productivity. In contrast, weaker or negative trends are predominantly observed in climatically constrained environments.
Mean NDVI also shows clear differentiation among ecological zones. The upper cryosphere region maintains persistently low NDVI due to high elevation, low temperatures, and perennial snow and ice cover. Similarly, the lower arid desert zone exhibits low NDVI values, reflecting sparse vegetation under strong water limitation. These patterns highlight the combined influence of climatic gradients and land management practices in shaping vegetation dynamics across the basin.
In terms of trend patterns(Figure 4c), about 65.6% of the basin showed significant NDVI increases, mainly concentrated in irrigated agricultural areas along the main stem of the Indus River and its major tributaries, especially in the middle and lower basin. These improvements likely reflect the combined effects of favorable climate conditions, irrigation support, water-resource regulation, and land management. By contrast, 11.1% of the basin exhibited degradation trends, mainly in rapidly urbanizing corridors, cryosphere transition zones in the upper basin, and desert margins in the south. This subregional contrast highlights that the basin should not be interpreted as responding uniformly to either climate or human pressure.
The interpretation of these degradation hotspots, however, requires caution. In urban areas, NDVI declines are plausibly associated with built-up expansion and the conversion of vegetated land. In cryosphere margins and desert transition zones, degradation may also reflect climate stress, hydrological instability, sparse vegetation background, or uncertainties related to topography and data quality. These areas should therefore be regarded as ecologically vulnerable zones where additional validation using land-use change, night-time lights, irrigation, or groundwater data would be valuable before attributing degradation directly to human disturbance.

4.2. Natural Climatic Drivers of NDVI Dynamics

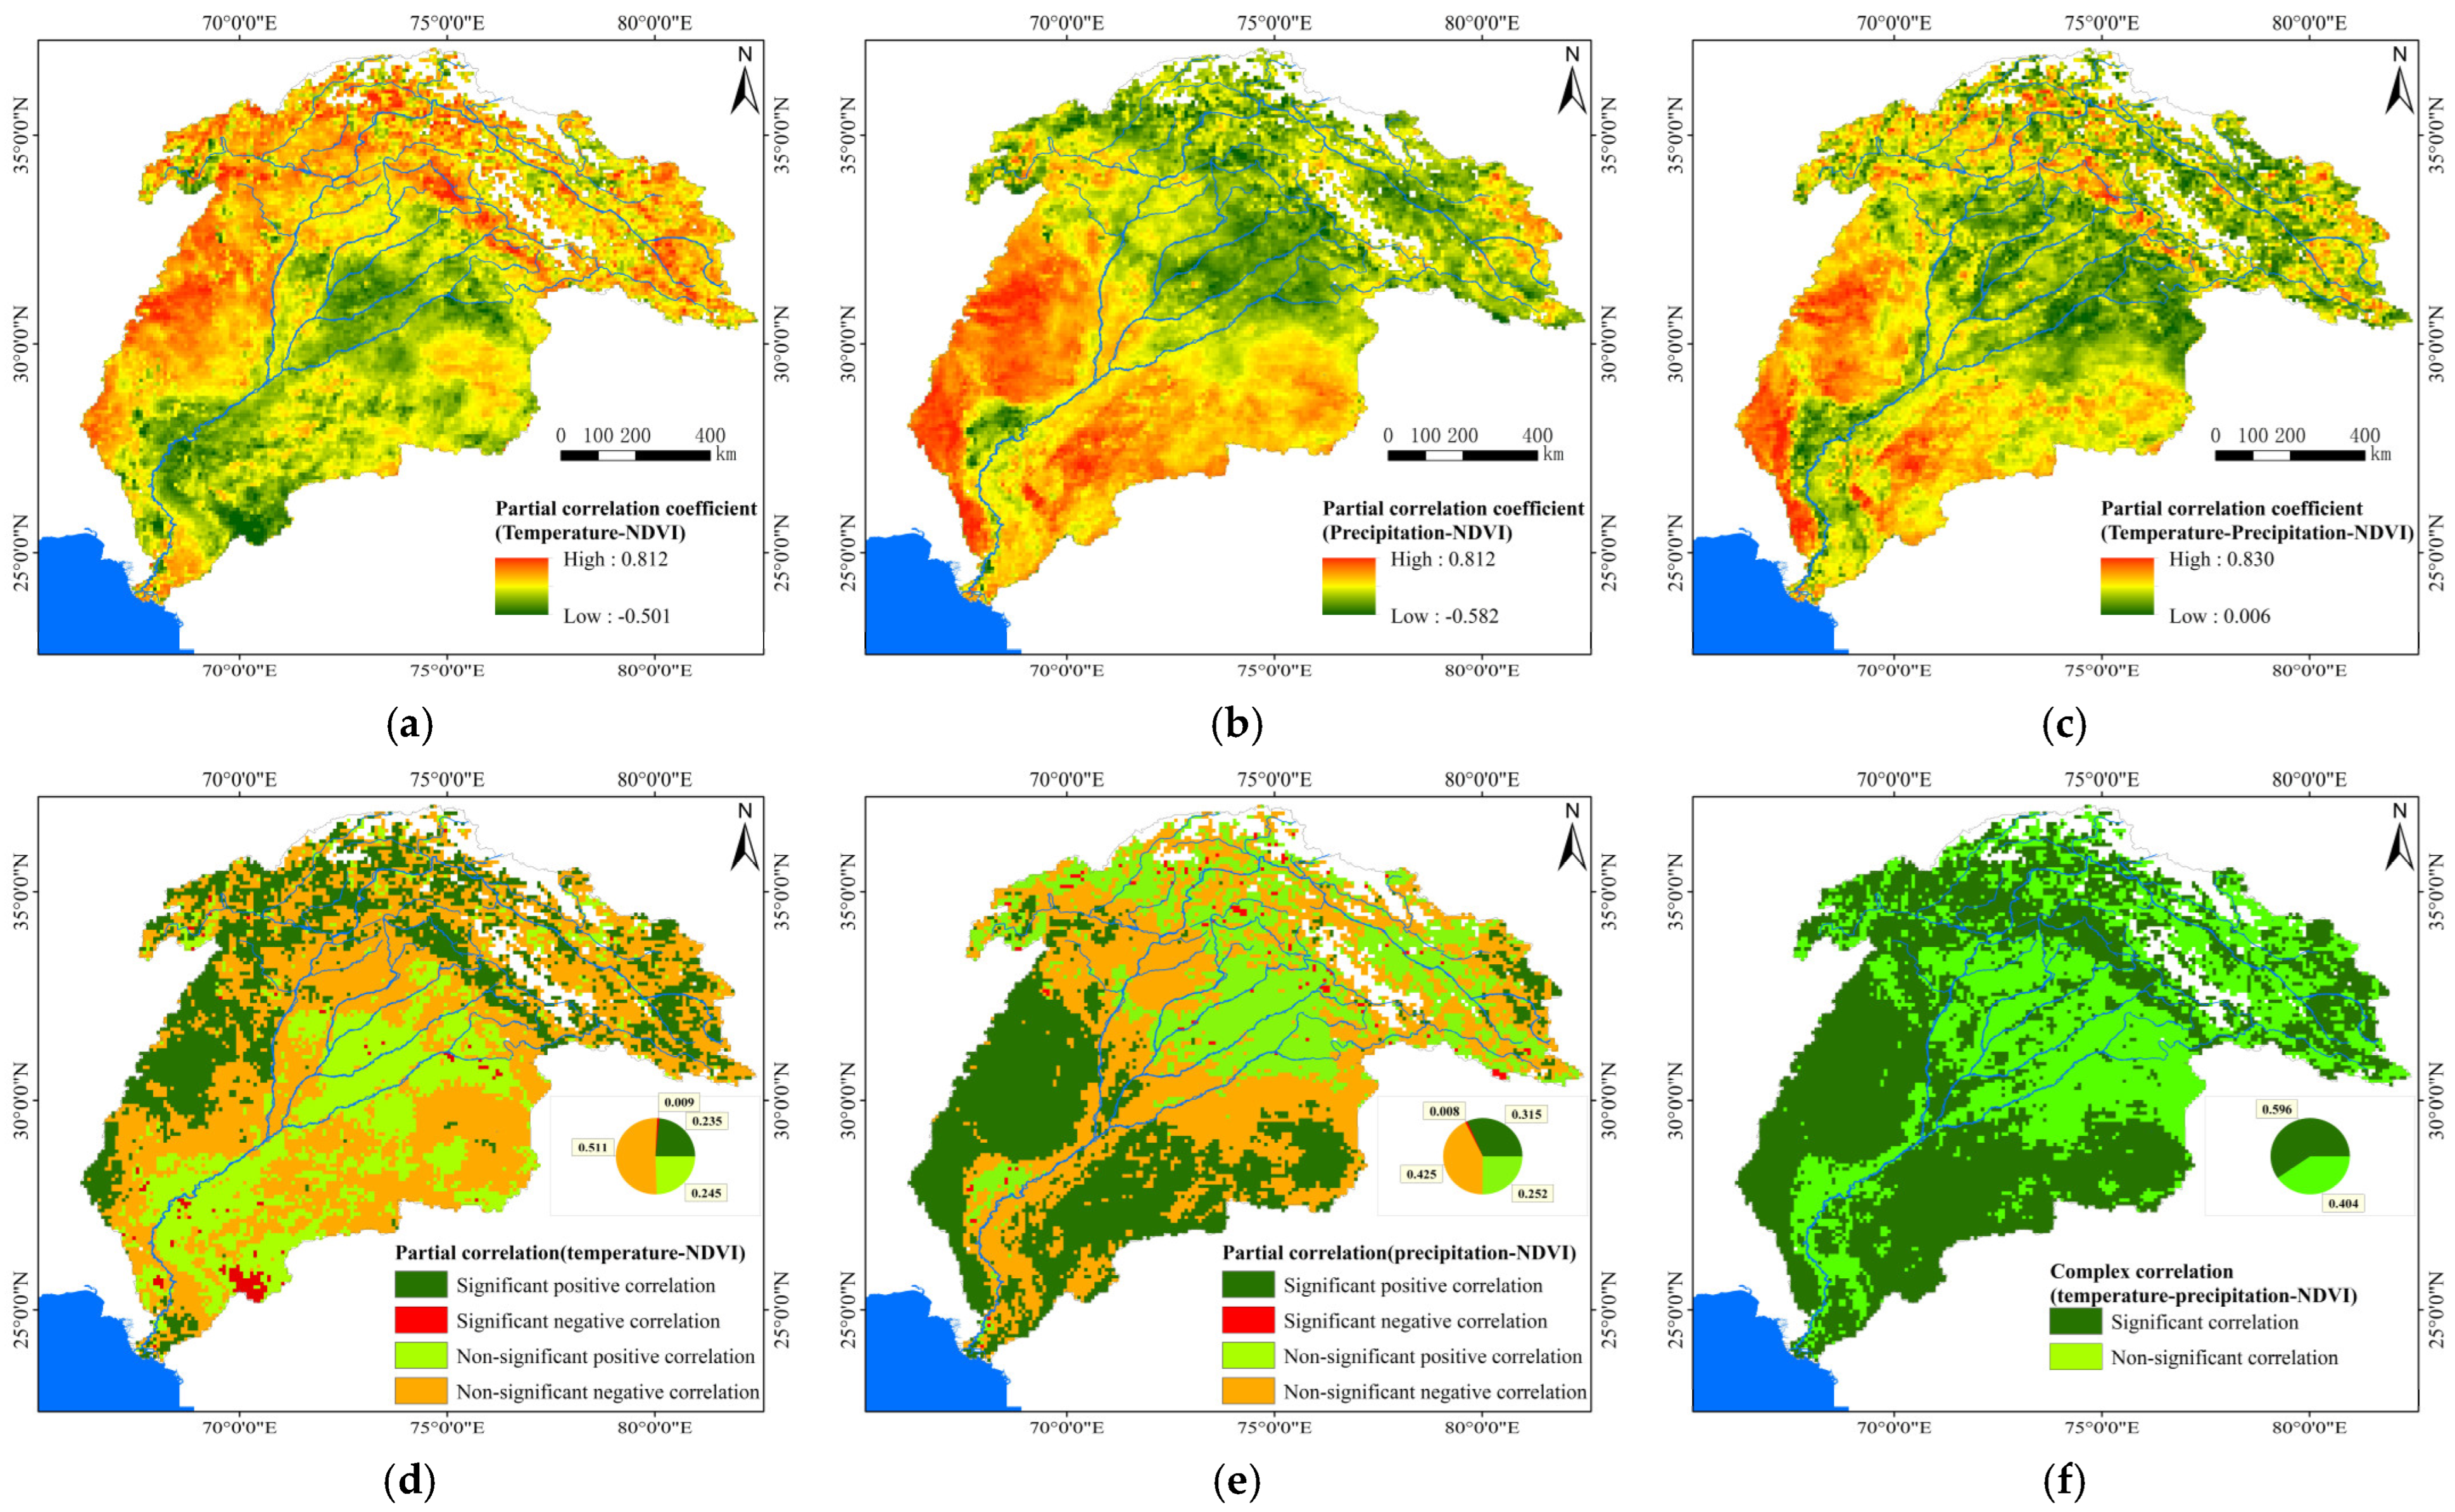
To better understand the mechanisms driving vegetation dynamics, this study employed partial correlation analysis to assess the independent contributions of temperature and precipitation to NDVI change while statistically controlling for the other variable. Figure 5, therefore, presents six panels describing both variables and their significance patterns, allowing a more explicit interpretation of climate–vegetation coupling across the basin. And Figure 5 panels (a), (b), and (c) show the partial correlation patterns of NDVI with temperature, precipitation, and climate, respectively; panels (d) and (e) show the corresponding significance levels of the NDVI–temperature and NDVI–precipitation relationships; and panel (f) shows the complex correlation of climate on NDVI.
The climate-related fitted component analysis had a mean positive correlation of 59.6% and a negative correlation of 40.4% across the basin (Figure 5f). Positive climate-related effects were concentrated mainly in upper-basin cryosphere transition zones and lower-basin barren or desert areas. In upper-elevation regions, warming may promote earlier snowmelt and lengthen the growing season, thereby supporting seasonal vegetation activity. In some lower-basin drylands, modest increases in effective moisture may alleviate drought constraints. Negative climate-related effects were more scattered along the Indus River and its tributaries, where ecosystems are sensitive to drought, heat stress, and water–heat mismatch.
It is important to note that increases in NDVI do not necessarily indicate ecological recovery or improved ecosystem conditions. In managed landscapes, particularly in agricultural regions, NDVI trends may reflect intensification practices such as irrigation, fertilization, or multiple cropping cycles rather than natural vegetation dynamics [26,27,28].

4.2.1. Relationship Between NDVI and Temperature

The partial correlation coefficient between NDVI and temperature ranged from −0.501 to 0.812, indicating clear spatial heterogeneity across the IRB (Figure 5a). Overall, positive temperature–NDVI relationships occupied about 48% of the basin, and significant positive correlations accounted for about 23.5% of the total area (Figure 5d). These areas were mainly distributed in the southwest and southeast of the basin, particularly in woodland, grassland, and ice-snow transition zones. In such environments, moderate warming may extend the growing season and enhance photosynthetic activity, making temperature an important driver of vegetation growth under relatively favorable moisture conditions.
By contrast, negative temperature effects were more limited in extent, accounting for about 52% of the basin, while significantly negative correlations occupied only about 0.9% of the total area (Figure 5d). These areas were mainly concentrated in urban cores and surrounding built-up zones, where vegetation growth may be constrained by urban heat-island effects, excessive temperature stress, and land-cover conversion. Overall, temperature acted mainly as a positive driver of vegetation growth in the IRB, although its promoting effect was spatially uneven and more evident outside heavily urbanized areas.

4.2.2. Relationship Between NDVI and Precipitation

The partial correlation coefficient between NDVI and precipitation ranged from −0.582 to 0.812, indicating substantial spatial heterogeneity across the basin (Figure 5b). Overall, about 56.7% of the basin showed positive precipitation–NDVI relationships (Figure 5e), with positive effects being especially evident in the northern and northwestern water-limited regions, where additional moisture supports vegetation growth. This suggests that precipitation plays an important supportive role in arid and semi-arid marginal ecosystems.
By contrast, negative precipitation effects were more limited and mainly concentrated in high-altitude cryosphere and mountainous areas. Only about 0.8% of the basin showed a significant negative correlation (Figure 5e). In these regions, precipitation often occurs in the form of snow or ice and therefore does not directly translate into immediately available soil moisture for vegetation. In some cases, increased precipitation may also reduce surface temperature and suppress plant growth. Overall, precipitation remained an important but regionally contingent control on vegetation dynamics, and its ecological effect depended strongly on altitude, water–heat balance, and the form and timing of moisture input.

4.2.3. Spatial Differences and Comprehensive Interpretation

Figure 5f shows that significant positive relationships are concentrated mainly in the southwest and southeast, where temperature and precipitation jointly support vegetation growth. In contrast, correlations are weaker in the northern and northwestern parts of the basin, where complex topography, snow processes, sparse vegetation cover, and unstable water supply increase the uncertainty of climate–vegetation relationships.
From the perspective of ecological limiting factors, temperature remains an important control on vegetation growth in high-altitude mountainous areas, whereas both temperature and precipitation jointly influence vegetation conditions in the middle and lower basins. Precipitation effects are especially region-dependent because their ecological role varies with water–heat balance, altitude, and seasonal moisture availability. Overall, the results suggest that climate is a key regulator of vegetation dynamics in the IRB, but its influence is spatially heterogeneous.
These relationships, however, should not be interpreted as purely linear or stationary. Extreme climatic events, such as heat waves, droughts, and floods, may disrupt otherwise positive climate–greenness relationships by causing physiological stress or physical damage to vegetation, which may partly explain the observed interannual instability. Therefore, ecological management in the IRB should account for regional climatic sensitivity, with particular attention to vulnerable mountain, desert-margin, and urbanizing areas through more targeted land-use planning, water-resource allocation, and climate adaptation strategies.

4.3. Socioeconomic Drivers of NDVI Dynamics

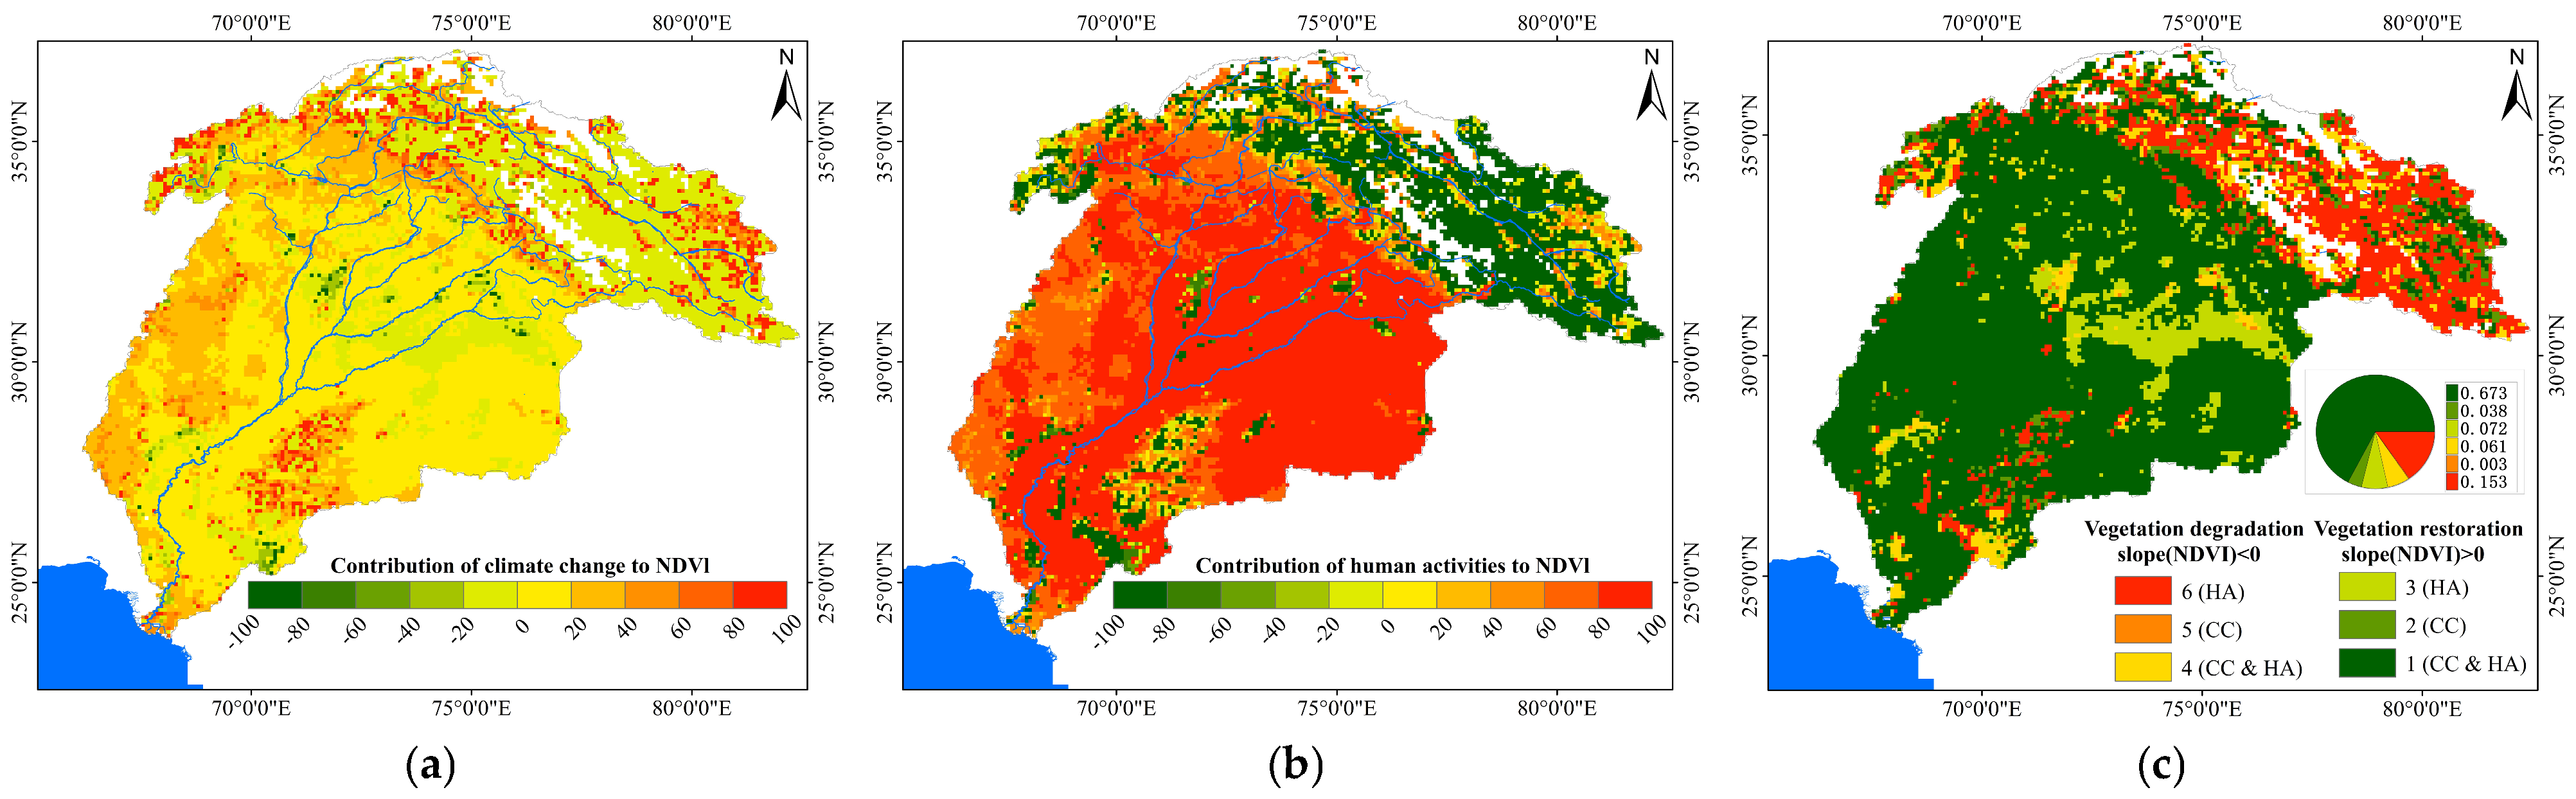
Climate change and human activities are the primary drivers of vegetation dynamics. Understanding their relative mechanisms is of great significance for formulating precise ecological governance and adaptation strategies. To quantify the relative contributions of climate change and human activities to vegetation dynamics in the IRB, this study separated the impacts of climate factors and human activities through the residual trend method (RESTREND), thereby estimating the contribution rate and spatial distribution pattern of each factor (Figure 6).

4.3.1. Non-Climatic Residual Contribution Pattern

Non-climatic residual effects played a more dominant role than the climate-related fitted component in many managed parts of the basin (Figure 6). Positive residual trends were mainly distributed in farmland, grassland, and shrubland, where irrigation projects, agricultural intensification, ecological restoration, and water-resource regulation may have improved vegetation cover. However, the interpretation of this residual as direct human activity must remain cautious because the model does not include irrigation intensity, groundwater extraction, urban extent change, or atmospheric moisture demand.
Negative residual trends were concentrated in cryosphere margins, wastelands, desert edges, and some urban expansion zones. In some locations, these patterns may reflect overgrazing, land-use conversion, mining, tourism pressure, or vegetation loss due to built-up expansion. In other locations, however, they may arise from data artifacts, nonlinear climate stress, or weak NDVI–climate relationships. The present results should therefore be interpreted as identifying likely non-climatic hotspots rather than proving direct anthropogenic degradation in a strict causal sense.

4.3.2. Socioeconomic Mechanisms Associated with NDVI Dynamics

To quantitatively identify the primary drivers of NDVI variation, we conducted Pearson correlation analysis between NDVI and four socioeconomic indicators: population density, agricultural GDP, nightlight, and agricultural irrigation area (Table 2). Results revealed statistically significant relationships (p < 0.001) across all variables. Among them, agricultural irrigation exhibited the strongest positive correlation with NDVI (r = 0.4459), followed by agricultural GDP (r = 0.2099). By contrast, both population density (r = −0.3138) and nightlight intensity (r = −0.2555) were moderately and negatively correlated with NDVI. These findings suggest that while certain anthropogenic factors contribute to vegetation degradation through urbanization and population pressure, others—particularly those related to agricultural modernization—facilitate vegetation greening.
These patterns are consistent with irrigation expansion and land management practices reported in previous studies in the region, although these processes are not directly quantified in the present analysis and should therefore be interpreted with caution [27].
To capture the complex, potentially nonlinear relationships between socioeconomic factors and NDVI, three widely used machine learning algorithms—Random Forest, Support Vector Regression (SVR), and Gradient Boosting—were employed. Using NDVI 30,000 random samples and four explanatory variables, model performance was assessed on independent test data through the coefficient of determination (R2), root mean square error (RMSE), and training time. Gradient Boosting outperformed both Random Forest and SVR in predictive accuracy (Table 3), demonstrating its superior ability to model the heterogeneous and interactive effects of socioeconomic drivers on vegetation dynamics. The relatively high R2 value indicates that these factors explain approximately 46.5% of the spatial variance in NDVI, highlighting the significant—but not complete—role of anthropogenic influences.
It is important to distinguish the socioeconomic analysis in this section from the residual-based non-climatic component presented in Section 4.3.1. The residual method identifies spatial patterns of NDVI change that cannot be explained by temperature and precipitation alone and therefore provides an indirect estimate of non-climatic influence over the 1982–2022 period. By contrast, the socioeconomic analysis uses independent indicators of human pressure and management to identify which specific factors are statistically associated with NDVI variation. The two approaches are complementary rather than equivalent, because the residual may also contain omitted environmental effects and model uncertainty, while the socioeconomic datasets represent specific human drivers rather than the total non-climatic signal.
Feature importance analysis from tree-based models (Random Forest and Gradient Boosting) revealed the relative contributions of each socioeconomic variable. Across models, agricultural GDP ranked first in importance (0.3397), followed by population density (0.2846), agricultural irrigation area (0.2677), and nightlight (0.1080). Although agricultural irrigation showed the strongest bivariate correlation with NDVI, its slightly lower averaged importance suggests that its effects may interact synergistically with other factors, particularly agricultural GDP. The prominence of agricultural GDP emphasizes the role of economic investment and productive capacity in promoting vegetation growth, likely through mechanized farming, improved inputs, and efficient irrigation systems. Meanwhile, the significant influence of population density highlights the impact of human presence and activities, which drive land management decisions and can exert ecological pressure.
We examined two-way interaction strengths among the four drivers using conditional inference frameworks. The analysis revealed several significant interaction pairs. Notably, the interaction between agricultural GDP and agricultural irrigation exhibited the highest interaction strength (0.1302), with a combined effect (0.4581) significantly exceeding the sum of their isolated effects (0.2099 and 0.4459, respectively) (Table 4). This strong synergy underscores the ecological benefit of coordinated economic and infrastructural development: when financial investment in agriculture is paired with effective irrigation, substantial vegetation enhancement can be achieved. In contrast, the interaction between population density and agricultural GDP showed limited reinforcement (interaction strength = 0.0520), suggesting that demographic pressure may dilute the positive effects of economic growth in high-density areas. Similarly, the weak interaction between population density and nightlight intensity (0.0293) points to a compounded negative effect on vegetation in rapidly urbanizing regions, where increased human footprint and energy consumption contribute to vegetation suppression.
In summary, our integrated analysis demonstrates that NDVI dynamics in the study region are governed by a suite of socioeconomic drivers operating both independently and interactively. Agricultural GDP and agricultural irrigation emerge as the foremost positive drivers, reflecting the pivotal role of economic investment and water-efficient technologies in promoting vegetative growth. Conversely, population density and nightlight intensity are associated with vegetation decline, indicative of the ecological trade-offs accompanying demographic expansion and urbanization. Notably, the identification of a strong positive interaction between agricultural GDP and irrigation highlights the importance of policy alignment and integrated rural development. While human activities remain the principal force behind observed patterns of greening and browning, their impacts are deeply shaped by the structural interplay of economic capacities and infrastructural configurations. These insights call for spatially differentiated and sectorally integrated land management strategies that optimize the benefits of human intervention while safeguarding ecological integrity in regions undergoing profound anthropogenic transformation.

4.4. The Combined Impacts of Climate Change and Human Activities on NDVI

Vegetation dynamics in the IRB are shaped by the coupled effects of climate-related forcing and non-climatic influences. Following the six-scenario framework summarized in Table 1 and mapped in Figure 6, this section integrates the climate-related fitted component with the residual component to show where the two act in the same direction and where their effects diverge.
At the basin scale, the interaction between climate-related and non-climatic influences predominantly resulted in vegetation improvement. Approximately 67.3% of the IRB exhibited synergistic positive effects, where both the fitted climate component and the residual component contributed to NDVI increases (Figure 6c; Scenario 1 in Table 1). These areas were concentrated in irrigated agricultural plains, riverine corridors, and agro-pastoral transitional zones. In contrast, 6.1% of the basin experienced joint negative impacts (Figure 6c; Scenario 4 in Table 1), primarily in environmentally fragile zones such as urban expansion areas, cryosphere margins, and downstream arid deserts. Here, climatic stressors and non-climatic pressures likely acted together to reduce vegetation resilience and trigger localized degradation.
Beyond these synergistic zones, the relative dominance of individual drivers varied spatially. Areas predominantly influenced by climate change alone accounted for about 3.8% (Figure 6c; Scenario 2 plus Scenario 5 in Table 1), mostly in high-altitude cryosphere and sparsely populated desert regions where direct human disturbance is comparatively limited. Areas dominated by non-climatic residual effects accounted for about 22.5% in total, including 7.2% with residual-led greening (Figure 6c; Scenario 3 in Table 1) and 15.3% with residual-led degradation (Figure 6c; Scenario 6 in Table 1). This imbalance indicates that residual degradation hotspots deserve particular attention in urbanizing corridors, desert margins, and fragile uplands. This is consistent with the previous analysis of the impacts of climate change and human activities on vegetation. However, it should be noted that it is essential to pay attention to the scale and control variables during the analysis.
These findings highlight three important mechanisms of coupled climate–human interactions: (1) amplification effects, where human management enhances the benefits of favorable climate conditions, as observed in irrigated agriculture; (2) buffering effects, where infrastructure and technological inputs help mitigate climatic stress and stabilize NDVI even under variable rainfall; and (3) compound stress effects, where climate extremes coincide with anthropogenic disturbance, leading to disproportionate ecosystem decline. This nonlinear interplay underlines the need for integrated attribution approaches.
From a management perspective, recognizing these combined impacts provides a scientific basis for differentiated ecological governance. Regions with strong positive synergies should prioritize sustainable agricultural practices and efficient water use to maintain greening trends. Areas facing compound pressures require stricter land-use controls, urban growth boundaries, and targeted ecological restoration. Climate-sensitive alpine and desert ecosystems demand adaptive strategies to enhance resilience to hydrothermal variability.

4.5. Limitations and Future Research Directions

4.5.1. Technical Challenges in NDVI-Based Assessment

Although processing methods such as Maximum Value Composite (MVC) reduce part of the atmospheric interference, cloud contamination, and solar-angle artifacts in NDVI time series, residual noise remains a key constraint on NDVI-based assessment. Such noise reduces the ability to identify weak vegetation signals, particularly in areas with uneven surface cover or persistent cloud influence. In addition, NDVI itself has well-known physical limitations. In areas with high canopy density, NDVI can saturate and become insensitive to further increases in leaf area index; in sparsely vegetated areas, soil background reflectance can distort values. NDVI may also respond to environmental change with seasonal lags, which limits its ability to capture rapid hydroclimatic fluctuations and extreme-event responses. These issues underscore that a single-index approach cannot fully characterize vegetation dynamics in complex ecosystems.

4.5.2. Methodological Challenges in Attribution Studies

Several limitations constrain the present attribution framework. First, only temperature and precipitation were included as climatic predictors, whereas other influential variables such as vapor pressure deficit, humidity, solar radiation, soil moisture, snowmelt timing, and drought indices were not incorporated. Second, the model assumes a linear and contemporaneous NDVI response to climate, which may overlook nonlinear thresholds and lag effects. Third, the residual component inevitably combines multiple sources of unexplained variation, including omitted variables, model error, and true non-climatic influence. Fourth, bilinear resampling of ERA5-Land data does not fully resolve topographic complexity in the upper basin. Consequently, the residual trend approach used here should be regarded as a useful first-order attribution tool rather than a definitive causal decomposition.
To improve reproducibility and scientific rigor, future analyses should report regression diagnostics such as R2, p values, and residual spatial structure at regional or stratified scales, and attribution maps should be accompanied by significance masks or uncertainty layers. Validation using land-use change, night-time lights, irrigation statistics, groundwater data, or human-footprint indicators would be especially valuable for distinguishing anthropogenic influence from model residuals in irrigation-dominated plains and urbanizing corridors.

4.5.3. Future Research Priorities

Future work should pursue three priorities. First, expand the predictor set to include atmospheric moisture demand, drought indices, soil moisture, snow and meltwater indicators, and explicit lag structures. Second, integrate direct human pressure datasets, including night-time lights, land-use transitions, irrigation maps, and groundwater depletion, so that anthropogenic attribution can be validated independently rather than inferred only from residuals. Third, use nonlinear or spatially varying models, such as geographically weighted regression or machine-learning approaches, to capture heterogeneous NDVI responses across cryosphere, cropland, urban, and desert ecosystems.

5. Conclusions

This study investigated spatiotemporal changes in vegetation activity across the Indus River Basin (IRB) from 1982 to 2022 using NDVI time series, trend analysis, partial correlation, and residual trend attribution. The results indicate a significant overall greening trend, with basin-averaged NDVI increasing at a rate of 0.0061 per decade. However, this increase was not monotonic. NDVI showed clear temporal fluctuations and pronounced spatial heterogeneity. Significant greening occupied 65.6% of the basin, mainly in irrigated agricultural areas and river corridors, whereas 11.1% of the basin showed degradation, especially in urbanizing zones, cryosphere margins, and desert-edge regions.
The attribution results suggest that both climate-related and non-climatic factors influenced NDVI dynamics, but their effects varied across environmental settings. Temperature and precipitation generally promoted vegetation growth, particularly in some upper-basin and water-limited areas, although negative climatic effects also appeared in ecologically fragile and water-stressed regions. The residual analysis further indicates that non-climatic influences were important in managed landscapes, where irrigation, agricultural development, and ecological regulation may have supported vegetation improvement. At the same time, negative residual trends identified potential degradation hotspots in fragile uplands, expanding urban areas, and desert margins. These patterns confirm that vegetation change in the IRB is shaped by the interaction of climate variability, land-use intensity, and water-resource management.

Author Contributions

Conceptualization, C.L.; methodology, C.L.; writing—original draft preparation, C.L., X.X., W.L.F., M.C., S.W., X.Y., D.Y.A. and K.A.; writing—review and editing, C.L., X.X., W.L.F., M.C., S.W., X.Y., D.Y.A. and K.A.; visualization, X.X.; supervision, C.L.; project administration, C.L.; funding acquisition, C.L. All authors have read and agreed to the published version of the manuscript.

Funding

This work was supported by the Research Project of Humanities and Social Sciences of the Ministry of Education, China (Grants No.24YJCZH132).

Data Availability Statement

The data that support the findings of this study are available from the corresponding author upon reasonable request.

Conflicts of Interest

The authors declare no conflicts of interest.

References

  1. Gao, W.; Zheng, C.; Liu, X.; Lu, Y.; Chen, Y.; Wei, Y.; Ma, Y. NDVI-based vegetation dynamics and their responses to climate change and human activities from 1982 to 2020: A case study in the Mu Us Sandy Land, China. Ecol. Indic. 2022, 137, 108745. [Google Scholar] [CrossRef]
  2. Ma, B.X.; He, C.X.; Jing, J.L.; Wang, Y.F.; Liu, B.; He, H.C. Attribution of vegetation dynamics in Southwest China from 1982 to 2019. Acta Geogr. Sin. 2023, 78, 714–728. [Google Scholar]
  3. Kong, D.; Zhang, Q.; Singh, V.P.; Shi, P. Seasonal vegetation response to climate change in the Northern Hemisphere (1982–2013). Glob. Planet. Change 2017, 148, 1–8. [Google Scholar] [CrossRef]
  4. Lu, J.B.; Ju, K.; Liao, W.B. Variation in NDVI and its response to climate change and human activities in Gansu Province during 2000–2020. J. Desert Res. 2023, 43, 118–127. [Google Scholar]
  5. Zhao, G.S.; Ren, L.J.; Ye, Z.L. Vegetation dynamics in response to climate change and human activities in a Typical Alpine Region in the Tibetan Plateau. Int. J. Environ. Res. Public Health 2022, 19, 12359. [Google Scholar]
  6. Zhao, P.; Chen, T.; Wang, Q.; Yu, R. Quantitative analysis of the impact of climate change and human activities on grassland ecosystem NPP in Xinjiang. J. Univ. Chin. Acad. Sci. 2020, 37, 51–62. [Google Scholar]
  7. Li, C.; Wang, J.; Hu, R.; Yin, S.; Bao, Y.; Ayal, D.Y. Relationship between vegetation change and extreme climate indices on the Inner Mongolia Plateau, China, from 1982 to 2013. Ecol. Indic. 2018, 89, 101–109. [Google Scholar] [CrossRef]
  8. Abbas, S.; Qamer, F.M.; Murthy, M.S.R.; Tripathi, N.K.; Ning, W.; Sharma, E.; Ali, G. Grassland Growth in Response to Climate Variability in the Upper Indus Basin, Pakistan. Climate 2015, 3, 697–714. [Google Scholar] [CrossRef]
  9. Immerzeel, W.W.; Droogers, P.; de Jong, S.M.; Bierkens, M.F.P. Large-Scale Monitoring of Snow Cover and Runoff Simulation in Himalayan River Basins Using Remote Sensing. Remote Sens. Environ. 2009, 113, 40–49. [Google Scholar]
  10. Uereyen, S.; Bachofer, F.; Klein, I.; Kuenzer, C. Multi-Faceted Analyses of Seasonal Trends and Drivers of Land Surface Variables in Indo-Gangetic River Basins. Sci. Total Environ. 2022, 847, 157515. [Google Scholar]
  11. Mehmood, K.; Anees, S.A.; Rehman, A.; Pan, S.; Tariq, A.; Zubair, M.; Liu, Q.; Rabbi, F.; Khan, K.A.; Luo, M. Exploring Spatiotemporal Dynamics of NDVI and Climate-Driven Responses in Ecosystems: Insights for Sustainable Management and Climate Resilience. Ecol. Inform. 2024, 80, 102532. [Google Scholar] [CrossRef]
  12. Sajjad, H.W.; Raheem, A.; Laraib, M.; Khalid, O.; Arshed, A.B.; Mustafa, K. Spatiotemporal Analysis of Hydrological and Land Cover Transformations in the Upper Indus Basin: Insights from MNDWI. Evid. Earth Sci. 2025, 1, 125–144. [Google Scholar] [CrossRef]
  13. Dharpure, J.K.; Howat, I.M.; Kaushik, S. Declining Groundwater Storage in the Indus Basin Revealed Using GRACE and GRACE-FO Data. Water Resour. Res. 2025, 61, e2024WR038279. [Google Scholar] [CrossRef]
  14. Rahman, K.U.; Mao, D.; Ejaz, N.; Saleem, M.W.; Balkhair, K.S.; Khan, K.U.J.; Shang, S. Developing Robust Vegetation Health Indices by Optimizing the Weights for Vegetation and Temperature Condition Indices Using Principal Component Analysis. J. Hydrol. Reg. Stud. 2025, 61, 102741. [Google Scholar] [CrossRef]
  15. Janjua, S. Evaluation of Water Allocation System and Reservoir Ranking for Indus River Basin: A Hydro-Economic Perspective. Ph.D. Thesis, Capital University of Science and Technology, Islamabad, Pakistan, 2021. [Google Scholar]
  16. Khan, A.; Faheem, M.; Marwat, M.A. Water for peace: A collaborative governance framework for the Indus River Basin. Adv. Soc. Sci. Arch. J. 2025, 3, 816–823. [Google Scholar]
  17. Pinzon, J.E.; Tucker, C.J. A non-stationary 1981–2012 AVHRR NDVI3g time series. Remote Sens. 2014, 6, 6929–6960. [Google Scholar] [CrossRef]
  18. Li, M.; Cao, S.; Zhu, Z.; Wang, Z.; Myneni, R.B.; Piao, S. Spatiotemporally consistent global dataset of the GIMMS Normalized Difference Vegetation Index (PKU GIMMS NDVI) from 1982 to 2022. Earth Syst. Sci. Data 2023, 15, 4181–4203. [Google Scholar] [CrossRef]
  19. Yang, Y.; Wang, S.; Bai, X.; Tan, Q.; Li, Q.; Wu, L.; Tian, S.; Hu, Z.; Li, C.; Deng, Y. Factors Affecting Long-Term Trends in Global NDVI. Forests 2019, 10, 372. [Google Scholar] [CrossRef]
  20. Wei, Y.; Sun, S.; Liang, D.; Jia, Z. Spatial–temporal variations of NDVI and its response to climate in China from 2001 to 2020. Int. J. Digit. Earth 2022, 15, 1463–1484. [Google Scholar] [CrossRef]
  21. Ma, B.X.; Jing, J.L.; Xu, Y.; He, H.; Liu, B. Spatial-temporal changes of NPP and its relationship with climate change in karst areas of Yunnan, Guizhou, and Guangxi from 2000 to 2019. Ecol. Environ. Sci. 2021, 30, 2285–2293. [Google Scholar]
  22. Shi, C.; Wang, K.; Sun, C.; Zhang, Y.; He, Y.; Wu, X.; Gao, C.; Wu, G.; Shu, L. Significantly lower summer minimum temperature warming trend on the southern Tibetan Plateau than over the Eurasian continent since the Industrial Revolution. Environ. Res. Lett. 2019, 14, 124033. [Google Scholar] [CrossRef]
  23. Liu, Y.; Tian, J.; Liu, R.; Ding, L. Influences of Climate Change and Human Activities on NDVI Changes in China. Remote Sens. 2021, 13, 4326. [Google Scholar] [CrossRef]
  24. Shi, S.; Yu, J.; Wang, F.; Wang, P.; Zhang, Y.; Jin, K. Quantitative Contributions of Climate Change and Human Activities to Vegetation Changes over Multiple Time Scales on the Loess Plateau. Sci. Total Environ. 2021, 755, 142419. [Google Scholar] [CrossRef]
  25. Liu, Y.; Guo, B.; Lu, M.; Zang, W.; Yu, T.; Chen, D. Quantitative Distinction of the Relative Actions of Climate Change and Human Activities on Vegetation Evolution in the Yellow River Basin of China during 1981–2019. J. Arid Land 2023, 15, 91–108. [Google Scholar] [CrossRef]
  26. Zhu, Z.; Piao, S.; Myneni, R.B.; Huang, M.; Zeng, Z.; Canadell, J.G.; Ciais, P.; Sitch, S.; Friedlingstein, P.; Arneth, A.; et al. Greening of the Earth and Its Drivers. Nat. Clim. Change 2016, 6, 791–795. [Google Scholar] [CrossRef]
  27. Chen, C.; Park, T.; Wang, X.; Piao, S.; Xu, B.; Chaturvedi, R.K.; Fuchs, R.; Brovkin, V.; Ciais, P.; Fensholt, R.; et al. China and India Lead in Greening of the World through Land-Use Management. Nat. Sustain. 2019, 2, 122–129. [Google Scholar] [CrossRef]
  28. Maina, F.Z.; Kumar, S.V.; Albergel, C.; Mahanama, S.P. Warming, Increase in Precipitation, and Irrigation Enhance Greening in High Mountain Asia. Commun. Earth Environ. 2022, 3, 43. [Google Scholar] [CrossRef]
Figure 1. Land use in the Indus River Basin and research framework.
Land 15 00803 g001
Figure 2. Research framework in this paper.
Land 15 00803 g002
Figure 3. Interannual change trend of average NDVI in the Indus River Basin from 1982 to 2022.
Land 15 00803 g003
Figure 4. Spatial distribution of NDVI characteristics in the IRB during 1982–2022: (a) multi-year mean NDVI; (b) Theil–Sen trend slope; and (c) Mann–Kendall trend significance.
Land 15 00803 g004
Figure 5. Partial correlation results between NDVI and climatic variables in the IRB during 1982–2022: (a) partial correlation between NDVI and temperature; (b) partial correlation between NDVI and precipitation; (c) partial correlation between NDVI and temperature and precipitation; (d) significance of the NDVI-temperature relationship; (e) significance of the NDVI-precipitation relationship; and (f) complex correlation of temperature-precipitation on NDVI.
Land 15 00803 g005
Figure 6. Spatial distribution of the relative contribution of climate-related (a) and non-climatic residual (b) drivers on NDVI change in the IRB during 1982–2022, classified according to the six scenarios (c) defined in Table 1.
Land 15 00803 g006
Table 1. The relative roles of climate change and human activities in the NDVI obs change process under different scenarios.
Slope (NDVIobs) aDriver FactorScenarioCriterionContribution Rate
Slope (NDVICC) bSlope (NDVIHA) cContribution of Climate Change (%)Contribution of Human Activities (%)
>0
(Vegetation restoration)
CC & HA1>0>0 slope ( NDVI CC ) slope ( NDVI obs ) slope ( NDVI HA ) slope ( NDVI obs )
CC2>0<01000
HA3<0>00100
<0
(Vegetation degradation)
CC & HA4<0<0 slope ( NDVI CC ) slope ( NDVI obs ) slope ( NDVI HA ) slope ( NDVI obs )
CC5<0>01000
HA6>0<00100
Note: a, b, and c refer to the trend rates of remotely sensed NDVI observations, climate-predicted NDVI from the multiple regression model, and NDVI residuals, respectively. In this study, b represents the climate-related component, whereas c represents the non-climatic residual component; the latter may include human influence as well as omitted environmental variability and model uncertainty.
Table 2. Pearson correlation between socioeconomic factors.
FactorCorrelation Coefficient (r)Significance
Agricultural Irrigation Area+0.4459p < 0.001
Population Density−0.3138p < 0.001
Night-time Light−0.2555p < 0.001
Agricultural GDP+0.2099p < 0.001
Table 3. Comparison of machine learning model performance.
ModelR2 (Test)RMSEMAE
Random Forest0.43990.12200.0931
Support Vector Machine (SVM)0.40500.12570.0933
Gradient Boosting0.46510.11920.0923
Notes: R2 (Test): coefficient of determination on the test set, indicating goodness of fit; RMSE: root mean square error, measuring prediction deviation; MAE: mean absolute error, reflecting average prediction error.
Table 4. Interaction effects among socioeconomic drivers of NDVI.
Interaction PairInteraction StrengthIndividual EffectsCombined EffectInterpretation
Agricultural GDP × Agricultural Irrigation Area0.13020.2099, 0.44590.4581Strong synergy: Combined effect exceeds the sum of individual effects, indicating a significant joint enhancement of vegetation cover through economic investment and irrigation.
Population Density × Agricultural GDP0.05200.3138, 0.20990.3138Neutralized effect: Combined effect approximates the effect of population density alone, suggesting the positive impact of GDP is offset in high-density areas.
Population Density × Nightlight0.02930.3138, 0.25550.3140Slight compounding effect: Joint influence marginally reinforces the negative impact, indicating that urbanization and energy consumption together further suppress vegetation.
Disclaimer/Publisher’s Note: The statements, opinions and data contained in all publications are solely those of the individual author(s) and contributor(s) and not of MDPI and/or the editor(s). MDPI and/or the editor(s) disclaim responsibility for any injury to people or property resulting from any ideas, methods, instructions or products referred to in the content.