Article

Assessing the Impact of Land Use and Land Cover Changes on Flood Hazard in the Wadi Ibrahim Watershed


1
Department of Water Resources, Faculty of Environmental Sciences, King Abdulaziz University, Jeddah 21589, Saudi Arabia
2
Irrigation and Hydraulics Department, Faculty of Engineering, Mansoura University, Mansoura 35516, Egypt
3
Laboratory of Ecohydraulics & Inland Water Management, Department of Ichthyology and Aquatic Environment, University of Thessaly, 38446 Nea Ionia, Greece
4
Aerospace Information Research Institute, Chinese Academy of Sciences, Beijing 100101, China
5
Department of Geoinformation in Environmental Management, CI-HEAM/Mediterranean Agronomic Institute of Chania, 73100 Chania, Greece
6
Department of Applied Geosciences, Faculty of Science, German University of Technology in Oman, Muscat 1816, Oman
*
Author to whom correspondence should be addressed.
Land 2026, 15(5), 742; https://doi.org/10.3390/land15050742
Submission received: 28 February 2026 / Revised: 13 April 2026 / Accepted: 23 April 2026 / Published: 27 April 2026

Abstract

Land Use and Land Cover (LULC) changes significantly influence flood hazard, especially in rapidly urbanizing areas like the Wadi Ibrahim watershed in Makkah, Saudi Arabia. This study analyzed the impacts of historical (2001–2025) and projected (2037) LULC changes on floods using remote sensing, GIS, and hydrological modeling with 30 m DEM and Landsat data. Urban growth was assessed from 2001, 2013, and 2025 maps, and future scenarios were simulated with the MOLUSCE plugin in QGIS using Cellular Automata–Artificial Neural Network (CA-ANN) techniques. Hydrological simulations were used to examine changes in flood discharge and response to LULC transitions. The results revealed substantial urban expansion, with built-up areas increasing from 12 km2 (11%) in 2001 to 28.7 km2 (26%) in 2025 and projected to reach 31.9 km2 (28.3%) by 2037. The corresponding impervious surface fraction rose from 11% to 28% over the same period. Hydrological modeling for 50-, 100-, and 200-year return periods reveals a significant escalation in flood response, with peak discharge (Qp) increasing by up to 12% and runoff volume (V) by approximately 9% between 2001 and 2037. The LULC classification using the Random Forest algorithm demonstrated strong and reliable performance, achieving an average Kappa (κ) value of 0.86, indicating almost perfect agreement. Overall, the findings underscore the need for sustainable land management to reduce flood risk in rapidly growing arid regions.

1. Introduction

Flooding is one of the most severe hydrological hazards, posing substantial risks to urban areas, infrastructure, and human lives. As a highly destructive natural disaster, it significantly impedes socioeconomic development and affects millions of people worldwide [1,2]. Between 1990 and 2016, the global economic losses attributed to flood events were estimated to be approximately USD 723 billion [3]. Driven by continuous population growth and the escalating impacts of climate change, urban areas are becoming increasingly vulnerable, with greater exposure to frequent and intense flooding events. By 2030, approximately 40% of the world’s cities are anticipated to be situated in high flood-risk zones, potentially impacting approximately 54 million people [4].
Floods result not only from excessive rainfall but also from rapid urbanization, which alters watershed hydrology by increasing impervious surfaces and modifying land cover [5,6]. Anthropogenic activities, particularly Land Use and Land Cover (LULC) changes, strongly influence watershed responses to flooding [7,8,9]. Numerous studies have also shown that LULC can increase flood hazards across diverse regions worldwide, including both arid and tropical environments [10,11,12].
Urbanization and population growth disrupt ecosystems and natural water systems. In the Wadi Ibrahim watershed, Makkah City, rapid urbanization has become a dominant factor due to the city’s status as a holy site that continuously attracts millions of pilgrims. The population grew from 1,294,000 in 2000 to 2,017,793 in 2020 (nearly 56% increase), accompanied by intensive development of hotels, high-rise buildings, and road networks that convert natural landscapes into built-up areas and intensify runoff generations [13,14,15,16]. Over the same period, Makkah’s urban footprint expanded markedly, with its area increasing from 366 km2 to 465 km2 alongside strong internal densification as the number of developed districts grew from 60 to 101, reflecting extensive conversion of natural or rural land into urban fabric [17]. Together, these demographic and spatial trends indicate a tight coupling between population growth and urban expansion, leading to widespread loss of permeable surfaces, reduced infiltration, increased surface runoff, and heightened pressure on drainage systems, thereby exacerbating flood hazards in the Wadi Ibrahim watershed [18,19].
Methods for analyzing LULC processes have advanced rapidly, particularly in spatial analysis, simulation, and the representation of transition potentials, enabling researchers to investigate the drivers of historical and current land changes and to generate future scenarios. A variety of models have been developed for LULC study, including predicting future LULC using the Land Change Modeler (LCM) in Terrset V18.31 software [20,21,22], Markov-FLUS [23], and Cellular Automata–Artificial Neural Network (CA-ANN) techniques [24,25,26]. The CA-ANN approach has been widely applied and is considered more effective than linear regression. It demonstrates high efficiency even with limited data, requires relatively simple calibration, and has been used for transition potential modeling and future simulations [26,27]. As an advanced machine learning approach, ANN can capture and represent complex behaviors and patterns [28]. The CA-ANN model was implemented using the MOLUSCE plugin in QGIS. This method has been widely applied in numerous studies, consistently demonstrating reliable and acceptable simulations of LULC changes [25,29,30,31].
The objectives of this study are to (1) classify and quantify LULC changes in the Wadi Ibrahim watershed for historical (2001, 2013) and recent (2025) periods; (2) model and predict LULC for the projected 2037 scenario using the CA-ANN technique within MOLUSCEV 5.2; and (3) assess the impacts of both historical and projected LULC changes on the hydrological response and flood patterns of the watershed.
The remainder of this paper is structured as follows: Section 2 describes the study area, Section 3 presents the data and methodology, Section 4 provides the results, Section 5 discusses the findings and their limitations, and Section 6 concludes the study.

2. Study Area

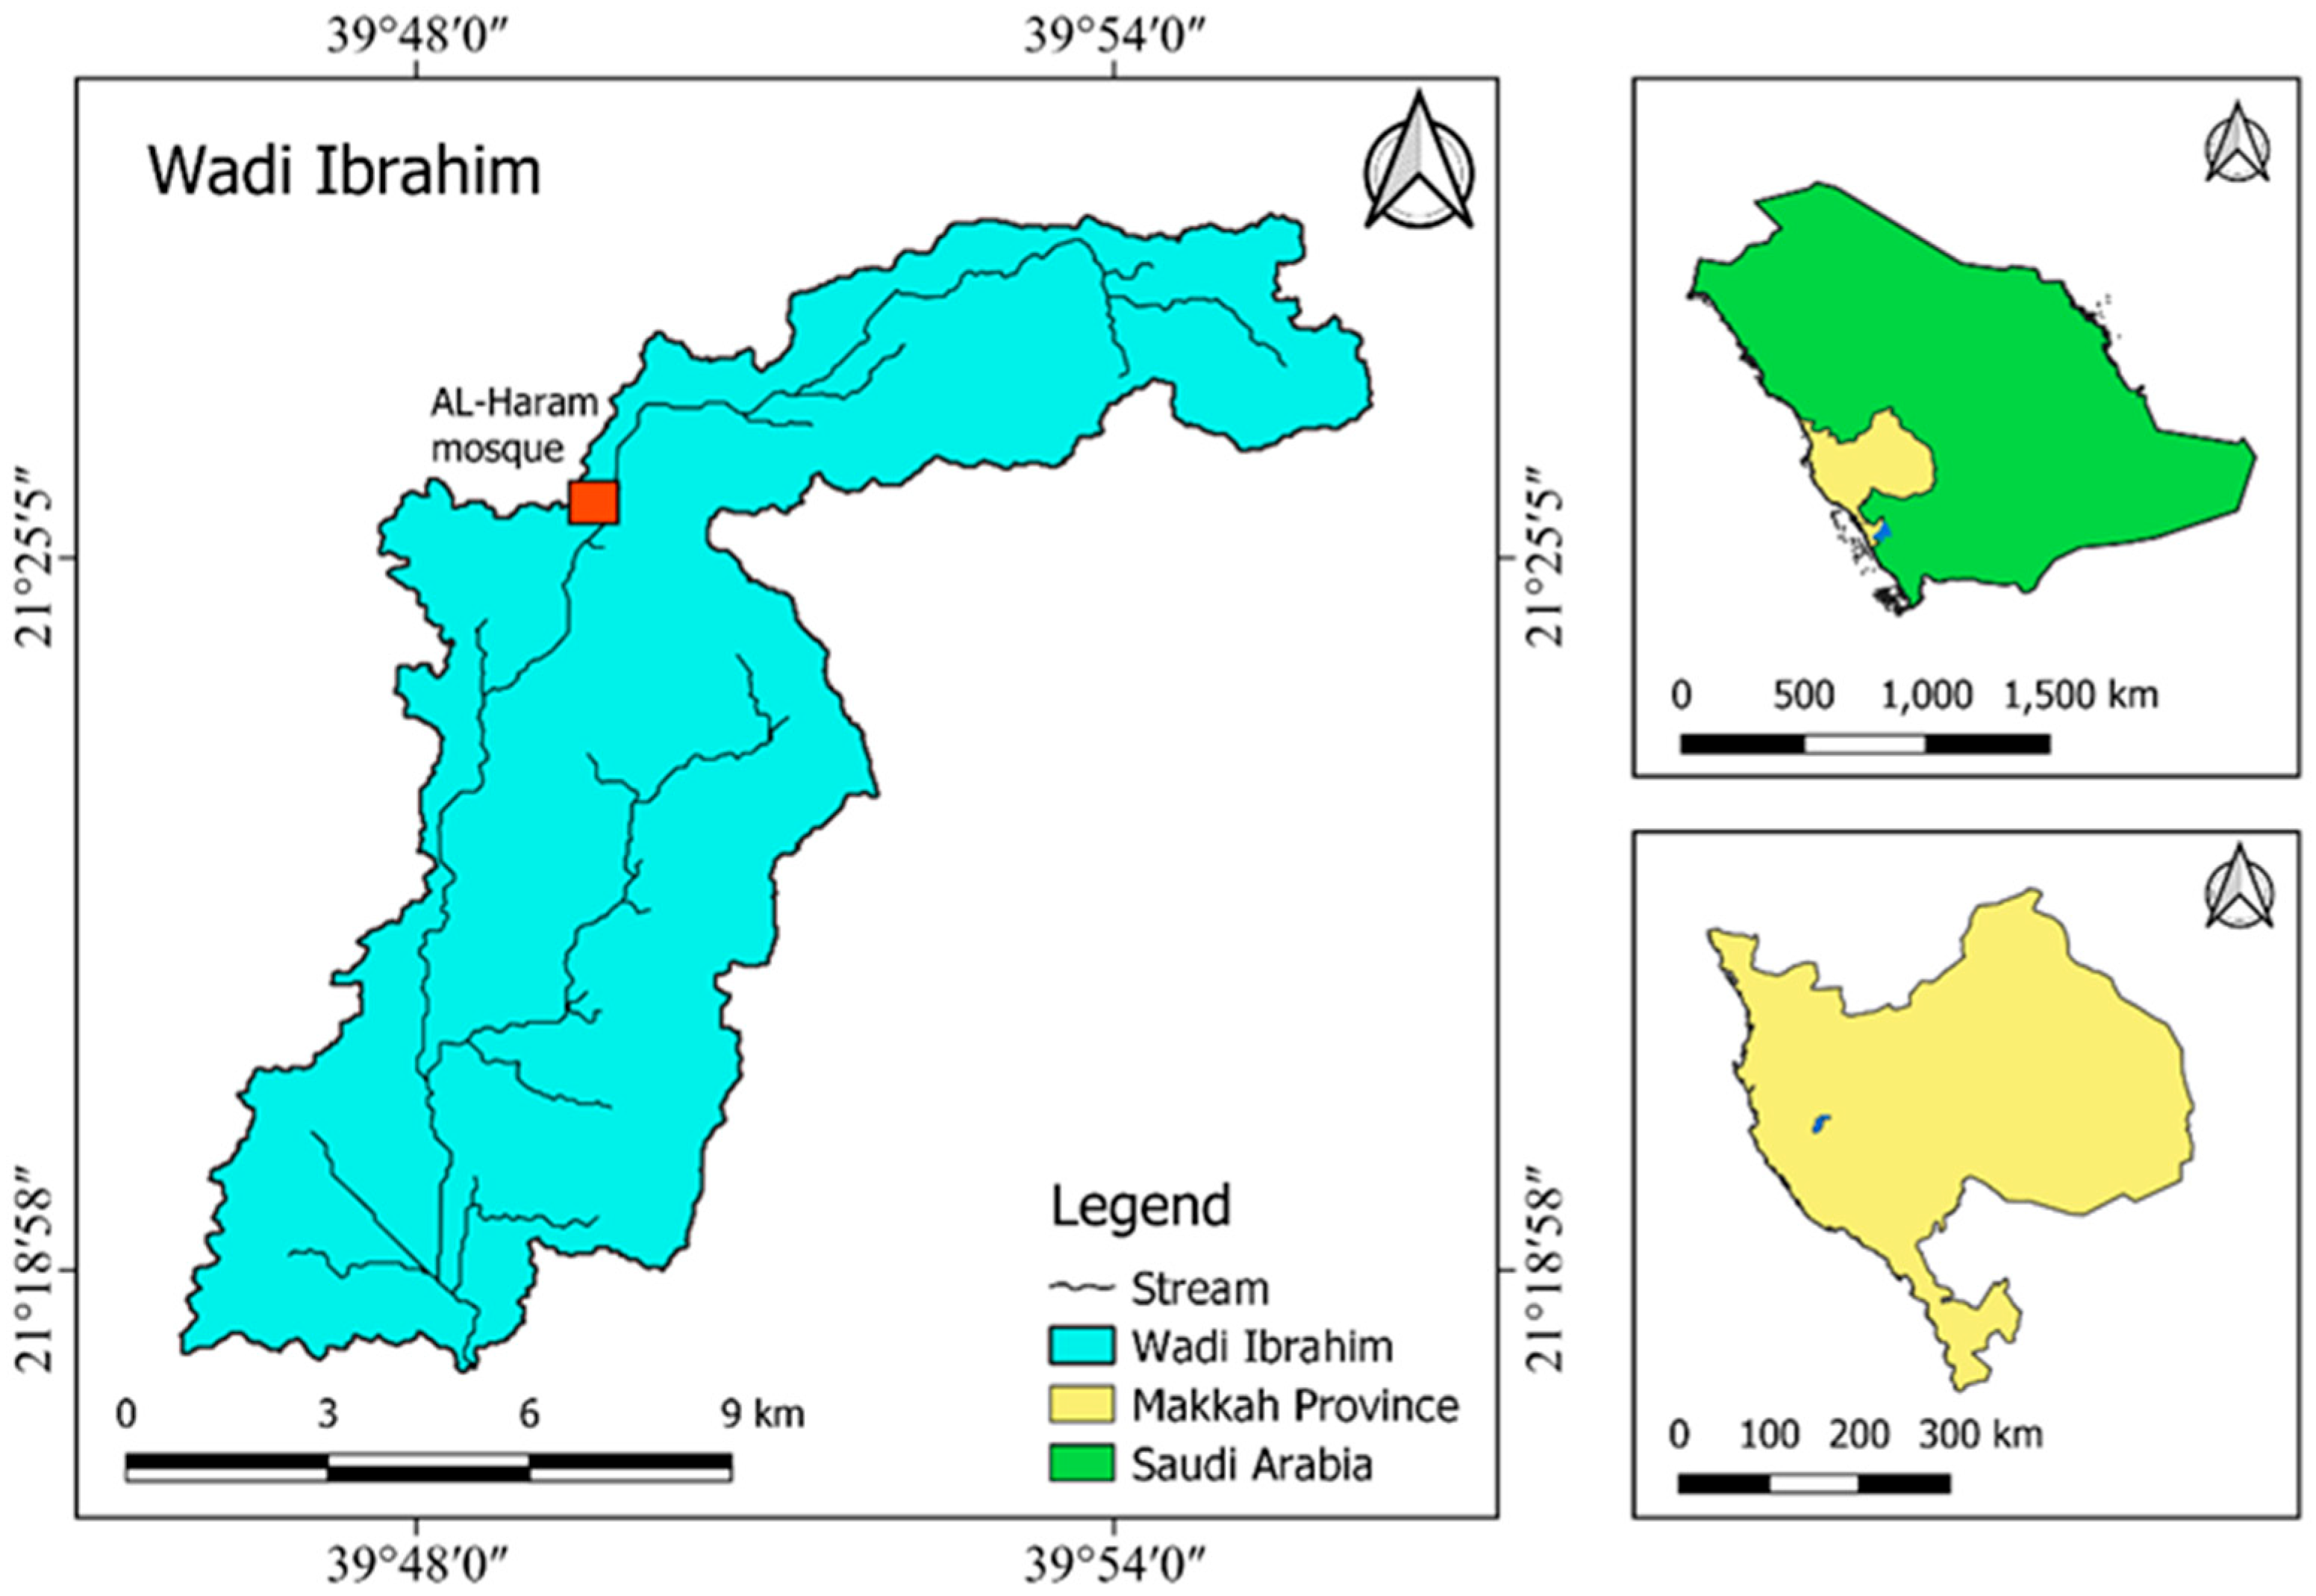
The Wadi Ibrahim watershed is one of the most significant watersheds in Makkah Al-Mukarramah City because of its proximity to the Al-Haram Mosque, which lies within its boundaries (Figure 1). Makkah Al-Mukarramah, the administrative capital of the Makkah Region, Kingdom of Saudi Arabia (KSA), covers an area of approximately 1200 km2 and is situated between 39°53′–40°02′ E longitude and 21°09′–21°37′ N latitude. The city has experienced rapid urbanization driven by extensive residential and commercial development. Between 2003 and 2017, the population grew from 1,375,000 to approximately 2,017,793 residents, nearly doubling within 14 years, according to the Ministry of Municipal and Rural Affairs (2020) [13]. Geographically, the city is positioned at an elevation of 277 m above the mean sea level (amsl) and lies approximately 80 km inland from the Red Sea. The Wadi Ibrahim watershed is classified as an arid catchment, characterized by low precipitation, frequent droughts, and limited water resources. Geologically, the city is situated in the west–central section of the Proterozoic Arabian Shield, which includes three main rock types: igneous, metamorphic, and sedimentary rocks. The wadi is dominated by Precambrian rocks, with quartz diorite and tonalite as the primary minerals [32,33].
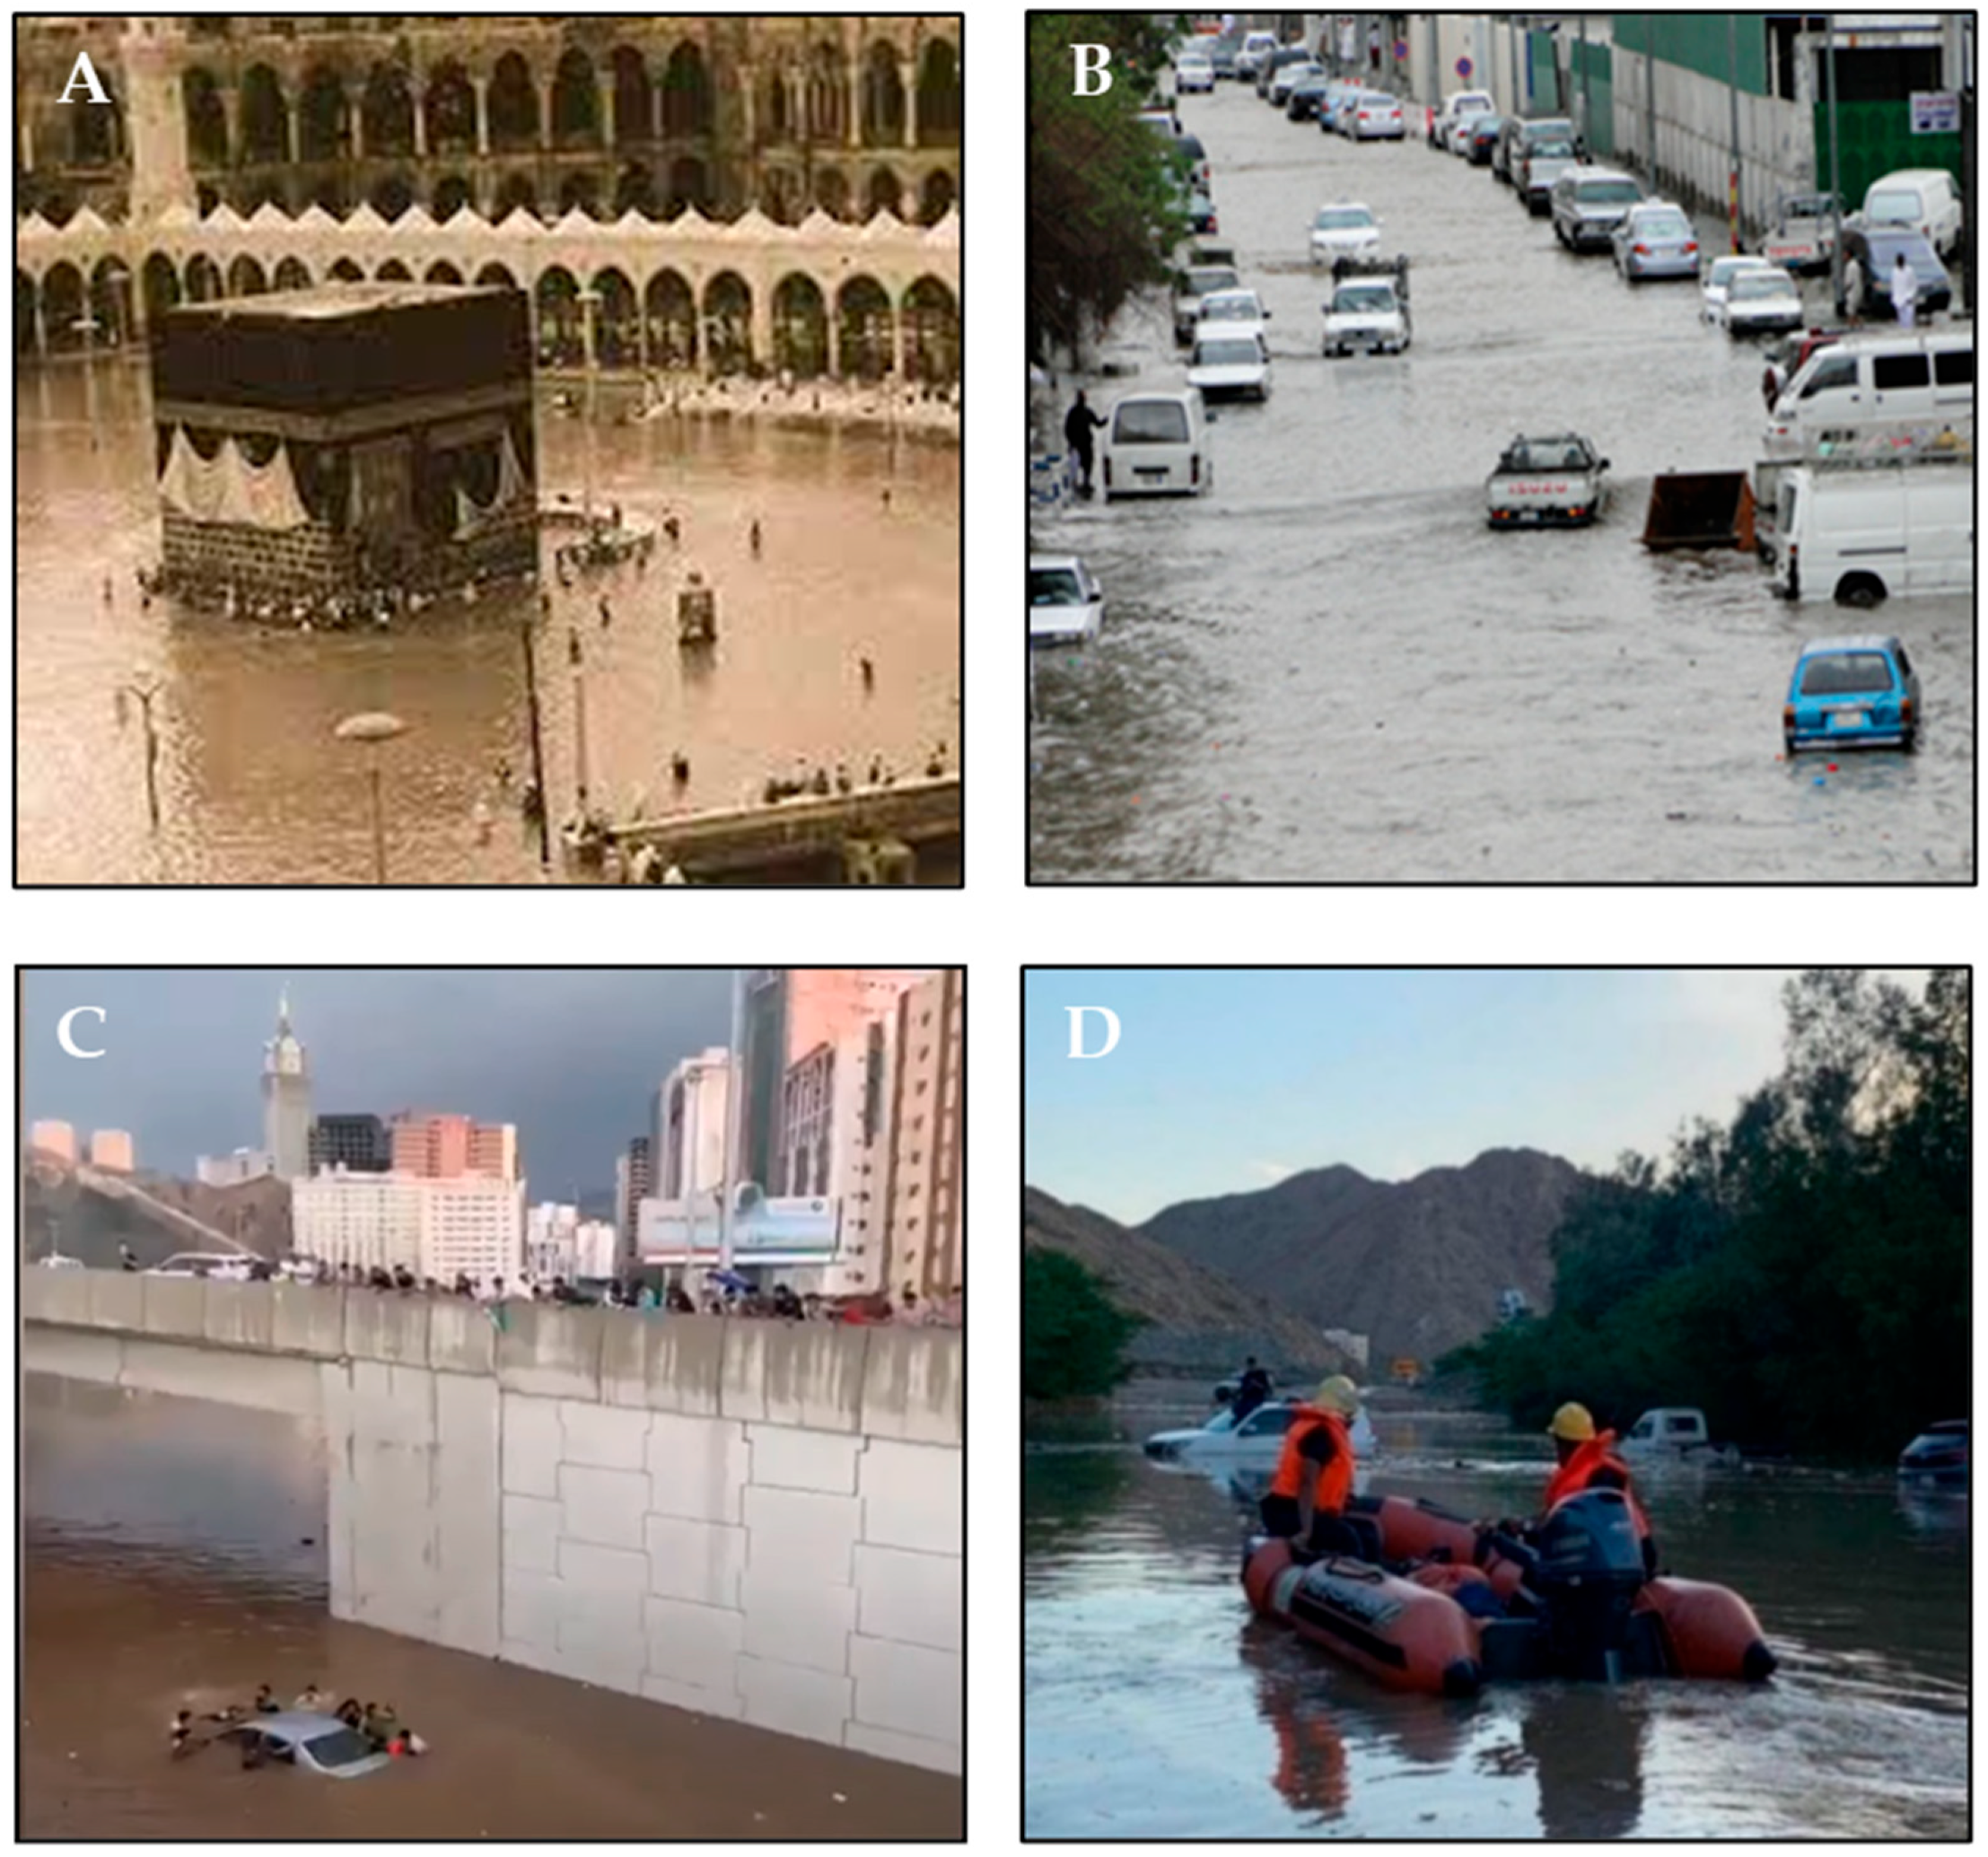
In the KSA, flooding was the most frequent hazard affecting the period between 1982 and 2005, with an average annual economic cost of approximately USD 19 million. These floods in Makkah Al-Mukarramah City are shown in Figure 2. Floods are common during winter, even though the amount of precipitation is low, including a 1941 flood that inundated the Holy Mosque, with floodwaters reaching 2.5 m above the floor due to rainfall exceeding 269 mm [34]. On 22 January 2005, a severe rainstorm resulted in substantial human and infrastructural damage. The storm led to 29 fatalities, 17 injuries, and extensive damage to infrastructure, including the sweeping away of vehicles and the destruction of bridges, electrical towers, and communication networks [35]. Subsequent floods struck the city in 2006, followed by events on 30 December 2010, 3 November 2018, and 27 April 2021. These floods caused significant destruction, damaging roads and inundating urban infrastructure.

3. Materials and Methods

3.1. Data Sources

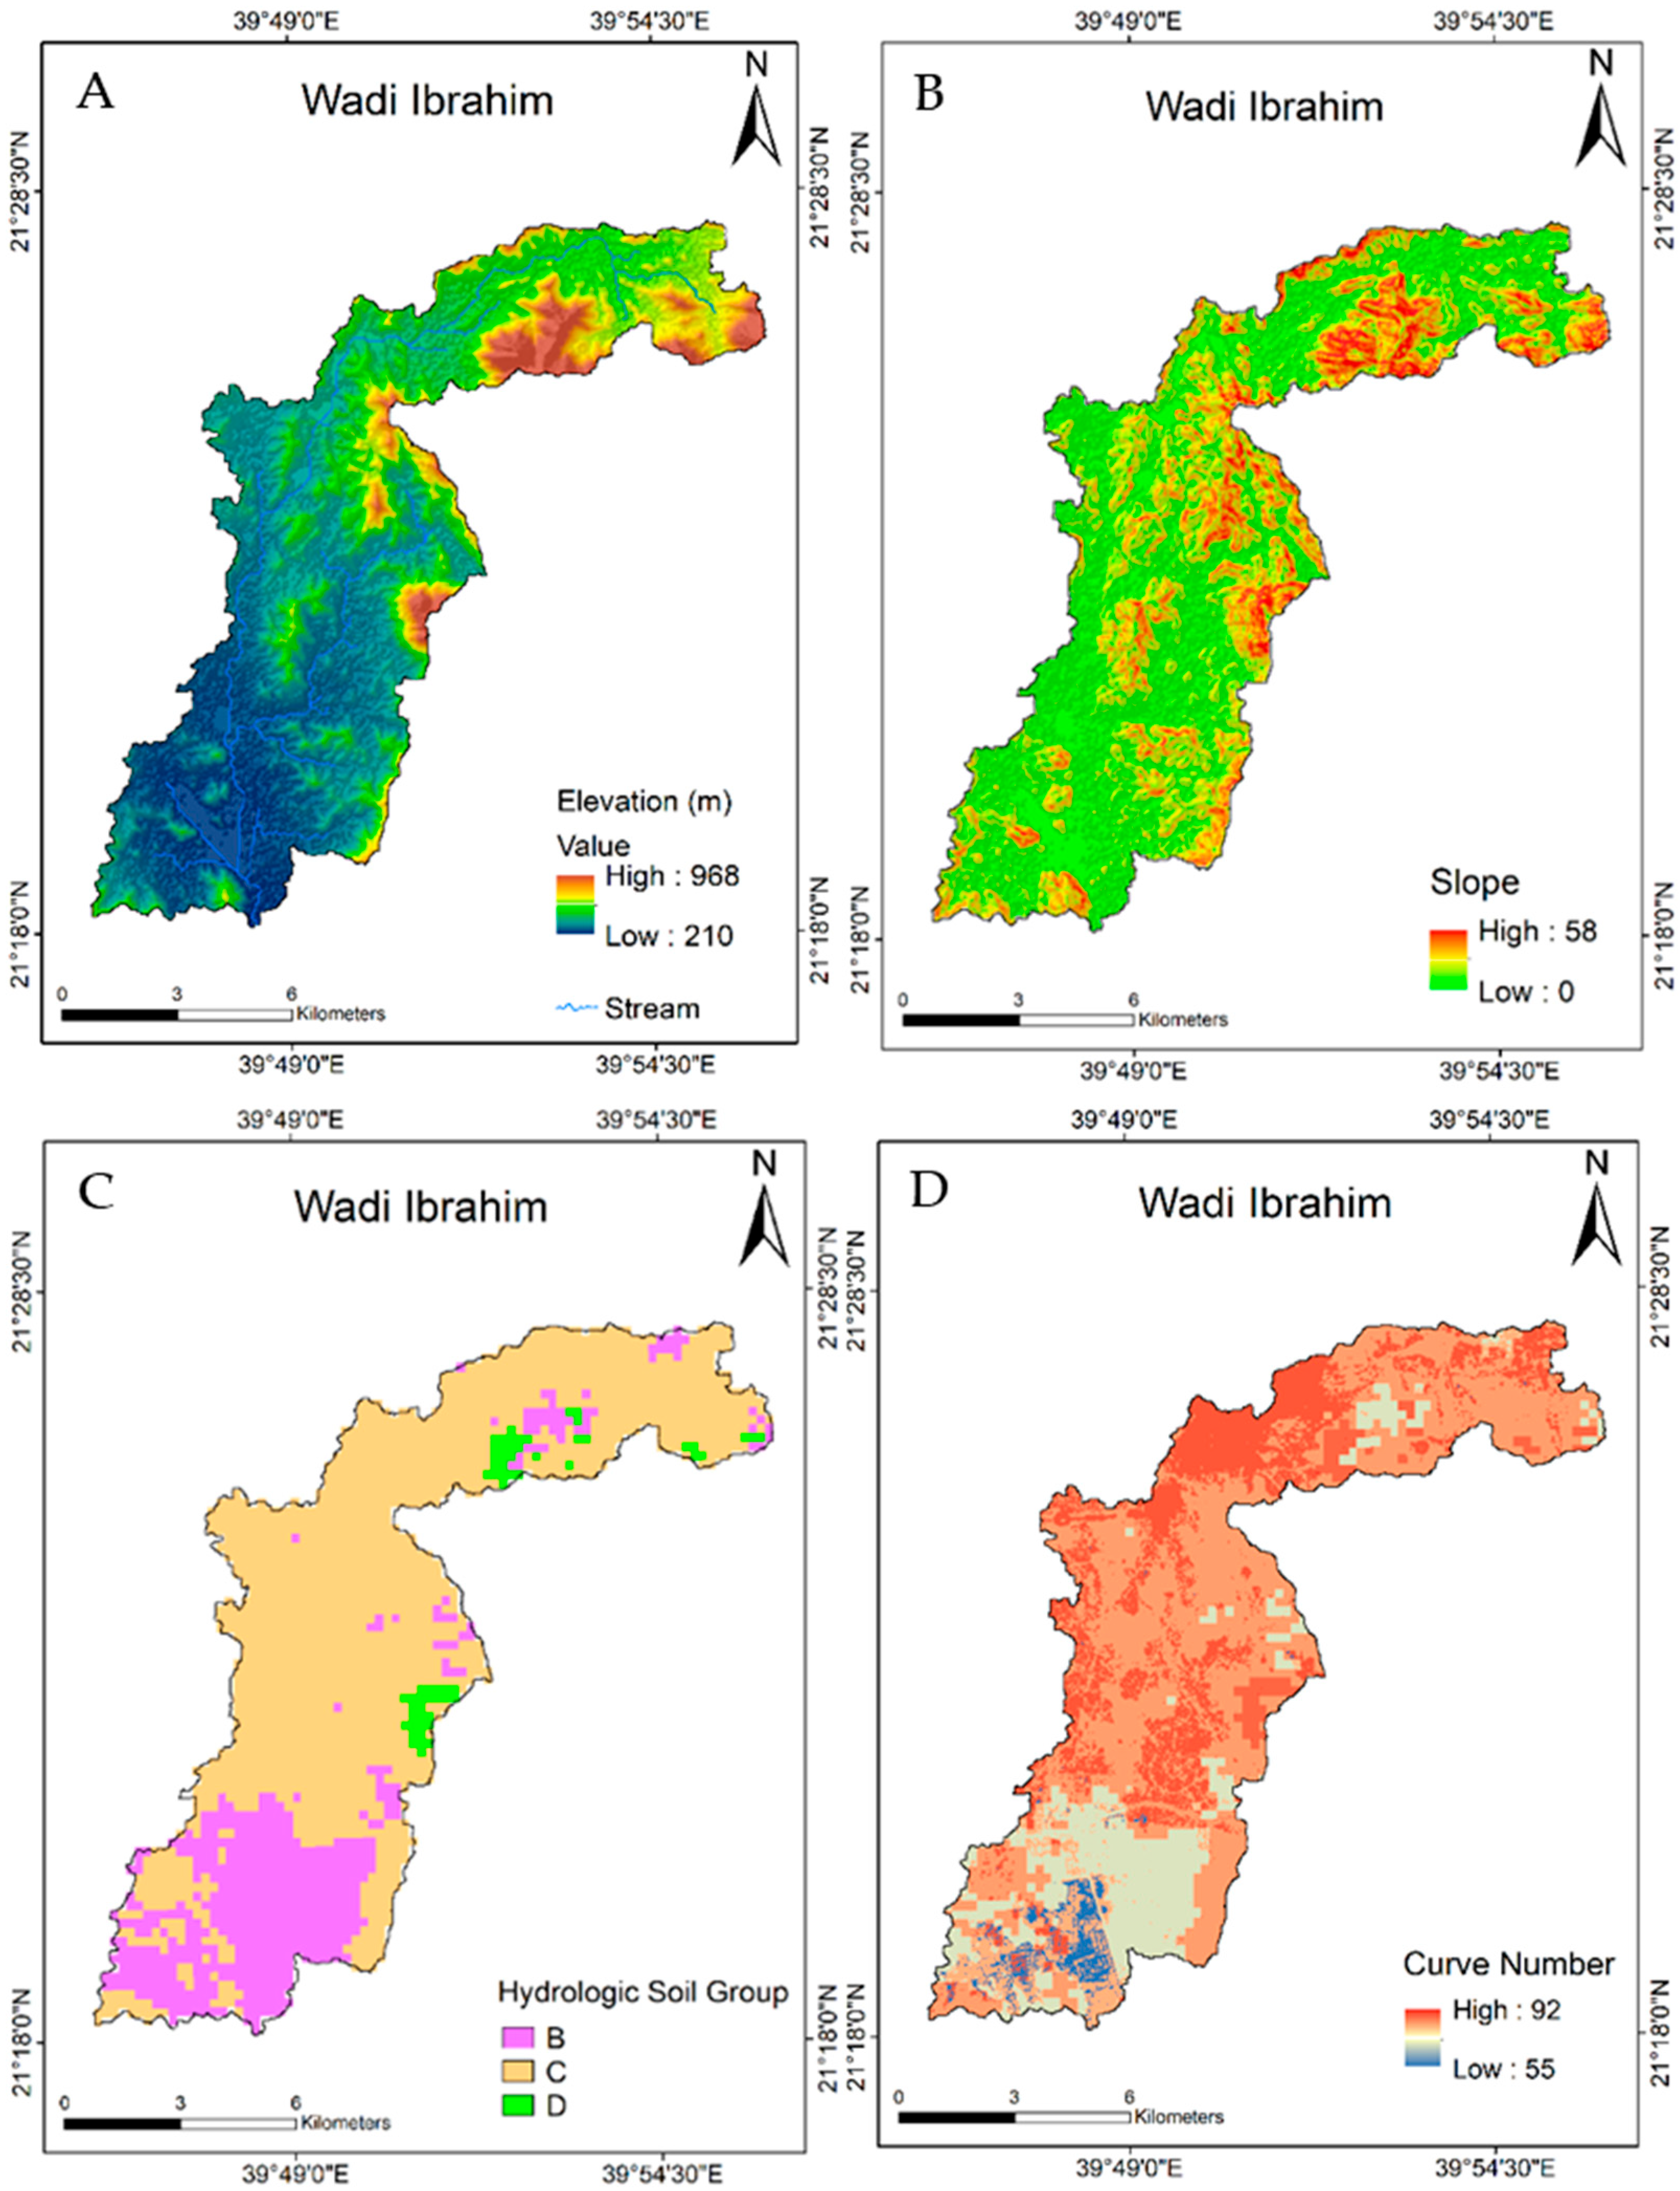
This study utilized multiple datasets to comprehensively analyze the Wadi Ibrahim Watershed. A 30 m resolution Digital Elevation Model (DEM) from Copernicus (www.opentopography.org) provided essential morphometric parameters (Table 1) and slope data (Figure 3), which are critical for understanding the physical characteristics of the watershed. Hydrologic Soil Groups (HSG) were generated using the CN Generator plugin in QGIS, which classifies soils into four groups (A to D) based on their runoff potential; Group A has the lowest, and Group D has the highest potential [36,37].
To improve hydrological modeling and flood hazard assessment accuracy, a composite CN for the watershed was calculated by area-weighting the CN values assigned to each combination of LULC and HSG class [38]. Table 2 details the CN values for three representative land cover types, namely, built-up, bare land, and vegetation, across soil groups B, C, and D. The results indicate that CN values increased from soil group B to D for all land uses, reflecting a higher runoff potential in less permeable soils. Vegetation exhibited the lowest CN range (55–77), bare land had intermediate values (79–89), and built-up areas had the highest CN (85–92) [39], signifying greater runoff generation from impervious surfaces. This highlights the role of both land cover and soil type, which underlines their combined role in controlling watershed runoff behavior.
Satellite imagery datasets for the LULC analysis were obtained from Landsat 5, 8, and 9 (Table 3). Landsat-5 Thematic Mapper (TM) data with a resolution of 30 m, provided by the United States Geological Survey (USGS), were used for LULC in the year of 2001. The Landsat-5 mission, which commenced in March 1984 and ended in 2013, acquired imagery at decadal intervals. Landsat-8 Operational Land Imager (OLI) was used to acquire the LULC data for 2013. The recent LULC (2025) was assessed using Landsat-9 OLI-2 with a resolution of 30 m.
All Landsat data can be accessed freely at https://earthexplorer.usgs.gov/. To predict LULC, several driving factors were used as independent variables, including DEM from the Open Topography portal, slope derived from the DEM, and distances to roads and settlements calculated using the Euclidean distance method in ArcGIS10.8. These variables are widely used in LULC change analyses because they reliably capture physical and anthropogenic influences.
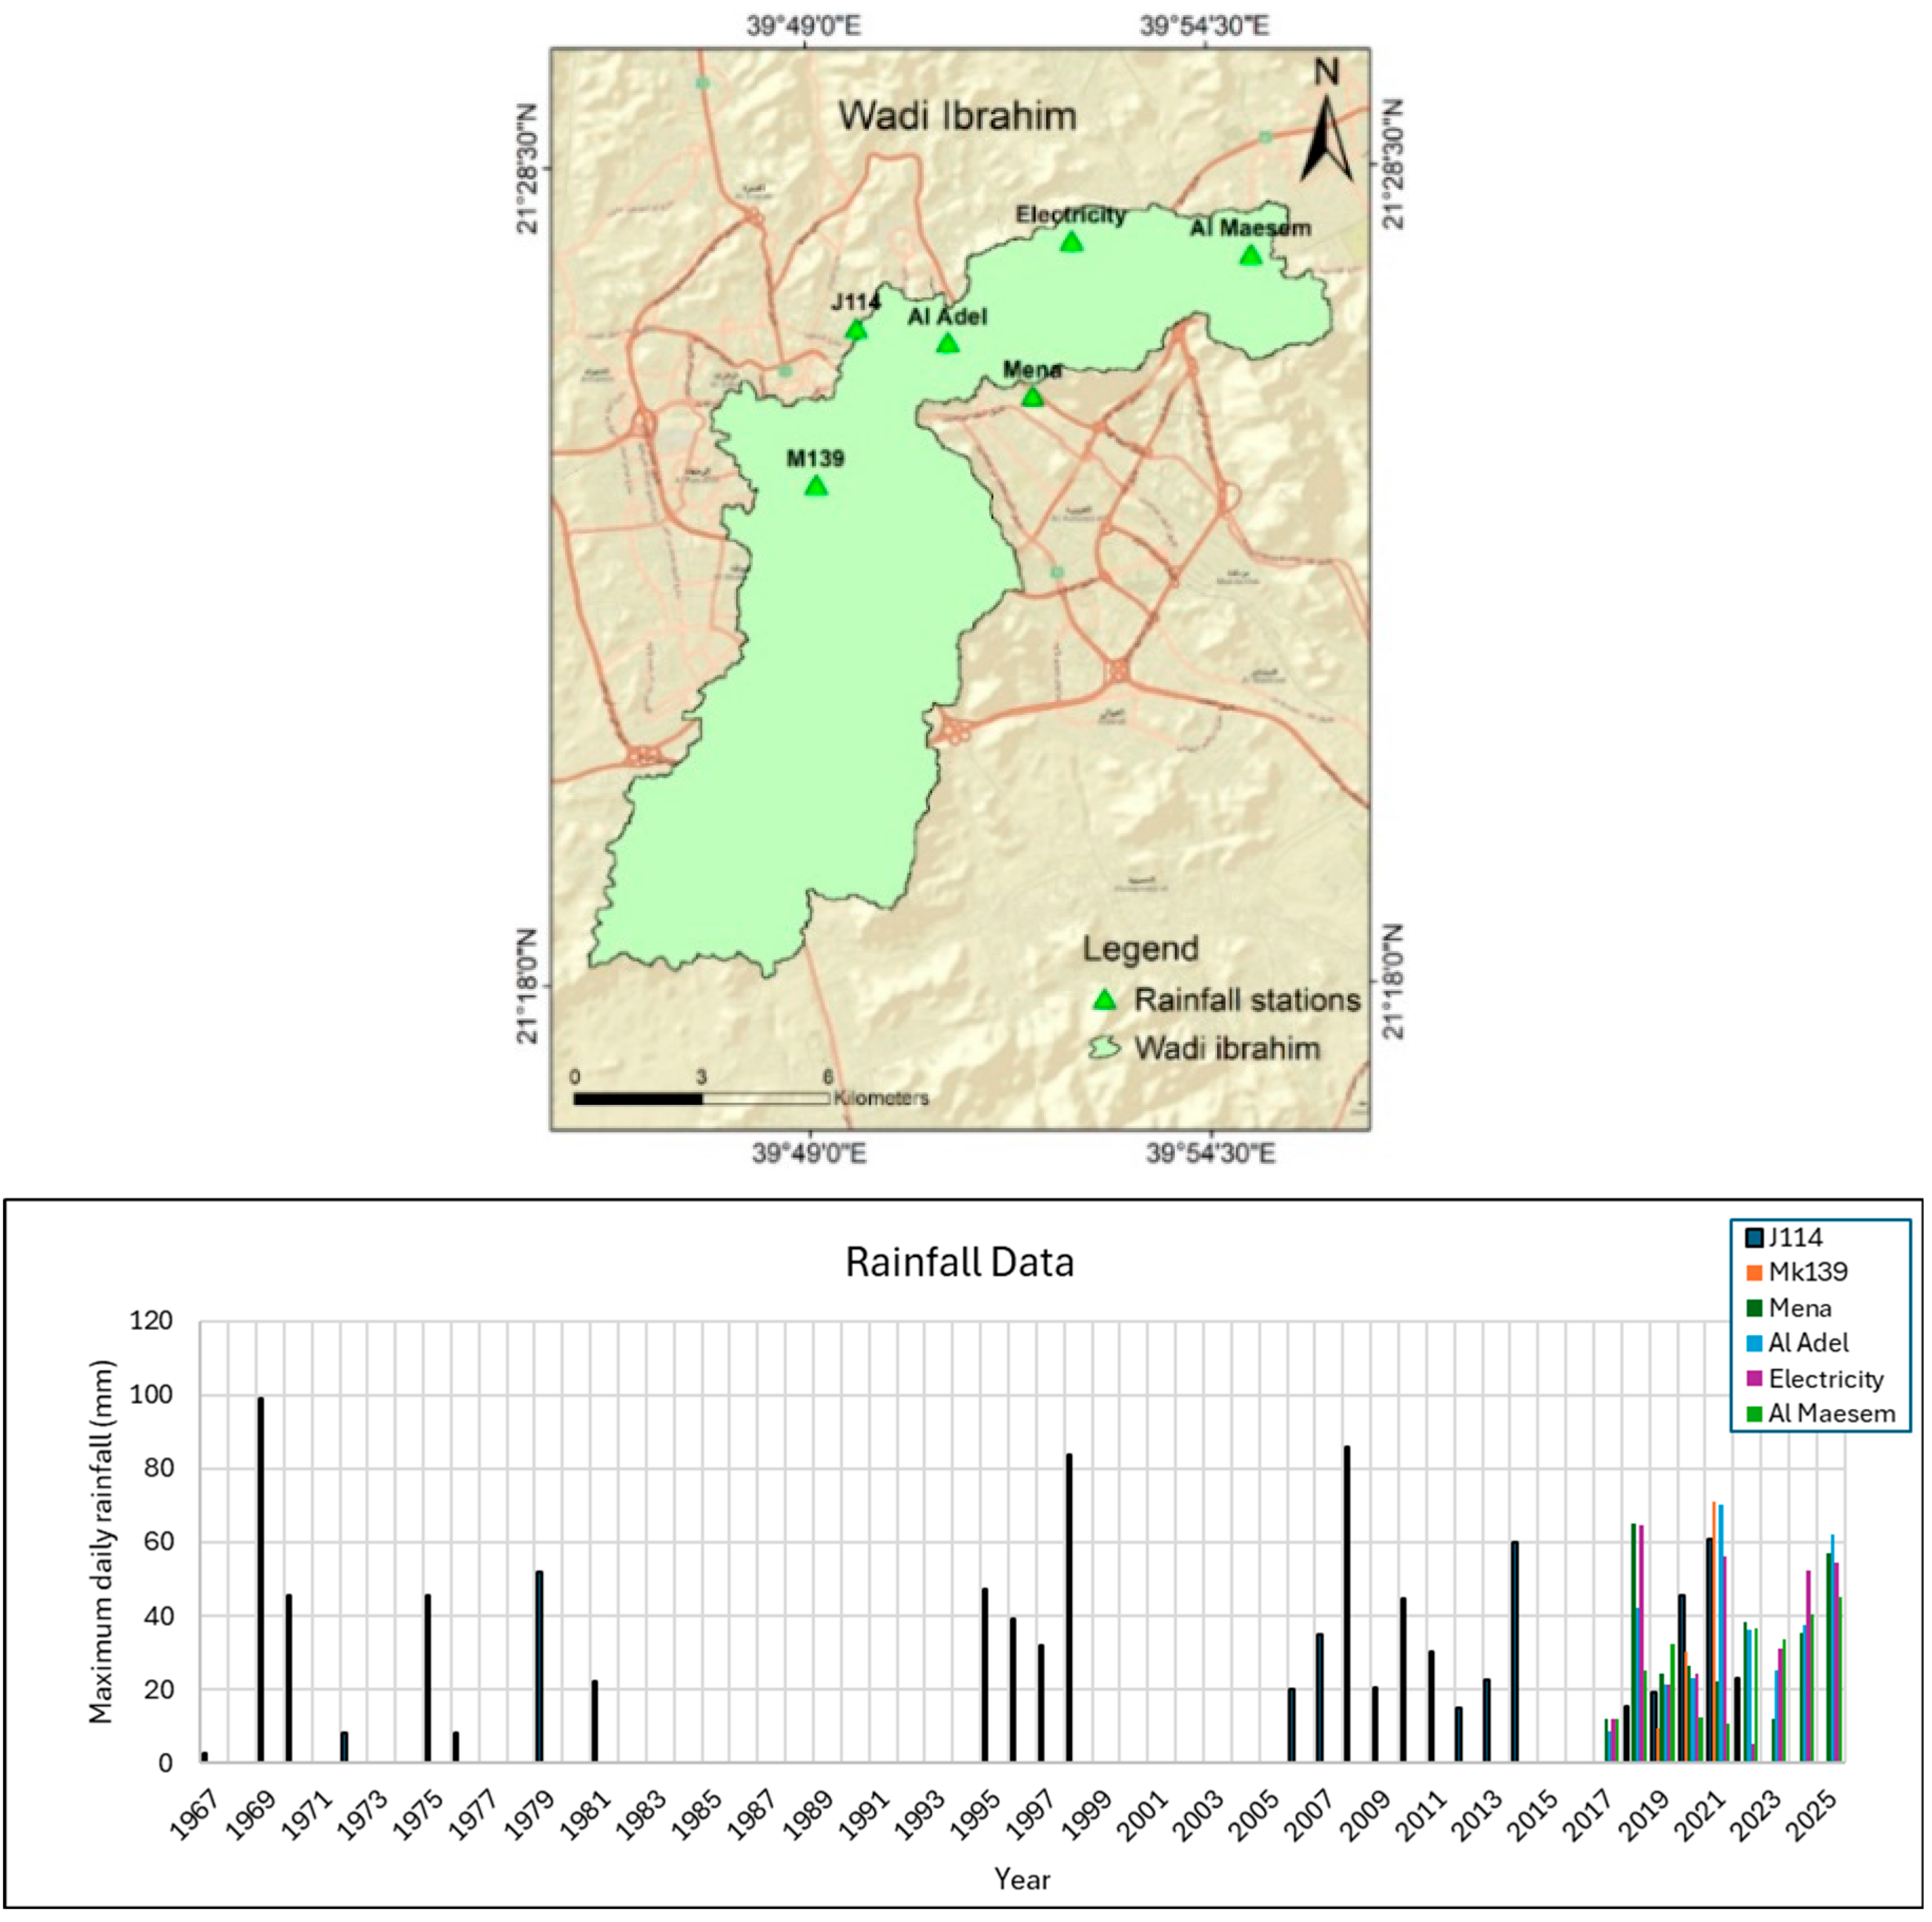
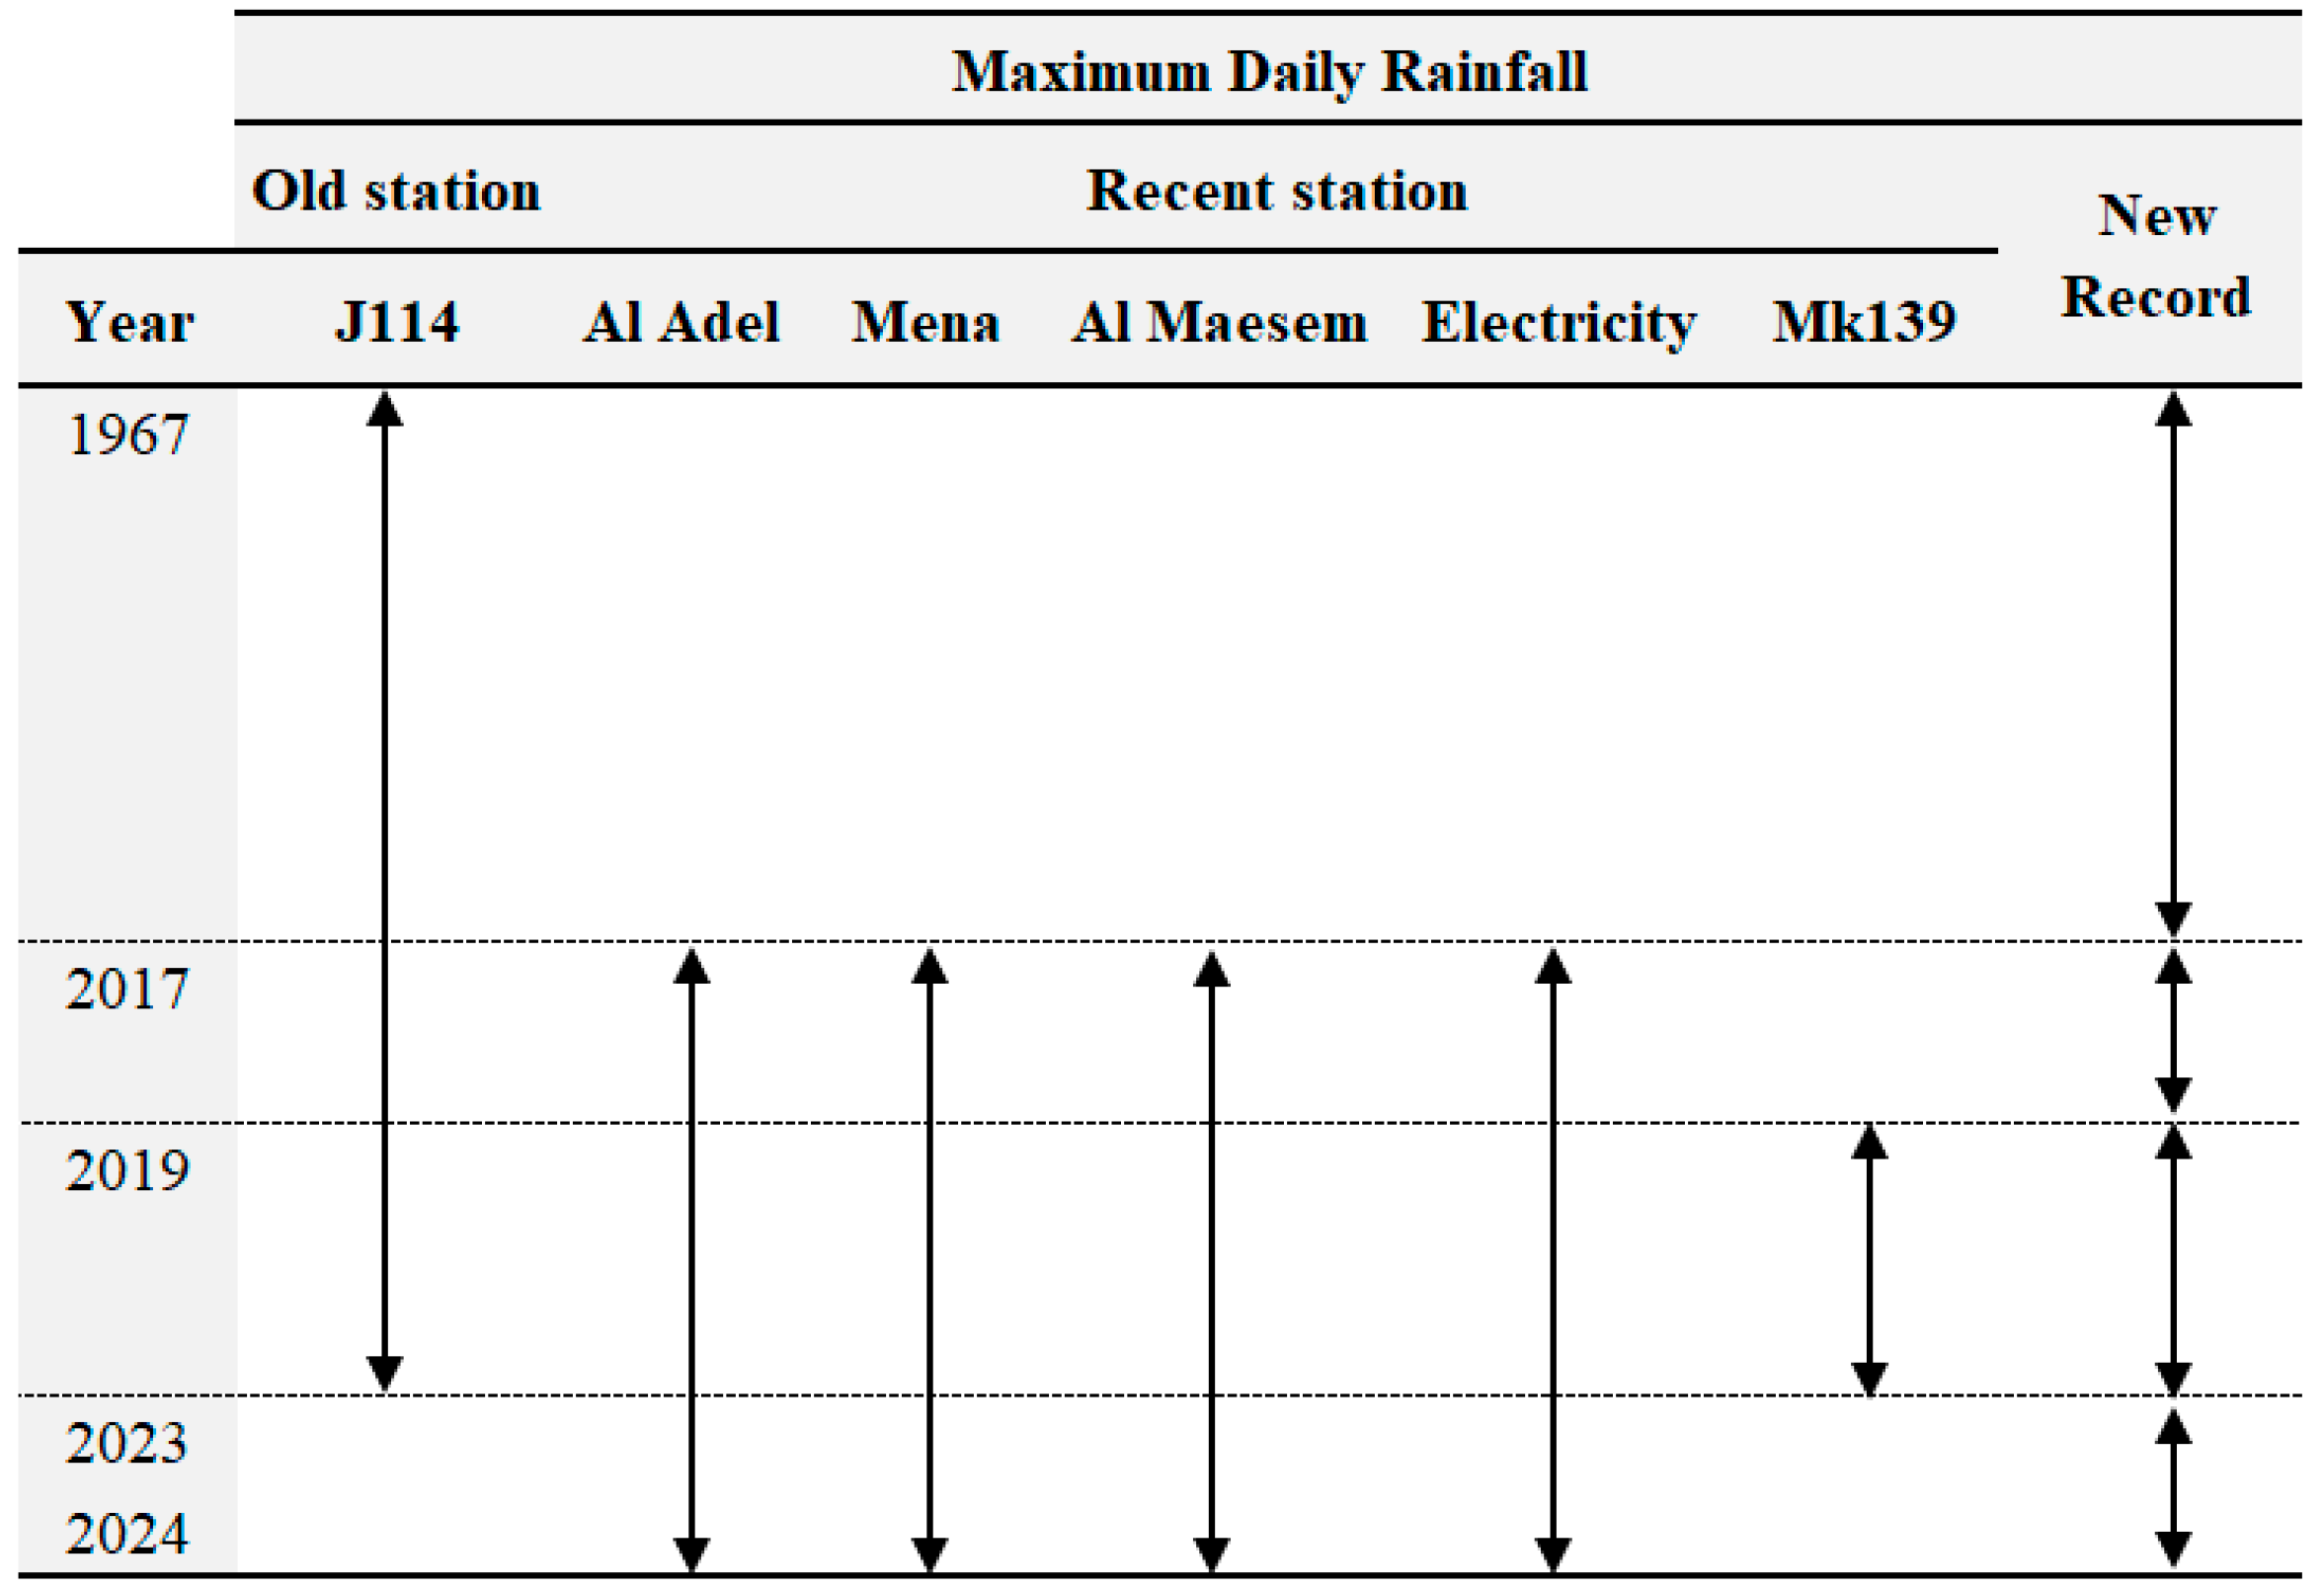
Rainfall data, as a key climatic factor, were obtained from six rainfall stations located within the Wadi Ibrahim watershed: J114, MK139, Al Adel, Mena, Electricity, and Al Maesem. Among these, Station J114 provided a long-term record, with over 55 years of maximum daily rainfall spanning from 1967 to 2022, with a peak rainfall of 100 mm. In contrast, the other stations (Al Adel, Mena, Electricity, and Al Maesem) are relatively new, with data available only from 2017 to 2025 (Figure 4). The spatial distribution of stations offers reliable rainfall coverage, which is crucial for accurate hydrological modeling and flood hazard assessment, capturing both historical and recent climate patterns [40].
The gap in rainfall data from 1967 to 2017 was addressed by generating a reconstructed dataset based on the average of overlapping records from the available stations for the period 2017–2024, as shown in Figure 5.

3.2. LULC Classification

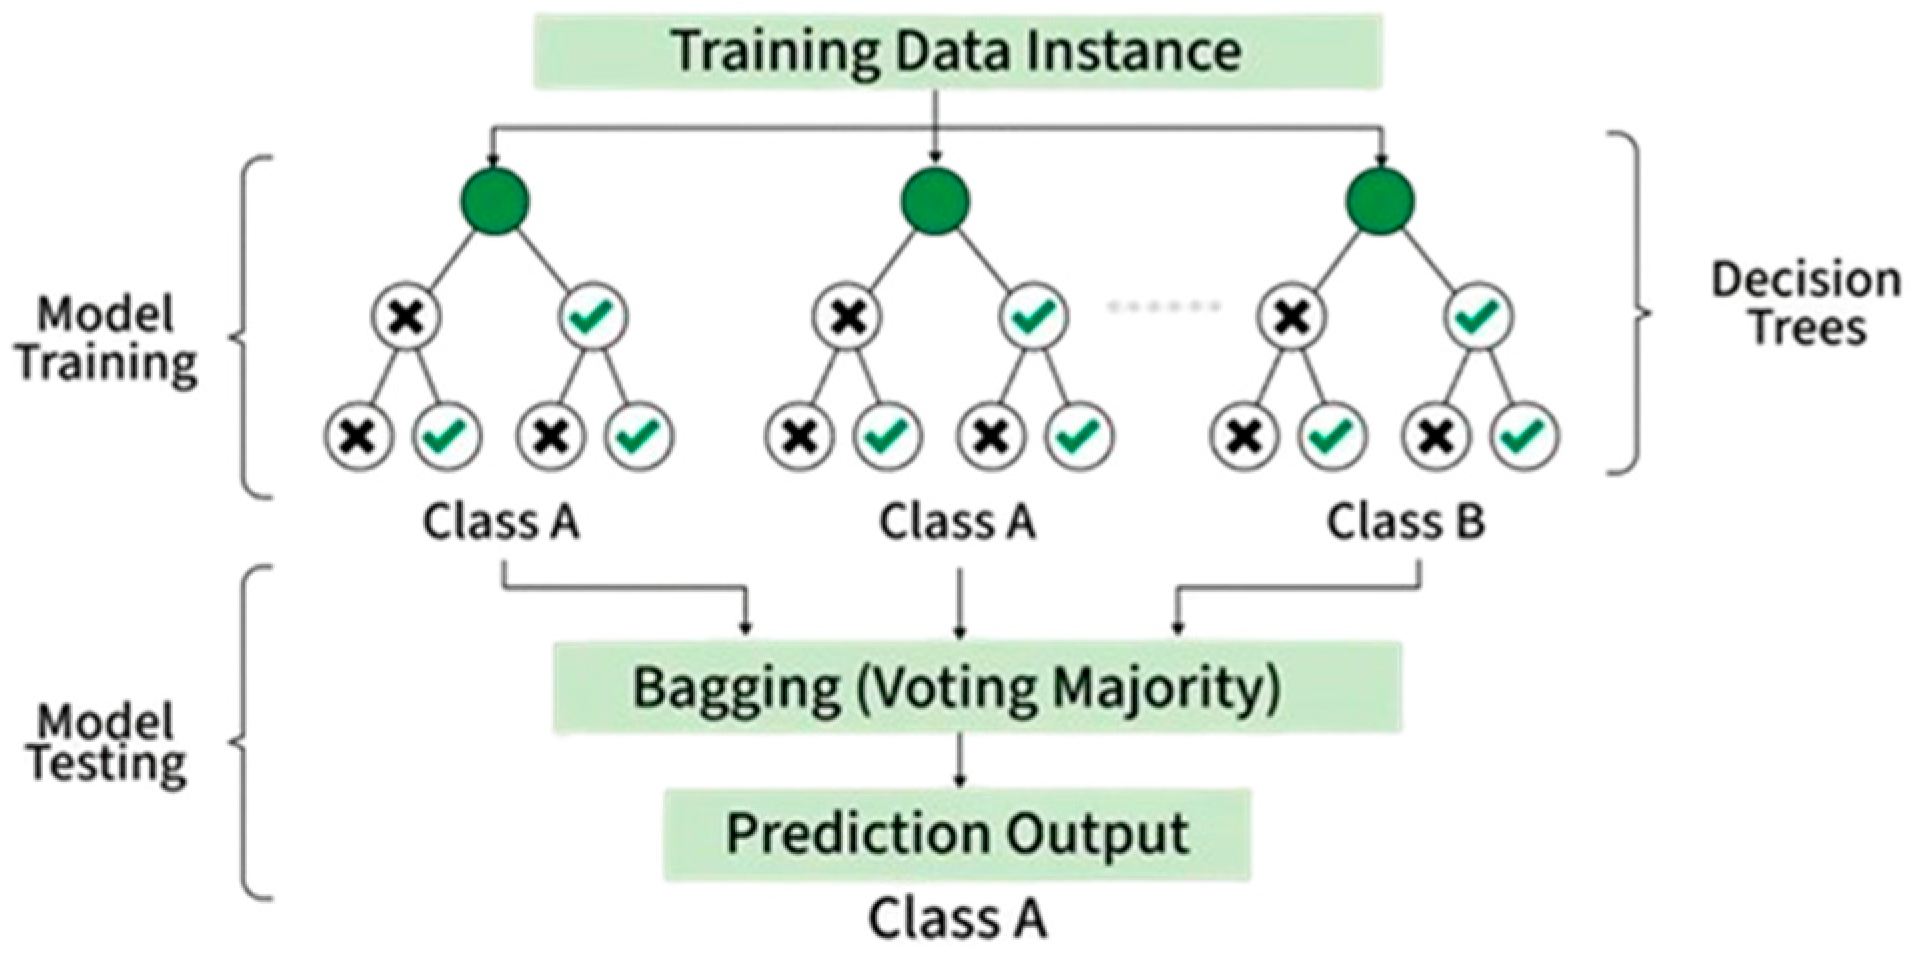
This study uses the Random Forest (RF) algorithm for LULC classification [41]. Random Forest is a machine learning model that classifies data by combining multiple decision trees to improve accuracy and robustness [42]. It operates based on the principle that multiple models collectively produce better results than a single model. Each decision tree classifies data by recursively splitting it based on feature values, aiming to maximize differences between classes while maintaining similarity within each group [43]. During training, multiple trees are constructed using bootstrap samples of the training data along with random subsets of features, allowing each tree to learn and assign a class. During testing, a new sample is passed through all trees, where each tree produces a class prediction, and the final step is the bagging (majority voting) that selects the class with the most votes as the final prediction output. By aggregating the predictions of many trees, RF reduces overfitting and enhances overall model performance. The workflow of RF is illustrated in Figure 6.
Prior to applying the RF classifier, the preprocessing of Landsat imagery and the classification workflow implemented in Google Earth Engine (GEE) were carried out as summarized in Table 4.

3.3. Historical and Recent LULC

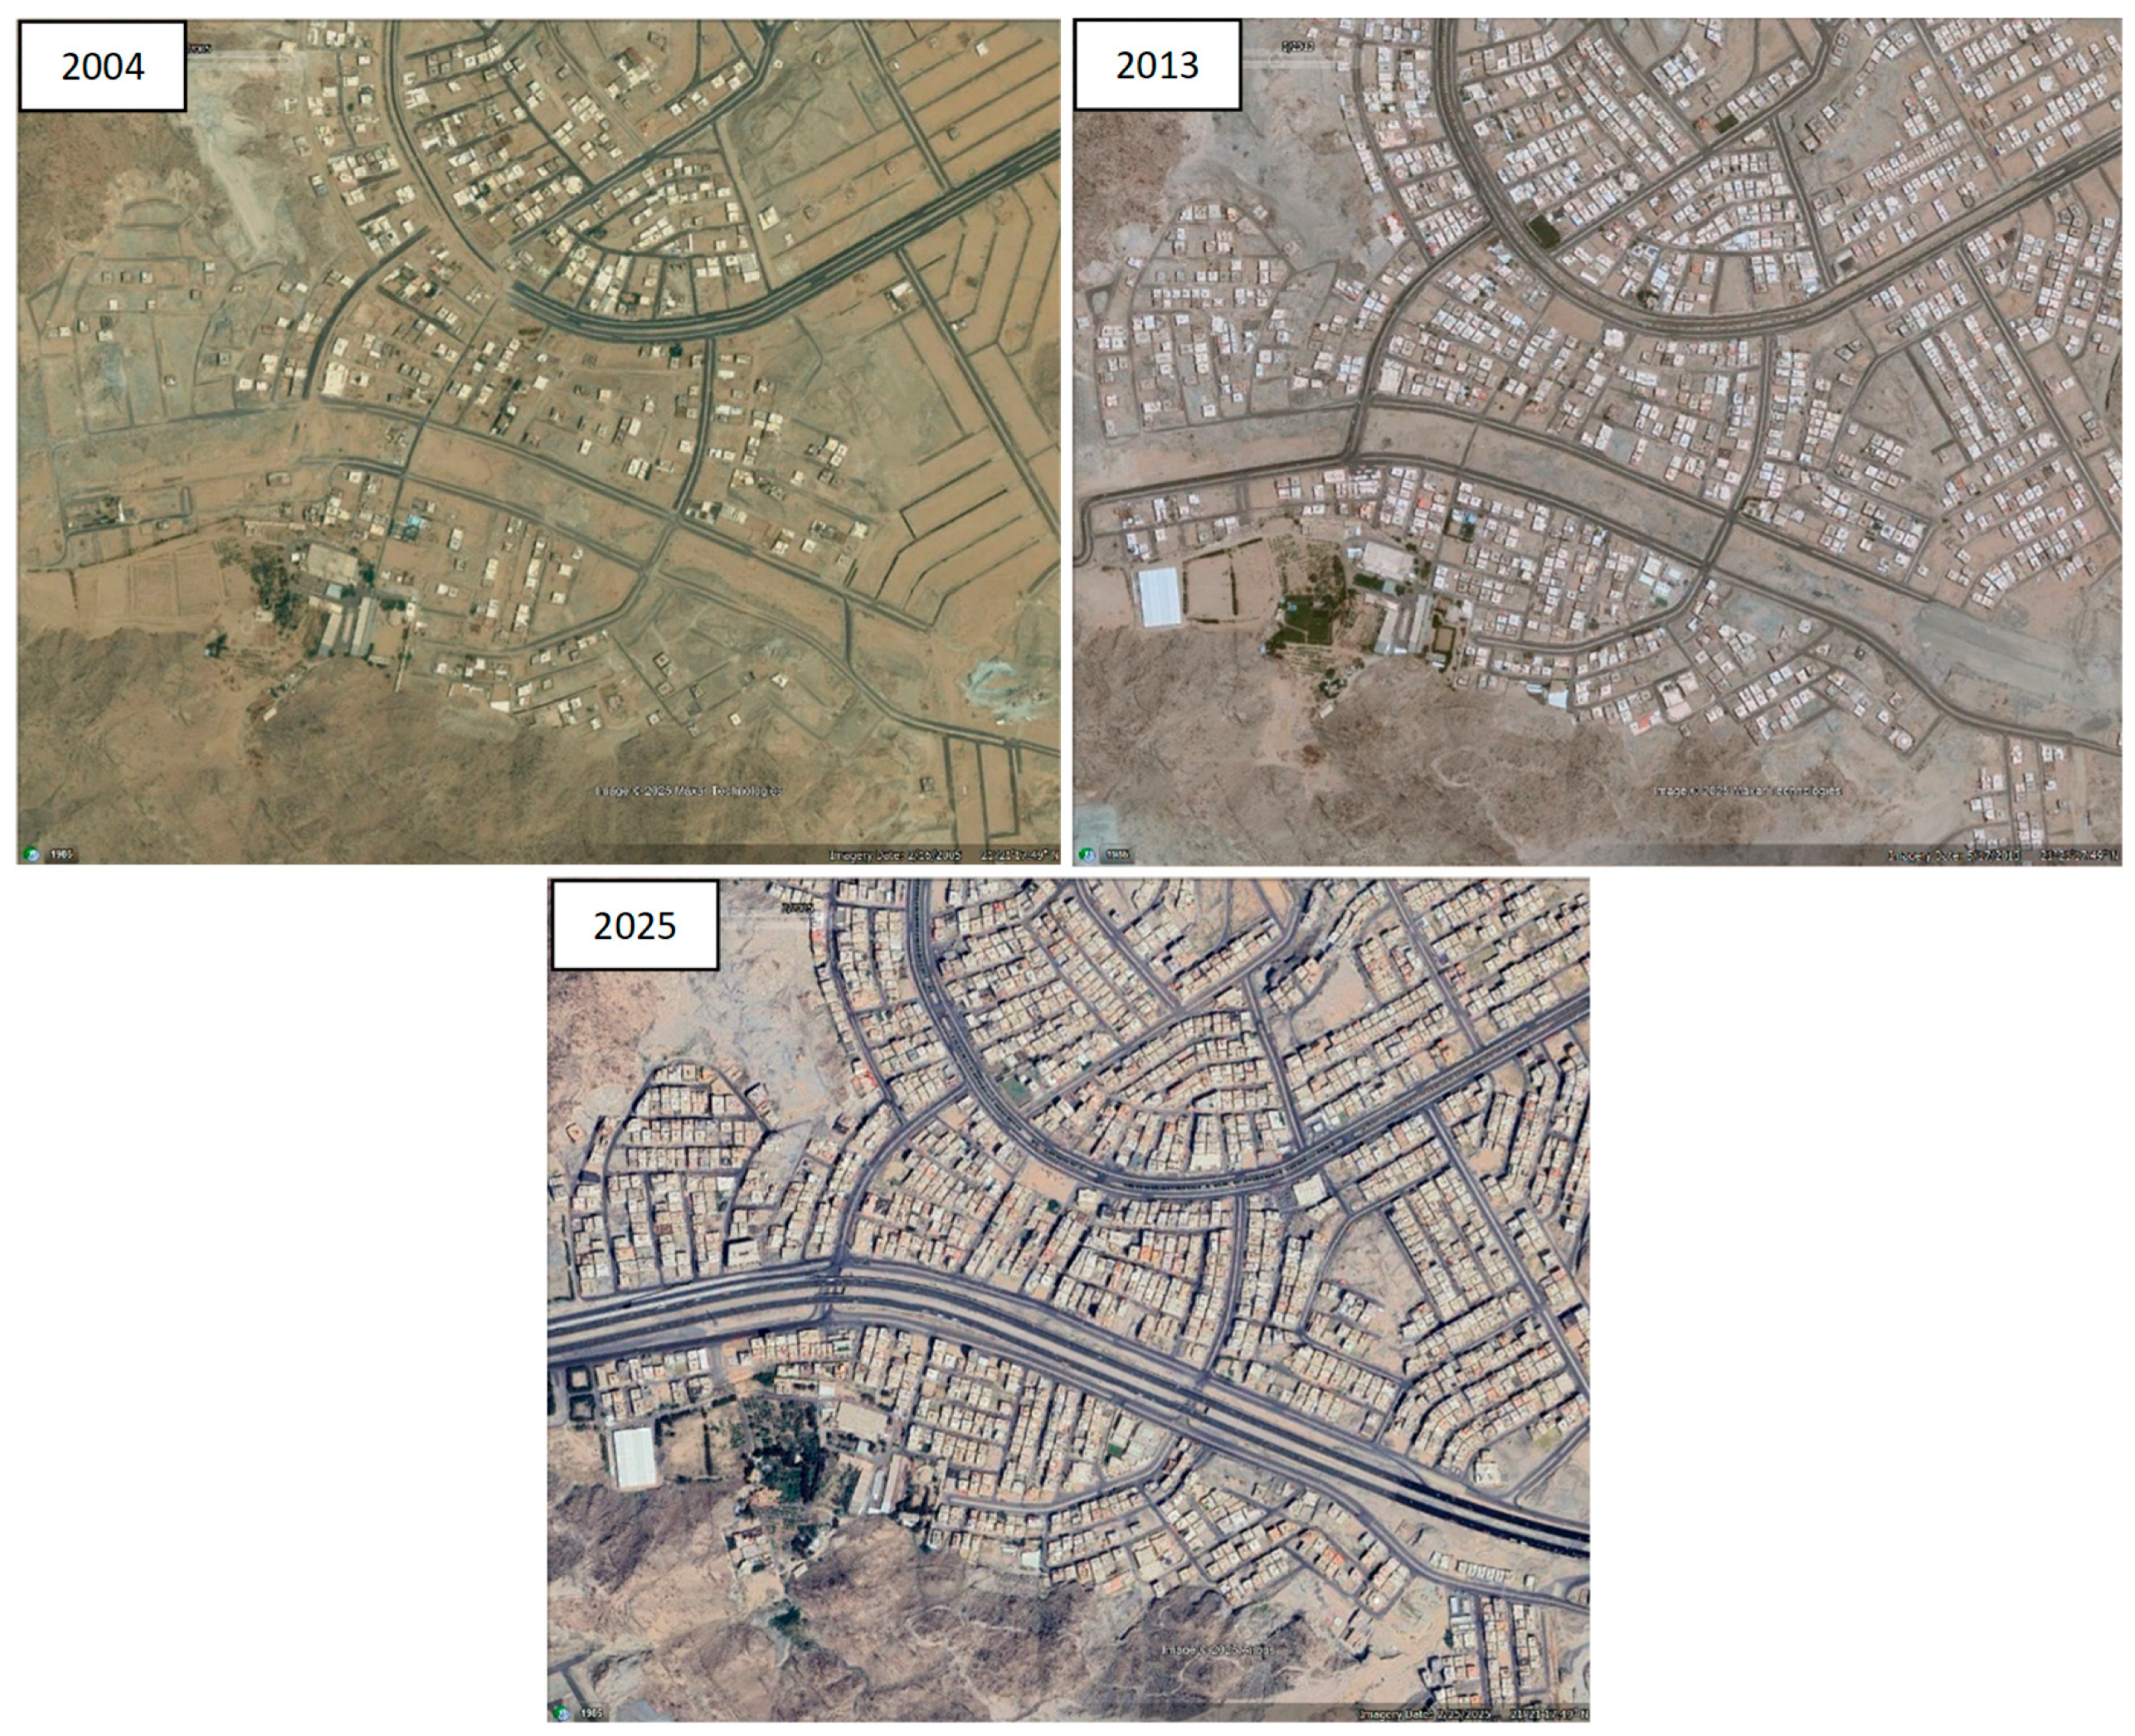
The LULC of the Wadi Ibrahim watershed was analyzed for historical (2001 and 2013) and recent scenarios (2025) and classified into built-up, bare land, and vegetation. Preliminary observations based on historical imagery from Google Earth Pro indicate urban expansion within the Wadi Ibrahim watershed in Makkah City over the past two decades. For instance, in the Batha Quraish district (latitude: 21°21′20.72″ N and longitude: 39°49′29.91″ E) located within Wadi Ibrahim, noticeable changes occurred between 2004 and 2025, marked by an increase in the number of buildings and a decrease in bare land (Figure 7).

3.4. Projected LULC

The LULC projection scenario for 2037, representing a 12-year interval, was conducted using the MOLUSCE plugin in QGIS. MOLUSCE, available in the official QGIS plugin repository (https://plugins.qgis.org/plugins/molusce/, accessed on 12 April 2026), is a user-friendly tool for analyzing, modeling, and simulating LULC changes. The theoretical basis of this tool lies in predicting land use changes through an ANN–CA approach, which integrates Cellular Automata with the Markov chain to simulate transitions across various land use categories. In this study, ANN was applied to produce transition potential maps that guided future LULC predictions. Driving factors such as slope, elevation, and distances from roads and settlements were used as input variables, with their correlations to LULC assessed using Pearson’s method. After calibration and validation, the CA–ANN model was employed to simulate the projected LULC scenario for 2037.
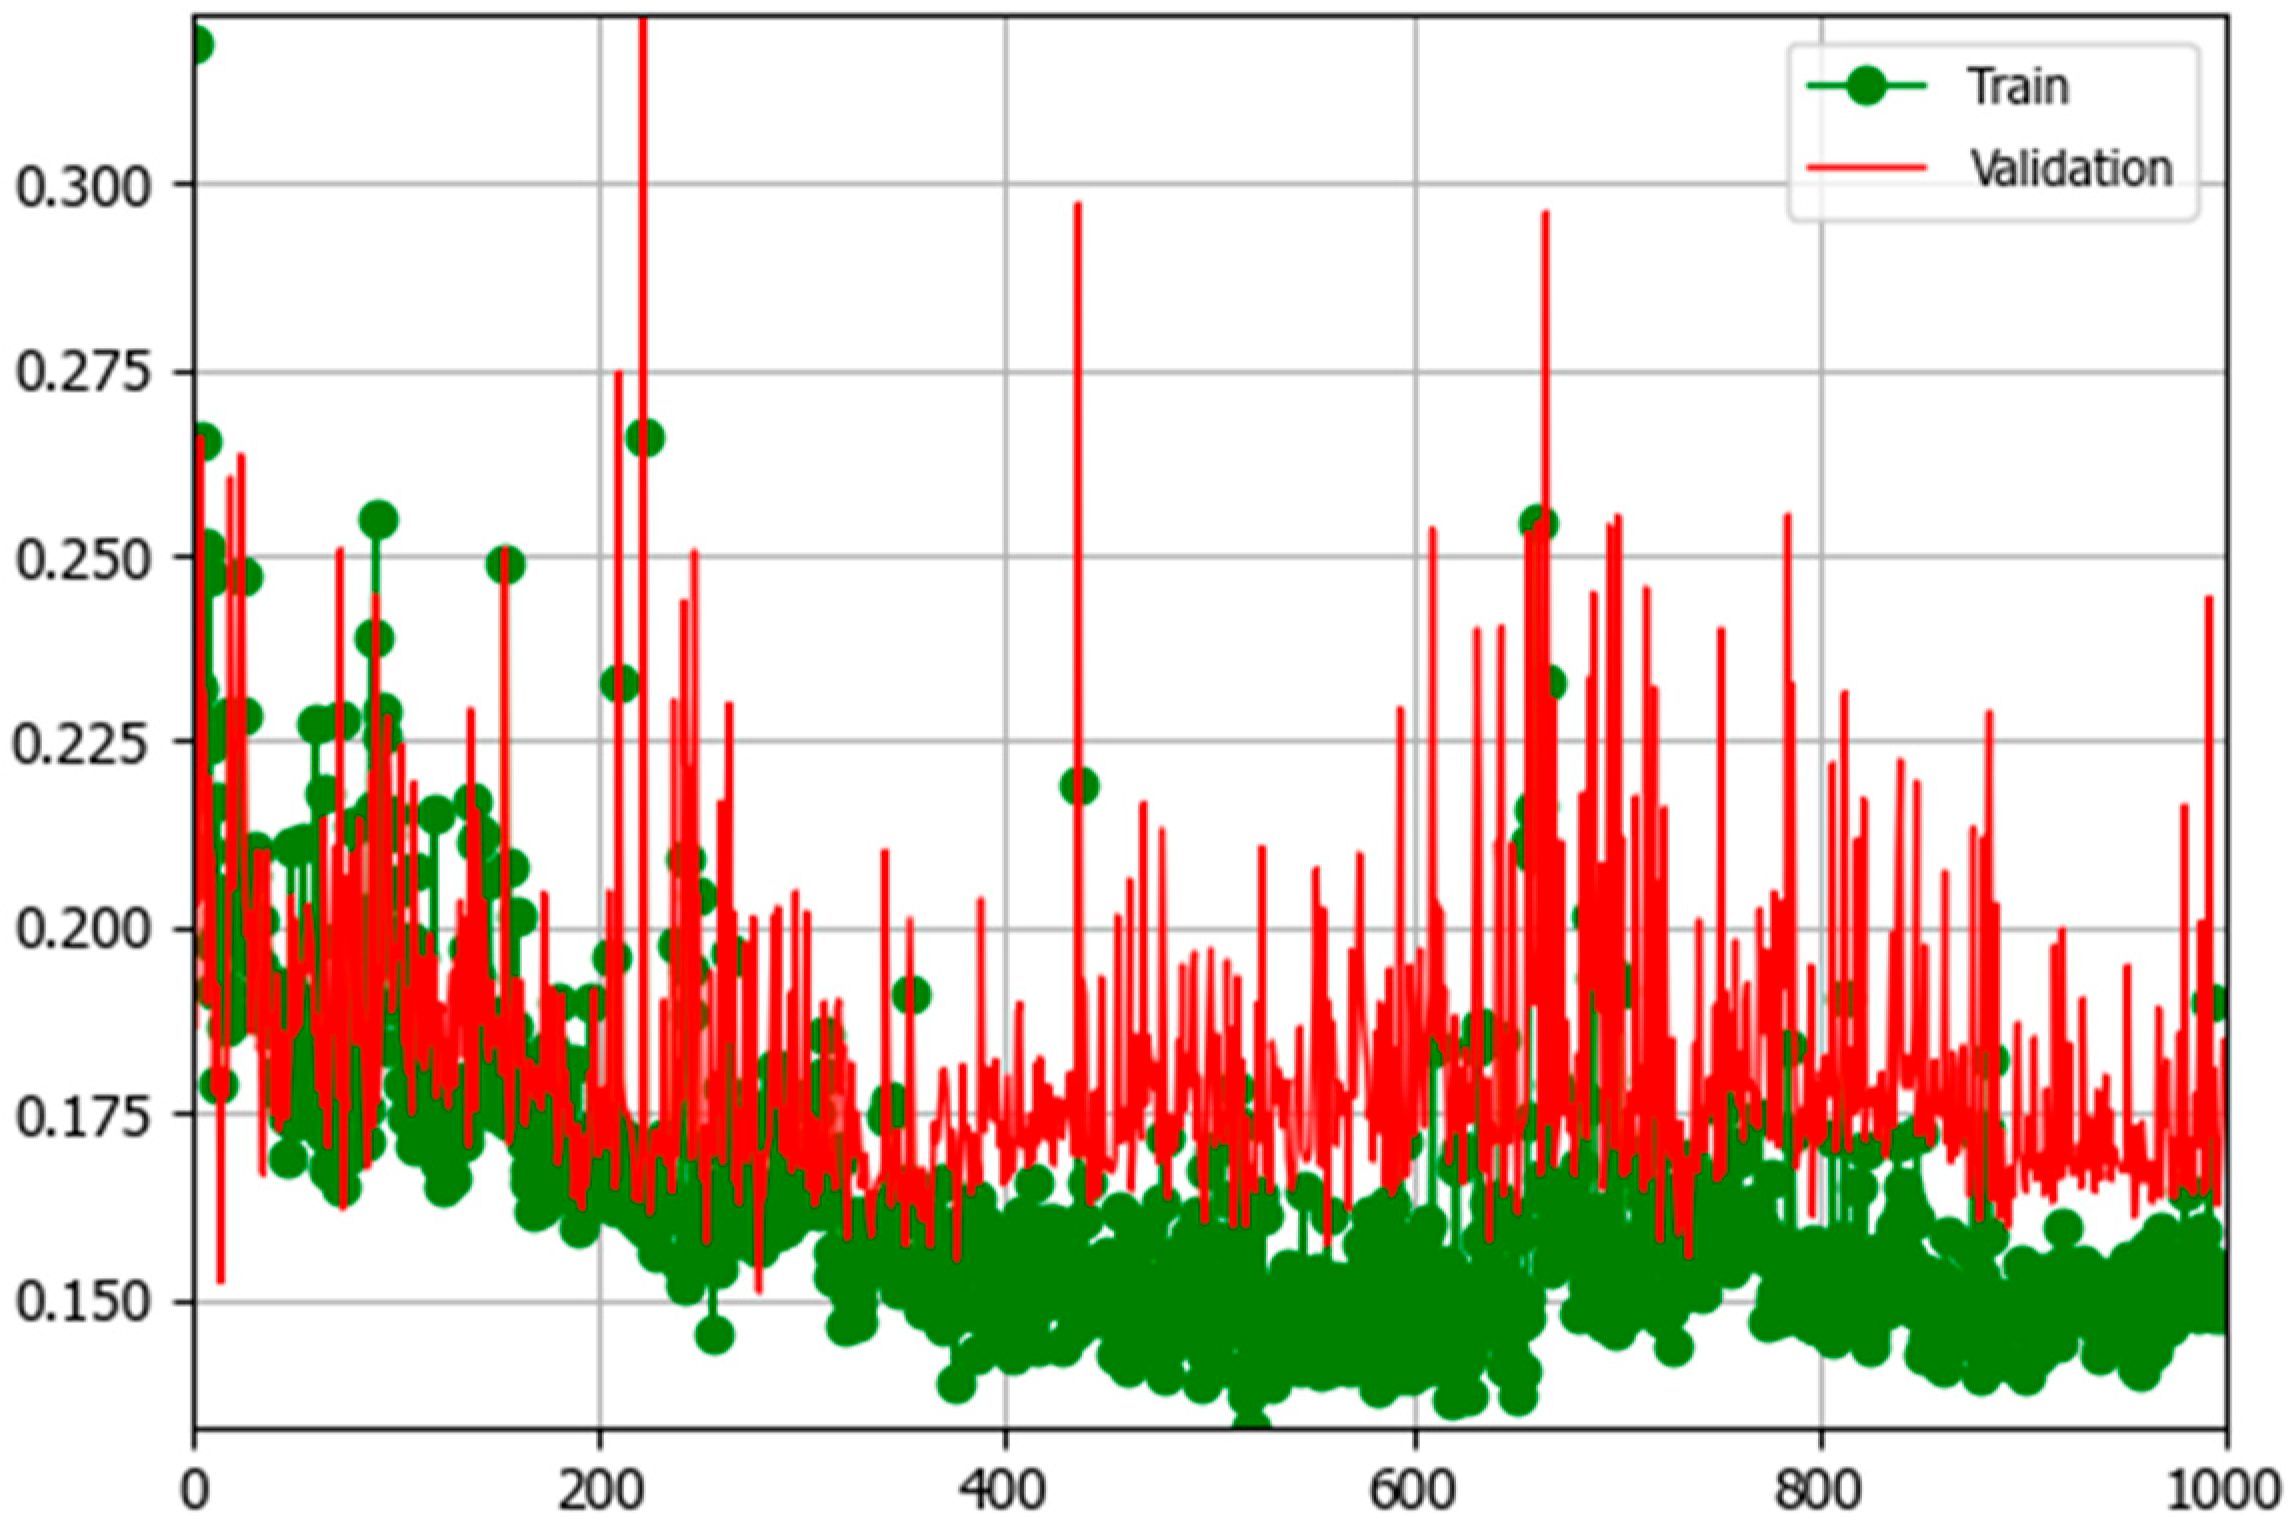
The configuration of the CA–ANN model is explicitly presented, with detailed parameters summarized in Table 5 and the learning curve shown in Figure 8 [44]. The ANN component was implemented as a multilayer perceptron consisting of an input layer, ten hidden layers, and an output layer. The number of neurons in the hidden layer was determined through a trial-and-error process to achieve optimal performance. The model was trained using a supervised learning approach with 1000 iterations and a learning rate of 0.1. The dataset was divided into training and testing subsets using an 80:20 split. Within this framework, transition rules determine how each cell of land use class changes based on an ANN algorithm to predict the probabilities and the influence of neighboring cells, enabling the CA simulation to realistically capture the spatial patterns of urban expansion.
The annual rate change (ARC) or magnitude of change was also calculated for each land use type by dividing the difference between the final and initial years by the initial value multiplied by the time interval. The ARC equations for each class are as follows:
A R C % = A f A i A i × t × 100
where ARC is the annual rate of change in percentage, Af is the area of the final year (km2), Ai is the area of the initial year (km2), and t is the time interval (year).

3.5. Assessment of LULC Classification

The accuracy of the LULC classifications for 2001, 2013, and 2025 was assessed to determine how well the classified maps reflected actual ground conditions. The assessment was conducted using a confusion matrix to derive four main accuracy metrics: overall accuracy (OA), producer accuracy (P), user accuracy (U), and the Kappa coefficient (κ). A confusion matrix is a cross-tabulation of reference and classified data, where correctly classified samples are represented along the main diagonal, while misclassifications appear in the off-diagonal elements. This matrix provides the basis for computing both class-specific and overall classification performance. OA represents the proportion of correctly classified samples to the total number of reference samples, providing a general measure of classification performance across all classes. P accuracy measures how well each class is correctly identified (omission errors), whereas U accuracy shows the reliability of the classified pixels (commission errors) [45]. κ evaluates the degree of agreement between the classification and reference data. Its values range from poor (<0.00), slight (0.00–0.20), fair (0.21–0.40), moderate (0.41–0.60), substantial (0.61–0.80), to almost perfect (0.81–1.00) [46]. The formulas are as follows:
P = D i j R i
U = D i j C j
κ = N i = 1 a D i j i = 1 a R i C j N 2 i = 1 a R i C j
where P is the producer’s accuracy, U is the user’s accuracy, D i j is the number of correctly classified pixels in row i (for P calculation) and row j (for U calculation), R i is the total number of pixels in row i, C j is the total number of pixels in column j, κ is the Kappa coefficient, D i j is the sum of correctly classified pixels in all images, and a is the number of classes.

3.6. Rainfall Analysis

Rainfall analysis was conducted to assess the temporal and spatial variability of precipitation across the study area, including the maximum daily rainfall, frequency distributions, and return periods using the Gumbel distribution [47]. Return periods of 50, 100, and 200 years were estimated to support hydrological modeling and hazard assessment. The average rainfall increased from 94.51 mm (50-year) to 107.09 mm (100-year, +13.29%) and from 107.09 mm to 119.62 mm (200-year, +11.70%), as presented in Table 6, indicating higher rainfall for longer return periods. These values were used in the HEC-HMS model to simulate rainfall–runoff dynamics within the watershed.
The temporal rainfall distribution for various return periods was estimated using a dimensionless mass curve formula, as proposed in [48], and is presented in Equation (5):
R ( t ) R T = 1 a t D b 1 a
where R(t) denotes the cumulative rainfall depth at a given elapsed time t, R T represents the total storm rainfall depth; t refers to the elapsed time since the beginning of the storm; D is the storm duration, and a and b are fitting parameters, assigned values of 0.037 and 1, respectively, for the Makkah region, KSA.

3.7. Hydrological Analysis

The SCS-CN method was employed to estimate direct runoff, considering watershed characteristics, rainfall duration (D), impervious area (%), lag time ( T l a g ) , initial abstraction ( I a ) , and the composite CN. These parameters were used as inputs in HEC-HMS to simulate the rainfall–runoff process (Q). Table 7 presents the parameters and equations used to compute the hydrological characteristics for the historical (2001 and 2013), current (2025), and projected (2037) LULC scenarios. The model was run for a 3 h storm duration, and the resulting Q p , t p , and runoff volumes and were estimated for the Wadi Ibrahim watershed under return periods of 50, 100, and 200 years.
Table 7. Hydrological parameters and corresponding Equations (6)–(11) used in the flood study.
Hydrological ParametersEquations (6)–(11)References
Direct runoff Q = P 0.01 S 2 ( P + 0.99 S ) (6)USDA Soil Conservation Services
[39]
S = 25,400 C N 254 (7)
I a = 0.01 S (8)
Lag time T l a g = L 0.8 2540 22.68 C N 0.7 14,104 C N 0.7 S 0.5 (9)Ponce and Hawkins
[49]
Peak discharge Q p = C A t p (10)USDA-NRCS (1986)
[50]
Time to peak t p = Δ t 2 + T l a g (11)USDA-NRCS (1986)
[50]
Where S represents the maximum retention potential (mm), while I a denotes the initial abstraction or initial losses (mm) with I a coefficient ratio 0.01 for the arid region. Q is the accumulated rainfall excess at time t (mm), and P is the accumulated rainfall depth at time t (mm). The basin lag time is expressed as T l a g (hours), with L indicating the hydraulic length measured along the principal watercourse (m), and CN refers to the composite curve number. The watershed slope is denoted by S (m/m). The unit hydrograph peak discharge for 1 cm of effective rainfall is given as Q p (m3/s), where C is the peaking factor (2.08 in SI units), A is the watershed area (km2), t p is the time to peak of the unit hydrograph (hours), and Δt is the duration of excess precipitation (hours).
The percentage changes in peak discharge (ΔQp), time to peak (Δtp), and flood volume (ΔV) were calculated using the following equation:
% C h a n g e = X i X h i s t X h i s t × 100
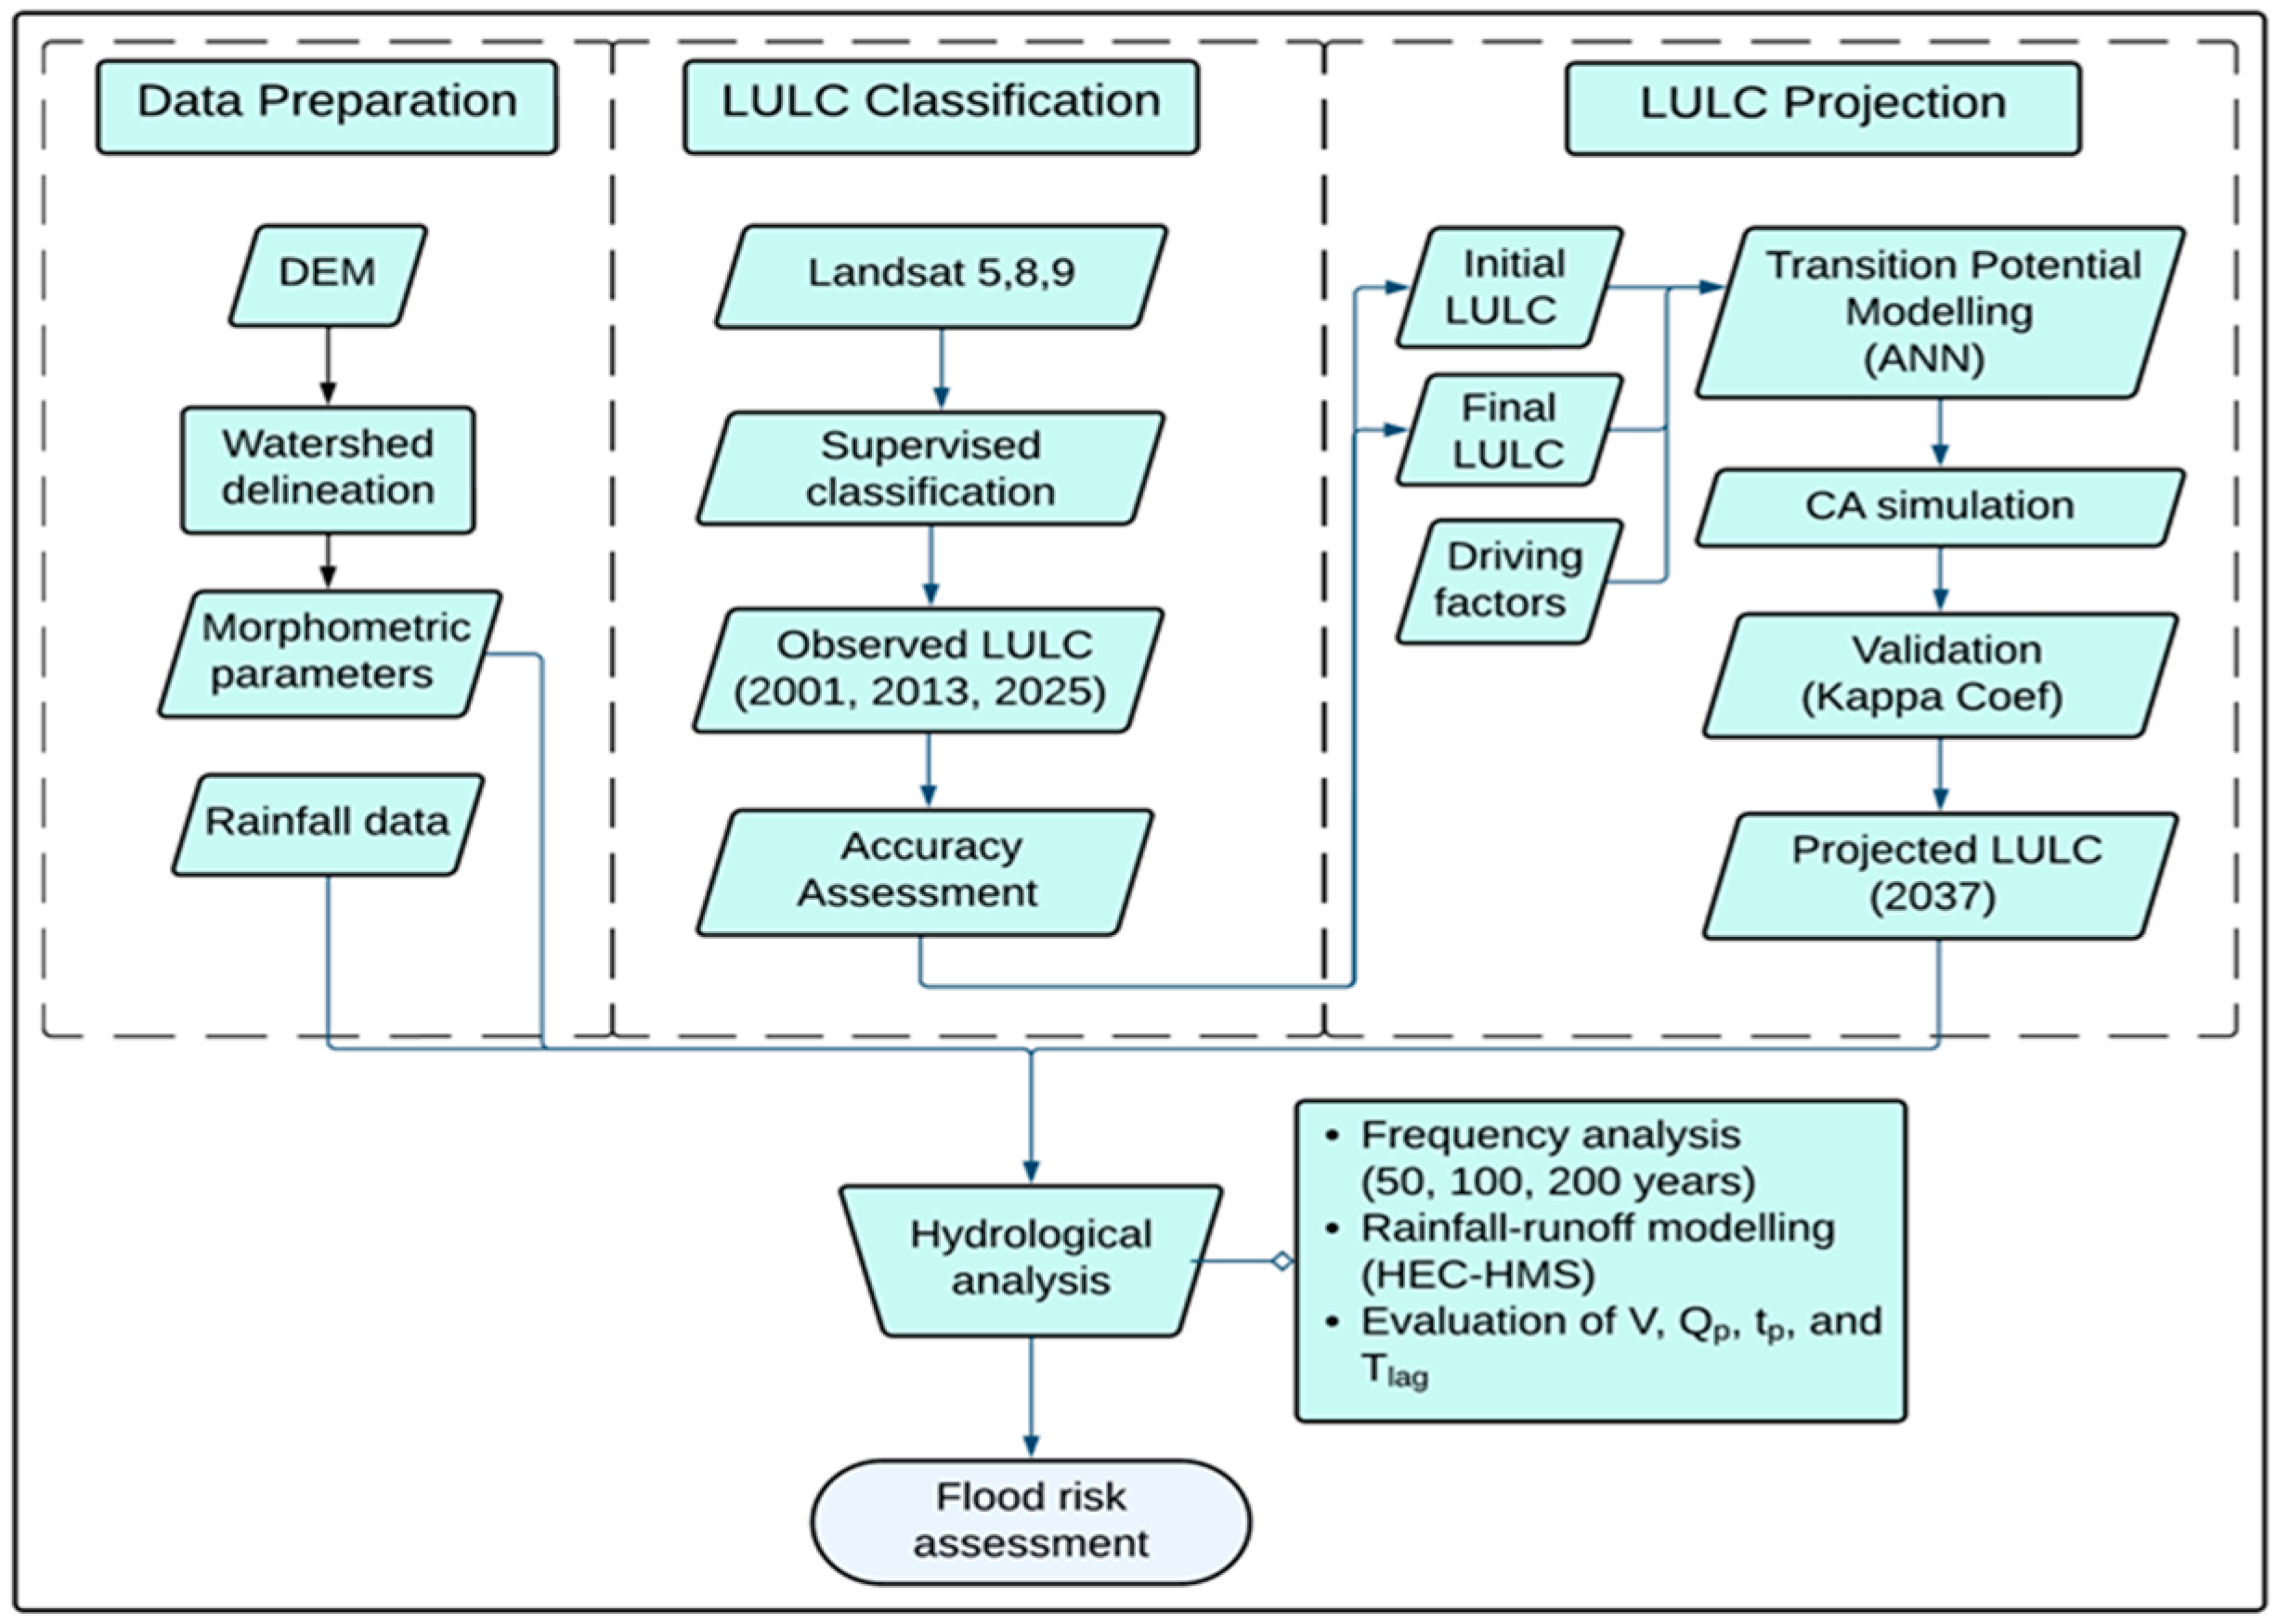
where i represents the LULC scenario for different years (2013, 2025, and 2037), X i is the variable under analysis ( Q p , t p , and V), and X h i s t is denotes the corresponding value for the historical scenario (LULC 2001). The general framework of this study is illustrated in Figure 9.

4. Results

4.1. LULC Changes Analysis

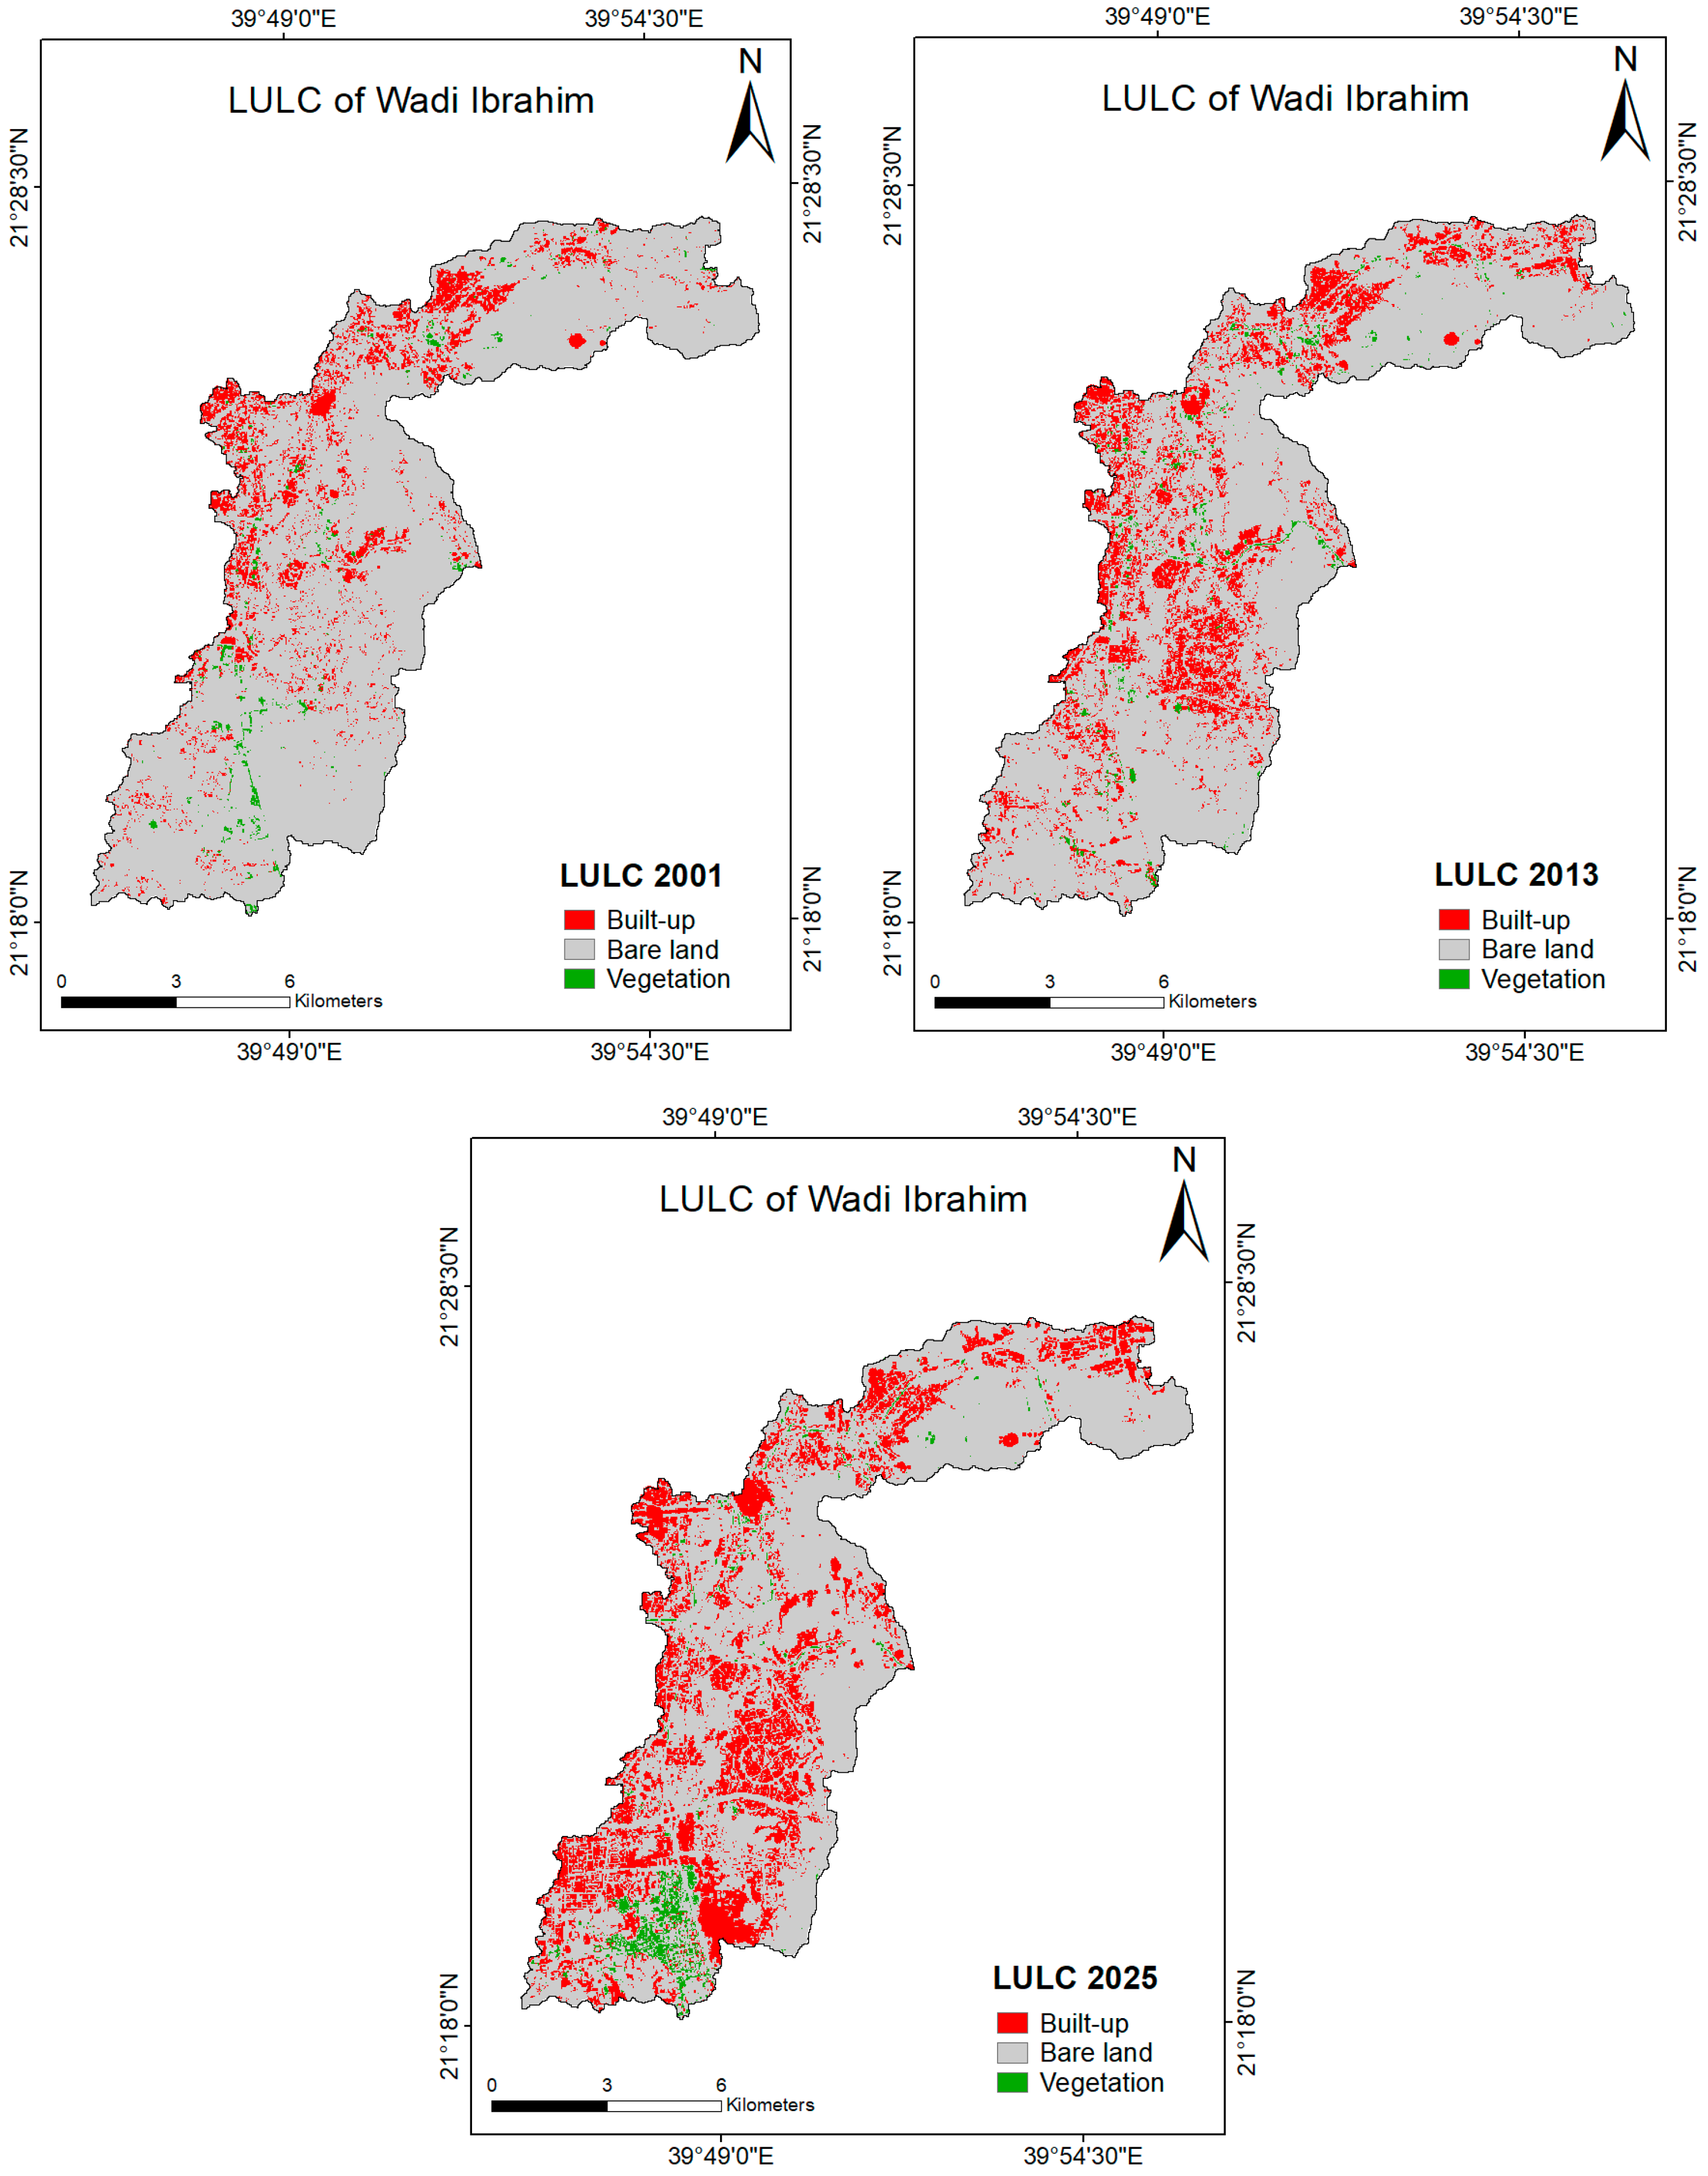
The LULC changes in the Wadi Ibrahim watershed between 2001 and 2025 revealed substantial spatial transformations, reflecting rapid urban expansion and moderate vegetation recovery. As shown in Figure 10, in 2001, bare land dominated the landscape (99.1 km2; 88%), followed by built-up areas (12 km2; 11%) and vegetation (1.5 km2; 1%) (Table 8). By 2013, bare land had declined to 91.3 km2 (81%), built-up areas increased to 19.8 km2 (18%), and vegetation slightly increased to 1.6 km2 (1%). This trend intensified by 2025, with bare land decreasing further to 81.2 km2 (72%), built-up areas sharply increasing to 28.7 km2 (26%), and vegetation modestly increasing to 2.7 km2 (2%). The ARC values for 2001–2025 indicated a 3.3% increase in vegetation, a 5.8% increase in built-up areas, and a 0.8% decline in bare land. These changes have direct implications for surface runoff and flood hazard within the watershed.
The classification accuracy of the LULC maps was evaluated using confusion matrices, OA, and κ, as summarized in Table 9. In 2001, the classification achieved an OA of 0.84 and a κ of 0.75, indicating substantial agreement. Class-wise performance showed moderate to high accuracy, with built-up areas (P = 0.86; U = 0.89) performing better than bare land (P = 0.83; U = 0.73) and vegetation (P = 0.81; U = 0.93).
In 2013, classification performance improved significantly, with OA reaching 0.94 and κ increasing to 0.91. All land cover classes exhibited high reliability, particularly built-up areas (P = 0.90; U = 0.90) and vegetation (P = 0.93; U = 0.96), while bare land also maintained strong accuracy (P = 0.90; U = 0.87).
The highest accuracy was obtained in 2025, with OA = 0.99 and κ = 0.98, reflecting near-perfect classification performance. Built-up areas and bare land achieved almost perfect classification (P = 1.00), while vegetation also showed very high agreement (P = 0.96; U = 0.97).
Overall, the consistent increase in accuracy metrics across the study period indicates a robust classification performance. These results demonstrate that the classification method effectively distinguished land cover types throughout the study period, with κ consistently exceeding 0.88, reflecting almost perfect agreement and acceptable performance [46].

4.2. LULC Projection Analysis

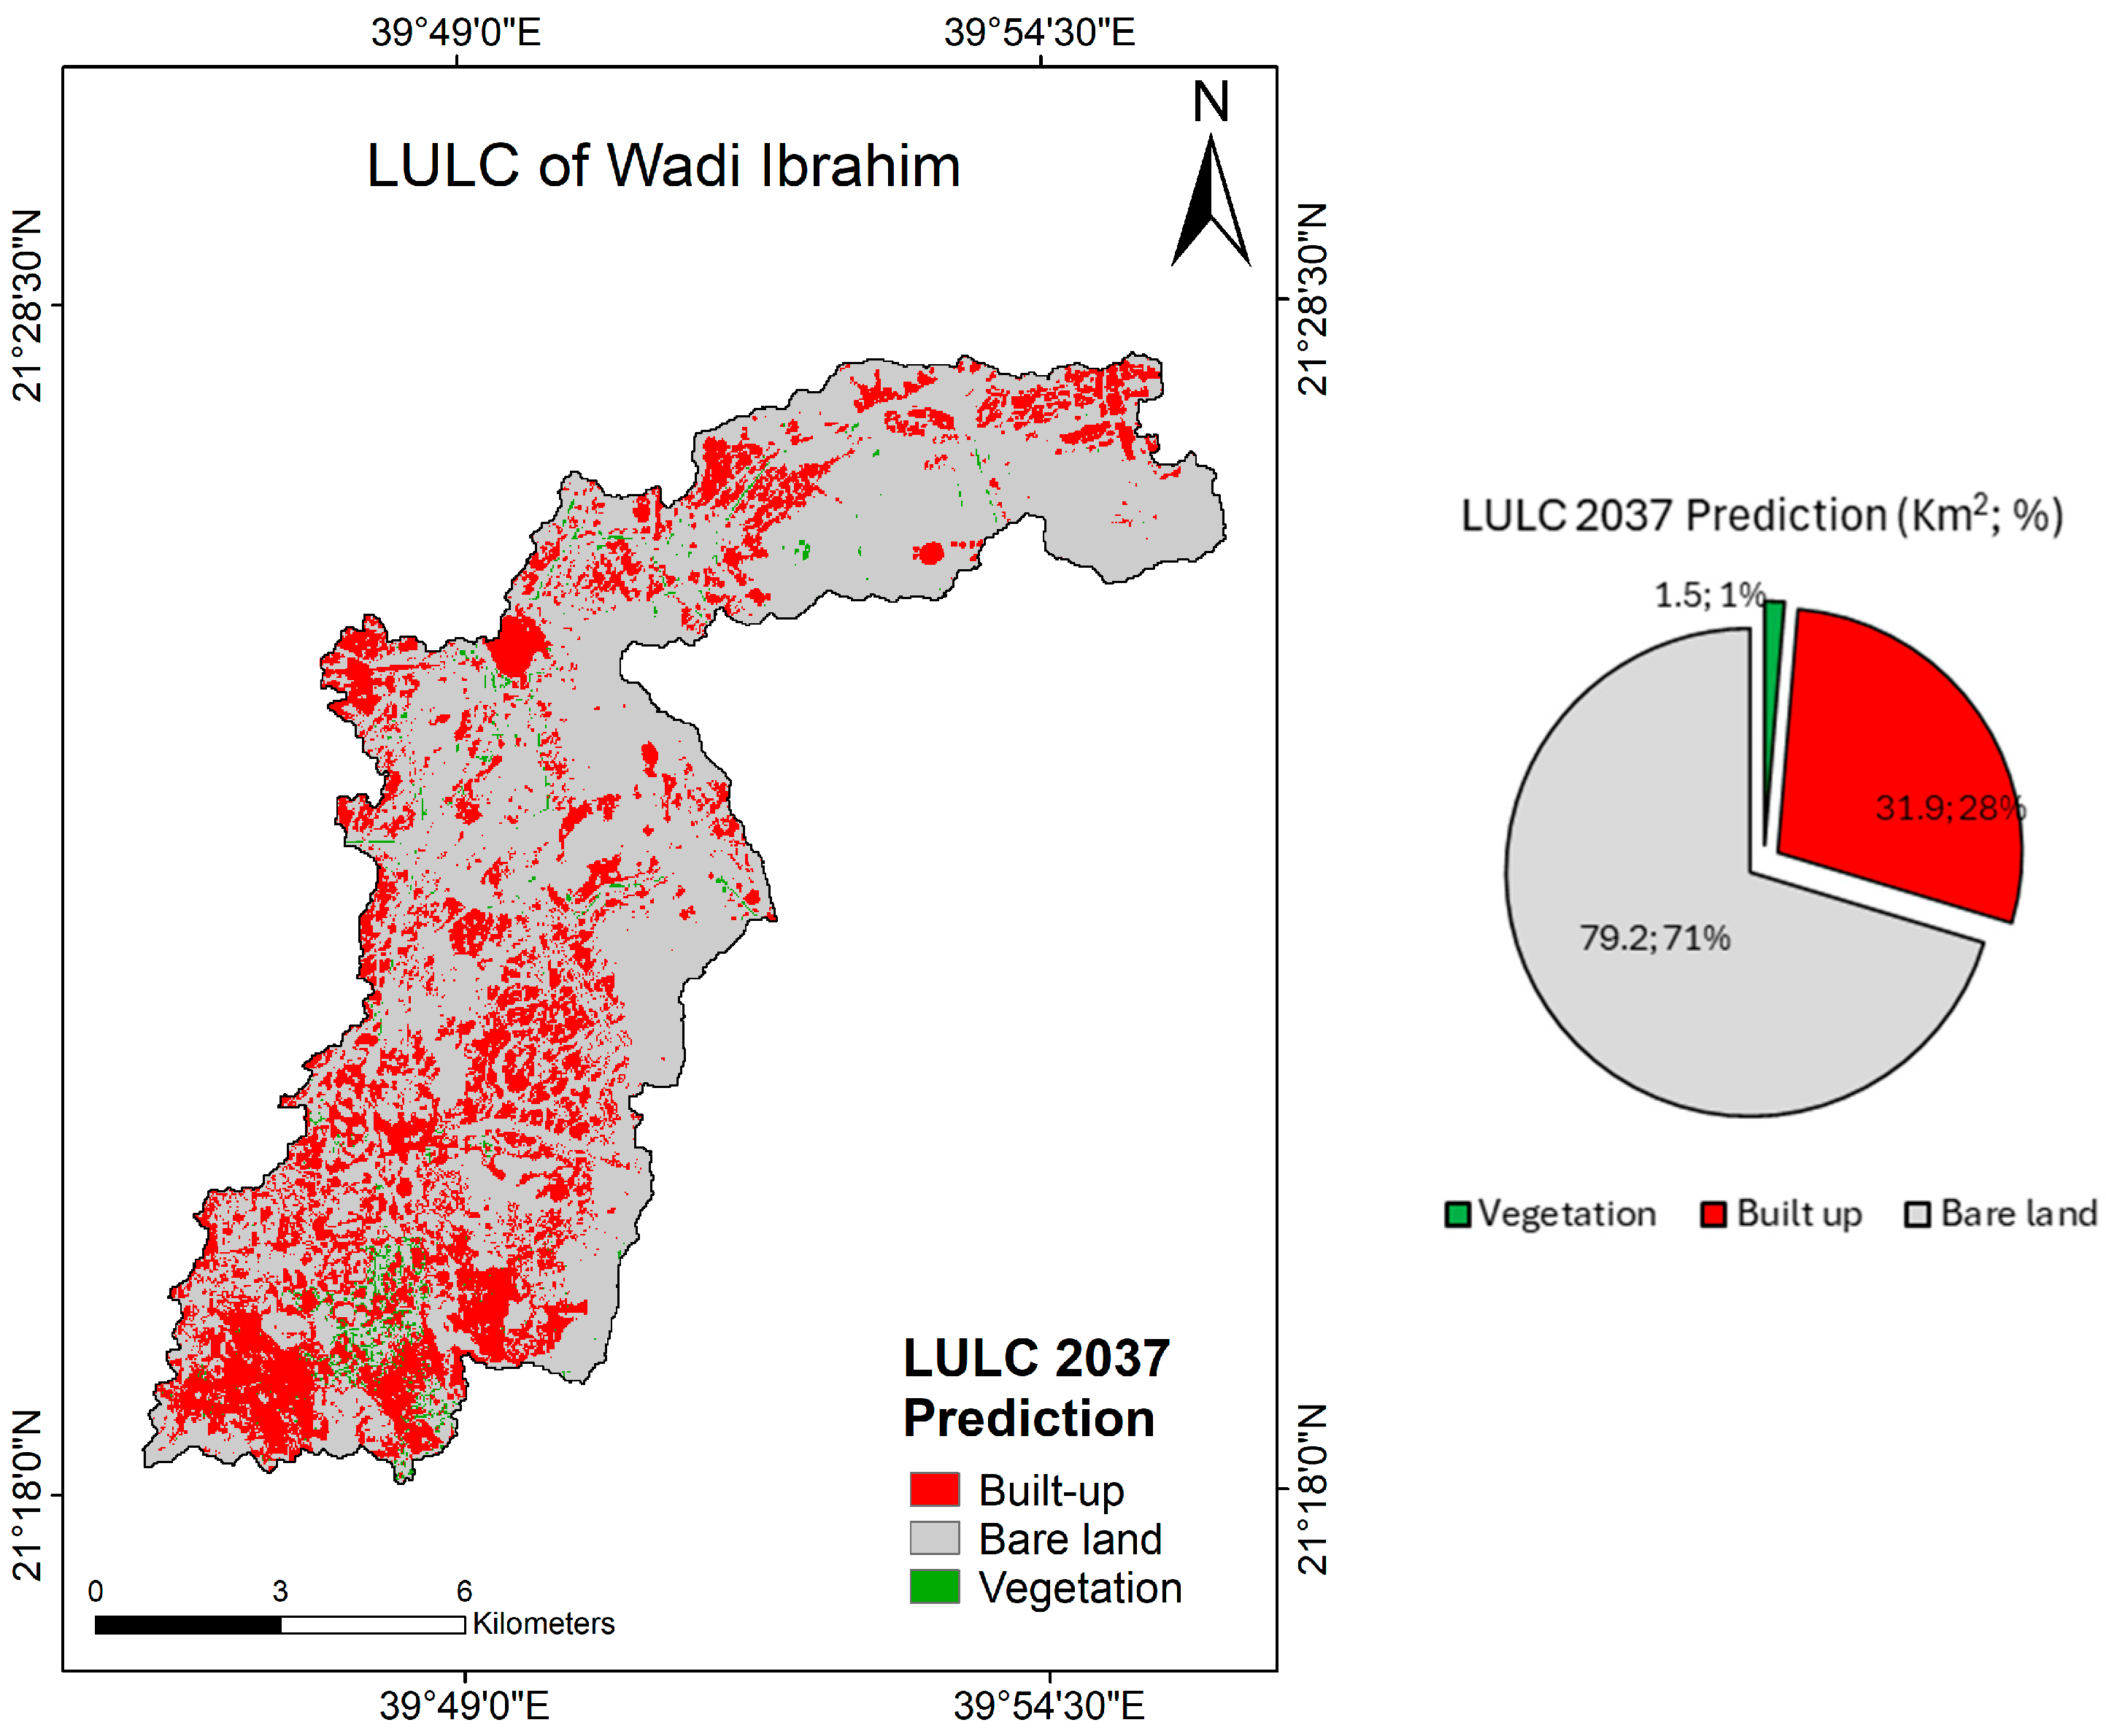
Figure 11 presents the projected LULC scenarios for the Wadi Ibrahim watershed in 2037, which were generated using the MOLUSCE tool. Relative to the reference year 2025, vegetation cover is expected to decline from 2.7 km2 (2%) to 1.5 km2 (1.3%). Built-up areas are projected to expand markedly from 28.7 km2 (26%) to 31.9 km2 (28.3%), underscoring the continued trend of urban expansion in the region. Conversely, bare land is anticipated to decrease from 81.2 km2 (72%) to 79.2 km2 (70.3%), suggesting the progressive conversion of open lands into urban structures. These projections highlight a clear transition from bare land to built-up areas, whereas vegetation coverage remained minimal throughout the period.

4.3. Influence of LULC Change on Flood Potential

The hydrological simulations were conducted using the HEC-HMS model to evaluate the impacts of LULC changes on runoff response under different scenarios. In this study, the outputs are presented as scenario-based simulations to represent potential hydrological responses associated with LULC changes. Accordingly, the results should be interpreted as indicative streamflow responses under the model assumptions, rather than exact measured discharge values.
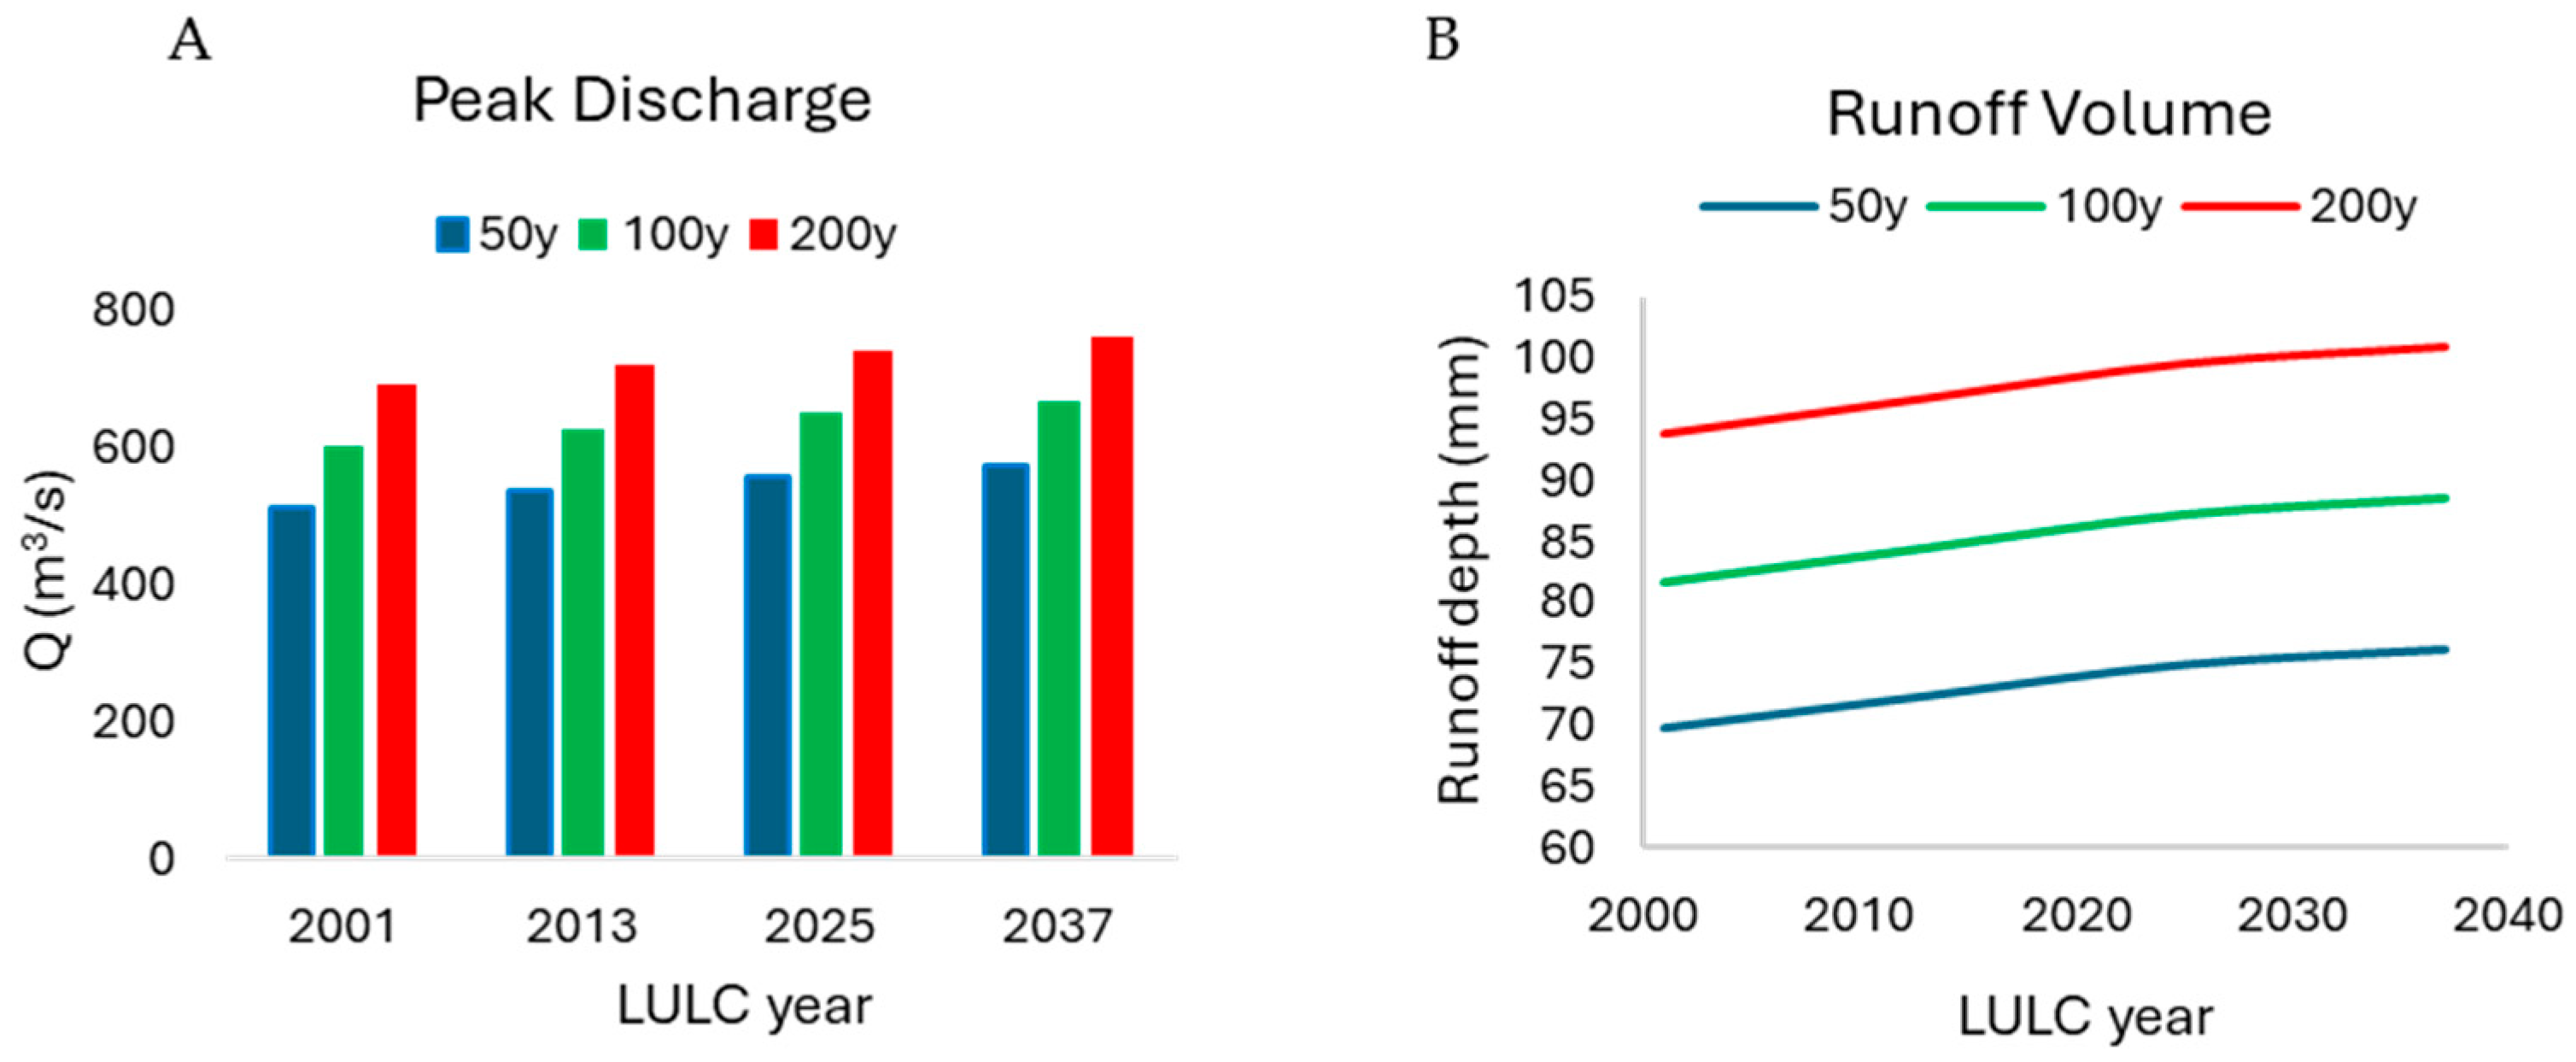
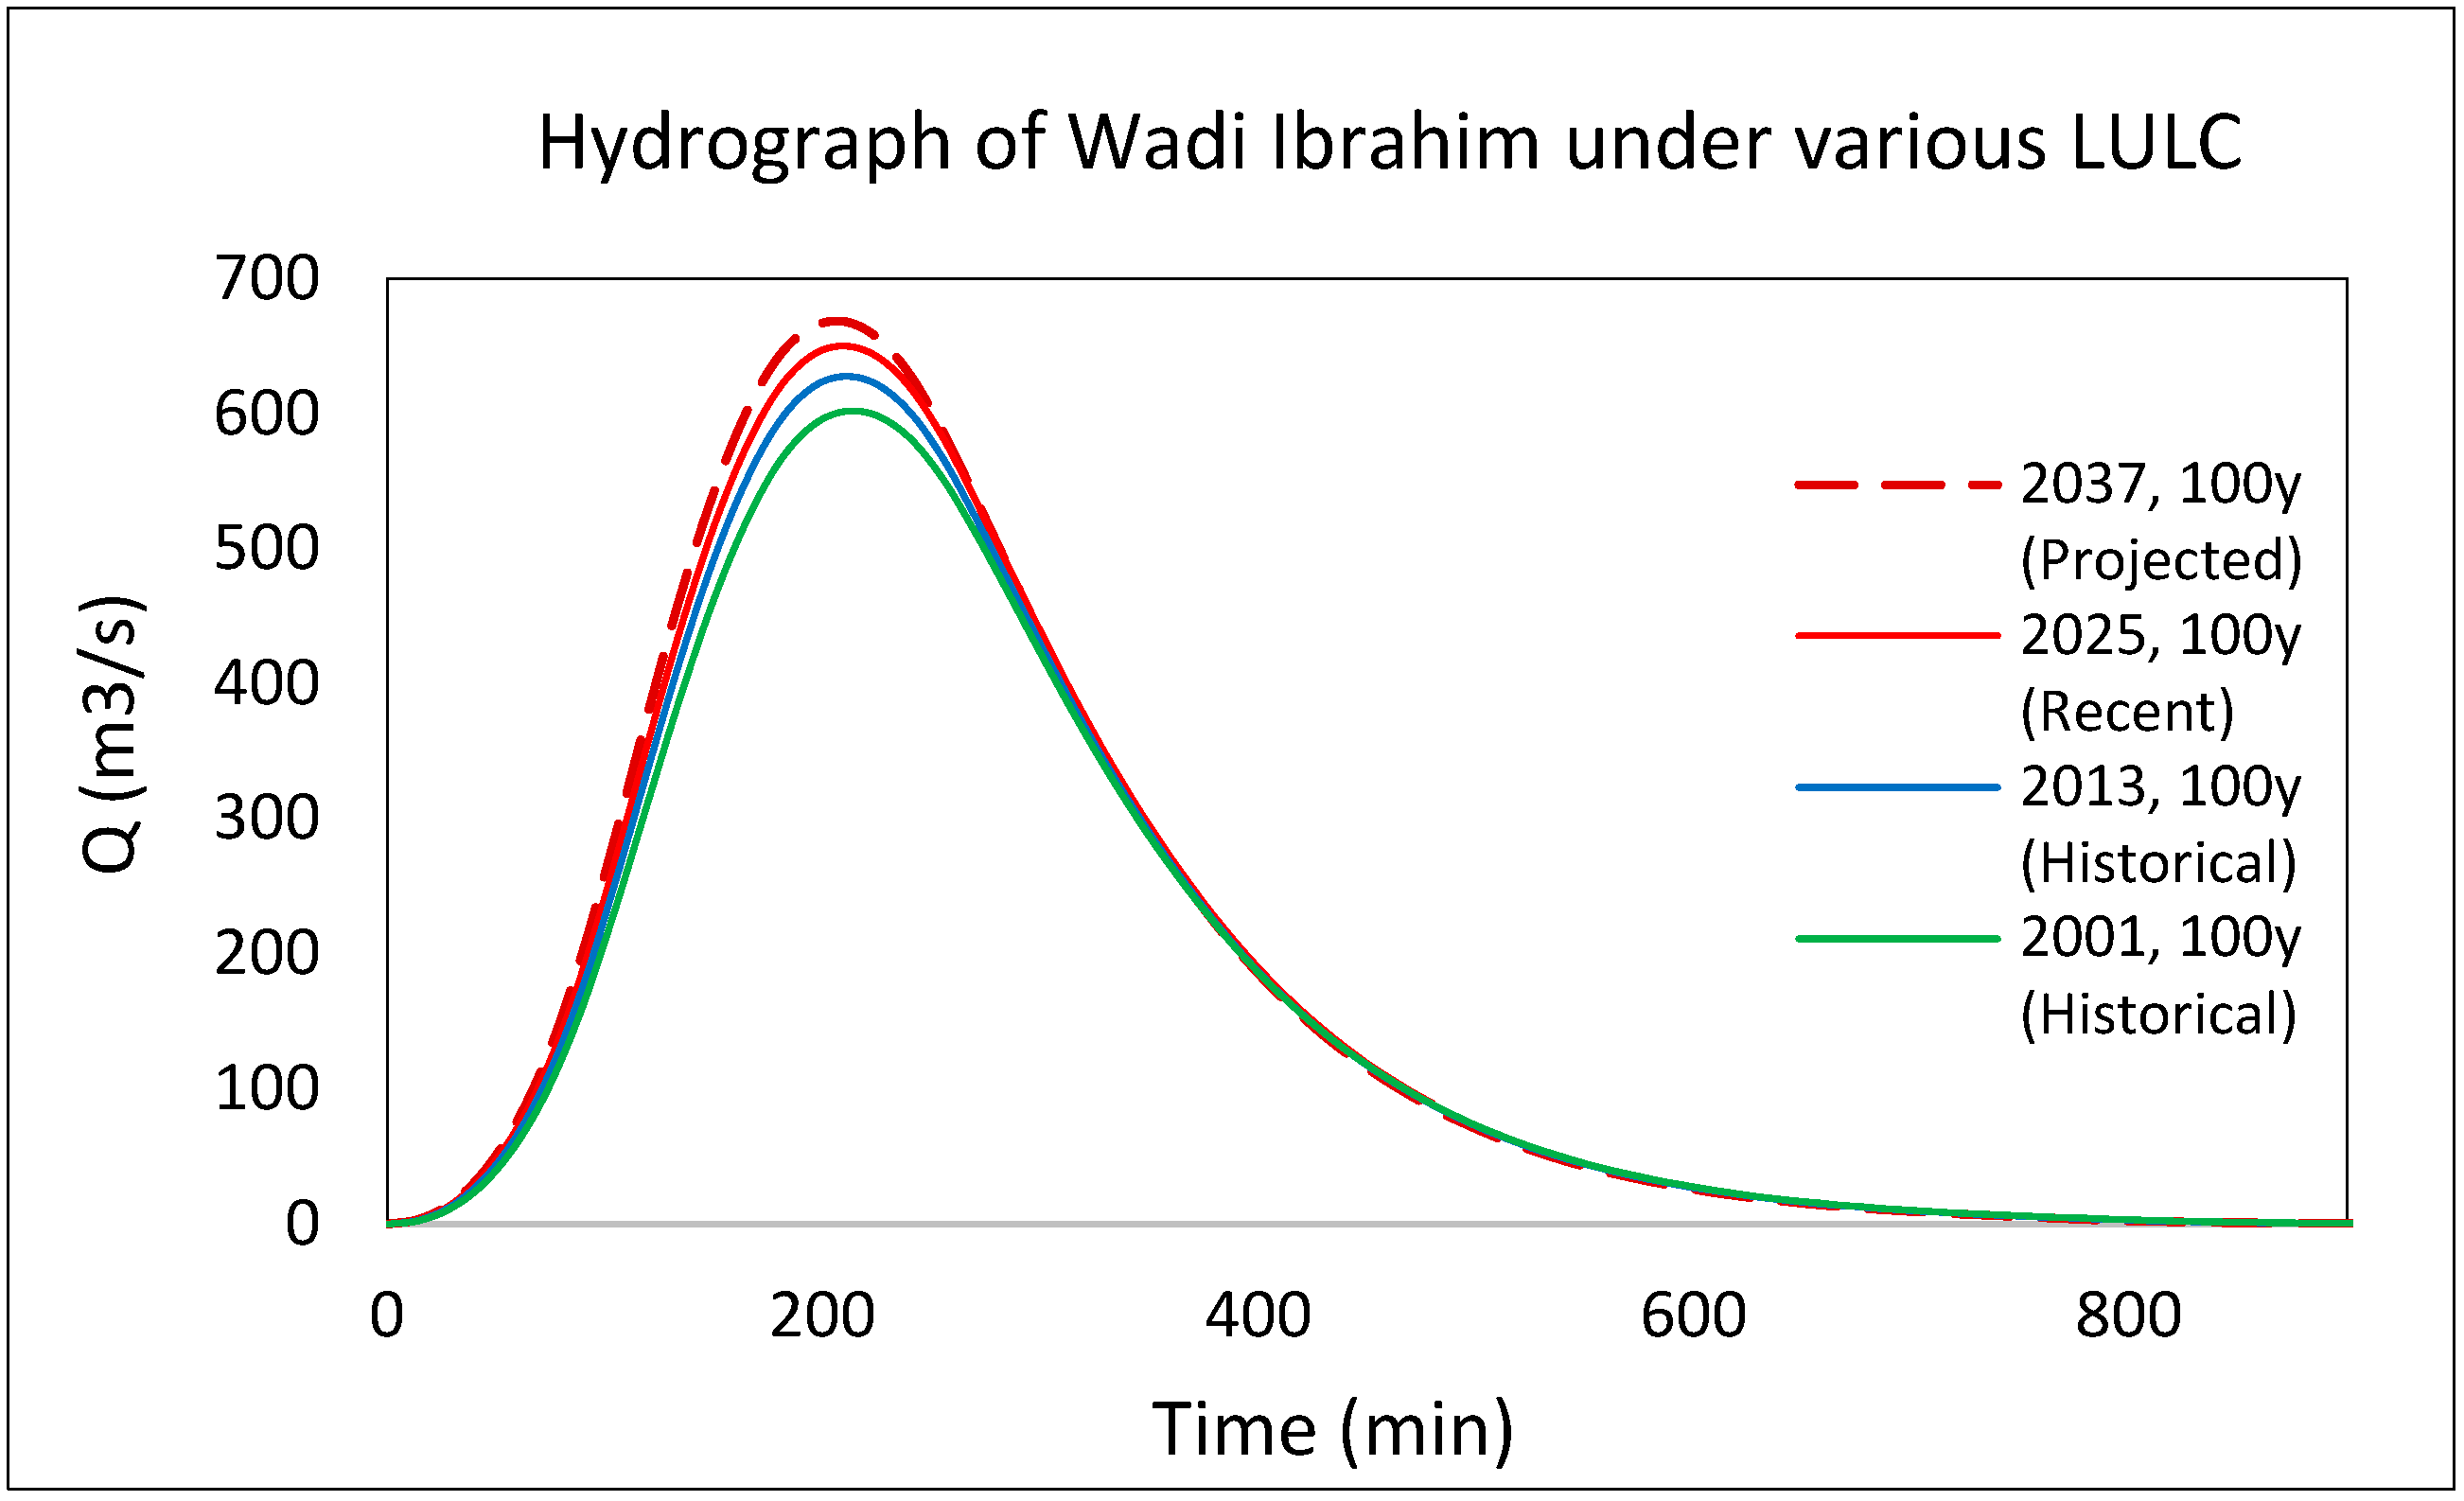
The hydrological analysis results demonstrated the significant impact of LULC changes on hydrological responses over the study period. Specifically, the CN increased steadily from 84.6 in 2001 to a projected 85.5 in 2037, while the percentage of impervious surfaces rose substantially from 11% to 28%, reflecting increasing urbanization and land development. The hydrological parameters changed for all return periods. For example, the Q p for the 100-year return period rose from 601.6 m3/s in 2001 to a projected 668.1 m3/s in 2037 (Figure 12A). Similarly, the runoff volume (V), expressed as equivalent runoff depth, also increased, rising from 81.75 mm in 2001 to 88.6 mm in 2037 (Figure 12B). In contrast, the t p remained constant across all return periods and scenarios, maintaining a stable value of 210 min. The percentage increases in Q p , ranging from 4% to 12%, and V up to 9%, highlight the escalating flood hazard associated with ongoing land transformation. The reduced and stabilized time to peak further indicates a faster hydrological response that requires updated flood management strategies. A summary of these findings is presented in Table 10.
The hydrograph of the Wadi Ibrahim watershed clearly shows that increasing urbanization from 2001 to the projected 2037 significantly alters runoff patterns. For example, under 100 years return period (Figure 13), larger impervious surface areas reduced infiltration, resulting in elevated and sharper peak flows, particularly during extreme events such as the 200-year return period. This accelerated increase in flood hazard is produced by faster and larger Q p compared to historical conditions.

5. Discussions

5.1. Global Patterns, Drivers, and Flood Hazard Implications of LULC Changes

Globally, LULC changes consistently show increasing urban areas at the expense of agriculture, vegetation, and semi-natural lands. In Wuhan, China, built-up land increased by 228% increase in built-up land (2000 to 2019), mainly by converting cropland and habitats [51], while Dongying, China, recorded a 347% increase (1995 to 2015) by replacing grassland and farmland [52], both reflecting China’s rapid industrialization. Urban growth is even sharper in South Asia. Chittagong, Bangladesh, marked the highest relative expansion (+618% in 36 years), largely affecting hills and open land [53], while Delhi, India, showed +326% (1990–2018), mostly at the cost of agriculture and vegetation [54]. Hyderabad, Pakistan, also expanded +34% (1979–2020), replacing croplands and vegetation, highlighting regional urban sprawl and development pressure [55].
In contrast, European cities expanded modestly. Lisbon, Portugal, grew by 17% (1990–2007), mainly at the expense of farmland [56], while Poland recorded only 0.76% (2006–2012), reflecting stronger land regulations and slower demographic growth [57]. Projections for Mumbai indicate a 14% rise by 2050 [58], threatening agriculture and barren land despite the already extreme population density and flood vulnerability. Table 11 presents evidence from different regions to illustrate the consistent hydrological response to LULC change, particularly the role of urban expansion in intensifying flood hazards. Rather than focusing on specific numerical values, the table highlights a general and widely observed pattern in which increasing impervious surfaces and decreasing natural land cover systematically enhance surface runoff generation and flood susceptibility.
Across diverse climatic and geographical settings, the literature consistently demonstrates that urban growth alters natural hydrological processes by reducing infiltration capacity and accelerating runoff concentration. In contrast, the presence or increase in vegetation cover is generally associated with attenuated flood responses due to improved infiltration and increased surface roughness. This consistency across studies indicates that the hydrological impact of LULC change is largely governed by fundamental process controls rather than regional specificity alone.
In the Wadi Ibrahim watershed, the simulated results follow the same hydrological behavior, where urban expansion leads to a noticeable increase in flood magnitude and spatial extent. This is further supported by the hydrological response observed in this study, where a marginal increase in CN from 84.6 to 85.5 results in a substantial increase in Qp from 512.8 m3/s to 575.2 m3/s (+12%). This behavior can be explained by the non-linear formulation of the SCS-CN method (Equation (3)), where CN is inversely related to potential retention, and small increases in CN lead to a reduction in storage capacity. Due to the quadratic structure of the runoff generation process, this effect is amplified particularly under extreme rainfall conditions where infiltration capacity is rapidly exceeded. As a result, even minor changes in land surface conditions can significantly increase runoff generation and Qp.
This suggests that even in arid environments, the conversion of bare land to impervious surfaces can significantly modify runoff generation processes and amplify flood hazard.

5.2. Model Limitations and Uncertainty

This study is subject to several limitations related to data availability and model assumptions. First, the use of 30 m resolution of Landsat imagery may introduce classification uncertainty, particularly when distinguishing spectrally similar classes such as bare land and built-up areas. The LULC classification was limited to three classes due to the arid characteristics of the study area, where there are no water bodies, and agricultural land is minimal. Therefore, all green covers were generalized as vegetation. While this simplification is appropriate for the regional context, it may not capture smaller variations in land cover. Furthermore, although the classification approach demonstrates high accuracy across all periods, its validation was limited to a single study area and dataset. The robustness of the method under different geographic regions, datasets, and classification schemes has not been fully evaluated. This limitation should be considered when interpreting the transferability of the results. Future work should therefore focus on testing the approach under diverse spatial and environmental conditions to further assess its generalizability.
Second, uncertainties in CA–ANN projections are associated with model structure and input data. The CA–ANN model depends on the quality of training samples, selection of driving factors, transition rules, and neighborhood configuration. In rapidly urbanizing arid environments, LULC change is influenced not only by biophysical factors but also by socio-economic and policy drivers that are not explicitly represented in the model. These limitations may affect the accuracy of spatial transition probabilities and future LULC projections. The resulting model performance, indicated by a Kappa coefficient of 0.54, reflects moderate agreement and highlights this uncertainty.
Third, uncertainties in hydrological modeling are mainly related to the absence of observed discharge data, which prevented calibration and validation of the HEC-HMS model. As a result, model parameters were adopted from the literature and default or regional estimates, introducing parameter uncertainty in the runoff simulation. Additional uncertainty arises from the coupling between projected LULC scenarios and hydrological response, as this approach simplifies complex watershed processes and feedback mechanisms.
The integration of LULC change and hydrological modeling introduces compounded uncertainty. Therefore, the estimated changes in peak discharge (approximately ~12% increase in Qp) should be interpreted as indicative trends rather than precise predictions. Despite these limitations, the results remain consistent with established hydrological understanding that urban expansion reduces infiltration capacity, increases surface runoff, and intensifies flood hazard.

6. Conclusions

This study comprehensively assessed flood hazard in the Wadi Ibrahim watershed under historical, current, and projected LULC scenarios. The findings highlight the major impact of urban expansion and impervious surface growth on watershed hydrology and flood dynamics. The key findings are as follows:
  • Built-up areas in the Wadi Ibrahim watershed increase from 12 km2 (11%) in 2001 to 28.7 km2 (26%) in 2025, and are projected to reach 31.9 km2 (28.3%) by 2037. At the same time, bare land decreased from 99.1 km2 (88%) to 79.2 km2 (70.3%), while vegetation remained minimal, declining to 1.5 km2 (1.3%) by 2037.
  • Hydrological modeling for 50-, 100-, and 200-year return periods shows a notable increase in flood metrics due to LULC changes, with Qp rising by up to 12% (2001–2037) and V expanding by about 9%.
  • Tlag and tp remained relatively stable, suggesting that the increased flood hazard is primarily due to increased runoff volumes and peak flows rather than changes in storm timing.
  • The LULC maps demonstrated acceptable classification accuracy, with the average Kappa validation (κ) value achieving 0.86, indicating almost perfect agreement and reliable classification performance.
Due to the projected increase in Q p , the study highlights several concrete implications for urban planning by implementing green infrastructure such as retention basins, permeable pavements, and urban green spaces to enhance infiltration and delay runoff; introducing nature-based solutions to restore and preserve vegetation; maintaining open spaces in critical parts of the watershed to reduce runoff velocity and flood volume; and updating land use plans using projected LULC and flood hazard maps to prevent development in highly vulnerable zones.
Overall, this study supports evidence-based strategies to reduce flood vulnerability in rapidly urbanizing arid regions. The contribution of this study lies in linking LULC changes to hydrological response in an arid watershed, using a combination of RF classification and CA–ANN projection, providing a framework applicable to other data-limited regions.

Author Contributions

Conceptualization, A.H., J.B. and M.E.; Methodology, A.H. and A.E.; Validation, F.A. (Fahad Alzahrani) and F.A. (Fahad Alamoudi); Formal analysis, A.H., J.B. and M.E.; Resources, F.A. (Fahad Alzahrani) and F.A. (Fahad Alamoudi); Writing—original draft preparation, A.H., J.B. and M.E.; Writing—review and editing, A.H., J.B., A.E. and M.E. All authors have read and agreed to the published version of the manuscript.

Funding

This project was funded by the Deanship of Scientific Research (DSR) at King Abdulaziz University, Jeddah, under grant no. IPP: 121-155-2025. Therefore, the authors gratefully acknowledge the DSR for the technical and financial support.

Data Availability Statement

Data available on request.

Conflicts of Interest

The authors declare no conflicts of interest.

References

  1. Francesch-Huidobro, M.; Dabrowski, M.; Tai, Y.; Chan, F.; Stead, D. Governance challenges of flood-prone delta cities: Integrating flood risk management and climate change in spatial planning. Prog. Plan. 2017, 114, 1–27. [Google Scholar] [CrossRef] [Scilit]
  2. Dawod, G.M.; Mirza, M.N.; Al-Ghamdi, K.A. GIS-based estimation of flood hazard impacts on road network in Makkah city, Saudi Arabia. Environ. Earth Sci. 2012, 67, 2205–2215. [Google Scholar] [CrossRef] [Scilit]
  3. United Nations Office for Disaster Risk Reduction (UNISDR). The Human Cost of Weather Related Disasters: 1995–2015; United Nations Office for Disaster Risk Reduction: Geneva, Switzerland, 2015. [Google Scholar]
  4. Güneralp, B.; Seto, K. Futures of global urban expansion: Uncertainties and implications for biodiversity conservation. Environ. Res. Lett. 2013, 8, 014025. [Google Scholar] [CrossRef] [Scilit]
  5. Suriya, S.; Mudgal, B. Impact of urbanization on flooding: The Thirusoolam sub watershed–A case study. J. Hydrol. 2012, 412, 210–219. [Google Scholar] [CrossRef] [Scilit]
  6. Chang, H.; Franczyk, J. Climate change, land-use change, and floods: Toward an integrated assessment. Geogr. Compass 2008, 2, 1549–1579. [Google Scholar] [CrossRef] [Scilit]
  7. Zope, P.; Eldho, T.; Jothiprakash, V. Impacts of land use–land cover change and urbanization on flooding: A case study of Oshiwara River Basin in Mumbai, India. Catena 2016, 145, 142–154. [Google Scholar] [CrossRef] [Scilit]
  8. Adnan, M.S.G.; Abdullah, A.Y.M.; Dewan, A.; Hall, J.W. The effects of changing land use and flood hazard on poverty in coastal Bangladesh. Land Use Policy 2020, 99, 104868. [Google Scholar] [CrossRef] [Scilit]
  9. Hussein, K.; Alkaabi, K.; Ghebreyesus, D.; Liaqat, M.U.; Sharif, H. Land use/land cover change along the Eastern Coast of the UAE and its impact on flooding risk. Geomat. Nat. Hazards Risk 2020, 11, 112–130. [Google Scholar] [CrossRef] [Scilit]
  10. Kayitesi, N.; Guzha, A.; Mariéthoz, G. Impacts of Land use Land Cover Change and Climate Change on River Hydro-morphology—A review of research studies in tropical regions. J. Hydrol. 2022, 615, 128702. [Google Scholar] [CrossRef] [Scilit]
  11. Hidayatulloh, A.; Bahrawi, J.; Psilovikos, A.; Elhag, M. Integrating MCDA and Rain-on-Grid Modeling for Flood Hazard Mapping in Bahrah City, Saudi Arabia. Geosciences 2026, 16, 32. [Google Scholar] [CrossRef] [Scilit]
  12. Idowu, D.; Zhou, W. Land Use and Land Cover Change Assessment in the Context of Flood Hazard in Lagos State, Nigeria. Water 2021, 13, 1105. [Google Scholar] [CrossRef] [Scilit]
  13. UN-Habitat. Makkah City Profile. 2020. Available online: https://unhabitat.org/sites/default/files/2020/03/makkah.pdf (accessed on 2 July 2024).
  14. Horton, R.; Ankeny, M.; Allmaras, R. Effects of compaction on soil hydraulic properties. Dev. Agric. Eng. 1994, 11, 141–165. [Google Scholar]
  15. Dams, J.; Dujardin, J.; Reggers, R.; Bashir, I.; Canters, F.; Batelaan, O. Mapping impervious surface change from remote sensing for hydrological modeling. J. Hydrol. 2013, 485, 84–95. [Google Scholar] [CrossRef] [Scilit]
  16. Alqurashi, A.; Kumar, L. Land Use and Land Cover Change Detection in the Saudi Arabian Desert Cities of Makkah and Al-Taif Using Satellite Data. Adv. Remote Sens. 2014, 3, 106–119. [Google Scholar] [CrossRef]
  17. Helal, M.M.; Eldamaty, T.A. Urban development analysis using GIS and remote sensing. The case study of Makkah City. Eng. Technol. Appl. Sci. Res. 2024, 14, 13864–13869. [Google Scholar] [CrossRef] [Scilit]
  18. Alqurashi, A.F.; Kumar, L. An assessment of the impact of urbanization and land use changes in the fast-growing cities of Saudi Arabia. Geocarto Int. 2019, 34, 78–97. [Google Scholar] [CrossRef] [Scilit]
  19. Elhag, M.; Chaabani, A.; Zhang, L. Assessment of surface deformation patterns using InSAR data: Implications for human impacts in Makkah City, Saudi Arabia. Kuwait J. Sci. 2025, 52, 100419. [Google Scholar] [CrossRef] [Scilit]
  20. Girma, R.; Fürst, C.; Moges, A. Land use land cover change modeling by integrating artificial neural network with cellular Automata-Markov chain model in Gidabo river basin, main Ethiopian rift. Environ. Chall. 2022, 6, 100419. [Google Scholar] [CrossRef] [Scilit]
  21. Gupta, R.; Sharma, L.K. Efficacy of Spatial Land Change Modeler as a forecasting indicator for anthropogenic change dynamics over five decades: A case study of Shoolpaneshwar Wildlife Sanctuary, Gujarat, India. Ecol. Indic. 2020, 112, 106171. [Google Scholar] [CrossRef] [Scilit]
  22. Getachew, D.; Kaur, R. Modeling Land-Use/Land-Cover Change, Using Multi-Layer Perceptron and Markov Chain Analysis: A Study on Bahir Dar City, Ethiopia. In Re-Envisioning Remote Sensing Applications; CRC Press: Boca Raton, FL, USA, 2021; pp. 241–260. [Google Scholar]
  23. Chen, Z.; Huang, M.; Zhu, D.; Altan, O. Integrating remote sensing and a markov-FLUS model to simulate future land use changes in Hokkaido, Japan. Remote Sens. 2021, 13, 2621. [Google Scholar] [CrossRef] [Scilit]
  24. Rahman, M.T.U.; Tabassum, F.; Rasheduzzaman, M.; Saba, H.; Sarkar, L.; Ferdous, J.; Uddin, S.Z.; Zahedul Islam, A. Temporal dynamics of land use/land cover change and its prediction using CA-ANN model for southwestern coastal Bangladesh. Environ. Monit. Assess. 2017, 189, 565. [Google Scholar] [CrossRef] [Scilit]
  25. Muhammad, R.; Zhang, W.; Abbas, Z.; Guo, F.; Gwiazdzinski, L. Spatiotemporal change analysis and prediction of future land use and land cover changes using QGIS MOLUSCE plugin and remote sensing big data: A case study of Linyi, China. Land. 2022, 11, 419. [Google Scholar] [CrossRef] [Scilit]
  26. Baig, M.F.; Mustafa, M.R.U.; Baig, I.; Takaijudin, H.B.; Zeshan, M.T. Assessment of land use land cover changes and future predictions using CA-ANN simulation for Selangor, Malaysia. Water 2022, 14, 402. [Google Scholar] [CrossRef] [Scilit]
  27. El-Tantawi, A.M.; Bao, A.; Chang, C.; Liu, Y. Monitoring and predicting land use/cover changes in the Aksu-Tarim River Basin, Xinjiang-China (1990–2030). Environ. Monit. Assess. 2019, 191, 480. [Google Scholar] [CrossRef] [Scilit]
  28. Pijanowski, B.C.; Brown, D.G.; Shellito, B.A.; Manik, G.A. Using neural networks and GIS to forecast land use changes: A land transformation model. Comput. Environ. Urban Syst. 2002, 26, 553–575. [Google Scholar] [CrossRef] [Scilit]
  29. Kamaraj, M.; Rangarajan, S. Predicting the future land use and land cover changes for Bhavani basin, Tamil Nadu, India, using QGIS MOLUSCE plugin. Environ. Sci. Pollut. Res. 2022, 29, 86337–86348. [Google Scholar] [CrossRef] [Scilit] [PubMed]
  30. Lukas, P.; Melesse, A.M.; Kenea, T.T. Prediction of future land use/land cover changes using a coupled CA-ANN model in the upper omo–gibe river basin, Ethiopia. Remote Sens. 2023, 15, 1148. [Google Scholar] [CrossRef] [Scilit]
  31. Ahmad, M.N.; Shao, Z.; Javed, A. Modelling land use/land cover (LULC) change dynamics, future prospects, and its environmental impacts based on geospatial data models and remote sensing data. Environ. Sci. Pollut. Res. 2023, 30, 32985–33001. [Google Scholar] [CrossRef] [Scilit]
  32. El Bastawesy, M.; Al Harbi, K.; Habeebullah, T. The hydrology of Wadi Ibrahim Catchment in Makkah City, the Kingdom of Saudi Arabia: The interplay of urban development and flash flood hazards. Life Sci. J. 2012, 9, 580–589. [Google Scholar]
  33. Hidayatulloh, A.; Chaabani, A.; Zhang, L.; Elhag, M. DEM study on hydrological response in Makkah City, Saudi Arabia. Sustainability 2022, 14, 13369. [Google Scholar] [CrossRef] [Scilit]
  34. Yousef, B. The climate of Mecca area. J. Umm Al-Qura Soc. Sci. 1992, 15, 1–94. [Google Scholar]
  35. Subyani, A.M. Hydrologic behavior and flood probability for selected arid basins in Makkah area, western Saudi Arabia. Arab. J. Geosci. 2011, 4, 817–824. [Google Scholar] [CrossRef] [Scilit]
  36. Ross, C.; Prihodko, L.; Anchang, J.; Kumar, S.; Ji, W.; Hanan, N. Global Hydrologic Soil Groups (HYSOGs250m) for Curve Number-Based Runoff Modeling; ORNL DAAC: Oak Ridge, TN, USA, 2018. [Google Scholar]
  37. Bahrawi, J.; Ewea, H.; Kamis, A.; Elhag, M. Potential flood risk due to urbanization expansion in arid environments, Saudi Arabia. Nat. Hazards 2020, 104, 795–809. [Google Scholar] [CrossRef] [Scilit]
  38. USDA Soil Conservation Service. Technical Release 55: Urban Hydrology for Small Watersheds; US Department of Agriculture, Soil Conservation Services: Washington, DC, USA, 1986. [Google Scholar]
  39. U.S. Department of Agriculture. National Engineering Handbook, Section 4: Hydrology; U.S. Department of Agriculture: Washington, DC, USA, 1972; Volume 127. [Google Scholar]
  40. Adem, E.; Elfeki, A.; Chaabani, A.; Alwegdani, A.; Hussain, S.; Elhag, M. Impact of satellite precipitation estimation methods on the hydrological response: Case study Wadi Nu’man basin, Saudi Arabia. Theor. Appl. Climatol. 2024, 155, 3907–3925. [Google Scholar] [CrossRef] [Scilit]
  41. Breiman, L. Random Forests. Mach. Learn. 2001, 45, 5–32. [Google Scholar] [CrossRef] [Scilit]
  42. Salman, H.A.; Kalakech, A.; Steiti, A. Random Forest Algorithm Overview. Babylon. J. Mach. Learn. 2024, 2024, 69–79. [Google Scholar] [CrossRef] [Scilit]
  43. Biau, G.; Scornet, E. A random forest guided tour. TEST 2015, 25, 197–227. [Google Scholar] [CrossRef] [Scilit]
  44. NEXTGIS. Modules for Land Use Change Evaluation; Quick Help. 2025. Available online: https://docs.nextgis.com/docs_ngqgis/source/molusce.html (accessed on 15 January 2025).
  45. Story, M.; Congalton, R.G. Accuracy assessment: A user’s perspective. Photogramm. Eng. Remote Sens. 1986, 52, 397–399. [Google Scholar]
  46. Landis, J.R.; Koch, G.G. The measurement of observer agreement for categorical data. Biometrics 1977, 33, 159–174. [Google Scholar] [CrossRef] [Scilit]
  47. Kite, G.W. Frequency and Risk Analyses in Hydrology; Water Resources Publications: Denver, CO, USA, 1977; Volume 224. [Google Scholar]
  48. Elfeki, A.M.; Ewea, H.A.; Al-Amri, N.S. Development of storm hyetographs for flood forecasting in the Kingdom of Saudi Arabia. Arab. J. Geosci. 2014, 7, 4387–4398. [Google Scholar] [CrossRef] [Scilit]
  49. Ponce, V.M.; Hawkins, R.H. Runoff curve number: Has it reached maturity? J. Hydrol. Eng. 1996, 1, 11–19. [Google Scholar] [CrossRef] [Scilit]
  50. USDA. Urban Hydrology for Small Watersheds; Technical Release TR-55; U.S. Department of Agriculture: Washington, DC, USA, 1986; pp. 2–6. [Google Scholar]
  51. Zhai, H.; Lv, C.; Liu, W.; Yang, C.; Fan, D.; Guan, Q. Understanding Spatio-Temporal Patterns of Land Use/Land Cover Change under Urbanization in Wuhan, China, 2000–2019. Remote Sens. 2021, 13, 3331. [Google Scholar] [CrossRef] [Scilit]
  52. Wang, C.; Wang, Y.; Wang, R.; Zheng, P. Modeling and evaluating land-use/land-cover change for urban planning and sustainability: A case study of Dongying city, China. J. Clean. Prod. 2018, 172, 1529–1534. [Google Scholar] [CrossRef] [Scilit]
  53. Hassan, M.; Nazem, M.N.I. Examination of land use/land cover changes, urban growth dynamics, and environmental sustainability in Chittagong city, Bangladesh. Environ. Dev. Sustain. 2016, 18, 697–716. [Google Scholar] [CrossRef] [Scilit]
  54. Naikoo, M.W.; Rihan, M.; Ishtiaque, M. Analyses of land use land cover (LULC) change and built-up expansion in the suburb of a metropolitan city: Spatio-temporal analysis of Delhi NCR using landsat datasets. J. Urban Manag. 2020, 9, 347–359. [Google Scholar] [CrossRef] [Scilit]
  55. Baccari, N.; Hamza, M.H.; Slama, T.; Sebei, A.; Ouerghi, S.; Elsheikh, R.; Rebai, N.; Hasanean, H.; Almazroui, M.; Elhag, M. Assessment of Machine Learning Techniques in Mapping Land Use/Land Cover Changes in a Semi-Arid Environment. Earth Syst. Environ. 2025, 9, 519–539. [Google Scholar] [CrossRef] [Scilit]
  56. Abrantes, P.; Fontes, I.; Gomes, E.; Rocha, J. Compliance of land cover changes with municipal land use planning: Evidence from the Lisbon metropolitan region (1990–2007). Land Use Policy 2016, 51, 120–134. [Google Scholar] [CrossRef] [Scilit]
  57. Wnęk, A.; Kudas, D.; Stych, P. National level land-use changes in functional urban areas in Poland, Slovakia, and Czechia. Land 2021, 10, 39. [Google Scholar] [CrossRef] [Scilit]
  58. Vinayak, B.; Lee, H.S.; Gedem, S. Prediction of Land Use and Land Cover Changes in Mumbai City, India, Using Remote Sensing Data and a Multilayer Perceptron Neural Network-Based Markov Chain Model. Sustainability 2021, 13, 471. [Google Scholar] [CrossRef] [Scilit]
  59. Zope, P.; Eldho, T.; Jothiprakash, V. Hydrological impacts of land use–land cover change and detention basins on urban flood hazard: A case study of Poisar River basin, Mumbai, India. Nat. Hazards 2017, 87, 1267–1283. [Google Scholar] [CrossRef] [Scilit]
  60. Szwagrzyk, M.; Kaim, D.; Price, B.; Wypych, A.; Grabska, E.; Kozak, J. Impact of forecasted land use changes on flood risk in the Polish Carpathians. Nat. Hazards 2018, 94, 227–240. [Google Scholar] [CrossRef] [Scilit]
  61. Gao, Y.; Chen, J.-H.; Luo, H.; Wang, H. Prediction of hydrological responses to land use change. Sci. Total Environ. 2019, 708, 134998. [Google Scholar] [CrossRef] [Scilit]
  62. Gholami, F.; Li, Y.; Zhang, J.; Nemati, A. Quantitative Assessment of Future Environmental Changes in Hydrological Risk Components: Integration of Remote Sensing, Machine Learning, and Hydraulic Modeling. Water 2024, 16, 3354. [Google Scholar] [CrossRef] [Scilit]
  63. Danegulu, A.; Karki, S.; Bhattarai, P.; Pandey, V.P. Characterizing urban flooding in the Kathmandu Valley, Nepal: The influence of urbanization and river encroachment. Nat. Hazards 2024, 120, 10923–10947. [Google Scholar] [CrossRef] [Scilit]
  64. Kabeja, C.; Li, R.; Guo, J.; Rwatangabo, D.E.R.; Manyifika, M.; Gao, Z.; Wang, Y.; Zhang, Y. The Impact of Reforestation Induced Land Cover Change (1990–2017) on Flood Peak Discharge Using HEC-HMS Hydrological Model and Satellite Observations: A Study in Two Mountain Basins, China. Water 2020, 12, 1347. [Google Scholar] [CrossRef] [Scilit]
Figure 1. Wadi Ibrahim watershed in Makkah Al-Mukarramah City, KSA.
Land 15 00742 g001
Figure 2. Flood in Makkah Al-Mukaramah City: (A) 1941, (B) 2010 [35], (C,D) 2021 (Saudi Civil Defense).
Land 15 00742 g002
Figure 3. Elevation (A), slope (B), HSG (C), and CN (D) of the Wadi Ibrahim watershed.
Land 15 00742 g003
Figure 4. The location of six rainfall stations in the Wadi Ibrahim watershed (top) and its rainfall data from 1967 to 2025 (bottom).
Land 15 00742 g004
Figure 5. Reconstructed rainfall dataset for the period 1967–2017, based on the average of overlapping records from six stations for 2017–2024.
Land 15 00742 g005
Figure 6. Random Forest workflow (source: GeeksforGeeks, ‘Random Forest algorithm in machine learning’, https://www.geeksforgeeks.org/machine-learning/random-forest-algorithm-in-machine-learning/ accessed on 12 April 2026).
Land 15 00742 g006
Figure 7. Urbanization changes in Batha Quraish, part of the Wadi Ibrahim watershed (2004, 2013, 2025).
Land 15 00742 g007
Figure 8. ANN learning curve as transitional potential modeling.
Land 15 00742 g008
Figure 9. The flowchart of flood risk assessment under LULC changes.
Land 15 00742 g009
Figure 10. LULC of the Wadi Ibrahim watershed for historical and recent scenarios.
Land 15 00742 g010
Figure 11. Projected LULC scenarios for the Wadi Ibrahim watershed in 2037.
Land 15 00742 g011
Figure 12. Peak discharge (A) and runoff volume are expressed as equivalent runoff depth (B) for different LULC and return periods.
Land 15 00742 g012
Figure 13. Hydrograph of the Wadi Ibrahim watershed under various LULC under 100-year return periods.
Land 15 00742 g013
Table 1. Morphometric parameters of the Wadi Ibrahim watershed.
Basin ParametersIbrahim Watershed
Low Elevation (m)210
High Elevation (m)968
Area (km2)112.6
Perimeter (km)107.2
Longest Flow Path (km)34.6
Basin Length (km)28.6
Table 2. Curve numbers under LULC and HSG.
LULC TypeCN for Different HSG
BCD
Built-up859092
Bare land798689
Vegetation557077
Table 3. Data collection and driving factors for the LULC study.
SatelliteAcquisition Date/YearEllipsoidResolution
Landsat 5 TM2001WGS-8430 m
Landsat 8 OLI2013WGS-8430 m
Landsat 9 OLI2025WGS-8430 m
Google Earth2004–2025WGS-8415 m
Driven forceTypeSources
ElevationStatichttps://opentopography.org/
SlopeStaticDEM
Distance from settlementDynamicGlobal Building Atlas
Distance from roadDynamichttps://download.geofabrik.de/ (accessed on 12 April 2026)
Table 4. Preprocessing steps applied to Landsat imagery prior to LULC classification.
StepProcessDescription
1Path/Row169/45 (Wadi Ibrahim, Makkah City)
2Atmospheric correctionSurface reflectance: LEDAPS (Landsat 5) and LaSRC (Landsat 8/9)
3Cloud maskingQA_PIXEL mask, clouds and shadows removed (~10% pixels)
4Band selectionSix spectral bands: B1–B7
5Image compositingMedian composite per year
6Feature derivationNDVI and NDBI
7Training samplesBuilt-up: 160, Bare land: 160, Vegetation: 130.
8Training/Testing70/30
Table 5. Configuration of the CA–ANN model and Cellular Automata simulation for future LULC prediction in MOLUSCE.
ComponentParameterValue
CA–ANN ModelHidden Layers10
Neighborhood1 px
Iterations1000
Learning Rate0.1
Momentum0.05
Current Validation Kappa0.54
Min Validation Overall Error0.15
Table 6. Average rainfall across the stations for various return periods.
CoordinatesRainfall (mm) at Different Return Periods (Years)
StationsLong (E)Lat (N)50100200
Al Adel39.8521.4484.794.8105.0
Mena39.8721.4377.987.597.0
Al Maesem39.9221.4659.766.573.2
Electricity39.8821.4688.499.4110.4
J11439.8321.4497.2110.6123.9
M13939.8221.4198.6113.6128.4
Average 94.5107.1119.6
Table 8. LULC areas and ARC in the Wadi Ibrahim watershed.
LULC
Categories
200120132025ARC (%)
Area (km2)%Area (km2)%Area (km2)%
Vegetation1.51%1.61%2.72%3.3
Built up12.011%19.818%28.726%5.8
Bare land99.188%91.381%81.272%−0.8
Total112.6100%112.6100%112.6100%
Table 9. Confusion matrix, overall accuracy, and Kappa coefficient for LULC classification (2001, 2013, and 2025).
LULC 2001LULC 2013LULC 2025
Confusion Matrix254322303200
319123300360
031300240128
Overall Accuracy0.750.940.99
Kappa Coefficient0.840.910.98
Table 10. Hydrological parameters and the impact of LULC changes on flood hazard.
ScenariosReturn
Period
Hydrological Parameters
CNImpervious
(%)
Tlag
(min)
Qp (m3/s)tp (min)Runoff Depth
(mm)
% ΔQp% Δtp% ΔV
Historical LULC
(2001)
5084.611153.5512.821069.77
10084.611153.5601.621081.75
20084.6111153.5691.221093.8
Historical LULC
(2013)
5084.918151.9537.321072.45%0%4%
10084.918151.9627.721084.54%0%3%
20084.918151.9718.721096.74%0%3%
Current LULC
2025
5085.026151.4558.921075.09%0%8%
10085.026151.4650.021087.28%0%7%
20085.026151.4742.121099.57%0%6%
Projected LULC
2037
5085.528148.8575.221076.312%0%9%
10085.528148.8668.121088.611%0%8%
20085.528148.8761.5210100.810%0%8%
Table 11. LULC change effects on flood peak and hazard worldwide.
City/RegionLULC Change (Years)Impact on Flood
Mumbai,
India [59]
Built-up 16.6% → 44.1%
(1966–2009)
Peak discharge ↑ 2.6–20.9%; floodplain extent ↑ 14.2–42.5%
Polish Carpathians, Poland [60]Urbanization/forest
(to 2060)
Peak discharge: slight ↓ with forest, monetary flood losses
Qinhuai River,
China [61]
Urban land ↑ 56.8%
(2001–2010)
Flood peak ↑ 3.5% (small floods), up to 8.1% if urban land ↑ 60%
Tajan Watershed,
Iran [62]
Urban/agriculture ↑
(2021–2040)
flood vulnerability areas ↑ 43%; annual flood damage ↑ from $162 M → $376 M
Kathmandu Valley, Nepal [63]Built-up ↑ 113%
(1990–2020)
Inundation depth ↑; river encroachment has an even greater effect
Yanhe & Guangyuan, China [64]Forest ↑ 16–18%, urban
↑ 2–8% (1990–2017)
Flood peak discharge ↓ 6–14% due to reforestation
Wadi Ibrahim, Saudi ArabiaUrban land ↑ Bare land ↓
(2001–2037)
Flood peak discharge ↑ 17%
floodplain extent ↑ 14%
Increase; ↓ Decrease.
Disclaimer/Publisher’s Note: The statements, opinions and data contained in all publications are solely those of the individual author(s) and contributor(s) and not of MDPI and/or the editor(s). MDPI and/or the editor(s) disclaim responsibility for any injury to people or property resulting from any ideas, methods, instructions or products referred to in the content.