High-Vitality Stability Characteristics and Nonlinear Mechanisms of Urban Virtual Vitality: Evidence from Five Urban Districts in Harbin, China

Abstract
1. Introduction
- (1)
- What dynamic change process does virtual vitality present over continuous temporal scales?
- (2)
- Between different temporal stages, what transformation relationships does virtual vitality present in space, and how can high-vitality stable zones and other dynamic zoning be identified?
- (3)
- How do the multidimensional structural characteristics of physical vitality spaces influence the formation of high-vitality stable zones?
- (1)
- Characterizing the dynamic change characteristics of virtual vitality from continuous temporal processes, addressing the limitations of static comparison methods.
- (2)
- Identifying and defining high-vitality stable zones of virtual vitality, extending virtual vitality research from the perspective of spatial transformation.
- (3)
- Revealing the differentiated and nonlinear effects of the multidimensional structural characteristics of physical vitality spaces on the formation of high-vitality stable zones.
2. Research Materials
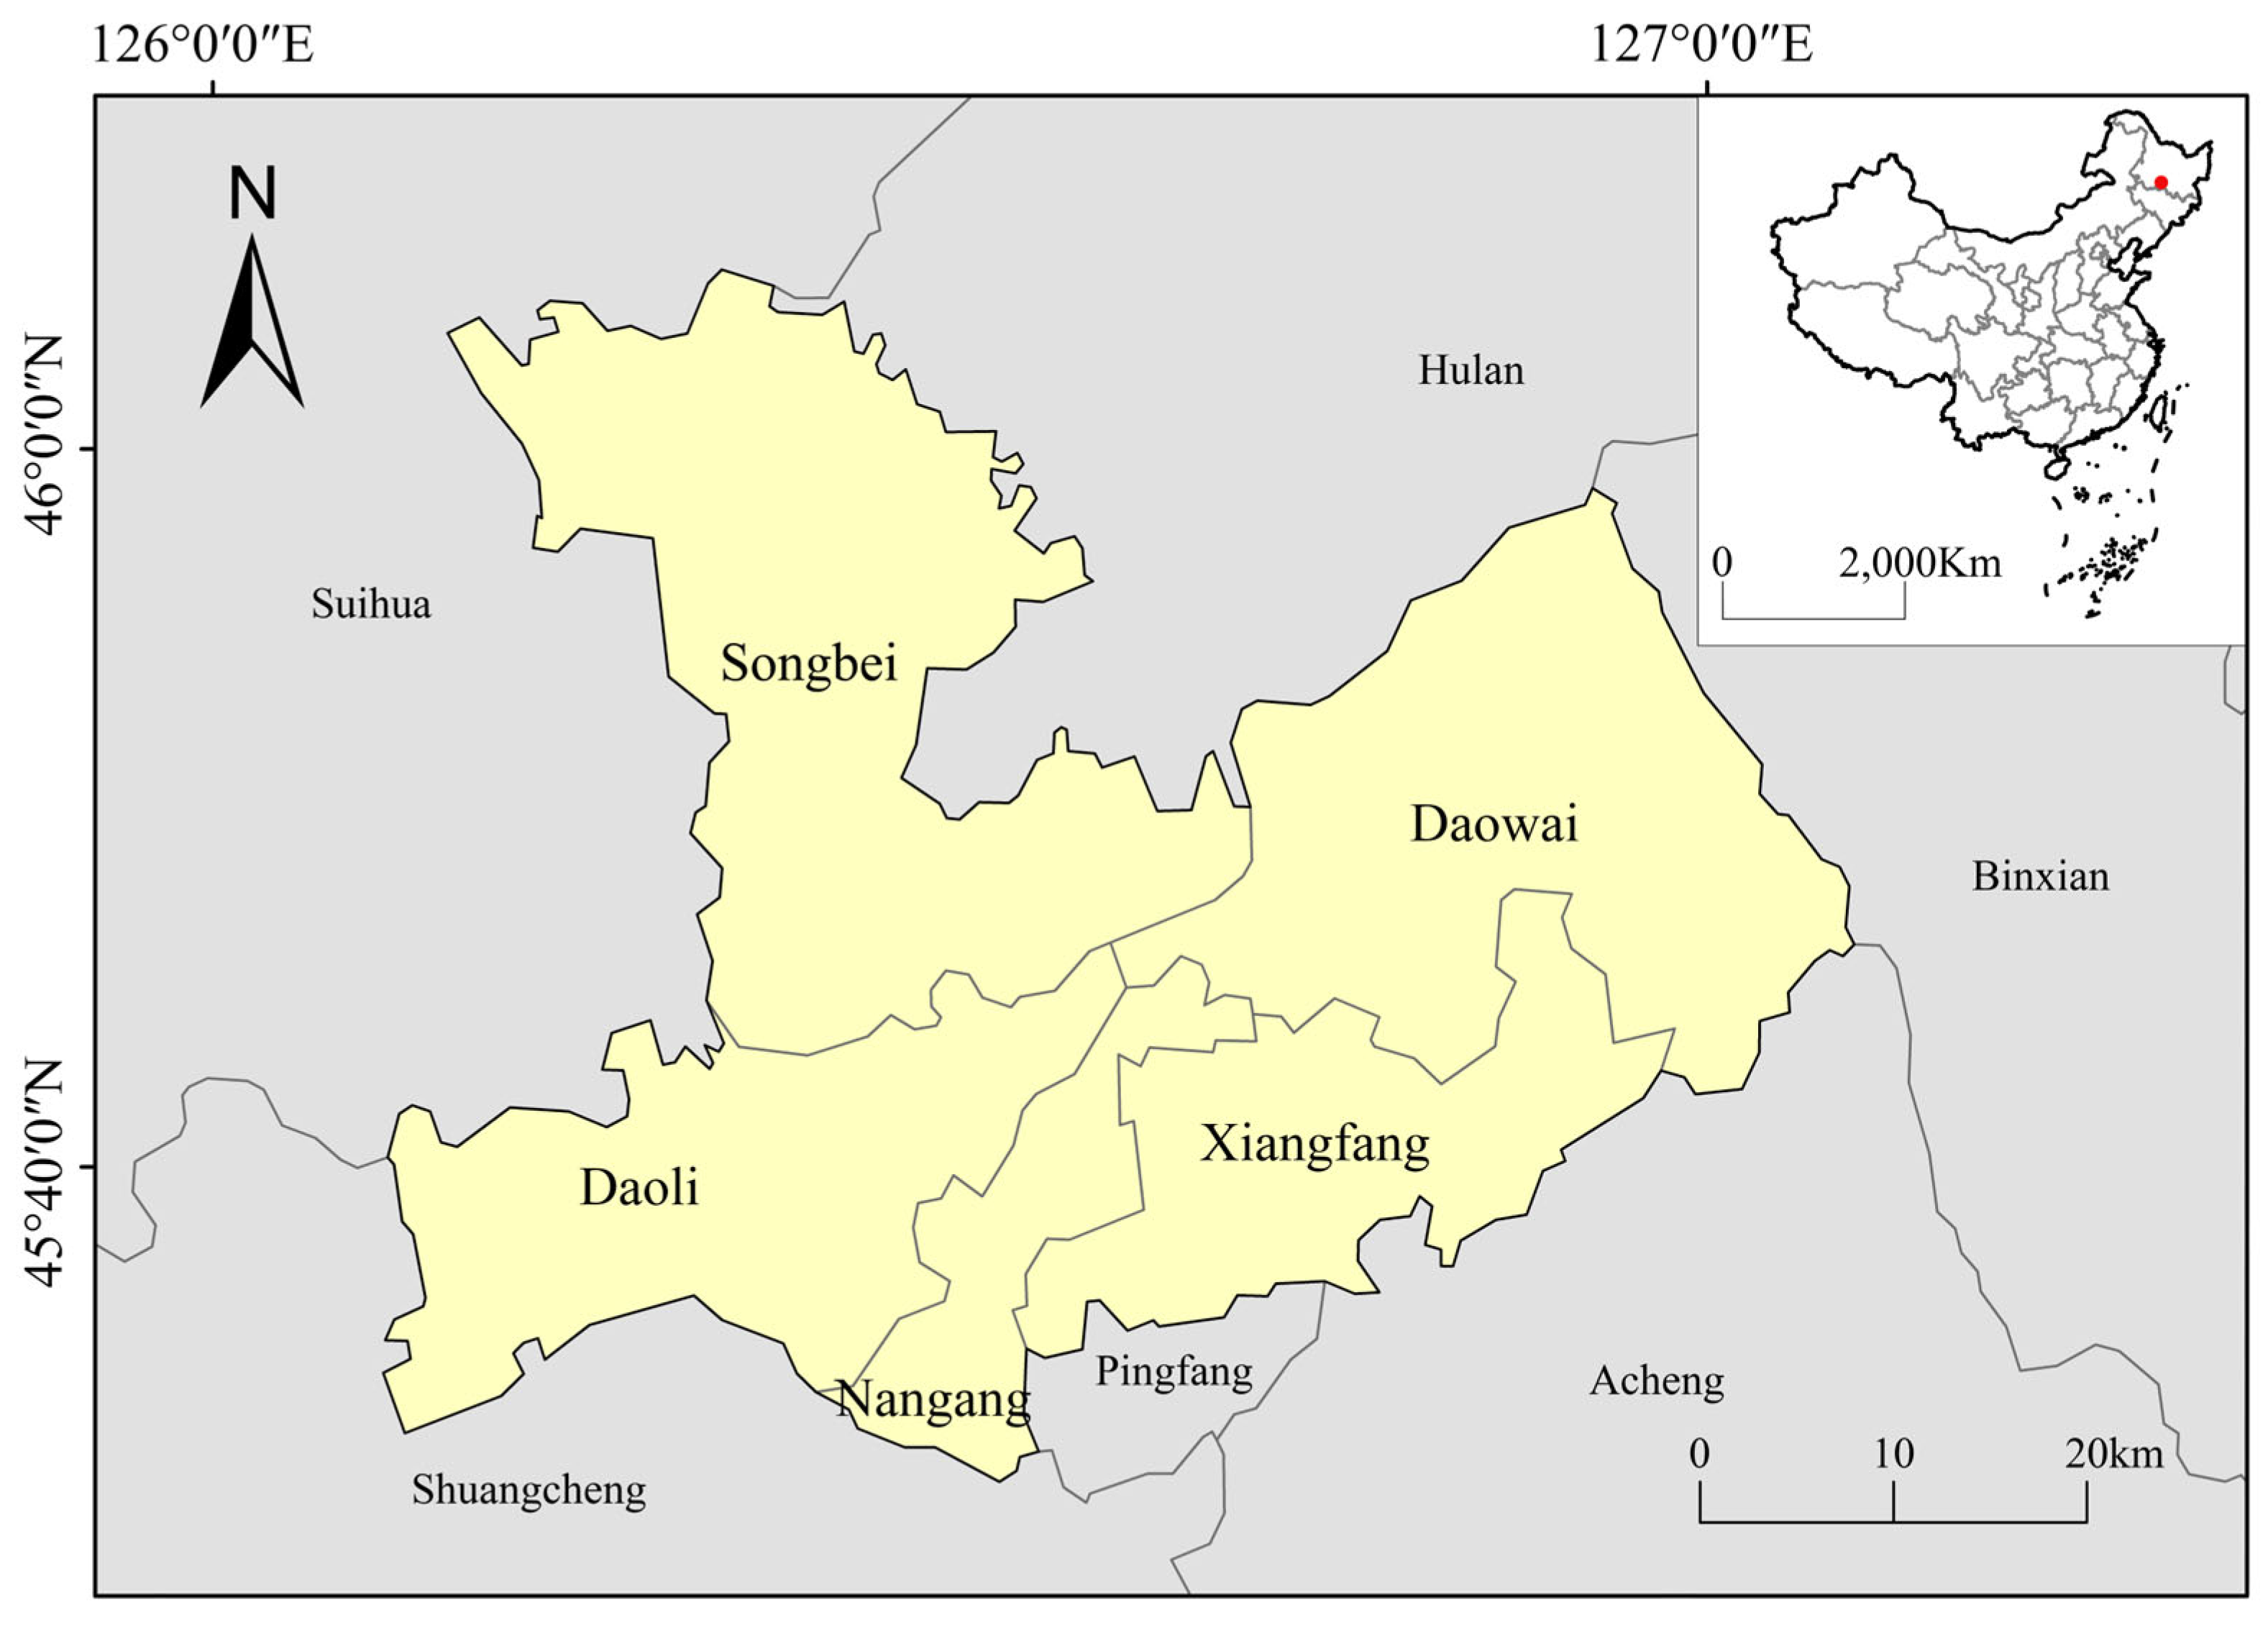
2.1. Description of Study Area
2.2. Data Sources
2.2.1. Basic Geographic Data
2.2.2. Online Open-Source Data
- (1)
- Locations without clear addresses or accurate spatial positioning were removed.
- (2)
- Locations with seasonal name changes but unchanged business types were merged.
2.2.3. Functional Classification
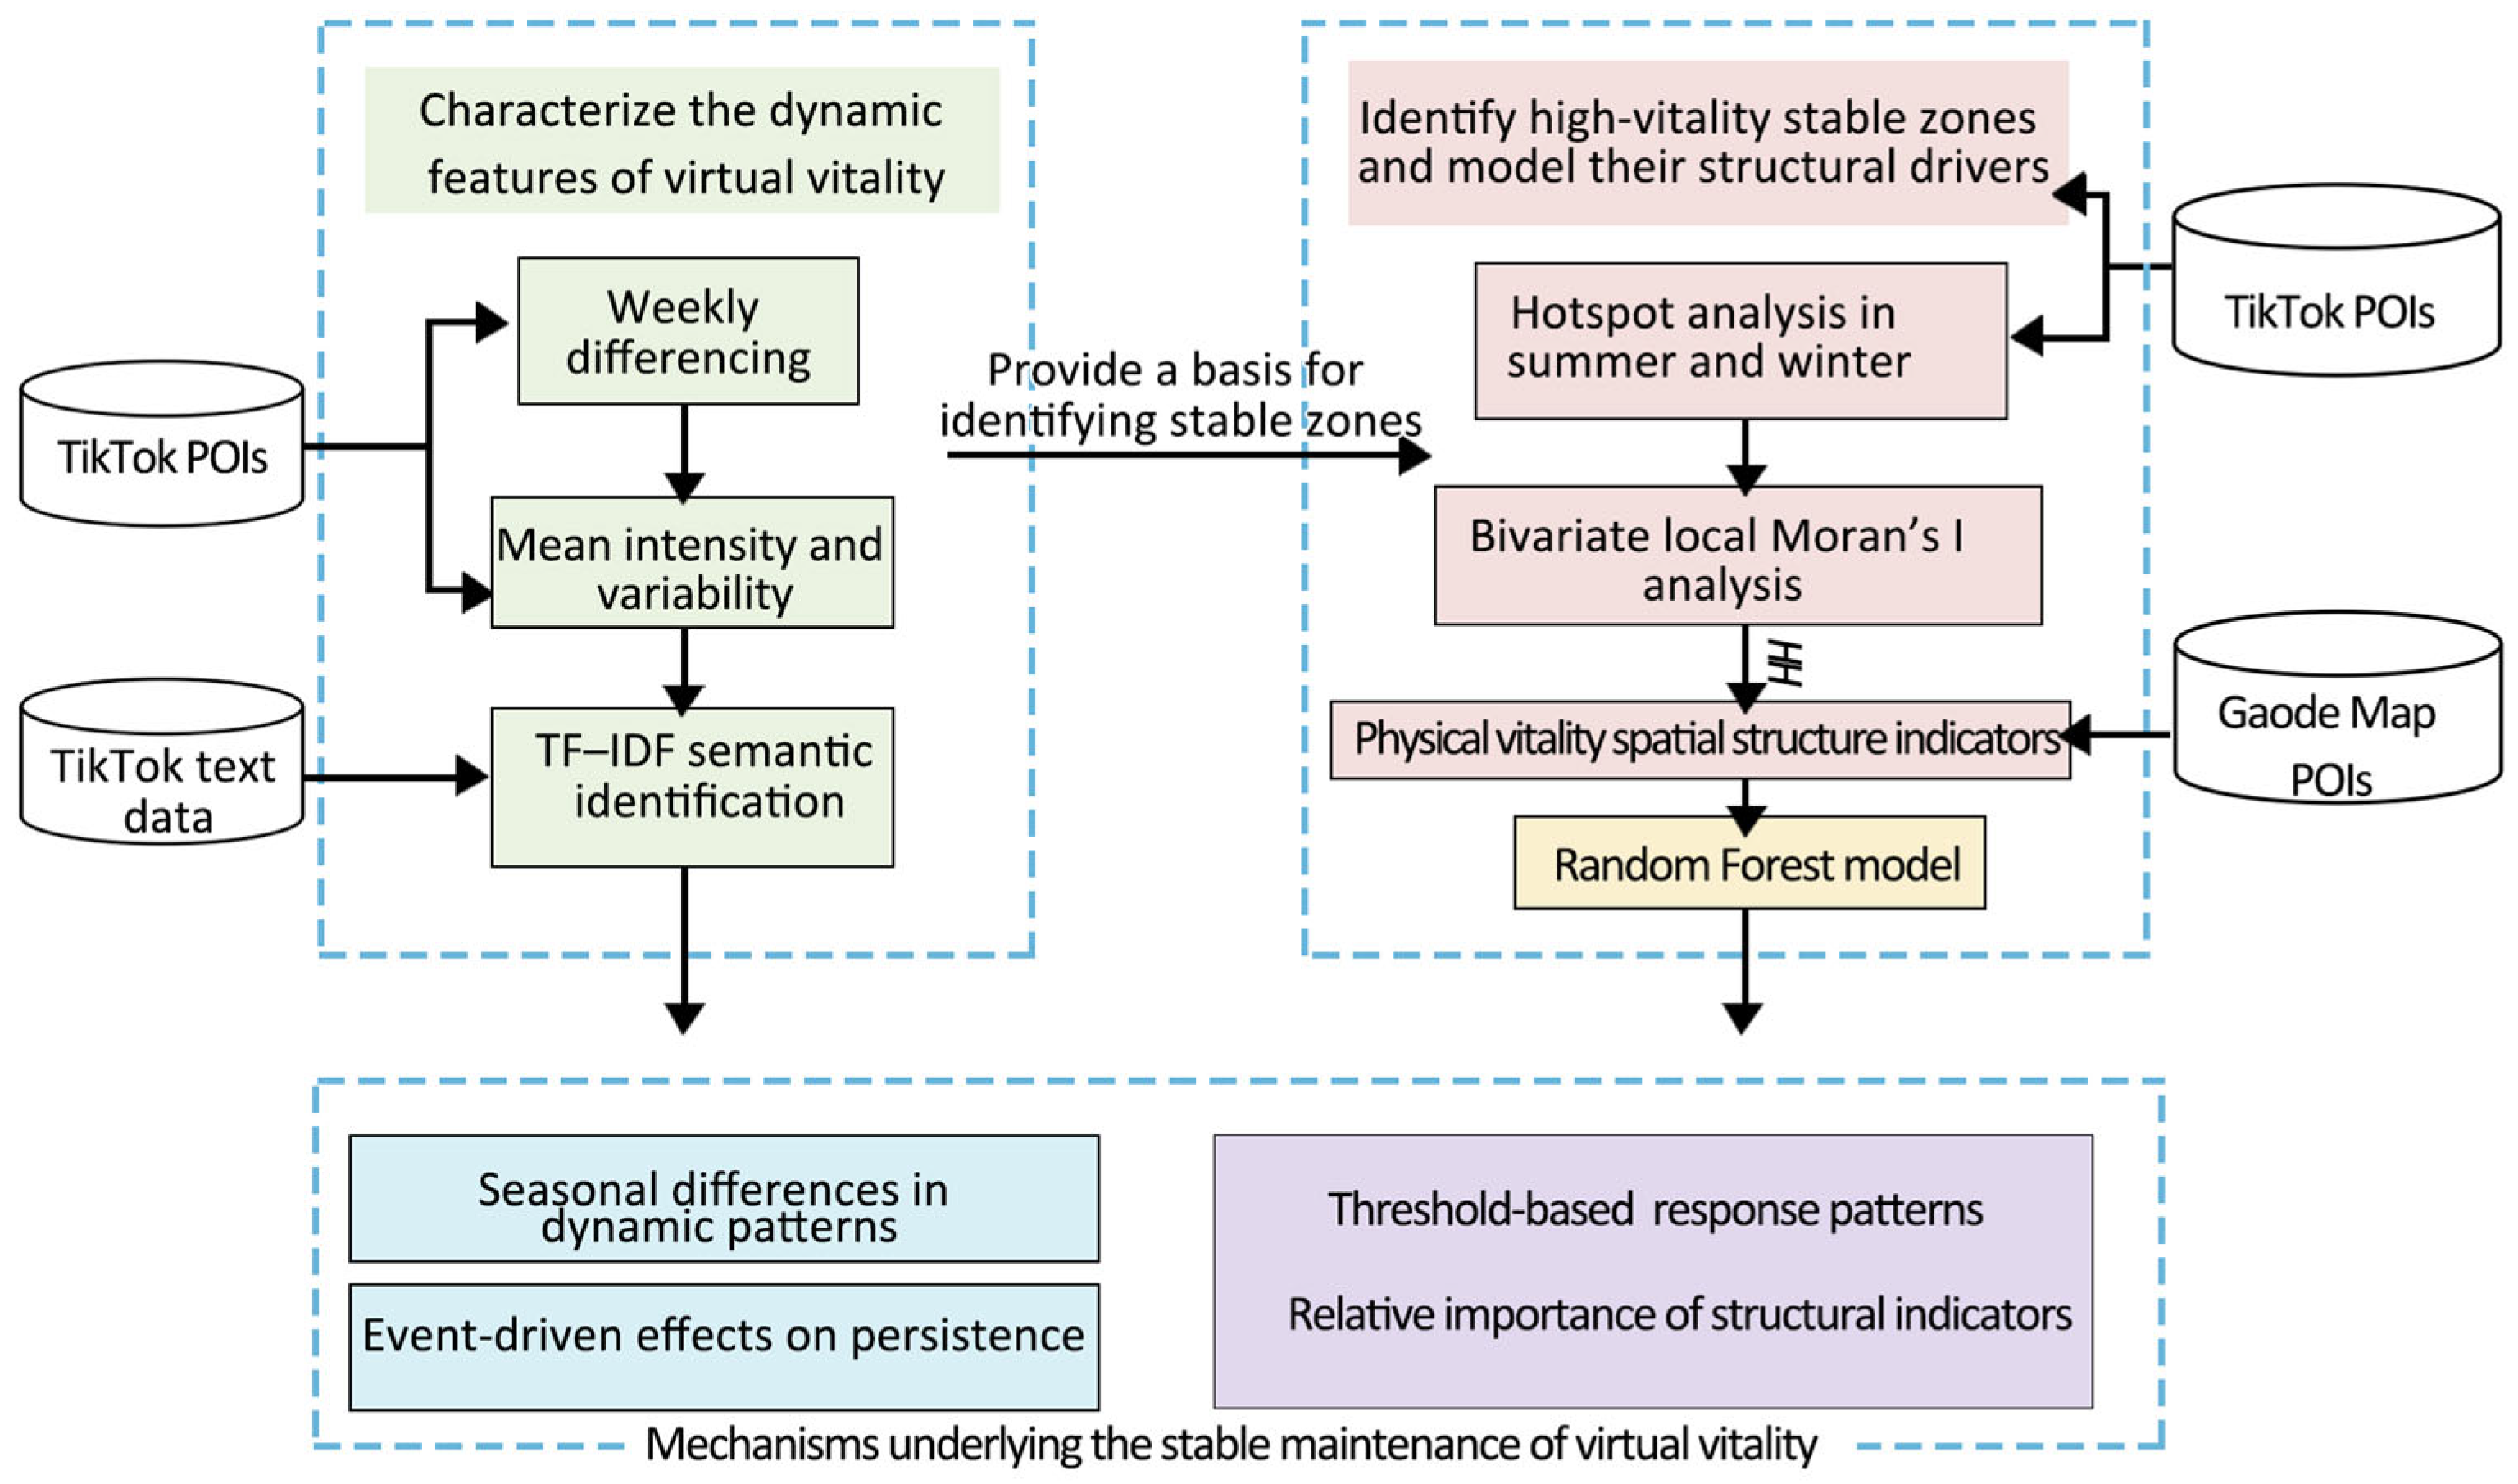
3. Methods
3.1. Measurement of Virtual Vitality
3.1.1. Measurement Indicators and Calculation Methods of Virtual Vitality
3.1.2. Weekly-Scale Dynamic Change Characterization and Change Category Identification
3.1.3. Seasonal Mean and Fluctuation Levels of Virtual Vitality
3.1.4. TF–IDF-Based Extraction of Semantic Features of Virtual Vitality
3.2. Spatial Analysis Methods of Virtual Vitality
3.2.1. Hotspot Analysis
3.2.2. Bivariate Local Spatial Autocorrelation Analysis
3.3. Mechanism Modeling
3.3.1. Indicator Screening and Feature Construction
3.3.2. Random Forest
4. Results
4.1. Dynamic Features and Seasonal Differences of Virtual Vitality
4.1.1. Weekly Change-Type Identification of Virtual Vitality
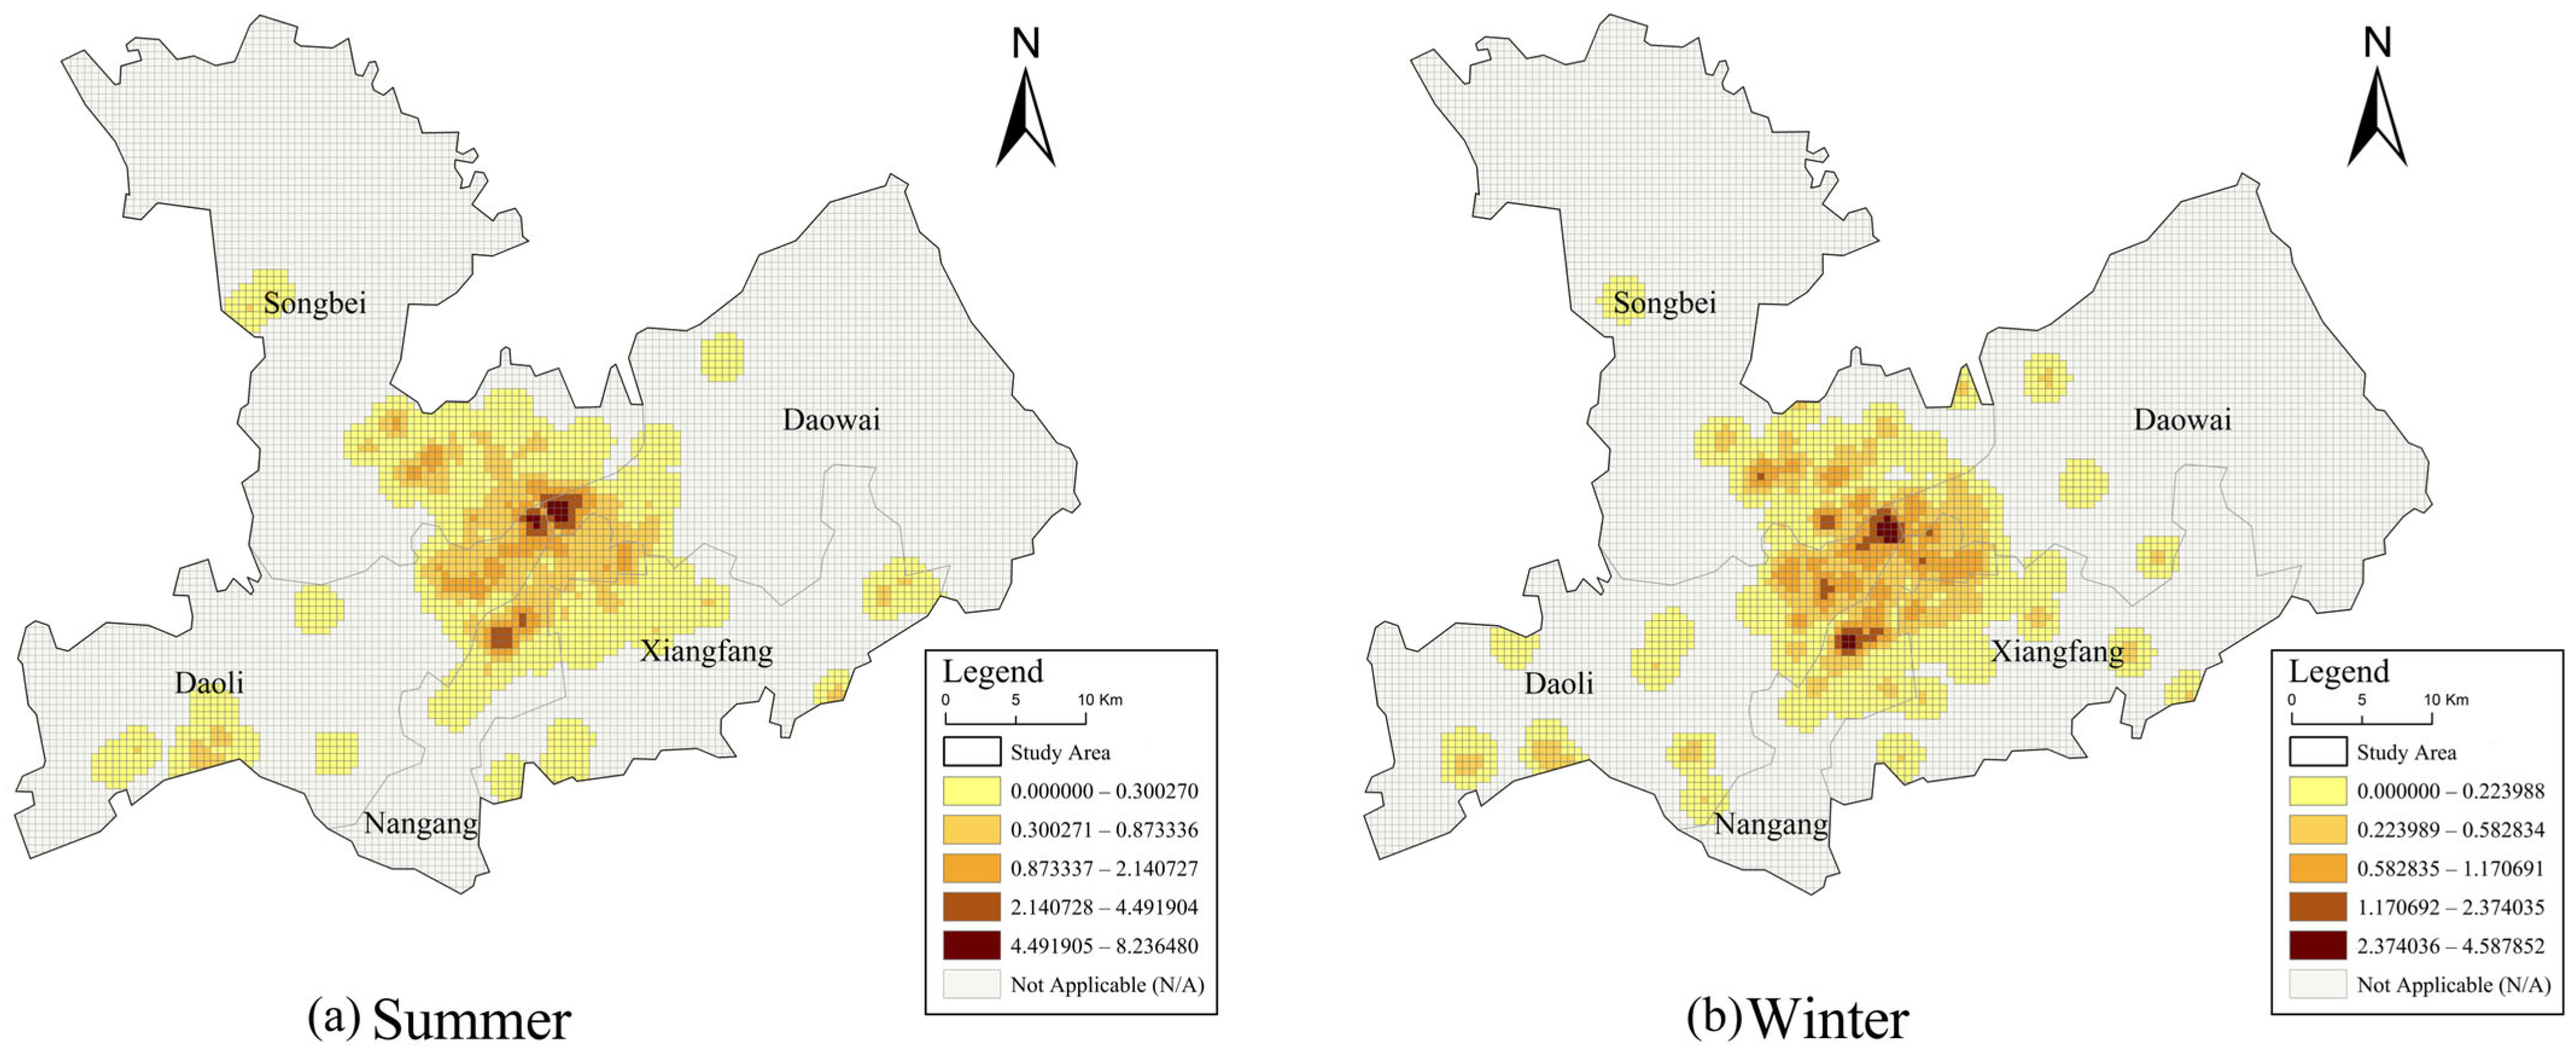
4.1.2. Seasonal Differences in the Mean and Fluctuation Levels of Virtual Vitality
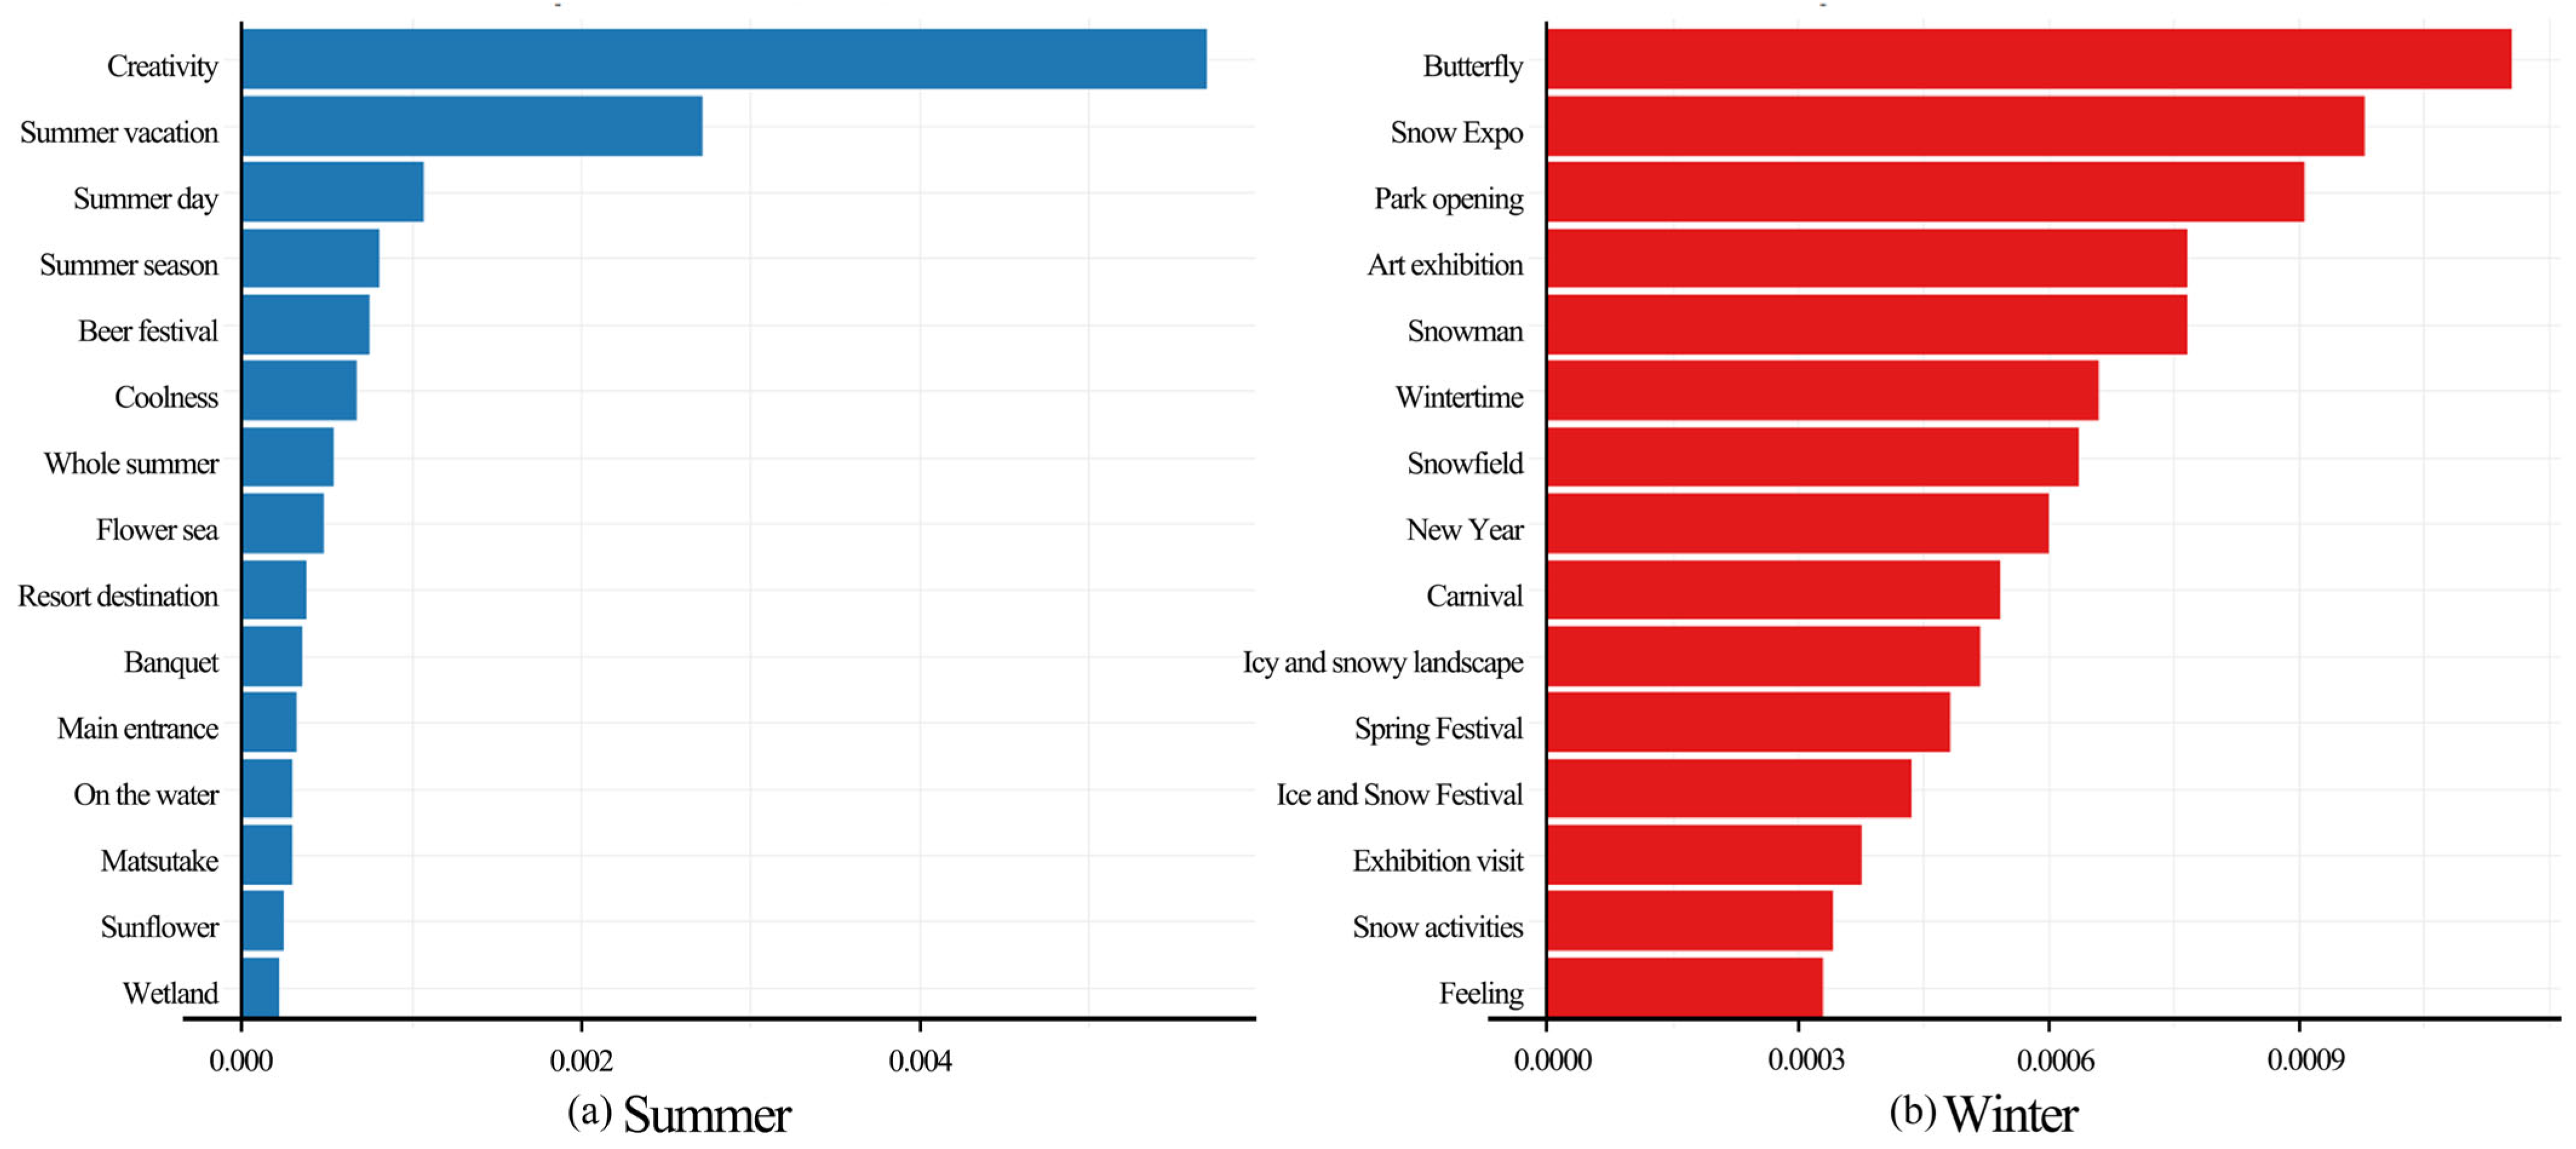
4.1.3. Seasonal Differences in Semantic Features of Virtual Vitality
4.2. High-Vitality Stable Zones and Related Dynamic Zones
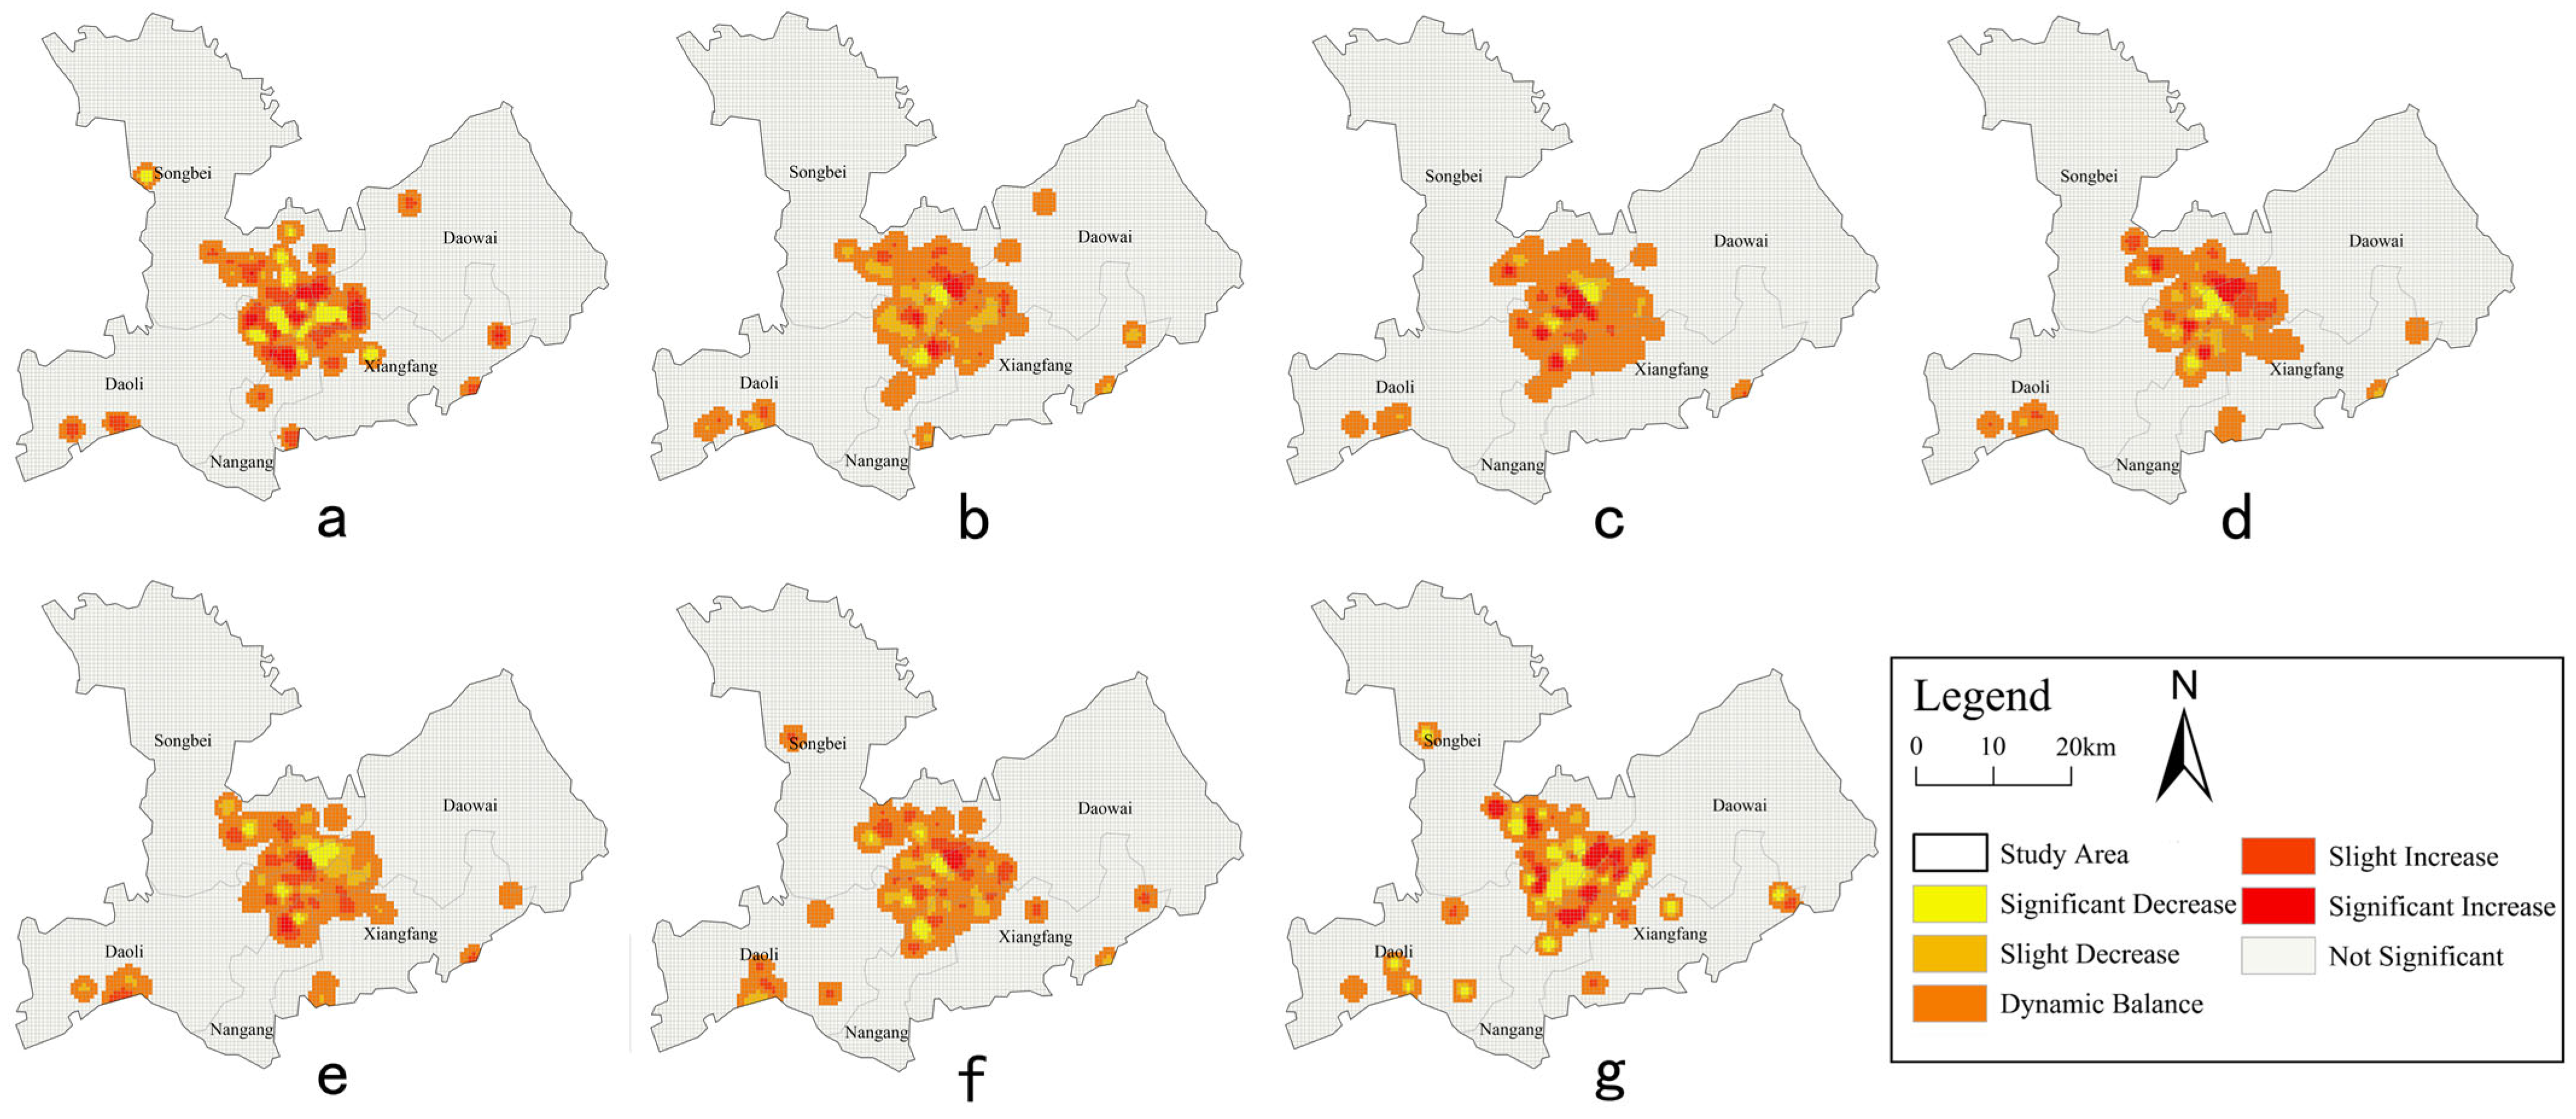
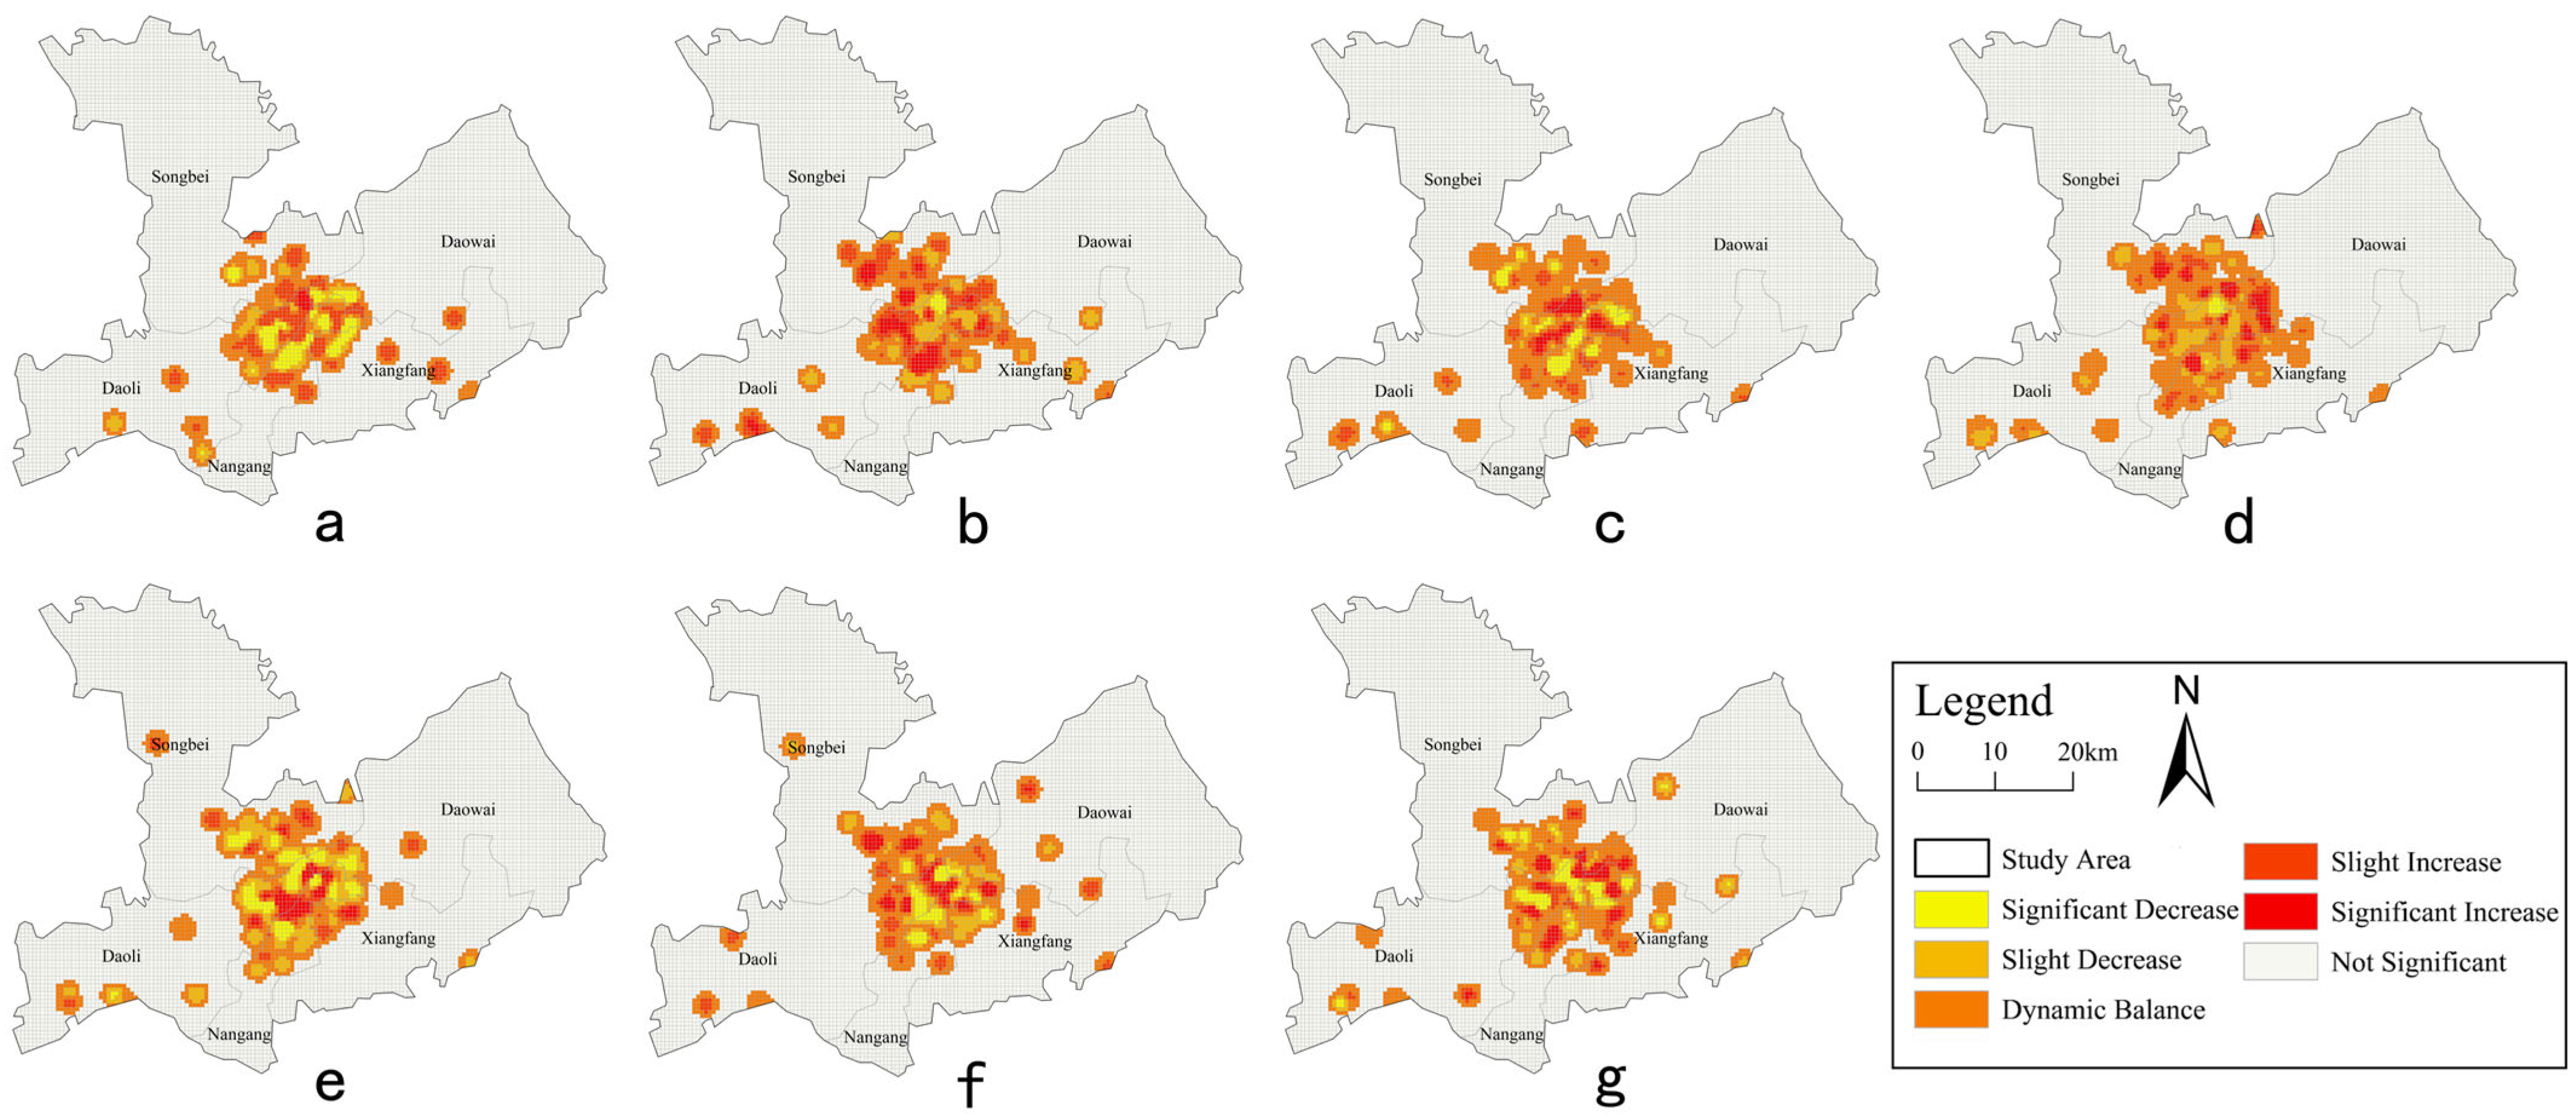
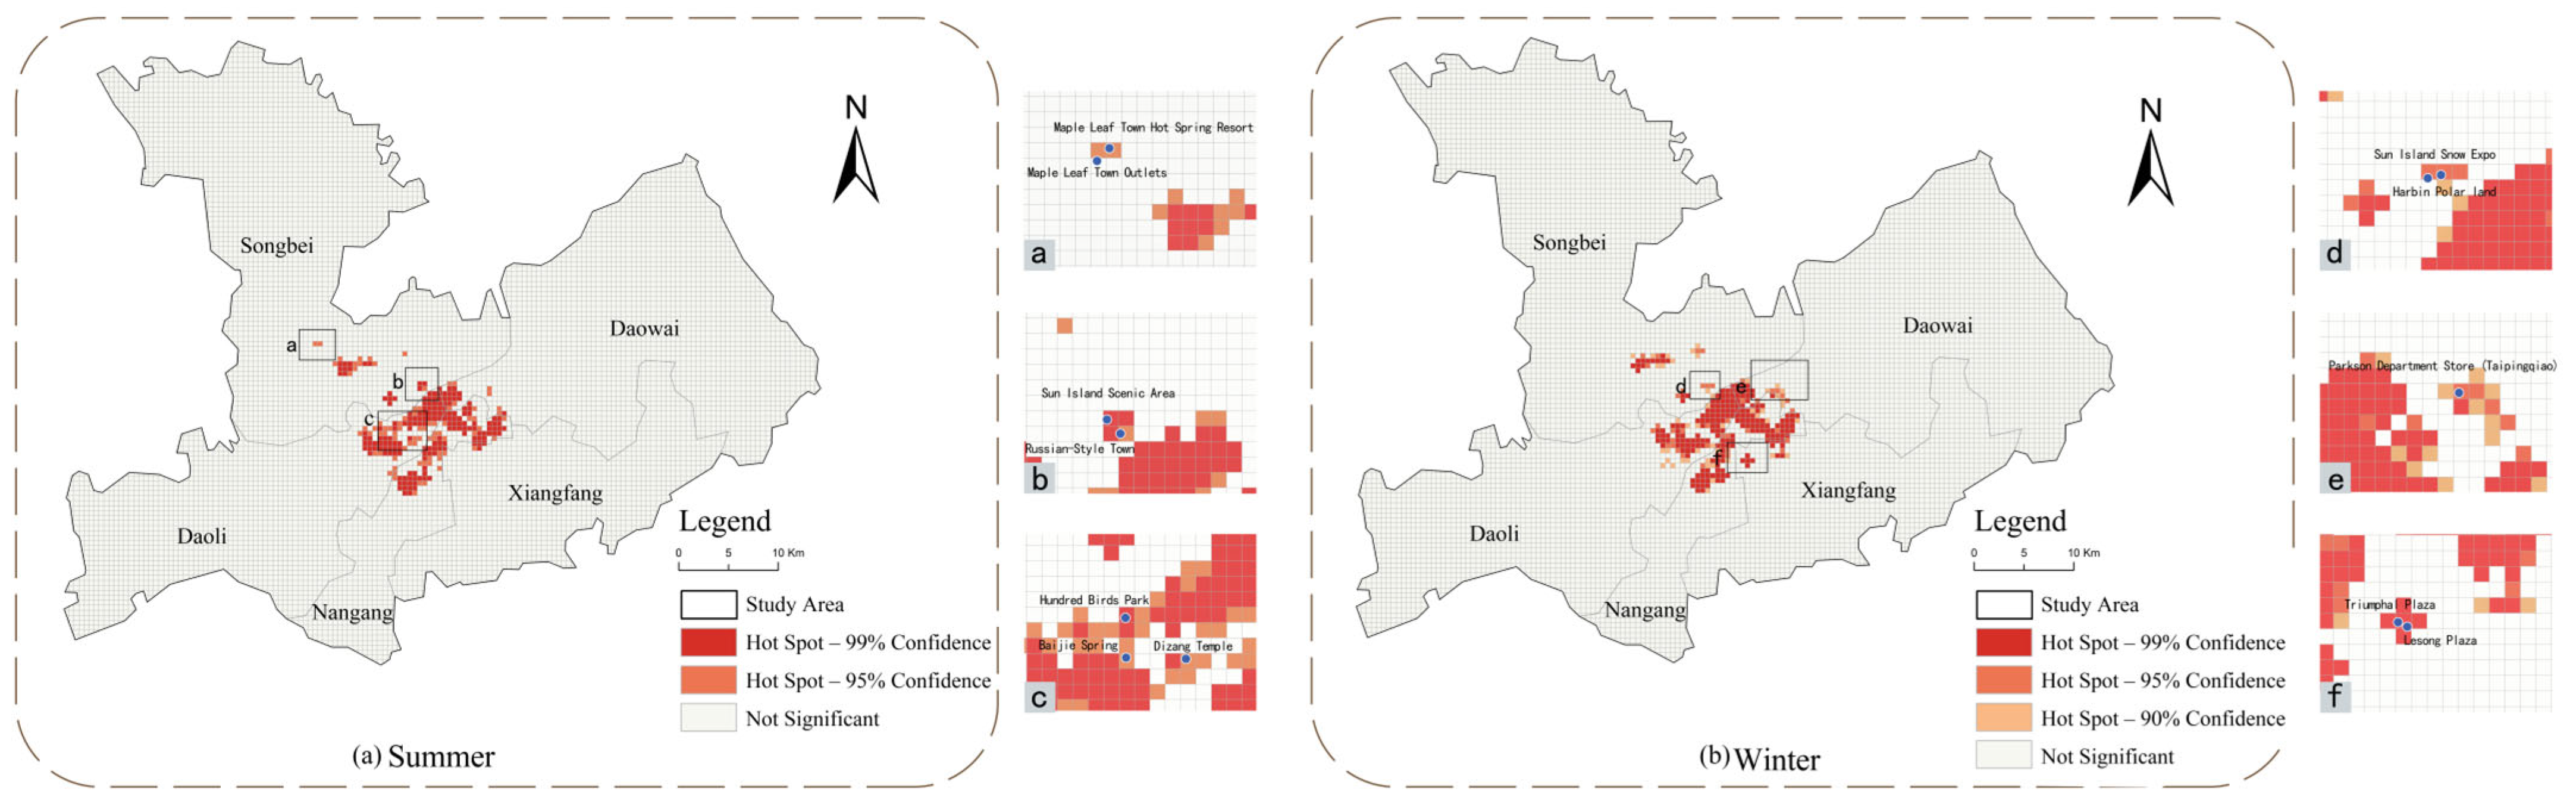
4.2.1. Seasonal Hotspot Patterns of Virtual Vitality
4.2.2. Identification of High-Vitality Stable Zones and Other Dynamic Zone Types
4.3. Influencing Factors and Response Patterns of the Stable Maintenance of High Virtual Vitality
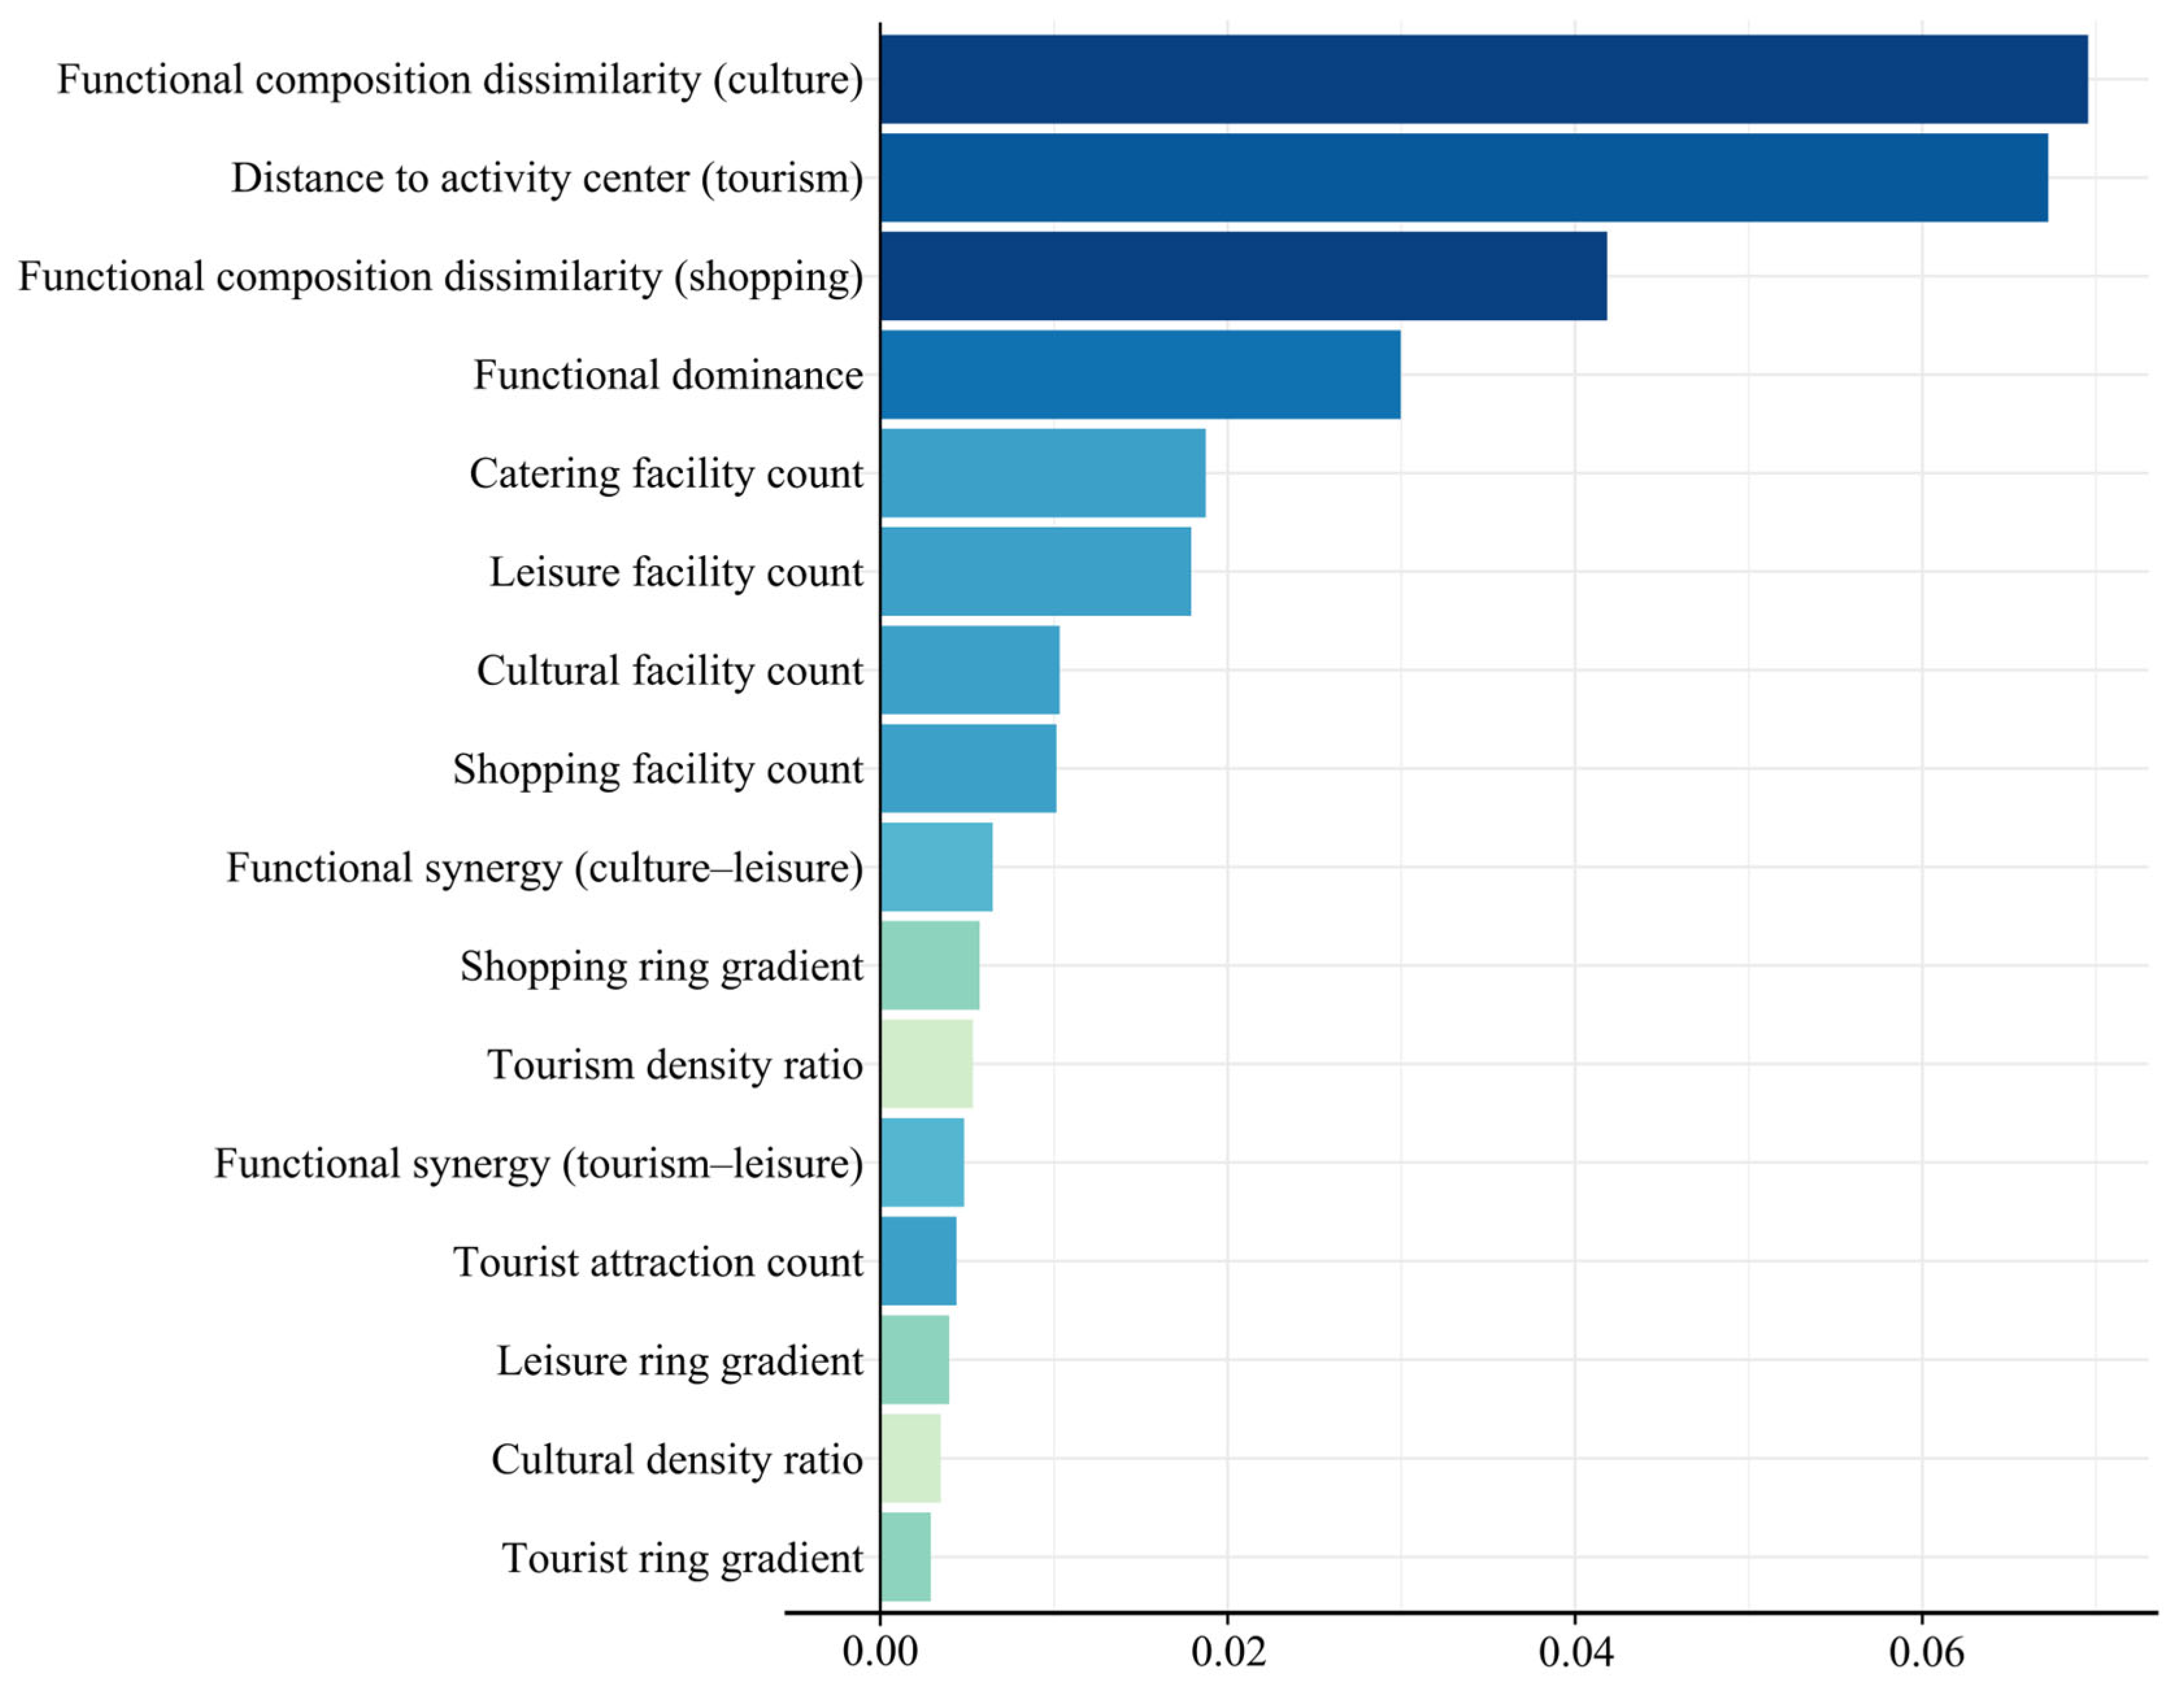
4.3.1. Feature Importance
4.3.2. Nonlinear Response Relationships of Key Influencing Factors
- (1)
- Centrality-Based Location Indicators
- (2)
- POI Count Indicators
- (3)
- Functional Dominance Indicators
- (4)
- Functional Composition Dissimilarity Indicators
- (5)
- Other Structural Indicators


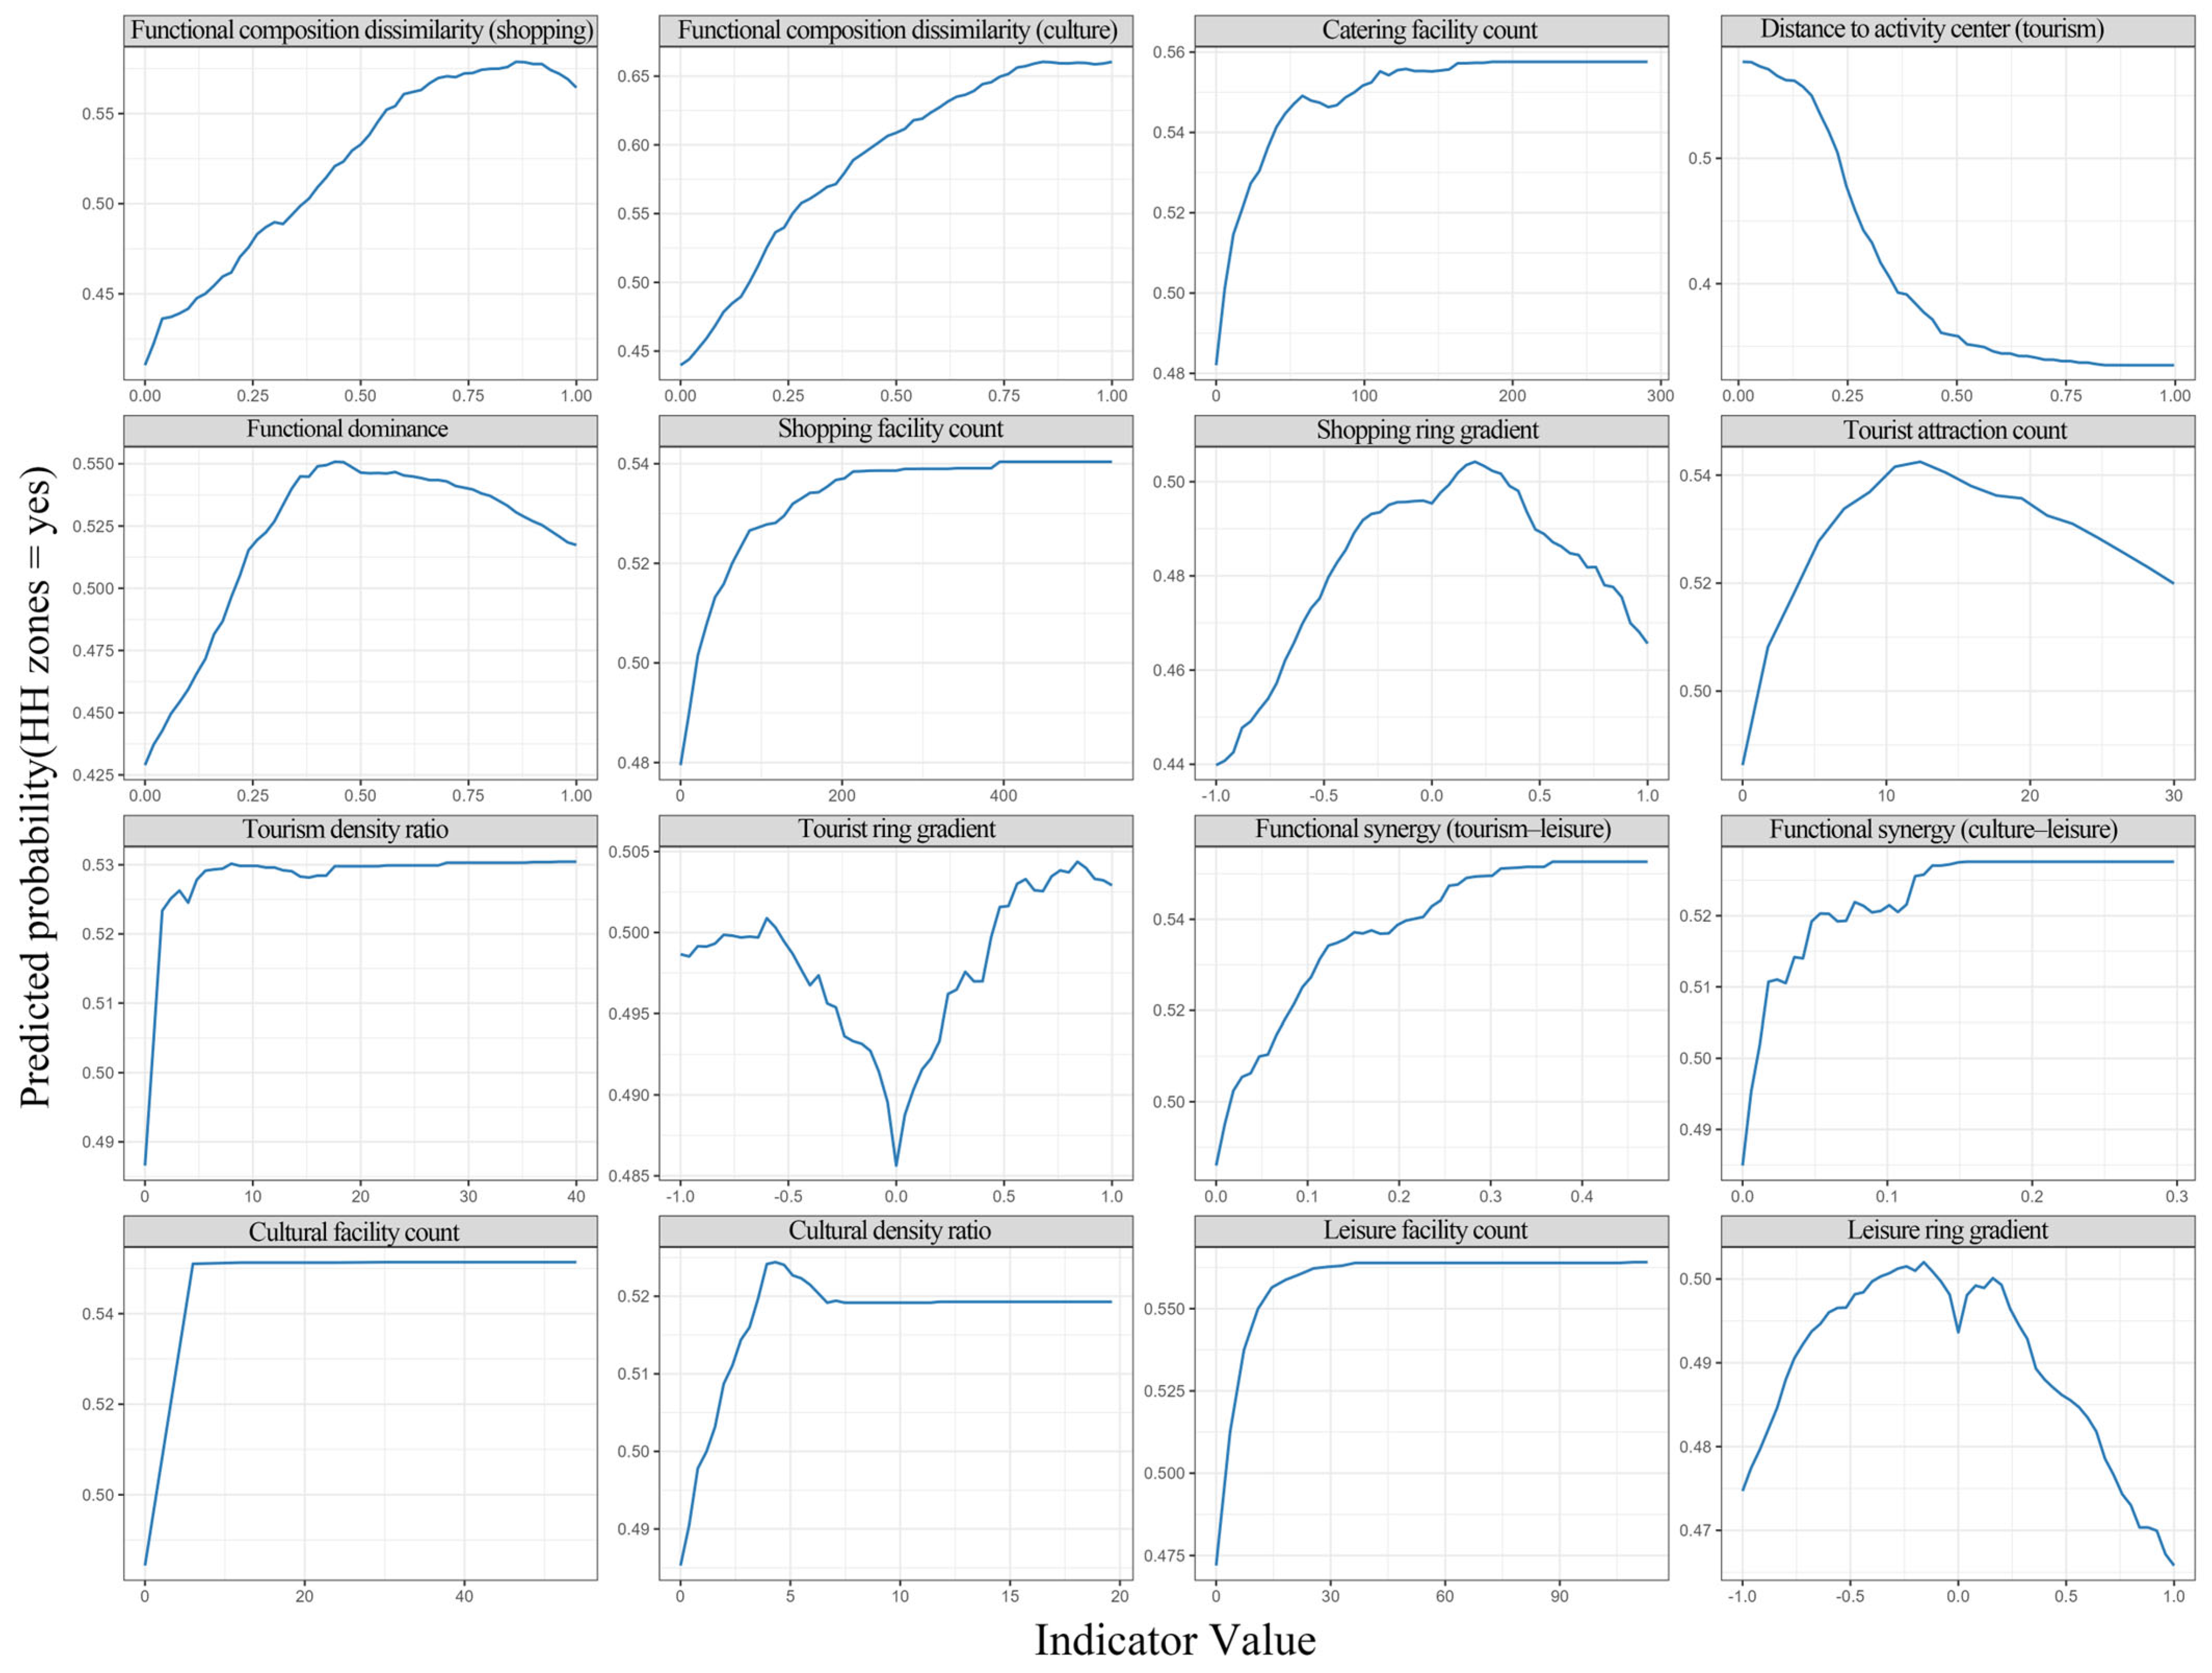
| Feature | Peak Value | Peak Response | Inflection Point | Inflection Response | Shape |
|---|---|---|---|---|---|
| Functional composition dissimilarity (shopping) | 0.88 | 0.58 | 0.04 | 0.44 | Unimodal |
| Functional composition dissimilarity (culture) | 1.00 | 0.66 | 0.22 | 0.54 | Threshold-type |
| Catering facility count | 190.04 | 0.56 | 11.88 | 0.51 | Threshold-type |
| Distance to activity center (tourism) | 0.01 | 0.58 | 0.27 | 0.45 | Threshold-type |
| Functional dominance | 0.43 | 0.55 | 0.14 | 0.47 | Unimodal |
| Shopping facility count | 392.33 | 0.54 | 21.80 | 0.50 | Threshold-type |
| Shopping ring gradient | 0.22 | 0.50 | −0.51 | 0.48 | Unimodal |
| Tourist attraction count | 11.63 | 0.54 | 4.29 | 0.52 | Unimodal |
| Tourism density ratio | 38.37 | 0.53 | 1.63 | 0.52 | Threshold-type |
| Tourist ring gradient | 0.84 | 0.50 | −0.02 | 0.49 | U-shaped |
| Functional synergy (tourism–leisure) | 0.37 | 0.55 | 0.06 | 0.51 | Threshold-type |
| Functional synergy (culture–leisure) | 0.16 | 0.53 | 0.02 | 0.51 | Threshold-type |
| Cultural facility count | 4.41 | 0.55 | 1.10 | 0.52 | Threshold-type |
| Cultural density ratio | 4.41 | 0.52 | 0.80 | 0.50 | Unimodal |
| Leisure facility count | 108.39 | 0.56 | 4.61 | 0.52 | Threshold-type |
| Leisure ring gradient | −0.14 | 0.50 | 0.02 | 0.49 | Unimodal |
5. Discussion
5.1. Dynamic Change Patterns of Virtual Vitality and Their Seasonal Responsiveness
5.2. Spatial Organization of High-Vitality Stable Zones and Related Dynamic Zones
5.3. Formation Mechanism of High-Vitality Stable Zones
5.4. Planning Implications, Limitations, and Future Research
6. Conclusions
- (1)
- Theoretical implications
- (2)
- Methodological contributions
- (3)
- Practical implications:
Author Contributions
Funding
Data Availability Statement
Conflicts of Interest
References
- Lan, F.; Gong, X.; Da, H.; Wen, H. How Do Population Inflow and Social Infrastructure Affect Urban Vitality? Evidence from 35 Large- and Medium-Sized Cities in China. Cities 2020, 100, 102454. [Google Scholar] [CrossRef]
- Jacobs, J. The Death and Life of Great American Cities; Random House Publishing Group, Random House: New York, NY, USA, 1961. [Google Scholar]
- Lynch, K. Good City Form; MIT Press: Cambridge, MA, USA, 1984. [Google Scholar]
- Fan, L.; Zhang, D. Research on Spatial Perception of Urban Image Hotspots under New Social Media: Take the Note Data of Beijing Xiaohongshu as an Example. Urban Dev. Stud. 2022, 29, 1–8. [Google Scholar]
- Kim, Y.-L. Seoul’s Wi-Fi Hotspots: Wi-Fi Access Points as an Indicator of Urban Vitality. Comput. Environ. Urban Syst. 2018, 72, 13–24. [Google Scholar] [CrossRef]
- Zeng, W. The Virtual and Physical Space Characteristics and Evolution of Changsha Xiaohongshu Wanghong Clock-in Place. Archit. Cult. 2024, 2024, 130–133. [Google Scholar] [CrossRef]
- Chen, C.; Shen, L.; Wang, X.; Xi, G. A Study on the Influencing Factors of Digital Sense of Place in Historical Districts Based on Social Media Data: A Case of Mendong Area in Nanjing. Hum. Geogr. 2025, 40, 50–58, 78. [Google Scholar] [CrossRef]
- Zhou, K.; Zhang, H.; Xia, Y.; Liu, C. New Urban Consumption Space Shaped by Social Media: A Case Study of the Geo—Tagging PIaces of Changsha on Xiaohongshu. Mod. Urban Res. 2021, 9, 20–27. [Google Scholar] [CrossRef]
- Cui, L.; Wang, M.; Zhou, Y.; Zhang, Y. The spatial reconstruction of cultural and creative industry parks from the perspective of social media: A case study of Shanghai. Geogr. Res. 2024, 43, 1166–1186. [Google Scholar] [CrossRef]
- Yang, L.; Chen, W.; Fang, C.; Zeng, J. How Does the Coordinated Development of Population Urbanization and Land Urbanization Affect Residents’ Living Standards? Empirical Evidence from China. Cities 2024, 149, 104922. [Google Scholar] [CrossRef]
- Morán Uriel, J.; Camerin, F.; Córdoba Hernández, R. Urban Horizons in China: Challenges and Opportunities for Community Intervention in a Country Marked by the Heihe-Tengchong Line. In Diversity as Catalyst: Economic Growth and Urban Resilience in Global Cityscapes; Siew, G., Allam, Z., Cheshmehzangi, A., Eds.; Urban Sustainability; Springer Nature: Singapore, 2024; pp. 105–125. [Google Scholar]
- Qin, X.; Zhen, F.; Zhu, S.; Xi, G. Spatial Pattern of Catering Industry in Nanjing Urban Area Based on the Degree of Public Praise from Internet: A Case Study of Dianping. Com. Sci. Geogr. Sin. 2014, 34, 810–817. [Google Scholar] [CrossRef]
- Rose, G.; Raghuram, P.; Watson, S.; Wigley, E. Platform Urbanism, Smartphone Applications and Valuing Data in a Smart City. Trans. Inst. Br. Geogr. 2021, 46, 59–72. [Google Scholar] [CrossRef]
- Törnberg, P. Social Media Imaginaries and the City: How the Attention Economy Is Reshaping Urban Built Environments. Soc. Media + Soc. 2025, 11, 20563051251323389. [Google Scholar] [CrossRef]
- Chang, H.; Spierings, B. Places “for the Gram”: Millennials, Specialty Coffee Bars and the Gentrification of Commercial Streets in Seoul. Geoforum 2023, 139, 103677. [Google Scholar] [CrossRef]
- Chen, R.; Huang, Q.; Miao, L.; Lin, Z.; Gao, D. Social Media-Driven Behavioral Mechanisms for Sustainable Park Governance: A Analysis of Visitation Intentions. Front. Psychol. 2025, 16, 1647976. [Google Scholar] [CrossRef]
- Hussain, K.; Didarul Alam, M.M.; Malik, A.; Tarhini, A.; Al Balushi, M.K. From Likes to Luggage: The Role of Social Media Content in Attracting Tourists. Heliyon 2024, 10, e38914. [Google Scholar] [CrossRef]
- Li, J. Research on the Distribution Characteristics of Urban Vitality Space from the Perspective of Network POI—Based on the Case Study of Chengdu. Master’s Thesis, Architecture Southeast University, Nanjing, China, 2023. [Google Scholar]
- Wu, C.; Ye, X.; Ren, F.; Du, Q. Check-in Behaviour and Spatio-Temporal Vibrancy: An Exploratory Analysis in Shenzhen, China. Cities 2018, 77, 104–116. [Google Scholar] [CrossRef]
- Huang, B.; Zhou, Y.; Li, Z.; Song, Y.; Cai, J.; Tu, W. Evaluating and Characterizing Urban Vibrancy Using Spatial Big Data: Shanghai as a Case Study. Environ. Plan. B Urban Anal. City Sci. 2020, 47, 1543–1559. [Google Scholar] [CrossRef]
- Duan, Y. Research on the Characteristics of Internet Celebrity Space and the Renewal Strategy of Qingdao Historical Blocks from the Perspective of Spatial Media. Master’s Thesis, Qingdao University of Technology, Qingdao, China, 2025. [Google Scholar]
- Xiang, J. Research on the Emergence and Spatial Characteristics of “Web-Star Space” in the Mobile Internet Era. Master’s Thesis, Nanjing University, Nanjing, China, 2021. [Google Scholar]
- Jiang, H.; Song, T.; Li, S.; Deng, Z. Spatial Pattern Characteristics of Urban Virtual-Real Vitality in the Digitization Context: A Case Study of Guangzhou. Trop. Geogr. 2023, 43, 695–706. [Google Scholar] [CrossRef]
- Pan, C.; Zhou, J.; Huang, X. Impact of Check-In Data on Urban Vitality in the Macao Peninsula. Sci. Program. 2021, 2021, 7179965. [Google Scholar] [CrossRef]
- Yuan, Y.; Raubal, M.; Liu, Y. Correlating Mobile Phone Usage and Travel Behavior—A Case Study of Harbin, China. Comput. Environ. Urban Syst. 2012, 36, 118–130. [Google Scholar] [CrossRef]
- Zhong, W.; Wang, D.; Xie, D.; Yan, L. Dynamic Characteristics of Shanghai’s Population Distribution Using Cell Phone Signaling Data. Geogr. Res. 2017, 36, 972–984. [Google Scholar] [CrossRef]
- Hao, K.; Deng, Y.; Liu, Y.; Hou, K.; Yu, T. Spatial Differentiation and Non-Linear Mechanisms of Urban Virtual-Physical Vitality. Urban Dev. Stud. 2025, 32, 34–41. [Google Scholar]
- Zhou, Z. A Study on the Correlation Between Virtual and Real Characteristics of “Internet-Sensation Space” and Its Actual Popularity. Master’s Thesis, South China University of Technology, Guangzhou, China, 2024. [Google Scholar]
- Wang, W.; Li, Y. Distribution Characteristics and Relationship between Virtual- and Real-Imagery Hotspots as Influenced by Social Media: A Case Study of Changsha City. J. Asian Archit. Build. Eng. 2025, 24, 4532–4550. [Google Scholar] [CrossRef]
- Lv, F.; Wang, S. Space Vitality Measurement and Its Influencing Factors of The Core Section of Huangpu Riverfront Area from Both Online and Offline Perspectives. Planners 2023, 39, 123–130. [Google Scholar]
- Li, X.; Liu, X.; Liu, Z.; Yang, X. Nonlinear Relationship between Urban Online Vitality and Built Environment: A Case Study of Metro Vicinity Area in Wuhan. Archit. J. 2024, 92–99. [Google Scholar]
- Gong, X.; Wang, Y. Exploring Dynamics of Sports Fan Behavior Using Social Media Big Data—A Case Study of the 2019 National Basketball Association Finals. Appl. Geogr. 2021, 129, 102438. [Google Scholar] [CrossRef]
- Wang, B.; Lei, Y.; Wang, C.; Wang, L. The Spatio-Temporal Impacts of the Built Environment on Urban Vitality: A Study Based on Big Data. Sci. Geogr. Sin. 2022, 42, 274–283. [Google Scholar] [CrossRef]
- Ding, X.; Wang, J.; Li, Y. Study on Characteristics and Influencing Factors of Network Attention Degree of Tourist Destination Based on Baidu Index: A Case of Xiamen City. Resour. Dev. Mark. 2018, 34, 709–714. [Google Scholar] [CrossRef]
- Lu, L.; Dai, X. Research on the Tourist Network Attention and Spatial Pattern of Tourist Destination Cities in Hunan Based on the Baidu Index. Resour. Environ. Yangtze Basin 2020, 29, 836–849. [Google Scholar]
- Xie, L.; Yang, Z.; Cai, J.; Cheng, Z.; Wen, T.; Song, T. Harbin: A Rust Belt City Revival from Its Strategic Position. Cities 2016, 58, 26–38. [Google Scholar] [CrossRef]
- Hu, X.; Lin, T.; Wu, D. Peripheral Regions Becoming Wanghong (Internet Famous) Cities in China? Revitalizing City Brands via Social Media Platforms. Geoforum 2026, 169, 104523. [Google Scholar] [CrossRef]
- Zhou, X.; Li, H.; Xu, J.; Sun, Q. Urban Spatial Image Acquisition and Examination Based on Geographic Big Data. Land 2024, 13, 774. [Google Scholar] [CrossRef]
- Yin, J.; Chen, R.; Zhang, R.; Li, X.; Fang, Y. The Scale Effect of Street View Images and Urban Vitality Is Consistent with a Gaussian Function Distribution. Land 2025, 14, 415. [Google Scholar] [CrossRef]
- GB 50442–2018; Planning Standards for Urban Public Service Facilities. China Architecture & Building Press: Beijing, China, 2018.
- Zhang, W. Study on Spatial Features of Online Popular Block Taking the Urban Area of Qingdao for Example. Master’s Thesis, Qingdao University of Technology, Qingdao, China, 2024. [Google Scholar]
- Wu, C.; Ye, X.; Ren, F.; Wan, Y.; Ning, P.; Du, Q. Spatial and Social Media Data Analytics of Housing Prices in Shenzhen, China. PLoS ONE 2016, 11, e0164553. [Google Scholar] [CrossRef]
- Salton, G.; Buckley, C. Term-Weighting Approaches in Automatic Text Retrieval. Inf. Process. Manag. 1988, 24, 513–523. [Google Scholar] [CrossRef]
- Ord, J.K.; Getis, A. Local Spatial Autocorrelation Statistics: Distributional Issues and an Application. Geogr. Anal. 1995, 27, 286–306. [Google Scholar] [CrossRef]
- Niu, H.; Silva, E.A. Understanding Temporal and Spatial Patterns of Urban Activities across Demographic Groups through Geotagged Social Media Data. Comput. Environ. Urban Syst. 2023, 100, 101934. [Google Scholar] [CrossRef]
- Wu, W.; Liu, X.; Zhou, Y.; Zhao, K. Spatial Heterogeneity of Built Environment’s Impact on Urban Vitality Using Multi-Source Big Data and MGWR. Sci. Rep. 2025, 15, 23459. [Google Scholar] [CrossRef] [PubMed]
- Lin, J.; Zhuang, Y.; Zhao, Y.; Li, H.; He, X.; Lu, S. Measuring the Non-Linear Relationship between Three-Dimensional Built Environment and Urban Vitality Based on a Random Forest Model. Int. J. Environ. Res. Public Health 2022, 20, 734. [Google Scholar] [CrossRef] [PubMed]
- Yu, M.; Ji, Q.; Zheng, X.; Cui, W. Nonlinear Effects of the Built Environment on Urban Vitality in Jinan Based on Multi-Source Data and Explainable AI. Sci. Rep. 2026, 16, 4923. [Google Scholar] [CrossRef]
- Li, X.; Li, Y.; Jia, T.; Zhou, L.; Hijazi, I.H. The Six Dimensions of Built Environment on Urban Vitality: Fusion Evidence from Multi-Source Data. Cities 2022, 121, 103482. [Google Scholar] [CrossRef]
- Liu, Q.; Zou, G.; Luo, Y. How the Neighborhood Amenity Mix Shapes Urban Vitality: An Exploratory Analysis from a Rhythm Perspective. Appl. Geogr. 2025, 185, 103807. [Google Scholar] [CrossRef]
- Zhuo, Y.; Hu, H.; Li, G. The Effects of Land Use Mix on Urban Vitality: A Systemic Conceptualization and Mechanistic Exploration. Systems 2025, 13, 542. [Google Scholar] [CrossRef]
- Xu, G.; Su, J.; Xia, C.; Li, X.; Xiao, R. Spatial Mismatches between Nighttime Light Intensity and Building Morphology in Shanghai, China. Sustain. Cities Soc. 2022, 81, 103851. [Google Scholar] [CrossRef]
- Zhang, Y.; Wang, X.; Ye, Y.; Wang, L.; Zhang, Y.; Qin, W.; Chi, Y.; Liu, G.; Yao, S. Nonlinear Relationships and Interaction Effects of Urban Built Environment on Urban Vitality Based on Explainable Machine Learning. City Environ. Interact. 2025, 28, 100244. [Google Scholar] [CrossRef]
- Wang, Z.; Liu, Y.; Luo, X.; Tong, Z.; An, R. Nonlinear relationship between urban vitality and the built environment based on multi-source data: A case study of the main urban area of Wuhan City at the weekend. Prog. Geogr. 2023, 42, 716–729. [Google Scholar] [CrossRef]
- Ruan, Y.; Zhang, X.; Wang, J.; Liu, N. Understanding the Role of Urban Block Morphology in Innovation Vitality through Explainable Machine Learning. Sci. Rep. 2025, 15, 21337. [Google Scholar] [CrossRef]
- O’Brien, R.M. A Caution Regarding Rules of Thumb for Variance Inflation Factors. Qual. Quant. 2007, 41, 673–690. [Google Scholar] [CrossRef]
- Liu, Y.; Du, H. The Built Environment and Urban Vibrancy: A Data-Driven Study of Non-Commuters’ Destination Choices Around Metro Stations. Land 2025, 14, 1619. [Google Scholar] [CrossRef]
- Wang, Z.; Xia, N.; Zhao, X.; Gao, X.; Zhuang, S.; Li, M. Evaluating Urban Vitality of Street Blocks Based on Multi-Source Geographic Big Data: A Case Study of Shenzhen. Int. J. Environ. Res. Public Health 2023, 20, 3821. [Google Scholar] [CrossRef] [PubMed]
- Friedman, J.H. Greedy Function Approximation: A Gradient Boosting Machine. Ann. Stat. 2001, 29, 1189–1232. [Google Scholar] [CrossRef]
- Gong, Y.; Han, S.; Yang, J. Study on the Coupling and Coordination Degree of Virtual and Real Space Heat in Coastal Internet Celebrity Streets. ISPRS Int. J. Geo-Inf. 2025, 14, 407. [Google Scholar] [CrossRef]
- Wang, X.; Zhu, R.; Che, B. Spatial Optimization of Tourist-Oriented Villages by Space Syntax Based on Population Analysis. Sustainability 2022, 14, 11260. [Google Scholar] [CrossRef]
- Ouyang, J.; Fan, H.; Wang, L.; Zhu, D.; Yang, M. Revealing Urban Vibrancy Stability Based on Human Activity Time-Series. Sustain. Cities Soc. 2022, 85, 104053. [Google Scholar] [CrossRef]
- Huang, J.; Obracht-Prondzynska, H.; Kamrowska-Zaluska, D.; Sun, Y.; Li, L. The Image of the City on Social Media: A Comparative Study Using “Big Data” and “Small Data” Methods in the Tri-City Region in Poland. Landsc. Urban Plan. 2021, 206, 103977. [Google Scholar] [CrossRef]
- Huang, Y.; Zheng, B. Social Media Users’ Visual and Emotional Preferences of Internet-Famous Sites in Urban Riverfront Public Spaces: A Case Study in Changsha, China. Land 2024, 13, 930. [Google Scholar] [CrossRef]
- Zhou, X.; Chen, J. Seasonal Variations in the Mechanisms Linking the Built Environment and Metro Station Area Vitality in Cold Regions: A Case Study of Harbin. Land 2025, 14, 2222. [Google Scholar] [CrossRef]
- Wengel, Y.; Ma, L.; Ma, Y.; Apollo, M.; Maciuk, K.; Ashton, A.S. The TikTok Effect on Destination Development: Famous Overnight, Now What? J. Outdoor Recreat. Tour. 2022, 37, 100458. [Google Scholar] [CrossRef]
- Xu, H.; Lovett, J.C.; Law, R. Understanding Destination Value Co-Creation on Social Media: An Application of Travel Blog Analysis. Tour. Hosp. 2022, 3, 573–588. [Google Scholar] [CrossRef]
- Bernabeu-Bautista, Á.; Serrano-Estrada, L.; Perez-Sanchez, V.R.; Martí, P. The Geography of Social Media Data in Urban Areas: Representativeness and Complementarity. ISPRS Int. J. Geo-Inf. 2021, 10, 747. [Google Scholar] [CrossRef]
- Zabelskyte, G.; Kabisch, N.; Stasiskiene, Z. Patterns of Urban Green Space Use Applying Social Media Data: A Systematic Literature Review. Land 2022, 11, 238. [Google Scholar] [CrossRef]
- Boeker, M.; Urman, A. An Empirical Investigation of Personalization Factors on TikTok. In Proceedings of the ACM Web Conference 2022, Lyon, France, 25 April 2022; Association for Computing Machinery: New York, NY, USA, 2022; pp. 2298–2309. [Google Scholar]





| Year | Data Source | Ranking Name | Ranking | Feature Description |
|---|---|---|---|---|
| 2020 | 21st Century Business Herald & 21 Finance App | China’s Trending Economy: 2020 Top 100 Influential Cities Ranking | 33 | In the early stages of online popularity, attention levels remain relatively low. |
| 2021 | 21st Century Business Herald & 21 Finance App | China’s Trendy Economy: 2021 Top 100 Influential Cities Ranking | 31 | Online attention is limited, with relatively stable engagement levels. |
| 2022 | 2022 National Tourism City Brand Influence Report | 2022 Top 100 Cities for Tourism | 60 | The indicators lean toward tourism brand communication, resulting in a relative decline in rankings. |
| 2023 | Ouwei Data | 2023 China’s Top 20 Influential Cities Index | 13 | Online popularity has surged significantly, ranking among the top 20 nationwide. |
| 2024 | Ouwei Data | 2024 China’s Most Influential Cities Ranking | 9 | Its popularity continues to rise, ranking among the top 10 nationwide. |
| 2025 | The Beijing News | 2025 Long-Term Popularity Ranking of Viral Cities | 4 | Online influence continues to grow, with popularity surging. |
| Type | TikTok Check-In POI | Gaode Maps POI |
|---|---|---|
| Tourist attractions | (6) Botanical garden, aquarium, user-generated attractions, scenic spots, zoo, tourist attractions | (7) Religious sites, tourist attractions, botanical gardens, zoos, memorial halls, parks and plazas, scenic spots |
| Cuisine | (20) Buffet, Cantonese cuisine, beverages, music restaurant, western cuisine, barbecue, Japanese cuisine, theme restaurant, bread and pastries, fast food and snacks, grilled meat, hot pot, Korean cuisine, seafood, Southeast Asian cuisine, Northeastern Chinese cuisine, skewered hot pot, Sichuan cuisine, Shanghai-style Jiangsu–Zhejiang cuisine, Russian cuisine | (10) Chinese restaurants, casual dining establishments, ice cream shops, coffee shops, foreign restaurants, fast-food restaurants, dessert shops, bakeries, tea houses, food and beverage-related venues |
| Shopping | (5) Specialty stores, commercial streets, retail stores and supermarkets, department stores, shopping malls | (10) Specialty stores, convenience stores, shopping malls, retail centers, electronics and home appliances stores, pawnshops, auction houses, commercial streets, markets, department stores and supermarkets |
| Leisure and entertainment | (14) Fitness centers, entertainment venues, amusement parks, bathhouses and massage parlors, internet cafes, board and card game establishments, activity centers, escape rooms, photography and travel photography services, bars, vacation resorts and spas, movie theaters, fruit-picking farms, parks and plazas | (17) Recreational venues, fishing parks, water activities, amusement parks, fruit-picking gardens, campgrounds, karaoke and dance entertainment, nightclubs, card and board game rooms, internet cafes, arcades, bars, health resorts and vacation spots, theaters, concert halls, sports stadiums, sports service facilities |
| Culture | (7) Exhibition halls, concert halls, libraries, art galleries, theaters, museums, cultural and creative centers | (10) Convention and exhibition center, museum, library, planetarium, exhibition hall, cultural palace, performing arts troupe, archives, science and technology museum, art museum |
| Comparison Weight Scheme | Max | Min | Mean |
|---|---|---|---|
| 8:2 | 0.984 | 0.9528 | 0.9743 |
| 6:4 | 0.992 | 0.9811 | 0.9852 |
| Weekly Serial Number | Summer Time Period (2024) | Winter Time Period (2024–2025) |
|---|---|---|
| Week 1 | 1 Jul (Mon)–7 Jul (Sun) | 2 Dec (Mon)–8 Dec (Sun) |
| Week 2 | 8 Jul (Mon)–14 Jul (Sun) | 9 Dec (Mon)–15 Dec (Sun) |
| Week 3 | 15 Jul (Mon)–21 Jul (Sun) | 16 Dec (Mon)–22 Dec (Sun) |
| Week 4 | 22 Jul (Mon)–28 Jul (Sun) | 23 Dec (Mon)–29 Dec (Sun) |
| Week 5 | 29 Jul (Mon)–4 Aug (Sun) | 30 Dec (Mon)–5 Jan (Sun) |
| Week 6 | 5 Aug (Mon)–11 Aug (Sun) | 6 Jan (Mon)–12 Jan (Sun) |
| Week 7 | 12 Aug (Mon)–18 Aug (Sun) | 13 Jan (Mon)–19 Jan (Sun) |
| Week 8 | 19 Aug (Mon)–25 Aug (Sun) | 20 Jan (Mon)–26 Jan (Sun) |
| Category | Indicators | Definition | Interpretation |
|---|---|---|---|
| Centrality-based location indicator | Distance to activity center (tourism) | Euclidean distance from a grid cell to the weighted centroid of a given POI category (m) | Measure the spatial distance between a grid cell and the nearest activity center, reflecting accessibility to core functional nodes |
| POI count indicators | Catering facility count, leisure facility count, cultural facility count, shopping facility count, and tourist attraction count | POI count within a grid cell (25 ha) | Quantify the functional scale and service capacity of a node by counting the number of POIs of specific categories within a grid |
| Functional dominance indicators | Functional dominance | Ratio of the count of the most frequent POI category to the total POI count within a grid cell (%) | Measure whether a single function dominates within a grid by comparing the proportion of one POI category to the total number of POIs |
| Functional composition dissimilarity indicators | Functional composition dissimilarity (culture), functional composition dissimilarity (shopping) | Using the total number of a given POI category in the central grid cell and all grid cells within its 750 m neighborhood as the denominator, the absolute difference between the proportion of that POI category in the central grid cell and the proportion in the neighboring grid cells (unitless) | Quantify the compositional difference of a specific function between a grid cell and its surrounding 3 × 3 neighborhood, describing the inconsistency in functional distribution between the cell and its surrounding area |
| Neighborhood relative density indicators | Tourism density ratio, cultural density ratio | Ratio of the number of a given POI category within a grid cell to the average number of the same POI category within its 750 m neighborhood (unitless) | Evaluate the degree of local concentration of POIs within a grid relative to its surrounding area |
| Ring-based spatial gradient indicators | Shopping ring gradient, leisure ring gradient, tourist ring gradient | Calculation of the ratio of the difference in the number of a given POI category between the outer ring (750–1250 m) and the core ring (0–750 m) centered on a grid cell to the total number of the two rings (unitless) | Capture spatial variation in POI density between inner and outer buffers, reflecting core–periphery differentiation |
| Functional synergy indicators | Functional synergy (culture–leisure), functional synergy (tourism–leisure) | Calculation of the ratio of the square root of the product of the counts of two POI categories within the same grid cell to the total POI count within that grid cell (unitless) | Measure the degree of co-location and interaction between different functional categories within a grid |
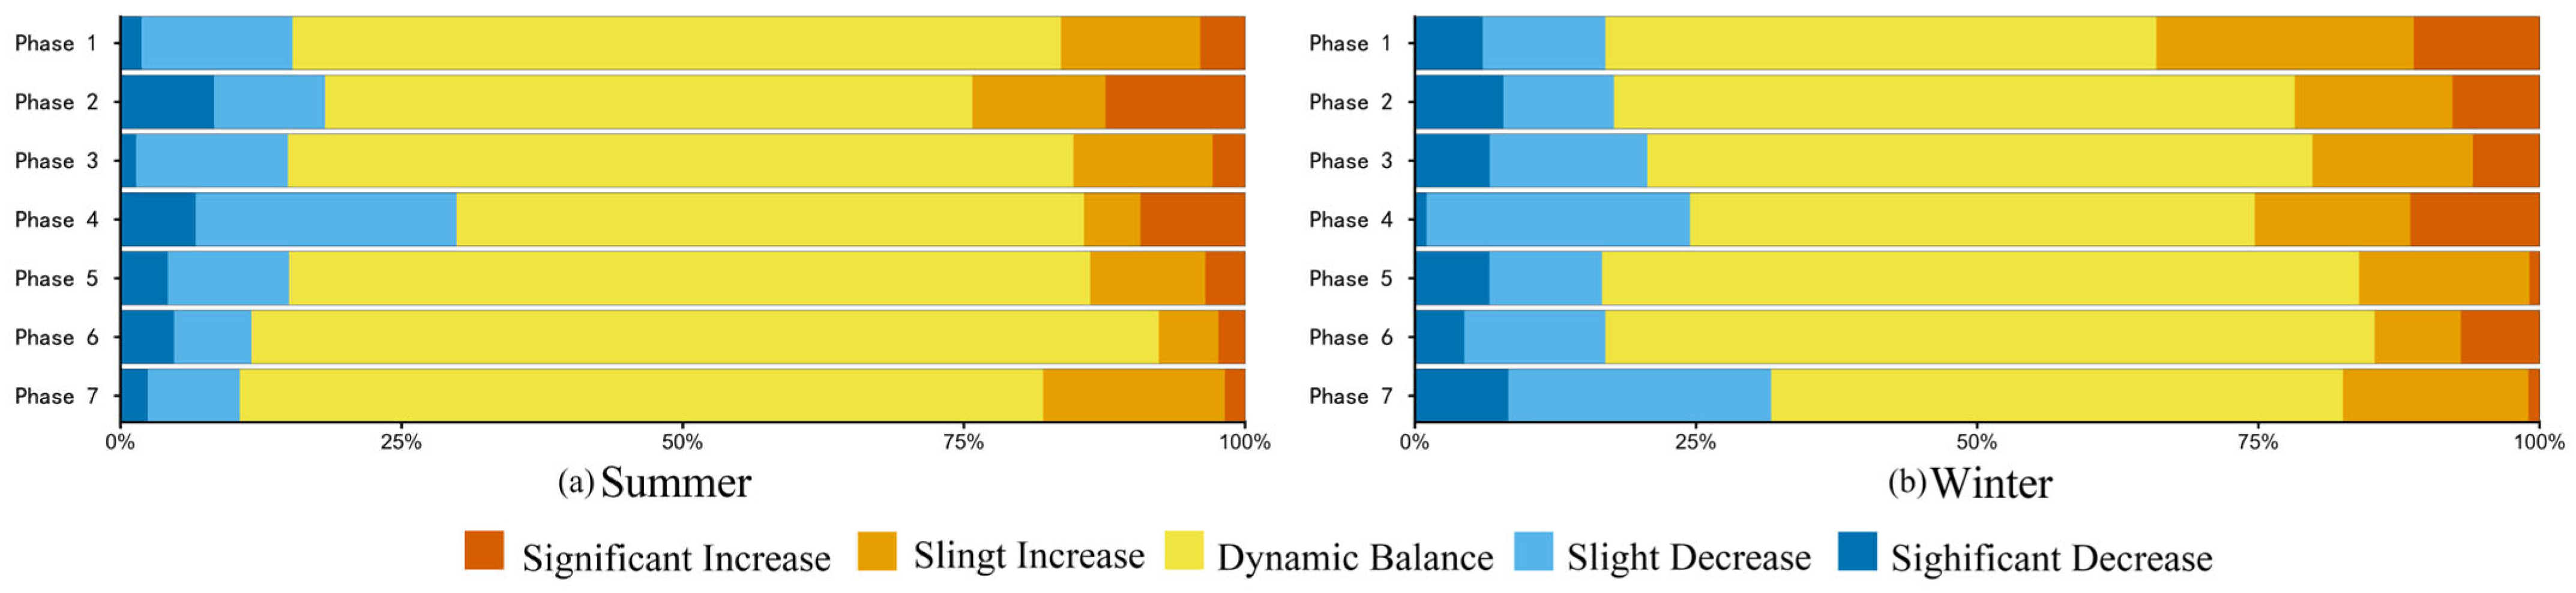
| Change Phase | Summer Difference Interval (Week t–Week t − 1) | Winter Difference Interval (Week t–Week t − 1) |
|---|---|---|
| 1 | 8 Jul–14 Jul → 1 Jul–7 Jul | 9 Dec–15 Dec → 2 Dec–8 Dec |
| 2 | 15 Jul–21 Jul → 8 Jul–14 Jul | 16 Dec–22 Dec → 9 Dec–15 Dec |
| 3 | 22 Jul–28 Jul → 15 Jul–21 Jul | 23 Dec–29 Dec → 16 Dec–22 Dec |
| 4 | 29 Jul–4 Aug → 22 Jul–28 Jul | 30 Dec–5 Jan → 23 Dec–29 Dec |
| 5 | 5 Aug–11 Aug → 29 Jul–4 Aug | 6 Jan–12 Jan → 30 Dec–5 Jan |
| 6 | 12 Aug–18 Aug → 5 Aug–11 Aug | 13 Jan–19 Jan → 6 Jan–12 Jan |
| 7 | 19 Aug–25 Aug → 12 Aug–18 Aug | 20 Jan–26 Jan → 13 Jan–19 Jan |
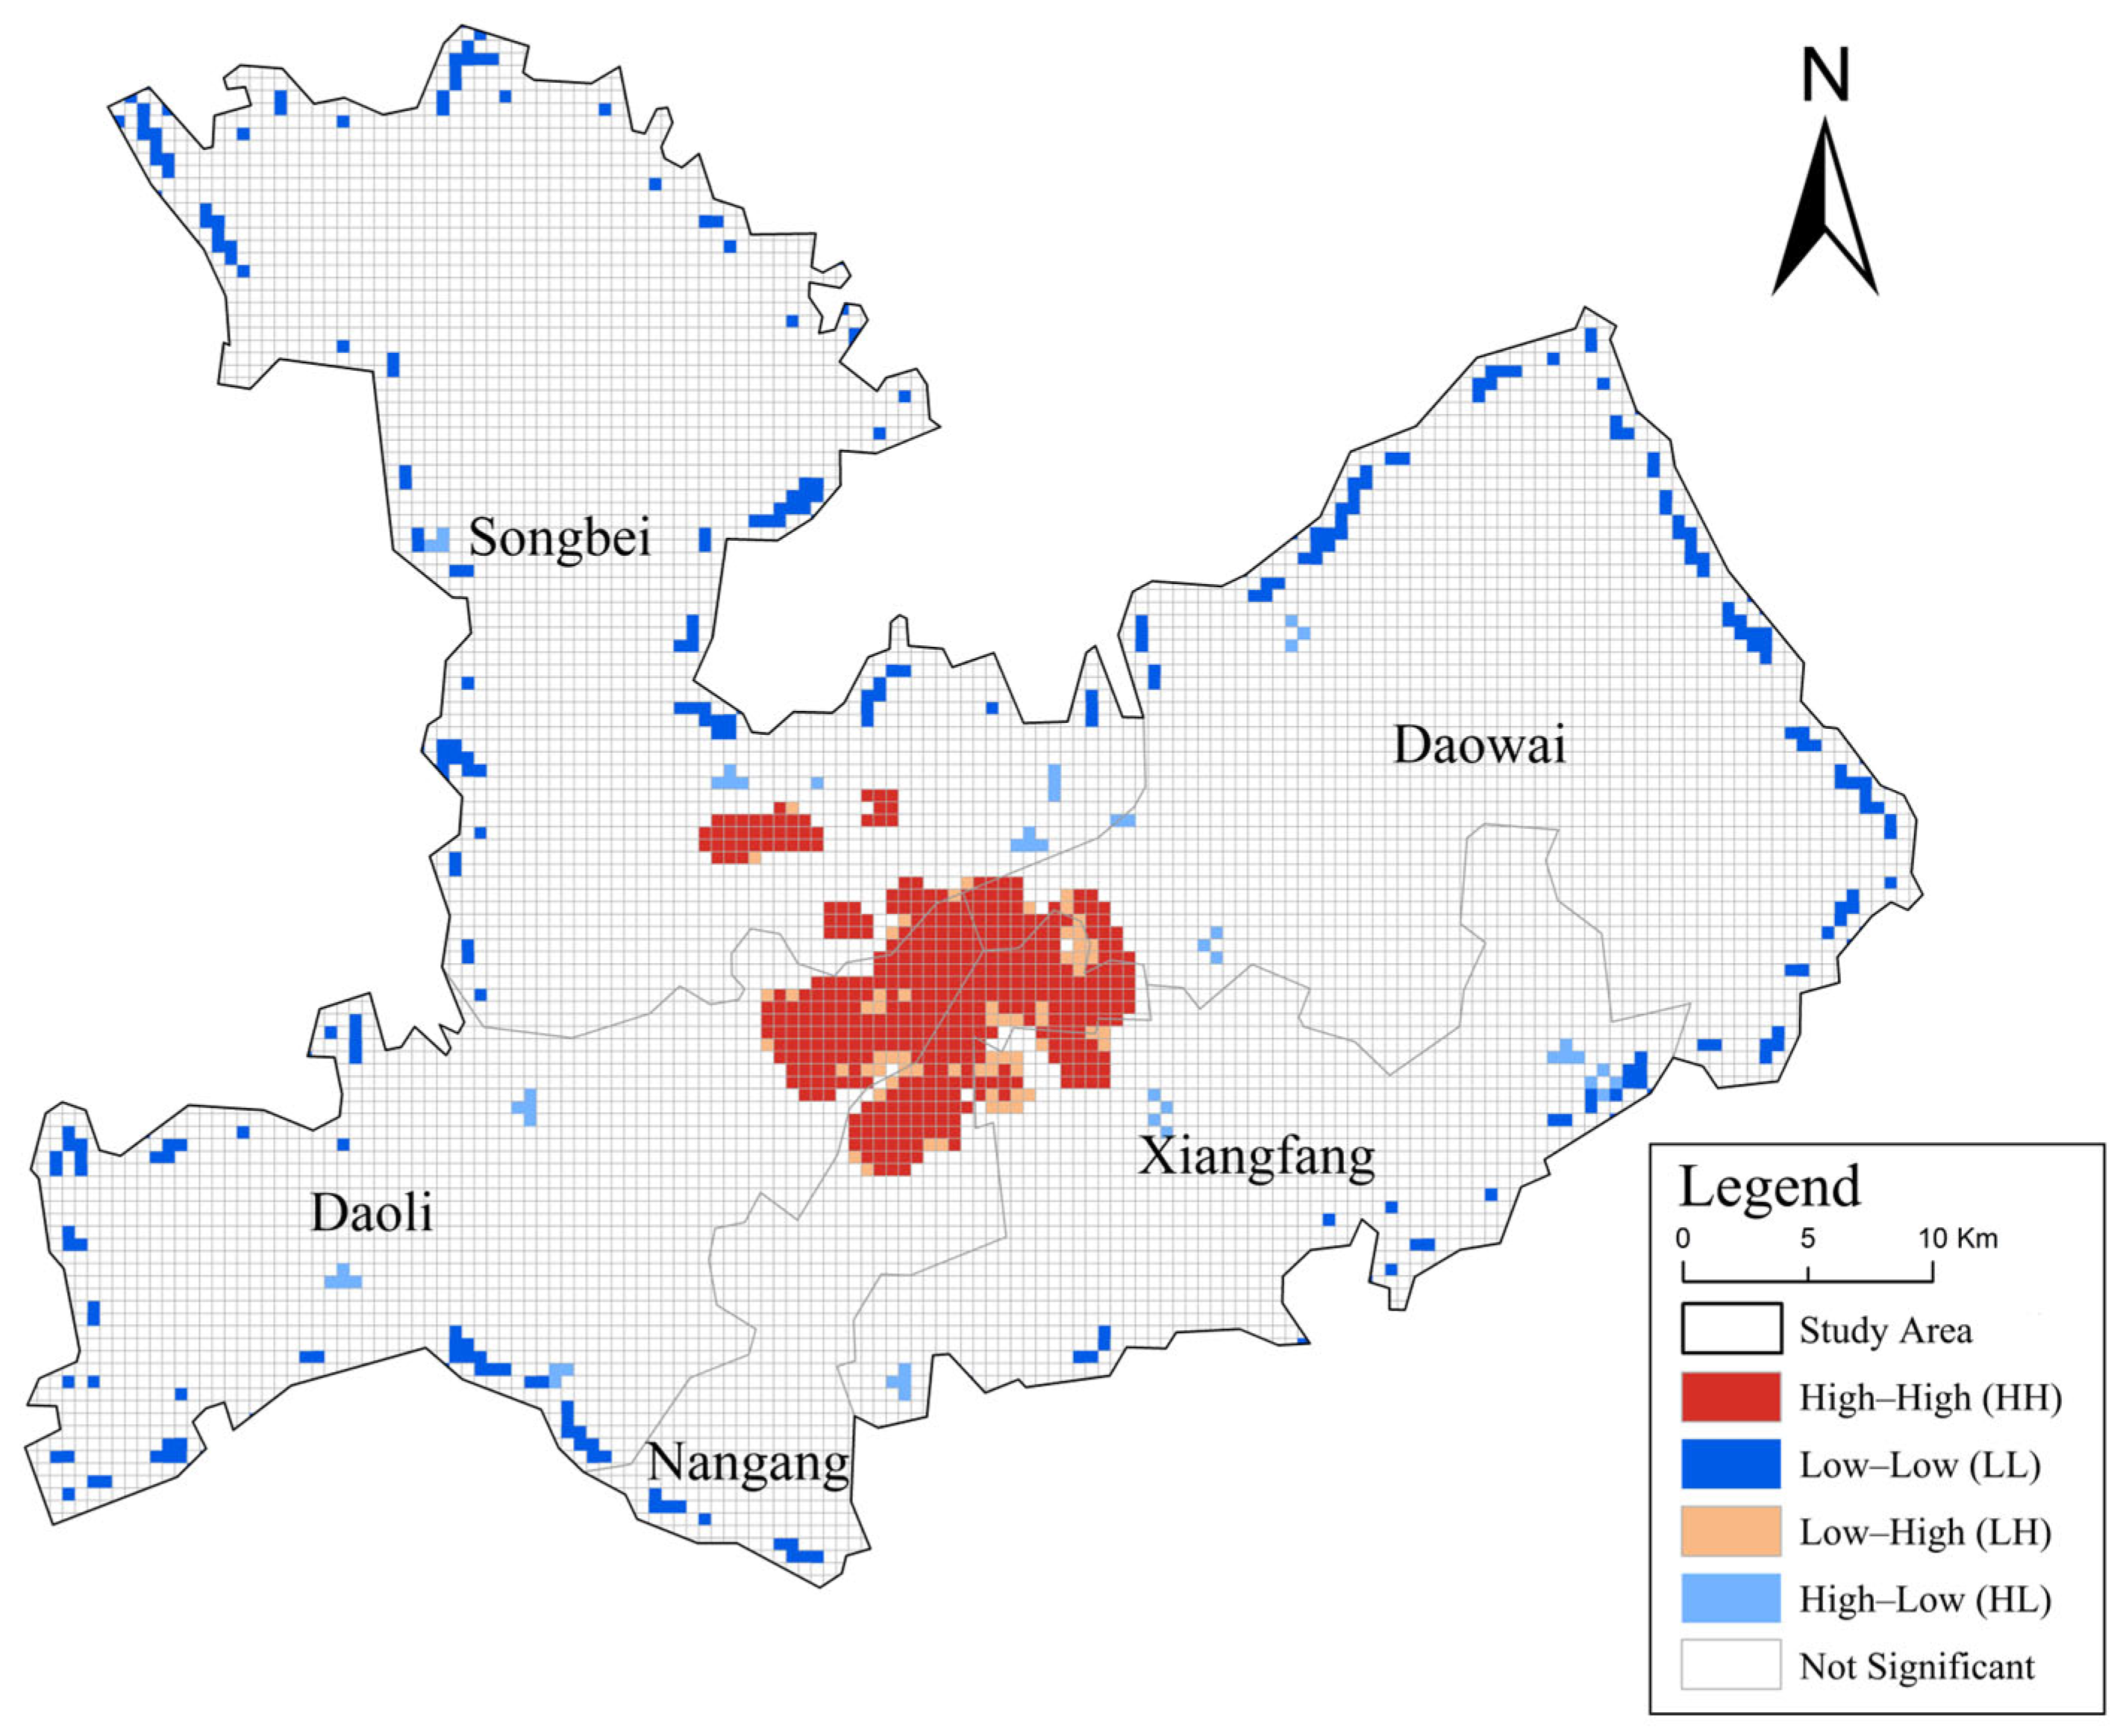
| Bivariate LISA Type | Spatial Category | Number of Grids | Proportion (%) |
|---|---|---|---|
| HH | high-vitality stable zones | 422 | 48.84 |
| LH | vitality-enhancing zones | 62 | 7.18 |
| HL | vitality-declining zones | 50 | 5.79 |
| LL | low-vitality stable zones | 330 | 38.19 |
| Model | Dataset | AUC | Precision | Recall | F1-score | Accuracy |
|---|---|---|---|---|---|---|
| LGBM | Train | 0.9465 | 0.875 | 0.943 | 0.907 | 0.906 |
| LGBM | Test | 0.9325 | 0.866 | 0.921 | 0.892 | 0.891 |
| RF | Train | 0.9739 | 0.871 | 0.980 | 0.922 | 0.919 |
| RF | Test | 0.9387 | 0.873 | 0.984 | 0.925 | 0.922 |
Disclaimer/Publisher’s Note: The statements, opinions and data contained in all publications are solely those of the individual author(s) and contributor(s) and not of MDPI and/or the editor(s). MDPI and/or the editor(s) disclaim responsibility for any injury to people or property resulting from any ideas, methods, instructions or products referred to in the content. |
© 2026 by the authors. Licensee MDPI, Basel, Switzerland. This article is an open access article distributed under the terms and conditions of the Creative Commons Attribution (CC BY) license.
Share and Cite
Gong, Z.; Jiao, H. High-Vitality Stability Characteristics and Nonlinear Mechanisms of Urban Virtual Vitality: Evidence from Five Urban Districts in Harbin, China. Land 2026, 15, 654. https://doi.org/10.3390/land15040654
Gong Z, Jiao H. High-Vitality Stability Characteristics and Nonlinear Mechanisms of Urban Virtual Vitality: Evidence from Five Urban Districts in Harbin, China. Land. 2026; 15(4):654. https://doi.org/10.3390/land15040654
Chicago/Turabian StyleGong, Zhu, and Hong Jiao. 2026. "High-Vitality Stability Characteristics and Nonlinear Mechanisms of Urban Virtual Vitality: Evidence from Five Urban Districts in Harbin, China" Land 15, no. 4: 654. https://doi.org/10.3390/land15040654
APA StyleGong, Z., & Jiao, H. (2026). High-Vitality Stability Characteristics and Nonlinear Mechanisms of Urban Virtual Vitality: Evidence from Five Urban Districts in Harbin, China. Land, 15(4), 654. https://doi.org/10.3390/land15040654