1. Introduction
Renewable energy sources, especially solar energy, have evolved throughout the 21st century as a key solution to the environmental and economic challenges posed by the reliance on fossil fuels. The increasing population growth and rising energy requirements have heightened the urgency of transitioning to sustainable energy sources [
1,
2]. Solar energy has the potential to be a sustainable source of energy due to its clean, accessible nature and global abundance [
3]. Therefore, solar energy not only reduces greenhouse gas emissions but also increases national energy independence.
On the other hand, as civilizations strive for a cleaner, more sustainable energy future, identifying and prioritizing viable energy sources becomes essential [
4].
Although the transition to sustainable energy is a global need, the regional specificities of each area must be considered. The variability in energy requirements, the diversity of environmental challenges, and the complexity of regional specifics require a more nuanced approach [
5]. It is therefore crucial to understand these regional complexities so that tailored strategies can be developed that not only meet the region’s energy requirements but also align with its environmental and socio-economic objectives [
6].
Iran is located in the global solar belt (between latitudes 25° and 40° N) and receives annual solar irradiation of 1800–2200 kWh/m
2, with more than 280 sunny days per year, making it one of the best locations for solar energy use. However, despite this considerable potential for solar energy, the share of solar energy in Iran’s total electricity production was less than 1% in 2024, primarily due to the significant fossil fuel subsidy, the lack of adequate policy frameworks, limited financing options, and the supply-driven model of planning that prioritizes generation capacity over the proximity of demand [
7]. South Khorasan Province, located in the east of Iran, illustrates this paradox: it has one of the highest levels of solar irradiation in the country (reaching up to 2300 kWh/m
2/yr) and it contains large areas of unused desert land; however, the installed solar capacity in South Khorasan is negligible (less than 50 MW in 2024). Previous national- and provincial-scale studies in Iran that assessed the potential for solar energy in the country employed a technical-only, irradiance-based approach and mapped solar energy potential without accounting for spatial differences in electricity demand, population density, or economic viability [
8]. Consequently, proposed solar energy projects are typically located far from load centers, resulting in high transmission losses, poor returns on investment, and the underuse of solar energy’s potential.
The growing international literature indicates the importance of regional prioritization for renewable energy projects based on demand characteristics. Studies conducted in China, India, and Saudi Arabia demonstrated that the integration of energy consumption patterns with resource maps can reduce the costs associated with grid connection by 15–30%, improve the project bankability [
9,
10]. Several studies have used GIS-based suitability analyses at the national or single-province level [
11,
12,
13]. There is currently no study that has carried out a county-level prioritization of solar energy development in South Khorasan that simultaneously considers solar irradiation, population, and sectoral electricity demand (domestic, industrial, and agricultural) within a multi-criteria decision-making (MCDM) framework. This research gap is relevant because South Khorasan exhibits extreme spatial heterogeneity: urban centers such as Birjand account for more than 40% of the province’s electricity demand, whereas vast rural and desert counties have an electricity consumption of less than 5% despite higher irradiation levels. Without demand-sensitive investment prioritization, they risk being allocated to low-consumption areas, thereby delaying the province’s contribution to Iran’s 2030 renewable energy target of 10 GW of solar capacity. The main research question of this study is as follows: How can the development of solar energy be spatially prioritized across the counties of South Khorasan Province, taking into account both resource availability and actual energy demand? According to the research hypothesis, the primary goal of this study is to develop and implement an integrated GIS-MARCOS framework for ranking the 11 counties of South Khorasan based on their suitability and priority for photovoltaic development. The specific goals of this study are threefold: (i) to quantify and map the spatial variations in solar irradiation and sectoral electricity consumption, (ii) to calculate the objective criteria weights using Shannon’s Entropy, (iii) to obtain a demand-driven priority ranking using the MARCOS method. Based on the research hypothesis, we assume that, contrary to conventional irradiation-based approaches, countries with a greater population density and per capita domestic electricity consumption will be ranked as the top priorities, even though their solar irradiation is slightly lower than that in distant desert areas. The demand-driven methodology proposed in this study enables a shift in planning from a supply-based to a demand-based paradigm. This research provides policymakers, provincial authorities, and private investors with a scientifically valid roadmap for directing investments to major load centers. The proposed framework is reproducible across all other Iranian provinces and arid regions worldwide with similar resource–demand mismatches, which could lead to reduced losses, improved grid stability, and the accelerated penetration of clean energy.
This paper is also one of the few papers that incorporates demand-based variables (e.g., population, sectoral demand) into a GIS-based multi-criteria spatial analysis (MARCOS), whereas most other papers focus almost entirely on solar irradiance or similar supply-side factors.
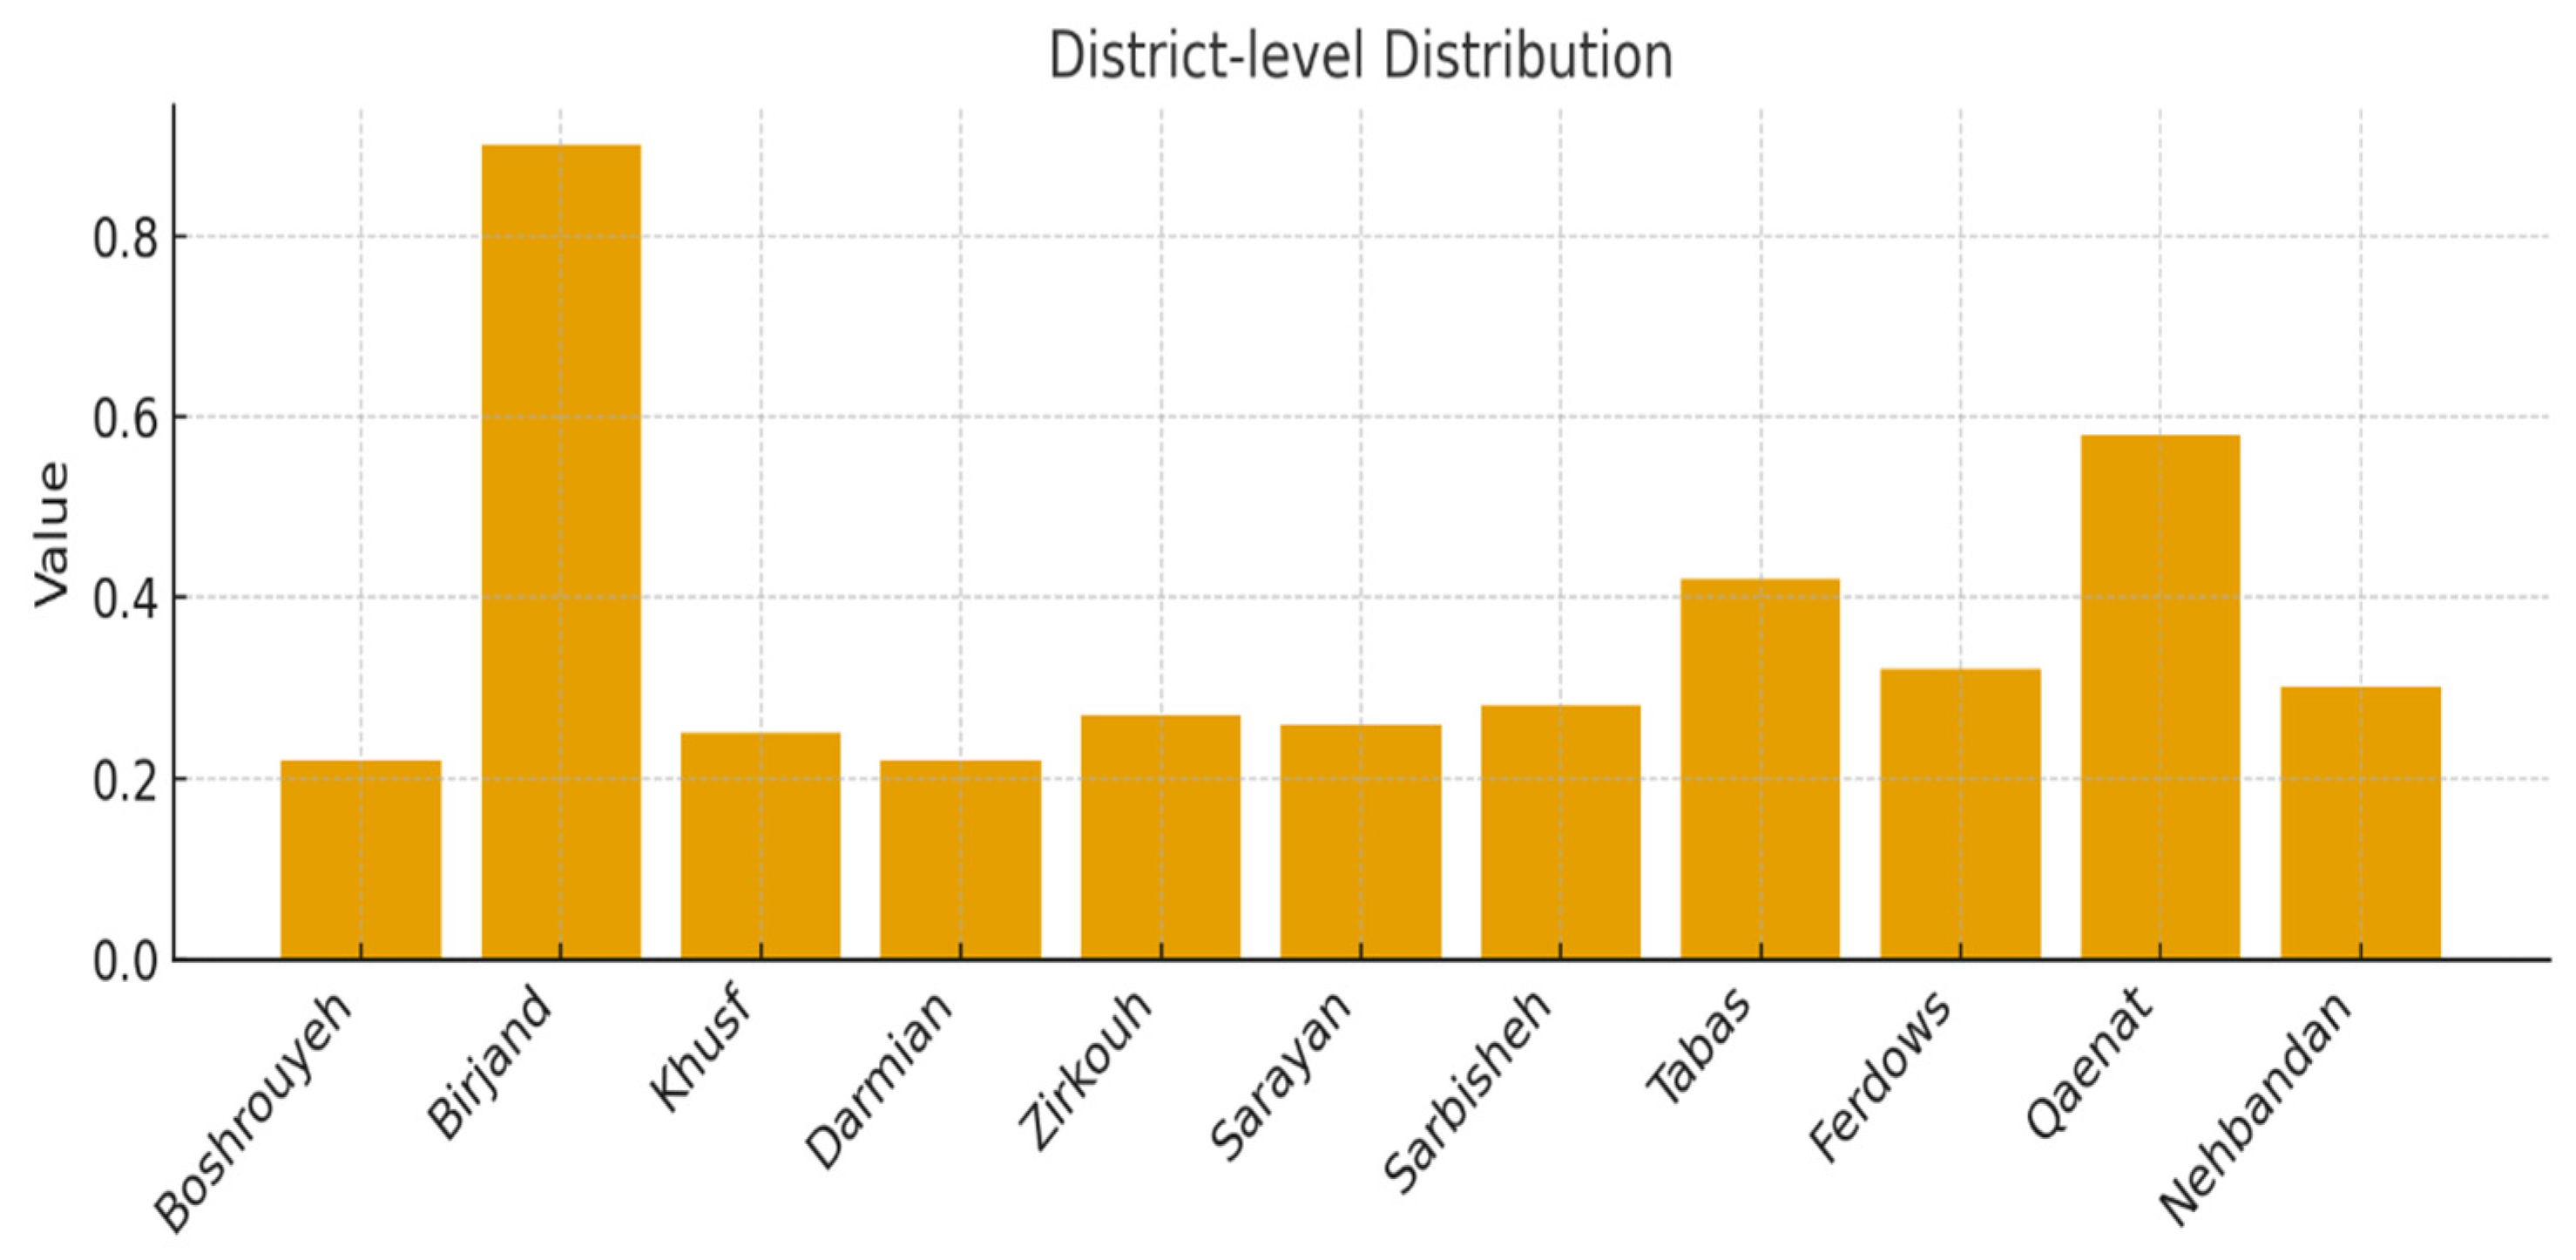
As a result, this research supports a shift from strictly resource-focused renewable energy planning to more demand-oriented approaches in areas with substantial regional disparities in electricity demand. Moreover, this research shows how entropy-based weights can be used to integrate demand and supply factors together in a manner that reflects the relative uncertainty associated with each factor. The research results indicate that when using entropy-based objective weights, per capita residential electricity consumption is the primary driver of the prioritization process. This indicates that in regions with significant differences in electricity demand, proximity to demand is likely to have a greater influence on investment priorities than small differences in solar irradiance.
The five largest gaps based on the previous evaluation can be defined as follows, with regard to one of Iran’s most high-solar-irradiated and thus least-developed solar energy regions—South Khorasan Province:
The absence of any county-based studies to date prevents prioritized regional allocation based on an assessment of each county’s available solar resources. There is no use of the MARCOS method in the literature related to the selection of sites for solar energy development in Iran, although this methodology has already been shown to have utility in other locations [
14] as well as being recognized throughout the scientific community for its ability to provide stable rankings and resist rank reversals [
15]. In addition, there is a genuine need for a demand-driven ranking system to guide the provincial investment plan and reduce transmission energy losses. There is currently no quantitative analysis of the influence of per capita domestic energy consumption on decisions regarding the location of new energy developments, even in high-irradiance desert counties with very small populations. Additionally, there is no incorporation of real-sector electricity demand as a first criterion for selecting a site, alongside irradiance, at the sub-provincial level—a procedure now commonly used in leading international studies conducted in arid and semi-arid environments. To the best of the authors’ knowledge, this is the first time in the Iranian literature that an attempt has been made to provide answers to all the aforementioned gaps simultaneously as part of the following new developments and contributions:
The development of the first county-level, mandate-driven prioritization system for the development of solar PV systems throughout the eleven counties of South Khorasan Province.
The first novel integration of Shannon’s Entropy weighting with the robust and rank stable MARCOS method in a full GIS environment—a methodological combination that has never previously been reported in any Iranian renewable energy research.
The first empirical validation in Iran of the increasingly well-supported hypothesis that population-weighted per capita domestic electricity consumption will exceed the irradiance benefits in arid regions, thereby aligning Iranian research with the most recent international evidence [
16].
Provides a directly actionable ranking system for use by provincial authorities, SATBA, and private sector investors, with significant influence over the forthcoming review of South Khorasan’s Renewable Energy Roadmap and national 2030 targets.
Presents a transparent, easy-to-replicate methodology that could be applied to other sunbelt provinces in Iran and similar arid regions in the Middle East, Central Asia, and North Africa.
Although some restrictions remain (notably the use of the currently available provincial statistical yearbooks and the lack of hourly demand profiles), the proposed framework undoubtedly constitutes a major paradigm shift from the conventional irradiance-dominated planning approach to a much more economically rational, grid-efficient, and policy-relevant planning paradigm.
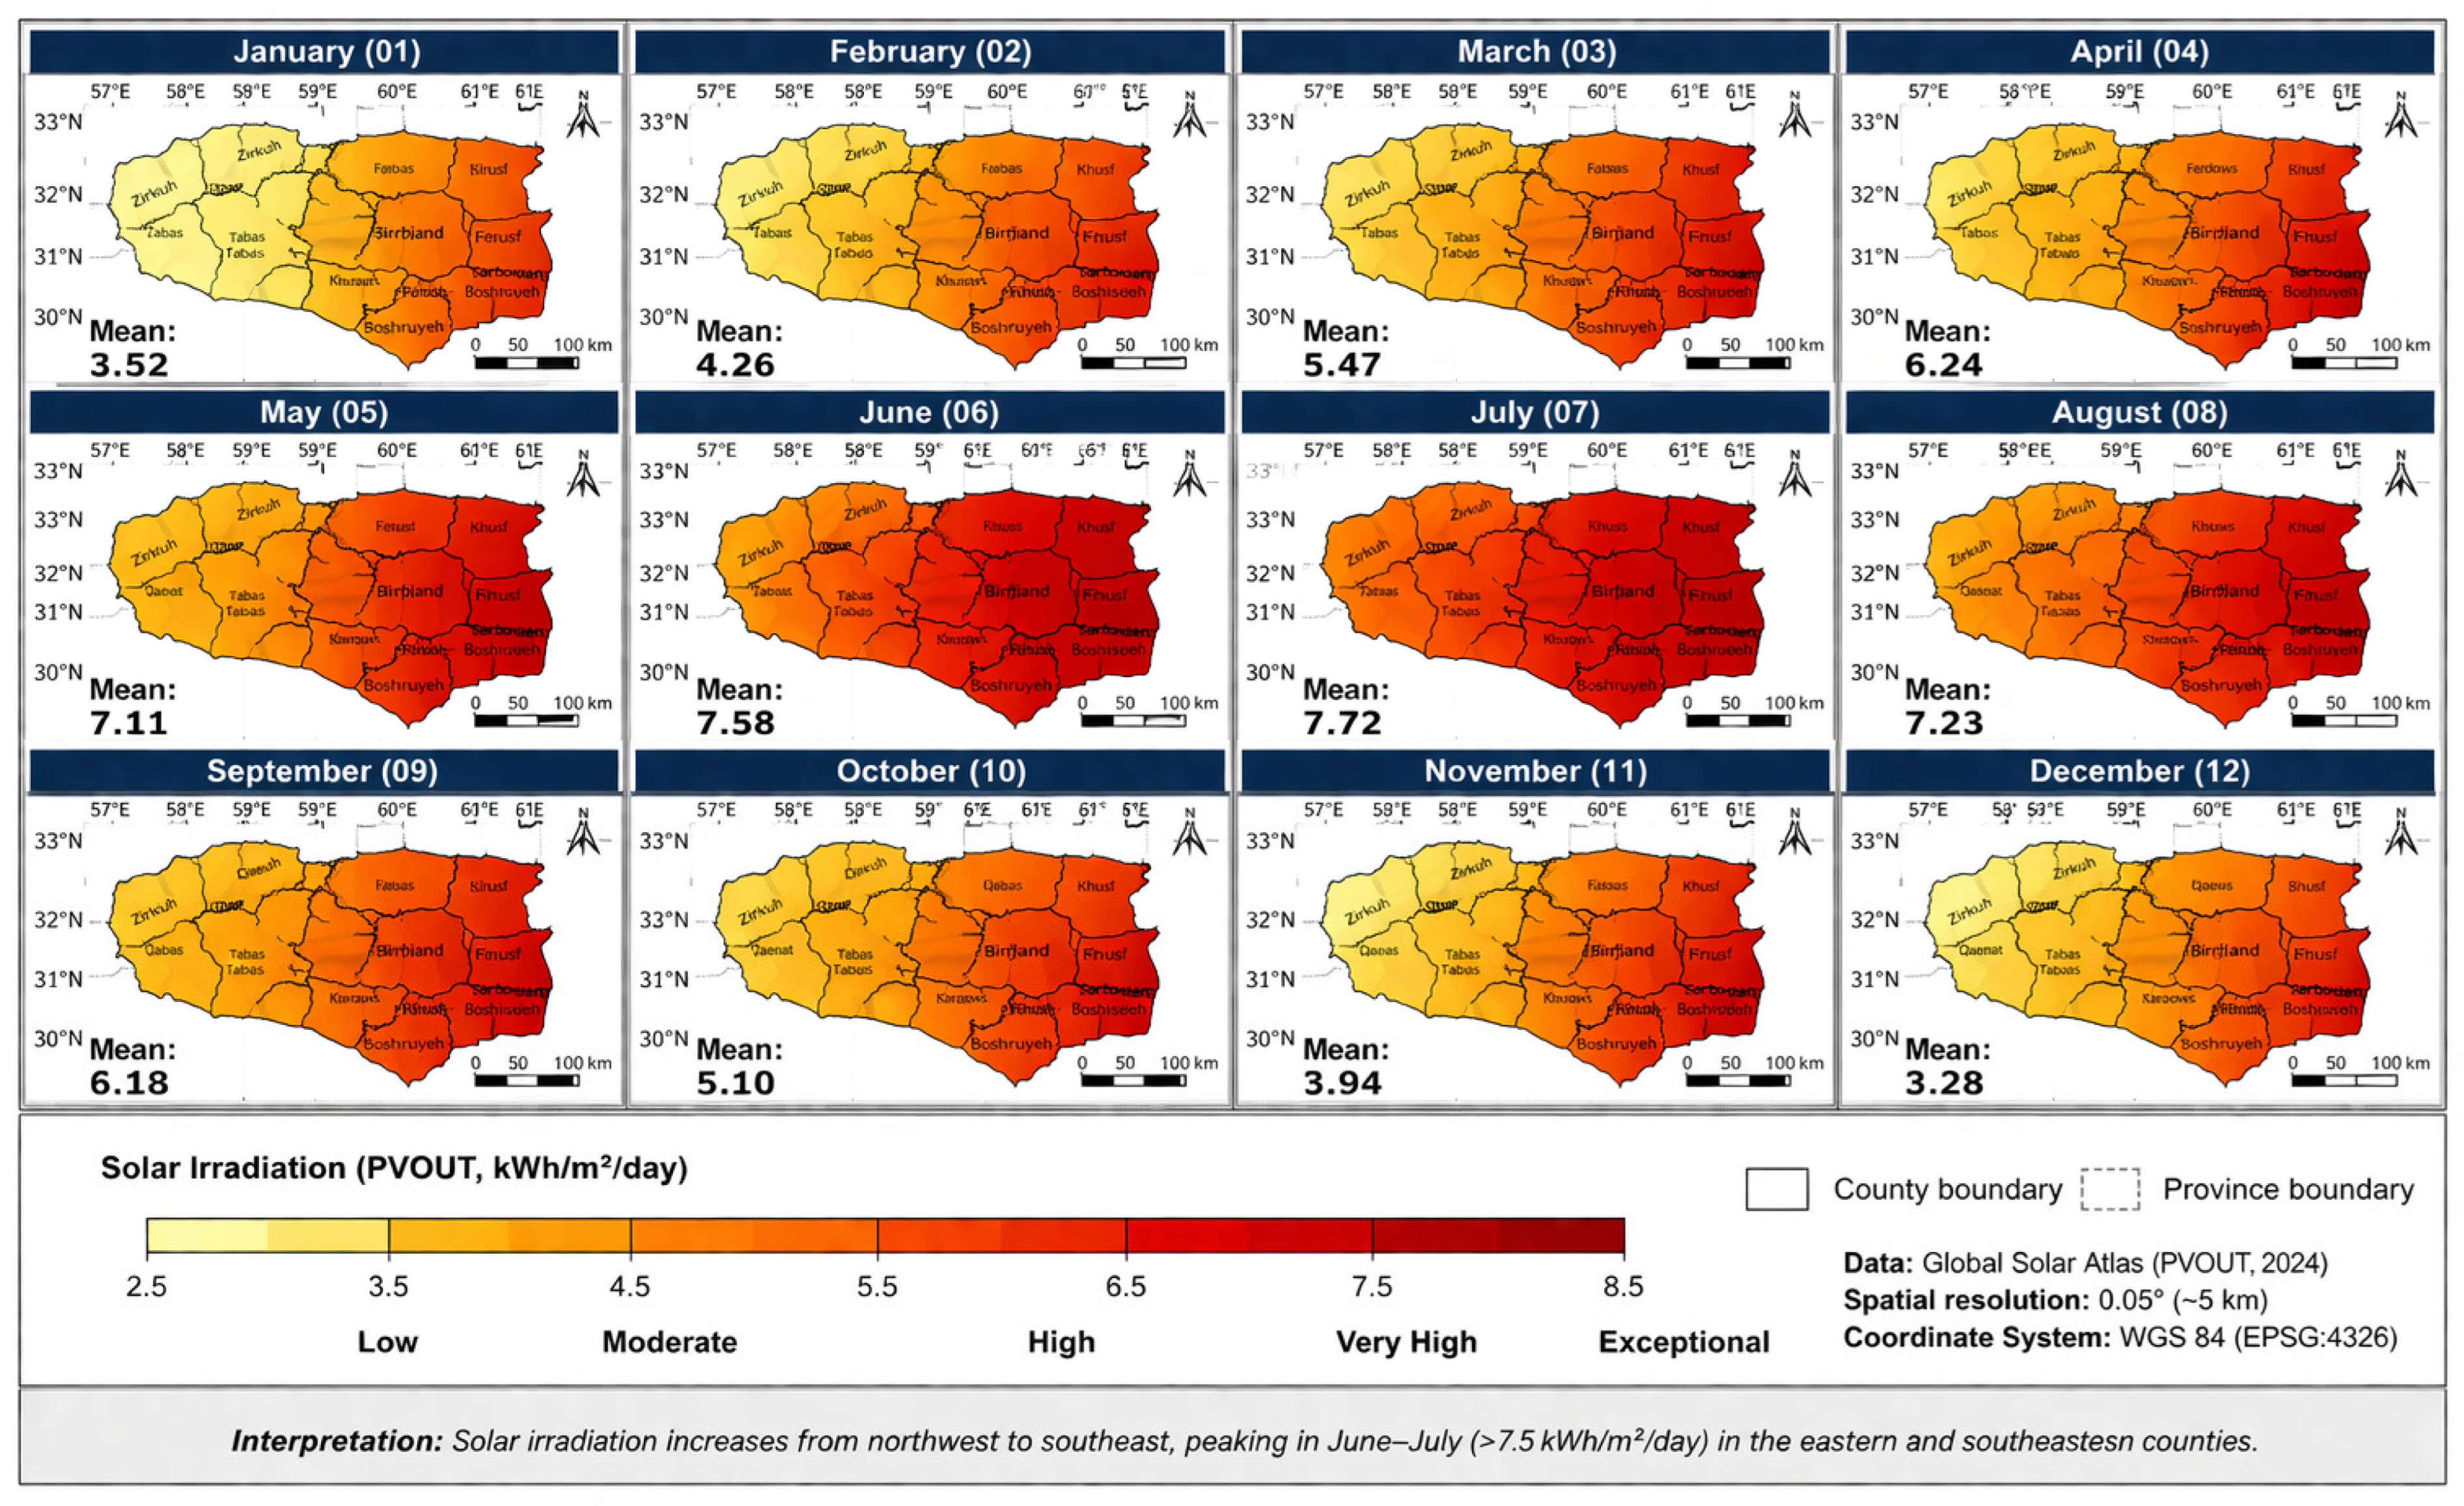
The Photovoltaic Power Potential (PVOUT) data from the Global Solar Atlas has been used to determine the potential for using solar power. PVOUT represents the amount of energy generated as kilowatts per year per kilowatt. PVOUT is a commonly used expression in solar resource assessments. PVOUT is a representation of the expected total yearly electricity generation from a traditional photovoltaic array based on the climatic conditions of the area.
2. Literature Review and Gap Analysis
The growing need for energy worldwide has led many people to question how we generate it [
17]. Most researchers agree that we must transition from finite resources like fossil fuels to clean, renewable energy sources [
18]. This is especially true given the growing concern around the environment and the increasing need for energy [
19]. In addition to the benefits of using renewable energy, such as reducing greenhouse gas emissions and decreasing the reliance on foreign energy sources, one type of renewable energy is gaining popularity: solar power [
20]. Demand-oriented solar planning is also possible within a broader body of knowledge on energy system planning and spatial energy economics [
21]. Spatially oriented integrated resource planning (IRP), which has been widely used in the electric power industry’s planning process, focuses on integrating new supply resources with the spatial pattern of demand to minimize total system costs and capital requirements [
22]. Likewise, spatial energy economics emphasizes locating generation assets near areas of high consumption to reduce energy losses during transmission, improve grid stability, and ultimately increase the overall efficiency of the system [
23]. When it comes to developing renewable energy, IRP implies that solar investments should be determined not only by the availability of solar resources but also by the spatial distribution of electrical energy demand [
24]. Therefore, the demand-focused methodology employed in this research project is consistent with the broader planning traditions of IRP and related methodologies by considering both the solar resource potential and regional consumption patterns to efficiently allocate renewable energy infrastructure across territories [
25].
A number of recent international studies have highlighted the need for incorporating demand-related variables into renewable energy planning methodologies. Studies focusing on China, India, and several Middle East nations indicate that the placement of renewable energy generation near the areas of highest demand can result in an approximate reduction of 15–30% in energy transmission losses and an improvement in economic viability through reduced costs associated with connecting to the grid and infrastructure requirements [
26]. Additionally, studies have shown that demand-related methodologies can reduce the LCOE of distributed renewable energy systems by reducing the need for additional network expansion, thereby increasing energy utilization efficiency [
27]. As such, the findings of these studies further demonstrate the necessity of combining resource-based and demand-based variables when developing renewable energy systems to produce more efficient, economically viable systems [
28].
Solar Photovoltaics (PV) are a form of renewable energy that uses sunlight to produce electricity [
29]. Solar PV has become increasingly popular due to the availability of sunlight, the lack of pollution associated with electricity generation, and the decline in PV technology prices [
30]. Recently, international research has increased, shifting the paradigm from traditional irradiance-based methods to more complex demand-based methodologies [
31]. Similar results were reported by Nassar et al. [
14], who used GIS-integrated AHP-MARCOS in Egypt and found that, despite 83% of the land area being technically suitable for PV systems, only 23% remained economically viable when real consumption patterns were incorporated as the primary decision-making criterion. Saraswat et al. [
9] also noted that including electricity demand data increased project bankability by approximately 25%. These results indicate that neglecting the demand side of the equation can significantly overestimate the economic potential and lead to recommendations for locations that do not meet optimal conditions.
The significant advances reported in the literature on this subject, however, have yet to be reflected in the vast majority of studies examining Iran’s suitability for PV development. While the majority of studies have focused on a supply-oriented methodology, utilizing solar irradiation as the most important criterion, a number of recent Iranian studies [
32,
33] have similarly treated actual electricity consumption as simply an exclusionary layer or marginal weighting factor, but have failed to utilize it as the key driver in determining the relative importance of different geographic locations for PV development. Such simplifications have been shown in recent international studies to result in 30–40% overestimates of economic viability and recommendations of locations that suffer from high transmission loss and poor capacity factors.
In addition to the general lack of consideration for the demand side of the equation in Iranian studies, the methods used to evaluate and compare the suitability of different locations for PV development have almost exclusively employed subjective weighting techniques (AHP, ANP, Fuzzy-AHP). Objective entropy-based or CRITIC methods [
34,
35] have been employed in other countries but have yet to be adopted in Iran. Also, as in many international studies, Iranian analyses are often conducted at the national or provincial level. However, such scales mask important intra-provincial variability in population density and sectoral demand. Several international researchers [
36,
37,
38] have demonstrated that conducting analyses at sub-provincial scales provides a better understanding of regional differences in PV suitability. The recent emphasis on hybrid MCDM methods (e.g., DEA + FAHP + TOPSIS) aims to address a range of environmental, economic, and infrastructure issues when determining locations for solar energy infrastructure simultaneously [
39,
40,
41]. Some researchers have used AI and fuzzy MCDM methods to develop regional prioritization models incorporating GIS to select sites for renewable energy generation simultaneously [
42].
For example, ANFIS–FAHP–GIS models can be used to simultaneously evaluate environmental, economic, and spatial factors, thereby improving the accuracy and robustness of decisions on the placement of solar photovoltaic farms [
43].
The recent literature emphasizes the value of GIS–MCDM frameworks for assessing potential locations for renewable energy resources by integrating spatial constraints, technical potential, environmental impacts, and social and economic factors [
44].
These approaches will be very useful when designing integrated wind/solar systems with hydrogen energy storage systems within a multi-criteria decision environment.
The fuzzy MCDM models developed to address the issue of selecting locations for solar photovoltaic plants account for uncertainties in environmental and infrastructural data [
45].
Decision makers can use techniques such as CRITIC and VIKOR to determine the relative priority of each location based on its balance between competing criteria (e.g., solar potential, distance to grid connection points, climate characteristics, etc.) and environmental constraints [
46].
As well as this global progress in international solar PV development, most studies examining the potential for solar PV in Iran have still employed mainly supply-oriented methodologies to evaluate solar PV resources, with solar irradiance as the main determining factor for solar PV development. Many studies have treated electricity demand indicators as secondary factors or exclusionary constraints rather than as primary determinants of spatial prioritization for solar PV development. Consequently, such simplification may lead to a significant overestimation of economic viability and suggest locations for solar PV development that are affected by high transmission losses and poor grid connections.
In addition to the limitations of the above-mentioned literature, another constraint is the application of multi-criteria decision-making (MCDM) techniques in solar energy planning. A large number of MCDM techniques have been used worldwide in GIS-based decision-support systems for solar energy planning, including TOPSIS, ELECTRE, PROMETHEE, MARCOS, AHP, and others. The reasons why MCDM techniques are widely applied include their simple methodology, the transparency of the computational procedure, and the high level of interpretability for decision makers. Moreover, the majority of these techniques are robust when applied to spatial data, require relatively little computing time, and yield stable rankings. Additionally, some methods, including MARCOS, have been developed to address rank reversal and improve the reliability of comparative assessments of alternatives.
Recently, researchers have emphasized the importance of incorporating environmental and ecosystem services into territorial energy planning frameworks. For instance, Hernández and Camerin [
47] have demonstrated that spatial decision-support tools can integrate assessments of ecosystem services into land use planning processes. They highlight the need to assess functional ecological factors—for instance, biodiversity protection, landscape preservation, and ecosystem resilience—alongside socio-economic development goals to ensure sustainable territorial development.
Although the main focus of the current study is on the relationships between available solar resources and electrical consumption patterns, future extensions of the proposed GIS–Entropy–MARCOS framework can include indicators of ecosystem services as additional evaluation criteria. This will allow for a more integrated evaluation of the location for renewable energy investment, taking into account the efficiency of the electric grid, economic feasibility, and environmental sustainability.
To position the present research within the wider literature,
Table 1 presents a comparative overview of a selection of GIS-MCDM studies on solar energy planning and emphasizes differences in geographical area of study, evaluation criteria, weighting procedures, and decision-making techniques.
Recent research is also focused on integrating environmental and ecological services into territorial energy planning frameworks. As an example, the work of Hernández and Camerin [
47] demonstrated how spatial decision-support tools can incorporate ecosystem service assessments into land use planning processes. The authors emphasize that it is essential to evaluate environmental functions (such as biodiversity protection, landscape conservation, and ecosystem resilience) alongside socio-economic development objectives to support sustainable territorial development. Therefore, integrating ecosystem service indicators into GIS-based decision-making models will provide a more comprehensive basis for spatial planning. While this study has focused on the relationship between solar resource availability and electricity demand patterns, future applications of the proposed GIS–Entropy–MARCOS framework may include additional ecosystem service layers as criteria. This would allow for a more integrated prioritization of the territorial renewable energy projects based on grid efficiency, economic viability, and sustainability.
To compare the present research with previous GIS-MCDM research on solar energy,
Table 1 summarizes several relevant GIS-MCDM studies on solar energy planning with respect to differences in spatial scale, evaluation criteria, weighting procedures, and decision-making techniques.
In particular, most previous studies have employed subjective weighting procedures (e.g., AHP) and have focused primarily on resource-based suitability criteria. The present study, by contrast, develops an objective weighting procedure based on entropy and focuses its analysis on demand-driven regional prioritization at the county level.
3. Research Methodology
3.1. Study Area
Compared to other provinces in Iran, South Khorasan is the third largest in terms of geographic area, with an approximate total land area of 150,800 km2, and is located in the eastern part of the nation. The province of South Khorasan is bounded to the north by Khorasan Razavi Province, to the west by Yazd, Semnan, and Isfahan provinces, and to the south by Kerman and Sistan-Baluchestan provinces. To the east, it shares an international border of approximately 331 km with the Farah Province in Afghanistan. The province has a dry, arid desert climate, with an average annual precipitation of 98 mm. The province’s most recent census indicated that approximately 768,898 people lived in the province in 2016.
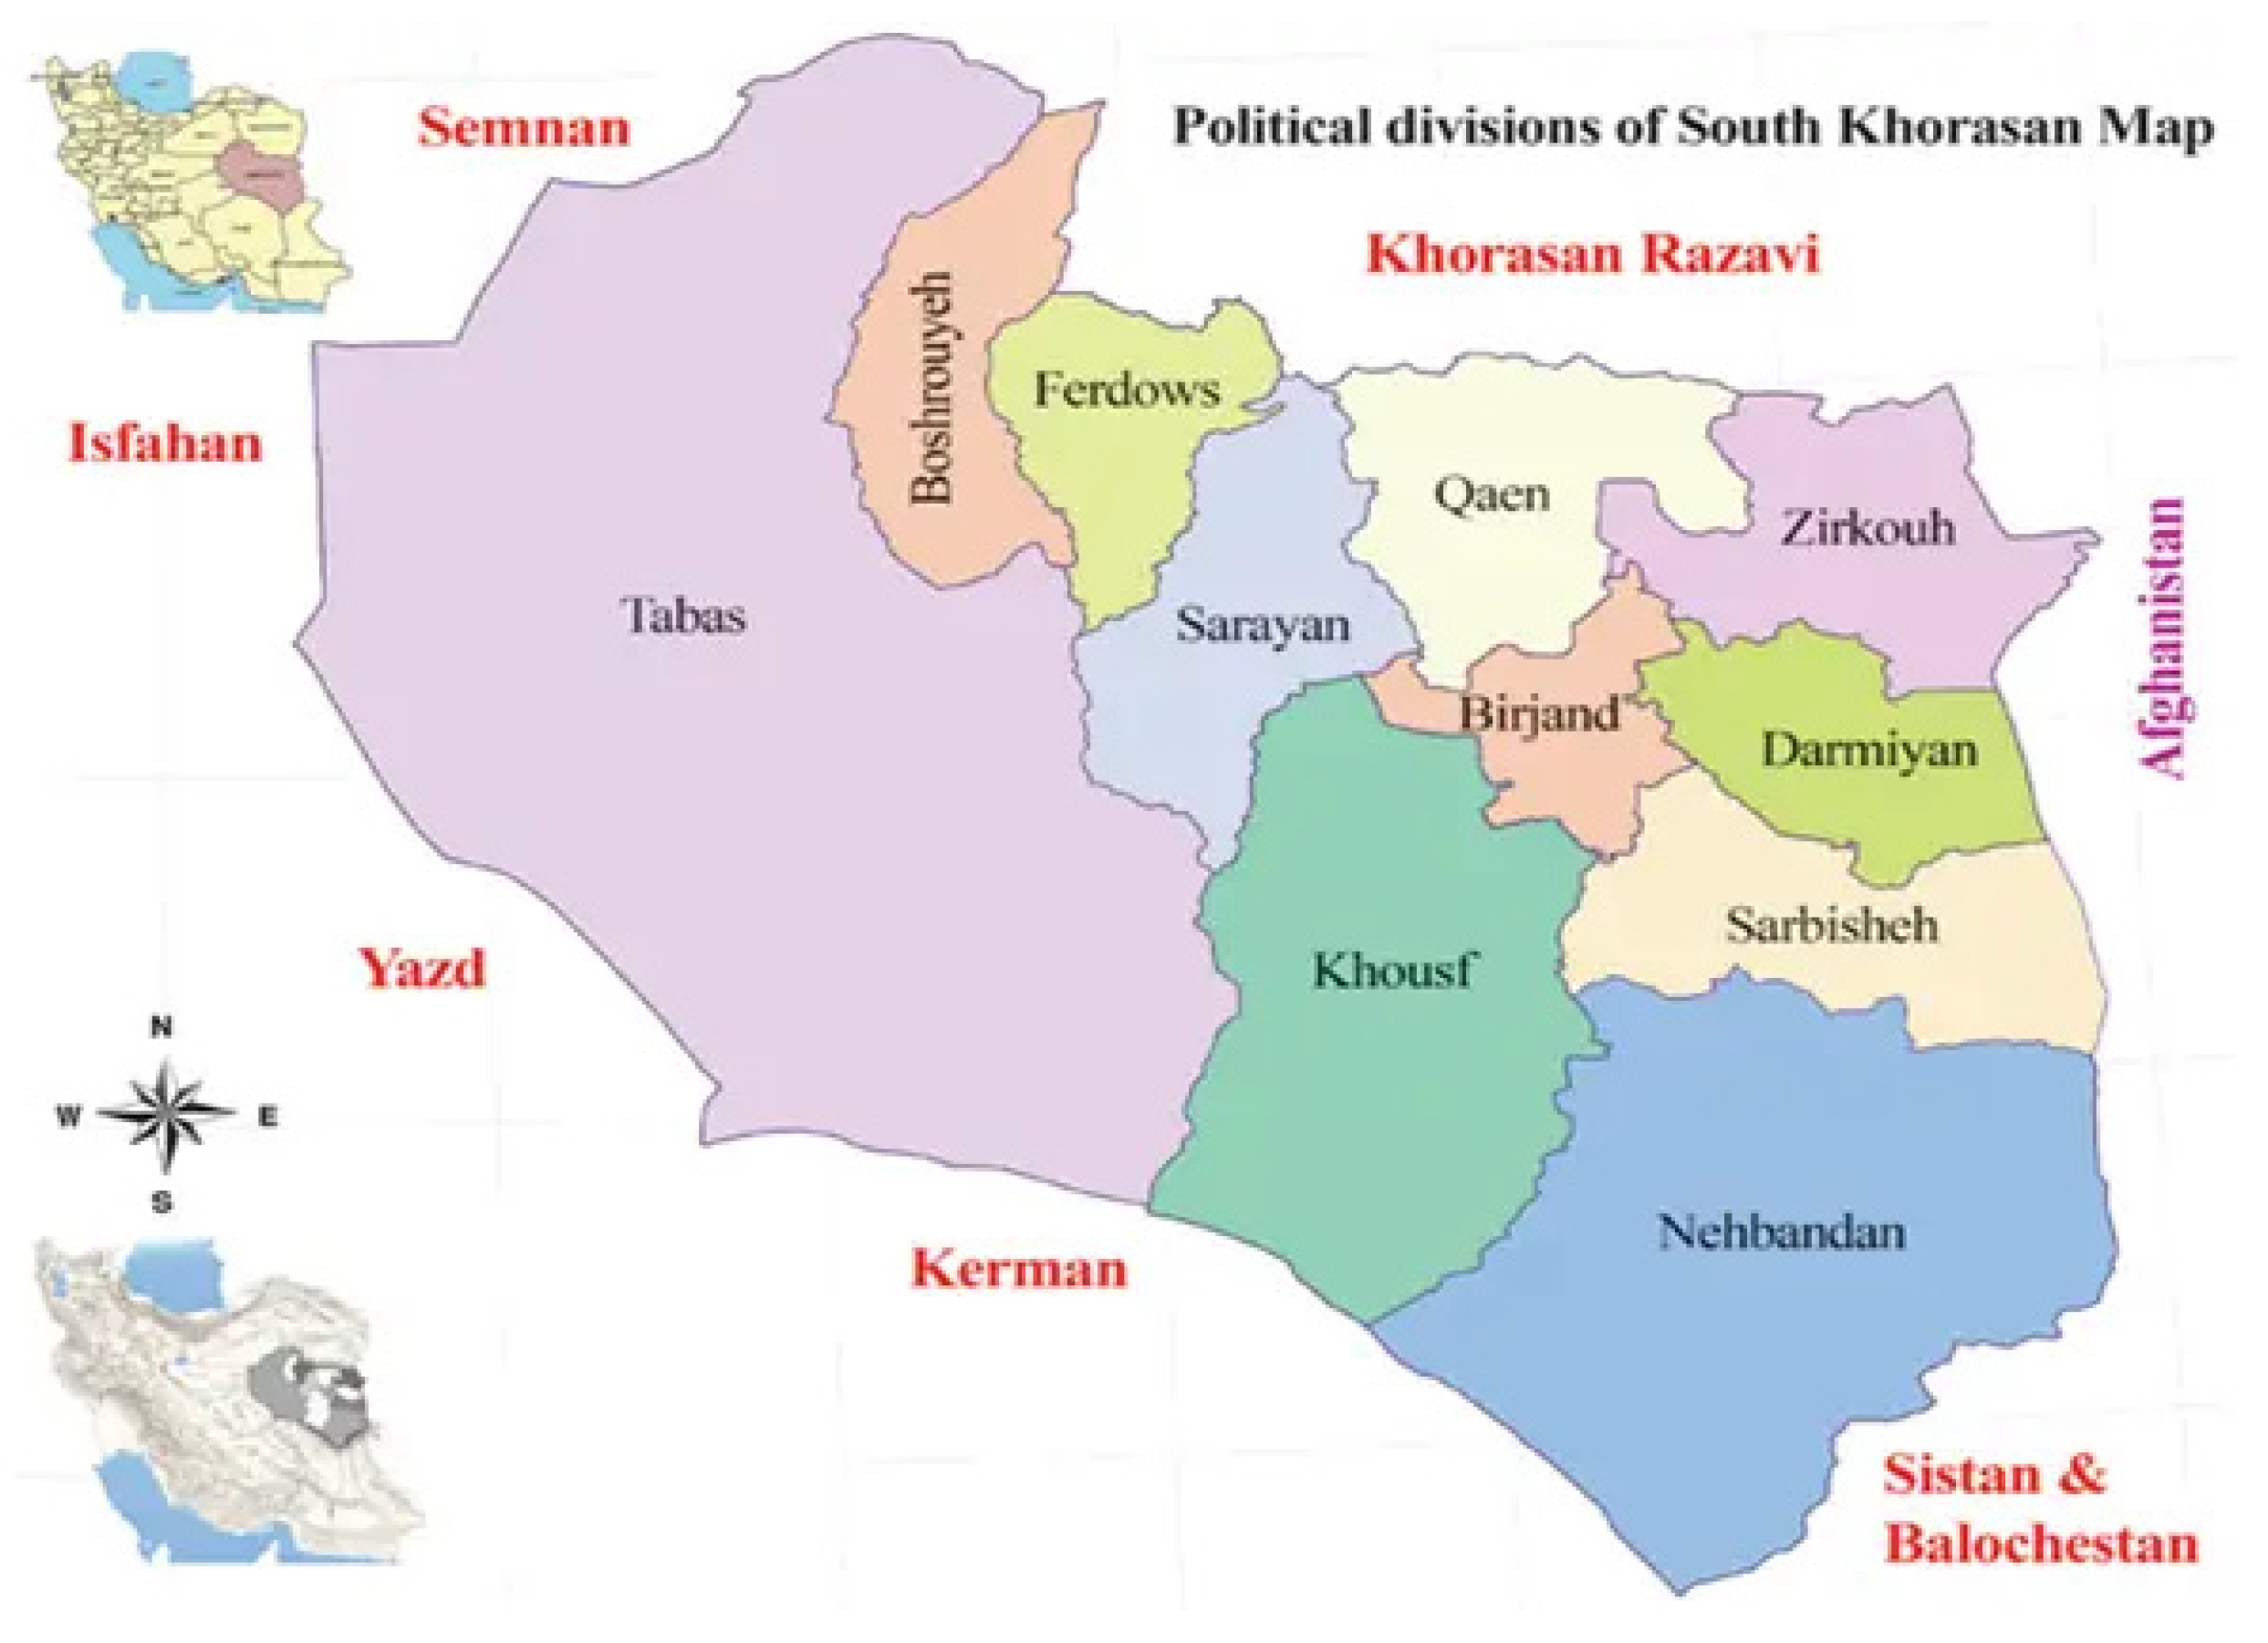
The province comprises 11 counties: Birjand (the province’s administrative capital), Boshruyeh, Darmian, Ferdows, Khusf, Nehbandan, Qaenat, Sarayan, Sarbisheh, Tabas, and Zirkuh. The majority of the province’s population lives in the city of Birjand, which is the province’s major urban and economic center and accounts for a large share of the province’s population and electrical load. The remaining counties are mostly desert and sparsely populated. A map of the county boundaries is shown in
Figure 1.
In addition to its geographical and climatic features, South Khorasan Province has structural features that are important for energy planning. The regional electrical system is characterized by a relatively low grid density and long transmission distances between thinly populated villages; both factors can lead to increased technical losses and higher infrastructure costs. The majority of the region’s electricity demand is concentrated in a few cities (Birjand and Qaenat), whereas large desert regions with abundant solar energy resources are poorly connected to the current power distribution system. The regional economy is largely composed of agricultural production, mining, and small-scale manufacturing, resulting in a diverse pattern of electricity use across counties. For these reasons, South Khorasan is a good example for examining how well the spatial availability of solar resources matches the spatial patterns of electrical use within the province.
3.2. Data Sources and Criteria Selection
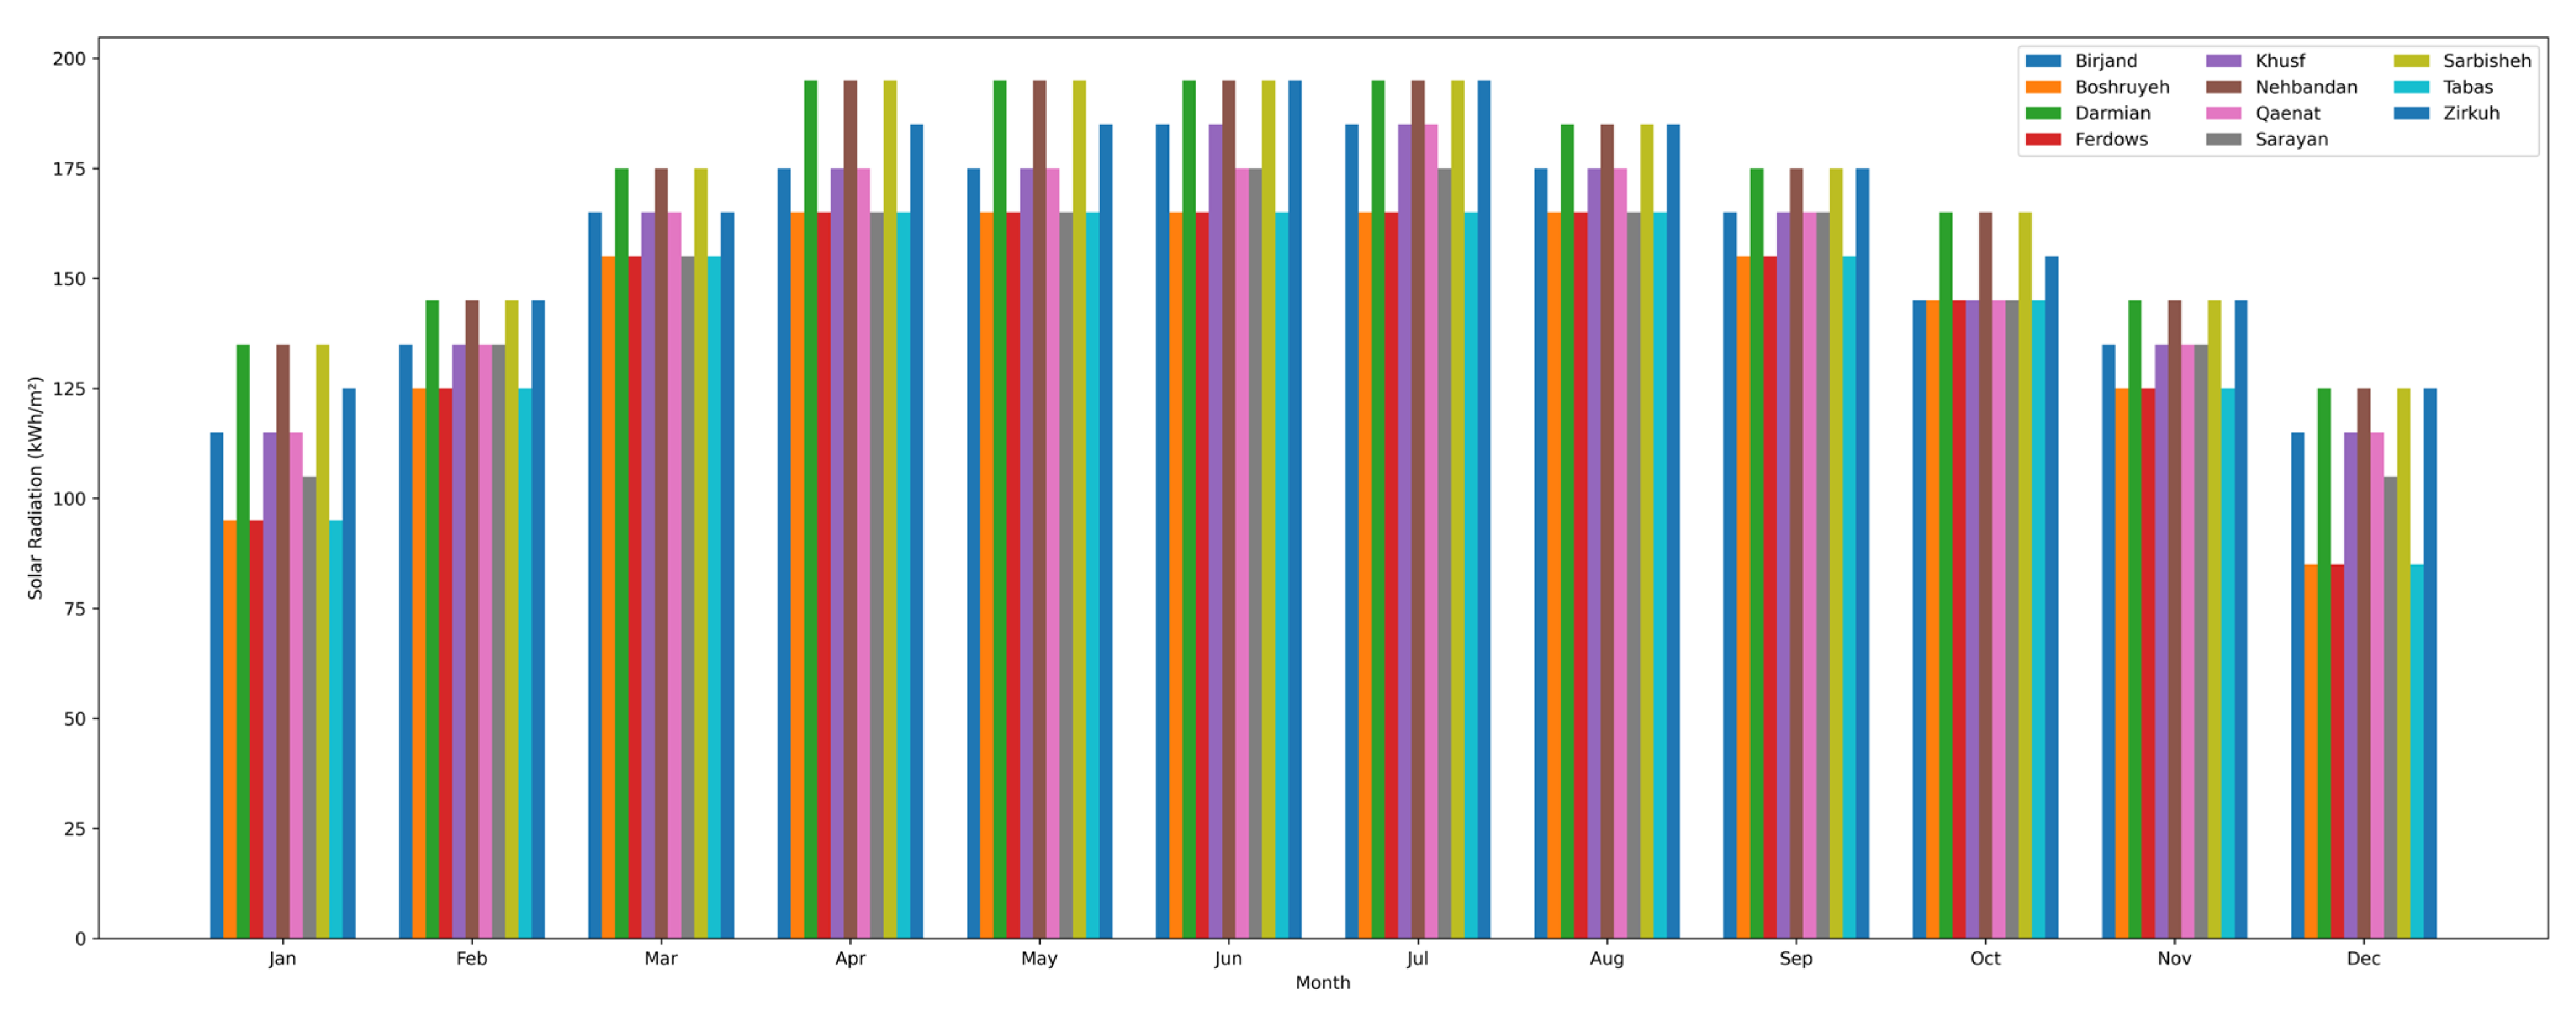
In the initial phase, an extensive review of the national and international literature on solar-energy regional prioritization and spatial prioritization was conducted to identify research gaps and inform criteria selection. Subsequently, to obtain accurate and up-to-date solar resource data for South Khorasan Province in 2024, annual and monthly global horizontal irradiation (GHI) values were extracted from the Global Solar Atlas (World Bank/IRENA), a widely recognized and validated data source. These raster datasets were then imported into ArcGIS Pro 3.2 for spatial processing, reclassification, and the generation of county-level solar irradiation maps.
Five benefit criteria were selected based on the literature review and the specific context of arid, demand-heterogeneous regions: (i) annual solar irradiation (kWh/m2/year), (ii) population, (iii) per capita domestic electricity consumption, (iv) industrial electricity consumption, (v) agricultural electricity consumption. All criteria except irradiation were treated as demand-side indicators to reflect the study’s explicit focus on consumption patterns. County-level electricity consumption data for 2023–2024 were obtained from the South Khorasan Regional Electric Company (Mashhad, Iran) and normalized per capita where appropriate.
Because the model evaluates population and per capita residential electricity usage (together), an additional screening method was developed to test for possible overlap among demand-based indicators. These two variables are associated but measure different aspects of the region’s total electrical demand. Population indicates the number of people available to meet total demand; per capita residential electricity usage is the average electrical demand per person. Therefore, one measures the “size” of the demand aggregation area, and the other measures residents’ behavior regarding their electrical usage.
A correlation analysis was also conducted across all evaluation criteria to ensure that including both variables would not introduce collinearity. Since the correlation between population and per capita residential electricity usage was low enough to avoid serious multicollinearity, both variables were included in the model, as each provides unique information about counties and the priority for developing solar energy.
The present study is an applied study that adopts a quantitative analytical approach combining spatial data processing within a GIS environment with multi-criteria decision-making techniques.
Objective weighting of the criteria was performed using the Shannon Entropy method, which eliminates subjective bias and is particularly suitable when criteria exhibit high variance—as is the case with domestic consumption across the province. The weighted criteria were then fed into the Measurement of Alternatives and Ranking according to Compromise Solution (MARCOS) method [
23] implemented in Microsoft Excel 365 with custom macros for full reproducibility. MARCOS was selected for its proven stability, resistance to rank-reversal problems, and successful application in recent solar site selection studies in comparable environments.
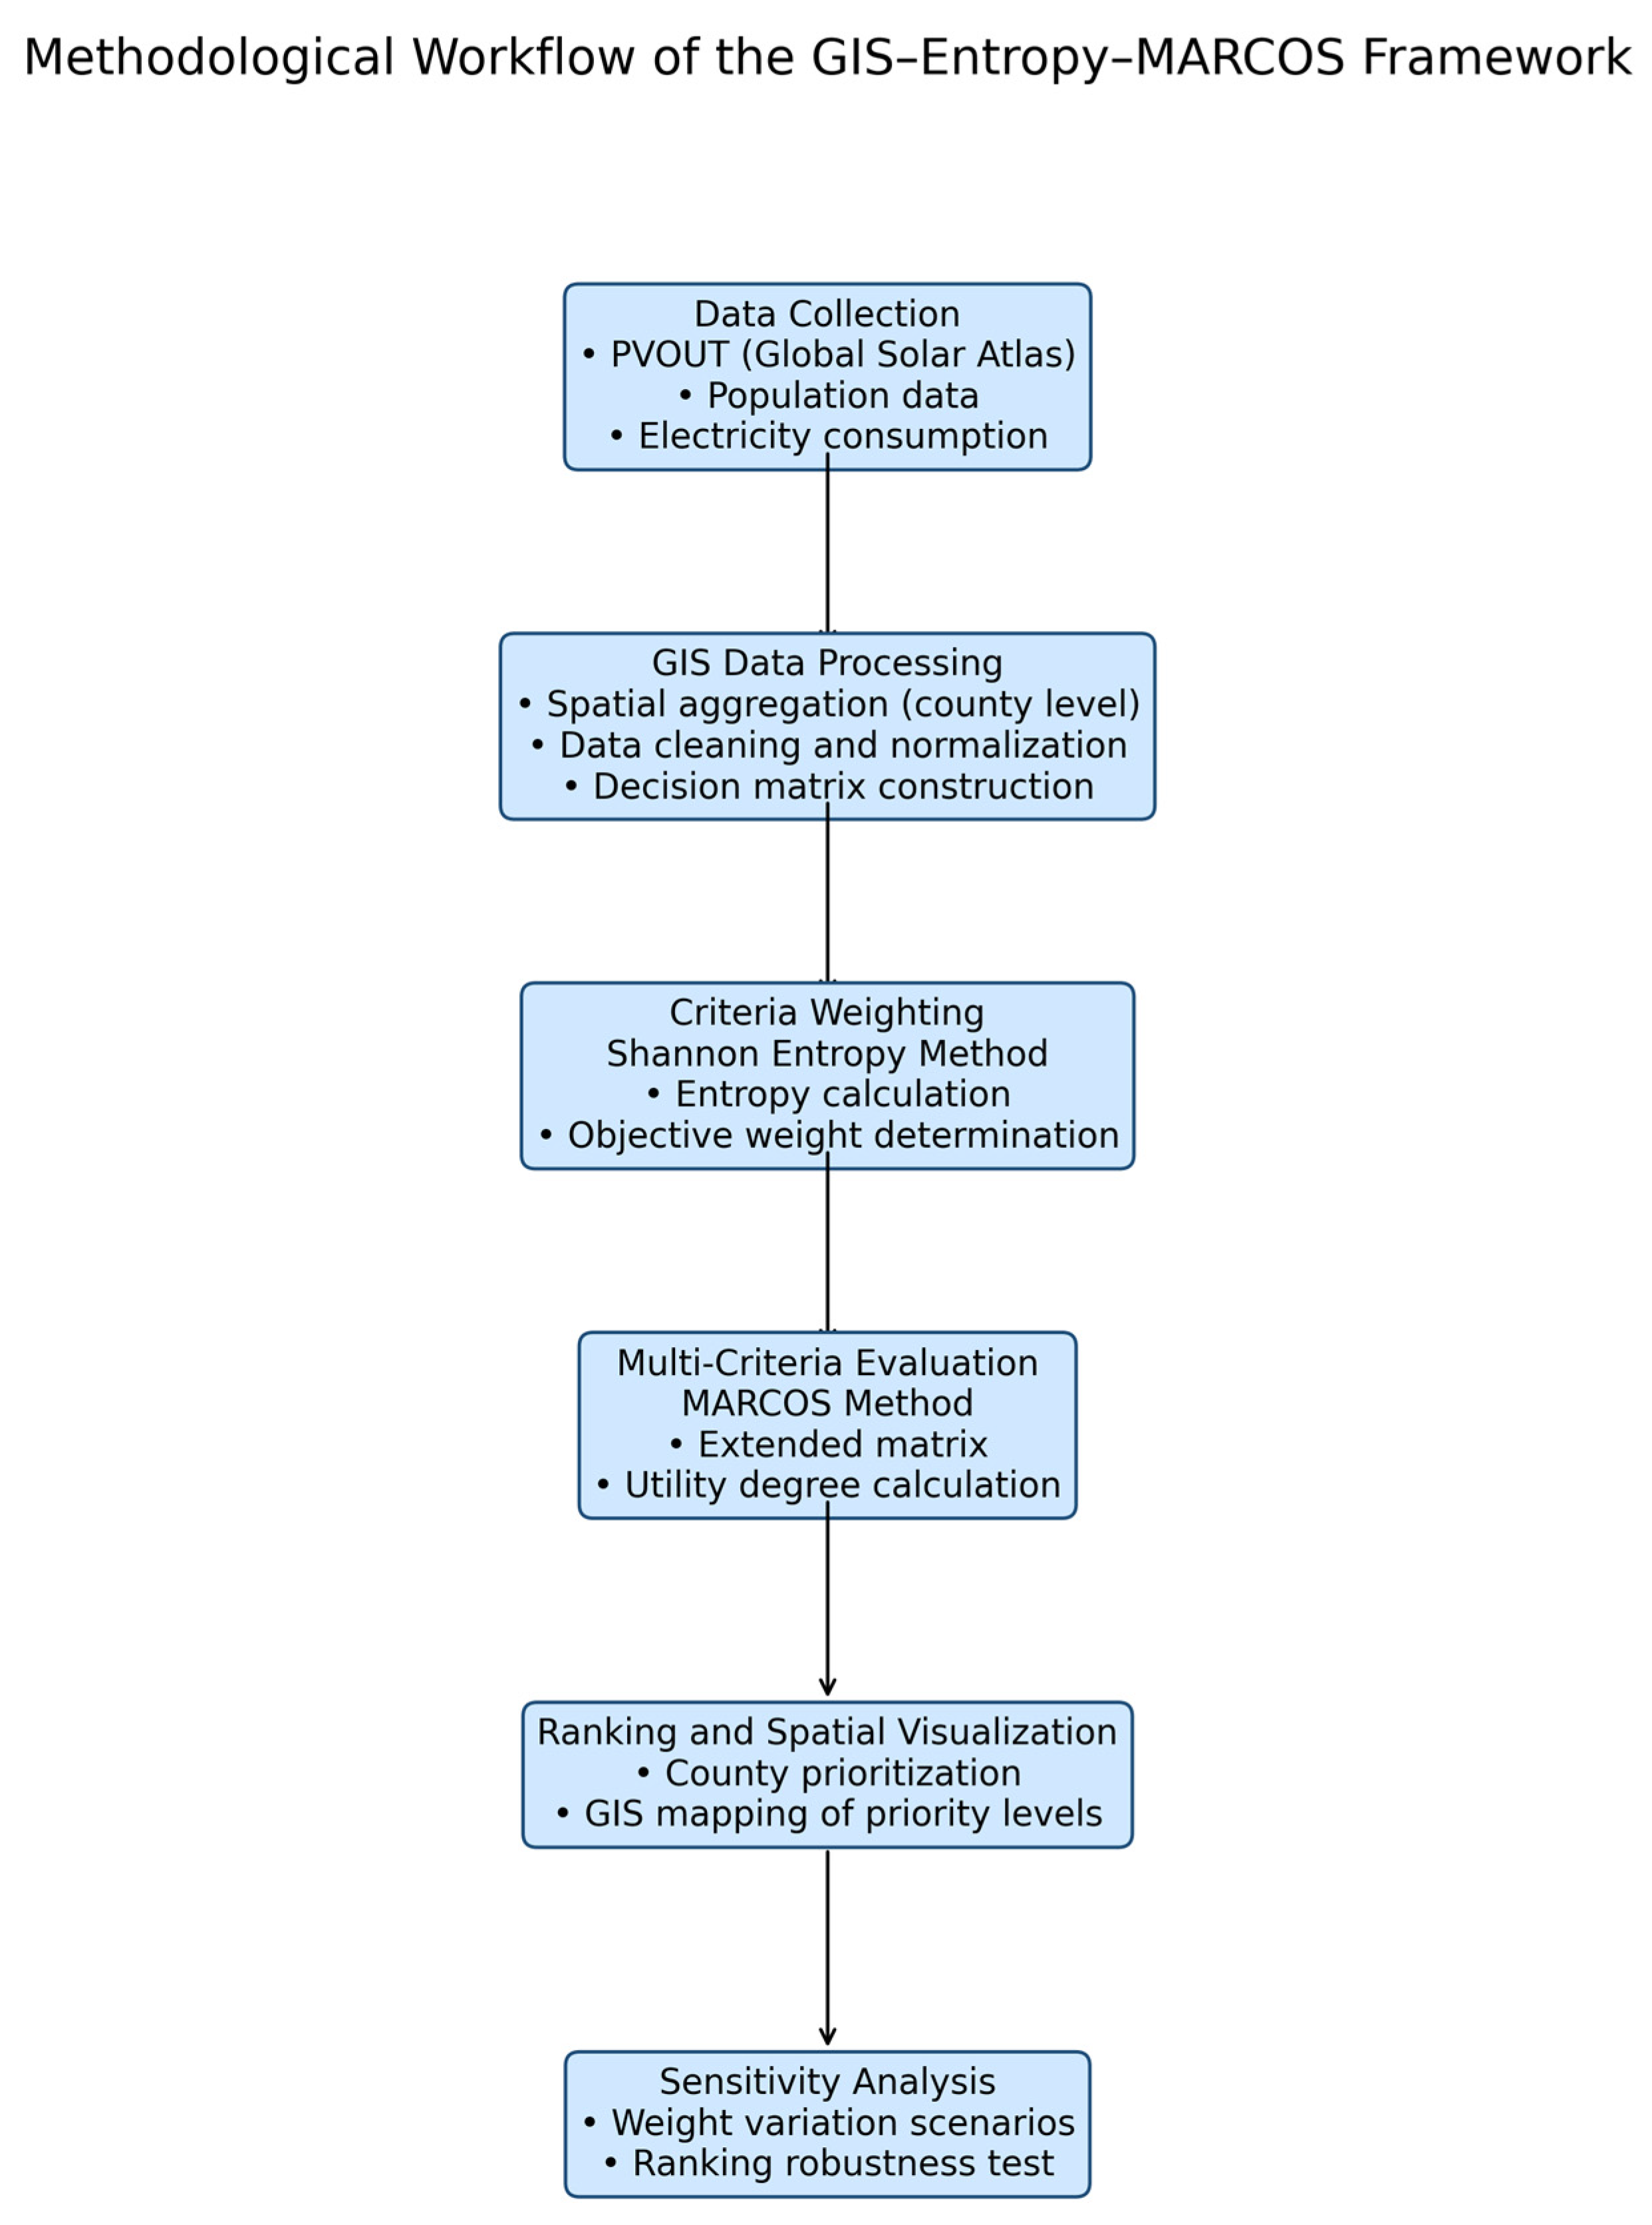
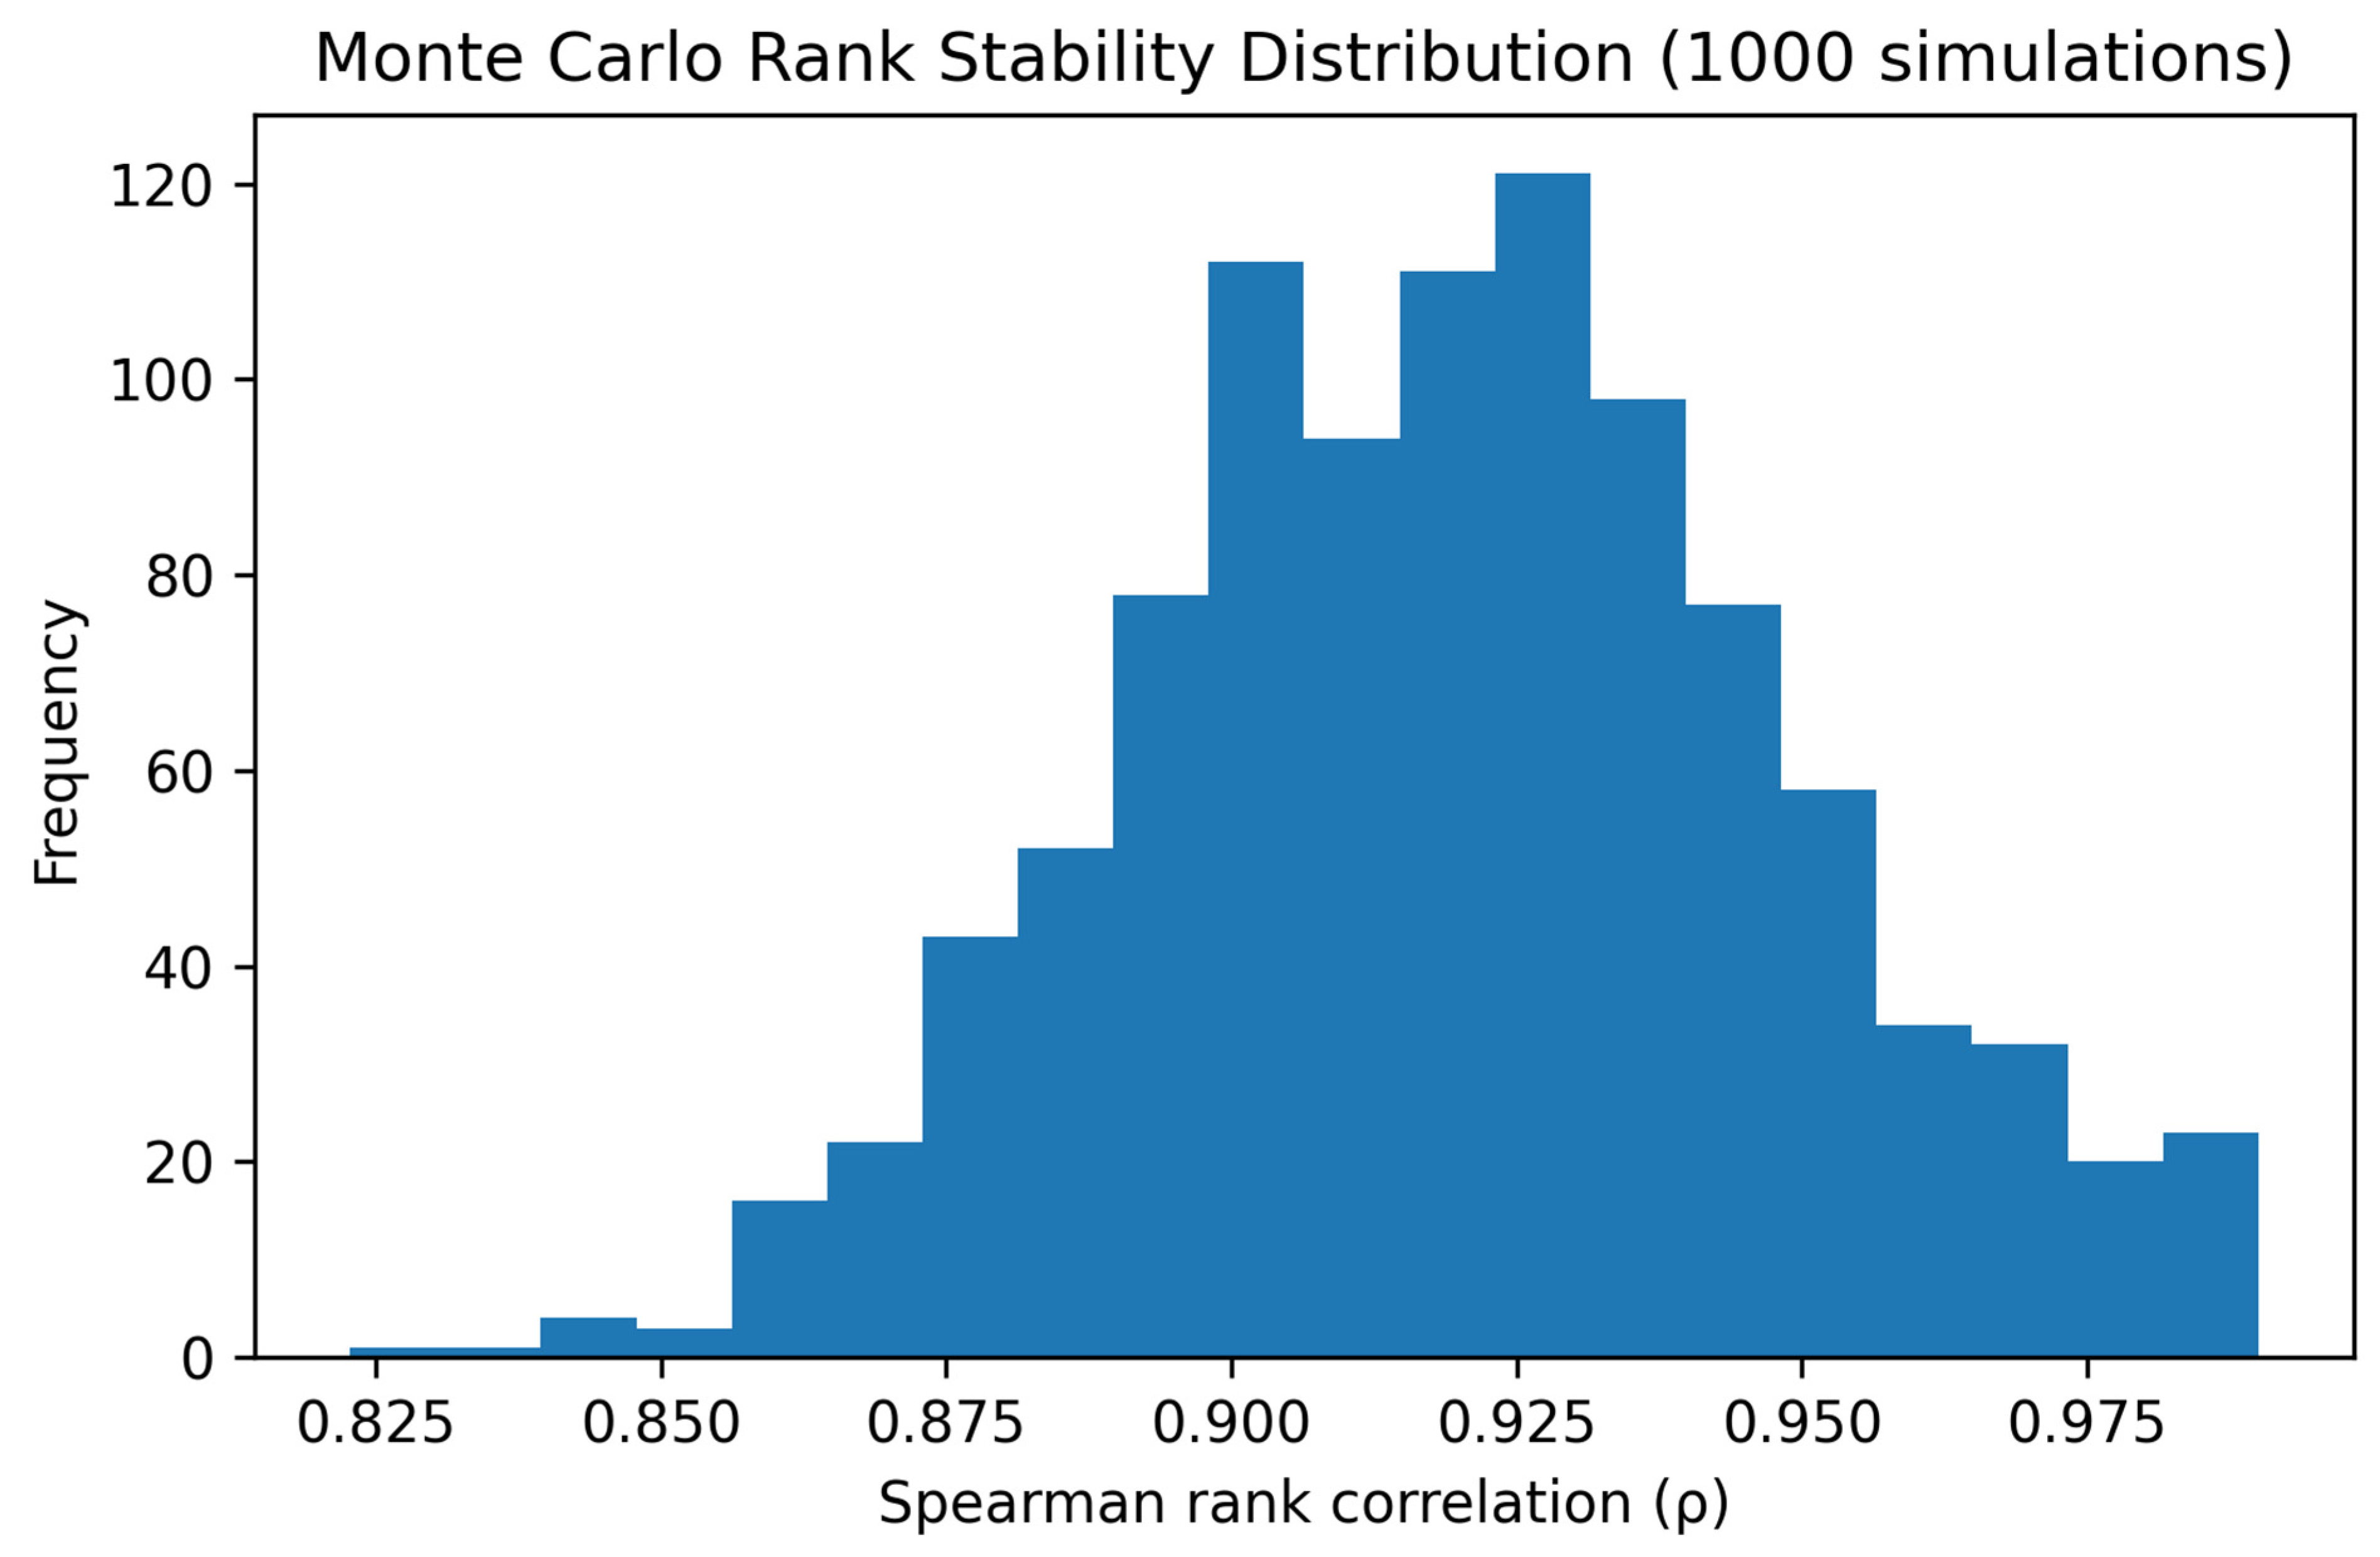
Final utility scores and county rankings were calculated, and the results were visualized through tables, bar charts, and a series of thematic maps produced in ArcGIS Pro. A sensitivity analysis was conducted by varying the criterion weights by ±20% to verify the robustness of the ranking order. The overall methodological workflow is summarized in
Figure 2 and
Table 2.
3.3. Multi-Criteria Decision Analysis Methods
3.3.1. Shannon’s Entropy Method
To eliminate subjectivity in expert weights, Shannon’s Entropy is used to assess the importance of each criterion. Shannon’s Entropy measures the amount of information contained in each criterion based on the variability in its scores across the alternatives and assigns a higher weight to the criterion with greater discrimination capability than to one with less.
m denotes the number of alternative options.
denote the number of criteria.
represent the value of the alternative under the criterion .
Step 1: Construction of the Normalized Decision Matrix
The original decision matrix
is normalized to obtain the proportion
as follows:
where
and
.
Step 2: Calculation of Entropy Values
The entropy value
for each criterion
is computed using Shannon’s Entropy formula:
where
This normalization ensures that .
Step 3: Degree of Diversification
The degree of diversification (information utility) for each criterion is calculated as follows:
A higher indicates greater variation and higher informational importance of the criterion .
Step 4: Determination of Entropy-Based Weights
Finally, the objective weight
of each criterion is obtained by normalizing the diversification degrees as follows [
48]:
with:
These weights are subsequently used in the MARCOS multi-criteria decision-making model.
3.3.2. Measurement of Alternatives and Ranking According to Compromise Solution (MARCOS)
A procedure for evaluating and ranking alternatives according to the concept of a “compromise solution” is known as the Measurement of Alternatives and Ranking According to Compromise Solutions (MARCOS) methodology. In this study, the MARCOS methodology was applied to identify the most suitable counties in the South Khorasan Province for developing solar power.
Originally developed by Stević and Pamučar [
23], the MARCOS methodology has since been widely applied to the ranking of research alternatives.
The MARCOS methodology represents an alternative to other multi-criteria decision methodologies, which compare different alternatives against each other with regard to both the best and worst possible alternatives. By comparing the alternatives against benchmark alternatives, the MARCOS methodology can provide stable evaluation scores while minimizing rank reversals.
Step 1: Creation of the Extended Decision Table
Starting from the original decision matrix , two additional rows are added:
For benefit-type criteria:
Step 2: Normalization of the Extended Matrix
The normalized matrix is computed as follows:
For benefit-type criteria:
Step 3: Construction of the Weighted Normalized Matrix
The weighted normalized values
are obtained by multiplying the normalized values by the criterion weights:
where
is the entropy-derived weight of the criterion
.
Step 4: Calculation of the Overall Utility Values
The total weighted score for each alternative is calculated as
Similarly, the total scores for the ideal and anti-ideal solutions are computed as and , respectively.
Step 5: Determination of Utility Degrees
The utility degree of each alternative with respect to the ideal and anti-ideal solutions is calculated as
Step 6: Calculation of the Final Utility Function and Ranking
The final utility value
for each alternative is determined using
Alternatives are ranked in descending order , with higher values indicating higher priority for solar energy development.
A number of multi-criteria decision aid methods use distance-based evaluation concepts, in which alternatives are evaluated with regard to ideal and anti-ideal (or negative) benchmark references. Among those distance-based multi-criteria decision aid methods, MARCOS can be distinguished from well-known methods such as TOPSIS, VIKOR, and EDAS by its methodological advantages. Whereas TOPSIS uses geometric distance to evaluate an alternative from the ideal and anti-ideal solution set, MARCOS uses a utility function that compares the relative proximity of all alternatives to both the ideal and anti-ideal solution at the same time. The use of a utility function in MARCOS facilitates a more explicit comparison of the alternatives with respect to both ideal and anti-ideal reference points, thereby reducing the influence of scale effects. It is also known that MARCOS is more robust in ranking outcomes than some traditional distance-based methods and is less susceptible to rank reversals. Given the above-mentioned characteristics, MARCOS appears to be a suitable method for spatially allocating competing objectives across heterogeneous indicators within a coherent decision-support framework.
Like many other GIS-based MCDM studies that compare algorithms, this study demonstrates that objective data-based weighting methods can alter the logic by which alternative investment options are prioritized. Entropy weighting has the greatest value added when there are significant differences throughout space in the basic data used in analysis (the amount of electricity each resident uses)—as evidenced by per capita electricity consumption in South Khorasan. When the degree of spatial difference is extreme, as in South Khorasan, entropy weighting would greatly magnify the importance of demand-side influences while diminishing the importance of resource-side influences (such as irradiance). The cause of the latter phenomenon lies in a reversal in the structural decision dominance; therefore, proximity to existing loads is given greater emphasis than the small degree of variability in the potential production capacity of each individual solar panel, even though they are located in an area of extremely high irradiance. Thus, the contributions of this study include empirically demonstrating that both the degree of information variance and the spatial scale affect where investments in renewable energy should be made.
The relationship between all the variables in this model will need to be checked for multicollinearity with regard to the two variables included in the model as demand-related indicators—namely, the size of the demand center and the level of energy intensity/lifestyle-based usage of electricity, which are represented by population and per capita consumption, respectively. While it would seem reasonable to conclude that the amount of total residential electricity demand should be positively correlated to both population and per capita consumption—due to their theoretical interrelationship—population measures the size of the demand center, while per capita consumption captures an additional dimension of electricity demand (spatial concentration vs. individual consumption). To test whether these variables can serve as independent measures of electricity demand distribution/intensity within the counties of South Khorasan Province, a Pearson correlation analysis was conducted on county-level data. The results indicated a moderate correlation between population and per capita consumption (|r| < 0.7). Therefore, since the two variables measure different aspects of electricity demand, they were both retained in the model.
Figure 2 demonstrates the research methodology.
The county scale was selected as the operational spatial unit for this study because it is the main administrative level at which regional planning decisions and investments in energy infrastructure are typically coordinated in Iran.
While parcel-level or municipal analysis provides an appropriate scale for identifying specific installation sites, county-level aggregation provides a suitable intermediate scale for strategic energy planning, enabling comparisons of territorial demand patterns and infrastructure conditions across the province.
In addition, the county scale aligned with official statistical data on electricity consumption and demographic characteristics that were available for the province.
3.3.3. Reason for Using Hybrid MCDM Methods
A number of MCDM techniques can be employed within a GIS framework to support the development of sustainable energy plans, due to several methodological advantages. For example, AHP, TOPSIS, and MARCOS are often used as part of the MCDM process due to relatively simple and easy to understand computation, high levels of interpretability from decision makers, ability to combine multiple criteria which may be of different types, ability to produce easily understandable rankings of alternatives, and relative simplicity with respect to computational time compared to more complex optimization models. Furthermore, some methods, such as MARCOS, were developed to address issues associated with “rank reversal” and to produce comparable evaluations that remain stable across alternative solutions. The characteristics mentioned above are among the reasons why MCDM methods are commonly used within GIS-MCDM frameworks to support spatial decisions in energy planning and other decision-support applications.
The use of another benchmark method—the Technique for Order Preference by Similarity to Ideal Solution (TOPSIS)—in addition to MARCOS, was used to further test the robustness of the proposed ranking methodology. In this case, the TOPSIS method uses the same decision matrix and entropy-derived weights as MARCOS but calculates the relative proximity of each option to the “ideal” solution. A comparative evaluation of these two multi-criteria decision-making methodologies is used to evaluate the level of agreement of the rankings and to strengthen confidence in the accuracy of the results.
6. Conclusions, Future Study, and Limitations
This study developed a GIS-Entropy-MARCOS framework to identify the counties with the highest priority for solar energy development in South Khorasan Province, combining county-level solar resource characteristics with spatial electricity demand indicators. This study indicates that variability in the county’s electricity consumption pattern is a more important factor in determining county priority than the relatively small variation in solar irradiation across counties. Therefore, counties with high electricity demand and favorable solar resources are typically assigned the highest priority scores. As such, this study demonstrates that demand-based planning can significantly affect where solar energy investments occur, compared with resource-based approaches that consider only the county’s solar irradiance potential.
Methodologically, this study makes a contribution by demonstrating an objective weighting scheme based on Shannon’s Entropy, combined with the MARCOS multi-criteria decision-making methodology, within a GIS framework, to systematically integrate county-specific solar resource data with sectoral electricity consumption indicators to support regional renewable energy planning. In addition to providing guidance on selecting priority regions for solar energy investments, the results also highlight the importance of evaluating demand distribution relative to resource availability to identify suitable locations.
In terms of policy, demand-based spatial prioritization may improve grid efficiency by placing new generation capacity near consumption centers, potentially reducing losses from long-distance transmission and the need for future expansions to the existing grid infrastructure.
Despite the contributions mentioned above, this study has some limitations that must be acknowledged. For example, the county-specific demand data used in this study are based on annual electricity consumption statistics and do not include hourly load profiles, which would likely have provided additional insight into county-specific demand patterns across different times of day. Additionally, no economic considerations, such as land acquisition costs, grid connection costs, or spatial variation in the levelized cost of electricity (LCOE), were included in the prioritization framework. Therefore, future studies may expand the proposed approach to include hourly electricity demand data, energy storage considerations, and nodal grid analysis to capture the dynamics of the overall energy system. Moreover, including spatially adjusted LCOE estimates and indicators of infrastructure accessibility may enable a more comprehensive evaluation of the technical and economic feasibility of developing solar energy across the region.
Limitations and Future Research
Although this study uses yearly data from provincial electrical energy statistics, it does not include hourly load curves. These would be a good way to improve the assessment of curtailing and the need for storage in the province. This study also did not use cost criteria (such as land cost or infrastructure access) when determining where to install new solar panels. To address the gaps in this study, future studies could collect real-time data using smart meters, create suitability layers for rooftops, and develop economic costing models. A larger scale for the study would be at the municipal level, allowing for even more detailed priority rankings.




 ,
,