1. Introduction
Today, global climate change is intensifying, with CO
2 widely recognized as the primary driver of this phenomenon [
1]. Economic growth and carbon emissions have long been highly correlated, and decoupling these two factors presents a significant challenge for nations worldwide as they transition toward low-carbon and sustainable development [
2]. As the world’s largest carbon emitter, China’s “dual carbon” goals announced in 2020 represent not only a national strategy but also a critical lever for balancing regional economic growth with ecological protection [
3,
4]. In this context, analyzing the decoupling dynamics between infrastructure investment and carbon emissions is particularly urgent. Infrastructure, as the cornerstone of economic development, involves massive energy consumption during its construction phase, forming a complex “investment–emission decoupling chain” [
5]. Understanding the decoupling status of this chain across different geographical scales is key to achieving low-carbon transition and regional sustainable development.
The carbon footprint of infrastructure exhibits distinct life-cycle characteristics [
6,
7]. While conventional studies have predominantly focused on operational-phase energy consumption, empirical evidence demonstrates that infrastructure generates intensive “carbon pulses”—concentrated high-intensity emissions during the construction phase [
8,
9]. This is particularly pronounced in topographically complex regions, where the sheer scale of engineering works and heavy reliance on energy-intensive materials amplify construction-phase emission peaks [
10,
11]. Liu and Deng (2024), employing life-cycle assessment, further demonstrated that carbon footprints from specific engineering projects in extreme construction environments exhibit nonlinear multiplication trends compared to plains regions [
12]. Moreover, infrastructure construction often entails profound “carbon lock-in” effects [
13,
14]: current investment decisions effectively predetermine long-term regional emission trajectories through spatial layout choices [
15]. Balboni (2025) further substantiated the persistence of such lock-in effects and the resulting path dependence from an economic logic perspective [
16]. However, these studies have largely focused on micro-scale project-level or single-facility carbon footprint assessments, without extending the consensus that “terrain amplifies carbon intensity” to the macro-regional analysis of investment–decoupling dynamics.
At the regional scale, carbon emissions and decoupling performance exhibit significant spatial differentiation [
17,
18]. Existing empirical studies indicate that such disparities arise not only from industrial structure evolution but are also deeply constrained by physical geographical environments [
19]. Liu et al. (2025) confirmed that terrain complexity is a long-term steady-state factor explaining the decoupling performance gap between eastern and western China, with its influence often surpassing the disturbance of short-term economic fluctuations [
20]. Specifically, terrain undulation imposes rigid constraints on land-use patterns, engineering technology selection, and logistics accessibility, profoundly affecting the carbon efficiency of economic activities [
21,
22]. As the related research emphasizes, discussing human activities in isolation from the natural geographical context makes it difficult to accurately capture the dynamic coupling patterns between regional development and environmental systems [
23]. Although terrain factors have been incorporated into analytical models, their role has largely been confined to “static background” or statistical control variables. The internal transmission logic through which terrain intervenes in infrastructure investment efficiency to drive decoupling evolution remains insufficiently examined through systematic empirical testing.
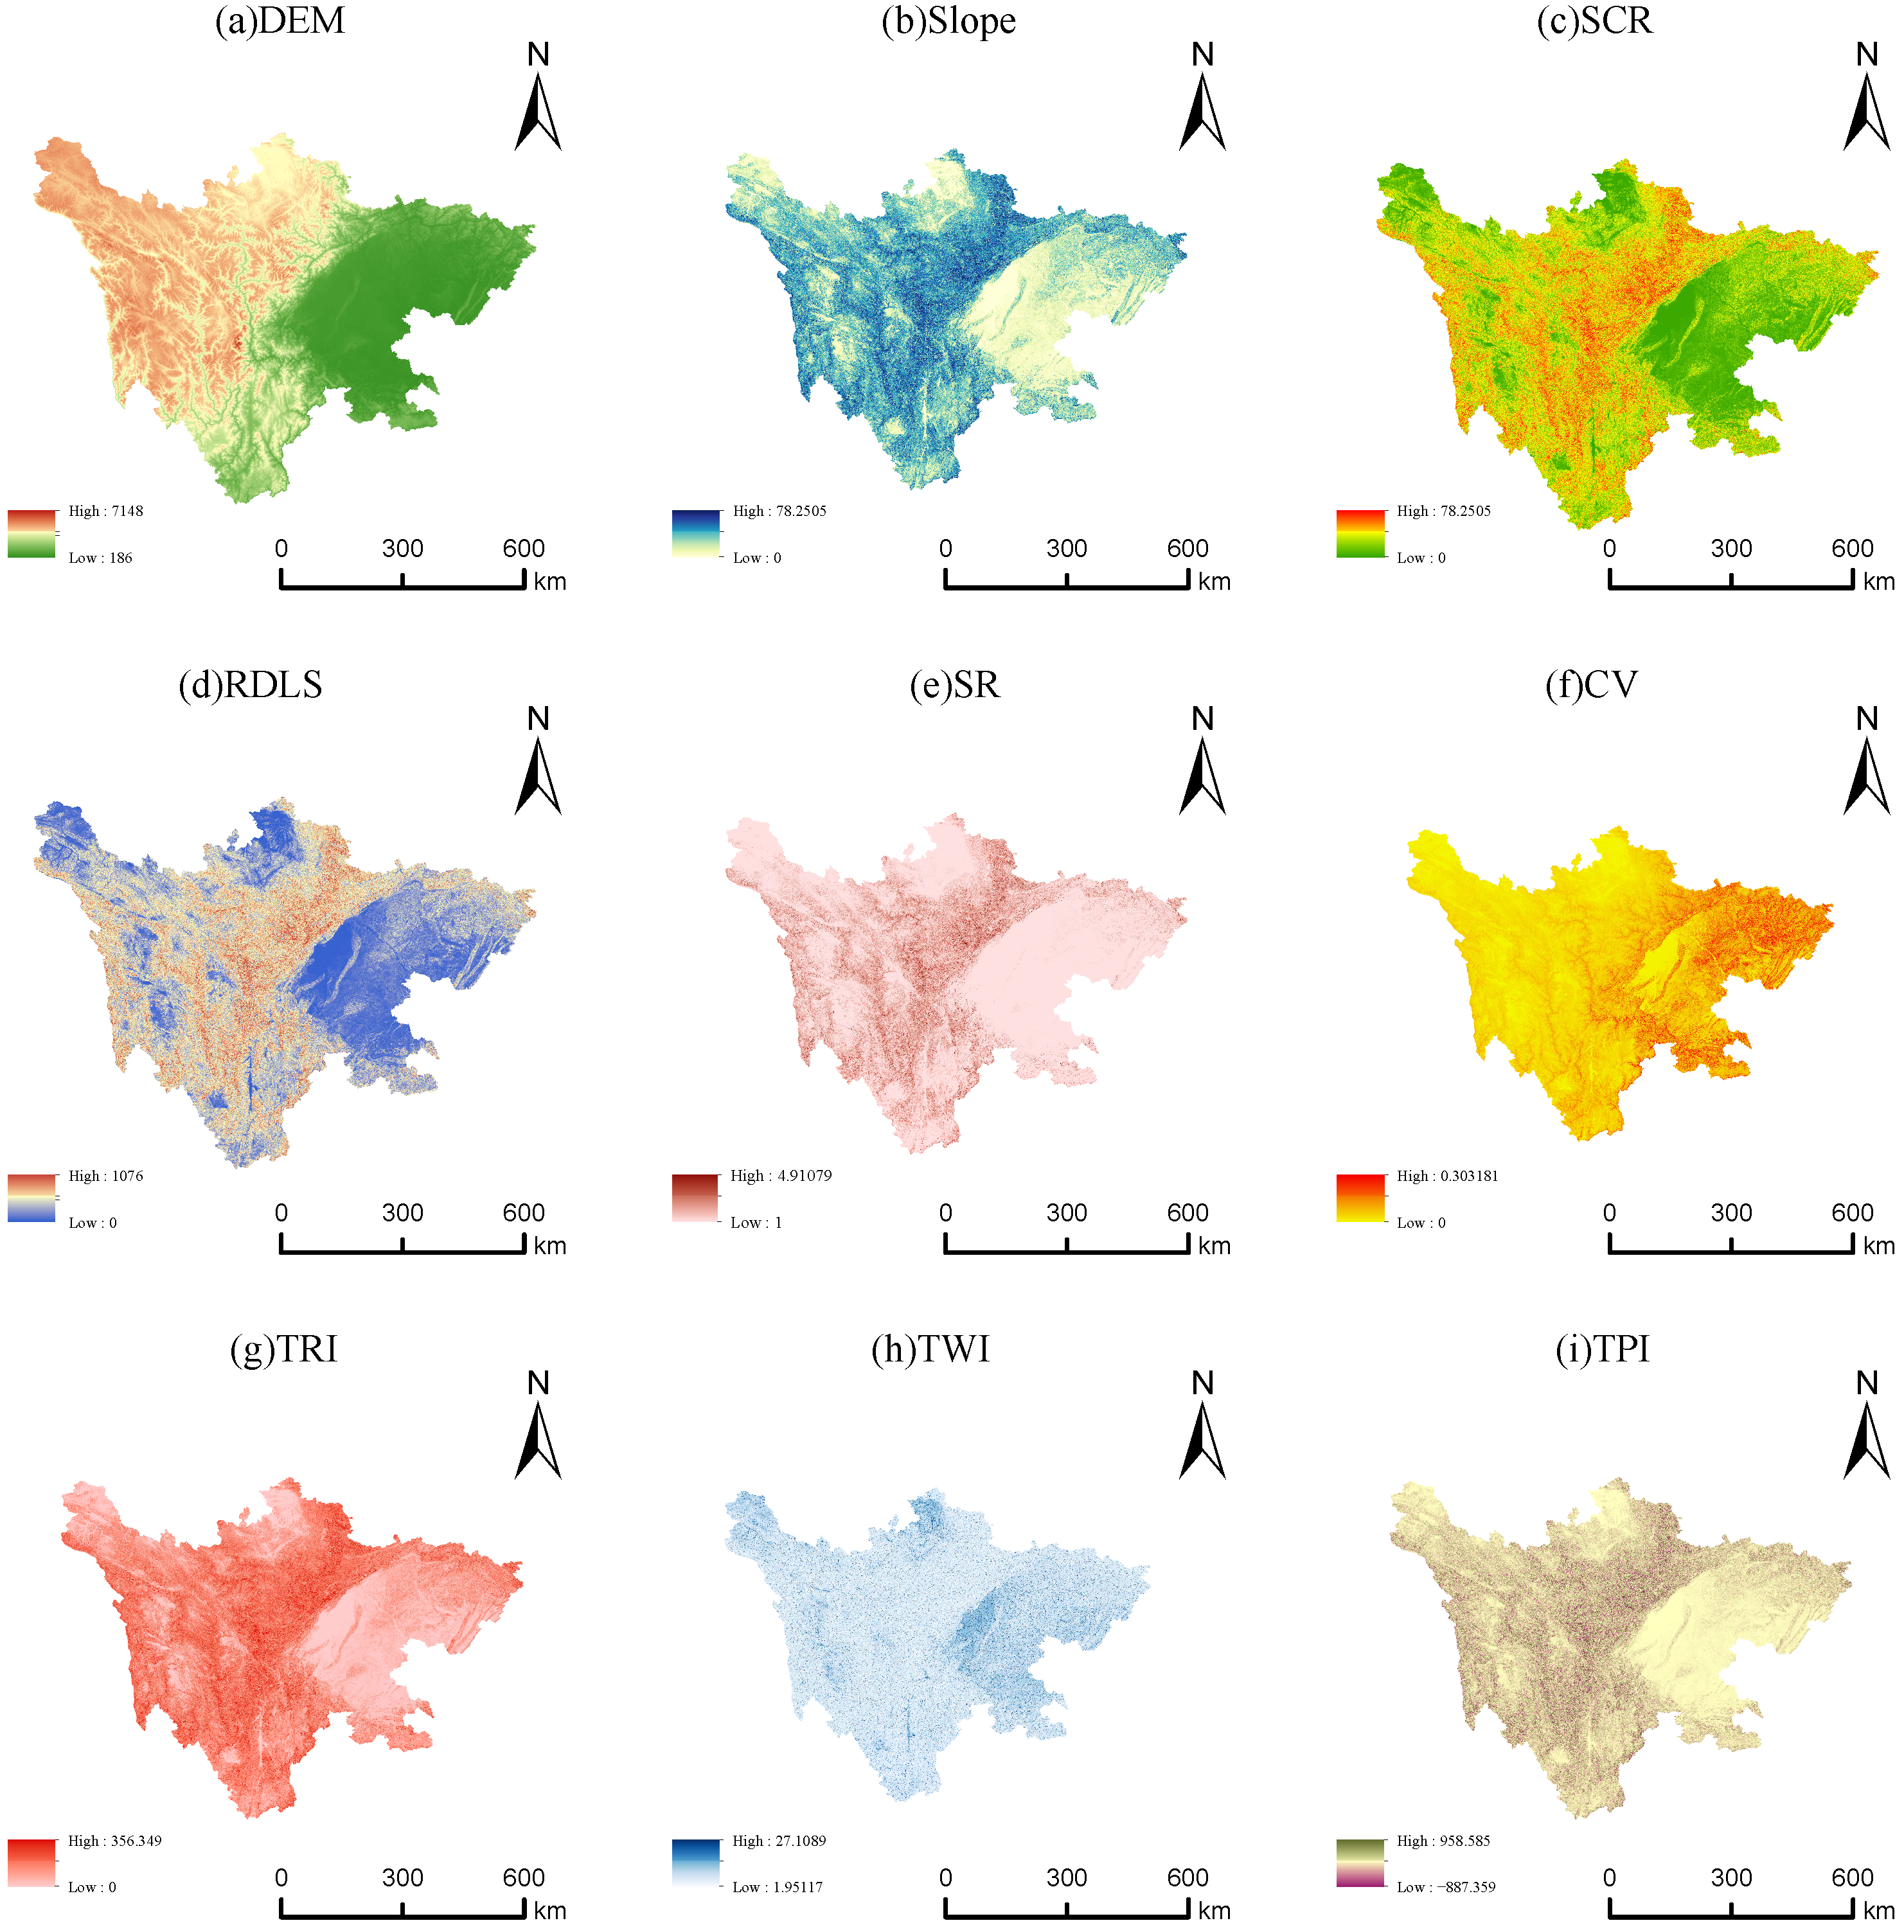
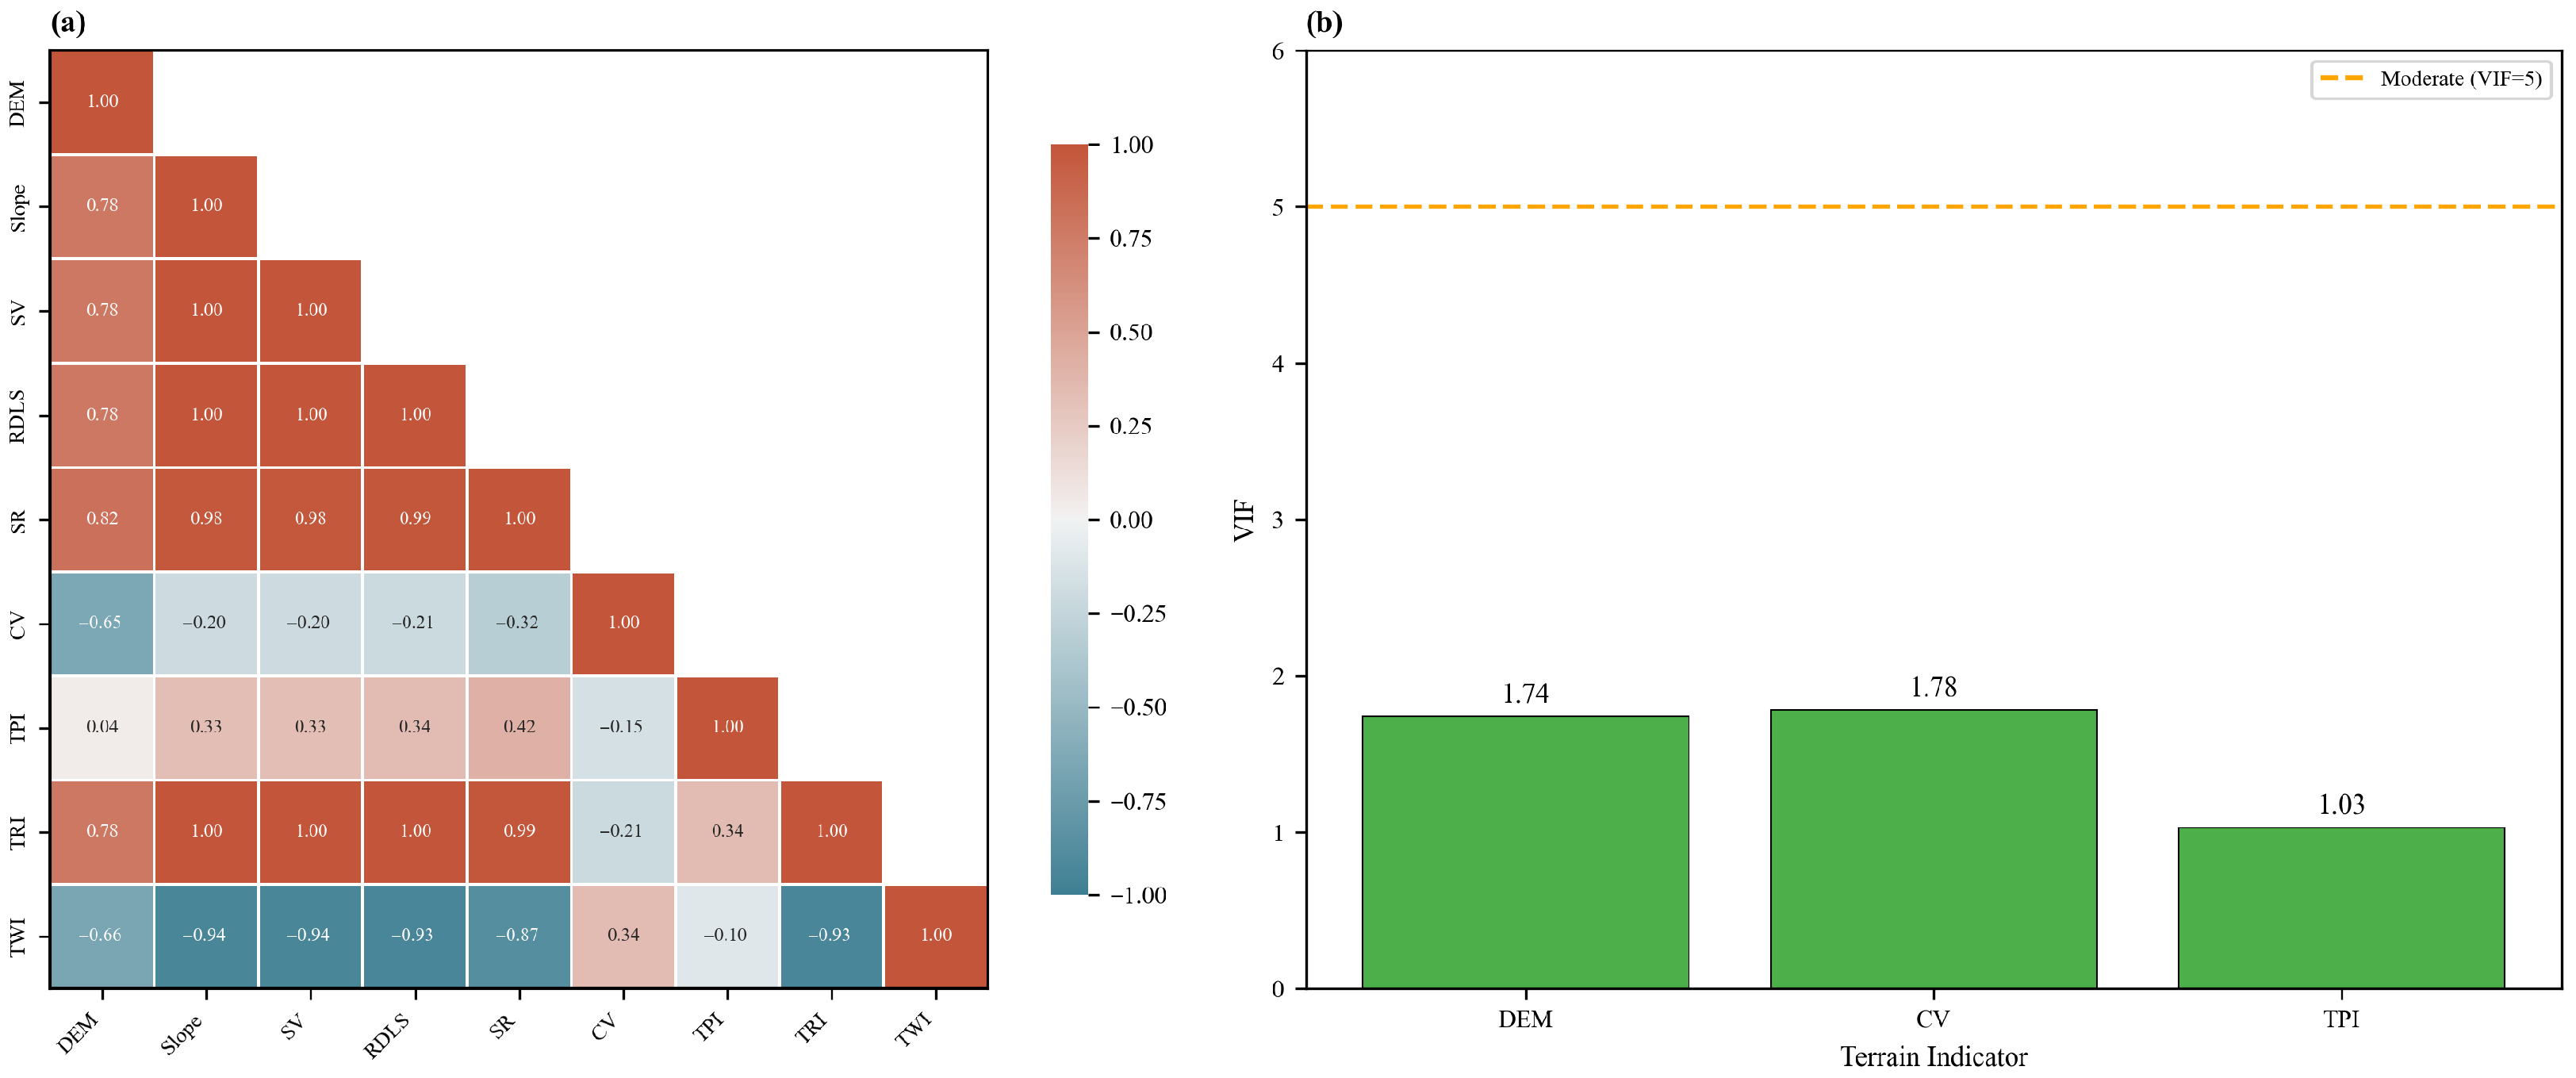
To quantify the constraining effects of natural geographical environments on human activities, indicators such as the Relief Degree of Land Surface (RDLS), Terrain Position Index (TPI), and Coefficient of Variation of elevation (CV) have been widely used to analyze the land resource carrying capacity and population distribution patterns [
24,
25,
26]. In the infrastructure domain, researchers have increasingly recognized that a single elevation indicator cannot comprehensively reflect the actual impediments posed by complex terrain; consequently, constructing an integrated Terrain Constraint Index (TCI) has become an important approach for measuring engineering difficulty and cost distance [
27]. However, the application of these indicators has largely remained at the level of static description. How to integrate terrain constraints—as a geographical background—with dynamic indicators reflecting economic–environmental relationships such as “carbon emission efficiency” or “decoupling elasticity” currently lacks a mature analytical framework.
Early decoupling studies primarily relied on elasticity coefficients from the Tapio model to characterize system evolution states [
28,
29,
30]. While this model is highly effective in identifying decoupling states, it often struggles to reveal the complex nonlinear relationships between geographical environments and socioeconomic factors [
31]. In recent years, to overcome this “descriptive” limitation, researchers have begun employing tools such as the Geodetector to enhance the identification of spatial differentiation drivers [
32,
33]. The introduction of this approach enables observation of how the terrain indirectly affects emission intensity by intervening in investment efficiency. This not only echoes Wang’s (2022) argument that carbon neutrality governance requires “place-based strategies” but also demands that research designs integrate state description (e.g., the Tapio model) with mechanism detection (e.g., the Geodetector) to more clearly reveal the deep-seated drivers behind decoupling phenomena [
34].
Despite the recognized importance of geographical factors, how terrain undulation specifically intervenes in investment efficiency and deteriorates decoupling performance remains insufficiently discussed in the existing empirical work. Most studies tend to simplify the spatial resistance imposed by terrain when analyzing decoupling, limiting the targeting of emission reduction policies for mountainous regions. This study posits that terrain factors primarily operate through an indirect mechanism: complex geographical conditions increase transportation difficulty and construction workload, constrain the selection of efficient construction methods, and thereby reduce the carbon emission efficiency of infrastructure investment. It is precisely this “efficiency discount” that makes it difficult for topographically complex regions to achieve desirable decoupling states. This constitutes the essential distinction between this study and the traditional paradigm: we not only narrow the analytical focus from macroeconomic aggregates to the high-energy-consumption sector of “infrastructure investment” but also attempt to extend the “terrain cost” logic to the dynamic domain of “carbon efficiency”, aiming to empirically test the complete transmission chain of “terrain constraint → investment carbon efficiency → decoupling performance”. Accordingly, we propose three testable hypotheses:
H1. Regional terrain complexity is negatively associated with the carbon decoupling performance of infrastructure investment. That is, regions with higher terrain complexity tend to exhibit higher decoupling elasticity values and face greater difficulty in achieving favorable decoupling states.
H2. The influence of terrain constraints on the decoupling performance is indirect, operating primarily through weakening the carbon emission efficiency of infrastructure investment (i.e., increasing the emission burden per unit of investment).
H3. Terrain factors and socioeconomic drivers (e.g., investment scale) do not simply add linearly; rather, they exhibit synergistic enhancement effects, with their interaction explaining more of the spatial differentiation in decoupling than any single factor alone.
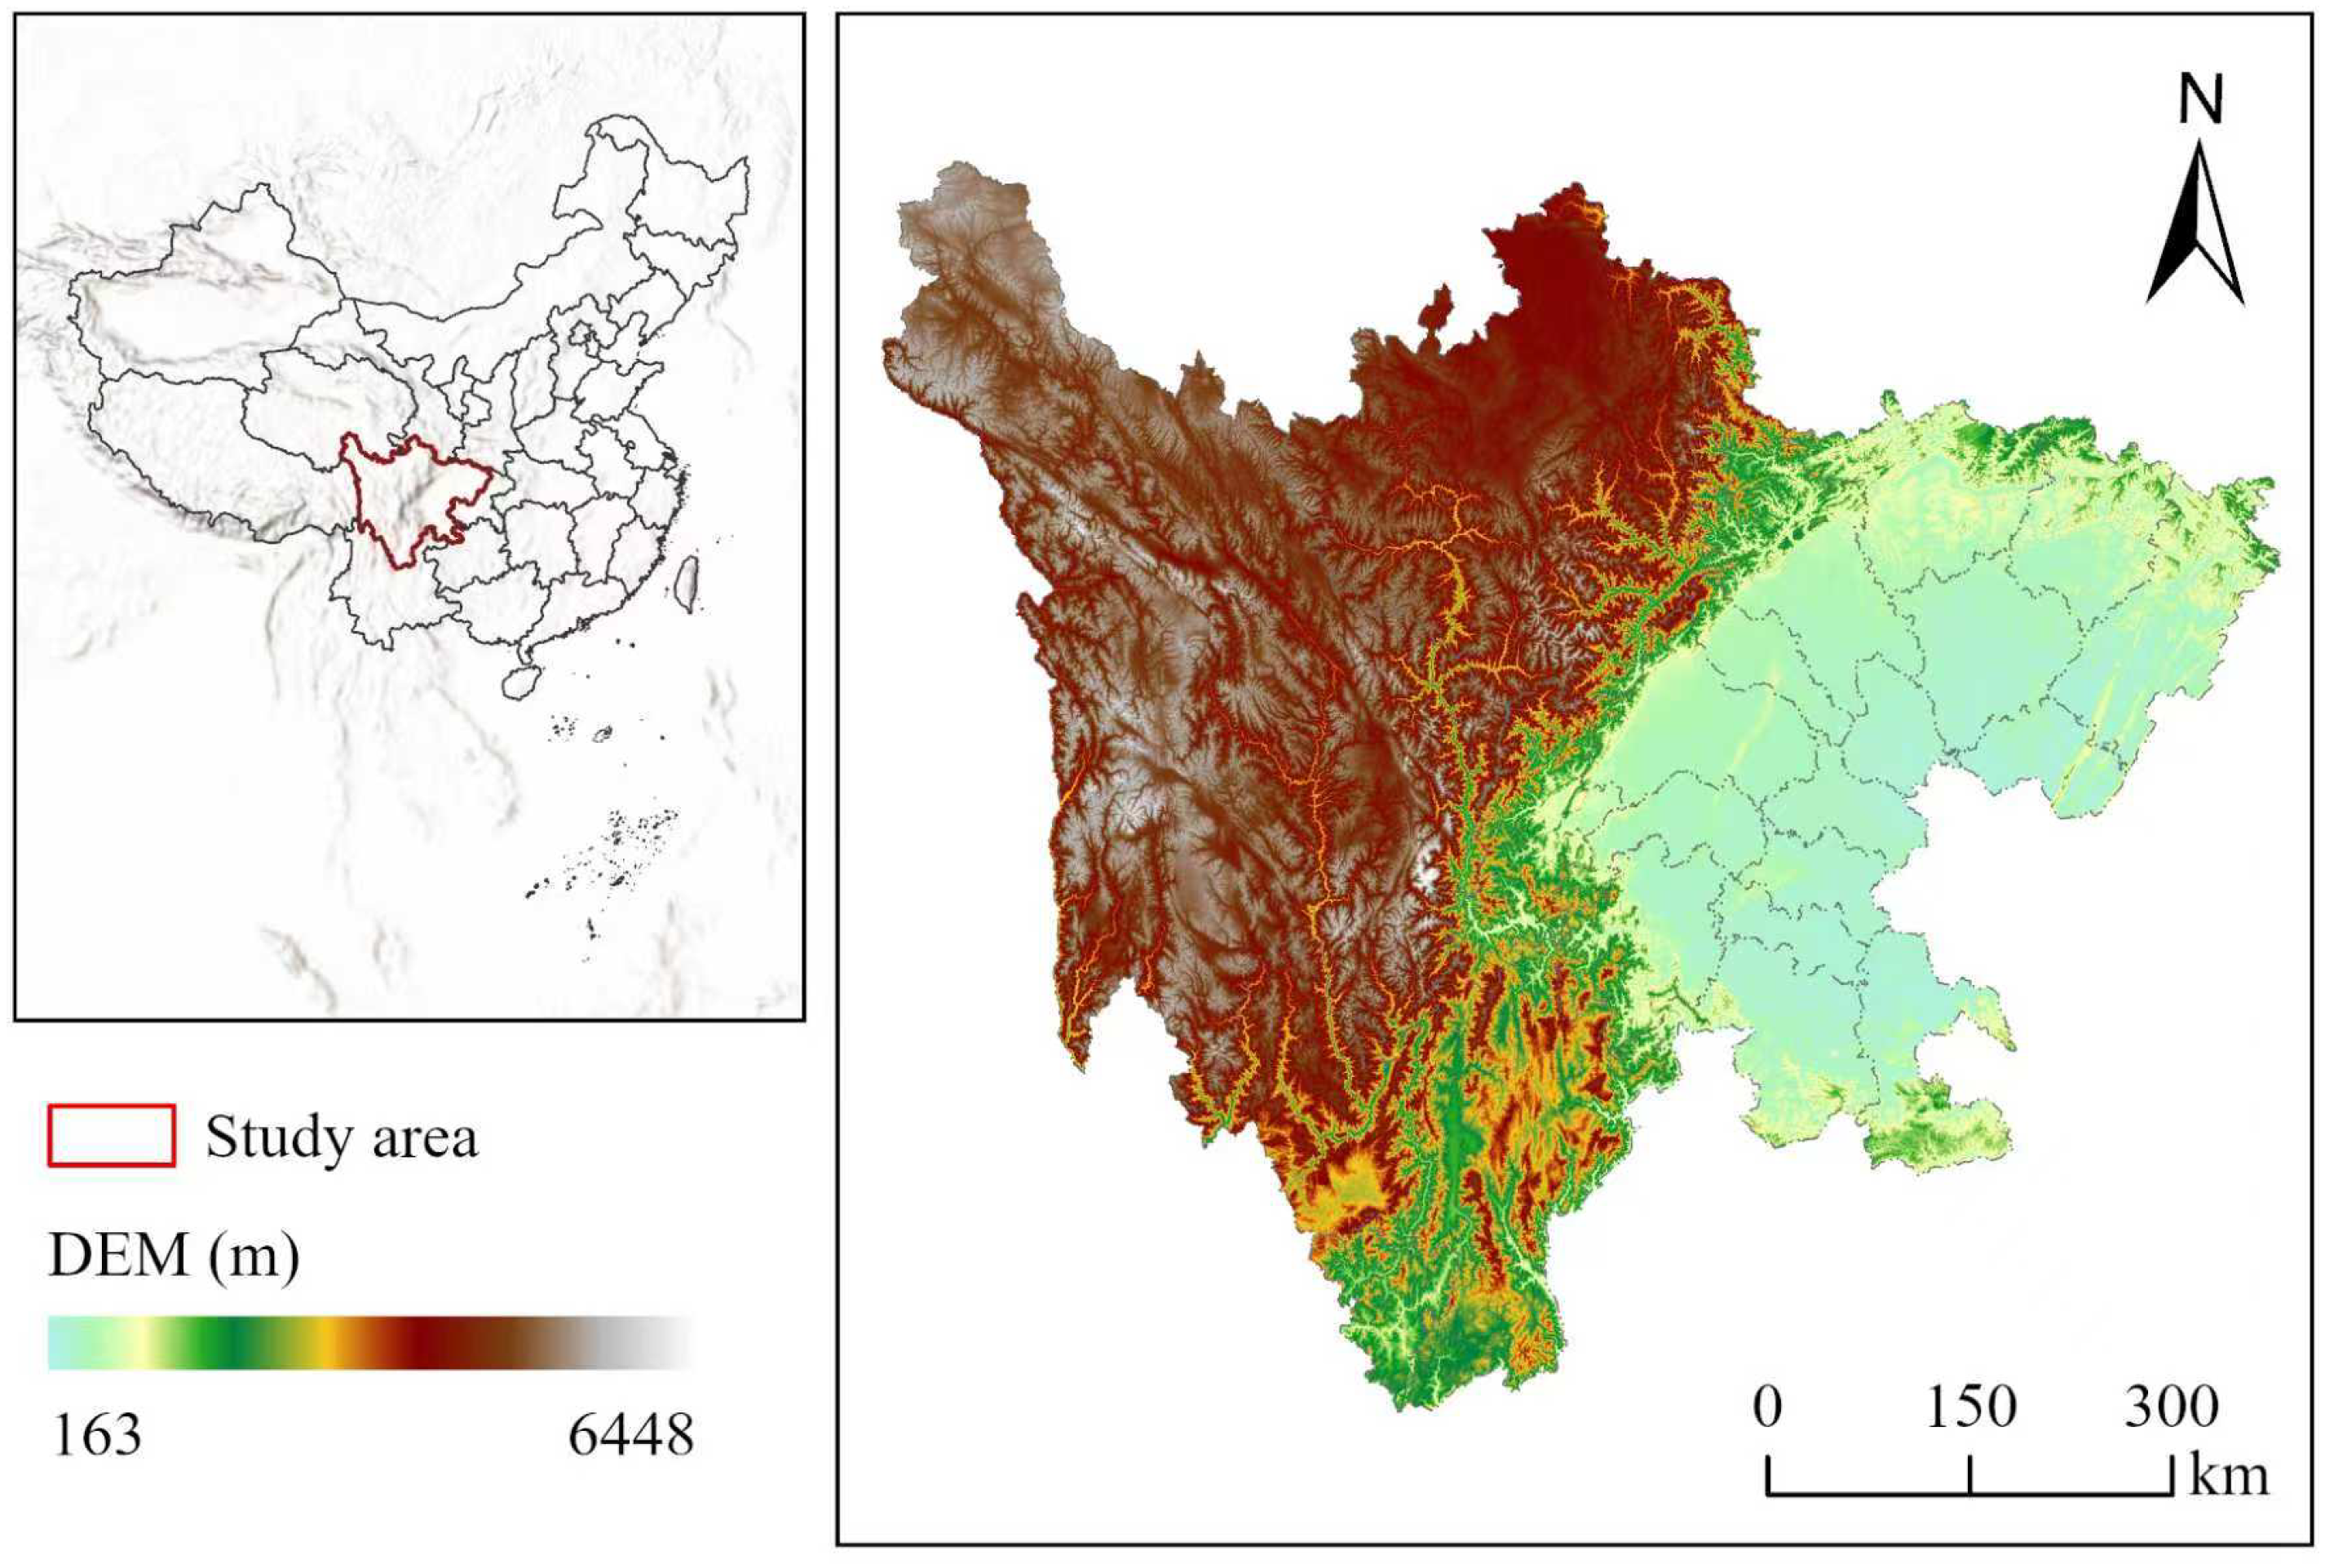
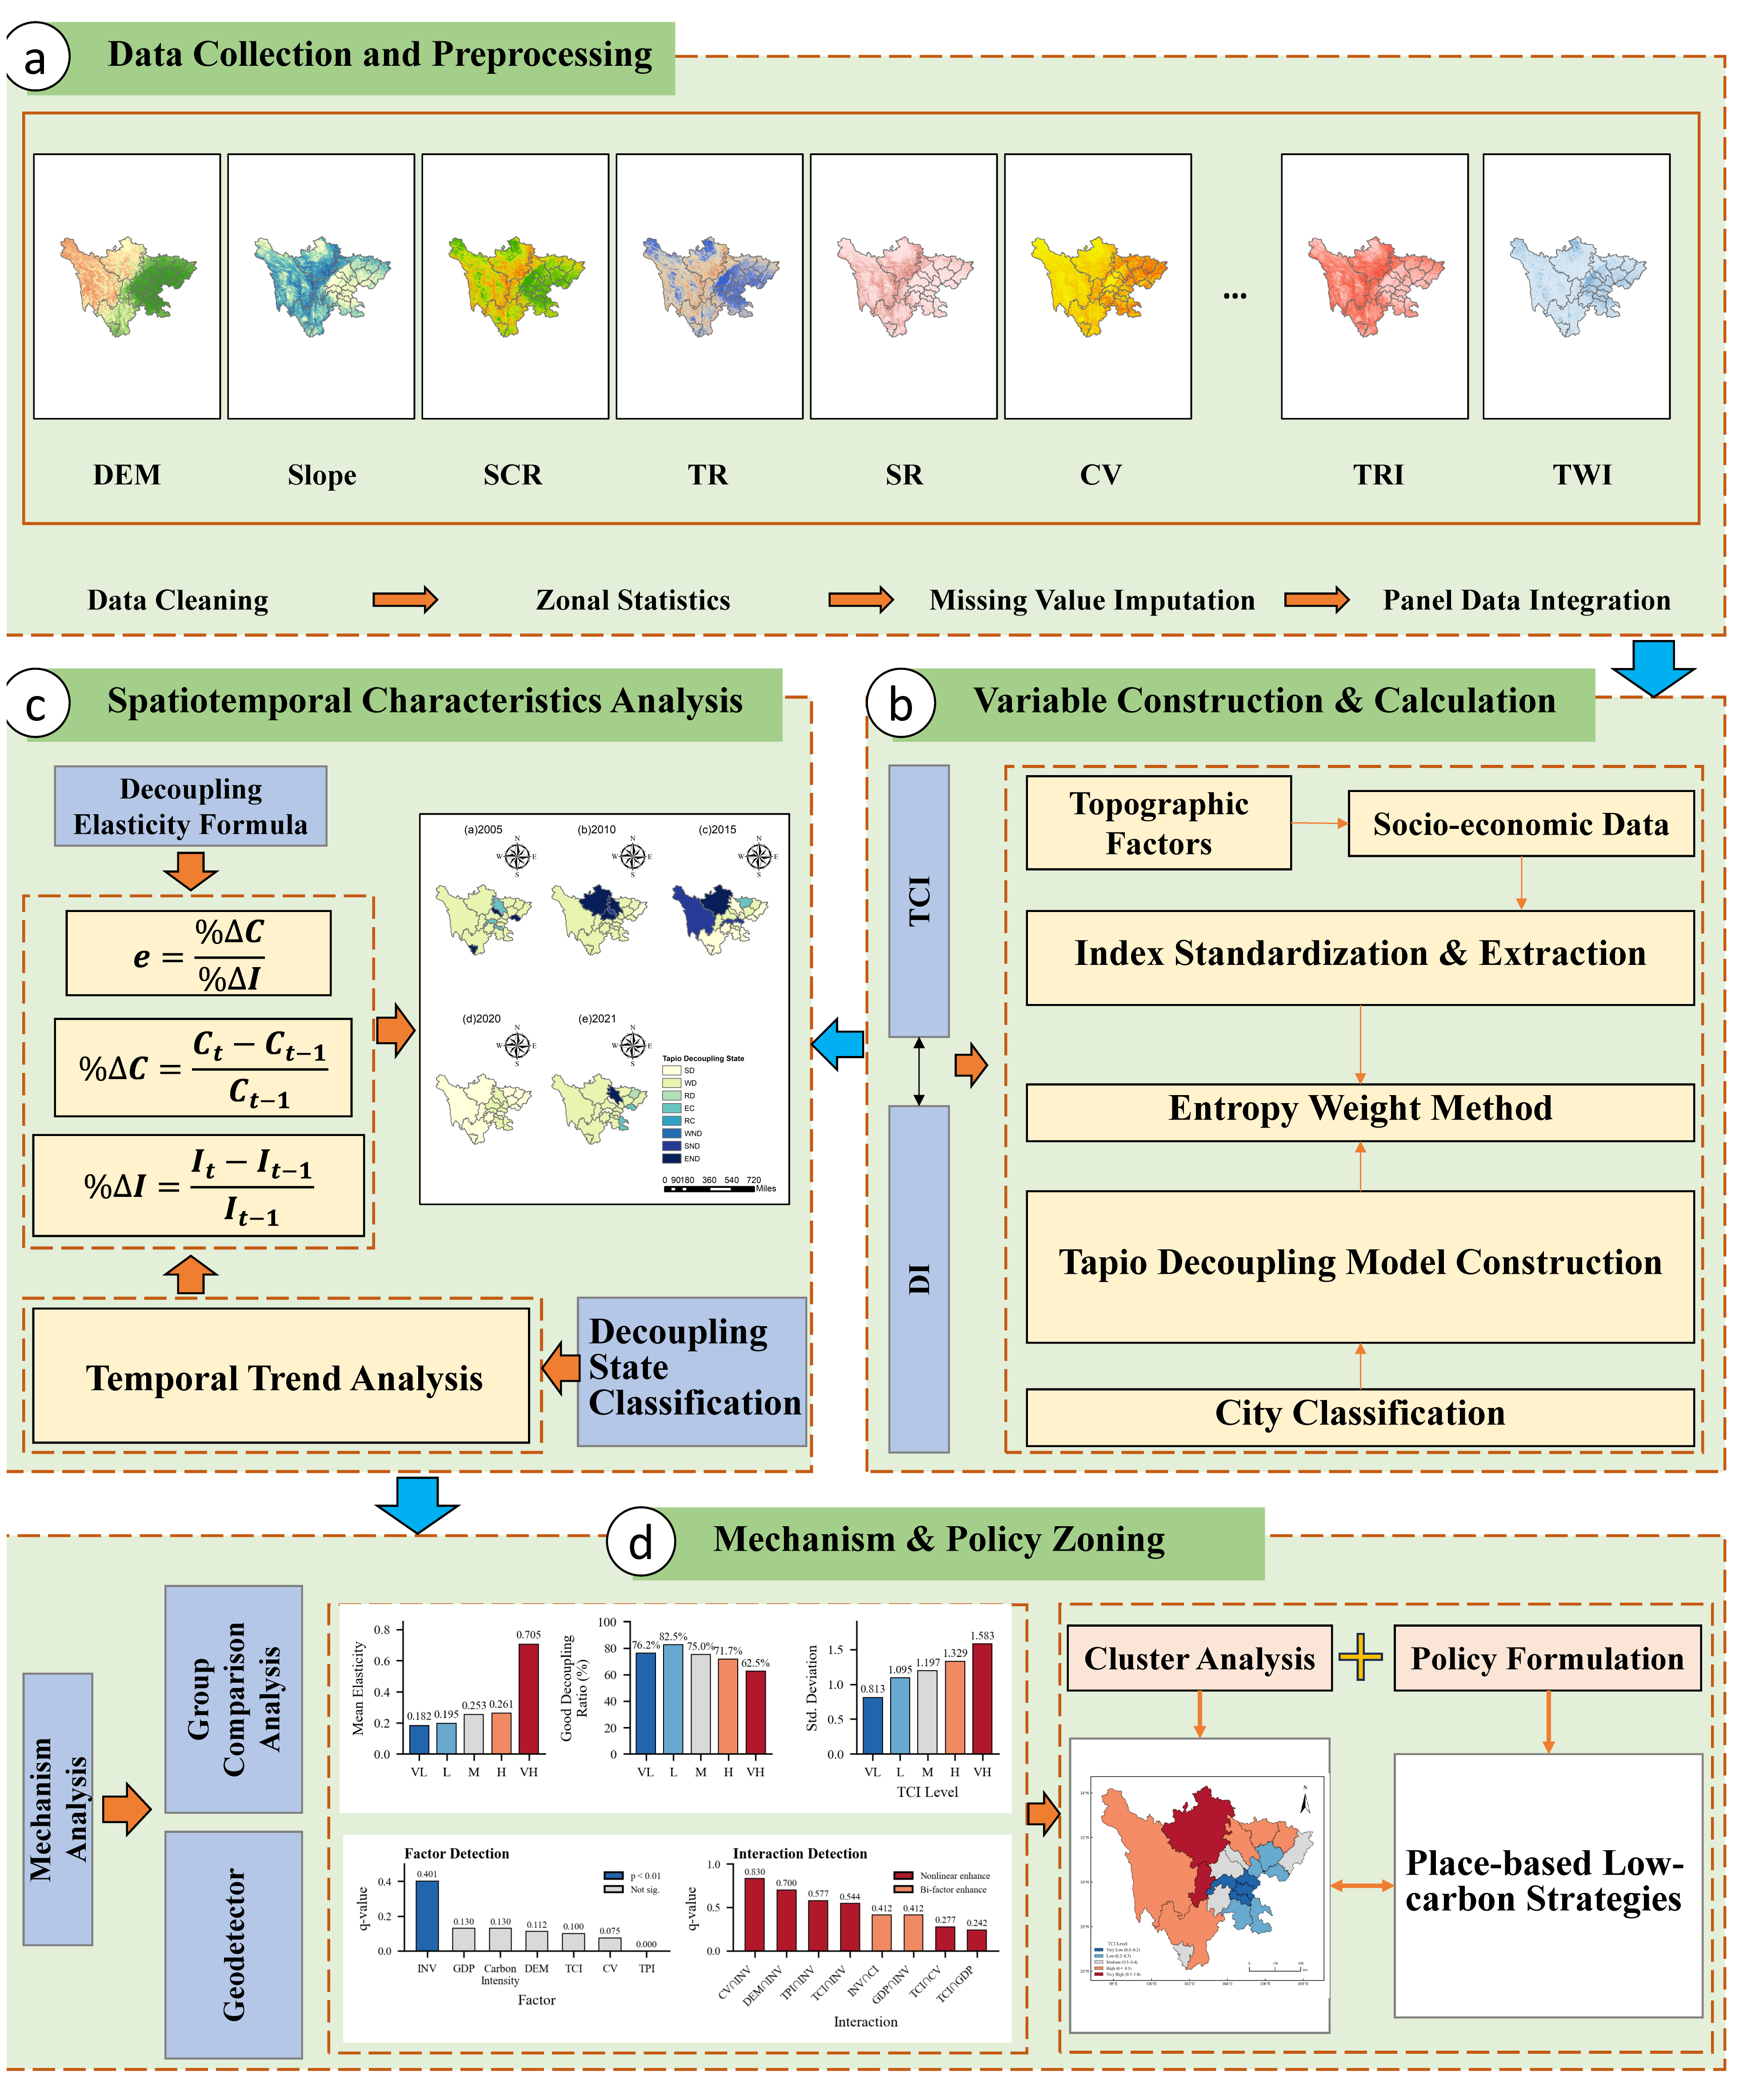
To test these hypotheses, this study selects Sichuan Province—a region characterized by pronounced terrain gradients and extreme internal heterogeneity—as the empirical case. The research proceeds in three stages: first, multi-source geographical data are integrated to construct a comprehensive TCI that quantifies the natural constraint intensity of each region; second, the Tapio decoupling model is employed to assess the evolution characteristics and decoupling states of infrastructure investment and carbon emissions across Sichuan’s prefecture-level cities during 2000–2021; finally, group comparison analysis and the Geodetector are applied to examine the moderating mechanism of terrain constraints on decoupling performance and to test whether H1, H2, and H3 are supported. The empirical findings are expected not only to provide support for Sichuan Province in formulating place-based low-carbon infrastructure plans but also to offer case-study references for other regions worldwide with similarly complex geographical conditions in balancing investment growth with green transition.
3. Results
3.1. Spatial Characteristics of Terrain Constraint Index
This study categorizes cities and prefectures in Sichuan Province into five terrain complexity levels based on the TCI calculated using the game theory combination weighting method (
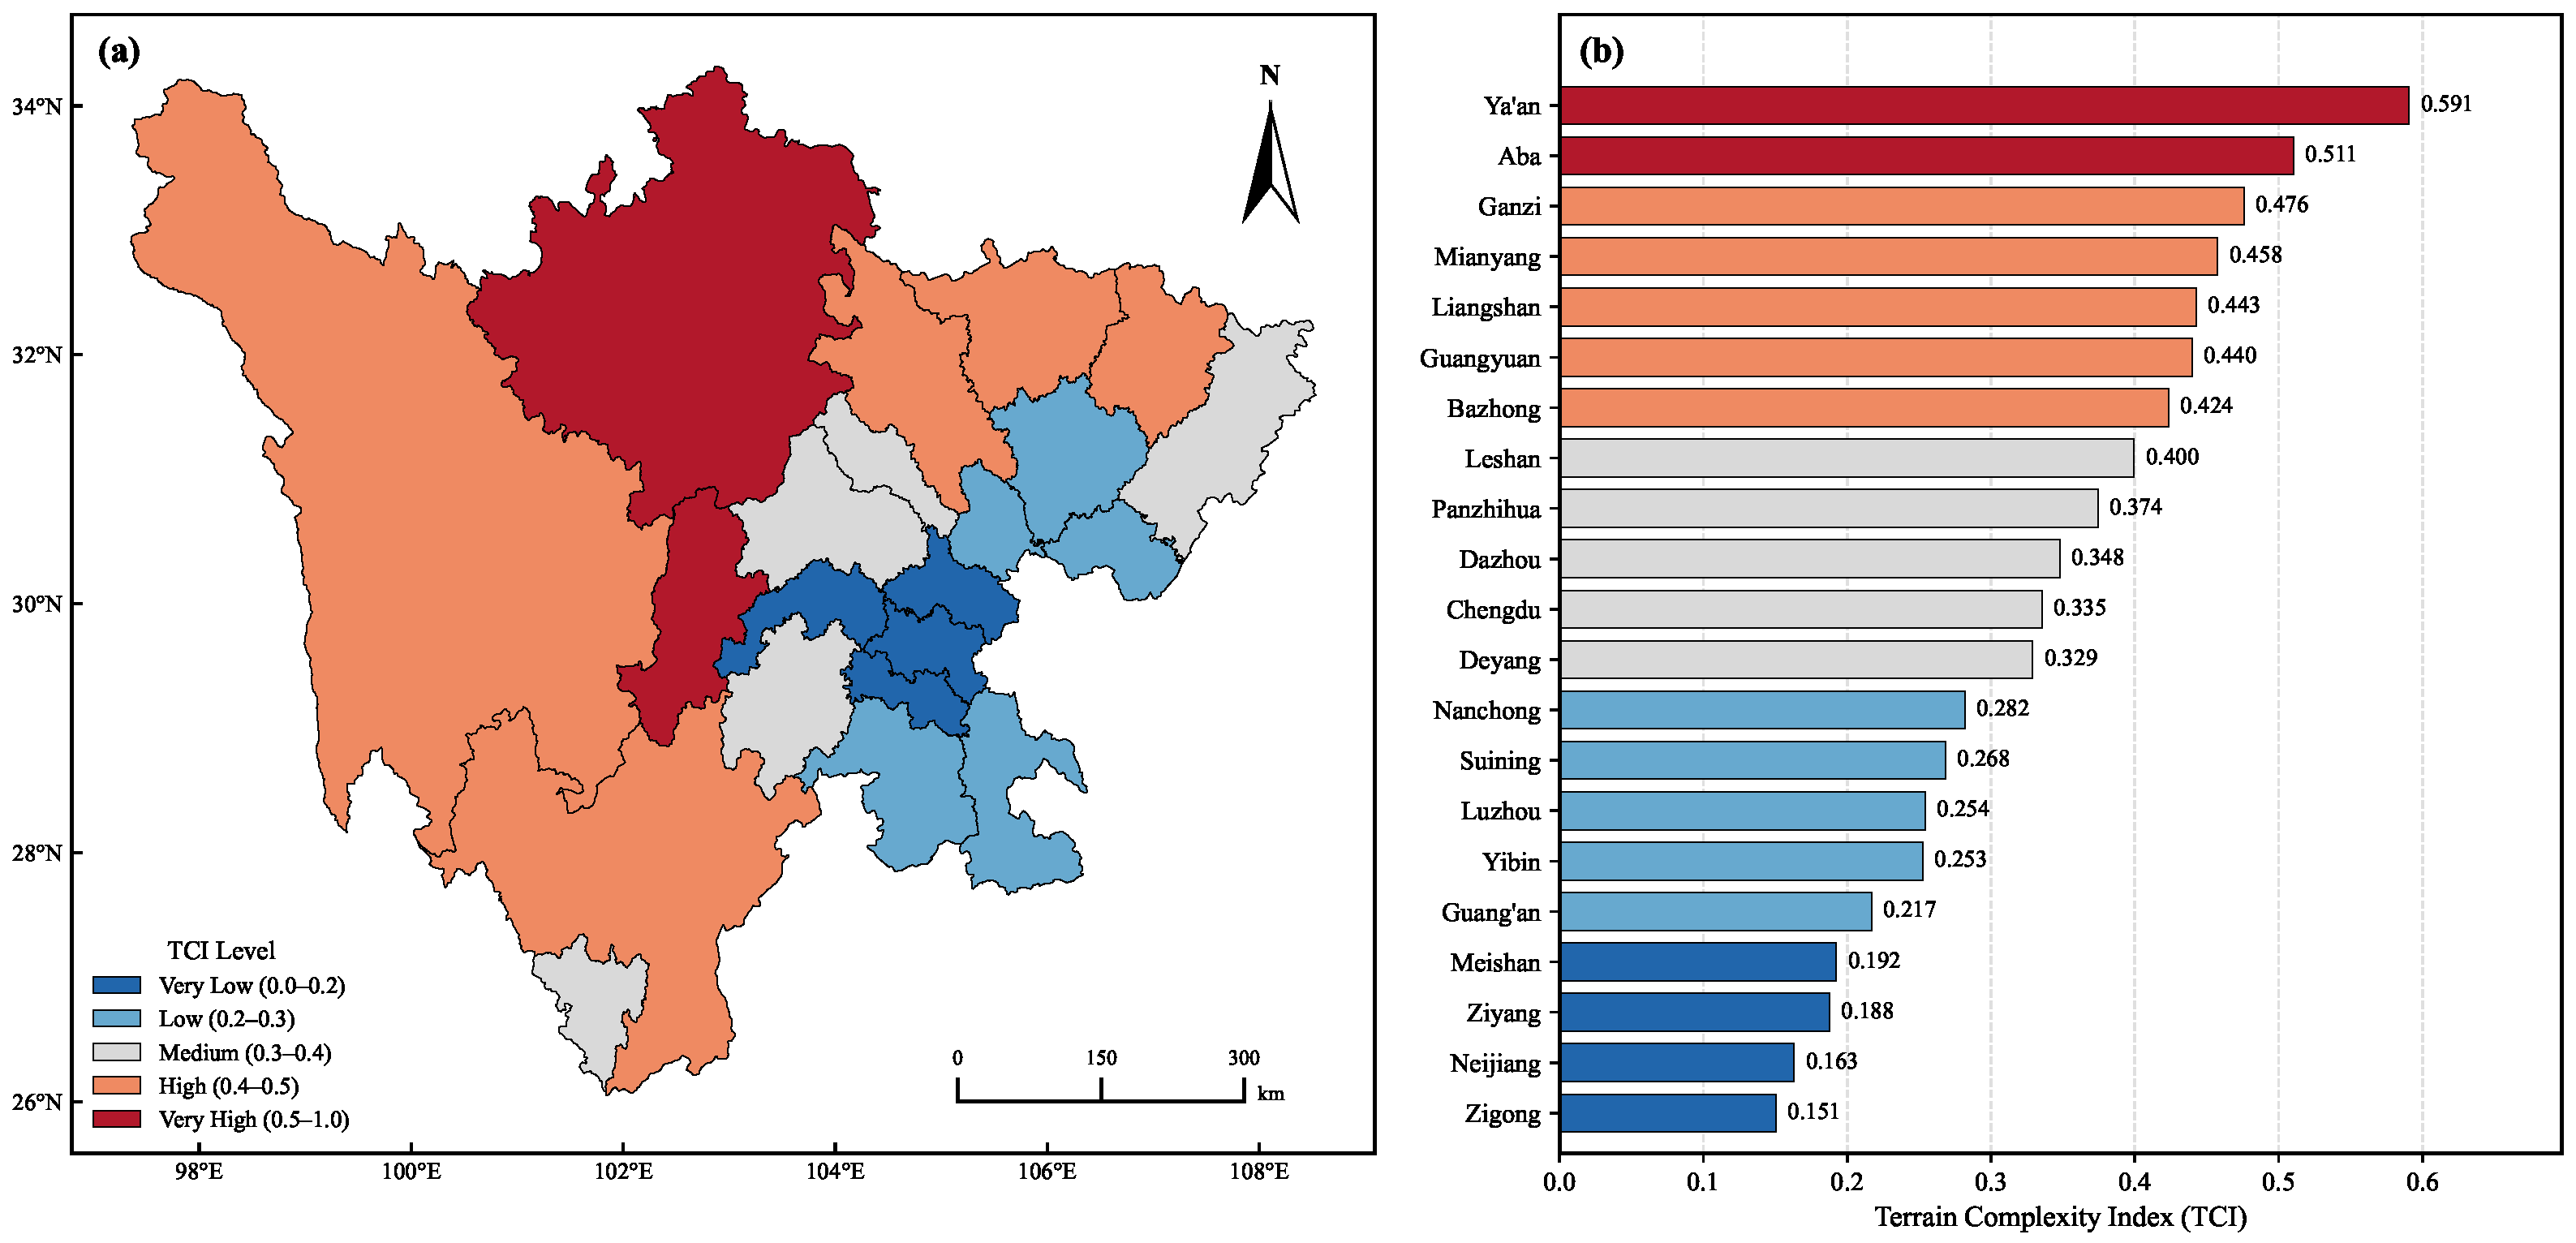
Table 6). Across the entire province of Sichuan, the TCI exhibits highly significant spatial heterogeneity, presenting an overall pattern of “high in the west, low in the east, with a stepped distribution”. The TCI values range from 0.151 (Zigong) to 0.591 (Ya’an), demonstrating substantial variation in terrain constraints across the region (
Figure 5).
Very High TCI Regions (TCI > 0.5) include Ya’an (0.591) and Aba (0.511), representing the most topographically complex areas in Sichuan Province. These regions are characterized by extremely high elevations, dramatic terrain variation, and significant engineering challenges for infrastructure development.
High TCI Regions (0.4–0.5) include Ganzi, Mianyang, Liangshan, Guangyuan, and Bazhong. These areas are primarily located in the western plateau and northern mountainous zones, facing substantial terrain constraints that increase infrastructure construction costs.
Medium TCI Regions (0.3–0.4) include Leshan, Panzhihua, Dazhou, Chengdu, and Deyang. These transitional zones connect the mountainous west with the basin east, presenting moderate topographical challenges.
Low TCI Regions (0.2–0.3) include Nanchong, Suining, Yibin, and Luzhou. These hilly areas offer relatively favorable conditions for infrastructure development compared to mountainous regions.
Very Low TCI Regions (TCI < 0.2) include Guang’an, Meishan, Ziyang, Neijiang, and Zigong. Located within the Sichuan Basin, these areas enjoy the most favorable terrain conditions, enabling efficient infrastructure construction with lower carbon intensity.
In summary, this spatial gradient of topographical constraints in Sichuan largely determines the carbon efficiency baseline for fixed-asset investments across regions, creating a stark contrast between the “low-constraint, high-efficiency” eastern areas and the “high-constraint, low-efficiency” western areas.
3.2. Spatiotemporal Evolution of Carbon Emissions and Decoupling Status
3.2.1. Spatiotemporal Evolution Characteristics of Carbon Emissions
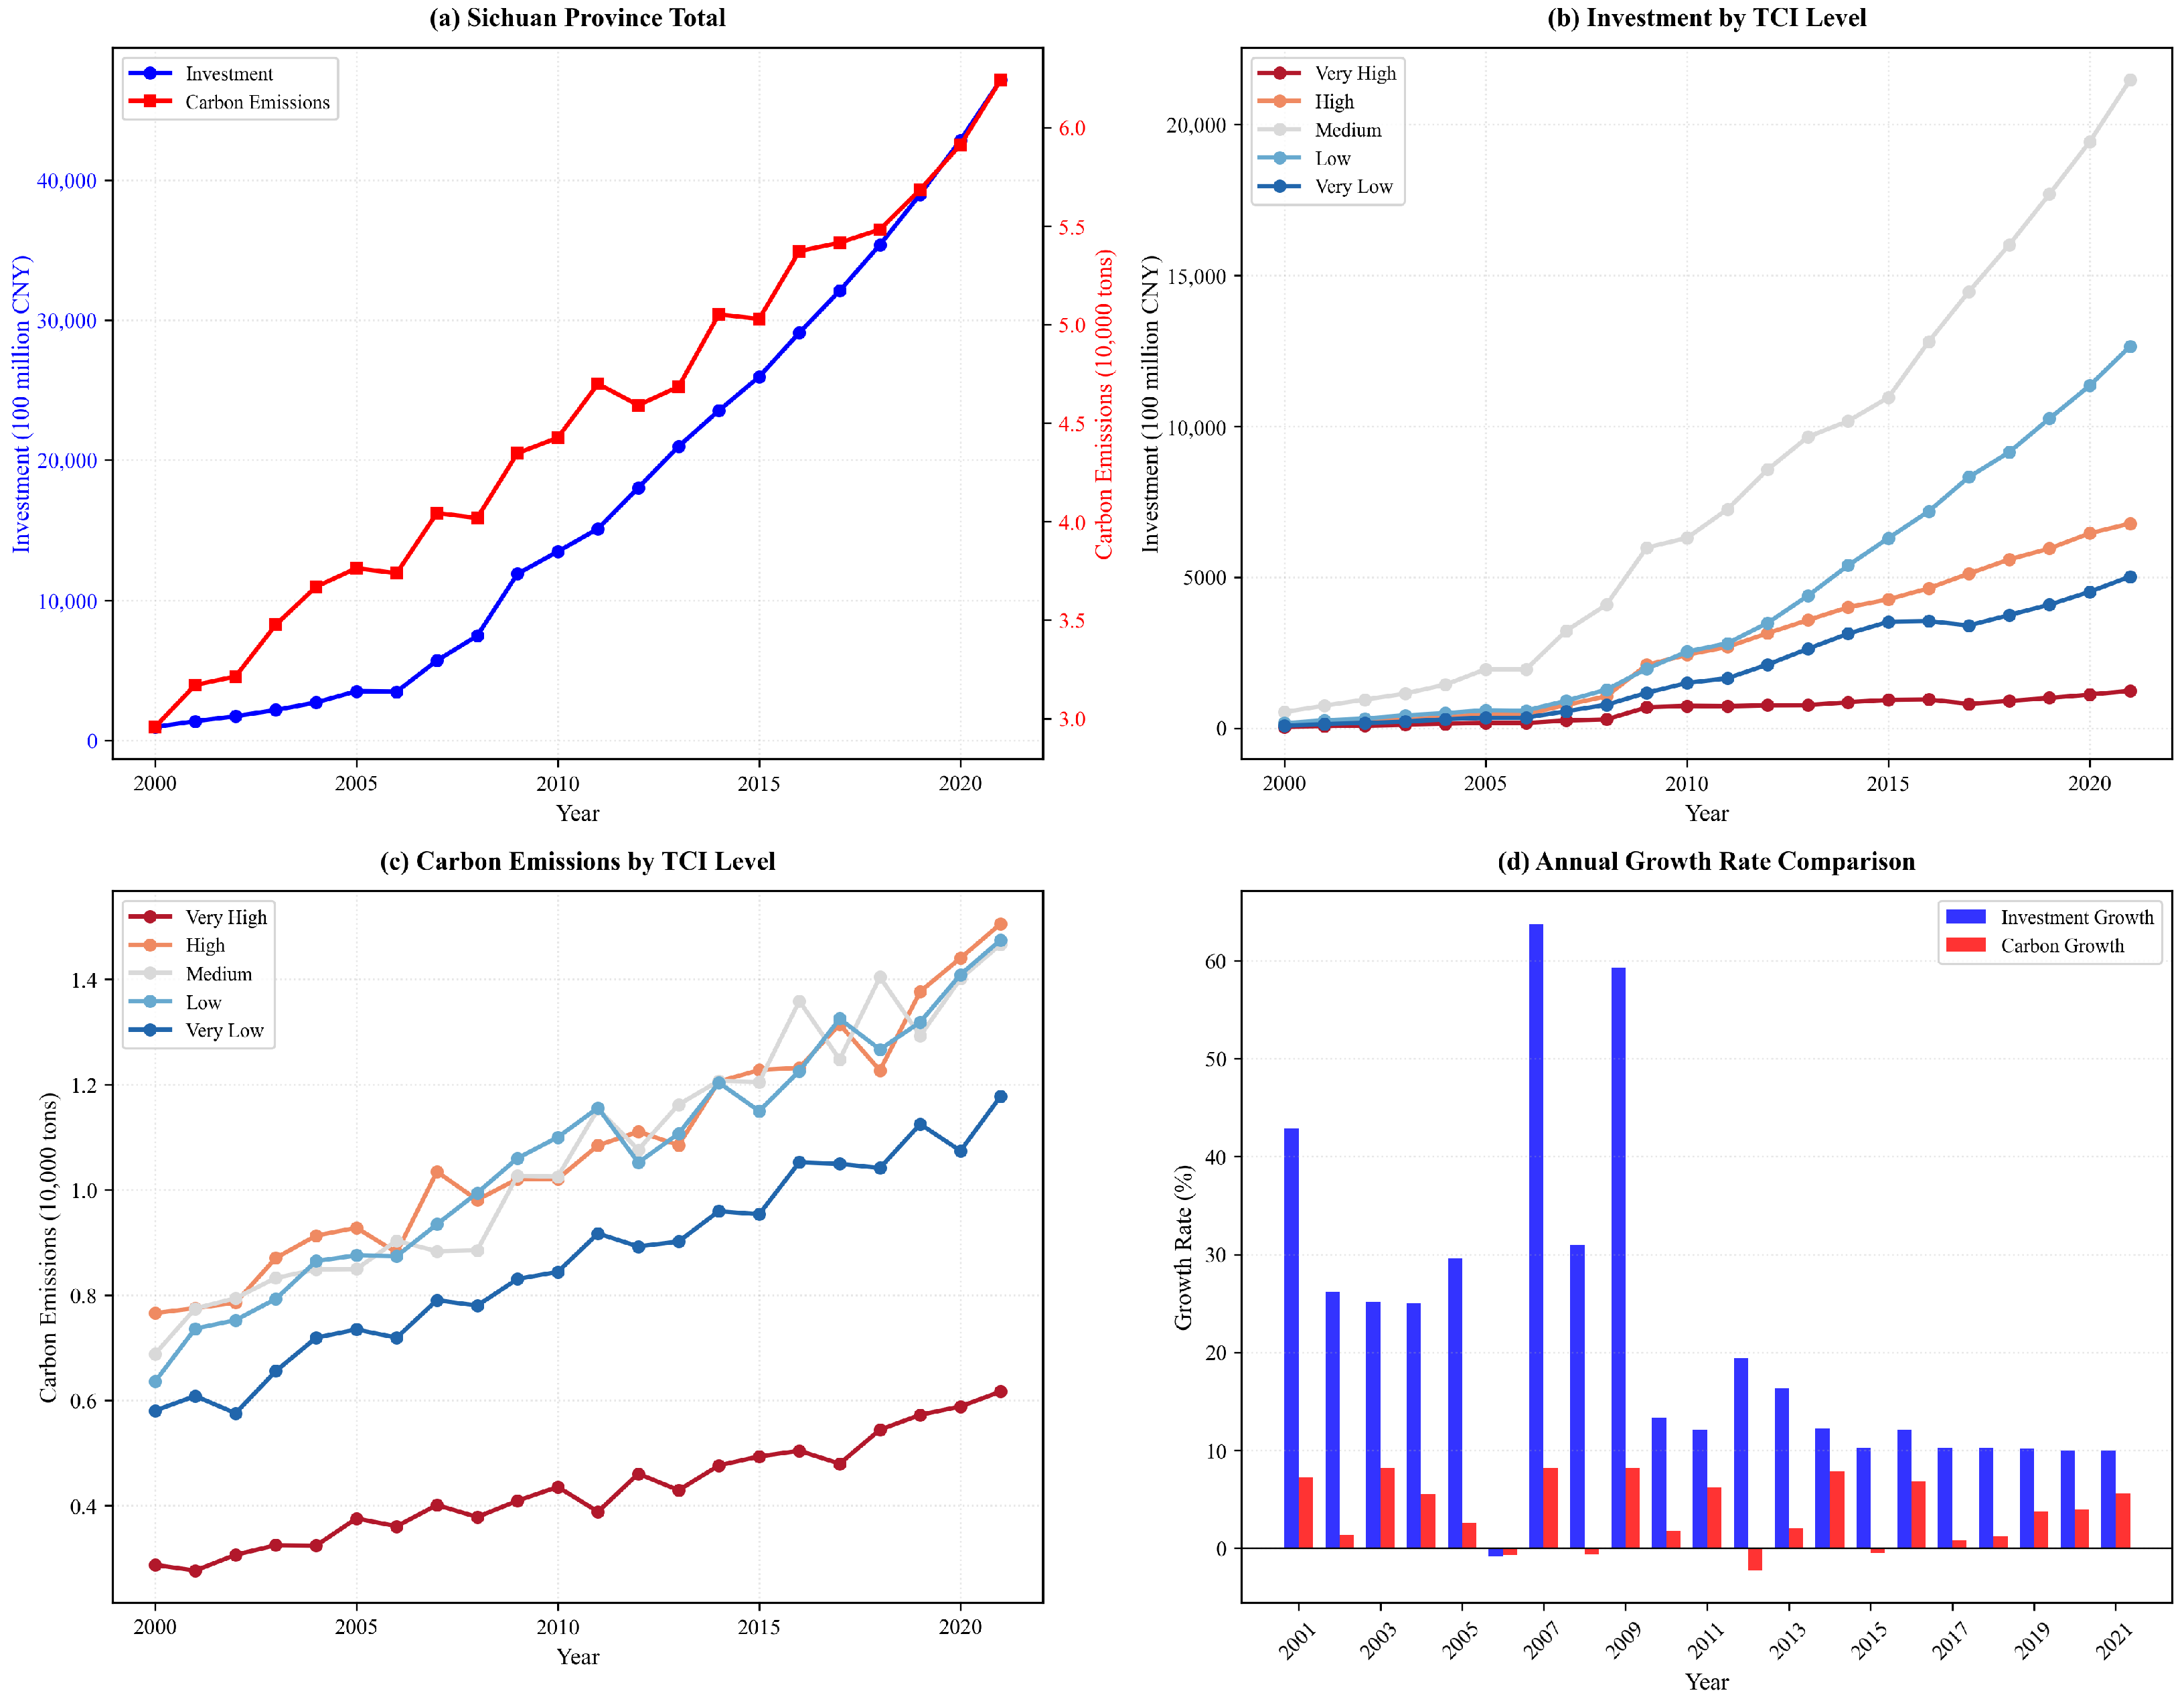
Sichuan Province’s carbon emissions trajectory exhibits path-dependent expansion characteristics closely coupled with the fixed-asset investment cycle. At the macro level (
Figure 6a), provincial emissions reached a peak growth momentum around 2013, subsequently entering a plateau phase marked by high-frequency fluctuations. Significant hierarchical differentiation emerges when classified by TCI (
Figure 6c): Very Low and Low TCI regions dominate total emissions but exhibit stabilizing growth rates, while High and Very High TCI regions demonstrate higher volatility, with carbon output showing high synchrony with investment surges (
Figure 6b).
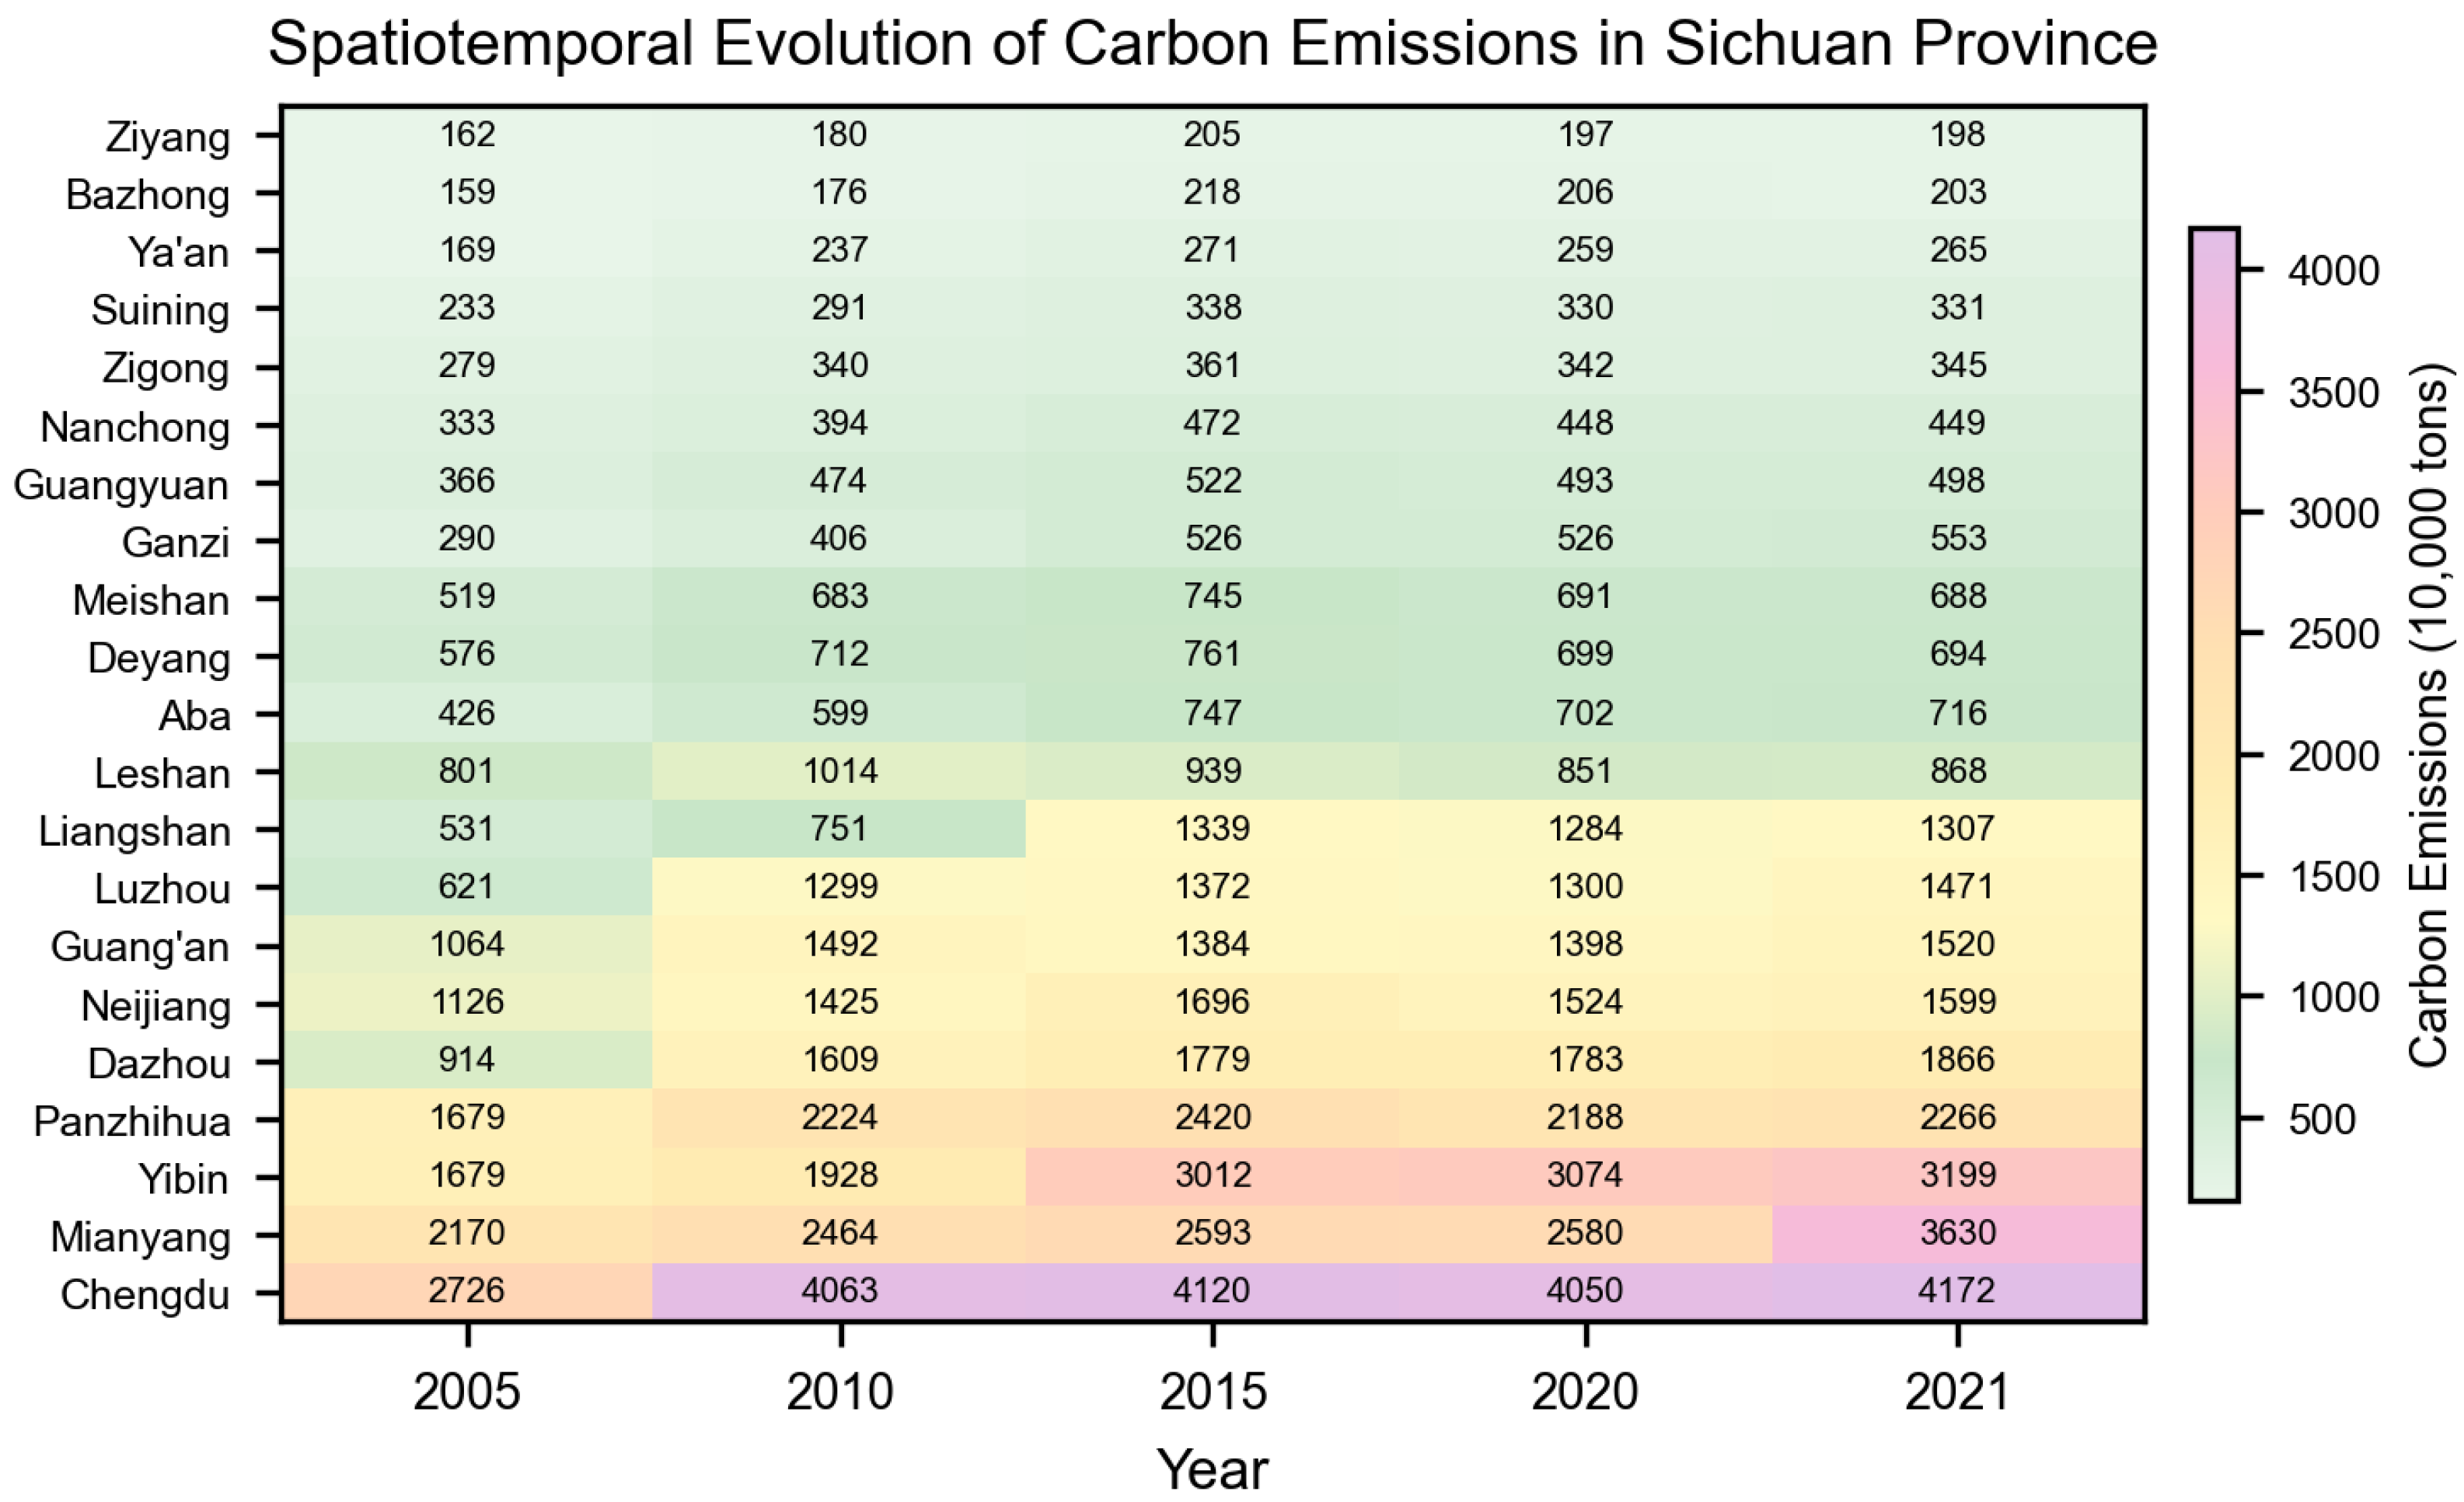
At the municipal level, spatial heatmaps (
Figure 7) clearly delineate Chengdu’s status as an enduring core of emissions, primarily driven by lock-in effects from its high-density industry and urbanization. Concurrently, industrial corridor cities like Yibin and Mianyang have emerged as secondary growth poles with rapidly intensifying heat values, contrasting sharply with peripheral cities like Bazhong and Ganzi that remain in a state of low emissions and high terrain constraints. This pattern suggests that Very Low and Low TCI regions may determine the baseline for provincial emissions, while High and Very High TCI regions potentially serve as key incremental areas for emission fluctuations. This could be attributed to the fact that high TCI areas typically have lower baseline emissions due to limited industrial activity but experience significant emission spikes during infrastructure construction phases when high-carbon activities such as tunnel excavation, bridge construction, and material transportation are concentrated within short periods.
3.2.2. Analysis of Decoupling Status Between Investment and Carbon Emissions
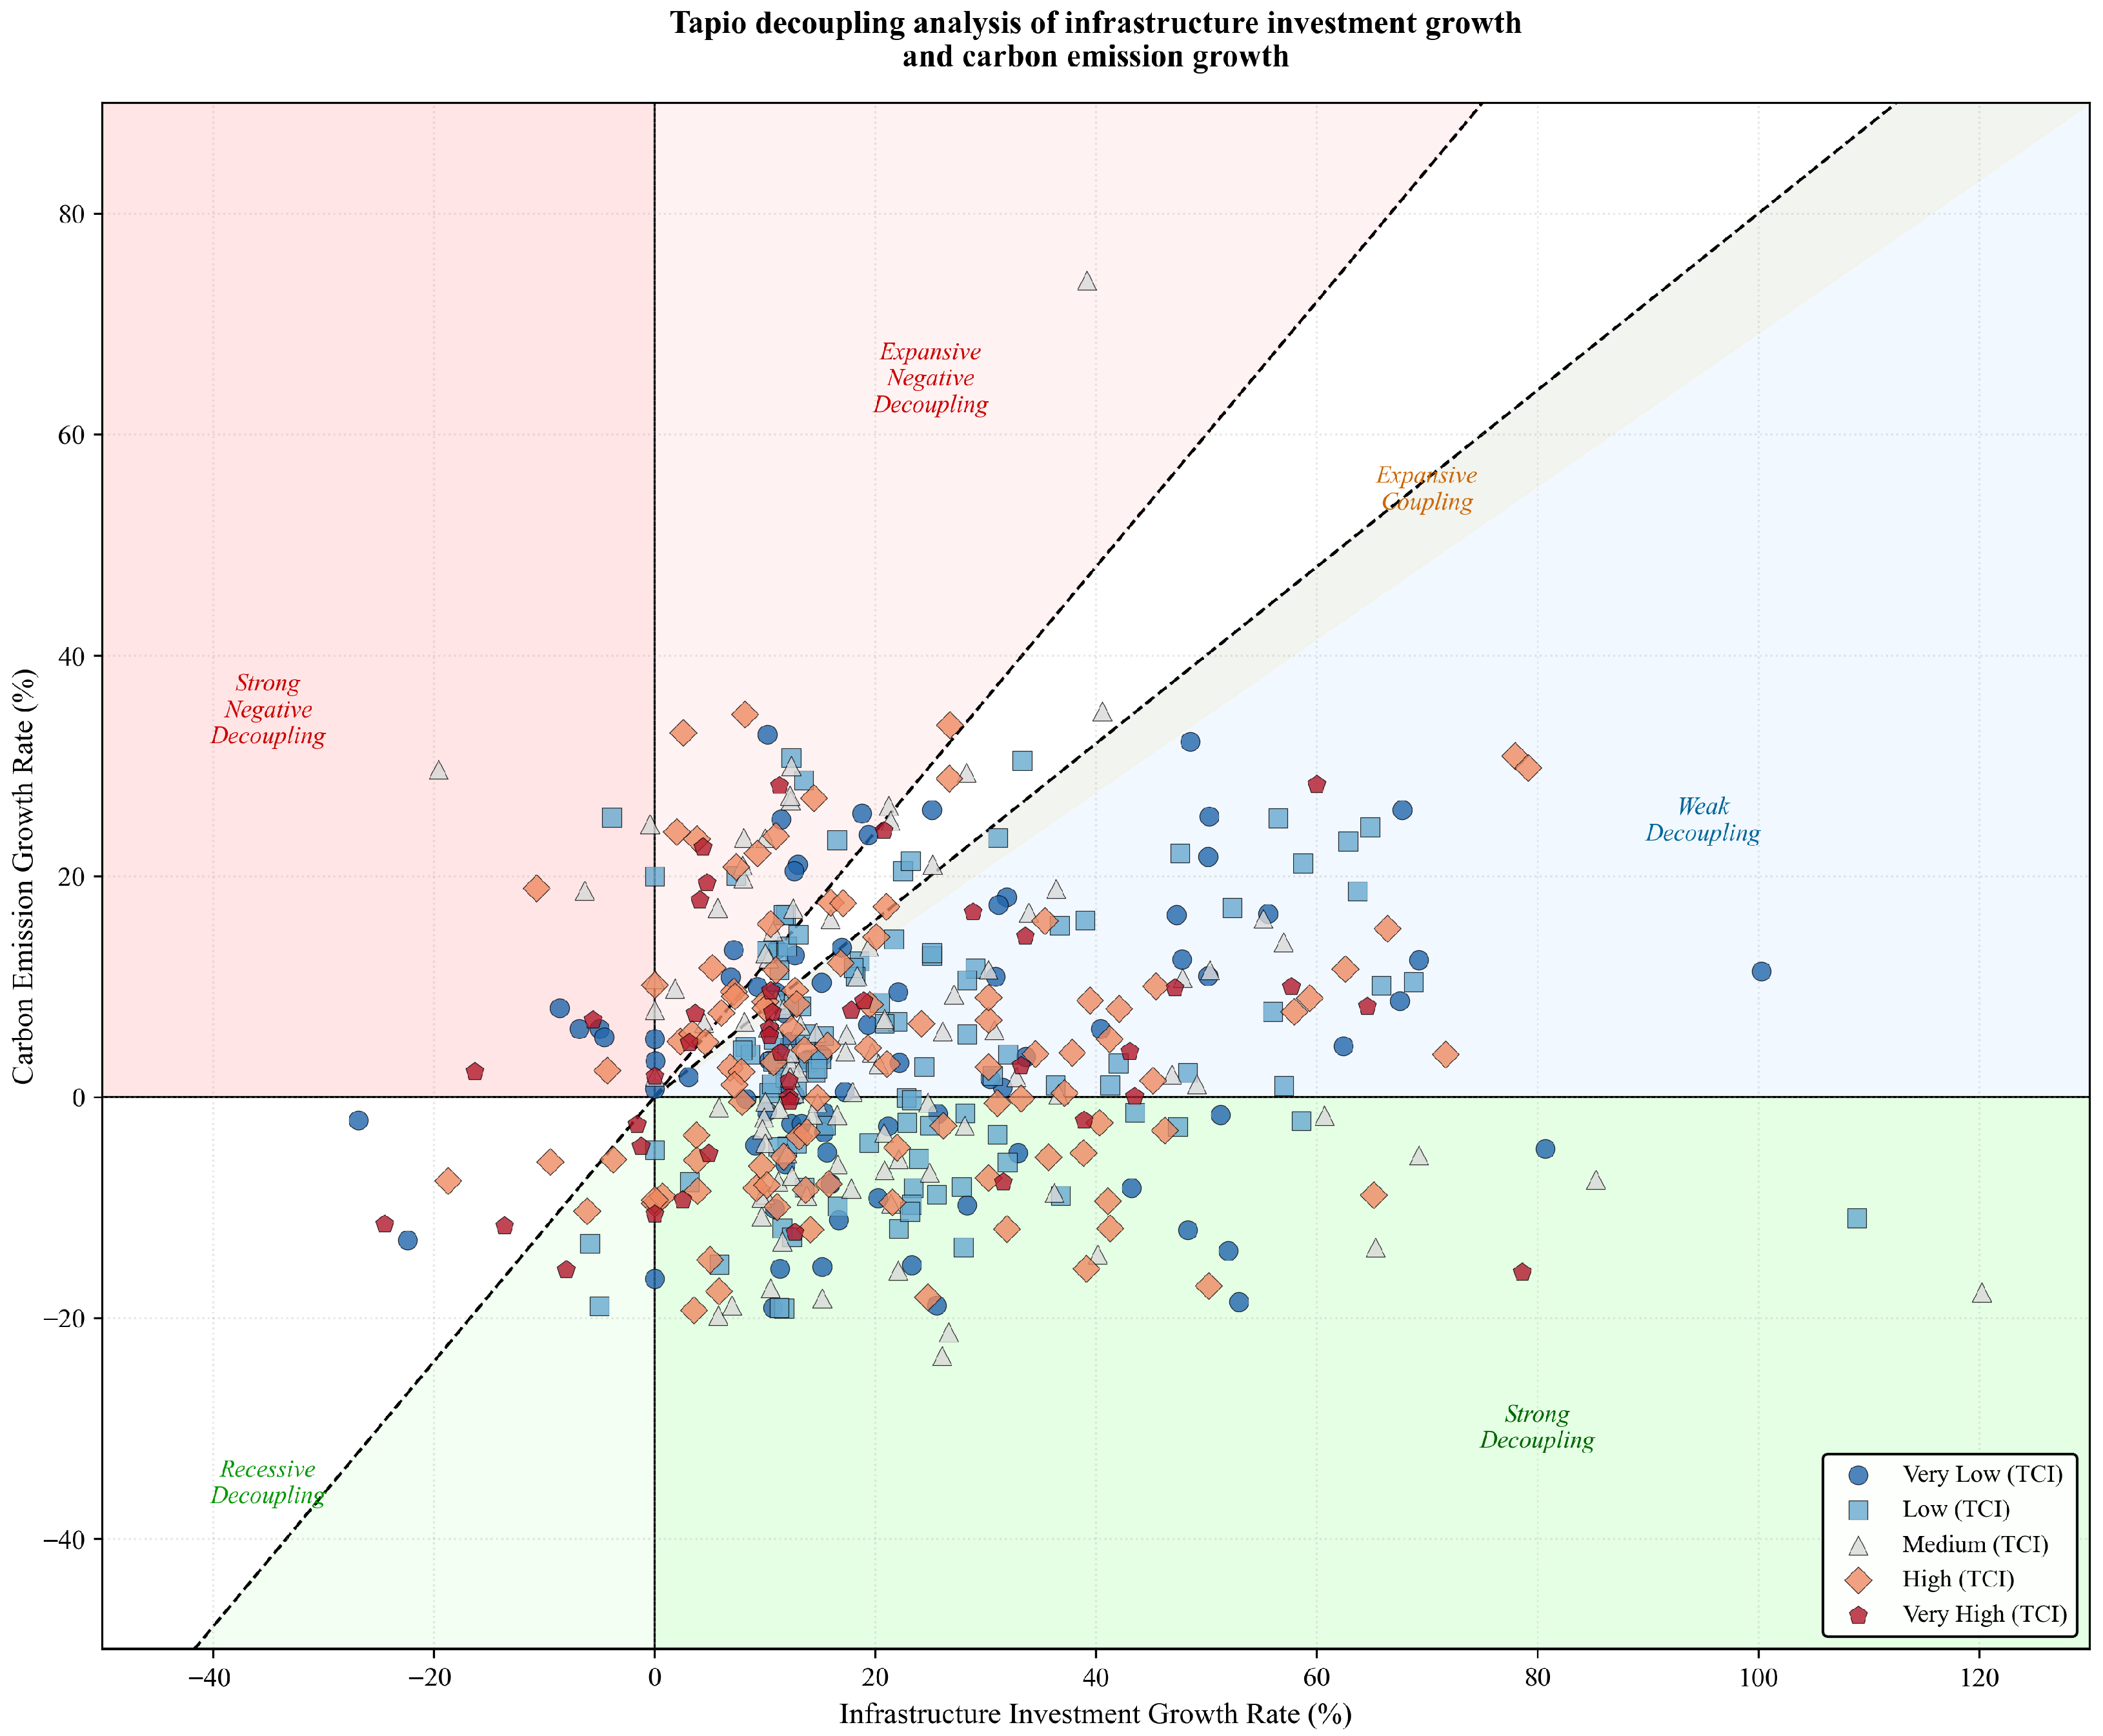
The decoupling linkage between investment and carbon emissions reveals a deep-seated “terrain–efficiency” penalty mechanism. The provincial sample primarily clusters within the WD and EC intervals, indicating that economic growth remains constrained by incremental carbon emissions. This evolution exhibits distinct TCI gradient characteristics: Very Low and Low TCI cities, benefiting from agglomeration economies and technological spillovers, are accelerating their migration toward the SD quadrant; whereas High and Very High TCI regions, scattered across the map (
Figure 8), demonstrate higher dispersion and frequently fall into END during intensive infrastructure construction phases.
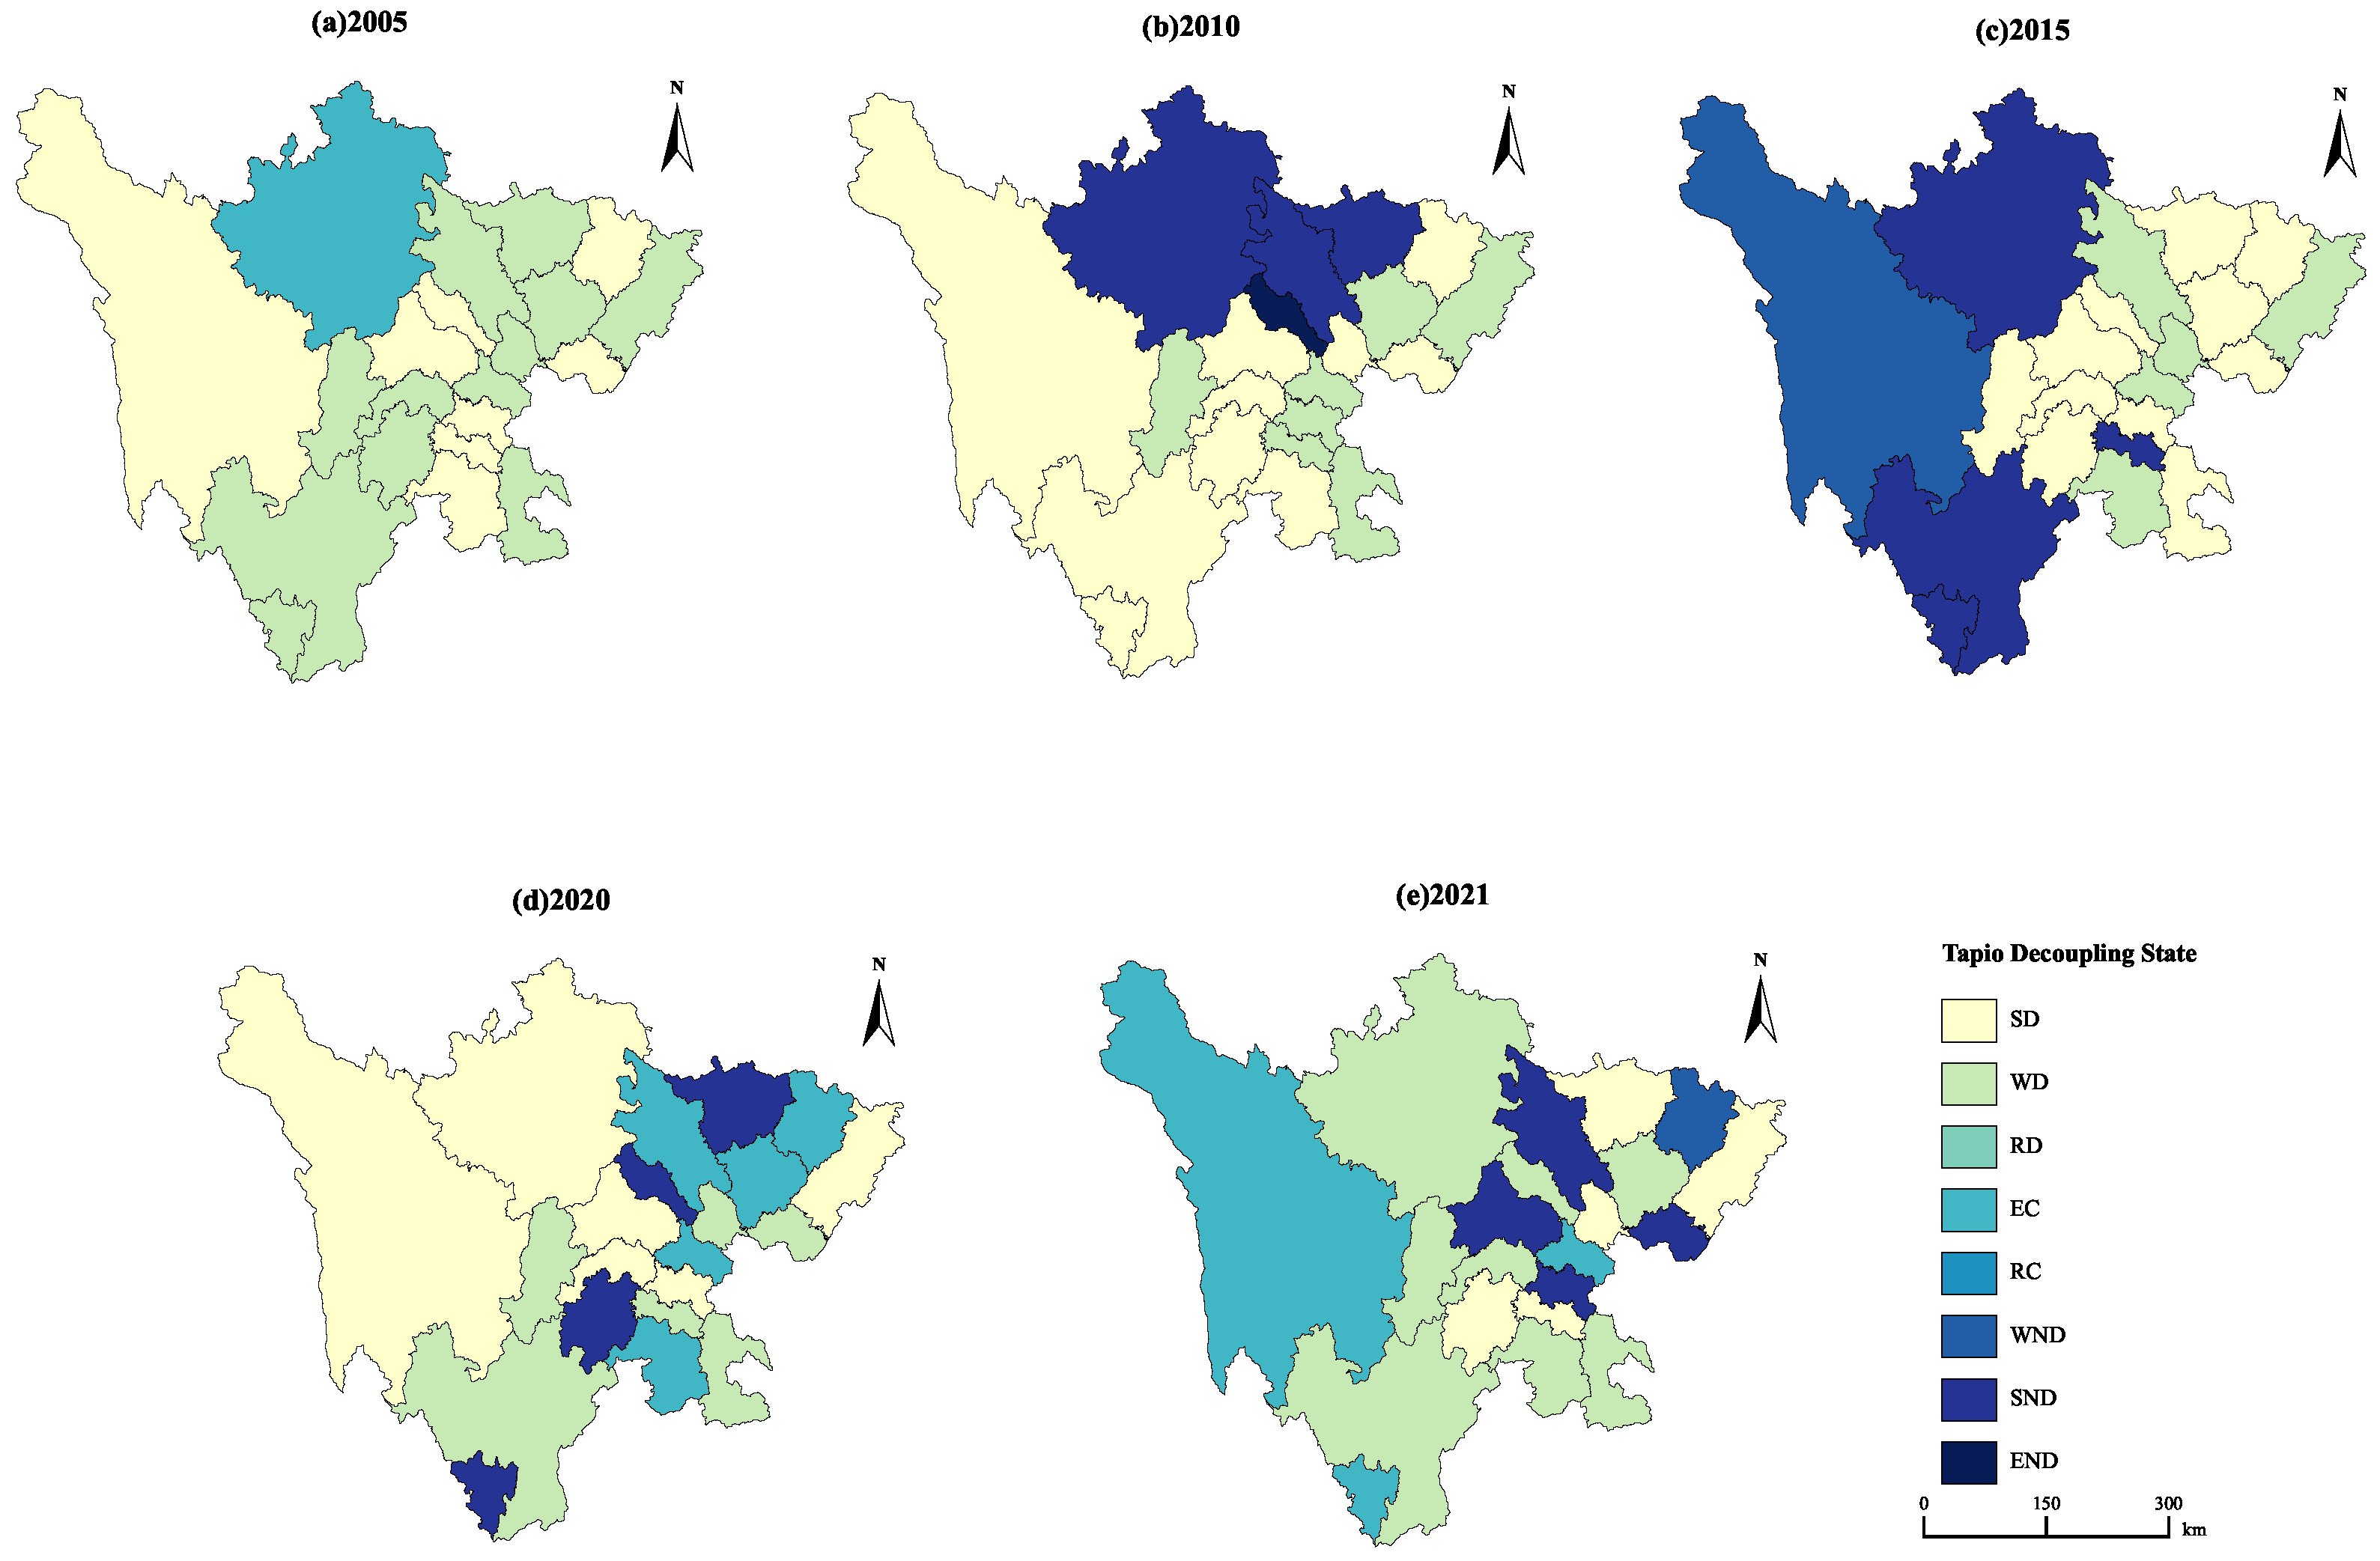
Spatiotemporal mapping (
Figure 9) further highlights this divergence, revealing the province’s transition from historical coupling to fragmented decoupling. However, frequent decoupling setbacks in western and northeastern Sichuan (High and Very High TCI regions) highlight structural barriers: the high carbon intensity required to overcome geographical friction—such as tunnel construction and high-elevation logistics—largely offsets the marginal efficiency gains from new investments. Consequently, Sichuan’s achievement of stable “strong decoupling” remains spatially constrained by carbon costs inherent to traversing complex terrain.
3.3. Group Comparison Analysis of Terrain Constraints on Decoupling Performance
To examine the correlation between terrain complexity and decoupling performance, this study employs group comparison analysis based on the five TCI classification levels. The results reveal a clear negative correlation between terrain complexity and decoupling outcomes (
Table 7).
The group comparison results reveal several important findings:
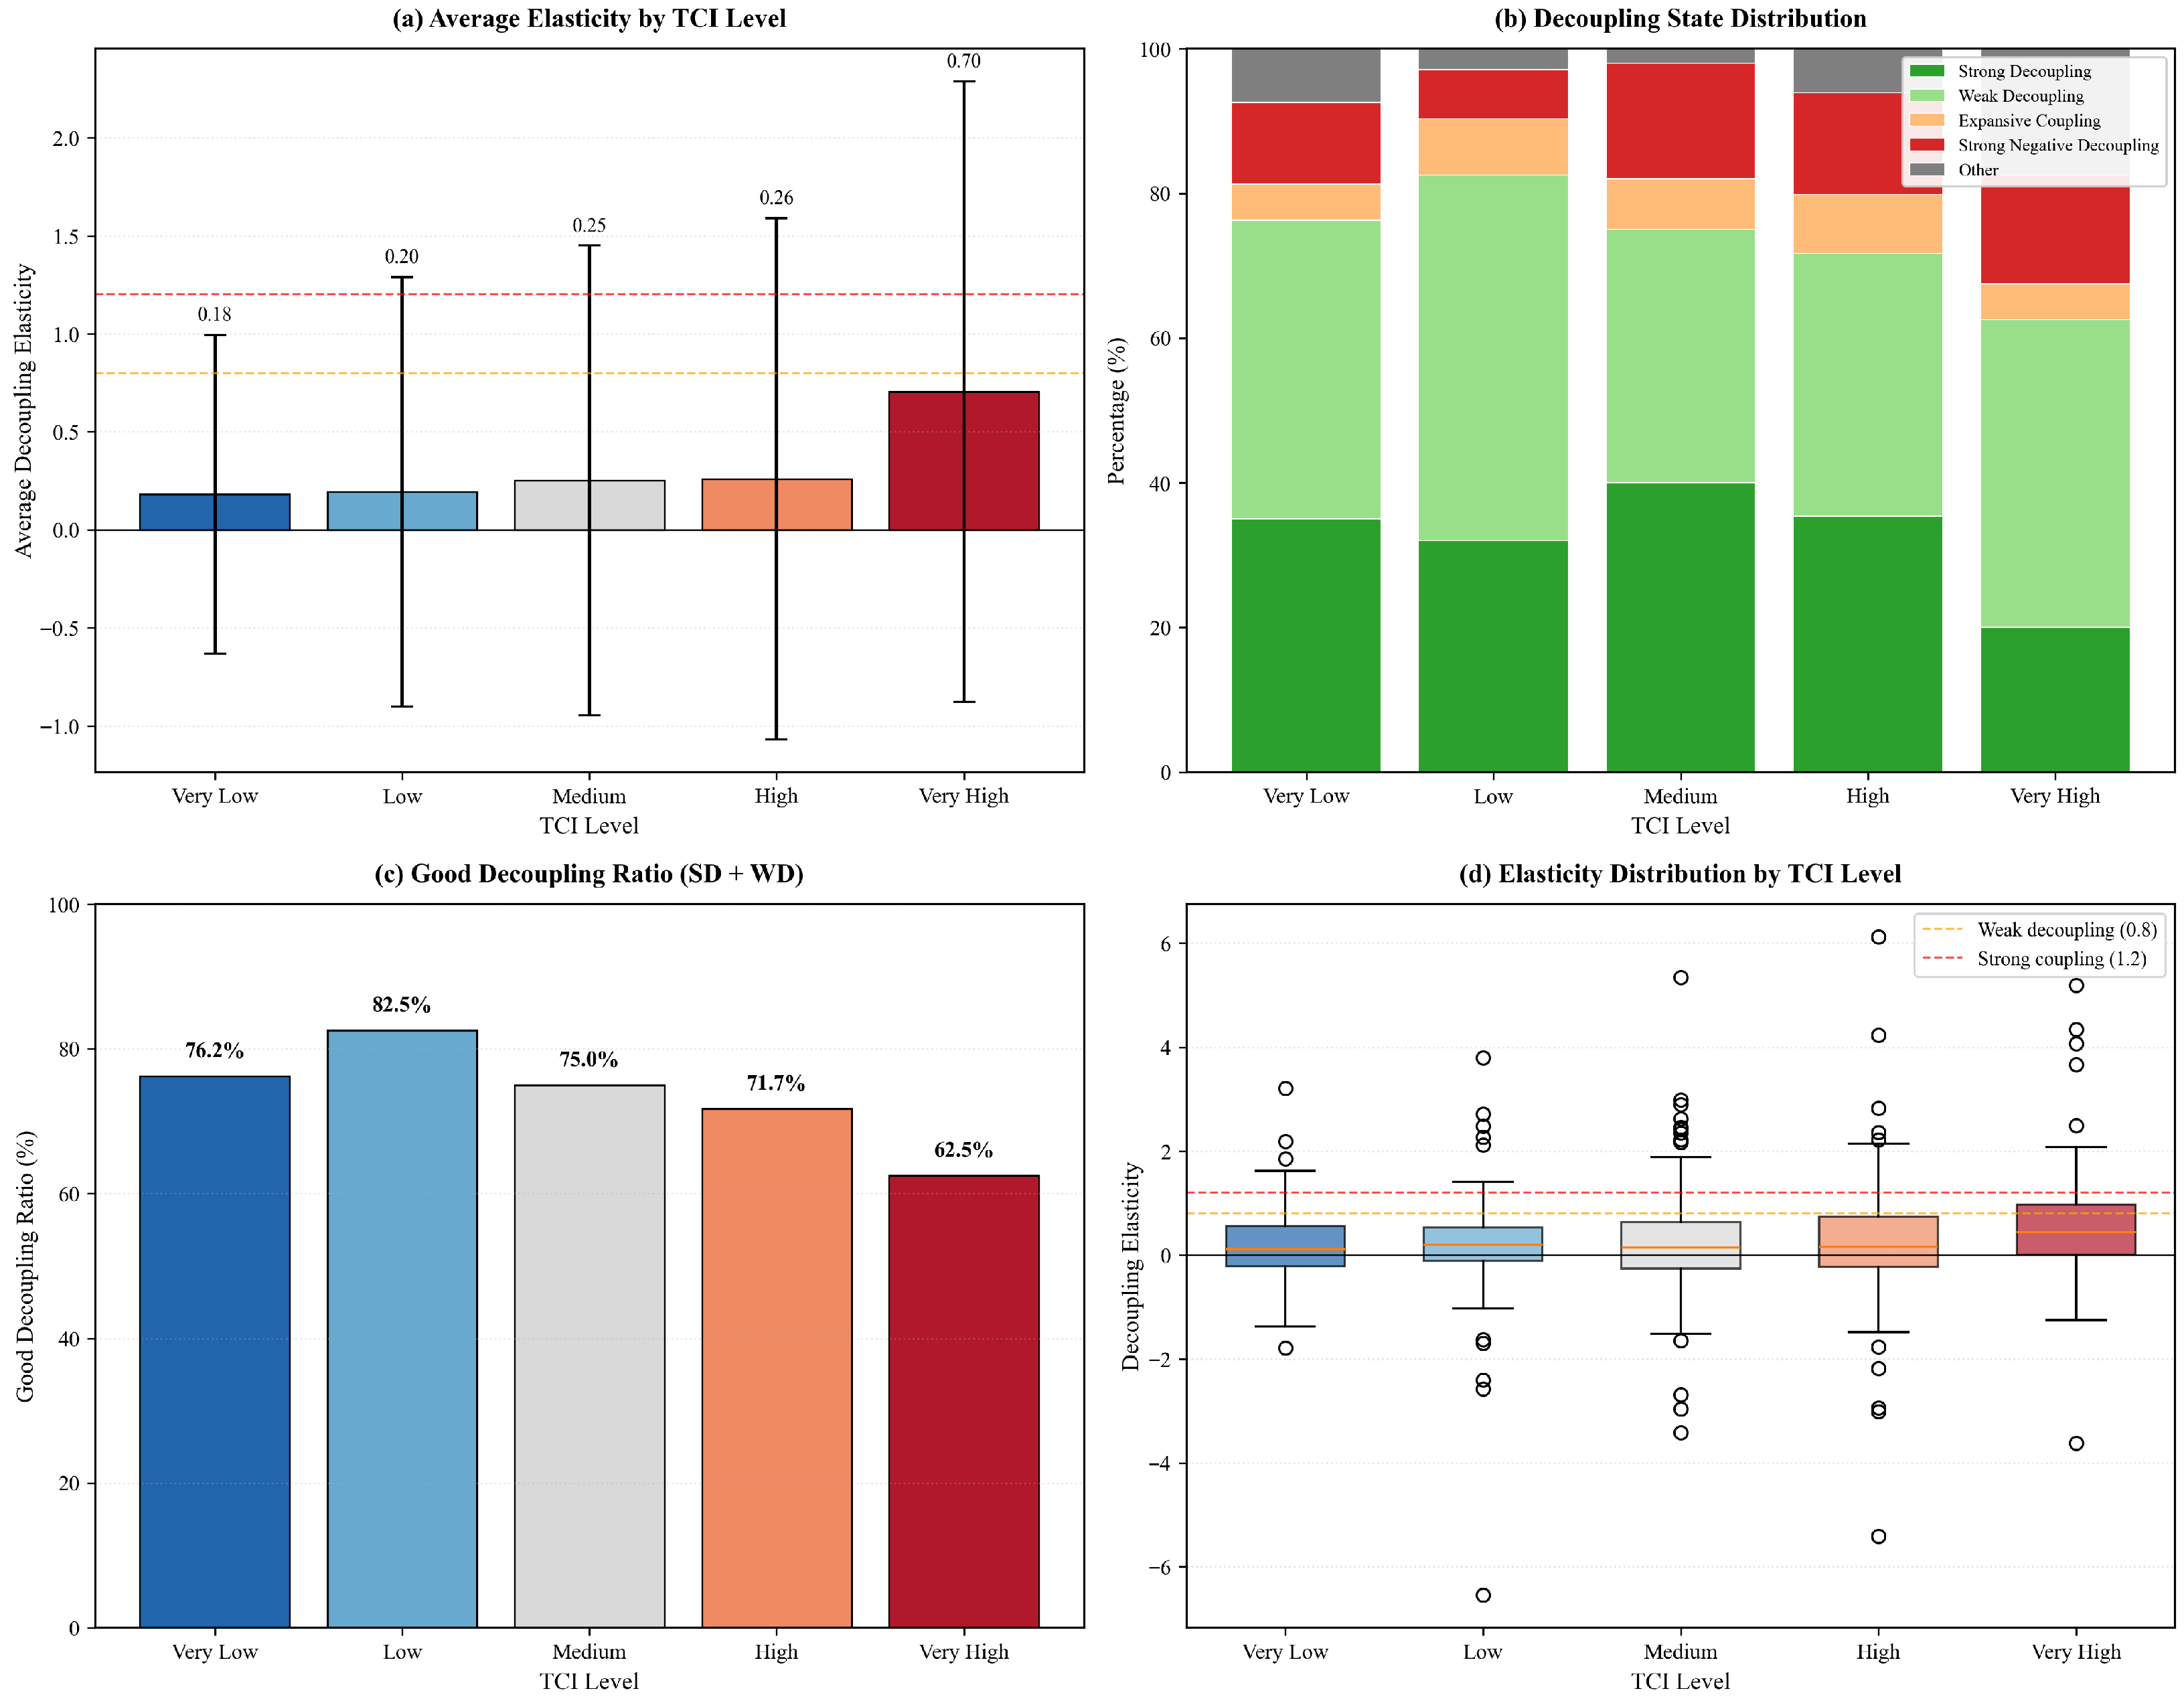
(1) The average decoupling elasticity increases with the terrain complexity. The mean elasticity rises from 0.182 in Very Low TCI regions to 0.705 in Very High TCI regions, representing a 287% increase. Lower elasticity values indicate better decoupling performance (carbon emissions growing slower than investment), confirming that regions with higher terrain complexity tend to face larger challenges in achieving carbon-efficient infrastructure development.
(2) The good decoupling ratio decreases with the terrain complexity. The proportion of observations achieving good decoupling (Strong Decoupling + Weak Decoupling) decreases from 82.5% in Low TCI regions to 62.5% in Very High TCI regions. Notably, the Low TCI group shows the highest good decoupling ratio, suggesting that moderate terrain conditions may be optimal for balancing development and carbon efficiency.
(3) The variability increases with the terrain complexity. The standard deviation of elasticity increases from 0.813 in Very Low TCI regions to 1.583 in Very High TCI regions, indicating that decoupling outcomes become more unpredictable in topographically complex areas.
Statistical Significance Tests
Table 8 presents the results of the statistical tests examining differences among TCI groups. The overall Kruskal–Wallis H test yields H = 5.200 (
p = 0.267), with a negligible effect size (
= H/(N−1) = 5.200/421 = 0.012), indicating that the five TCI groups do not differ significantly in decoupling elasticity at conventional levels. This result warrants a cautious interpretation of the group differences.
Uncorrected pairwise Mann–Whitney U tests suggest that the Very Low vs. Very High TCI comparison yields the smallest raw p-value (U = 1216.0, p = 0.033); however, after Bonferroni correction for 10 pairwise comparisons, no pair remains statistically significant at the 0.05 level. This outcome is not unexpected given the modest sample sizes within groups (particularly Very High TCI with only two cities and 40 city-year observations) and the high within-group variability of decoupling elasticity. Rather than interpreting these results as evidence of statistically confirmed group differences, we characterize the pattern as a gradual monotonic trend: the average elasticity increases progressively from 0.182 (Very Low) to 0.705 (Very High), and the good decoupling ratio decreases from 82.5% to 62.5%. These descriptive patterns are consistent with the hypothesis that terrain complexity is associated with worse decoupling outcomes, but the statistical evidence remains suggestive rather than conclusive due to the limited statistical power.
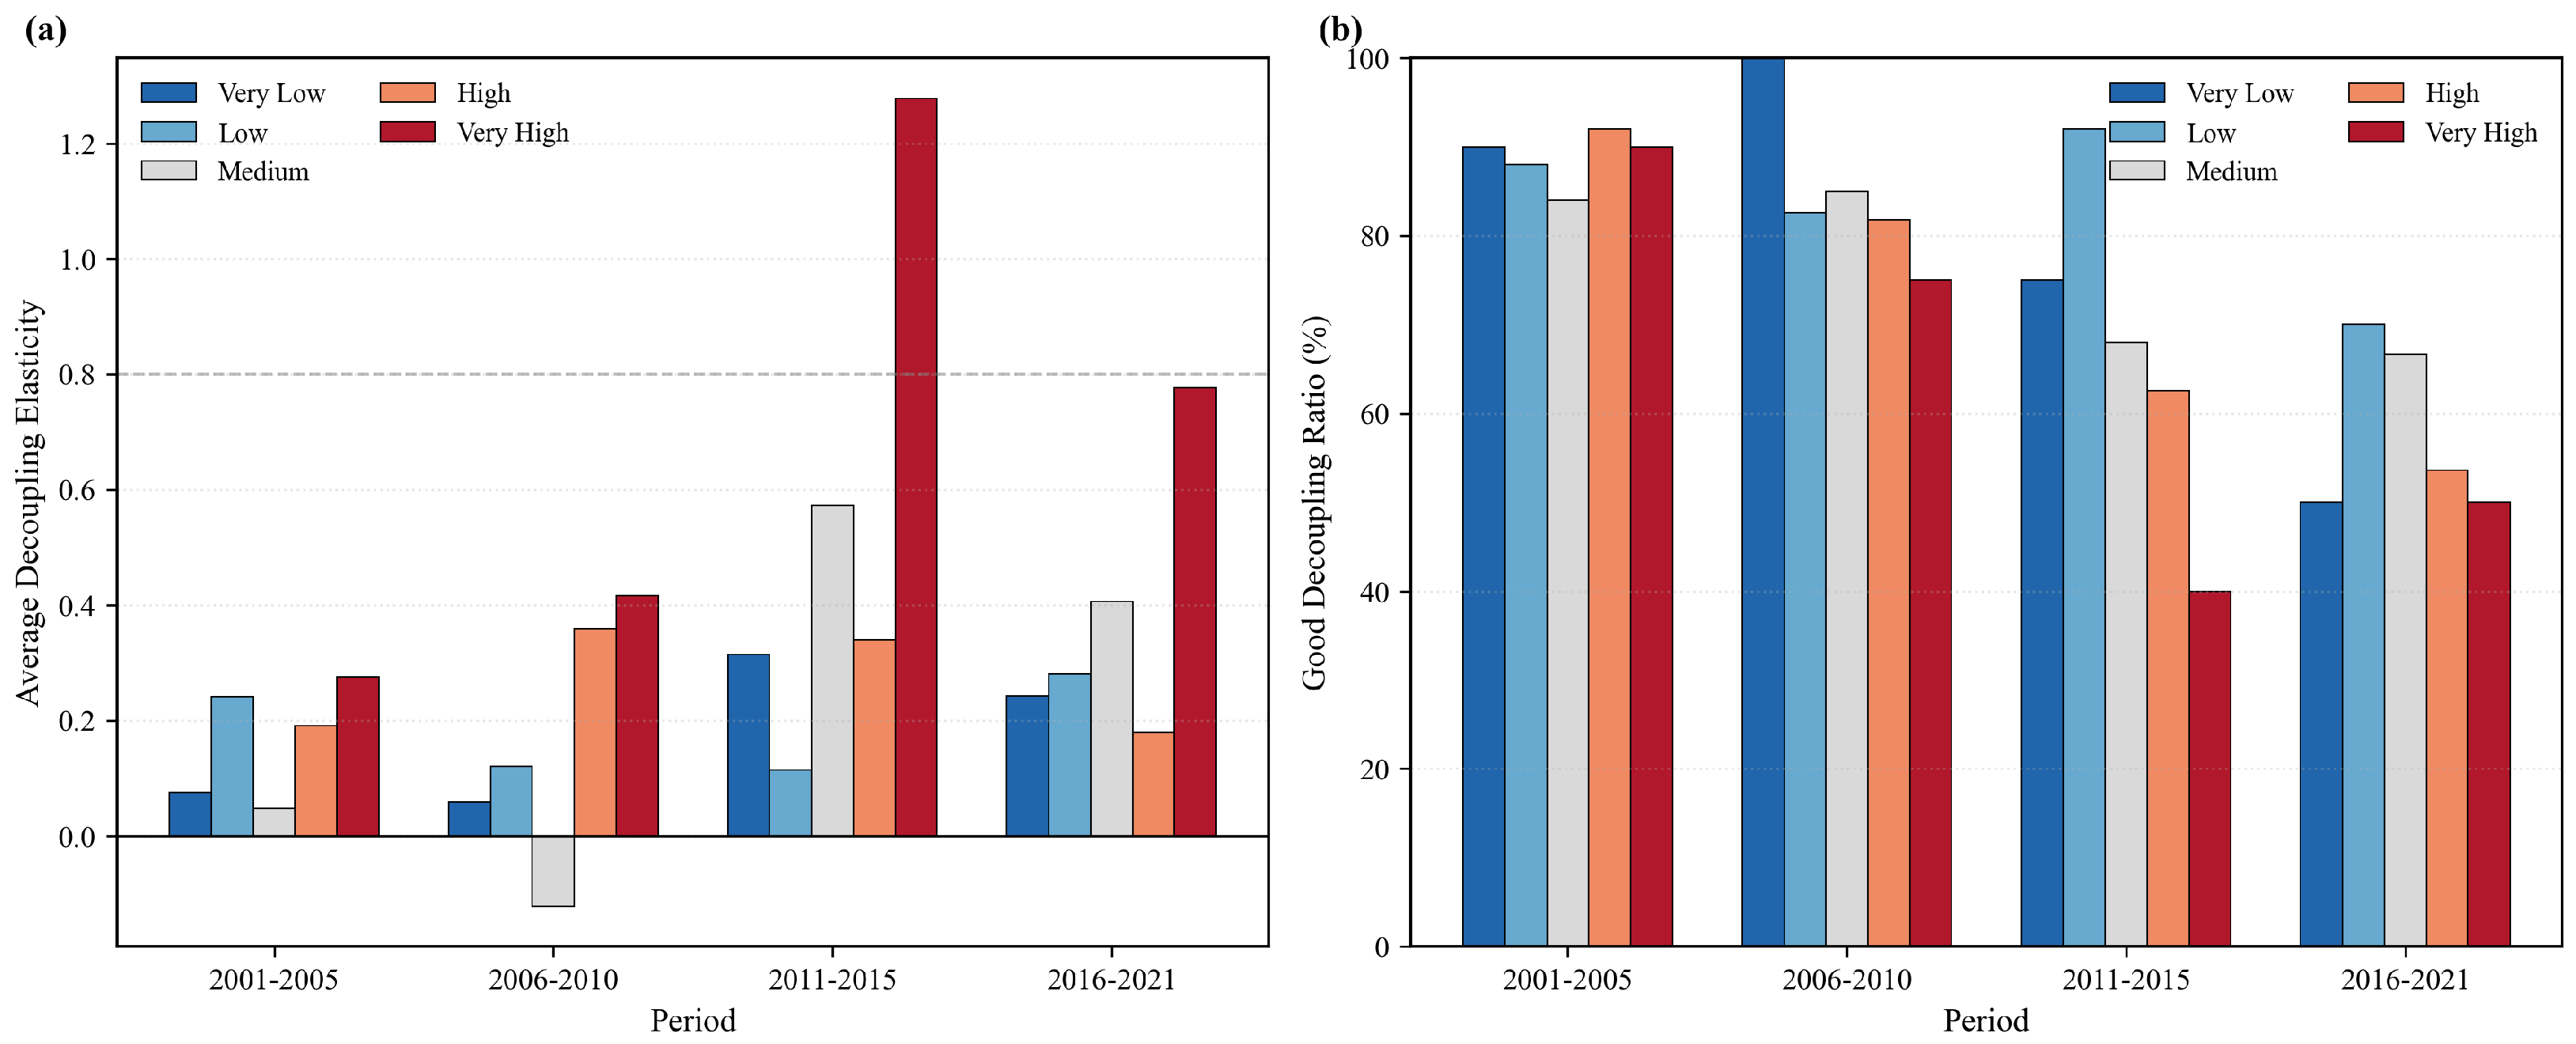
Figure 10 presents the group comparison results across different TCI levels. The comparison reveals that the Very High TCI regions consistently show higher average elasticity, higher variability, and lower good decoupling ratios compared to lower TCI regions.
Figure 11 presents additional group comparison results across different TCI levels. The comparison reveals that the Very High TCI regions consistently show higher variability and more frequent negative decoupling episodes compared to lower TCI regions.
3.4. Driver Detection and Interaction Analysis of Spatial Differentiation
The Geodetector analysis reveals the explanatory power of different factors on the spatial differentiation of the good decoupling ratio across cities. The analysis uses city-level aggregated data (21 cities) with the good decoupling ratio as the dependent variable (
Table 9).
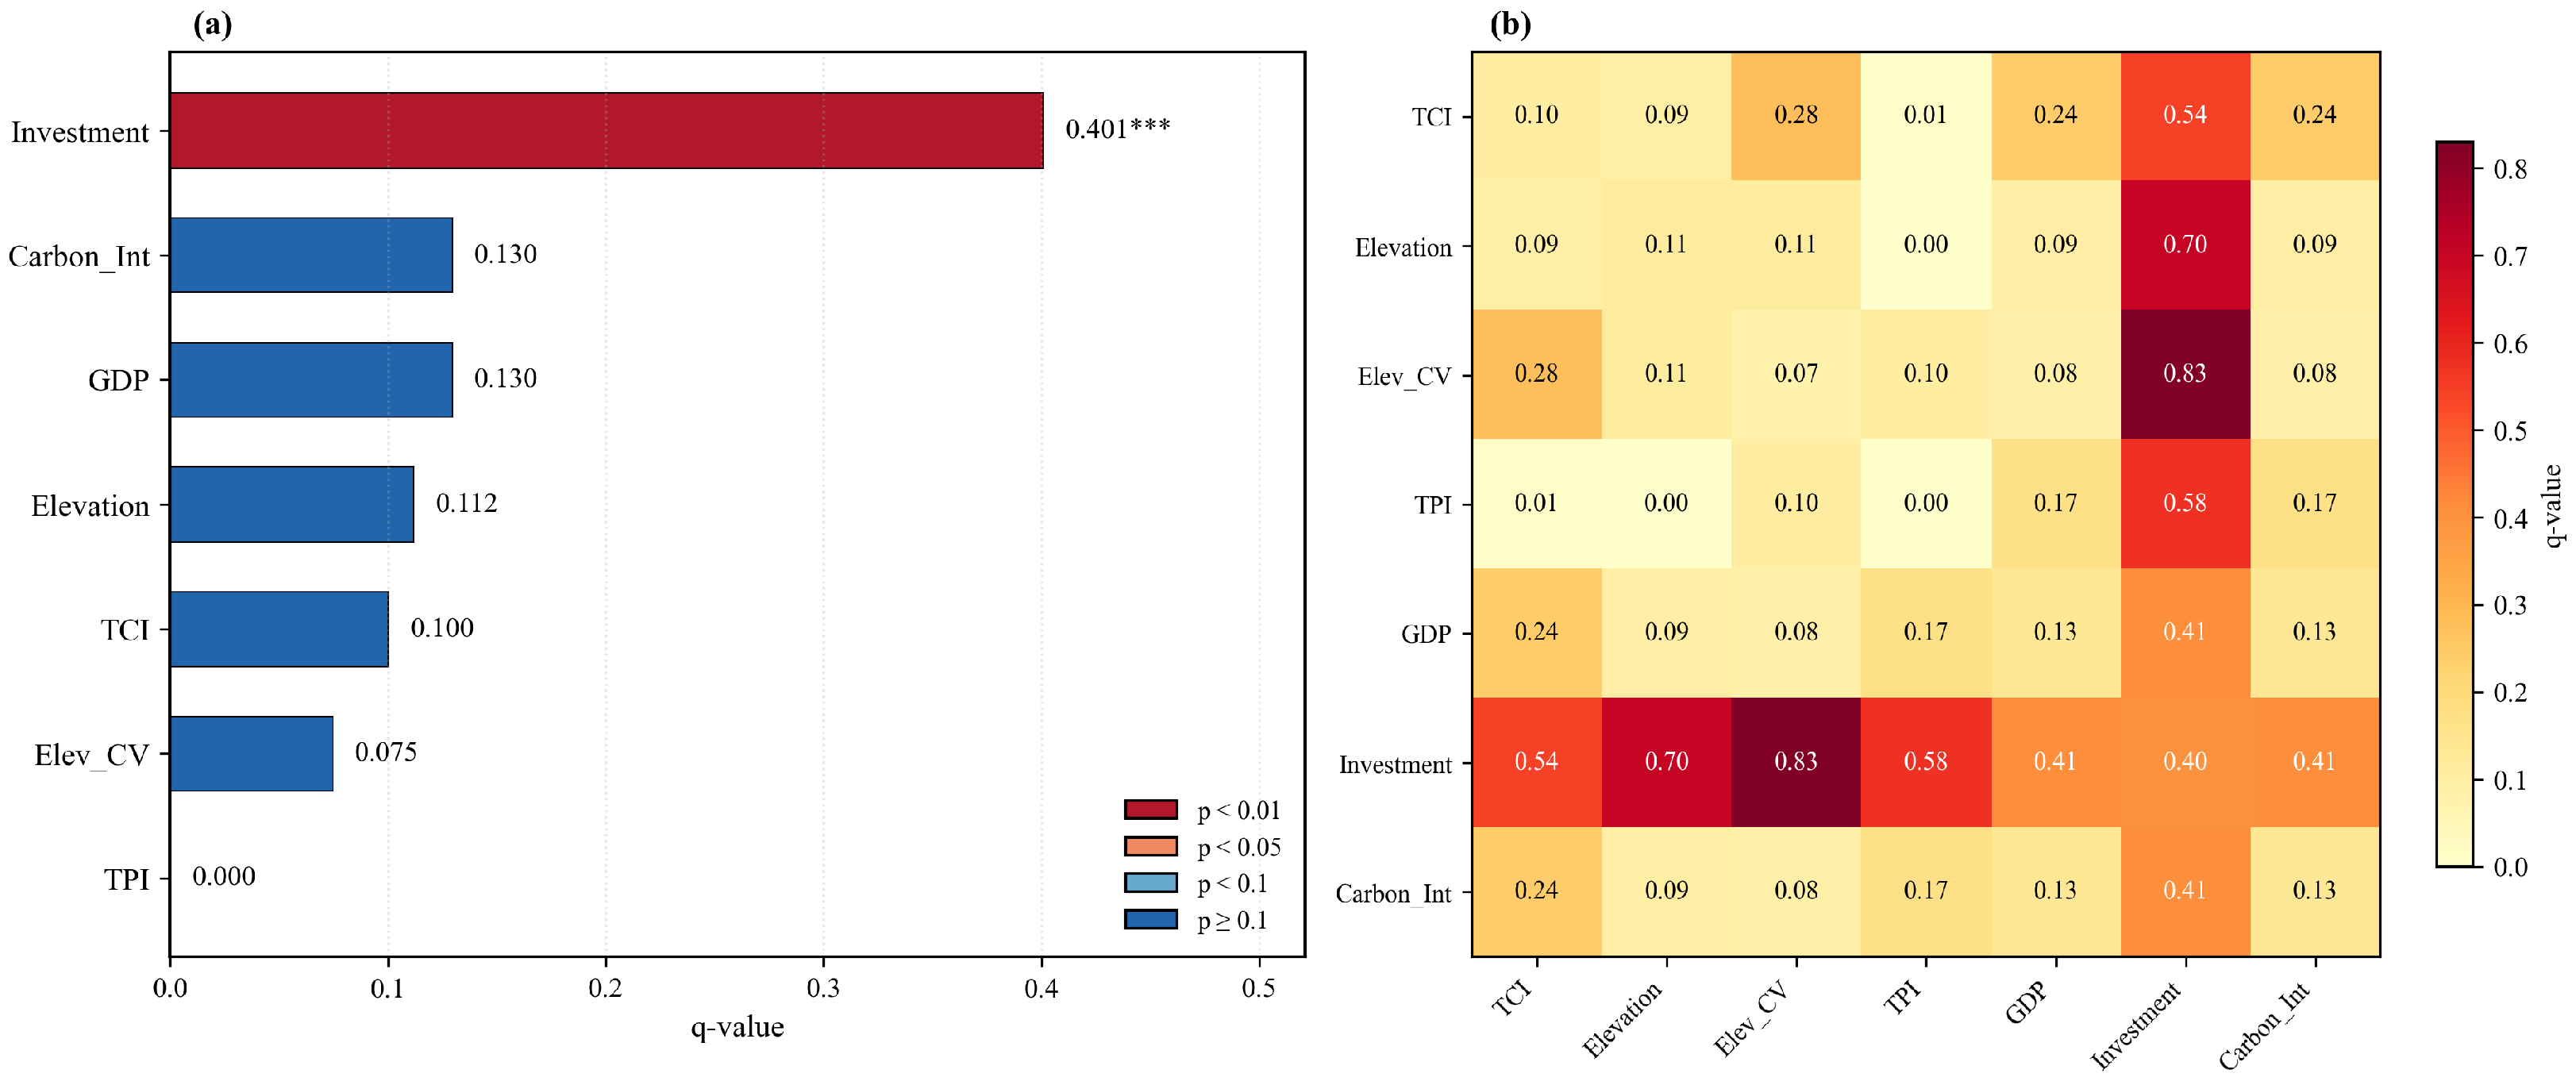
The factor detection results indicate that Investment has the highest explanatory power (q = 0.401, p = 0.010) for the spatial differentiation of good decoupling ratio, suggesting that the infrastructure investment scale is the primary factor associated with the decoupling performance differences among cities. The terrain-related factors (TCI, DEM, CV) show moderate q-values (0.075–0.112) but are not individually significant, suggesting that the terrain effects may operate through interaction with other factors rather than independently.
The interaction detection analysis reveals significant enhancement effects between terrain factors and socioeconomic factors (
Table 10). All interactions involving Investment show substantial increases in explanatory power.
The interaction results reveal several important findings:
(1) Terrain–Investment interactions show strong nonlinear enhancement. The interaction between CV and Investment produces the highest q-value (0.830), far exceeding the sum of individual effects (0.476). Similarly, DEM ∩ Investment (q = 0.700) and TCI ∩ Investment (q = 0.544) show substantial enhancement. These results are consistent with the hypothesis that the terrain complexity amplifies the carbon emission effects of infrastructure investment.
(2) The mechanism of terrain effects. The strong interaction effects suggest that terrain constraints are associated with decoupling performance primarily through modifying the efficiency of infrastructure investment rather than through direct independent effects. In regions with high terrain complexity, each unit of investment may generate more carbon emissions due to the increased construction difficulty, longer transportation distances, and reduced operational efficiency.
(3) Policy implications. The nonlinear enhancement between terrain and investment factors suggests that improving the investment efficiency in topographically complex regions requires targeted interventions that address the specific challenges posed by terrain constraints, rather than simply increasing the investment volume.
Figure 12 visualizes the Geodetector results, showing the factor detection q-values and interaction detection matrix. The bar chart shows that Investment has the highest explanatory power, while the heatmap reveals strong nonlinear enhancement effects between terrain factors and investment.
4. Discussion
This study investigates the association between terrain complexity and carbon emission decoupling in Sichuan Province using group comparison analysis and Geodetector methods, revealing descriptive patterns that advance our understanding of the “terrain penalty” in infrastructure–carbon decoupling.
4.1. Terrain Complexity and Decoupling Performance
A key finding of this study is the monotonic negative association between the terrain complexity and the decoupling performance. The average decoupling elasticity increases from 0.182 in Very Low TCI regions to 0.705 in Very High TCI regions, representing a 287% increase. This pattern is consistent with the interpretation that regions with higher terrain complexity face more challenges in achieving carbon-efficient infrastructure development [
47,
48,
49].
The good decoupling ratio (Strong Decoupling + Weak Decoupling) decreases from 82.5% in Low TCI regions to 62.5% in Very High TCI regions. Notably, the Low TCI group (rather than Very Low) shows the highest good decoupling ratio, suggesting that moderate terrain conditions may be optimal for balancing development needs and carbon efficiency. This finding aligns with the concept of “optimal complexity”, where some terrain variation may actually facilitate efficient infrastructure planning by providing natural corridors and reducing land-use conflicts [
50,
51].
The group comparison results further indicate that the terrain complexity is associated with the decoupling performance not only through average elasticity levels but also through increased variability. The standard deviation of elasticity rises from 0.813 in Very Low TCI regions to 1.583 in Very High TCI regions, suggesting that decoupling outcomes become more unpredictable in topographically complex areas. These patterns are consistent with the interpretation that terrain constraints impose additional carbon costs on infrastructure investment, though the cross-sectional nature of the TCI precludes causal inference from these associations alone.
4.2. Terrain Effects Through Investment Efficiency
The Geodetector analysis suggests that the terrain constraints are associated with the decoupling performance primarily through modifying the efficiency of infrastructure investment rather than through direct independent effects. The interaction between terrain factors and investment shows strong nonlinear enhancement effects: CV ∩ Investment (q = 0.830), DEM ∩ Investment (q = 0.700), and TCI ∩ Investment (q = 0.544) all substantially exceed the sum of individual factor effects [
52,
53,
54].
This finding has important theoretical implications. It suggests that the “terrain penalty” on carbon emissions may operate through an indirect mechanism: complex terrain increases construction difficulty, extends transportation distances, and reduces operational efficiency, thereby increasing the carbon intensity of each unit of infrastructure investment. This interpretation is consistent with why terrain factors alone show limited direct explanatory power (TCI q = 0.100, not significant), while their interactions with investment are highly significant.
4.3. Policy Implications
The findings of this study have important policy implications for achieving carbon neutrality goals in topographically complex regions:
(1) Differentiated emission reduction targets. Given the significant variation in decoupling performance across TCI levels, uniform emission reduction targets may be inappropriate. Regions with high terrain complexity should be assigned more flexible targets that account for their inherent geographical disadvantages.
(2) Technology-focused interventions for mountainous regions. Since terrain effects operate through investment efficiency, improving construction technology and logistics efficiency in mountainous areas could substantially reduce the terrain penalty.
(3) Regional coordination mechanisms. The strong interaction effects between terrain and investment suggest that isolated city-level policies may be insufficient. Regional coordination mechanisms, including inter-city carbon compensation and joint infrastructure planning, could help distribute the burden of terrain constraints more equitably [
55,
56,
57].
4.4. Limitations and Future Research
Several limitations should be acknowledged. First, and most importantly, the Tapio decoupling elasticity is a descriptive metric that captures co-movement between investment growth and emission growth; it does not, by itself, establish a causal link from terrain to decoupling outcomes. Because TCI is time-invariant, it is absorbed by city fixed effects in panel regressions, precluding within-city causal identification (see
Supplementary Material, Table S1). Random-effects estimation yields an insignificant TCI coefficient (
p = 0.720;
Table S2), and a cross-sectional Spatial Durbin Model with only 21 units produces unstable estimates (
;
Table S3). A difference-in-differences design exploiting exogenous policy shocks interacted with TCI could, in principle, strengthen the causal claims, but no suitable quasi-experiment was available during the study period. We therefore interpret all terrain–decoupling associations reported in this paper as systematic descriptive patterns rather than causal effects.
Second, the sample size of 21 cities limits the statistical power of both the group comparison tests and the Geodetector analysis. For the group comparison, the Very High TCI group contains only two cities (40 city-year observations), which constrains the ability to detect statistically significant differences. For the Geodetector, with
N = 21 and
k = 3 strata, each stratum contains approximately seven units, placing the analysis near the lower bound of reliable variance estimation. The discretization is sensitive to the number of classes: sensitivity checks show that while Investment consistently ranks first across
k = 3, 4, and 5 specifications, other factors’ q-values vary substantially (e.g., TCI q ranges from 0.100 to 0.485), underscoring the need for cautious interpretation. Future studies could expand the analysis to county-level data (e.g., Sichuan’s 183 counties) for more robust statistical inference and finer-grained discretization. Third, the TCI construction relies on three terrain indicators; incorporating additional factors such as geological conditions and climate variables could provide a more comprehensive measure of the terrain constraints. Fourth, the carbon emission data from the EDGAR database may have uncertainties at the municipal level, and future studies could benefit from more refined emission inventories [
58,
59].
Despite these limitations, this study documents a consistent descriptive pattern linking the terrain complexity to worse decoupling outcomes and identifies investment efficiency as a plausible mediating channel through Geodetector interaction analysis. These findings provide an empirical foundation for future causal investigations and suggest that achieving low-carbon goals in topographically complex regions may require targeted technological interventions and regional coordination rather than simply increasing the investment volume.
5. Conclusions
This study investigated the spatiotemporal decoupling of infrastructure investment from carbon emissions in Sichuan Province, China, employing group comparison analysis and Geodetector methods to examine the correlation between the terrain complexity and decoupling performance. The main conclusions are as follows:
(1) The TCI exhibits significant spatial heterogeneity across Sichuan Province, with a distinct “high in the west, low in the east” pattern. The TCI values range from 0.151 (Zigong) to 0.591 (Ya’an), with five distinct terrain complexity levels identified. Western plateau regions (Ya’an, Aba, Ganzi) face the highest terrain constraints, while eastern basin regions enjoy favorable geographical conditions.
(2) During 2001–2021, good decoupling states (Strong Decoupling + Weak Decoupling) accounted for 76.8% of all observations, indicating an overall improvement in carbon emission efficiency. Weak decoupling was most common (41.0%), followed by strong decoupling (35.8%).
(3) A monotonic negative association is observed between the terrain complexity and the decoupling performance. The good decoupling ratio decreases from 82.5% in Low TCI regions to 62.5% in Very High TCI regions. Uncorrected Mann–Whitney U tests show suggestive differences between the Very High TCI group and other groups (raw p < 0.05), though these do not survive Bonferroni correction, reflecting the limited statistical power with only 21 cities.
(4) The average decoupling elasticity increases from 0.182 in Very Low TCI regions to 0.705 in Very High TCI regions (287% increase), suggesting that higher terrain complexity is associated with worse decoupling outcomes. The variability in the decoupling performance also increases with the terrain complexity.
(5) Geodetector analysis reveals that infrastructure investment has the highest explanatory power for decoupling spatial differentiation (q = 0.401, p < 0.01). The interactions between terrain factors and investment show strong nonlinear enhancement effects (q = 0.544–0.830), consistent with the interpretation that terrain constraints are associated with decoupling outcomes primarily through their interaction with investment efficiency.
Based on these findings, we propose the following policy recommendations:
For Very Low and Low TCI regions: Leverage favorable terrain conditions to accelerate green infrastructure adoption and serve as demonstration zones for carbon-neutral development, with targets of achieving strong decoupling by 2030.
For Medium TCI regions: Implement balanced development strategies that optimize infrastructure layout to minimize terrain-related carbon costs while maintaining economic growth momentum.
For High and Very High TCI regions: Prioritize low-carbon construction technologies (modular bridges, prefabricated tunnels), develop alternative economic pathways (eco-tourism, clean energy), and establish differentiated emission reduction targets that account for geographical constraints.
For regional coordination: Establish inter-regional carbon compensation mechanisms where low TCI regions that benefit from favorable terrain conditions contribute to emission reduction efforts in high TCI regions, promoting equitable and sustainable development across the province.