Article

Evaluating Future Water Resource Risks in the Driftless Midwest from Climate and Land Use Change

1
Texas A&M AgriLife Research, Blackland Research and Extension Center, 720 E. Blackland Road, Temple, TX 76502, USA
2
Eastern Research Group Inc., 110 Hartwell Ave., Lexington, MA 02421, USA
3
Department of Ecoscience, Aarhus University, 8000 Aarhus C, Denmark
*
Author to whom correspondence should be addressed.
Land 2025, 14(9), 1919; https://doi.org/10.3390/land14091919
Submission received: 31 July 2025 / Revised: 9 September 2025 / Accepted: 16 September 2025 / Published: 20 September 2025
(This article belongs to the Special Issue Integrating Climate, Land, and Water Systems)

Abstract

Assessing the impacts of future changes in rainfall, temperature, and land use on streamflow and nutrient loads is critical for long-term watershed management, particularly in the unglaciated Driftless Area with steep slopes, erodible soils, and karst geology. This study evaluates the Kickapoo watershed in southwestern Wisconsin to examine how projected climate change and cropland expansion may affect hydrology during the mid- (post-2050) and late century (post-2070). Climate projections suggest temperature increase, wetter springs, and drier summers over the century. Annual average streamflow is projected to decline by 5–40% relative to 2000–2020, primarily due to a 5–15% reduction in groundwater discharge. While land use changes from prairie to cropland had a limited additional impact on streamflow, it increased annual average total phosphorus (TP) by 5.67–10.08%, total nitrogen (TN) by 1.08–2.34%, and sediment by 3.11–6.07%, frequently exceeding total maximum daily load (TMDL) thresholds in comparison to the climate change scenario. These findings suggest that although land use changes exacerbate nutrient and sediment pollution, climate change remains the dominant driver of hydrologic alteration in this watershed. Instead, converting 18% (~290 km2) of cropland to grassland could enhance baseflow (0.84–14%), and reduce TP (30–45%), TN (3–5%), sediment (80–90%), and meeting TMDL 90% of the time. These findings underscore the importance of nature-based solutions, such as prairie restoration, supporting adaptive management to reduce nutrient load, sustaining low flows, and strengthening hydrologic resilience, that support key Sustainable Development Goals. This approach offers valuable insights for other unglaciated watersheds globally.

1. Introduction

Climate change and land use change are two of the most significant drivers affecting global water sustainability [1,2,3,4,5]. Shifts in climate patterns including changes in rainfall seasonality and intensity, increased frequency of extreme events, and rising temperatures can substantially modify hydrological processes [6,7,8]. Simultaneously, land use changes such as deforestation, cropland intensification, and urban expansion alter watershed hydrology by modifying infiltration, evapotranspiration, and soil water storage, which in turn affect streamflow quantity and water quality [9,10,11,12,13]. These combined influences disrupt the spatial and temporal distribution of water resources [14,15], increasing the likelihood of floods and droughts and posing challenges to the sustainability of water-dependent systems. However, disentangling the relative contributions of these drivers remains challenging due to their complex and strong interactions [16,17,18]. Ongoing changes in these factors further complicate efforts by watershed planners, decision makers, and stakeholders to manage landscapes in ways that support sustainable clean water.
In the Midwestern United States, particularly in rural agricultural watersheds, these dynamics are especially evident. Increasing precipitation for more than two decades has been identified as a key driver of rising streamflow [14,16], though it does not fully account for this trend. Schilling (2005) [19] linked increased baseflow in Iowa’s rivers to intensified agricultural activity, while Zhang and Schilling (2006) [20] attributed streamflow increases in the Mississippi River largely to land use changes, specifically the shift from perennial to annual cropping systems. Additional studies reported elevated streamflow in the Upper Midwest, especially during warmer summer seasons, in response to increased precipitation [6,20,21,22,23]. Jha et al. (2006) [24] emphasized the heightened sensitivity of Upper Midwest watersheds to future climate change.
The challenges from climate change and land use change are especially pronounced in the Driftless Area of the Upper Midwest, spanning approximately 22,000 km2 from southeastern Minnesota to the Wisconsin–Illinois border [25,26]. This unglaciated region is characterized by thin soils and extensive karst features such as sinkholes, losing streams, and fractured bedrock that create a highly dynamic hydrological system where surface and groundwater are tightly interconnected [27,28]. Consequently, changes in precipitation and land cover can trigger rapid and nonlinear hydrologic responses, increasing the risk of flash flooding and groundwater contamination. Since the mid-19th century, intensified agriculture across the Midwest, particularly in the Driftless Area on steep slopes and shallow soils, has accelerated surface runoff, soil erosion, and nutrient leaching into vulnerable aquifers [29,30,31]. Between 2006 and 2017, cropland in this region expanded by 10–30% at the expense of perennial grasslands and pastures, a trend that continues and is projected to increase for economic reasons [31,32,33,34]. This unplanned agricultural expansion in the Driftless Area disrupts natural hydrology by increasing surface runoff, reducing infiltration, elevating sediment loads, and contributing to higher nutrient levels in both surface and groundwater due to intensified fertilizer and manure application. Moreover, the Driftless Area exemplifies how hydrogeologic sensitivity can amplify the impacts of broader climate and land use shift pressures, making it a critical setting for investigating coupled anthropogenic–natural hydrologic system dynamics. However, despite this significance, long-term studies examining hydrologic responses to combined land use and precipitation changes remain limited for this region.
The impacts of climate change and land use change happen worldwide. In southeastern Spain, Cabrera et al. (2022) [15] showed that future precipitation shifts, declining rainfall, and intensified agriculture could reduce runoff by altering evaporation and infiltration. Similar projections by Jodar-Abellan et al. (2018) [35] and Valdes-Abellan et al. (2020) [36] indicated streamflow reductions (~10%) for Mediterranean regions, though focused mainly on water quantity, leaving gaps in understanding seasonal streamflow dynamics and water quality impacts. In Wisconsin’s Driftless Area, evidence from Kucharik et al. (2010) [37] and Dauwalter et al. (2019) [38] showed a wetter and warmer climate with more frequent heavy rainfall events from 1950 to 2006 [39]. Juckem et al. (2008) [28] observed increased baseflow in the Kickapoo River Watershed since 1970, though whether this is driven by the climate, land management, or both remains uncertain. Gebert and Krug (1996) [27] similarly reported increased annual baseflow in southwestern Wisconsin streams, suggesting that land management significantly influences hydrologic responses. Another watershed in the Midwest, exhibiting a diversity of effects from both land use and the climate, is the Yahara Watershed (YW) of southern Wisconsin, where best management practices (BMPs) to mitigate soil erosion have been implemented with little impact on water quality [40].
Recent streamflow data (1990–2020) from the U.S. Geological Survey (USGS) reveal statewide increases in peak and daily stream flows, causing more frequent flooding in southwestern Wisconsin [41], particularly in the Coon and Kickapoo watersheds [42]. These increases are primarily driven by regional shifts in precipitation. While recent studies in these watersheds have focused on flood resilience, widespread and unplanned conversion from grasslands and prairies to croplands and grazed pastures accompanied by intensified fertilizer and manure use has heightened the vulnerability of these systems to water pollution, underscoring the need to balance flood resilience with water quality protection. Elevated nutrient (phosphorous and nitrogen) contamination are increasingly impacting both surface and groundwater, contributing to toxic algal blooms to stream water [43].
The Kickapoo Watershed in southwest Wisconsin is selected to evaluate the combined effects of future climate change variability and land use change, as its location in the Driftless Area features complex hydrogeology and an intensively cultivated, expanding, rural agricultural landscape. The watershed’s recent experiences with extreme rainfall events, including severe flooding in 2018 and near-drought conditions in 2012, highlight its sensitivity and relevance for understanding interactions between shifting climate and land use patterns in rural settings. As phosphorus levels in the rivers and streams continue to rise, Wisconsin has responded by adopting more stringent National Pollutant Discharge Elimination System (NPDES) permit limits, with in-stream phosphorus standards of no greater than 0.10 mg/L for state-listed rivers and 0.075 mg/L for smaller streams and creeks [44]. This increasing challenge to maintain water quality standards underscores the need to better understand how future climate and land use changes may further impact water quality, and holistic solutions may be developed.
In a prior effort, water quality trading in the Kickapoo watershed has been evaluated to achieve total maximum daily load (TMDL) water quality compliance for wastewater treatment facilities at a lower cost while providing additional benefits with land use conversion from cropland to prairie grassland [45]. Building on that work, this study expands the analysis by examining future risks and uncertainties in the same unglaciated watershed under projected climate variation and land use change, with the goal of supporting more informed and integrated decision-making. The Soil and Water Assessment Tool (SWAT) [46,47,48], a widely applied process-based hydrological model applicable from watershed scale to global scale, was used in this study to quantify hydrologic and water quality responses to land use and climate changes [17,49,50]. Our objectives were threefold: (1) to quantify the relative contributions of future climate projections and land use changes on streamflow and water quality; (2) to assess whether nature-based solutions such as preserving or restoring prairies and grasslands can help mitigate climate impacts and achieve better water quality; and (3) to evaluate how future climate projections might affect TP concentrations in the stream. With the increase in changing climate, the knowledge gap of their impacts on hydrological responses needs to be filled. The methodologies and the results from this study could help develop integrated watershed management plans, and provide transferable strategies to similar unglaciated karst regions around the world. This is the first of such extensive efforts to evaluate the impacts of both climate and land use change and offer new insights into the future land–climate dynamics and highlight the potential mitigation strategy of nature-based solutions.

2. Materials and Methods

2.1. Study Area
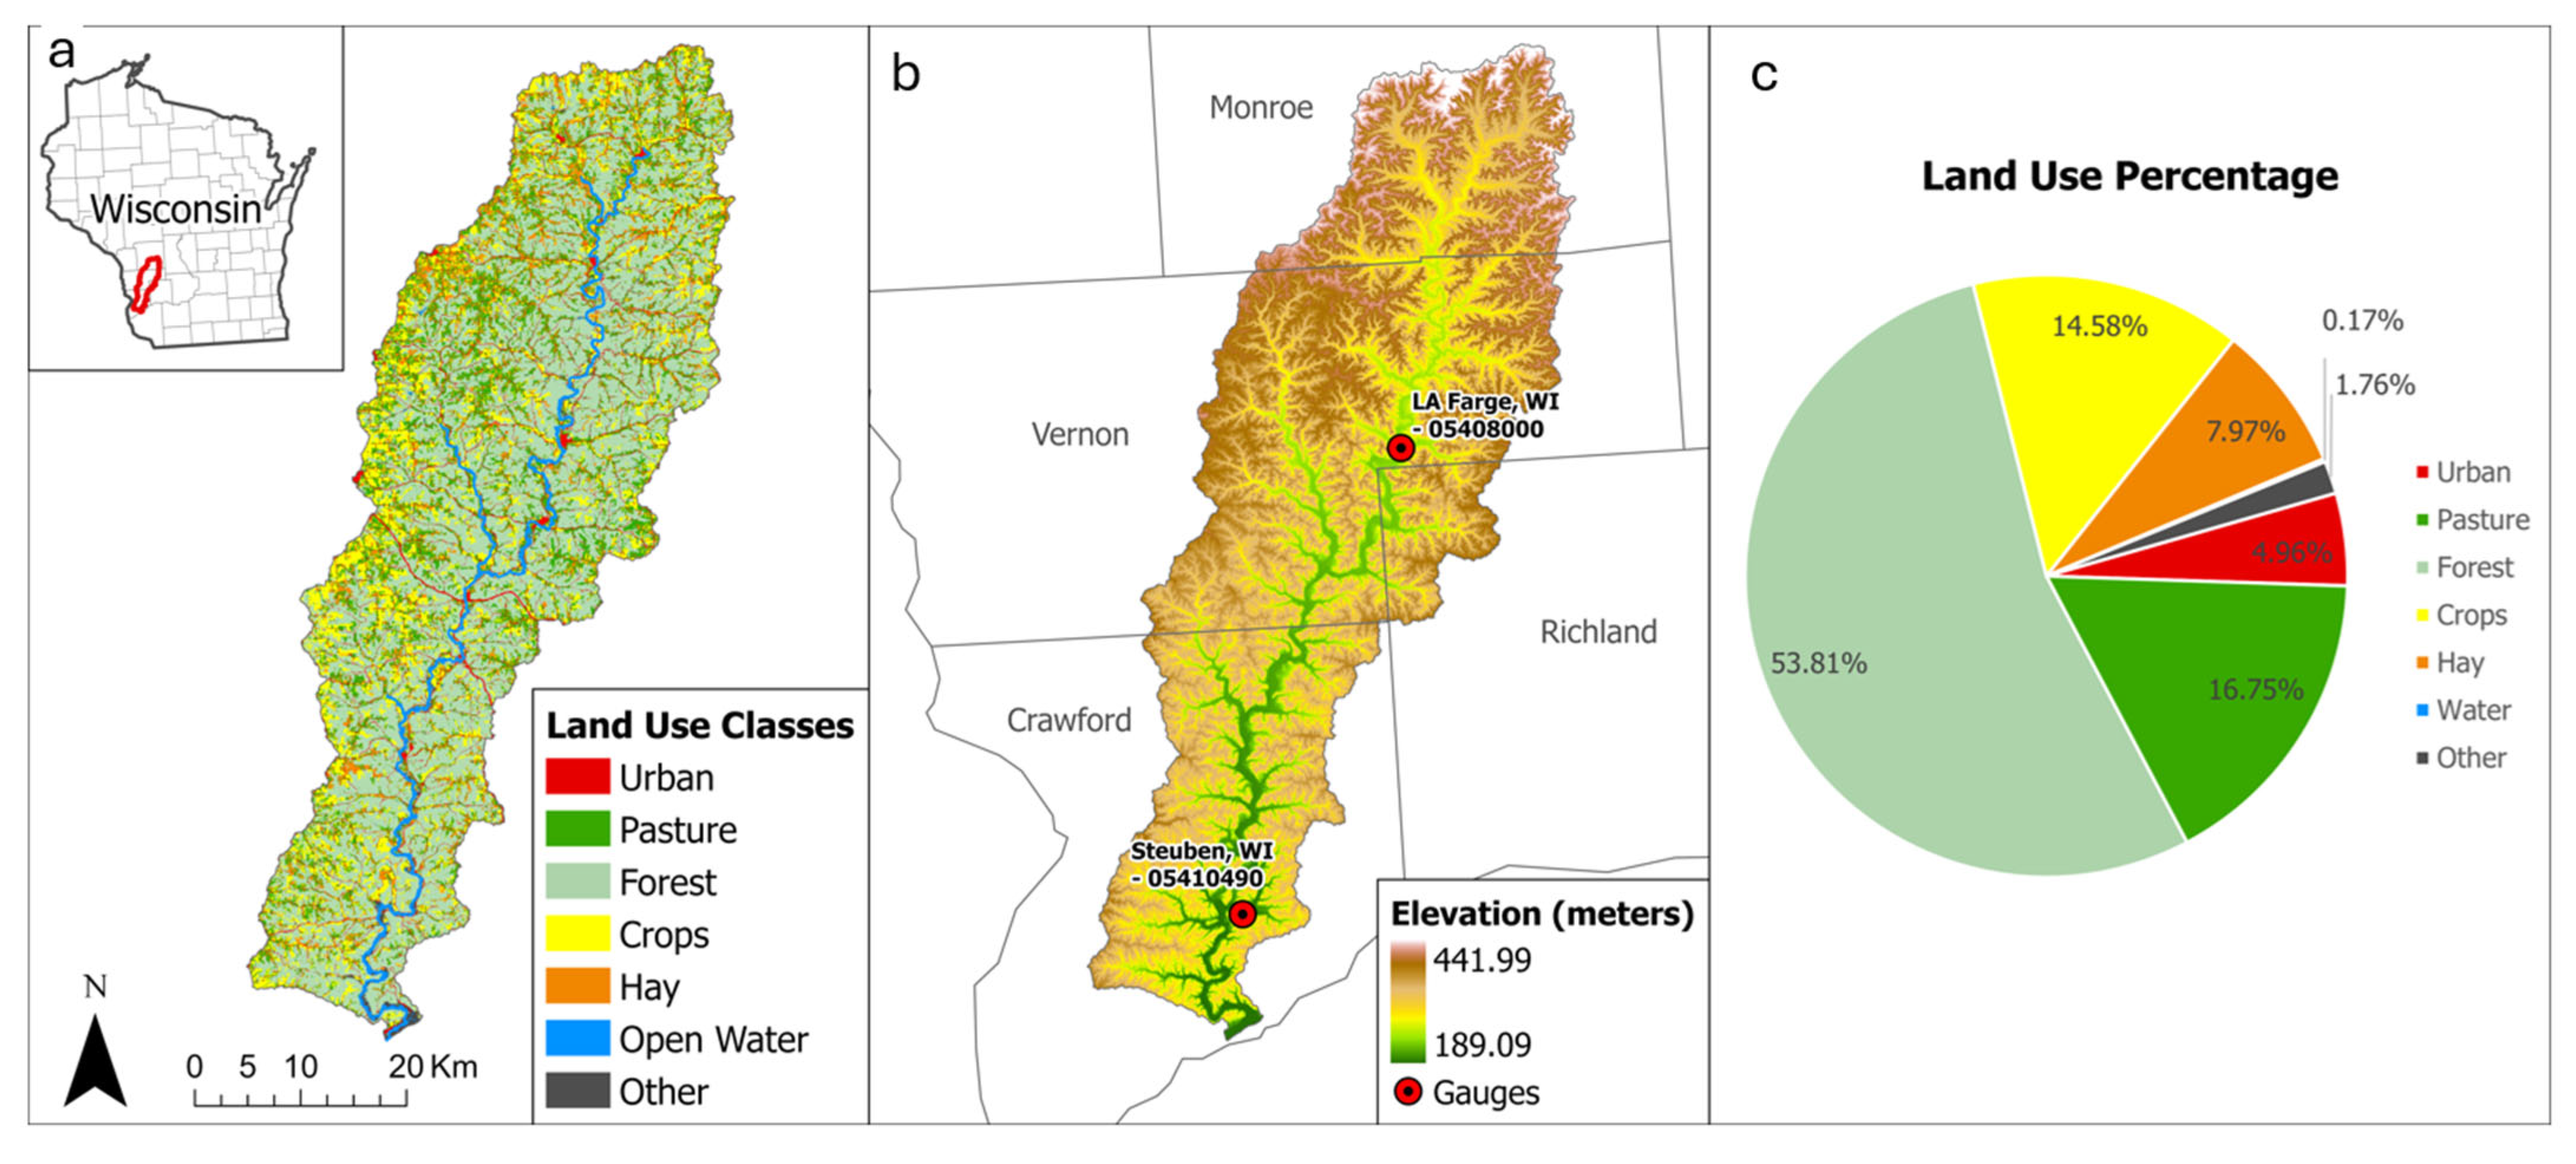
The Kickapoo River Watershed encompasses a drainage area of 1990 km2 in southwestern Wisconsin’s Driftless Area (Figure 1). The Driftless Area has a lack of glacial drift deposits from continental glaciers that covered much of the surrounding region during the Pleistocene Epoch [51]. The watershed is a largely forested area undergoing expanding agricultural activities [28], with elevation ranging from 189 m to 442 m above mean sea level. The Kickapoo River begins in south central Monroe County and flows in a southerly direction for 209.21 km through Vernon, Richland, and Crawford Counties before reaching the Wisconsin River near the Village of Wauzeka. Approximately 52% of the watershed is forested, while the remaining land use is primarily agricultural, including row crops, ungrazed pasture (hay), and pasture (grazing) [45]. Most crop and pasture activities are concentrated on ridges and in valleys, where management practices such as conservation tillage, crop rotation (predominantly corn–soybean), and strip cropping have been implemented. These ongoing and expanding agricultural practices are expected to continue spreading throughout the rest of the Driftless Area and beyond, as farmers have observed noticeable improvements in soil and hydrologic conditions [52]. The Driftless Area includes three geologically distinct landscape units that influence hydrology, clay-rich residuum on flat ridges [53], thin sandy soils with rock fragments on hillslopes, and loamy soils in valleys [54,55].
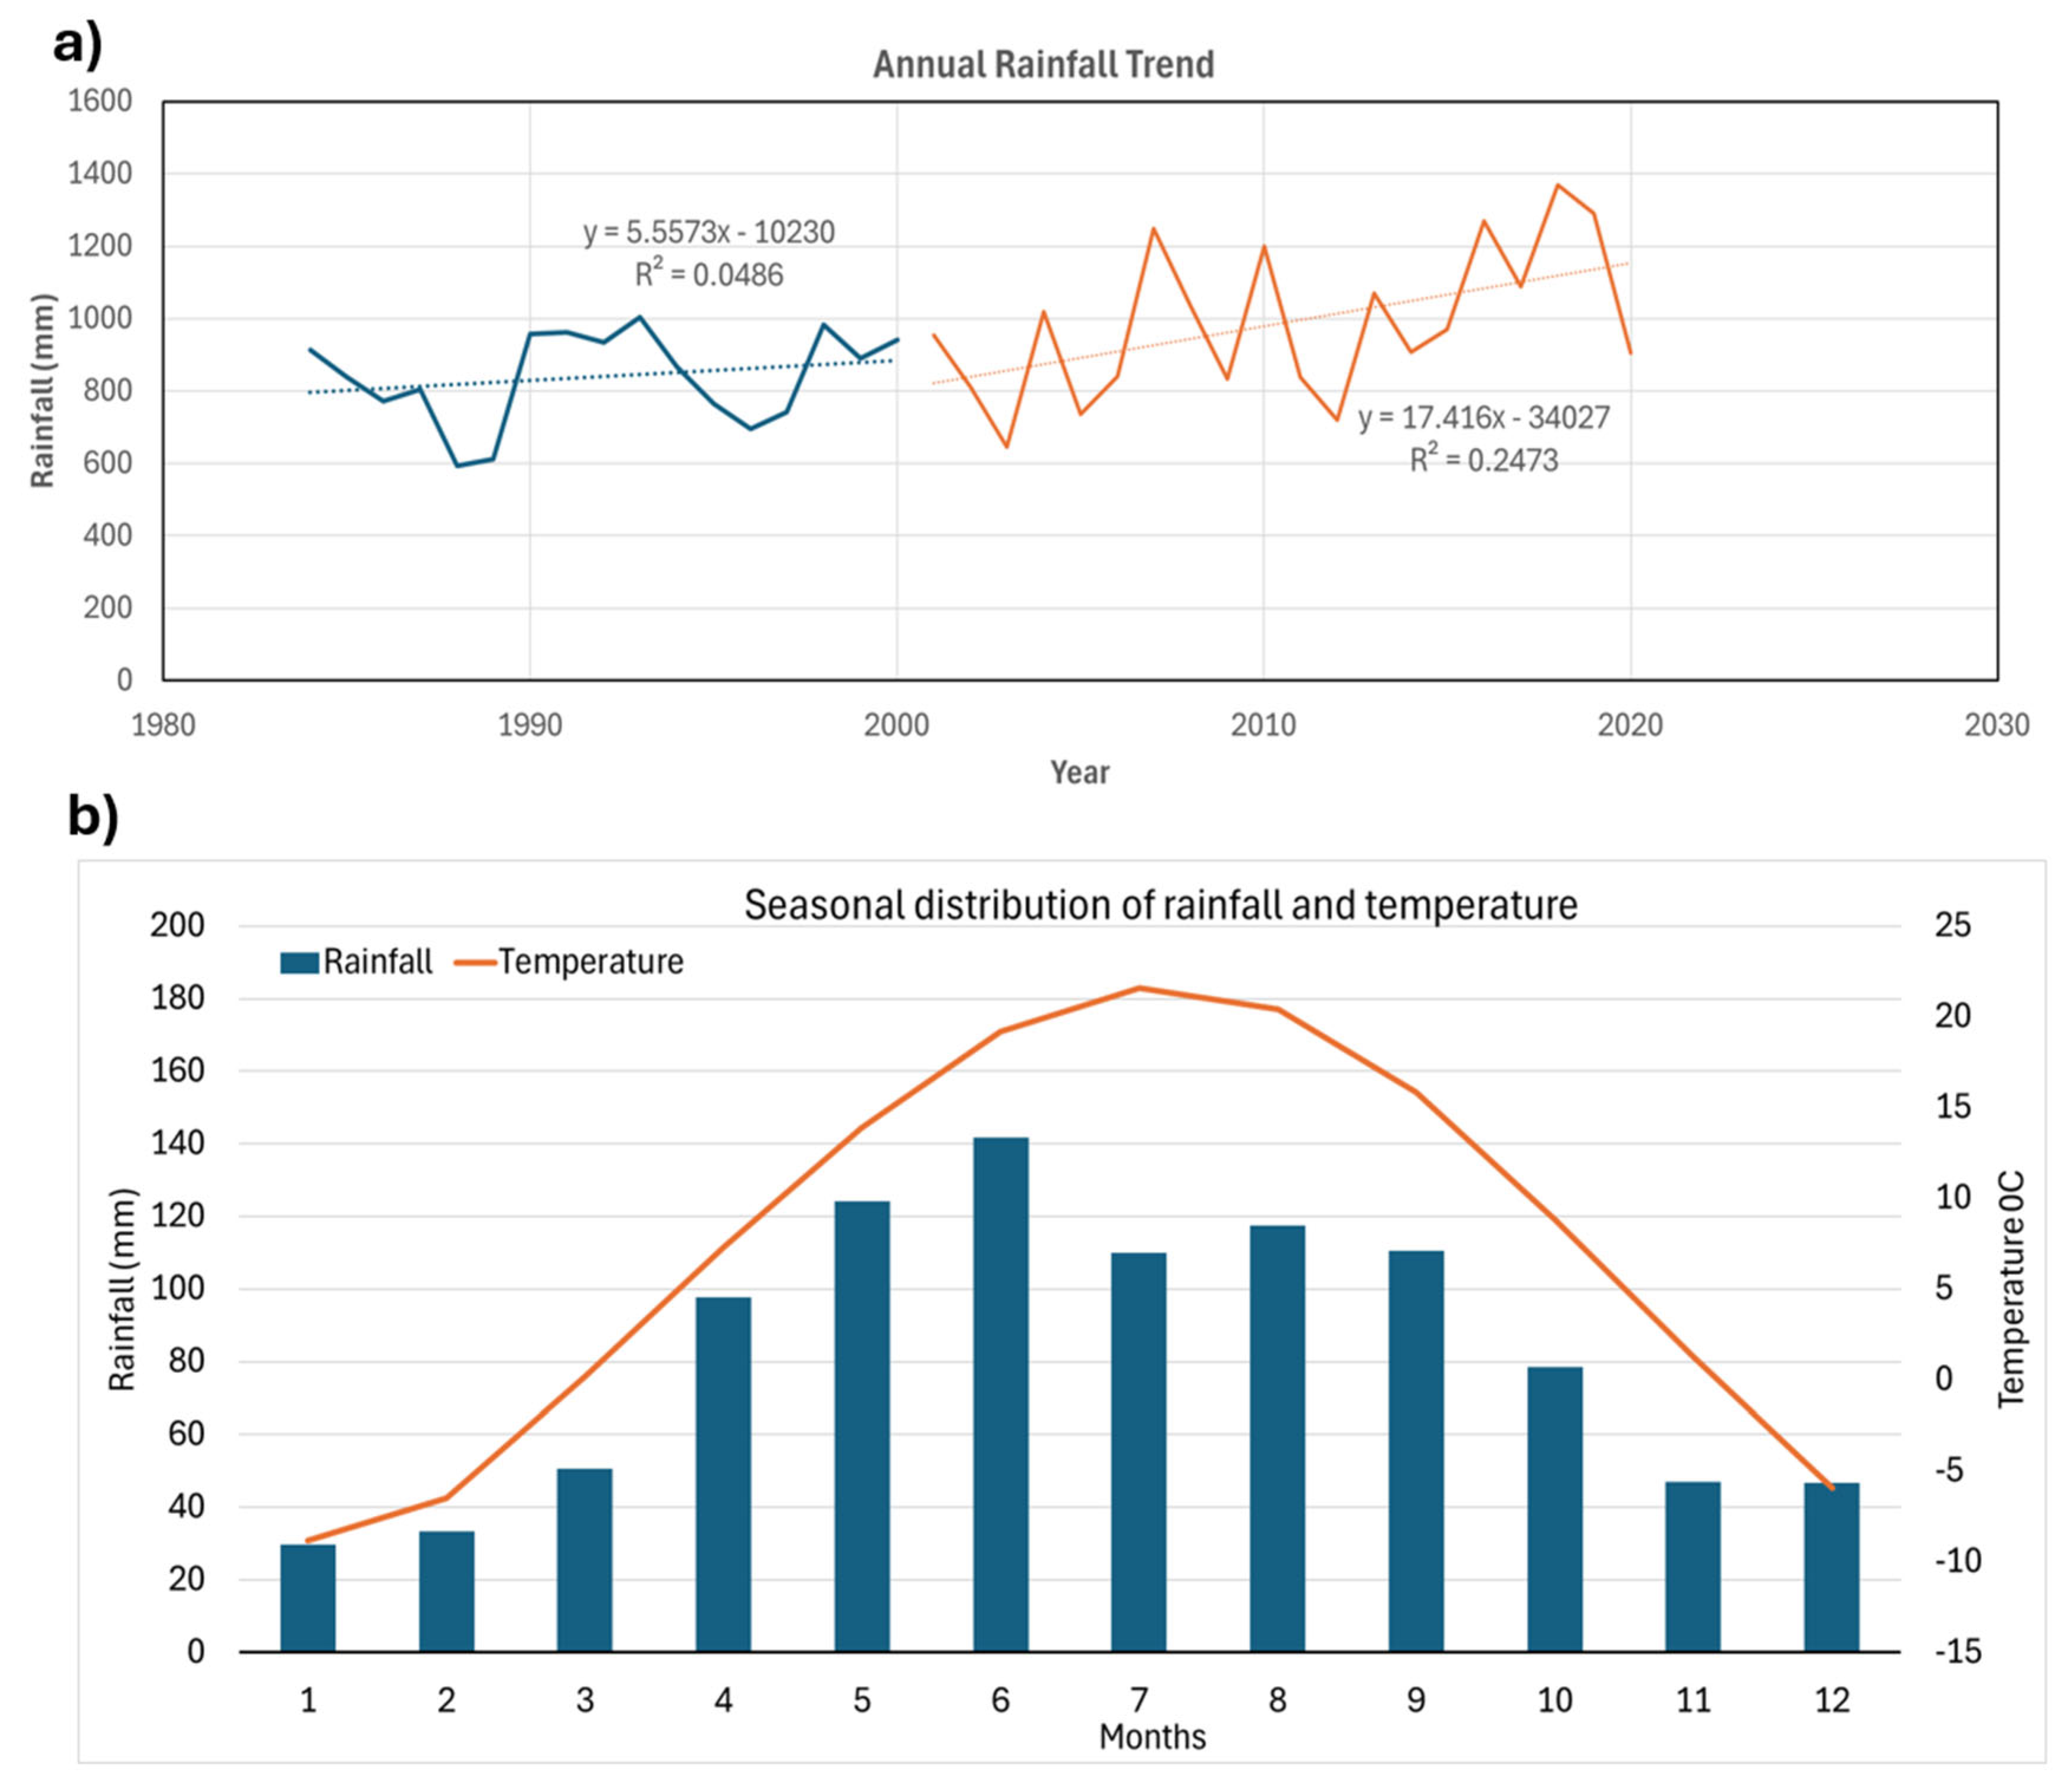
The watershed climate is characterized as sub-humid continental with mean annual precipitation of 920 mm, with wetter summers and drier winters. Long-term precipitation data (1982–2020) show an average of ~920 mm per year (PRISM (https://prism.oregonstate.edu/)), with a notable increasing trend over the 40-year period (Figure 2). The rainfall during (2000–2020) has high inter-annual variability and a steeper trend of rainfall increasing related to the 1982–1999 period (Figure 2). This high variability trend is particularly evident after 2000, with annual average rainfall increasing by 17% from ~840 mm during 1982–1999 to ~985 mm during 2000–2020 (Table S3). This increasing trend is consistent with other watersheds throughout the Upper Midwest and Wisconsin [56]. Between 2006 and 2020, there were both wet and dry precipitation extremes (Figure 2a), exemplified by the floods of 2008 and 2018 [28,42]. The seasonal distribution of rainfall shows that approximately 60% of the annual total occurs between June and September, which coincides with the primary crop-growing season. This pattern supports the region’s reliance on rainfed agriculture. Rainfall typically peaks in June. During this same period, temperatures also reach their highest, averaging around 20 °C in June and July. In contrast, winter temperatures often drop below 0 °C.
Figure 1. Location map of the Kickapoo watershed in Wisconsin State of the USA: (a) 2016 USDA NASS land cover [57], (b) elevation with gauge sites and USGS gauge number, and (c) land use percentage.
Land 14 01919 g001
Figure 2. Annual rainfall trends based on PRISM data for 1982–1999 (blue, lower slope) and 2000–2020 (orange, higher slope) (a). Monthly distribution of rainfall (blue bar graph) and mean temperature (orange line graph) (b).
Land 14 01919 g002

2.2. Methods

The procedure for estimating the impacts of future climate and land use change on hydrological behavior and water quality in the Kickapoo watershed involves the following steps (Figure 3):
(1) Hydrological Model Setup: The SWAT model was configured for the Kickapoo watershed using a digital elevation model, land use map, soil data, and current weather inputs from the Parameter-elevation Regressions on Independent Slopes Model (PRISM) [58]. The PRISM is widely used in hydrological modeling because it provides observation-based climate data with high spatial and temporal detail, making it well-suited for large-scale watershed simulations across the contiguous United States [59]. The model was then parameterized and calibrated using observed streamflow, sediment, and nutrient load data available for 21 years, 2000-2020. The calibrated model is referred to as the baseline model and used for climate and land use scenario simulations. Readers are referred to Arden et al. (2022) [45] for additional details on the sources and processing of the dataset for the hydrologic model setup, calibration, and validation for stream flow and nutrient loads.
(2) Climate Projections: Future daily rainfall and temperature time series for Representative Concentration Pathways (RCPs) 4.5 and 8.5 scenarios were obtained from seven statistically downscaled to high spatial resolution (~4 km) and robust bias-corrected global climate models (GCMs) using the Multivariate Adaptive Constructed Analogs method (MACAv2; https://www.climatologylab.org/maca.html, accessed on 20 April 2024) [60]. The MACAv2-CMIP5 dataset was trained with a high-resolution historical observational dataset (1971–2005) such as PRISM or a dataset derived from PRISM [54,61]. These GCMs were selected based on prior studies in Wisconsin watersheds [62,63]. The RCP4.5 is a stabilization scenario, where radiative forcing alleviates at 4.5 W m−2 in the year 2100 without exceeding that value. RCP8.5 combines assumptions about high population and relatively slow income growth with modest rates of technological change, thus resulting in very high greenhouse gas emissions [64].
(3) Land Use Change Scenarios: Land use scenarios were developed based on plausible trends focusing on the land covers most likely to change by the end of the 21st century.
(4) Scenario Simulation: Future hydrologic and water quality conditions were simulated under scenarios involving individual and combined changes in the climate (precipitation and temperature) and land use.
(5) Impact Assessment: Projected changes in streamflow and nutrient loads were evaluated by comparing the ensemble median of model outputs to the baseline period (2000–2020), which represents the current climate and land use condition. The use of the ensemble median is a standard approach to account for uncertainty associated with multi-model climate projections [65,66,67].

2.2.1. Model Setup and Calibration

The Hydrologic and Water Quality System (HAWQS, dev.hawqs.tamu.edu) Version 2.0 [68] was used to set up and parameterize the Kickapoo SWAT model. Key spatial input files, including the digital elevation model (DEM), land cover, soil map, climate, and agricultural management practices [69] are detailed in Table C1 in Arden et al., (2025) [45]. The watershed was divided into 92 sub-basins at the Hydrologic Unit Code (HUC)-14 scales [45], and these were further subdivided into 11,764 hydrologic response units (HRUs) representing unique combinations of land use, soil, and slope classes.
To ensure the model’s robustness for future climate and land use simulations, calibration and validation were performed using the SUFI-2 algorithm within the SWAT Calibration and Uncertainty Program [70]. Daily measured discharge data for the 2000–2020 duration from the La Farge and Steuben USGS gage stations (Figure 1) were used for flow calibration, followed by calibration and validation for sediment and nutrient loads. Total phosphorus (TP) and total nitrogen (TN) loads were estimated using weekly stream TP and TN concentrations from Steuben (2000–2020) using the USGS Load Estimator (LOADEST) [71]. La Farge was excluded from LOADEST models due to insufficient nitrate and TP concentration data. The full model setup and calibration result details are provided in Appendix C in Arden et al., 2025 [45]. From here onwards we call the calibrated model—baseline.

2.2.2. Future Climate Projections

Projected daily rainfall and temperature for the period 2021–2099 were derived for RCP 4.5 and 8.5 scenarios from an ensemble of seven global climate models (GCMs) (Supplementary Materials, Table S1). These projections were statistically downscaled and bias-corrected using the Multivariate Adaptive Constructed Analogs (MACA) method at a fine resolution of a 4 km grid [60,61], which made the future climate projections more realistic and locally relevant [72]. The MACA-2 product was found to accurately represent the fine-scale spatiotemporal variability including extremes [61,72] which is crucial for our watershed. We delineated the climate projection analysis in three equal future periods of 25 years: early century (2024–2049), mid-century (2050–2074), and late century (2075–2099).
The gridded temperature and precipitation data were converted from continuous raster cells to point data by representing each cell’s centroid carrying its associated value. These centroid points were intersected with the HUC14 watershed boundaries (average size ~20 km2), and for each HUC14 sub-basin, values from all centroid points within the boundary were averaged. If no centroids fell within a sub-basin boundary, the value of the nearest centroid to the sub-basin centroid was used. This process of generating the future climate input data required for SWAT simulations was described in (Corona, 2023) [73].

2.2.3. Projected Rainfall and Temperature

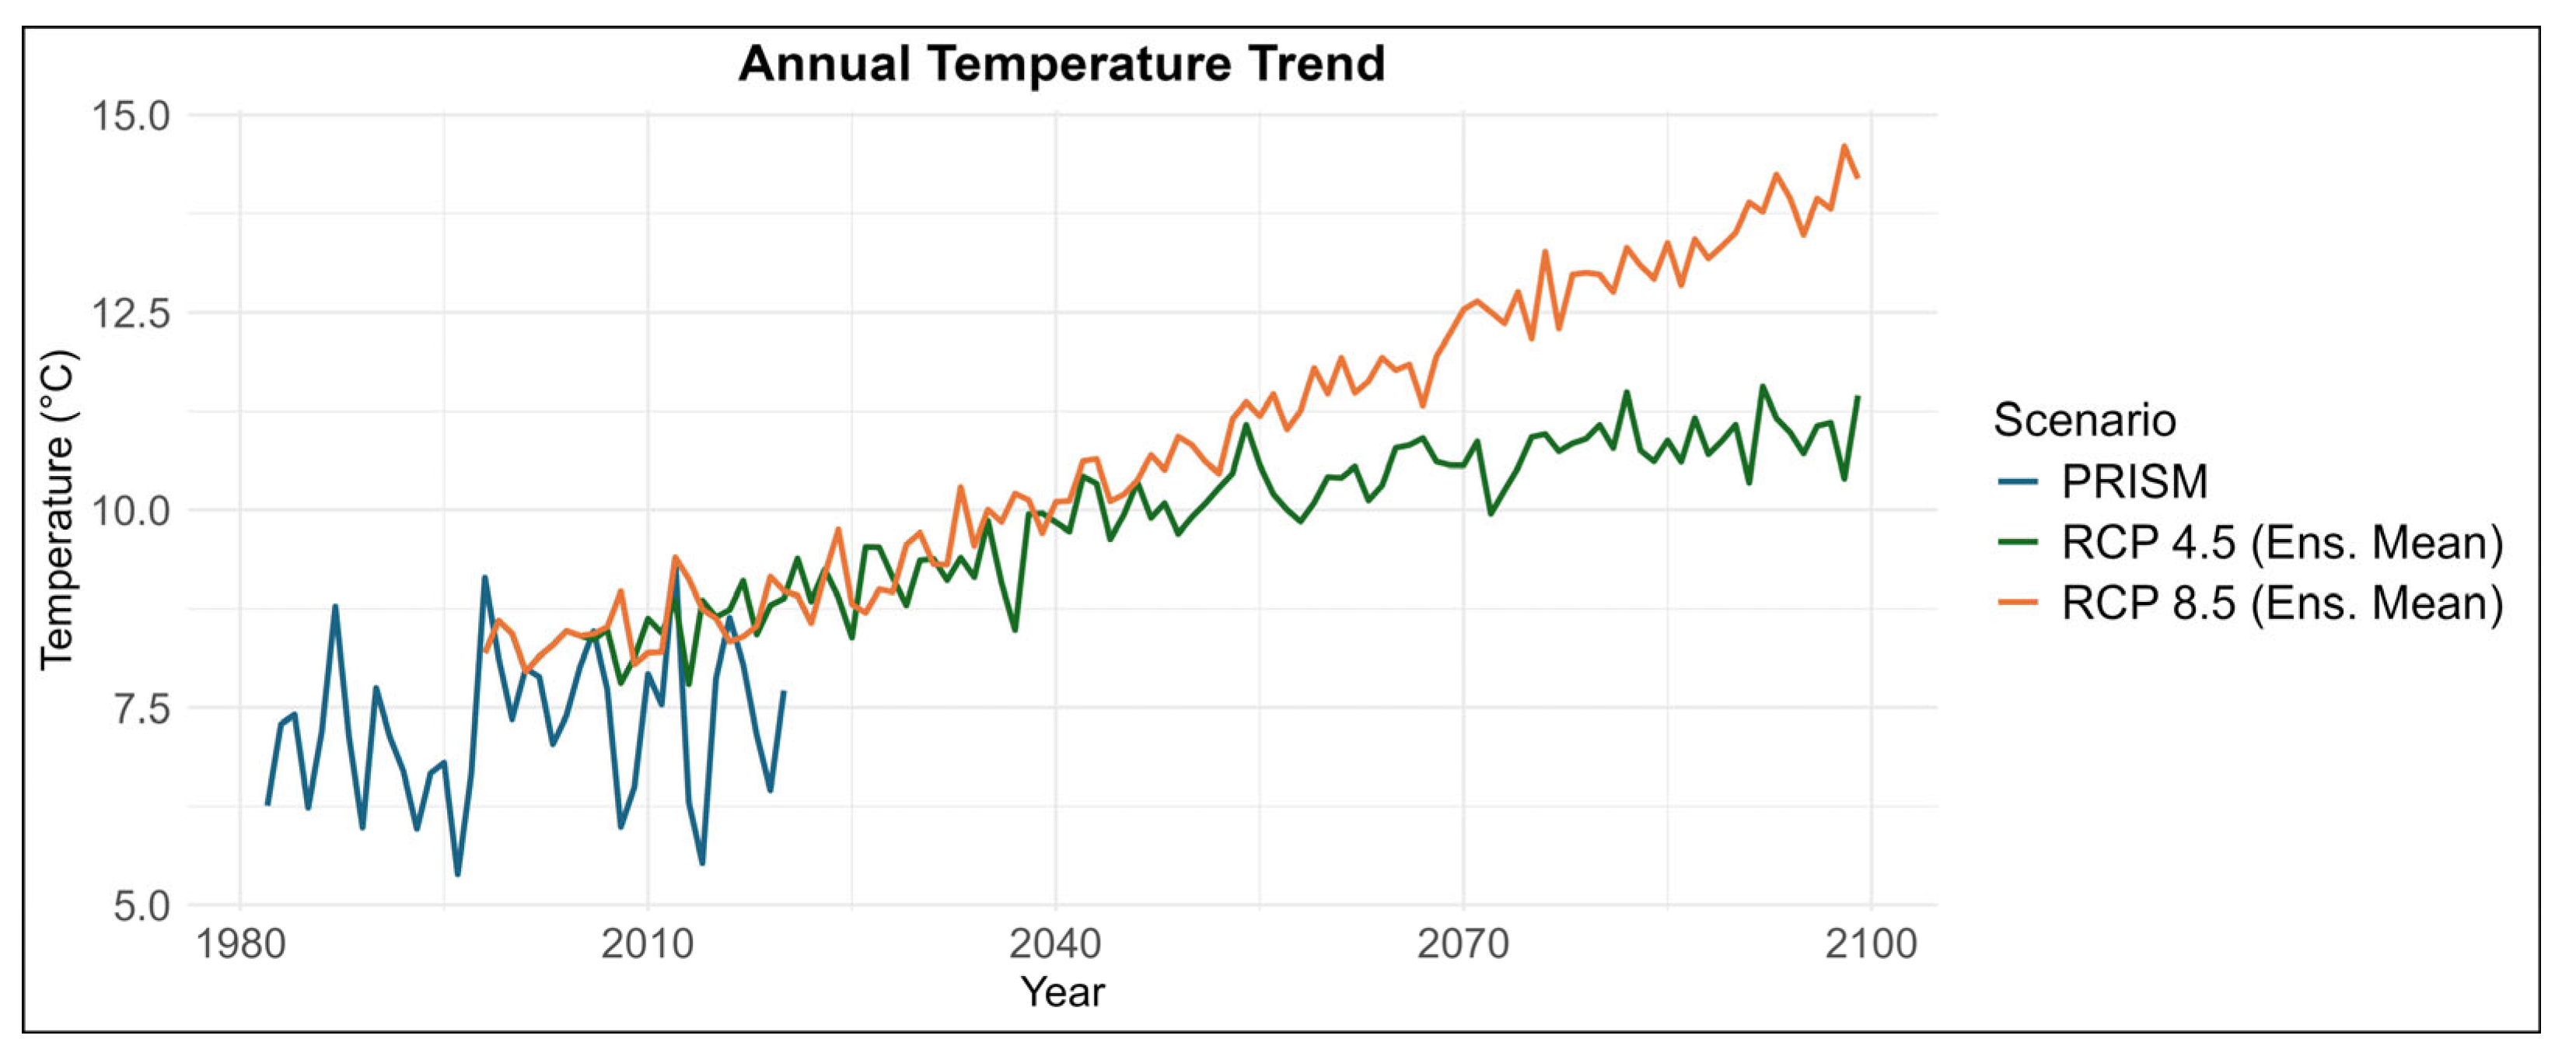
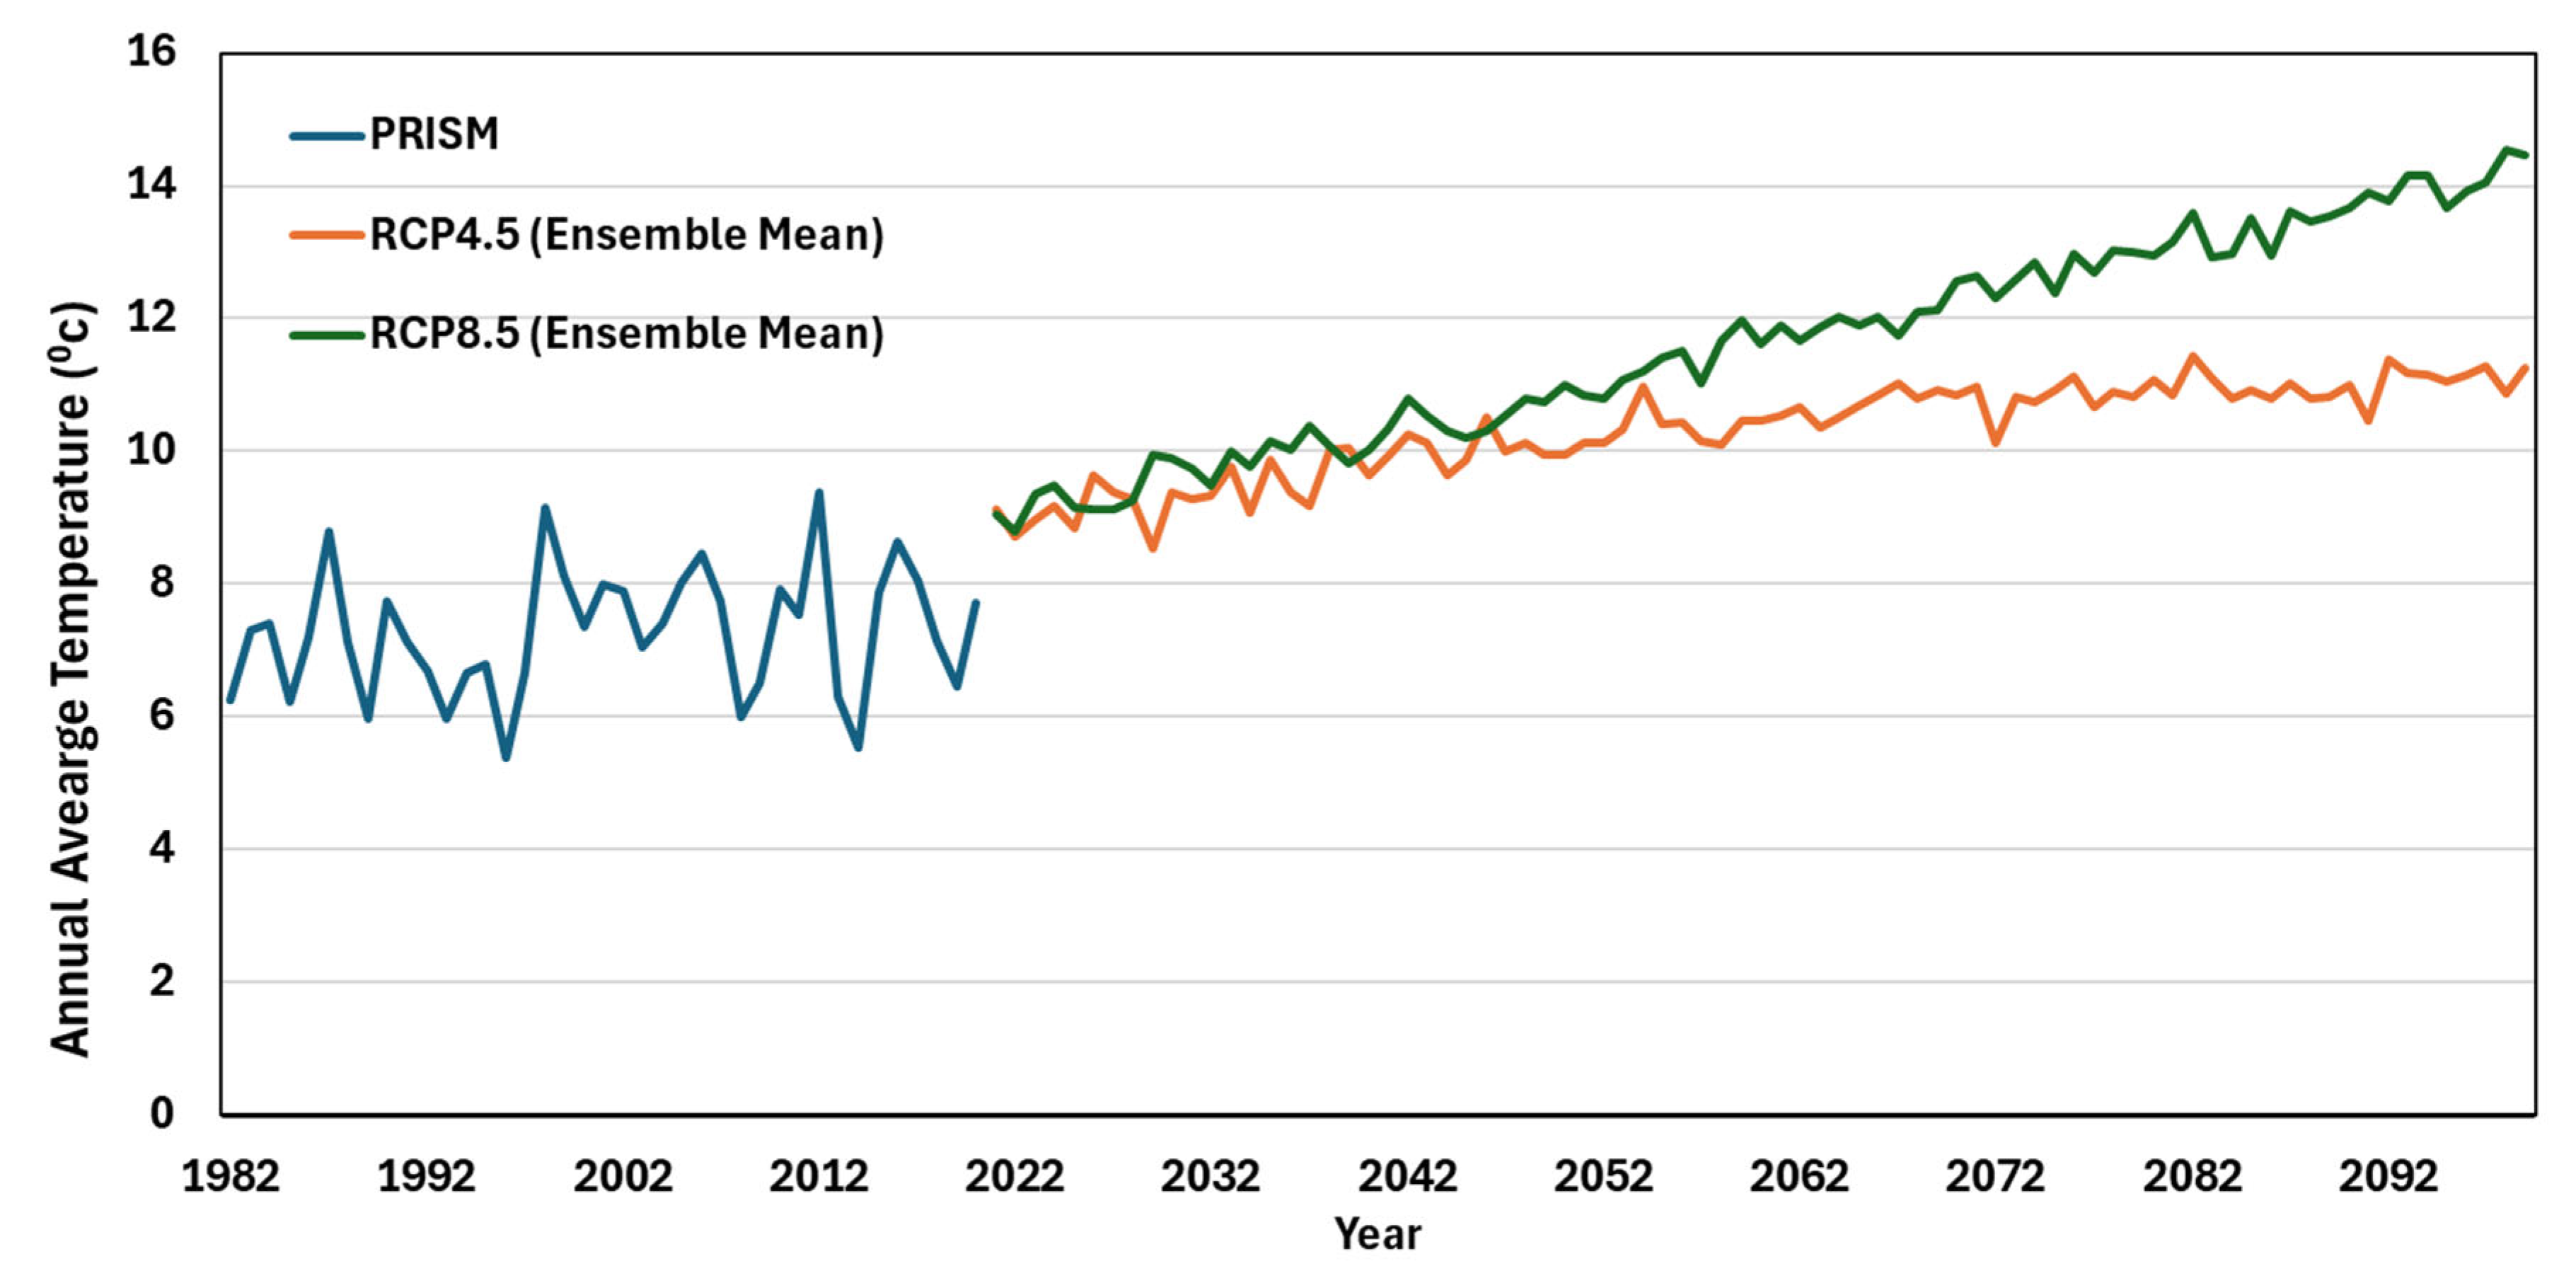
Observed PRISM data (1982–2020) show a moderate rise in annual average temperature (1–2 °C) (Figure 4). The ensemble mean of future projections shows this warming will continue under both RCPs until mid-century, after which the trends diverge. We also included an analysis of the projected ensemble average for 2006–2020 to explicitly show the temperature rise in the last two decades (Figure A4). RCP8.5 (representing higher emissions) predicts a sharper temperature rise after 2050, while RCP4.5 stabilizes. Over the mid- and late century, winter is going to experience significant temperature increases (1.05–4.73 °C for RCP4.5 and 1.50–8.59 °C for RCP8.5), followed by summer (1.05–4.42 °C for RCP4.5, 2.12–7.37 °C for RCP8.5), while fall (0.91–3.72 °C for RCP4.5, and 2.45–6.61 °C for RCP8.5) and spring (0.61–4.42 °C for RCP4.5, and 2.12–7.37 °C for RCP8.5) are less affected (Table S2). RCP8.5 exhibits more extreme warming than RCP4.5, particularly in winter and summer by the late century, with increases reaching up to 8.59 °C (MIROC).
The ensemble mean of rainfall for both RCPs indicates a shift toward wetter conditions relative to the PRISM historical period (1982–1999) (Figure 5). Notably, observed annual rainfall from the PRISM baseline period 2000–2020 was already 17% higher than the historical average (Table S3), suggesting either the early emergence of a wetter hydroclimatic regime or the influence of recurrent anomalously high rainfall years in the last two decades. The “jump” from the baseline blue line to projection means is not an artificial discontinuity. It is a real-world feature of the historical record that represents a significant flood year. The high spike in annual average streamflow in the baseline period (specifically in 2018) (Figure 8) is a result of high rainfall and is consistent with the observed data (Figure A3). We also investigated that future rainfall projections from 2006–2020 indicate an overall increase, reflected in the rising ensemble mean, with variability across GCMs capturing several high-rainfall years during this period (Figure A5). However, the extreme rainfall observed in 2018, which caused a rare flood event, was not captured in the projections. The interannual variability during the baseline period (SD (standard deviation): 202.81 mm) was near the upper range of projected variability for the mid- and late century under both RCPs (SD: 113.88–247.76 mm) (Table S3). Moreover, the projected annual rainfall indicates an increased likelihood of high rainfall years towards the end of the century. RCP 8.5 projects higher annual rainfall (833.59–1021.83 mm) and variability (SD: 131.75–245.92 mm) than RCP 4.5, reflecting higher impacts associated with the higher emissions (Table S3). These projections suggest a wetter future with increased variability and notable uncertainty across models and time periods in this watershed.
Heavy rainfall events (≥1 inch and ≥2 inches/day) increased substantially from the historical period (1982–1999) to the baseline (2000–2020), indicating a shift toward more frequent intense rainfall or the emergence of anomalous extremes (Figure A1, Table S4). Projections suggest that ≥1 inch/day events will persist or intensify through the late century, with higher occurrences under RCP8.5 (151–216 days) than RCP4.5 (134–177 days), reflecting stronger climate forcing. Although ≥2 inch/day events increased anomalously between the historical and baseline periods, they are projected to occur less frequently than baseline in the future period; however, few GCMs projected rare events in the late century (Table S4).
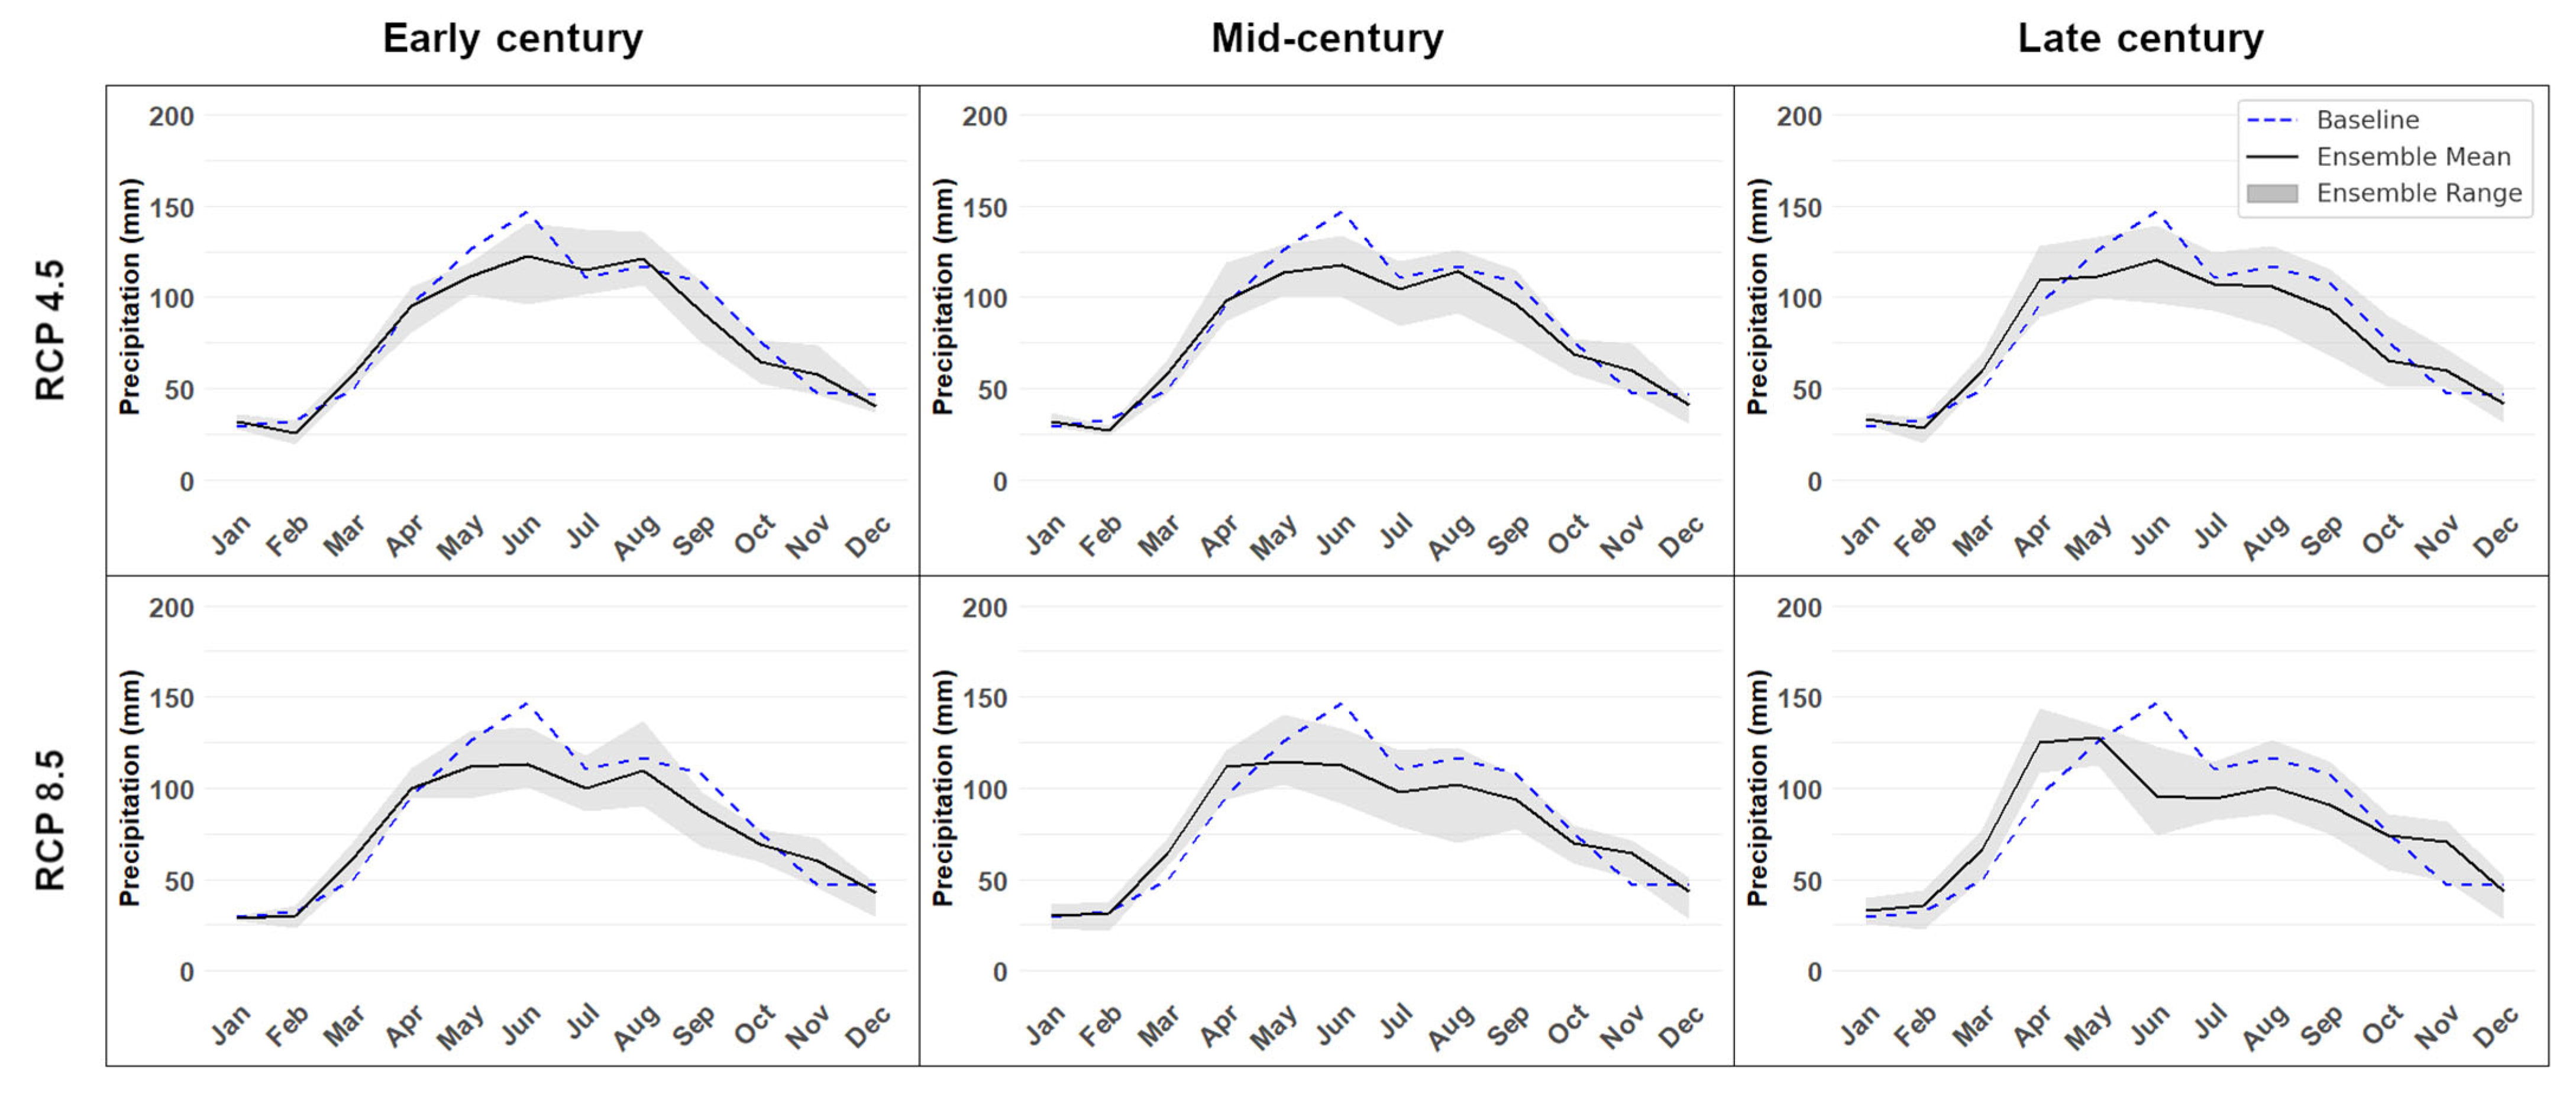
RCP4.5 retains the baseline seasonal rainfall pattern, with peaks in May–June and declines after August–September (Figure 6), while RCP8.5 shows greater mid- and late-century divergence, and earlier occurrences of a peak (March–April). Drier summers (June–August), with summer rainfall declining by 5–23% under RCP4.5 and up to 32% under RCP8.5 (Table S5)—these reductions contrast with baseline high summer rainfall that sustains soil moisture and supports crop growth. Spring (March–May) rainfall is projected to increase by 3.4% under RCP4.5 and up to 16.5% under RCP8.5, potentially intensifying erosion and nutrient loss as croplands are often fallow during this period. Winter projections vary widely (−29.1% to +18%), while fall remains relatively stable.

2.3. Scenarios

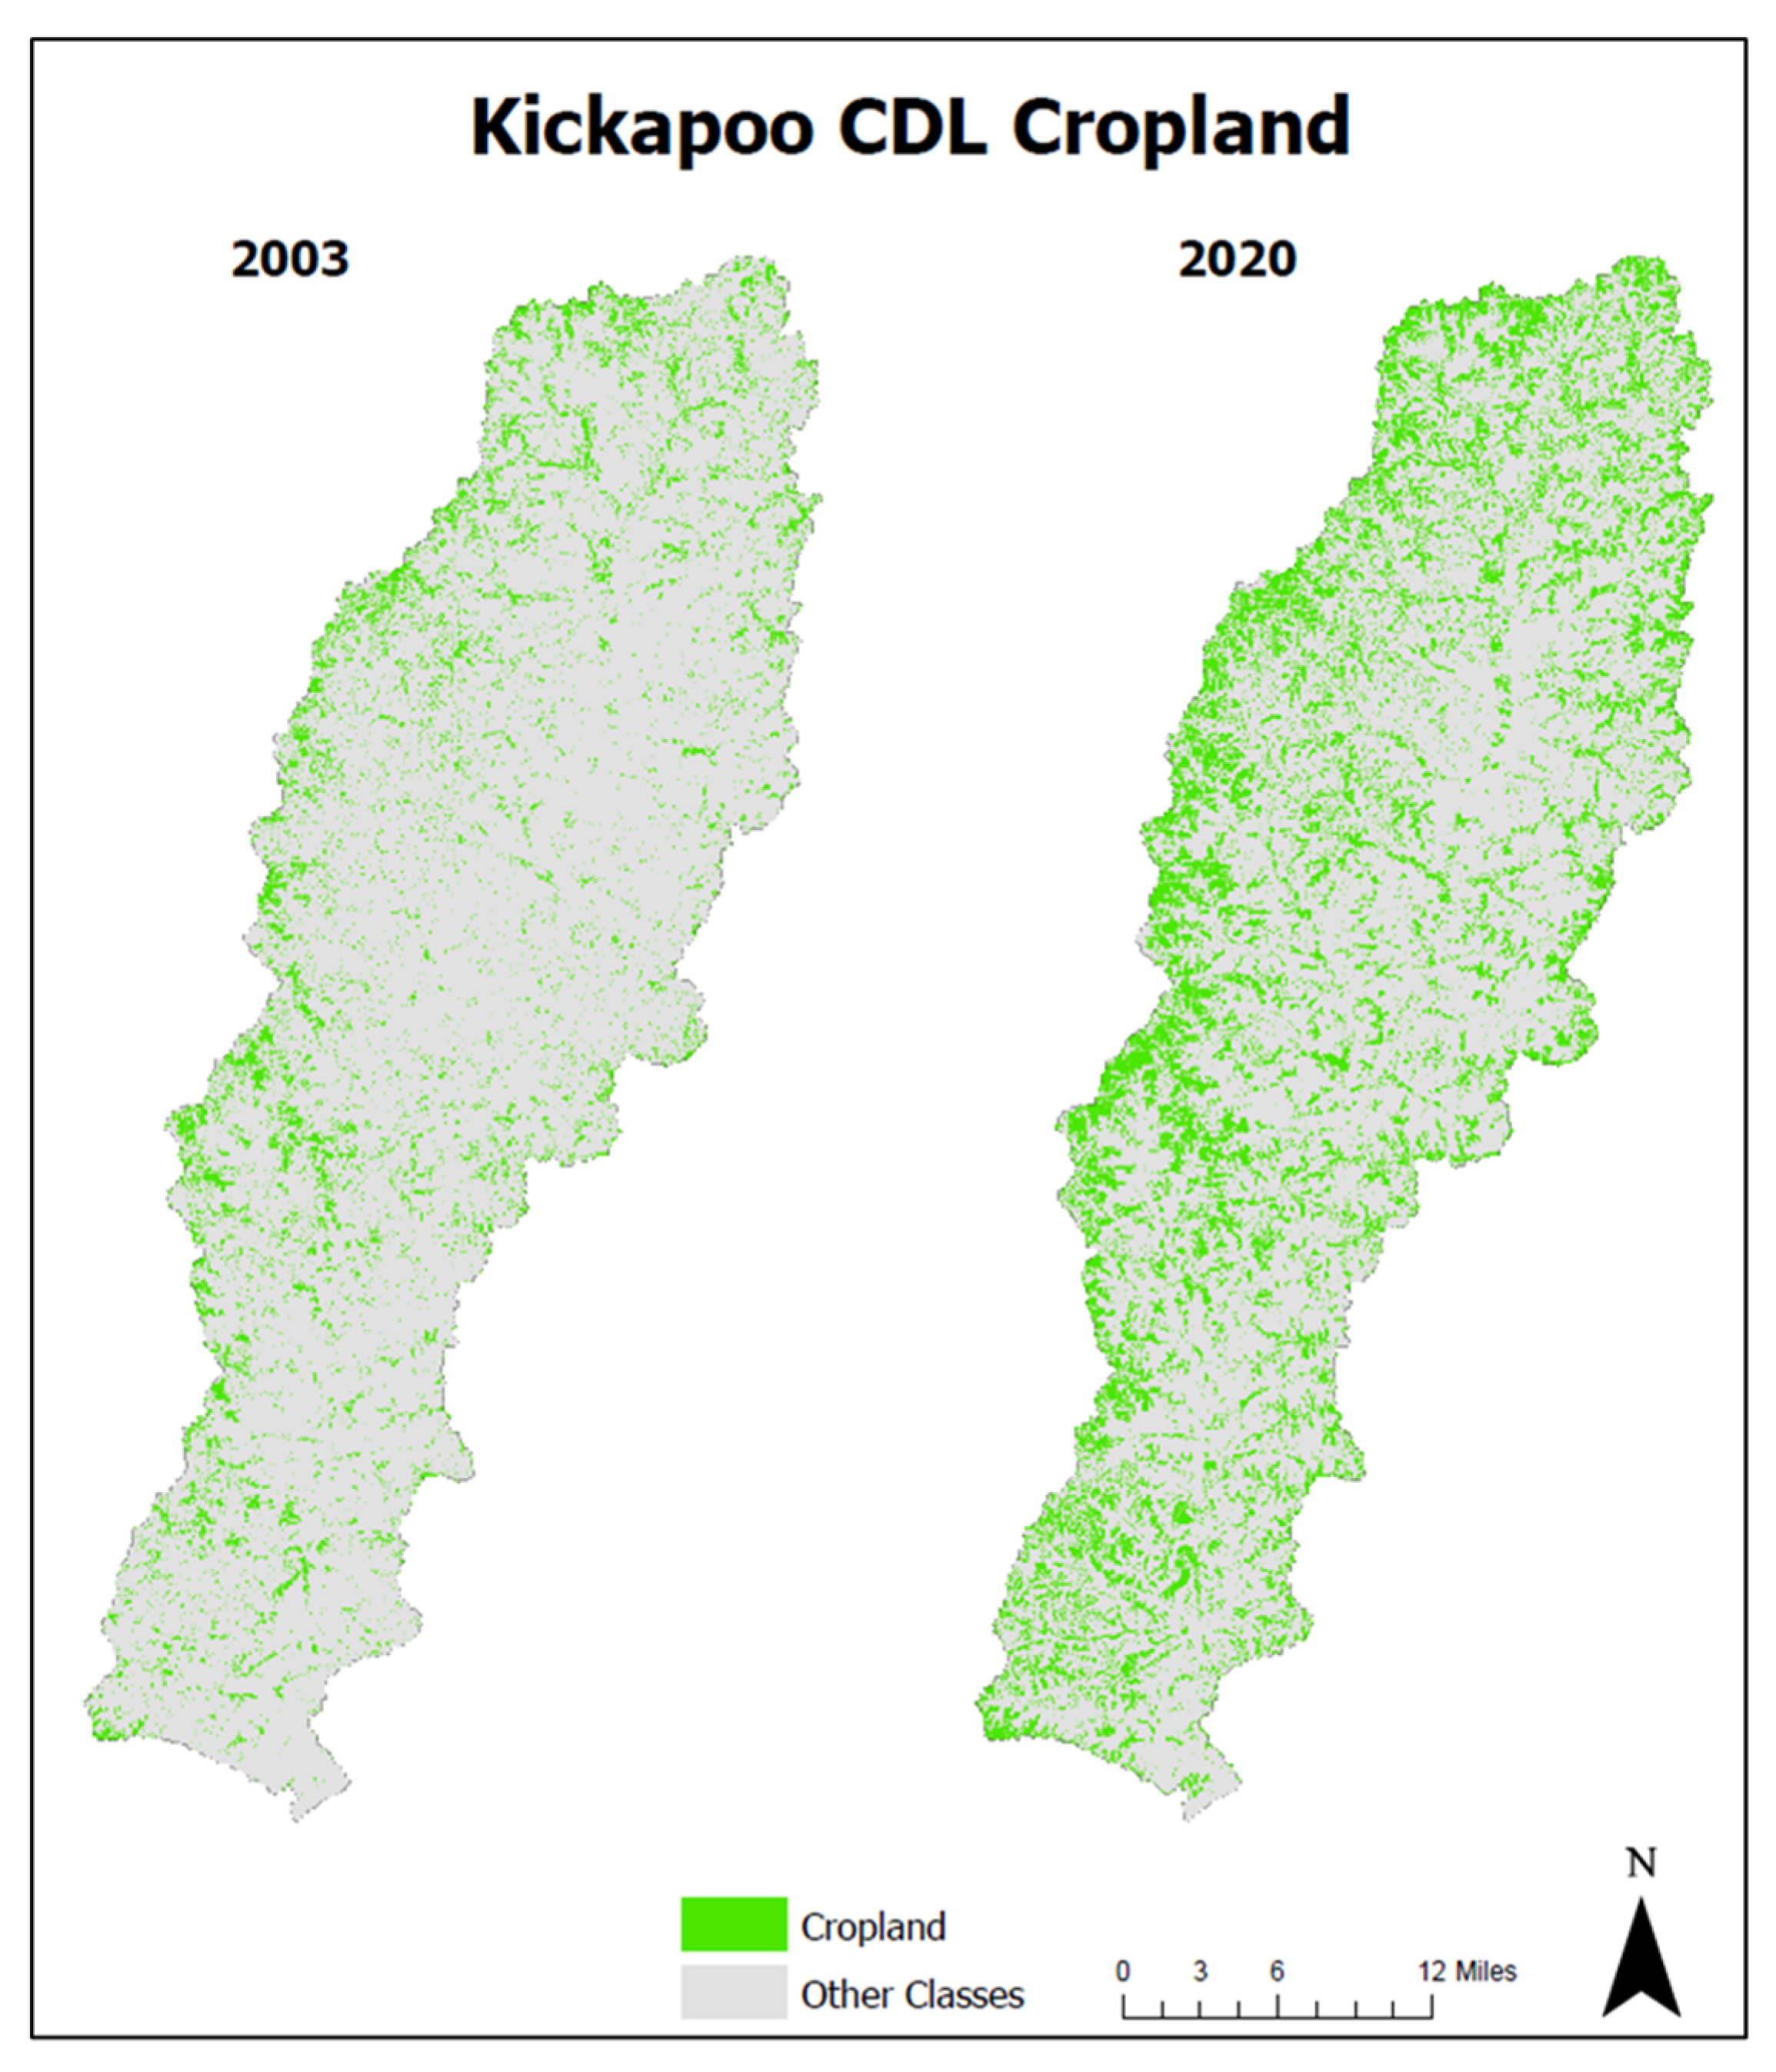
Since the last decades, the primary trend in land use change within the Kickapoo watershed was a significant reduction in prairie grassland land from 1378 km2 in 2003 to 466 km2 in 2020 accompanied by an increase in agricultural land from 142 km2 to 333 km2 ([74], Figure A2). This indicates that prairie-to-cropland conversions have been the dominant drivers of land use change. The scenarios (Table 1) evaluate the individual and combined impacts of land use and climate change across different timeframes and conditions. All the scenarios were implemented using the calibrated baseline model.
For the climate change (CC) scenario simulation, we used projected temperature and rainfall data from 2021 onwards, while keeping the baseline land use data static, and we analyzed the impacts of the CC scenario across three equally divided, 25-year periods; early century (2024–2049), mid-century (2050–2074), and late century (2075–2099). For the land use change (LU) scenario, we investigated the impacts by converting hay (ungrazed grass land) to row crops using baseline (2000–2020) climate data. For the combined land use and climate change, we simulated two scenarios, LUCC and G-CC. For LUCC, we combined mid-century (2050–2074) and late-century (2075–2099) climate projections with land use shifts from hay to row crops, while for G-CC we used the same climate projection mid-century and late century and converted row crops to grassland. Together, these scenarios assess the interplay of land use changes and climate projections over time. Given the already elevated phosphorus concentrations in streams, the G-CC scenario explores whether converting cropland back to prairie could mitigate phosphorus levels and help achieve TMDL targets.

3. Results

3.1. Climate Change Scenario (CC) Impacts on the Entire Watershed

3.1.1. Impact on Water Balance

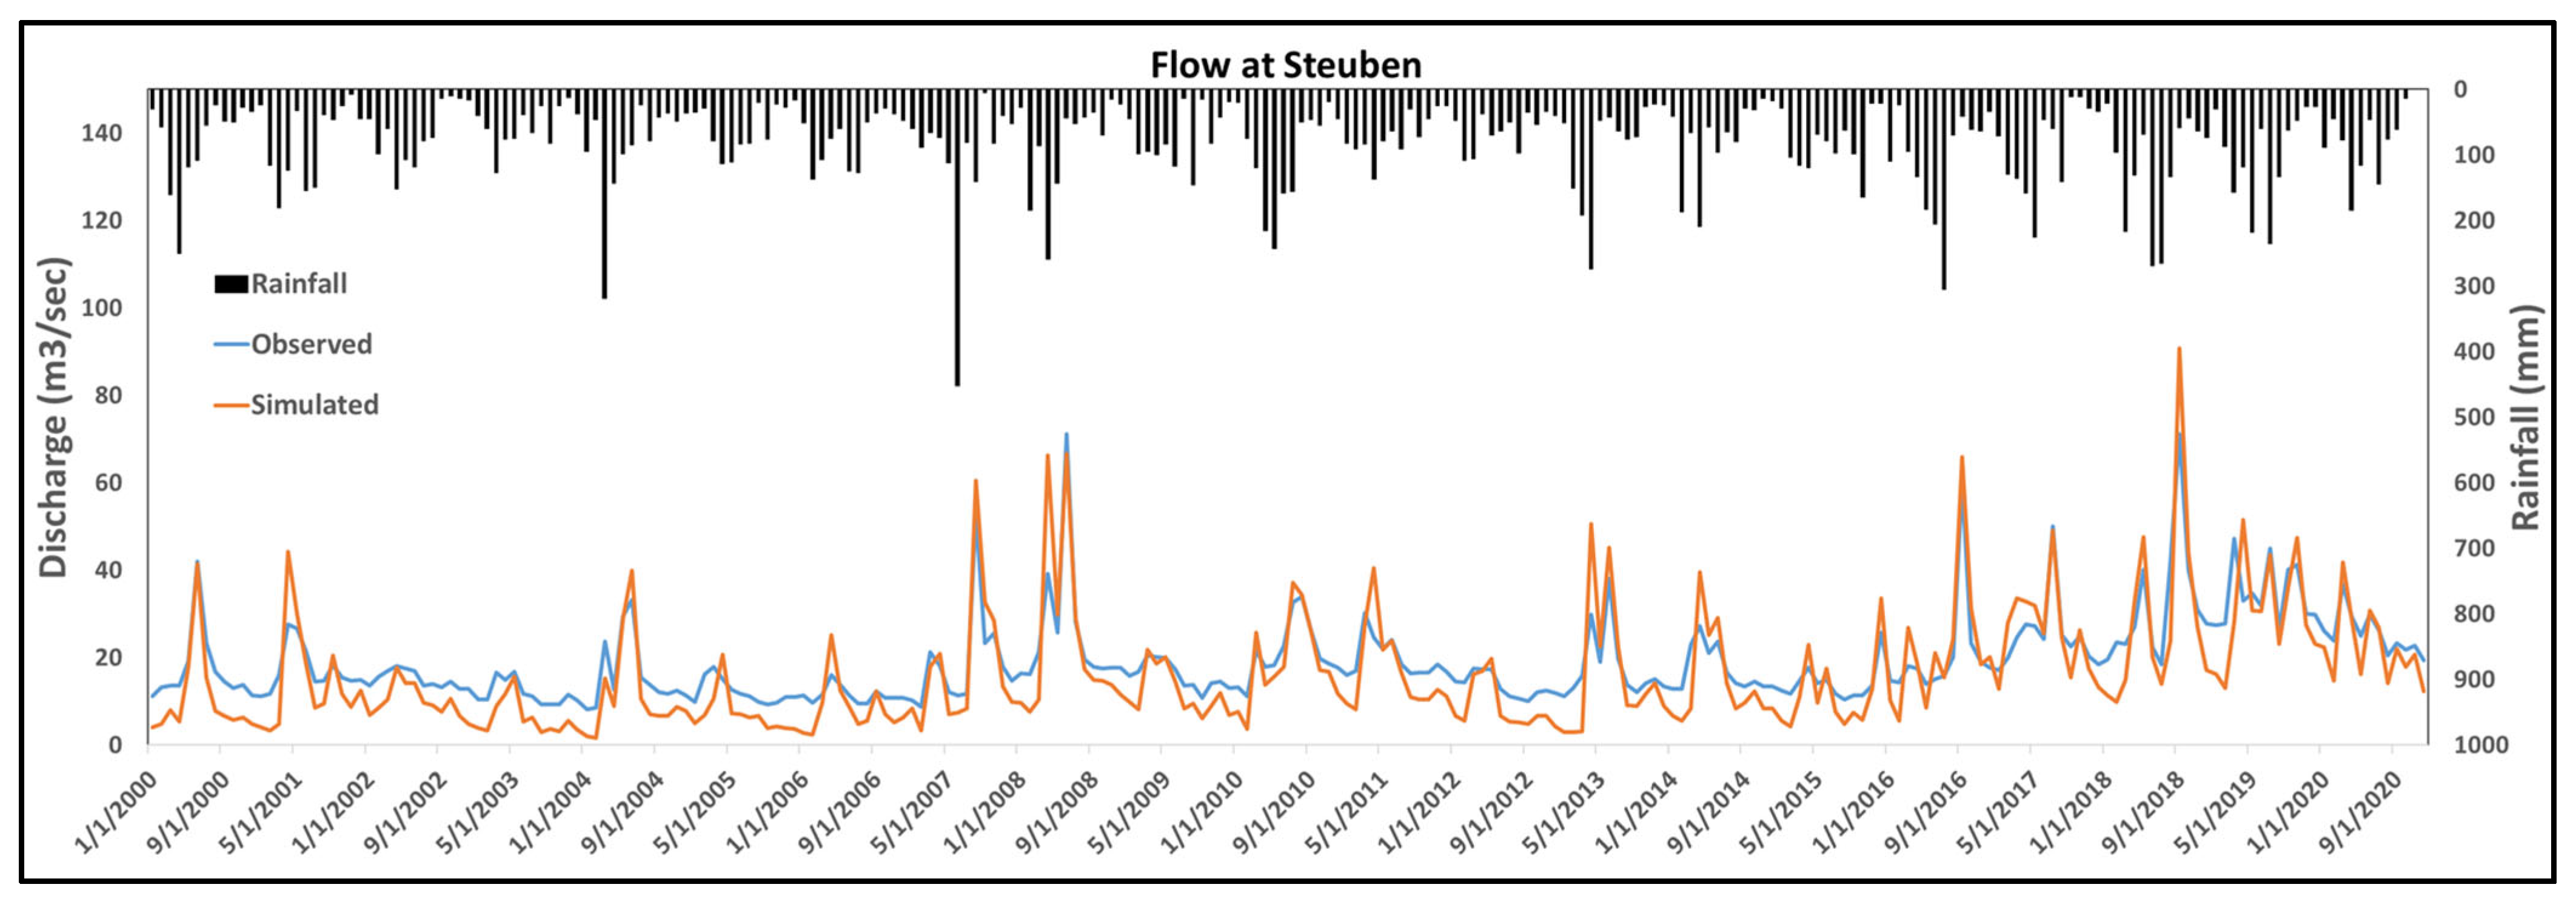
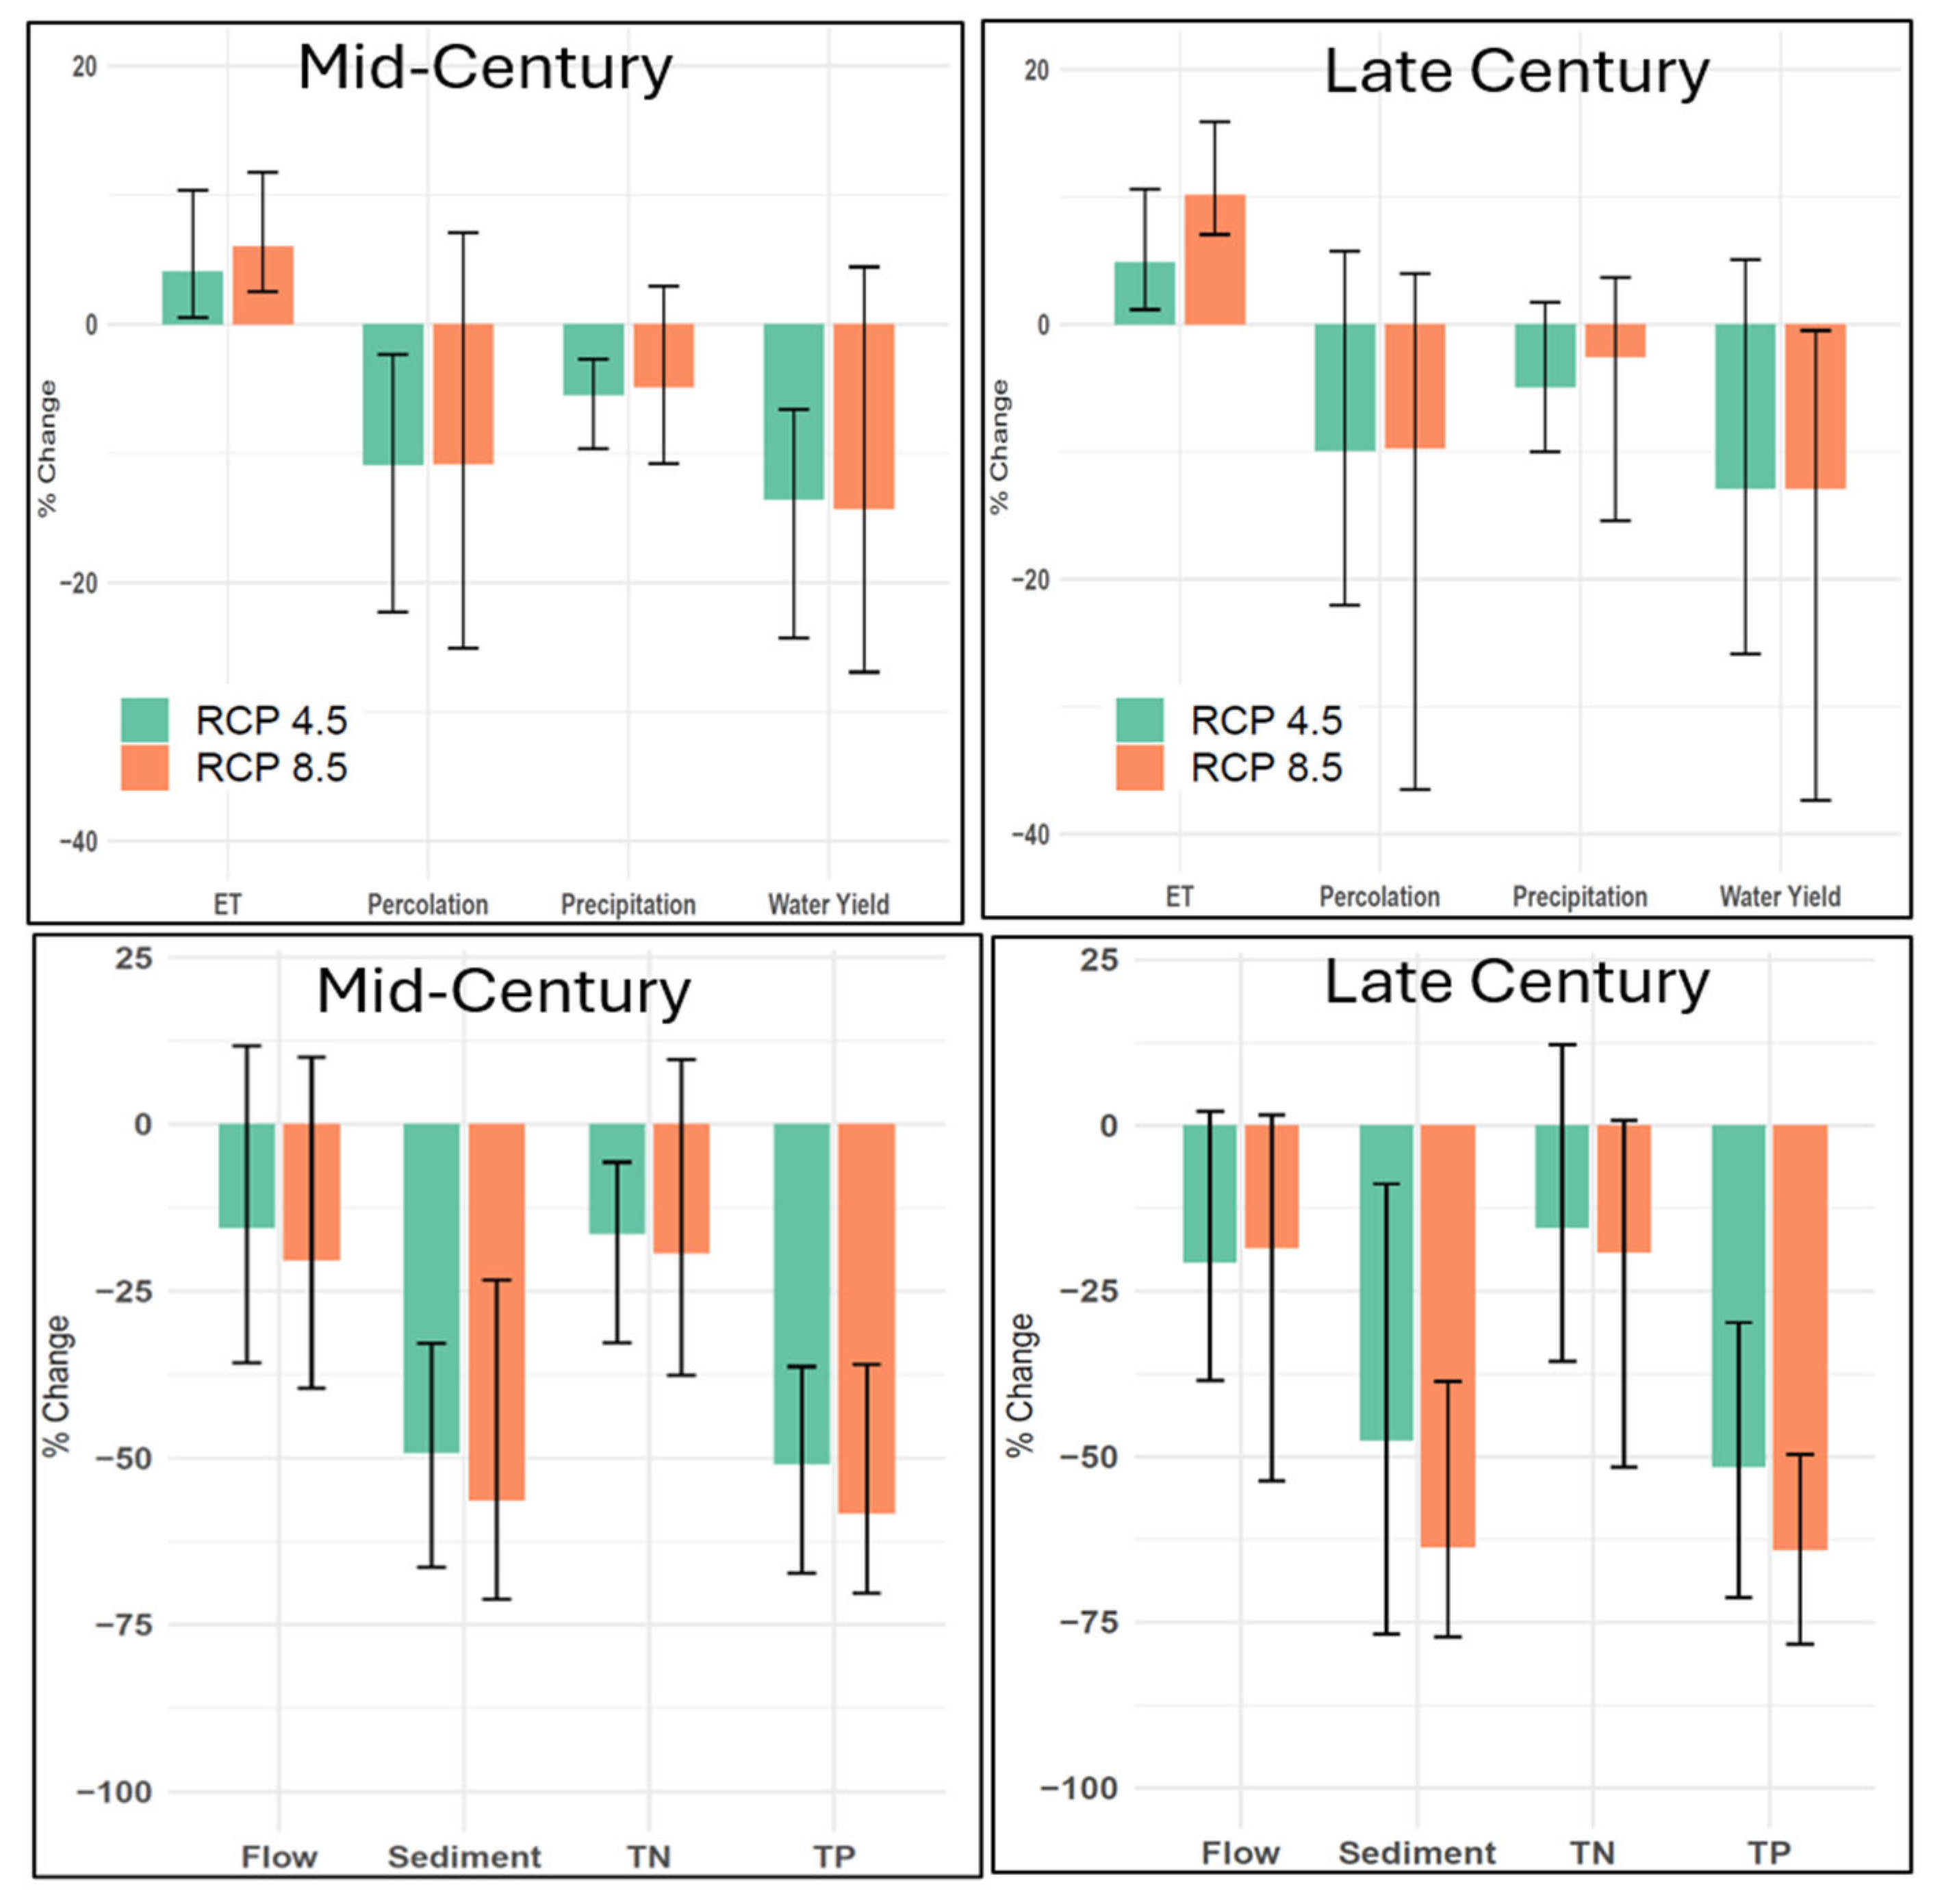
The assessment of the performance of the baseline model in simulating observed monthly discharge (r2 = 0.85), total nitrogen (r2 = 0.75), and total phosphorous (r2 = 0.79) loads at Steuben as well as its associated parameter uncertainty was presented and discussed in detail in Arden et al., 2025 [45]. Projected changes in water balance components (precipitation, percolation, ET, and water yield (water yield is the sum of runoff, lateral flow, and baseflow)) under both RCPs across seven GCMs indicate consistent declines in annual average water yield ranging from 7.34% to 25.88% for RCP4.5 during the mid-century and from 0.25% to 37.35% for RCP8.5 during the late century (Figure 7 (top), Table S6), while RCP 8.5 has high variability (5% to -26%) during the mid-century, and RCP 4.5 has high variability (5% to 26%) during the late century. These reductions are primarily driven by increased evapotranspiration (0.5–10% for RCP4.5 and 2.6–16% for RCP8.5), due to rising temperatures, and decreased percolation (2.3–22% for RCP4.5 and 2.5–36% for RCP8.5). Spatial assessment indicates that the southeastern region of the watershed, dominated by forest and pasture land is relatively more vulnerable to climate change (Figures S1 and S2) for both RCPs.

3.1.2. Impact on Stream Flow

Following the reduction in water yield, ensemble mean annual average streamflow is also projected to decline by approximately 10–20% relative to the baseline across the mid- and late century, primarily driven by shifts in rainfall patterns (Figure 7, bottom). However, projections vary substantially across GCMs from +2% to −35% under RCP4.5 and +1% to −50% under RCP8.5, reflecting high uncertainty, particularly under higher emission scenarios.
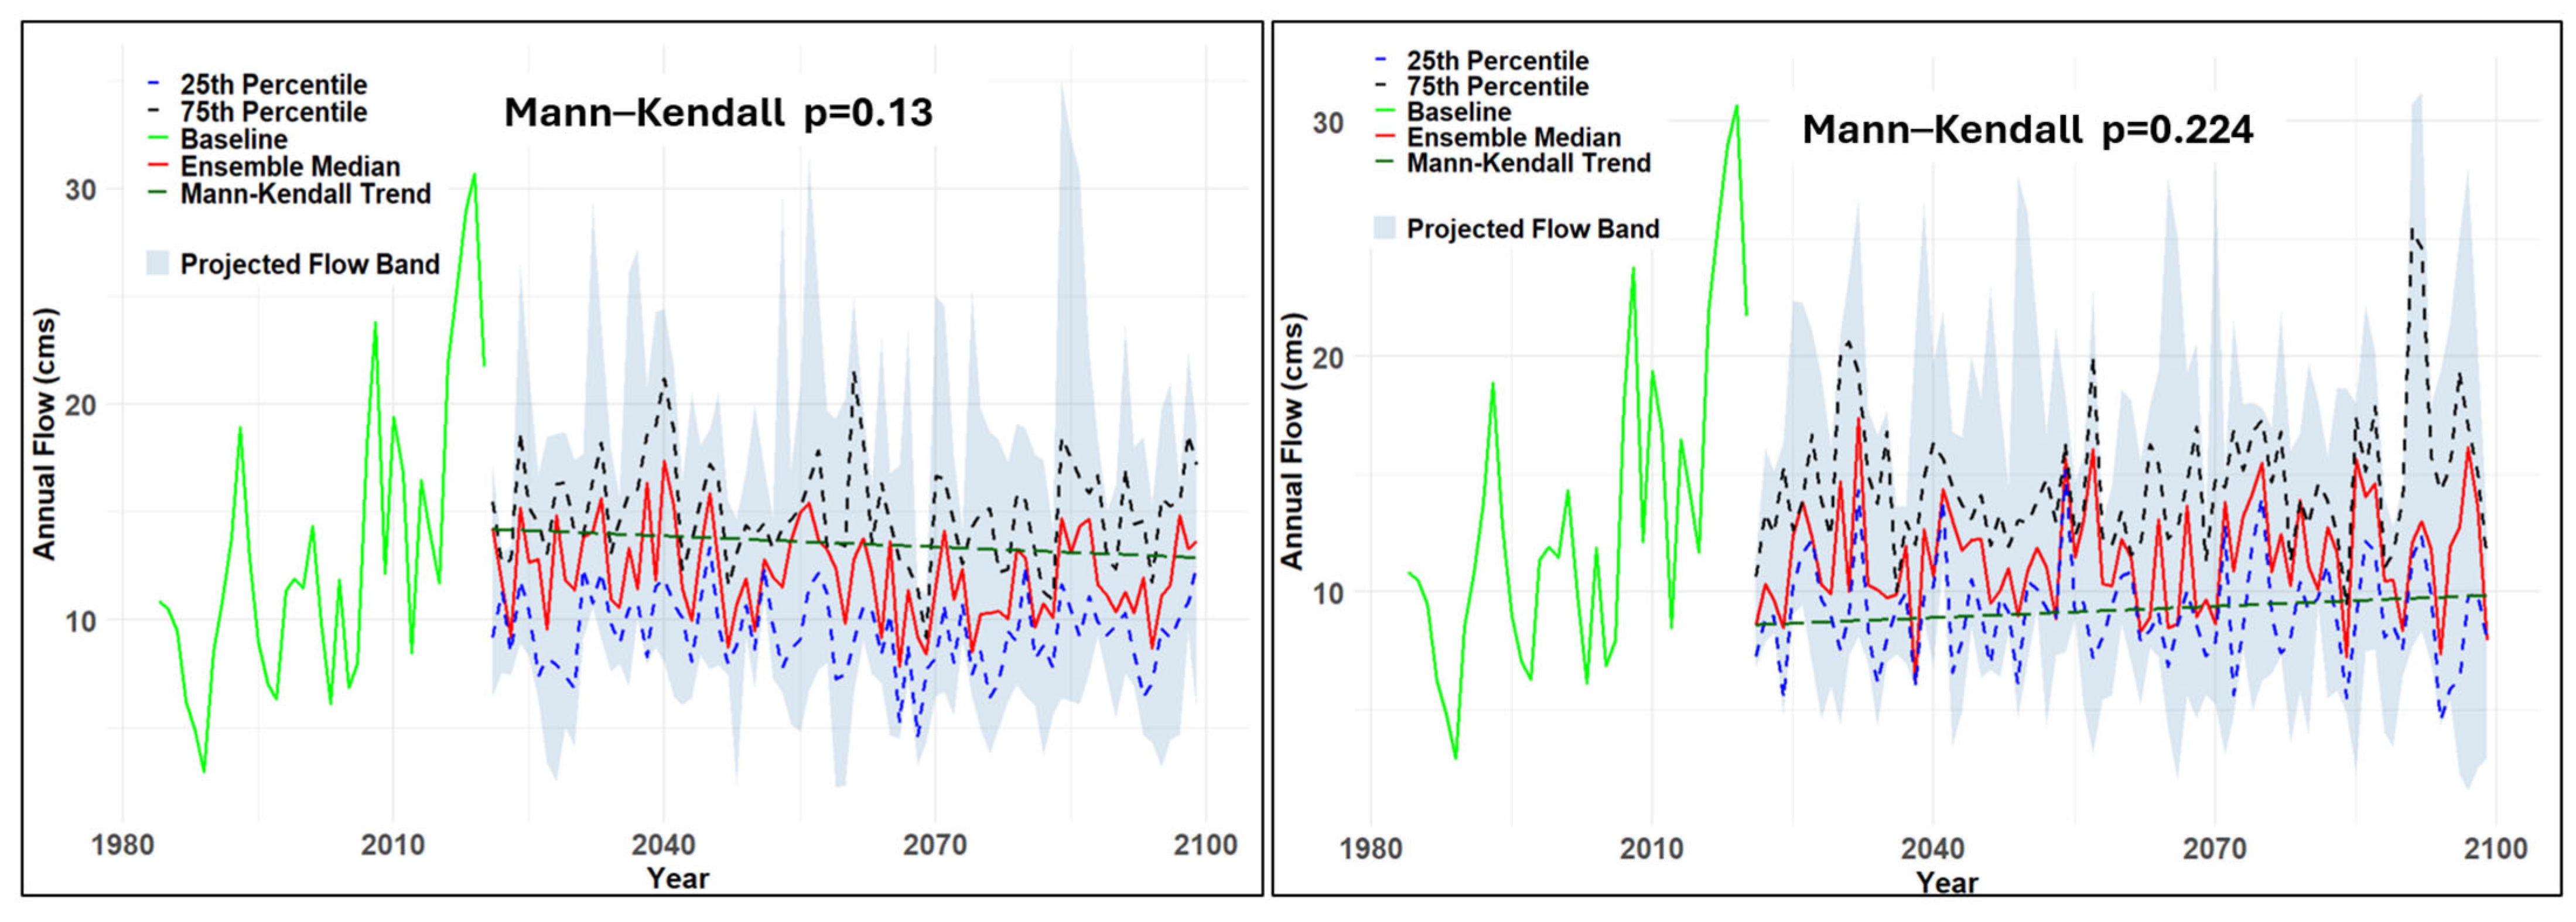
The projected annual streamflow at Steuben, under both RCPs, does not show a statistically significant long-term trend based on the Mann–Kendall test (p > 0.05). This suggests that average annual flows will be relatively stable across the mid- and late century (Figure 8). The baseline streamflow (2000–2020) shows significant up-and-down fluctuations from year to year indicating the early emergence of the climate shift and the resulting variability. Some years are much wetter (higher flow, year 2018, Figure A3) and some are much drier. While the projected streamflow will continue to fluctuate from year-to-year, the long-term trend is not statistically significant. The ensemble median shows a slight decline in annual streamflow under RCP4.5 and a slight increase under RCP8.5, with the latter exhibiting greater interannual variability (1–~30 m3/s). The ensemble spread widens toward the end of the century for both scenarios, indicating increased uncertainty across GCM projections. Although ensemble median annual streamflow shows limited change, it may mask important seasonal and daily variability. Therefore, we analyzed flow regimes to assess shifts in low- and high-flow conditions.
While the ensemble median monthly streamflow is consistently lower than baseline values, the wide projected range indicates high uncertainty in the hydrologic response, which is a more significant finding than the median’s simple prediction of flow reduction (Figure 9). The projected ranges include the possibility of high flows similar to the baseline in future except during the mid-century of RCP 4.5 and the late century of RCP 8.5. Despite this high uncertainty, the seasonal pattern generally aligns with the baseline, with high peaks occurring in the spring due to snowmelt and rainfall, followed by reduced flows in the fall and winter. Although summer is the wettest season, it does not produce peak flows but helps sustain discharge through baseflow and residual snowmelt. However, the early fall peak is projected to shift towards late fall across RCPs, driven by increased projected rainfall during that season (Figure 6). Overall, both scenarios indicate a drying trend, particularly under RCP 8.5.
Overall, projected daily flow regimes of most GCMs closely follow the baseline trend (Figure 10). However, variability in flows (exceedance > 75%) increases toward the late century in RCP4.5, reflecting growing uncertainty in groundwater contributions and posing challenges for managing water availability during dry periods. Projected flow duration curves from GCMs under RCP4.5 closely align with each other during the early and mid-century periods (except NorESM), with median flows (50% exceedance) ranging from 7 to 10 m3/s and the baseline median (~9.56 m3/s) lies near the upper end of this range. Low flows (90% exceedance probability) range from 2 to ~4.5 m3/s, with the baseline value falling within this range. Greater uncertainty is exhibited in the median flows (7–12 m3/s), for the mid- and late century for RCP4.5. For RCP8.5, the projected flows (except IPSL) remain consistent across the century. Low flows (3–5 m3/s) exhibit higher agreement than median and high flows, across all periods, and align well with the baseline. Median flows, projected between 7 and 10 m3/s during the early and mid-century periods, tend to be slightly lower than the baseline.

3.1.3. Impact on Sediment and Nutrient Load

Annual average sediment and nutrient loads are projected to decline substantially in the mid- and late-century periods under both RCPs (Figure 7, bottom figure), primarily driven by reduced streamflow, highlighting a strong linear relationship between flow and the transport of these constituents. While the annual average flow is projected to decrease by ~20%, sediment and total phosphorus (TP) loads decline by 50–60%. The reductions in TP and sediment are closely correlated, reflecting the dominant role of sediment-bound phosphorus transport. As streamflow decreases, reduced erosion leads to lower sediment mobilization, which in turn limits TP export.
The ensemble median of monthly sediment loads ranges from 2500 to 15,000 t/month, with a peak in March driven by snowmelt and extensive spring fallow (Figure S3), and a secondary peak in June corresponding to peak rainfall. Both RCPs project overall reductions in sediment loads relative to the baseline, with seasonal patterns preserved except under late-century RCP8.5, where the spring peak is diminished. Uncertainty is higher in late-century RCP4.5 and mid-century RCP8.5 projections. Monthly TP loads follow similar trends, consistently peaking in March–April across all scenarios and timeframes.
TN loads are projected to peak earlier, shifting from the baseline April peak to February–March under both RCPs, likely due to warmer winters and altered precipitation patterns enhancing nitrogen mobilization (Figure S3). While seasonal trends remain broadly aligned with the baseline, fall TN loads increase consistently throughout the century, largely attributed to increased streamflow during that period. RCP4.5 shows relatively narrow variability during the mid-century, while RCP8.5 is marked by prolonged seasonal peaks and greater uncertainty, reflecting stronger climate forcing.

3.2. Land Use and Climate Change Compounding Impacts on the Entire Watershed

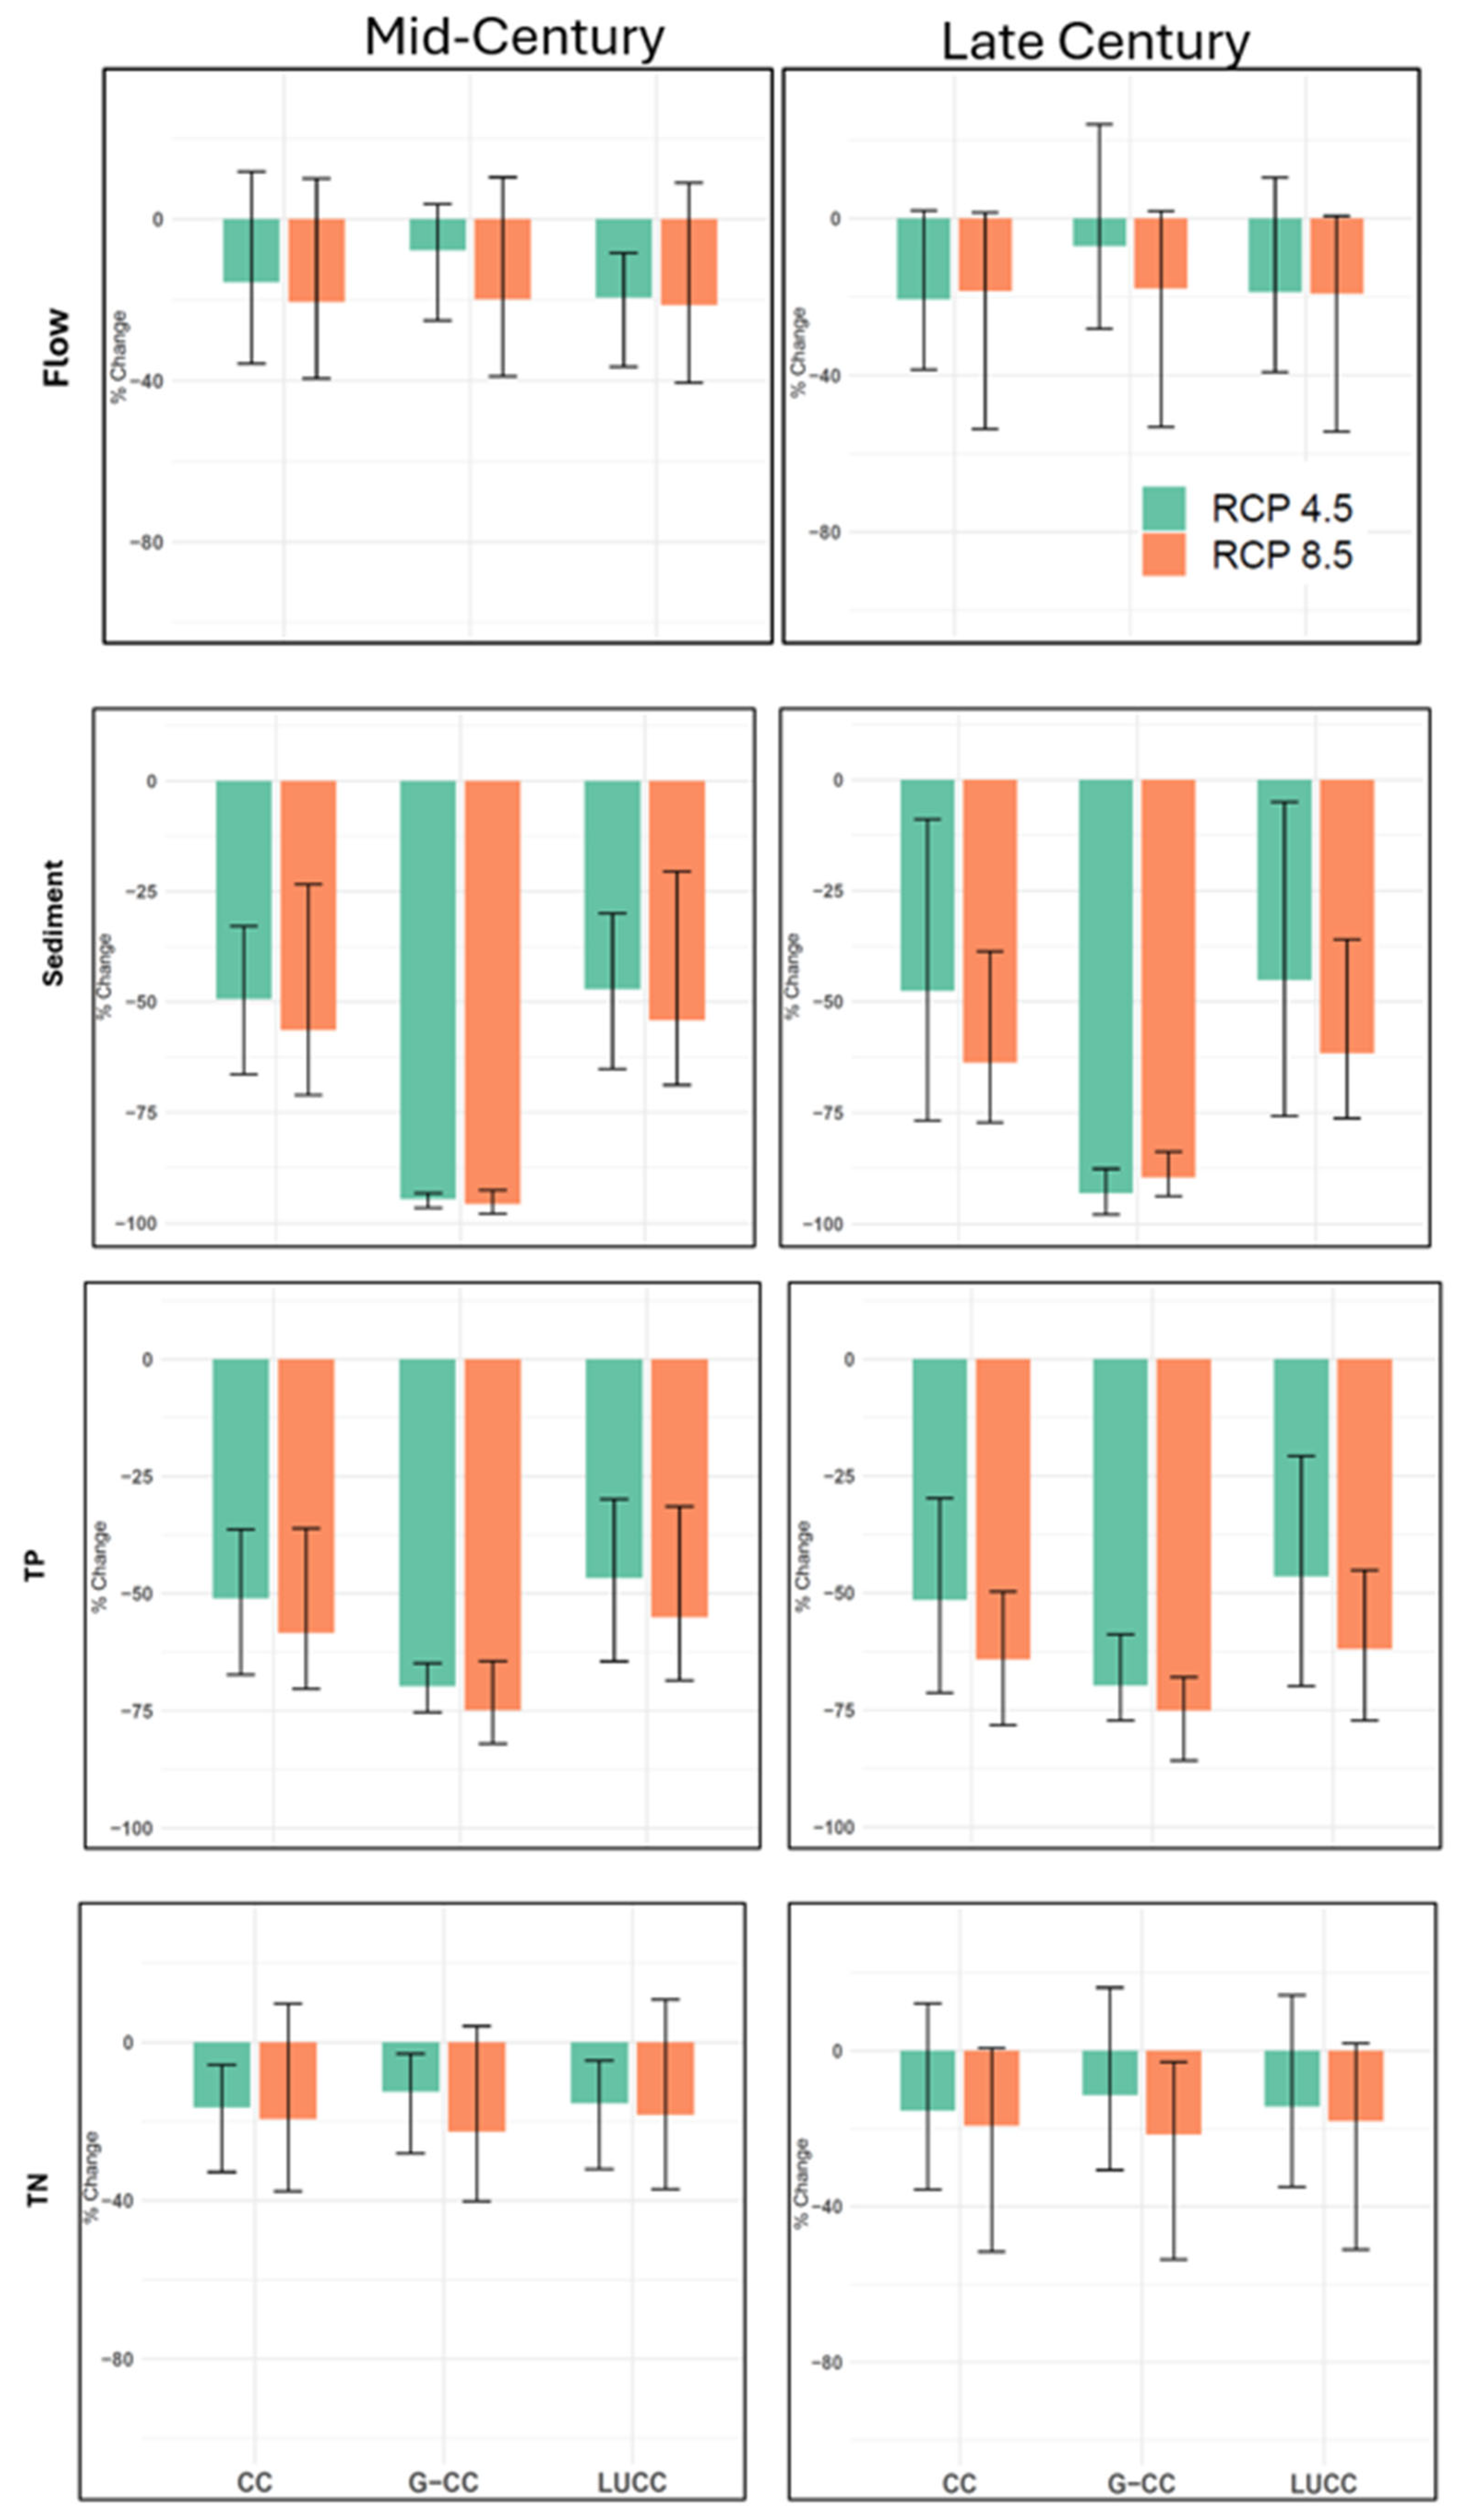
Annual average streamflow and TN loads show consistent patterns across the CC, LUCC, and G-CC scenarios (Figure 11), with similar direction and magnitude of change, indicating that TN loads are closely linked to runoff-driven transport of soluble nitrate. Projected average changes in streamflow and TN load range from 0 to −20% during mid- and late century under both RCPs, with wider variability across GCMs (+20% to −60%). Flow projections under the CC scenario show broader variability (+10% to −50%); particularly under late-century RCP8.5, the reduction in flow is prominent, indicating a drier future under high emissions. The addition of land use change (LUCC) has a limited impact on projected annual flows, underscoring climate change as the dominant driver. However, LUCC slightly amplifies mid-century flow reductions under RCP4.5 (−10% to −20%). In contrast, the G-CC scenario, which converts cropland to grassland, yields smaller streamflow declines (−2.5% to −8%) or even increases (up to +20%) under RCP4.5, likely due to enhanced infiltration and groundwater recharge with grassland. This buffering effect is not evident under RCP8.5, where G-CC projections align with LUCC. The G-CC results showed substantial reductions in sediment (~90%) and TP (~75%) loads across RCPs, driven by lower rainfall and improved ground cover, highlighting the potential of perennial vegetation to mitigate climate-induced water quality degradation.
The LUCC scenario representing cropland expansion under climate change led to modest increases in annual average sediment load (4.37% (RCP8.5) to 4.84% (RCP4.5) in the mid-century; 3.11% (RCP4.5) to 6.07% (RCP8.5) in the late century) compared to the CC scenario, with similar increases observed for TN and TP under both RCPs (Figures S4 and S5). The results suggest that expanded cropland slightly intensifies nutrient and sediment export. However, LUCC had limited influence on streamflow compared to CC, indicating that climate change remains the primary driver of hydrologic alterations in the watershed.
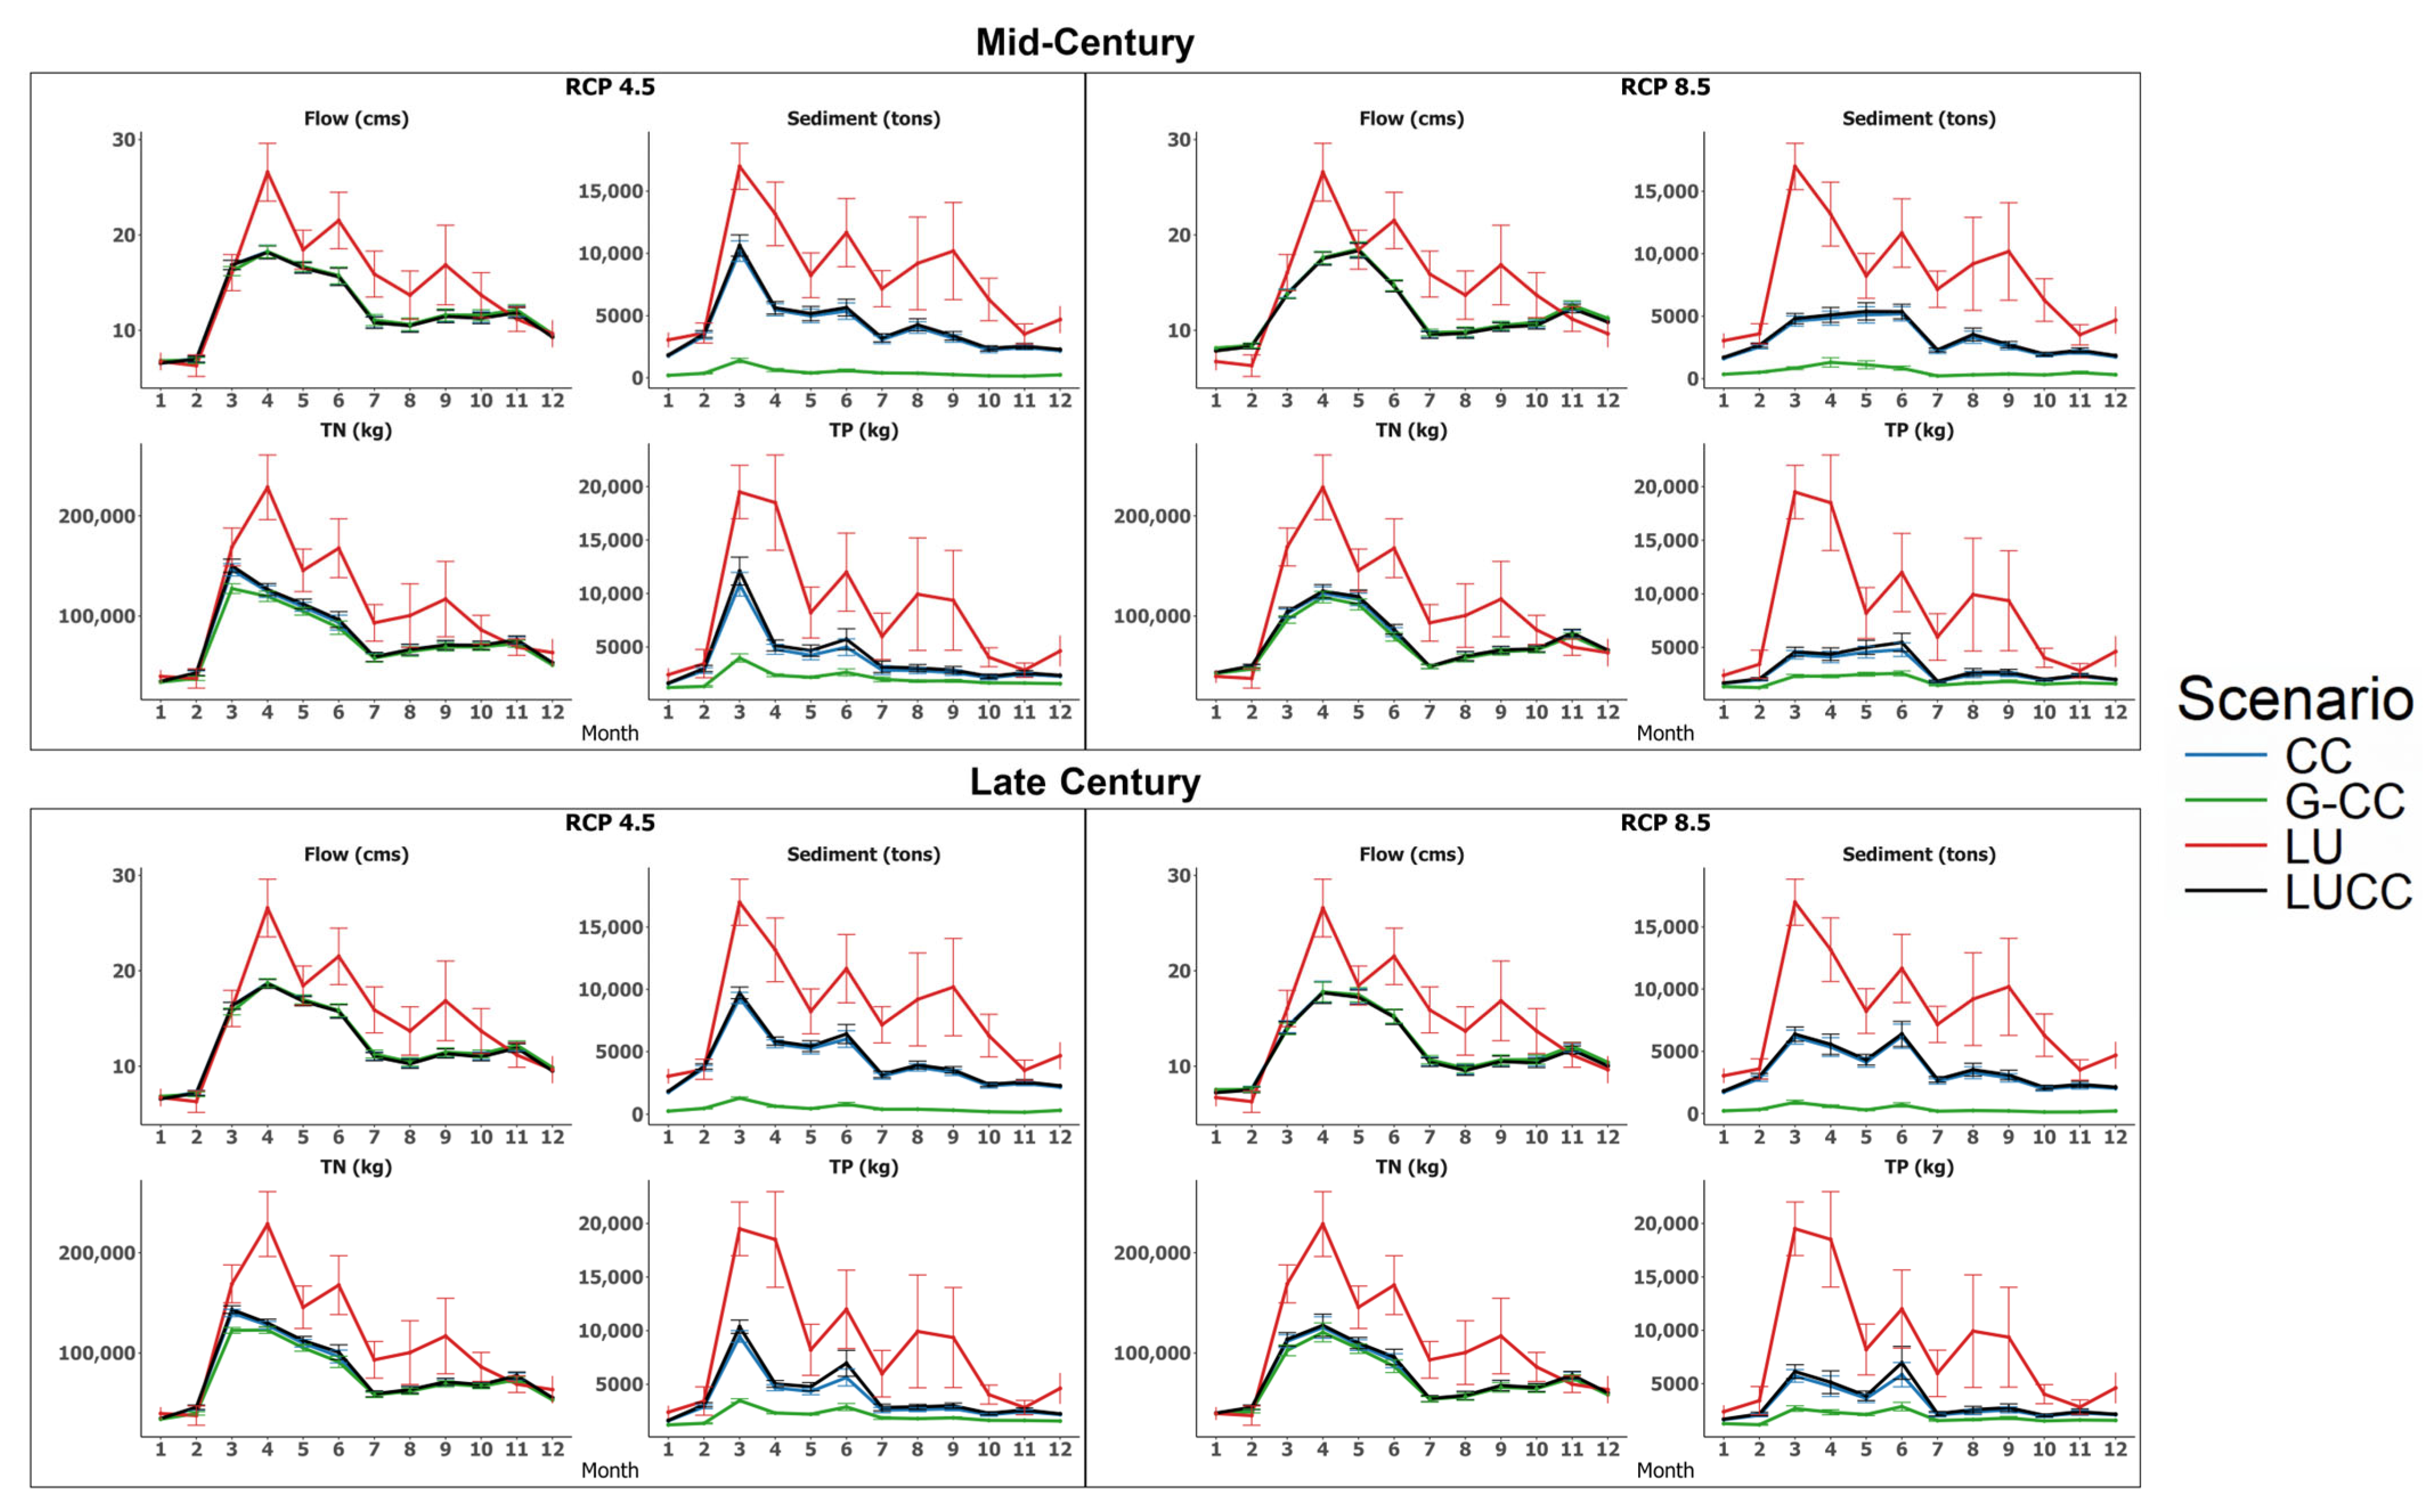
Consistent with the baseline’s monthly trend, the LU scenario shows a similar seasonal flow, sediment, and nutrient pattern. As the baseline rainfall regime is assumed to remain unchanged and despite hay-to-cropland conversion, the monthly trend remains closely aligned with the baseline. Although the LUCC, CC, and G-CC scenarios also follow the LU seasonal flow pattern during the mid-century, substantial reductions in flow are observed during spring and summer (Figure 12). In contrast, late fall flows exceed those under the LU scenario, indicating a shift toward the wetter late fall season (November–December) under both RCP 4.5 and RCP 8.5 across the mid- and late century. For sediment and TP, the G-CC scenario exhibits the lowest and most stable monthly values, suggesting improved stream water quality outcomes under this nature-based management approach. The G-CC scenario shows slight reductions in TN load during spring and summer, while aligning closely with the CC and LUCC scenarios in other seasons. These reductions are attributed to lower fertilizer-derived TN inputs during the growing season.
The ensemble median daily flow, total phosphorus (TP) load, and TP concentration duration curves for mid- and late-century projections show distinct scenario-based trends (Figure 13). Flow regimes remain relatively unchanged across scenarios and RCPs, with the LU scenario closely matching the baseline at 50%, 75%, and 90% exceedance probabilities (Table S7). Median flow (50% exceedance) under LUCC, CC, and G-CC scenarios is projected to decline by 6.35–11.78% in the mid-century and 15.85–21.28% in the late century under RCP 4.5. In contrast, the G-CC scenario shows slightly higher flows than the baseline at high exceedance probabilities. LUCC particularly reduces low flows (90% exceedance) by 10.83% in the mid-century, while late-century low flows increase slightly (+1.74%) due to climate-driven increases projected under the CC (+7.13%) and G-CC (+14.14%) scenarios. TP load and concentration exhibit more pronounced changes than streamflow. The LU scenario maintains patterns similar to the baseline, while both CC and LUCC show reductions in TP load and concentration up to the 75% exceedance probability. In contrast, G-CC consistently reduces TP load by 15–22% and keeps TP concentrations below the 0.075 mg/L threshold approximately 90% of the time. These results underscore the added water quality benefits of grassland conversion under climate change, particularly under moderate emissions.

4. Discussion

Various studies have reported that watersheds across the U.S. increasingly face complex challenges from climate change and land use change [75,76,77,78,79]. Understanding the changes in climate pattern and the risk of extreme events such as floods and droughts that are superimposed on long-term trends is critical for developing robust water management strategies [80,81]. In this context, understanding long-term hydrologic responses and projected climate variability is critical to develop effective strategies to enhance watershed resilience, reduce nutrient pollution, and protect water quality. This study showcases the Kickapoo River watershed, a predominantly rural and agriculture-dominated basin within the Driftless Area of Wisconsin state. The area is known for its steep terrain and vulnerable hydrology, which makes hydrological modeling, climate projections, and land use change analysis key tools to comprehensively assess future changes in streamflow and nutrient loads across the early, mid-, and late century. The framework developed here provides a transferable approach for supporting similar watershed-scale assessments elsewhere.
From the comprehensive analyses above, several insights can be gained. Climate projections for this watershed reveal a consistent warming trend across all scenarios until the mid-twenty-first century, when the outcomes diverge according to emission pathways, mostly RCP8.5 projected to increase in temperature further but RCP4.5 gets stabilized. Seasonal assessments showed that average summer and winter temperatures will rise substantially (by up to ~8.59 °C) in the watershed, especially under the high emission scenario RCP8.5. The results agree with the findings of the Wisconsin Initiative on Climate Change Impacts [75]. The Midwest United States (US) has been one of the major hotspots for climate change impacts as the region has witnessed considerable increases in warmer as well as wetter conditions [82,83,84] leading to droughts, and extreme precipitation events [82,85]. Substantial decrease in projected summer rainfall (−3.41% to −22% for RCP4.5 and −2.72% to −32% for RCP8.5) may severely impact crop production, as many crops in the region are planted in spring and harvested in late summer or early fall and rely primarily on rainfall. Furthermore, the projected increase in late-fall rainfall could intensify leaching and nutrient losses from crop residues after harvest. Yang et al. (2023) [63] projected up to a 40% decline in maize and soybean yields by the late century in the Midwest Corn Belt, primarily due to reduced precipitation and increased heat stress, based on MACA-2 CMIP5 climate projections. Spatial assessment of projected water yield changes suggests that the southeastern region of the watershed is more vulnerable to climate change, with potential water shortages that may affect agricultural operations. Assessing such regional impacts is critical for addressing both agricultural and ecological concerns and for developing effective watershed management plans.
The ensemble median of annual average streamflow is projected to decline by 5–45% relative to the baseline period by the mid- to late century, driven largely by shifts in precipitation timing, magnitude, frequency and accompanied by increased variability across projections. However, projected yearly streamflow does not show any statistically significant long-term trend under either RCP4.5 or RCP8.5, although year-to-year fluctuations remain. Projected monthly flow patterns expected to show a shift from early fall towards late fall led to the increased runoff of pollutants. Since late fall is a period of minimal vegetation cover on agricultural fields, these new peaks can lead to a significant export of sediment, phosphorus, and nitrogen from the land, contributing to water quality issues in streams. Precipitation changes exert a stronger influence on streamflow than land use changes. These findings align with previous studies in the Midwest [17,77,86], which concluded that changes in precipitation have been the dominant driver of altered streamflow patterns in the region. However, the relationship between precipitation and streamflow is inherently nonlinear, reflecting complex interactions among infiltration, runoff generation, and groundwater contributions. In particular, infiltration dynamics are strongly influenced by landscape modifications. In our study area, uncertainty in low-flow projections (Figure 9), primarily driven by variable groundwater discharge poses a challenge to maintain consistent baseflow, particularly during dry periods.
Streamflow projections in this study were evaluated relative to the baseline period (2000–2020), present-day climate condition rather than the historical period. While the ensemble annual average streamflow indicates a declining trend under future climate scenarios, individual GCMs exhibit substantial variability, with some projecting increases and others decreases. This divergence underscores the sensitivity of hydrologic projections to the choice of climate model and the reference period. GCMs remain essential tools for simulating the future climate under varying greenhouse gas emission scenarios [87]; however, rainfall being the primary driver of hydrologic processes is among the least reliably simulated meteorological variables [88,89].
Although climate-driven changes are key factors to future changing watershed dynamics, non-climatic drivers including land use shifts, population growth, economic development, and changing societal water demands introduce significant additional uncertainty [90]. Our study shows that land use change (cropland expansion) might have minimal impact on the stream flow but affect the water quality by increasing sediment (+3.11 to +6.07%), TP load (+5.67 to +10.08%), and TN load (+1.08 to +2.34%). Projected sediment load showed that peaks align with the baseline for both RCPs except late-century RCP8.5. Though the ensemble median shows significant decline, the variability is close to the baseline magnitude for the highest peaks during the spring season. RCP8.5 scenarios show similar but more extreme trends and dampened seasonal peaks, with amplified reductions in annual streamflow and increased variability in runoff and sediment dynamics. At RCP8.5, the impact of CC is much larger than land use change and overwhelm all the impacts.
Particularly, the ongoing conversion of diverse and perennial land uses to intensive monoculture-dominated production can further exacerbate hydrologic responses, including elevated runoff, higher peak flows during storm events, and worse water quality. Land use changes, especially on steep and erodible landscapes like the Driftless Area, can result in a further unbalanced hydrological cycle. These findings underscore the need for integrated watershed management approaches that incorporate multiple interconnected hydrological components and account for both climatic and anthropogenic pressures.
In the Kickapoo River Watershed, prairie and perennial vegetation significantly improved hydrologic resilience under changing climate conditions. Model results indicate that prairie cover improves infiltration and supports low flow conditions (+0.84% to +14%) while reducing high flow extremes (−20% to −30% at 10% exceedance probability) relative to the baseline (Table S7). Prairie restoration as one strategy is especially effective in reducing sediment loads, with projected reductions in ~90% in annual sediment export, and in maintaining total phosphorus (TP) concentrations near or below the TMDL threshold of 0.075 mg/L for most of the time. As the transition from diversified farming to corn and soy cultivation decreases perennial cover, it diminishes the watershed’s overall capacity to retain rainfall and nutrients. Restoring prairie land and other nature-based solutions can mitigate these impacts by enhancing infiltration, stabilizing soil, reducing flooding, and reducing sediment and nutrient losses, thereby improving water quality and promoting long-term watershed resilience.
The findings of our study have significant implications for several of the United Nation’s Sustainable Development Goals (SDGs) [91]. The projected decrease in summer precipitation and its severe impact on crop production, particularly for major regional crops like maize and soybean, demonstrate a connection to SDG 2: Zero Hunger. The insights from this study provide actionable information to develop agricultural strategies that can help ensure food security in the face of climate change. The comprehensive assessment of climate impacts on the watershed, including substantial temperature increases and altered precipitation patterns, is central to the goals of SDG 13: Climate Action, informing adaptation and mitigation efforts exemplified in the Kickapoo River watershed and similar karst regions. Our study highlights the immense benefits of prairie restoration; this study provides a clear framework for advancing key Sustainable Development Goals. The proposed use of nature-based solutions to enhance infiltration and reduce pollutant loads and maintain the TMDL of TP concentration in streams directly addresses the targets of SDG 6 (Clean Water and Sanitation), while simultaneously contributing to SDG 15 (Life on Land) by promoting the restoration of degraded landscapes.

Research Limitations and Recommendations

We analyzed how future climate projections and land use changes will impact streamflow, nutrient loads, and watershed hydrology. We compared these projections to a calibrated baseline model representing current climate conditions, and the selection of this baseline period is critical for understanding the future climate signal. The MACA v2 CMIP5 dataset used in this study has a training period ending in 2005 and therefore excludes extreme rainfall events observed in the Kickapoo watershed after 2012. The absence of such high-magnitude events may limit the representativeness of projected rainfall and, consequently, streamflow extremes in future scenarios. Future work will focus on improving projection reliability by incorporating more recent observed rainfall data, particularly extreme events post-2012.
Present-day streamflow shows significant year-to-year fluctuations, with some years much wetter and others much drier. Our analysis shows that the long-term trend from climate change on annual average flow is not statistically significant for the Kickapoo watershed. However, the variability within the baseline period indicates the possible onset of climate change. The results also show that the choice of climate model strongly influences projections, underscoring the importance of using a multi-model ensemble to provide a more robust and complete picture of potential future climate impacts.
Various studies [92,93,94] have addressed the multiple and cascading uncertainties inherent in simulating future climate change impacts on water resources. These uncertainties arise from different sources such as the following: (1) structural differences among Global Circulation Models (GCMs), (2) the choice of downscaling and bias correction methods, which strongly affect local-scale projections, (3) the selection of the historical reference period used for both downscaling and for comparison with future impacts, and (4) uncertainties related to the hydrological model (SWAT), including its input data and parameterization. Careful selection of the models and methods is critical in such evaluation. Handling all these uncertainties in preparing for climate change impact analysis is still a research challenge since the current approaches and tools are not adequate [95]. The ensemble climate model approach provides a potential range of outcomes which will help decision makers and policymakers to understand and interpret the full spectrum of risk, from best-case to worst-case scenarios, which is essential for robust planning.
To further advance this work, a groundwater module could be incorporated into the SWAT watershed modeling framework to better evaluate the influence of projected precipitation changes on baseflow dynamics. Incorporating groundwater processes into hydrological modeling is particularly important in the karst landscape of the Driftless Area and may provide more effective strategies for water resource management.

5. Conclusions

Ongoing and projected changes in climate and land use increasingly affect the watershed hydrological cycle and ecosystems. It requires comprehensive impact assessments to support effective adaptive management. This study incorporates future rainfall, temperature, and land use projections into a watershed hydrological model to assess water quantity and quality outcomes in the Kickapoo River watershed of Wisconsin’s Driftless Area, a region sensitive to hydrologic change due to steep slopes, erodible soils, and karst features. Climate projections estimate a 2–8.59 °C mean annual temperature rise over the century across RCPs, with a more significant increase in winter months and seasonal precipitation shifts toward wetter springs and drier summers. While projected annual streamflow does not show any significant trend, flow is projected to decline by 10–20% relative to 2000–2020, largely due to a 5–15% decrease in groundwater discharge. Overall, the projected seasonal flow pattern is retained but declines across most months, despite increased winter flows. Spatial assessment indicates that the southeastern watershed region is more vulnerable to climate change, with potential water shortages impacting agriculture, highlighting the need for region-specific management strategies addressing both agricultural and ecological concerns. The conversion of prairies to cropland with climate projections is expected to increase annual average sediment, TP, and TN loads by approximately 3.11–6.07%, 5.67–10.08%, and 1.08–2.34%, respectively, raising TP concentrations above the 0.075 mg/L TMDL threshold during high-flow events in comparison to the climate change scenario. Conversely, converting ~290 km2 of cropland to grassland could reduce sediment by 80–90%, TP by 30–45%, and TN by 3–5%, maintaining TMDL targets 90% of the time. Further adaptive management with different nature-based solutions and other approaches should be explored to achieve nutrient reduction and hydrologic resilience and reduce the upcoming impacts in the watershed. Adaptive strategies must also consider the potential for irreversible system changes, particularly under intensifying land use and climate stressors, and take measures to reduce the significant impacts of hydrological changes. A holistic, adaptive framework will be critical for sustaining water resources and ecosystem resilience in the watersheds like Kickapoo and similar unglaciated basins. The findings of our study provide crucial insights for policymakers and resource managers seeking to balance ecological protection, agricultural productivity, nature-based solutions, and community resilience under intensifying climate pressures, thereby supporting key Sustainable Development Goals related to Zero Hunger (SDG 2), Clean Water and Sanitation (SDG 6), Life on Land (SDG 15), and Climate Action (SDG 13).

Supplementary Materials

The following supporting information can be downloaded at https://www.mdpi.com/article/10.3390/land14091919/s1, Table S1. GCMs used for climate scenarios in the study; Table S2: Seasonal temperature Changes (0C) under RCP 4.5 and RCP 8.5 from baseline across Early, Mid, and Late Century; Table S3: Mean annual precipitation (mm) for the baseline period (2000–2020) and future periods: early century (2024–2049), mid-century (2050–2074), and late century (2075–2099). Values in parentheses indicate standard deviations, representing interannual variability. GCMs projecting higher average annual precipitation than the baseline are shown in bold; Table S4. Frequency of high rainfall events for Historical (1982–1999) and Baseline (2000–2020) Periods, and RCP4.5/RCP8.5 Projections Across GCMs: (a) Days with ≥2 Inch Rainfall and (b) Days with ≥1 Inch Rainfall for Early (2024–2049), Mid (2050–2074), and Late Century (2075–2099). The bold values represent the values higher than baseline; Table S5: Seasonal Rainfall Changes (%) under RCP 4.5 and RCP 8.5 from baseline across Early, Mid, and Late Century; Table S6: Average annual projected percent changes in water balance components (ET, percolation, water yield, and precipitation) for mid- and late-century in the Kickapoo watershed, compared to the baseline, across GCMs under RCP 4.5 and RCP 8.5 scenarios; Table S7: Projected changes in daily flow duration, TP load duration, and TP concentration at 50%, 75%, and 90% exceedance probabilities; for TP concentration, 10% exceedance probability is also included. Note: LU* shares the same climate as the baseline, hence mid- and late-century results are identical. The percentage changes from baseline are presented in Parentheses; Figure S1: Average annual projected changes in the ensemble mean of ET, percolation, and water yield for mid- and late-century under RCP 4.5 scenarios in the Kickapoo River watershed, relative to the baseline; Figure S2: Average annual projected changes in the ensemble mean of ET, percolation, and water yield for mid- and late-century under RCP 8.5 scenarios in the Kickapoo River watershed, relative to the baseline; Figure S3: Projected monthly sediment (a), TP (b) and TN(c) load at Steuben compared to the baseline. The blue line represents the ensemble median, the shaded band indicates the prediction range across GCMs, and the red line represents the monthly trend for baseline; Figure S4: Box plots are the annual average flow, sediment, and nutrient loads across GCMs for the mid- and late-century periods under the CC (grey), LUCC (no-color), and G-CC (green) scenarios at Steuben (RCP 4.5). The median values are highlighted in red color; Figure S5: Box plots are the annual average flow, sediment, and nutrient loads across GCMs for the mid- and late-century periods under the CC (grey), LUCC, and G-CC scenarios at Steuben (RCP 8.5). The median values are highlighted in red color.

Author Contributions

Conceptualization, methodology, data curation, analysis, writing, editing, visualization: S.R. Editing, Writing: S.A., T.M.B. Data analysis and Visualization: S.M. Funding Acquisition:, R.S. All authors have read and agreed to the published version of the manuscript.

Funding

This research was supported by the U.S. Environmental Protection Agency (U.S. EPA) Office of Research and Development’s Center for Environmental Solutions and Emergency Response. The work was funded by U.S. EPA contracts 68HERC20D0029.

Data Availability Statement

Data supporting the results of this research are available upon request, by contacting the authors.

Acknowledgments

We acknowledge and thank Cissy Ma who provided insightful discussion, editing, comments, suggestions, review, and overall research support along with funding.

Conflicts of Interest

The authors declare no conflicts of interest. Author Sam Arden was employed by the Eastern Research Group Inc. The author declare that they have no known competing financial interests or personal relationships that could have appeared to influence the work reported in this paper.

Appendix A

Figure A1. Number of rainy days across periods: (a) days with ≥1 inch rainfall and (b) days with ≥2 inch rainfall for historical (1982–1999), baseline (2000–2020), and RCP4.5/RCP8.5 projections (early, mid-, late century). The vertical bars represent the min and max range of the no. of days.
Land 14 01919 g0a1
Figure A2. Cropland cover 2003 vs. 2020 based on NASS CDL data layers.
Land 14 01919 g0a2
Figure A3. Observed and simulated hydrographs for gauging station La Farge and Steuben (refer to Figure C3, of Appendix C of Arden et al., 2025 [45]).
Land 14 01919 g0a3
Figure A4. The annual average temperature (°C) in the Kickapoo watershed from 1982 to 2100. PRISM data (blue line) covers the period 1982–2020, while projections for RCP4.5 (orange line) and RCP8.5 (green line) span 2006–2099.
Land 14 01919 g0a4
Figure A5. Time series of annual rainfall from 1982 to 2099. The historical data (1982–1999) is in orange, and the baseline period (2000–2020) in the blue line are PRISM data, and future projections (2006–2099) under RCP 4.5 and RCP 8.5 scenarios. Shaded bands represent the range across GCMs, and solid lines indicate ensemble (Ens.) means.
Land 14 01919 g0a5

References

  1. Villarini, G.; Smith, J.A.; Baeck, M.L.; Krajewski, W.F. Examining Flood Frequency Distributions in the Midwest U.S. JAWRA J. Am. Water Resour. Assoc. 2011, 47, 447–463. [Google Scholar] [CrossRef]
  2. Serpa, D.; Nunes, J.P.; Santos, J.; Sampaio, E.; Jacinto, R.; Veiga, S.; Lima, J.C.; Moreira, M.; Corte-Real, J.; Keizer, J.J.; et al. Impacts of climate and land use changes on the hydrological and erosion processes of two contrasting Mediterranean catchments. Sci. Total Environ. 2015, 538, 64–77. [Google Scholar] [CrossRef] [PubMed]
  3. Kaushal, S.S.; Gold, A.J.; Mayer, P.M. Land Use, Climate, and Water Resources—Global Stages of Interaction. Water 2017, 9, 815. [Google Scholar] [CrossRef]
  4. Roy, P.S.; Ramachandran, R.M.; Paul, O.; Thakur, P.K.; Ravan, S.; Behera, M.D.; Sarangi, C.; Kanawade, V.P. Anthropogenic Land Use and Land Cover Changes—A Review on Its Environmental Consequences and Climate Change. J. Indian Soc. Remote Sens. 2022, 50, 1615–1640. [Google Scholar] [CrossRef]
  5. Perring, M.P.; De Frenne, P.; Baeten, L.; Maes, S.L.; Depauw, L.; Blondeel, H.; Carón, M.M.; Verheyen, K. Global environmental change effects on ecosystems: The importance of land-use legacies. Glob. Change Biol. 2016, 22, 1361–1371. [Google Scholar] [CrossRef]
  6. Small, D.; Islam, S.; Vogel, R.M. Trends in precipitation and streamflow in the eastern U.S.: Paradox or perception? Geophys. Res. Lett. 2006, 33, L03403. [Google Scholar] [CrossRef]
  7. Ficklin, D.L.; Stewart, I.T.; Maurer, E.P. Effects of projected climate change on the hydrology in the Mono Lake Basin, California. Clim. Change 2013, 116, 111–131. [Google Scholar] [CrossRef]
  8. Zhang, X.; Wang, J.; Zwiers, F.W.; Groisman, P.Y. The Influence of Large-Scale Climate Variability on Winter Maximum Daily Precipitation over North America. J. Clim. 2010, 23, 2902–2915. [Google Scholar] [CrossRef]
  9. Baker, T.J.; Miller, S.N. Using the Soil and Water Assessment Tool (SWAT) to assess land use impact on water resources in an East African watershed. J. Hydrol. 2013, 486, 100–111. [Google Scholar] [CrossRef]
  10. Deng, X.; Shi, Q.; Zhang, Q.; Shi, C.; Yin, F. Impacts of land use and land cover changes on surface energy and water balance in the Heihe River Basin of China, 2000–2010. Phys. Chem. Earth Parts A/B/C 2015, 79-82, 2–10. [Google Scholar] [CrossRef]
  11. Fang, X.; Ren, L.; Li, Q.; Zhu, Q.; Shi, P.; Zhu, Y. Hydrologic Response to Land Use and Land Cover Changes within the Context of Catchment-Scale Spatial Information. J. Hydrol. Eng. 2013, 18, 1539–1548. [Google Scholar] [CrossRef]
  12. Li, Z.; Liu, W.-Z.; Zhang, X.-C.; Zheng, F.-L. Impacts of land use change and climate variability on hydrology in an agricultural catchment on the Loess Plateau of China. J. Hydrol. 2009, 377, 35–42. [Google Scholar] [CrossRef]
  13. Memarian, H.; Balasundram, S.K.; Abbaspour, K.C.; Talib, J.B.; Boon Sung, C.T.; Sood, A.M. SWAT-based hydrological modelling of tropical land-use scenarios. Hydrol. Sci. J. 2014, 59, 1808–1829. [Google Scholar] [CrossRef]
  14. Raymond, C.M.; Spoehr, J. The acceptability of climate change in agricultural communities: Comparing responses across variability and change. J. Environ. Manag. 2013, 115, 69–77. [Google Scholar] [CrossRef]
  15. Cabrera-Balarezo, J.J.; Sucozhañay-Calle, A.E.; Crespo-Sánchez, P.J.; Timbe-Castro, L.M. Applying hydrological modeling to unravel the effects of land use change on the runoff of a paramo ecosystem. DYNA 2022, 89, 68–77. [Google Scholar] [CrossRef]
  16. Schilling, K.E.; Libra, R.D. Increased baseflow in iowa over the second half of the 20th century. JAWRA J. Am. Water Resour. Assoc. 2003, 39, 851–860. [Google Scholar] [CrossRef]
  17. Tomer, M.D.; Schilling, K.E. A simple approach to distinguish land-use and climate-change effects on watershed hydrology. J. Hydrol. 2009, 376, 24–33. [Google Scholar] [CrossRef]
  18. Gillon, S.; Booth, E.G.; Rissman, A.R. Shifting drivers and static baselines in environmental governance: Challenges for improving and proving water quality outcomes. Reg. Environ. Change 2016, 16, 759–775. [Google Scholar] [CrossRef]
  19. Schilling, K.E. Relation of baseflow to row crop intensity in Iowa. Agric. Ecosyst. Environ. 2005, 105, 433–438. [Google Scholar] [CrossRef]
  20. Zhang, Y.K.; Schilling, K.E. Increasing streamflow and baseflow in Mississippi River since the 1940s: Effect of land use change. J. Hydrol. 2006, 324, 412–422. [Google Scholar] [CrossRef]
  21. Groisman, P.Y.; Knight, R.W.; Karl, T.R. Changes in Intense Precipitation over the Central United States. J. Hydrometeorol. 2012, 13, 47–66. [Google Scholar] [CrossRef]
  22. Novotny, E.V.; Stefan, H.G. Stream flow in Minnesota: Indicator of climate change. J. Hydrol. 2007, 334, 319–333. [Google Scholar] [CrossRef]
  23. Villarini, G.; Scoccimarro, E.; White, K.D.; Arnold, J.R.; Schilling, K.E.; Ghosh, J. Projected Changes in Discharge in an Agricultural Watershed in Iowa. JAWRA J. Am. Water Resour. Assoc. 2015, 51, 1361–1371. [Google Scholar] [CrossRef]
  24. Jha, M.; Arnold, J.G.; Gassman, P.W.; Giorgi, F.; Gu, R.R. Climate chhange sensitivity assessment on upper mississippi river basin streamflows using swat. JAWRA J. Am. Water Resour. Assoc. 2006, 42, 997–1015. [Google Scholar] [CrossRef]
  25. Mauldin, L. Official Recognized Boundary of Driftless Area Restoration Effort, 2013; D.A.R.E. United States Geological Survey, National Fish Habitat Partnership, Eds.; National Fish Habitat Partnership Science and Data Committee. 2013. Available online: https://www.sciencebase.gov/catalog/item/52274d4ce4b01904cf5a81e0 (accessed on 20 April 2023).
  26. Knox, J.C. Geology of the Driftless Area. In The Physical Geography and Geology of the Driftless Area: The Career and Contributions of James C. Knox; Carson, E.C., Rawling, J.E., III, Daniels, J.M., Attig, J.W., Eds.; Geological Society of America: Washington, DC, USA, 2019. [Google Scholar]
  27. Gebert, W.A.; Krug, W.R. Streamflow trends in Wisconsin’s driftless area. JAWRA J. Am. Water Resour. Assoc. 1996, 32, 733–744. [Google Scholar] [CrossRef]
  28. Juckem, P.F.; Hunt, R.J.; Anderson, M.P.; Robertson, D.M. Effects of climate and land management change on streamflow in the driftless area of Wisconsin. J. Hydrol. 2008, 355, 123–130. [Google Scholar] [CrossRef]
  29. Knox, J.C. Agricultural influence on landscape sensitivity in the Upper Mississippi River Valley. CATENA 2001, 42, 193–224. [Google Scholar] [CrossRef]
  30. Leopold, L. Analysis of the Driftless Area. In Regional and Property Analysis for the Development of a Master Plan for Department of Natural Resources’ Properties Along Trout and Smallmouth Bass Streams in the Driftless Area; Wisconsin Department of Natural Resources: Madison, WI, USA, 2013. [Google Scholar]
  31. Bendorf, J.; Hubbard, S.; Kucharik, C.J.; VanLoocke, A. Rapid changes in agricultural land use and hydrology in the Driftless Region. Agrosystems Geosci. Environ. 2021, 4, e20214. [Google Scholar] [CrossRef]
  32. Morton, L.W.; Hobbs, J.; Arbuckle, J.G.; Loy, A. Upper Midwest Climate Variations: Farmer Responses to Excess Water Risks. J. Environ. Qual. 2015, 44, 810–822. [Google Scholar] [CrossRef]
  33. Schilling, K.E.; Jha, M.K.; Zhang, Y.-K.; Gassman, P.W.; Wolter, C.F. Impact of land use and land cover change on the water balance of a large agricultural watershed: Historical effects and future directions. Water Resour. Res. 2008, 44, W00A09. [Google Scholar] [CrossRef]
  34. Haines, A.; Markham, L.; McFarlane, D.; Olson, E.; Roberts, R.; Stoll, L. Wisconsin Land Use Megatrends: Agriculture; University of Wisconsin Extension: Madison, WI, USA, 2010. [Google Scholar]
  35. Jodar-Abellan, A.; Ruiz, M.; Melgarejo, J. Climate change impact assessment on a hydrologic basin under natural regime (SE, Spain) using a SWAT model. Rev. Mex. De Cienc. Geológicas 2018, 35, 240–253. [Google Scholar] [CrossRef]
  36. Valdes-Abellan, J.; Pardo, M.A.; Jodar-Abellan, A.; Pla, C.; Fernandez-Mejuto, M. Climate change impact on karstic aquifer hydrodynamics in southern Europe semi-arid region using the KAGIS model. Sci. Total Environ. 2020, 723, 138110. [Google Scholar] [CrossRef]
  37. Kucharik, C.J.; Serbin, S.P.; Vavrus, S.; Hopkins, E.J.; Motew, M.M. Patterns of Climate Change Across Wisconsin From 1950 to 2006. Phys. Geogr. 2010, 31, 1–28. [Google Scholar] [CrossRef]
  38. Dauwalter, D.C.; Mitro, M.G. Climate Change, Recent Floods, and an Uncertain Future. In Proceedings of the 11th Annual Driftless Area Symposium, La Crosse, WI, USA, 5–6 February 2019; Trout Unlimited: Denver, CO, USA, 2019. 8p. [Google Scholar]
  39. Serbin, S.P.; Kucharik, C.J. Spatiotemporal Mapping of Temperature and Precipitation for the Development of a Multidecadal Climatic Dataset for Wisconsin. J. Appl. Meteorol. Climatol. 2009, 48, 742–757. [Google Scholar] [CrossRef]
  40. Lathrop, R. Perspectives on the eutrophication of the Yahara lakes. Lake Reserv. Manag. 2007, 23, 345–365. [Google Scholar] [CrossRef]
  41. Levin, S.B. Peak Streamflow Trends in Wisconsin and Their Relation to Changes in Climate, Water Years 1921–2020. In Peak Streamflow Trends and Their Relation to Changes in Climate in Illinois, Iowa, Michigan, Minnesota, Missouri, Montana, North Dakota, South Dakota, and Wisconsin: U.S. Geological Survey Scientific Investigations Report; U.S. Geological Survey: Reston, VA, USA, 2024; 49p. [Google Scholar] [CrossRef]
  42. Grewal, R.; Herlihey, C.; Parr, J.; Rosner, R.; Sodeman, R.; Wandsnider, K. Flood Resilience in the Coon Creek Watershed-2020 Water Resources Management Practicum Report; Nelson Institute for Environmental Studies, University of Wisconsin–Madison: Madison, WI, USA, 2022. [Google Scholar]
  43. United States Environmental Protection Agency. Updating the Environmental Protection Agency’s (EPA) Water Quality Trading Policy to Promote Market-Based Mechanisms for Improving Water Quality; US EPA, Ed.; United States Environmental Protection Agency: Washington, DC, USA, 2019. Available online: https://www.epa.gov/sites/default/files/2020-10/documents/trading-policy-memo-2019.pdf (accessed on 20 June 2024).
  44. Wisconsin Department of Natural Resources. Water Quality Standards for Wisconsin Surface Waters. In s. 35.93; Wisconsin Legislative Reference Bureau, Ed.; The State of Wisconsin: Wis. Stats.: Madison, WI, USA, 2022. [Google Scholar]
  45. Arden, S.; Morelli, B.; Miller, J.; Rath, S.; Ferrando, J.; Azevedo, G.; Nepal, S.; Demeke, B.; Ma, X. Environmental impacts and cost of a water quality trading approach for NPDES nutrient permit compliance in a rural watershed. Water Res. X 2025, 28, 100363. [Google Scholar] [CrossRef]
  46. Arnold, J.G.; Srinivasan, R.; Muttiah, R.S.; Williams, J.R. Large area hydrologic modeling and assessment part i: Model development. JAWRA J. Am. Water Resour. Assoc. 1998, 34, 73–89. [Google Scholar] [CrossRef]
  47. Neitsch, S.L.; Arnold, J.G.; Kiniry, J.R.; Williams, J.R. Soil and Water Assessment Tool Theoretical Documentation, Version 2005; USDA Agricultural Research Service and Texas A&M Blackland Research Center: Temple, TX, USA, 2005. [Google Scholar]
  48. Neitsch, S.L.; Arnold, J.G.; Kiniry, J.R.; Williams, J.R. Soil and Water Assessment Tool Theoretical Documentation, Version 2009; USDA Agricultural Research Service and Texas A&M Blackland Research Center: Temple, TX, USA, 2009. [Google Scholar]
  49. Johnson, T.; Butcher, J.; Deb, D.; Faizullabhoy, M.; Hummel, P.; Kittle, J.; McGinnis, S.; Mearns, L.O.; Nover, D.; Parker, A.; et al. Modeling Streamflow and Water Quality Sensitivity to Climate Change and Urban Development in 20 U.S. Watersheds. JAWRA J. Am. Water Resour. Assoc. 2015, 51, 1321–1341. [Google Scholar] [CrossRef] [PubMed]
  50. Karlsson, I.B.; Sonnenborg, T.O.; Refsgaard, J.C.; Trolle, D.; Børgesen, C.D.; Olesen, J.E.; Jeppesen, E.; Jensen, K.H. Combined effects of climate models, hydrological model structures and land use scenarios on hydrological impacts of climate change. J. Hydrol. 2016, 535, 301–317. [Google Scholar] [CrossRef]
  51. Gaffield, S.J.; Bradbury, K.R.; Potter, K.W. Hydrologic Assessment of the Kickapoo Watershed, Southwestern Wisconsin; Wisconsin Geological and Natural History Survey and Department of Geological Engineering, University of Wisconsin-Madison: Madison, MI, USA, 1998. [Google Scholar]
  52. Trimble, S.W.; Lund, S.W. Soil Conservation and the Reduction of Erosion and Sedimentation in the Coon Creek Basin, Wisconsin; Professional Paper 1234; USGS Publications Warehouse: Virgina, VA, USA, 1982; p. 35. [Google Scholar]
  53. Frolking, T.A. The genesis and distribution of upland red clays in Wisconsin’s driftless area. In Quaternary History of the Driftless Area, Proceedings of the 29th Annual Meeting Midwest Friends of the Pleistocene; Ostrom, M.E., Ed.; University of Wisconsin-Extension: Prairie du Chien, WI, USA, 1982. [Google Scholar]
  54. Knox, J.C. Valley Alluviation in Southwestern Wisconsin. Ann. Assoc. Am. Geogr. 1972, 62, 401–410. [Google Scholar] [CrossRef]
  55. Evans, T.J. Geology of La Crosse County, Wisconsin. Wisconsin Geological and Natural History Survey Bulletin 101; Wisconsin Geological and Natural History Survey: Madison, WI, USA, 2003. [Google Scholar]
  56. Booth, E.G.; Zipper, S.C.; Loheide, S.P.; Kucharik, C.J. Is groundwater recharge always serving us well? Water supply provisioning, crop production, and flood attenuation in conflict in Wisconsin, USA. Ecosyst. Serv. 2016, 21, 153–165. [Google Scholar] [CrossRef]
  57. United States Department of Agriculture (USDA); National Agricultural Statistics Service (NASS). USDA NASS Cropland Data Layer; USDA, NASS Marketing and Information Services Office: Washington, DC, USA, 2016. [Google Scholar]
  58. Daly, C.; Halbleib, M.; Smith, J.I.; Gibson, W.P.; Doggett, M.K.; Taylor, G.H.; Curtis, J.; Pasteris, P.P. Physiographically sensitive mapping of climatological temperature and precipitation across the conterminous United States. Int. J. Climatol. 2008, 28, 2031–2064. [Google Scholar] [CrossRef]
  59. Stern, M.A.; Flint, L.E.; Flint, A.L.; Boynton, R.M.; Stewart, J.A.E.; Wright, J.W.; Thorne, J.H. Selecting the Optimal Fine-Scale Historical Climate Data for Assessing Current and Future Hydrological Conditions. J. Hydrometeorol. 2022, 23, 293–308. [Google Scholar] [CrossRef]
  60. Abatzoglou, J.T. Development of gridded surface meteorological data for ecological applications and modelling. Int. J. Climatol. 2013, 33, 121–131. [Google Scholar] [CrossRef]
  61. Abatzoglou, J.T.; Brown, T.J. A comparison of statistical downscaling methods suited for wildfire applications. Int. J. Climatol. 2012, 32, 772–780. [Google Scholar] [CrossRef]
  62. Joyce, L.A.; Abatzoglou, J.T.; Coulson, D.P. Climate Data for RPA 2020 Assessment: MACAv2 (METDATA) Historical Modeled (1950–2005) and Future (2006–2099) Projections for the Conterminous United States at the 1/24 Degree Grid Scale; Forest Service Research Data Archive: Fort Collins, CO, USA, 2018. [Google Scholar]
  63. Yang, M.; Wang, G. Heat stress to jeopardize crop production in the US Corn Belt based on downscaled CMIP5 projections. Agric. Syst. 2023, 211, 103746. [Google Scholar] [CrossRef]
  64. Intergovernmental Panel on Climate Change (IPCC). Long-Term Climate Change: Projections, Commitments and Irreversibility Pages 1029 to 1076. In Climate Change 2013—The Physical Science Basis: Working Group I Contribution to the Fifth Assessment Report of the Intergovernmental Panel on Climate Change; Intergovernmental Panel on Climate Change, Ed.; Cambridge University Press: Cambridge, UK, 2014; pp. 1029–1136. [Google Scholar]
  65. Dale, A.; Fant, C.; Strzepek, K.; Lickley, M.; Solomon, S. Climate model uncertainty in impact assessments for agriculture: A multi-ensemble case study on maize in sub-Saharan Africa. Earth’s Future 2017, 5, 337–353. [Google Scholar] [CrossRef]
  66. Gharbia, S.S.; Gill, L.; Johnston, P.; Pilla, F. Multi-GCM ensembles performance for climate projection on a GIS platform. Model. Earth Syst. Environ. 2016, 2, 102. [Google Scholar] [CrossRef]
  67. McSweeney, C.F.; Jones, R.G. How representative is the spread of climate projections from the 5 CMIP5 GCMs used in ISI-MIP? Clim. Serv. 2016, 1, 24–29. [Google Scholar] [CrossRef]
  68. Srinivasan, R. HAWQS User Guide Version 1.1; Office of Water, US Environmental Protection Agency: Washington, DC, USA, 2019. [Google Scholar]
  69. NRCS WI Agronomy. Wisconsin Agronomy Technical Note 7-Cover and Green Manure Crops Benefits to Soil Quality; N.R.C.S. (NRCS), Ed.; Natural Resources Conservation Service (NRCS); United States Department of Agriculture (USDA): Washington, DC, USA, 2015. [Google Scholar]
  70. Abbaspour, K.C. SWAT-CUP: SWAT Calibration and Uncertainty Programs; Eawag: Swiss Federal Institute of Aquatic Science and Technology: Dübendorf, Switzerland, 2015. [Google Scholar]
  71. Runkel, R.L.; Crawford, C.G.; Cohn, T.A. Load Estimator (LOADEST): A Fortran Program for Estimating Constituent Loads in Streams and Rivers; United States Geological Survey: Reston, VA, USA, 2004. [Google Scholar]
  72. Wang, G.; Kirchhoff, C.J.; Seth, A.; Abatzoglou, J.T.; Livneh, B.; Pierce, D.W.; Fomenko, L.; Ding, T. Projected Changes of Precipitation Characteristics Depend on Downscaling Method and Training Data: MACA versus LOCA Using the U.S. Northeast as an Example. J. Hydrometeorol. 2020, 21, 2739–2758. [Google Scholar] [CrossRef]
  73. Corona, J. HAWQS 2.0: Hydrologic and Water Quality System Version 2 Technical Documentation; U.S. Environmental Protection Agency: Washington, DC, USA, 2023. [Google Scholar]
  74. U.S. Department of Agriculture, National Agricultural Statistics Service. Cropland Data Layer (Version 2003, 2020) [Data Set]. USDA NASS. 2003. Available online: https://www.nass.usda.gov/Research_and_Science/Cropland/Release/index.php (accessed on 20 April 2024).
  75. Nelson Institute for Environmental Studies. Wisconsin’s changing climate: Impacts and solutions for a warmer climate. In Wisconsin Initiative on Climate Change Impacts; University of Wisconsin-Madison and the Wisconsin Department of Natural Resources: Madison, WI, USA, 2021. [Google Scholar]
  76. Mishra, V.; Cherkauer, K.A.; Niyogi, D.; Lei, M.; Pijanowski, B.C.; Ray, D.K.; Bowling, L.C.; Yang, G. A regional scale assessment of land use/land cover and climatic changes on water and energy cycle in the upper Midwest United States. Int. J. Climatol. 2010, 30, 2025–2044. [Google Scholar] [CrossRef]
  77. Gupta, S.C.; Kessler, A.C.; Brown, M.K.; Zvomuya, F. Climate and agricultural land use change impacts on streamflow in the upper midwestern United States. Water Resour. Res. 2015, 51, 5301–5317. [Google Scholar] [CrossRef]
  78. Doubleday, A.; Errett, N.A.; Ebi, K.L.; Hess, J.J. Indicators to Guide and Monitor Climate Change Adaptation in the US Pacific Northwest. Am. J. Public Health 2020, 110, 180–188. [Google Scholar] [CrossRef]
  79. U.S. Environmental Protection Agency. Climate Change Indicators in the United States Fifth Edition; U.S. Environmental Protection Agency: Washington, DC, USA, 2024. [Google Scholar]
  80. Ciampittiello, M.; Marchetto, A.; Boggero, A. Water Resources Management under Climate Change: A Review. Sustainability 2024, 16, 3590. [Google Scholar] [CrossRef]
  81. Rahaman, M.H.; Masroor, M.; Rehman, S.; Singh, R.; Ahmed, R.; Sahana, M.; Sajjad, H. State of Art of Review on Climate Variability and Water Resources: Bridging Knowledge Gaps and the Way Forward. Water Resour. 2022, 49, 699–710. [Google Scholar] [CrossRef]
  82. Huang, H.; Winter, J.M.; Osterberg, E.C.; Horton, R.M.; Beckage, B. Total and Extreme Precipitation Changes over the Northeastern United States. J. Hydrometeorol. 2017, 18, 1783–1798. [Google Scholar] [CrossRef]
  83. Kunkel, K.E.; Stevens, L.E.; Stevens, S.E.; Sun, L.; Janssen, E.; Wuebbles, D.J.; Hilberg, S.D.; Timlin, M.S.; Stoecker, L.A.; Westcott, N.E.; et al. Regional Climate Trends and Scenarios for the U.S. National Climate Assessment Part 3: Climate of the Midwest U.S.; NOAA: Silver Spring, MD, USA, 2013. [Google Scholar]
  84. Qian, B.; Gameda, S.; Zhang, X.; De Jong, R. Changing growing season observed in Canada. Clim. Change 2012, 112, 339–353. [Google Scholar] [CrossRef]
  85. Horton, R.; Yohe, G.; Easterling, W.; Kates, R.; Ruth, M.; Sussman, E.; Whelchel, A.; Wolfe, D.; Lipschultz, F. Ch. 16: Northeast. Climate Change Impacts in the United States: The Third National Climate Assessment. In Global Change Research Program; Melillo, J.M., Richmond, T.T.C., Yohe, G.W., Eds.; U.S. Global Change Research Program: Washington, DC, USA, 2014; pp. 371–395. [Google Scholar]
  86. Ryberg, K.R.; Lin, W.; Vecchia, A.V. Impact of Climate Variability on Runoff in the North-Central United States. J. Hydrol. Eng. 2014, 19, 148–158. [Google Scholar] [CrossRef]
  87. Taylor, K.E.; Stouffer, R.J.; Meehl, G.A. An Overview of CMIP5 and the Experiment Design. Bull. Am. Meteorol. Soc. 2012, 93, 485–498. [Google Scholar] [CrossRef]
  88. Langousis, A.; Mamalakis, A.; Deidda, R.; Marrocu, M. Assessing the relative effectiveness of statistical downscaling and distribution mapping in reproducing rainfall statistics based on climate model results. Water Resour. Res. 2016, 52, 471–494. [Google Scholar] [CrossRef]
  89. Tarek, M.; Brissette, F.; Arsenault, R. Uncertainty of gridded precipitation and temperature reference datasets in climate change impact studies. Hydrol. Earth Syst. Sci. 2021, 25, 3331–3350. [Google Scholar] [CrossRef]
  90. Li, Z.; Quiring, S.M. Identifying the Dominant Drivers of Hydrological Change in the Contiguous United States. Water Resour. Res. 2021, 57, e2021WR029738. [Google Scholar] [CrossRef]
  91. United Nations. Transforming Our World: The 2030 Agenda for Sustainable Development; A/RES/70/1; United Nations: New York, NY, USA, 2015. [Google Scholar]
  92. Nover, D.M.; Witt, J.W.; Butcher, J.B.; Johnson, T.E.; Weaver, C.P. The effects of downscaling method on the variability of simulated watershed response to climate change in five U.S. basins. Earth Interact 2016, 20, 1–27. [Google Scholar] [CrossRef] [PubMed]
  93. Kundzewicz, Z.W.; Krysanova, V.; Benestad, R.E.; Hov, Ø.; Piniewski, M.; Otto, I.M. Uncertainty in climate change impacts on water resources. Environ. Sci. Policy 2018, 79, 1–8. [Google Scholar] [CrossRef]
  94. Sun, F.; Mejia, A.; Sharma, S.; Zeng, P.; Che, Y. Evaluating the Credibility of Downscaling: Integrating Scale, Trend, Extreme, and Climate Event into a Diagnostic Framework. J. Appl. Meteorol. Climatol. 2020, 59, 1453–1467. [Google Scholar] [CrossRef]
  95. Aven, T. On How to Deal with Deep Uncertainties in a Risk Assessment and Management Context. Risk Anal. 2013, 33, 2082–2091. [Google Scholar] [CrossRef]
Figure 3. Flow chart presenting the methodology.
Land 14 01919 g003
Figure 4. The annual average temperature (°C) in the Kickapoo watershed from 1982 to 2100. PRISM data (blue line) cover the period 1982–2020, while projections for RCP4.5 (orange line) and RCP8.5 (green line) span 2021–2099.
Land 14 01919 g004
Figure 5. Time series of annual rainfall from 1982 to 2099. The historical data (1982–1999) in orange color, and baseline period (2000–2020) in the blue line are PRISM data, and future projections (2021–2099) under RCP 4.5 (green) and RCP 8.5 (black) scenarios. The shaded bands represent the range across GCMs, and solid lines indicate ensemble (Ens.) means.
Land 14 01919 g005
Figure 6. Trend of monthly precipitation of baseline (dashed blue), and ensemble mean (black) of projections for RCP 4.5 and RCP 8.5, and the gray fill area are projection bands from GCMs across early-, mid-, and late-century Periods.
Land 14 01919 g006
Figure 7. Percent changes in annual average ET, percolation, precipitation, and water yield for the entire watershed (top), and flow, sediment, TN, and TP loads at Steuben (bottom), relative to the baseline under mid- and late-century RCP4.5 and RCP8.5 projections. The vertical bars represent the range of percentage changes across GCMs (see Table S4 for individual GCM).
Land 14 01919 g007
Figure 8. Baseline and projected annual streamflow at Steuben for RCPs. The red line represents the ensemble median, the shaded band indicates the prediction range across GCMs, and the dark green line shows the fitted Mann–Kendall trend for the median values, while the blue dotted line represents the 25th percentile and the black dotted line represents the 75th percentile. The baseline annual streamflow is in green.
Land 14 01919 g008
Figure 9. Projected monthly streamflow at Steuben for the early, mid-, and late century under RCP 4.5 (top) and RCP 8.5 (bottom). The red dotted line shows the baseline, the blue line is the ensemble median, and the shaded areas indicate GCM ranges.
Land 14 01919 g009
Figure 10. Projected daily flow duration curve for GCMs over the early, mid- and late century for RCP4.5 (top) and RCP8.5 (bottom). The variability of flow across GCMs at 50% and 90% exceedance probability is presented in boxplots, with baseline values in dots.
Land 14 01919 g010
Figure 11. Percent changes in annual averages of flow, sediment, TN, and TP load at Steuben relative to the baseline for the mid- and late century for land use and climate change scenarios under RCPs. Vertical bars represent the range of percentage changes across GCMs. The bar chart is the percentage difference between the ensemble average of percentage changes in GCMs.
Land 14 01919 g011
Figure 12. Ensemble median of mean monthly flow, sediment, and nutrient loads for the mid- and late-century periods under RCP 4.5 and RCP 8.5 across scenarios (CC (blue), G-CC (green), LU (red), and LUCC (black)) at Steuben. Vertical bars are error bars presenting the standard error across GCMs.
Land 14 01919 g012
Figure 13. Ensemble median daily flow duration, TP load duration, and TP concentration curves for each scenario during mid- and late-century periods under RCP4.5 and RCP8.5.
Land 14 01919 g013
Table 1. Summary of simulated model scenarios.
ScenarioAcronymLand Use DataTemperature and Precipitation Data
BaselineBaseline20162000–2020
Climate changeCC 2024–2049 (Early Century)
20162050–2074 (Mid-Century)
2075–2099 (Late Century)
Land use changeLUHay -> Crop2000–2020
Land use and climate changeLUCCHay -> Crop2050–2074 (Mid-Century)
2075–2099 (Late Century)
G-CCCrop -> Grassland2050–2074 (Mid-Century)
2075–2099 (Late Century)
Disclaimer/Publisher’s Note: The statements, opinions and data contained in all publications are solely those of the individual author(s) and contributor(s) and not of MDPI and/or the editor(s). MDPI and/or the editor(s) disclaim responsibility for any injury to people or property resulting from any ideas, methods, instructions or products referred to in the content.