Abstract
The supply–demand network facilitates regional sustainable development by optimizing resource flows and allocation within the Water–Energy–Food system. However, few studies have constructed such networks from a Water–Energy–Food Nexus (WEF Nexus) supply–demand perspective, and the key driving factors influencing network formation, along with their underlying mechanisms, remain poorly understood. To bridge this gap, we propose a new framework for constructing WEF Nexus supply–demand networks via explainable artificial intelligence (EAI). Taking the Bohai Rim urban agglomeration as an example, we identified the key factors affecting the long-term supply and demand of the WEF Nexus and their mechanisms using the XGBoost-SHAP model. By quantifying the magnitude and direction of these factors’ influences, we constructed supply–demand networks and further developed optimization strategies that consider complex factor interactions and distinct thresholds. Key findings include: (1) Identification of 114 stable supply sources and 128 chronic deficit sources, forming 472 high-efficiency and 296 standard supply–demand corridors, with 6 major supply potential zones delineated. (2) Precipitation, vegetation coverage, human activity intensity, cropland distribution, and temperature emerged as primary determinants in descending order of importance. (3) Synergistic analysis revealed significant negative interactions between human activity and precipitation/vegetation, but positive correlation with temperature, with distinct nonlinear thresholds across zones. Based on these findings, we proposed a differentiated optimization strategy. Our study constructs a supply–demand network from the perspective of the WEF Nexus and highlights the importance of threshold effects and interactions among key factors in the construction and optimization of the network. The research results are also applicable to other urban agglomerations facing similar challenges.
1. Introduction
The Water–Energy–Food Nexus (WEF Nexus) is facing unprecedented challenges under the double pressure of global climate change and human activities [1]. The intertwined problems of freshwater scarcity [2], increasing energy pollution [3] and deteriorating food security [4] are seriously threatening the sustainable socio-economic development [5]. This problem is particularly prominent in urban areas. The uncontrolled expansion of urban space not only directly encroaches on ecological land, but also greatly weakens the supply capacity of ecosystems by changing the surface cover and destroying the natural hydrological cycle [6]. And city clusters, as carriers of multiple closely linked cities, have become the mainstream trend of today’s urban development. Prominent global examples include China’s Bohai Rim [7] and Yangtze River Delta [8], the Northeast Atlantic Seaboard Megalopolis in the USA [9], and the Greater Tokyo Area in Japan [10]. Compared with a single city, the contradiction between supply and demand in city clusters WEF Nexus presents more complex characteristics and more severe challenges [11]. In terms of spatial layout, urban agglomerations are the concentration of multiple cities within a similar geographical area, which further compresses ecological space and expands resource requirements. In terms of functional needs, there is an extreme imbalance in demand between the large cities within the urban agglomerations and their peripheral cities. Core cities (e.g., Beijing in the Bohai Rim [12], Shanghai in the Yangtze River Delta [13], Tokyo in the Greater Tokyo Area [14], and New York in the Northeast Atlantic Seaboard Megalopolis [15]) tend to concentrate a large amount of economic activity and population and have extremely large demands for water, energy and food, while their neighboring cities have relatively low demands for resources [16]. Therefore, how to achieve WEF Nexus synergistic optimization at the level of urban agglomerations, enhance the efficiency of resource utilization, and alleviate the contradiction between supply and demand has become a key issue that needs to be solved urgently.
Ecosystems support and secure the sustainable provisioning of the regional Water–Energy–Food Nexus (WEF Nexus) by providing key services such as water yield (WY), food production (FP), carbon storage (CS), and soil conservation (SC) [17]. Essentially, these ecosystem services (ESs) represent the benefits that humans directly or indirectly obtain from ecosystem functions to sustain their most basic well-being [18]. It is precisely for this reason that they have gradually become a critical link coupling human impacts with the structure and functions of ecosystems, thereby ensuring the supply of the WEF Nexus [19]. Recently, the balance of supply and demand of WEF Nexus-related ecosystem services (ESs) has gradually become a research hotspot in academia. For example, Ding et al. (2023) constructed a framework for coupled assessment of WEF Nexus and ESs, screened the relevant three types of ESs based on the correlation and performed quantitative assessment of supply and demand and evaluation of spatial matching characteristics [20]. On this basis, Ding et al. (2024) further linked source sites with high supply of WY, CS and FP to construct a “supply-supply” WEF Nexus ecological network [21]. Yang et al. (2024) and Tan et al. (2025) evaluated the matching characteristics of WEF Nexus with the dynamic supply and demand of ecosystem services and identified the key influencing factors using the Geo Detector (GD) model [22,23]. Wang et al. (2024), on the other hand, further explored the mechanism of interactions among the influencing factors and deepened the understanding of the supply–demand imbalance in the WEF Nexus [24]. Yin et al. (2023) further proposed a spatial superposition-based zoning optimization scheme based on the spatial and temporal evolution characteristics of WEF Nexus supply–demand matching [25]. In summary, although existing research has conducted certain studies on the ecological security patterns related to the WEF Nexus, few have constructed ecological networks from the perspective of supply and demand to promote the rational spatial allocation of resources. Furthermore, current studies on the construction of SDNs pay limited attention to the key factors influencing these networks and their underlying mechanisms. This may, to some extent, result in network development that struggles to align with real-world conditions, leading to optimization measures that are disconnected from practical realities.
The supply–demand network constructed in this study optimizes the allocation of Water–Energy–Food (WEF) Nexus-related ecosystem services through the “source--resistance surface—corridor--management zone” framework. Its core mechanism is grounded in the theory of ecosystem service flows, functioning by quantifying the spatial flow processes and supply–demand relationships of these services [26]. The operational mechanism of the supply–demand network involves identifying stable supply sources and deficit demand sources, constructing a resistance surface that reflects the impediments to resource flow, generating efficient transmission corridors to connect supply and demand sources, and delineating management zones with differentiated supply potential. The construction of the resistance surface is key to network formation [27]. The resistance surface affects how easily WEF Nexus-related material and energy flow through the medium. Previous studies typically focused on specific points or periods in time [28]. They selected multi-dimensional factors [29]. The weights of each resistance factor are determined using methods such as the entropy method or the Analytic Hierarchy Process (AHP), and then the resistance surface is generated by superimposing these factors. While operationally efficient and convenient, these methods have significant limitations: On the one hand, they overlook the impact of the time span. The supply–demand imbalance is a dynamically changing process, and research based solely on a single time scale is insufficient to identify the key factors that have long-term impacts on the supply–demand imbalance. On the other hand, the method of selecting resistance factors and determining their weights based on literature reviews and expert experience treats the impact of each resistance factor on the supply–demand network as a unidirectional linear relationship. That is, the contribution of each factor to the resistance surface is considered to be independent and fixed [30]. However, in reality, there are complex interactions and threshold effects among different resistance factors. These factors influence and constrain each other, collectively affecting the transmission efficiency and stability of the supply–demand corridors [31]. These limitations introduce a degree of one-sidedness and subjectivity into the construction of the resistance surface, making it difficult to build a supply–demand network that accurately reflects the actual conditions of the study area.
The integration of traditional algorithmic models with machine learning methods provides a novel approach to address the aforementioned limitations. In the comprehensive assessment of long-term supply and demand dynamics for multiple ecosystem services, the Zonation 5 model demonstrates distinct advantages. This model can identify optimal trade-off areas for various types of ecosystem services, thereby establishing conservation priorities for overall spatial planning [32]. Additionally, it can incorporate temporal weighting factors to evaluate multi-year time-series data, facilitating a long-term integrated assessment of ecosystem supply and demand. Compared to traditional methods, the Zonation 5 model can simultaneously consider multiple objectives and spatially account for both the actual supply quantities and the connectivity of supply units [33]. The ecological conservation priorities it generates are more aligned with actual supply characteristics, making it suitable for regions with severe mismatches in ecosystem service supply and demand. Moreover, in elucidating the mechanisms of influencing factors, eXtreme Gradient Boosting (XGBoost) has garnered significant attention for its robust capabilities in modeling nonlinear relationships, handling high-dimensional data, and resisting noise [34]. Meanwhile, SHAP (SHapley Additive exPlanations), as a unified interpretability framework rooted in game theory, provides consistent and reliable explanations—both locally and globally—for predictions generated by any machine learning model [35]. Thus, this study adopts an explainable AI approach integrating XGBoost and SHAP to construct the supply–demand ecological network. This method not only processes high-dimensional data efficiently within a gradient boosting framework but also accurately quantifies the contribution of each factor to supply–demand imbalances. Compared to conventional methods (such as geographical detectors [36] and the Analytic Hierarchy Process [37]), our approach offers the following advantages: (1) it significantly reduces subjectivity in selecting key resistance factors and determining their weights during resistance surface construction; and (2) it effectively captures threshold effects and interaction mechanisms among driving factors, which is crucial for precisely optimizing the supply–demand network. However, applications of this method in constructing supply–demand networks remain relatively limited, with notable gaps particularly in multi-temporal scale integrated analysis and the interpretation of corridor supply mechanisms.
The Bohai Rim Metropolitan Region (Section 2.1.1, Figure 1), serving as an engine for economic development in Northern China, is one of the areas with the highest population density and industrialization levels in the country [38]. It has become a common epitome of the WEF Nexus supply–demand imbalance faced by many regions worldwide undergoing rapid urbanization. However, intensive industrial development and extensive production patterns have led to the superimposition of issues such as overexploitation of water resources, increased energy-related pollution, and a sharp reduction in arable land. These problems exacerbate supply–demand contradictions [39]. The integrated management of the Water–Energy–Food (WEF) Nexus in this region is thus confronted with unprecedented pressure [40]. As a typical composite of a metropolitan core, a heavy industrial base, and an agricultural zone, its coordinated management of the WEF Nexus is facing unprecedented pressure [41]. Therefore, taking the Bohai Rim Metropolitan Region as a case study, this research coupled traditional models with machine learning algorithms to analyze the contributions and mechanisms of key factors influencing the supply and demand of the WEF Nexus over an extended period. A resistance surface considering nonlinear characteristics and a composite supply–demand network are constructed accordingly. This study adopts a logical framework structured as “Problem Identification--Methodology Development--Empirical Analysis--Mechanism Interpretation--Optimization Strategies”. The overall research objectives are as follows: (1) Constructing supply–demand networks based on the WEF Nexus perspective. (2) Explainable AI is adopted to identify and interpret the key factors and mechanisms affecting network generation, facilitating the construction and optimization of supply–demand networks.
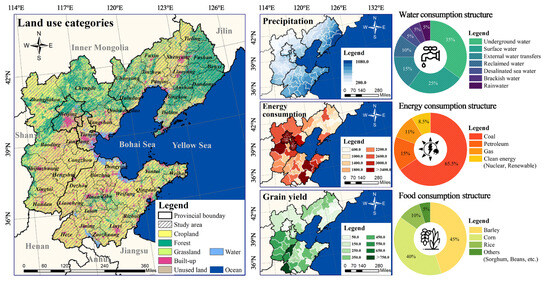
Figure 1.
Overview of study area.
2. Materials and Methods
2.1. Materials
2.1.1. Study Area
The Bohai Rim City Cluster includes two municipalities, Beijing and Tianjin, and three provincial-level administrative regions, Hebei, Liaoning and Shandong (Figure 1). Located in the temperate monsoon climate zone, the region experiences concentrated summer rainfall and sparse precipitation in spring and autumn. The per capita water resources are much lower than the national average, belonging to an extremely water-scarce area [42]. For a long time, the region’s economic growth has been partly reliant on the development of energy-intensive industries, which has led to severe air pollution [31]. Additionally, this region serves as a vital grain production base in Northern China. The arable land area reaches 26.565 million hectares, and grain output represents over 23% of the national total [43]. However, the mismatch between the supply and demand of water, energy, and food (WEF) in the region is particularly pronounced. Core cities such as Beijing and Tianjin function as major resource sinks, consuming water, energy, and food far beyond their ecological carrying capacity, and are thus heavily dependent on external inputs. In contrast, neighboring provinces, with their ecological function zones and agricultural production areas, bear the primary responsibility for resource supply, while simultaneously facing ecological degradation pressures resulting from resource extraction and outflow.
2.1.2. Data Sources
This study quantifies WEF Nexus supply and demand from multiple data sources. All were uniformly resampled at 1 km resolution. Supplementary S1 in the Supplementary Materials lists the sources and descriptions of each dataset.
2.2. Methods
This article takes the Bohai Rim urban agglomeration as the research object and proposes an AI-driven integration method driven by explainable artificial intelligence (XAI) to construct a WEF link supply and demand network. This approach is characterized by employing the XGBoost-SHAP framework as the computational core to actively derive and integrate data-driven insights into key decision-making processes. Specifically, a nested Zonation 5 model was first applied to analyze the supply–demand dynamics of six WEF Nexus-related ecosystem services across four periods (1990–2020). Time-weighted overlays were conducted to generate individual evaluations for water, energy, and food, which were then equally weighted and integrated to produce a comprehensive supply–demand assessment for source identification. The AI-driven component was implemented to overcome the subjectivity of conventional resistance surface construction: the XGBoost-SHAP model quantified the impact intensity and mechanisms of natural, climatic, and socioeconomic factors on long-term WEF Nexus supply–demand imbalance. This AI engine autonomously identified key driving factors and determined their weights based on objective contribution metrics, thereby constructing a data-driven ecological resistance surface. Supply–demand corridors meeting WEF Nexus balance were subsequently delineated using circuit theory. Furthermore, optimization strategies for enhancing corridor connectivity were proposed based on interaction mechanisms among key resistance factors revealed by the AI model. Beyond sources and corridors, the supply capacity of other regions was assessed, and self-organizing maps (SOM) were employed to delineate ecological potential zones. For zonal optimization, the XGBoost-SHAP AI engine was again leveraged to interpret the operational forms and threshold effects of key influencing factors across different zones, informing the development of comprehensive and differentiated management strategies. Ultimately, a “point-line-plane” structured supply–demand network (“source-corridor-zone”) was established (Figure 2).
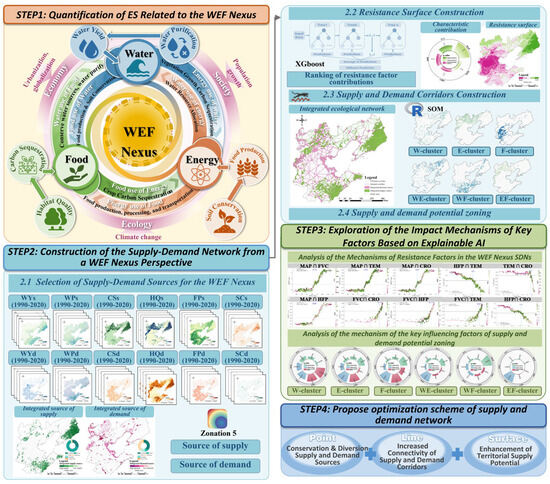
Figure 2.
Research flowchart design.
2.2.1. Quantification of ES Related to the WEF Nexus
The interlinkage framework between the Water–Energy–Food (WEF) Nexus and ecosystem services is illustrated in Figure 2. The WEF Nexus spans multiple domains, including water resources, industry, and agriculture [44]. Specifically, industrial production, agricultural irrigation, and daily life all depend on water yield (WY) services [45]. Meanwhile, energy production not only consumes substantial water resources but also relies on carbon sequestration (CS) services to ecologically regulate its carbon emissions [46]. The production, processing, and transportation of food simultaneously depend on both water and energy inputs, while food production (FP) services directly support societal demands [47]. Furthermore, some food products can be converted into bioenergy, further reflecting the energy conversion and circular mechanisms among these systems.
To scientifically characterize the complex interrelationships described above, this study employs a suite of core ecosystem services that correspond to the key attributes and feedback mechanisms of the three subsystems—water, energy, and food—thereby translating the abstract concept of the “nexus” into a quantifiable and spatially situatable model:
For the water subsystem, the central focus lies in both the quantity and quality of water resources. Water yield (WY) is used to quantify the supply capacity of water resources [48]. Concurrently, from a hydrological cycle perspective, water purification (WP) services—through ecological functions such as pollutant removal and water quality improvement—provide essential safeguards for WY, ensuring its stable and sustainable supply [48]. Thus, WY and WP collectively define the integrity and security of the water subsystem. For the energy subsystem, the emphasis is on the ecological regulation of carbon emissions derived from energy consumption. Carbon sequestration (CS) is selected as a direct proxy, whose supply capacity reflects the region’s ability to mitigate climate change through carbon storage [17]. CS largely depends on the photosynthetic efficiency of natural vegetation, which in turn is influenced by habitat quality (HQ) [49]. HQ regulates vegetation distribution, growth, and carbon sequestration functionality, making it a fundamental supporting factor for long-term CS supply. For the food subsystem, the core concerns are agricultural productivity and sustainability. Food production (FP) is directly employed to quantify food supply [47]. However, agricultural production is highly dependent on healthy soils and may also contribute to soil degradation. Therefore, soil conservation (SC) is introduced to represent the natural capital that underpins agricultural productivity and prevents land degradation [50].
In summary, this study selected six ecosystem services (WY, WP, CS, HQ, FP, SC) closely related to the WEF Nexus, which precisely correspond to and quantify the core attributes of the three WEF subsystems. By mapping the spatial patterns of supply and demand for these services, we transform the abstract concept of the “nexus” into a measurable and situatable spatial network. This approach provides a scientific basis for synergistic management of water, energy, and food systems. For specific formulas, please refer to Supplementary S2 (Figure 3).
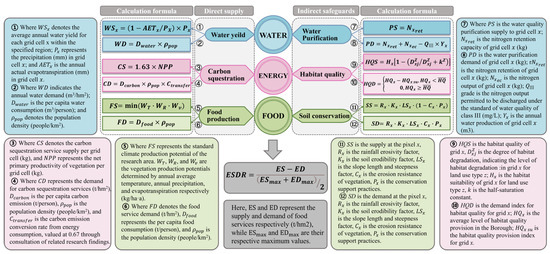
Figure 3.
WEF Nexus-related ecosystem service supply and demand calculation formula.
2.2.2. Construction of the Supply–Demand Network from a WEF Nexus Perspective
- Selection of Supply–Demand Sources for the WEF Nexus
Zonation 5 model as a tool for large-scale ecological planning and spatial prioritization [51]. The principle is to use an algorithm to iteratively remove the least valuable raster from the landscape and filter them to obtain the optimal protected area [52,53]. In this study, we applied the Zonation 5 to the comprehensive supply–demand evaluation of multiple ecosystem services related to WEF Nexus across different time periods. Specifically, we used exponential smoothing to assign time-dependent weights to the composite evaluation results for the years 1990, 2000, 2010, and 2020. The weights decrease progressively from the most recent to the earliest years, with the weight for each preceding year being half of that for the current year, ensuring that the sum of all weights equals 1. As a result, the weight for 2020 was calculated to be 0.5, while the weight for 1990 was 0.07, with weights for other years derived accordingly. Using this method, we obtained a prioritized ranking of water, energy, and food supply–demand balance based on the composite data from multiple periods. We further employed the Zonation 5 to conduct an equal-weight overlay analysis of the evaluation results, ultimately yielding a comprehensive assessment of the WEF Nexus supply–demand imbalance. Based on this, the top 20% of areas were extracted as composite supply sources, representing ecologically robust core regions capable of providing stable and continuous supply. The bottom 20% of areas were extracted as composite demand sources, indicating regions that have long faced supply–demand imbalances [54].
- 2.
- Resistance Surface Construction
The migration and flow of energy and resources among landscape units frequently encounter varying degrees of ecological resistance. Constructing resistance surfaces is therefore fundamental to delineating optimal pathways for resource transmission. Selecting resistance factors and scientifically assigning weights to them is crucial. XGBoost (eXtreme Gradient Boosting) is an efficient machine learning algorithm based on the gradient boosting framework [55]. In brief, XGBoost constructs high-accuracy predictive models by integrating multiple weak learners (i.e., decision trees). It demonstrates strong performance in handling complex nonlinear relationships and is particularly well-suited for multi-factor weight assignment tasks such as constructing ecological resistance surfaces. The algorithm assigns varying weights to resistance factors based on their relative influence, thereby enabling a scientifically robust quantification of resistance surfaces. Compared to conventional methods, XGBoost not only enhances model interpretability and predictive accuracy but also effectively mitigates overfitting and improves generalization capability. This provides a reliable foundation for identifying ecological corridors and optimizing ecological network planning.
In constructing the resistance surface, this study followed a workflow of “preliminary screening—quantitative contribution assessment—objective screening” to identify resistance factors and determine their weights. First, based on previous research [56] and the actual situation of the Bohai Rim urban agglomeration, three categories of resistance factors (totaling 8 items)—geographical, climatic, and socio-economic—were preliminarily selected (Table 1). Multi-year averages were used to represent the comprehensive characteristics of each influencing factor. To further refine the selection of factors, the XGBoost model was employed to rank the importance of the initially selected eight factors. Factors with cumulative contribution exceeding 85% were retained [57], thereby avoiding the inclusion of low-contribution or redundant variables and ensuring both simplicity and computational efficiency of the resistance surface. The normalized contribution values of each selected factor to long-term supply–demand imbalance were then used as their respective weights in constructing the resistance surface. This approach aims to overcome the subjectivity inherent in traditional methods such as the Analytic Hierarchy Process (AHP)—which synthesizes expert judgment through pairwise comparison matrices [58]—or entropy weight method, which objectively calculates weights based on the variability in indicator data using information entropy [59]. The operating principle and equations of XGBoost are provided in Supplementary S4; parameter settings and training results are listed in Supplementary S5.

Table 1.
Impact factor and classification.
- 3.
- Supply and Demand Corridors Construction
Circuit Theory simulates species migration by representing ecological resistance values as circuit resistances and ecological flows as random-walk currents, effectively reflecting the stochastic nature of species movement [60]. In this study, ecological corridors were delineated using the Linkage Pathways and Map Linkages modules of the Linkage Mapper Toolbox, based on circuit theory. It is particularly emphasized that the supply–demand network of the WEF Nexus constructed in this study serves as a conceptual spatial planning framework. It is not intended for the transportation of market commodities but rather aims to characterize potential pathways for the flow of ecosystem services. Essentially, it represents a feedback mechanism between ecosystems and human activities mediated by ecosystem service flows, designed to provide a scientific basis for rational regional resource allocation and the optimization of ecological security patterns. Within this framework, “supply” refers to the capacity of ecosystems to generate services, while “demand” corresponds to the consumption of these services by human society. “Ecological corridors” are identified as the least-resistance pathways for service flows. By enhancing the connectivity of these corridors and reducing ecological resistance during service delivery, the integrity and sustainability of ecological processes can be maintained. Regarding the “implementation of management strategies,” the primary actor is the government [61]. Through appropriate and precise ecological governance—such as implementing ecological restoration projects and designating ecological protection zones—the functionality of the network can be maintained and enhanced, thereby ensuring the stable and continuous supply of ecosystem services.
- 4.
- Supply potential zoning
Scientifically sound ecological management zoning serves as a crucial pathway towards achieving integrated regional governance [62]. The self-organizing map (SOM), an unsupervised neural network approach, preserves topological structures from high-dimensional input space by clustering units with similar ecosystem service (ES) characteristics into adjacent zones [63]. To balance analytical precision with practical urban agglomeration management needs, we adopted 10 km × 10 km grid cells (excluding source-sink areas) based on optimal scale recommendations for large-scale ES management [64]. Using long-term integrated supply–demand assessments of Water–Energy–Food systems, we quantified comprehensive supply potential for each spatial unit. Based on this, a self-organizing map (SOM) was employed to delineate ecological supply potential zones. To further propose targeted optimization strategies, this study again adopted the XGBoost-SHAP model to quantitatively analyze the key influencing factors within each zone and interpret their underlying mechanisms. Unlike conventional approaches that remain limited to spatial identification, this research further reveals the specific drivers affecting supply–demand dynamics across different zones, thereby providing a scientific basis for formulating differentiated ecological management strategies and promoting coordinated regional development.
2.2.3. Exploration of the Impact Mechanisms of Key Factors Based on Explainable AI
Explainable AI (XAI) refers to methods that clearly and visually explain the prediction process and outcomes of complex machine learning models to decision-makers, ensuring that each prediction is supported by corresponding decision-making rationale [35]. In this study, although XGBoost excels at identifying key factors affecting supply–demand imbalance based on feature importance ranking, its ‘black-box’ nature makes it difficult to intuitively understand the internal mechanisms of the model, as well as the direction (positive/negative) and functional form (linear/nonlinear) of each factor’s influence on supply–demand imbalance. SHAP (SHapley Additive exPlanations), on the other hand, is a method for interpreting machine learning model predictions. Based on Shapley values from game theory, it quantifies the contribution of each feature to the final prediction, thereby providing interpretability support for the model. Therefore, in this study, we integrate the XGBoost machine learning model with the SHAP method. By assigning contribution values to each feature factor in the model to visualize their importance ranking, we simultaneously identify and analyze the nonlinear structure of threshold effects and interaction mechanisms among various factors, constructing a transparent interpretation framework [65]. This provides a necessary scientific basis for subsequent decision-makers to propose optimization strategies. The formula is as follows [66]:
where is the sample, is the feature of the sample, is the marginal contribution of the feature, is the weight of the edge, is the SHAP value of the sample , is the prediction result of the sample, and is the mean value of the target variable.
3. Results
3.1. Mapping WEF Nexus Supply and Demand During 1990–2020
As shown in Figure 4, the WEF nexus-related ecosystem services in the Bohai Rim urban agglomeration exhibited significant spatiotemporal heterogeneity from 1990 to 2020. Figure 4a reveals that WYs and WQs services generally decreased from the southeastern coastal areas toward the northwestern inland regions. High-value areas of CSs and HQs were predominantly concentrated in major forested regions, such as the Changbai Mountains, Yanshan Mountains, and Taihang Mountains. In contrast, FPs were mainly distributed across the flat terrain of the North China Plain. Figure 4b demonstrates that WYd, CSd, and FPd were primarily clustered in industrial and densely populated zones, showing a notable increase with economic development. The spatial distribution of WQd was centered in the hinterland of the Shandong Peninsula and the Liaohe Plain, while HQd was mainly concentrated in urban fringe areas and agro-pastoral transition zones. SCd, however, was distributed in urban core areas and the Bashang Plateau. Nevertheless, the degree of supply–demand imbalance varied considerably among ecosystem services. Water yield exhibited the most pronounced imbalance, followed by water purification and habitat quality (Figure 4c).
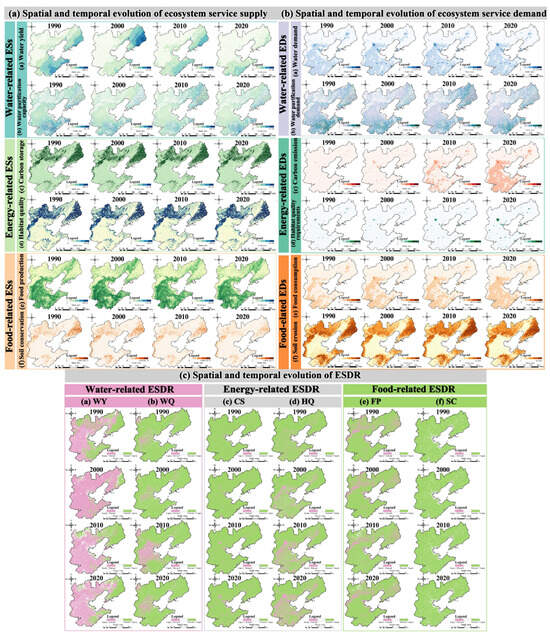
Figure 4.
Supply and demand for ES associated with WEF Nexus.
3.2. WEF Nexus Supply and Demand Network Construction
3.2.1. Supply and Demand Sources Identification
This study identified a total of 114 stable supply sources (82,355.64 km2) and 128 long-term deficit sources (77,306.85 km2). Figure 5 reveals the distribution of the comprehensive supply and demand sources of the WEF Nexus in the Bohai Rim region and their corresponding land use types. The supply sources are predominantly forest land and cropland, accounting for 65.3% and 28.6% (Figure 5a), respectively. The demand sources are mainly urban land and cropland, accounting for 38.3% and 37.8% (Figure 5b), respectively. Cropland, as a special type of land use, not only plays an important role in food production but may also lead to overconsumption or pollution of water resources. This is primarily because intensive irrigation agriculture consumes vast amounts of freshwater, while the application of fertilizers and pesticides can cause non-point source pollution, degrading water quality [67]. At the same time, cropland itself has a certain capacity for carbon sequestration and is an important focus for source area management.
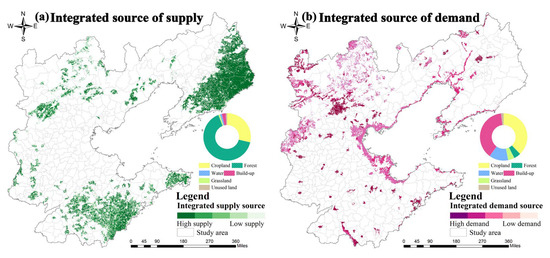
Figure 5.
Identification of supply–demand source areas.
3.2.2. Resistance Surface Construction
Based on the results of the XGBoost-SHAP model, the top 5 factors were selected as resistance factors for constructing the resistance surface (Figure 6). After normalizing their contributions, the factors were ranked according to their resistance levels as follows: annual average precipitation (0.464), vegetation cover (0.186), human activity intensity (0.143), cropland proportion (0.139), and temperature (0.068). The composite resistance surface analysis, based on the top five resistance factors by contribution (Figure 6), shows that high-value areas of corridor transmission resistance are mainly distributed in the northwestern part of the North China Plain, including cities such as Baoding, Shijiazhuang, and Langfang. Moreover, in the urban centers of Beijing and Tianjin, as well as in the economically and industrially dense regions of the Shandong Peninsula (such as Qingdao, Yantai, and Dongying), high resistance values are also observed due to the high concentration of human activities.
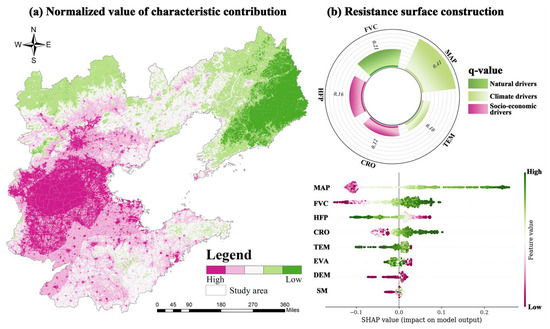
Figure 6.
Construction of ecological resistance surface.
3.2.3. Supply and Demand Corridors Construction
This study identified 768 ecological corridors totaling approximately 32,692.22 km, with the longest individual corridor spanning 265.16 km and an average length of about 31.04 km. According to spatial efficiency and minimum cumulative resistance based on circuit theory, corridors were classified into 472 high-efficiency transmission corridors (Ratio ≤ 5) and 296 general corridors (Ratio > 5), collectively forming an interconnected network structure (Figure 7).
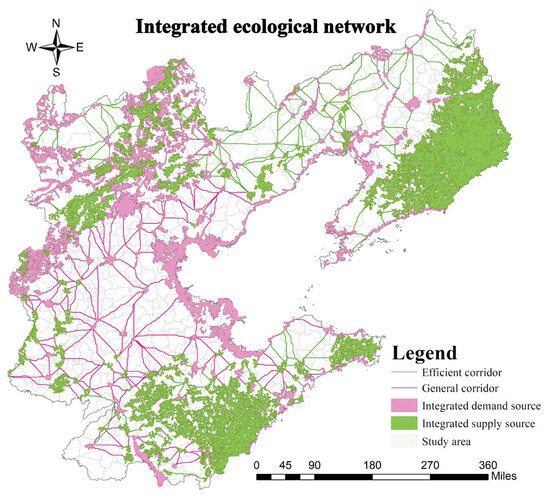
Figure 7.
Generation of supply–demand corridors.
3.2.4. Supply Potential Zoning
As shown in Figure 8a, based on the SOM model, the areas outside the ecological source regions in the study area were divided into six ecological management zones. Combined with the analysis of Figure 8, the water supply service potential zone (W cluster) is mainly distributed on the southeast side of the Taihang Mountains, dominated by forest land, with significantly higher annual precipitation than the surrounding areas and prominent water conservation capacity. The carbon sequestration service potential zone (E cluster) is mainly distributed on both sides of the Yan Mountains, with high vegetation cover and significant carbon sequestration efficiency. The food supply potential zone (F cluster) is mainly distributed on the northwest side of the North China Plain, mainly in arable areas, with superior light and heat conditions, but subject to strong human activity interference. The water supply and carbon sequestration composite zone (WE cluster) are mainly distributed in the central Liao River Plain, where the rainfall is abundant, the soil has strong water retention capacity, and the area has both water supply and carbon sink functions. The water supply and food production composite zone (WF cluster) are mainly distributed on the north side of the Changbai Mountains and in the southeast of Shandong, where fertile alluvial soils and monsoon precipitation work together to greatly enhance the potential for water supply and food production. The carbon sequestration and food production composite zone (EF cluster) is scattered in the Qinhuangdao area, where natural vegetation and farmland are interspersed, and the habitat quality is good.
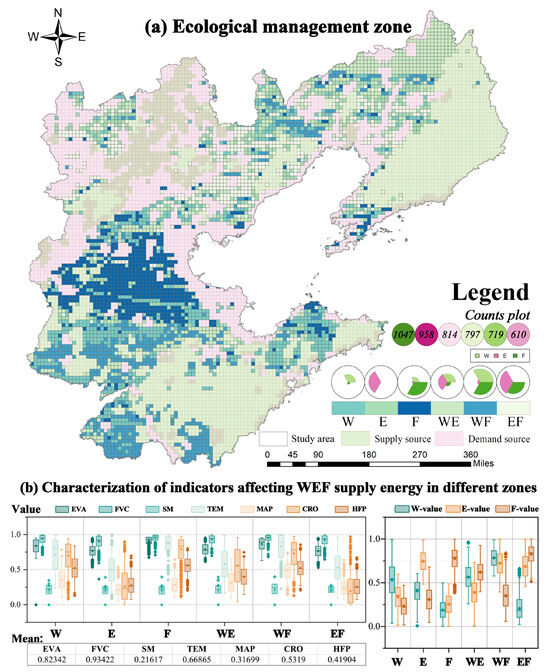
Figure 8.
Ecological management zoning based on territorial supply potential.
3.3. Explainable AI-Based Analysis of the Mechanism of Action of Key Impact Factors
3.3.1. Analysis of the Mechanisms of Resistance Factors in the WEF Nexus SDNs
This study selected the top five impact factors ranked by contribution and analyzed their pairwise interactions. An interaction diagram was plotted for those with correlation coefficients exceeding 0.6 (Figure 9a). As shown in Figure 9b, with increasing precipitation, the comprehensive supply capacity of the WEF Nexus in the study area gradually increases. When the annual average precipitation exceeds 750.92 mm, in combination with a lower CRO, it has a significant synergistic effect on promoting supply–demand balance (p = −0.78). Additionally, as shown in Figure 9c, HFP exhibits a negative synergistic effect with MAP. Moreover, Figure 9d,e indicates that FVC greater than 92% has a positive impact on supply–demand balance, showing negative synergistic effects with TEM (p = −0.67) and HFP (p = −0.79), respectively. The threshold for CRO is 68%, and it has a positive synergistic effect with HFP (Figure 9f). Finally, Figure 9g shows that TEM exceeding 12.97 °C has a certain synergistic effect with cropland distribution (p = 0.50), exacerbating the supply–demand imbalance of the WEF Nexus. The study reveals the complex impact mechanisms of key resistance factors on the WEF Nexus supply and demand, providing important guidance for proposing optimization strategies to ensure the sustainable and stable operation of the ecological network.
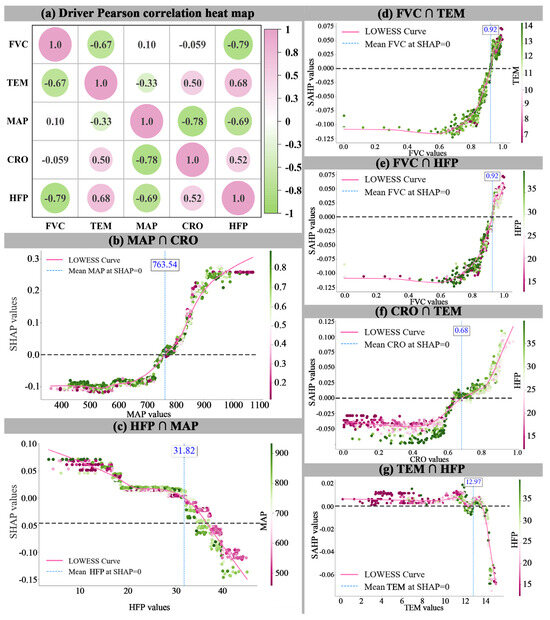
Figure 9.
Interaction effects of resistance factors.
3.3.2. Analysis of the Mechanism of the Key Factors of Supply Potential Zoning
As shown in Figure 10, drivers and their threshold influences on WEF Nexus supply potential vary across ecological management sub-regions. Annual precipitation is the dominant driver across all zones, positively enhancing provisioning potential above 750 mm. Additionally, elevation significantly affects supply potential in all zones except the EF cluster, with increasing elevation positively correlating with higher provisioning capacity due to reduced human disturbance, denser vegetation, and improved habitat quality. Notably (Figure 10e(2)), temperatures between 13.16 and 16.09 °C effectively enhance regional food supply and carbon sequestration potentials, as optimal temperatures promote photosynthesis and nutrient accumulation in crops and vegetation. Consistent with [68], elevated temperatures influence soil organic carbon accumulation and transformation, thereby affecting carbon sequestration capacities.
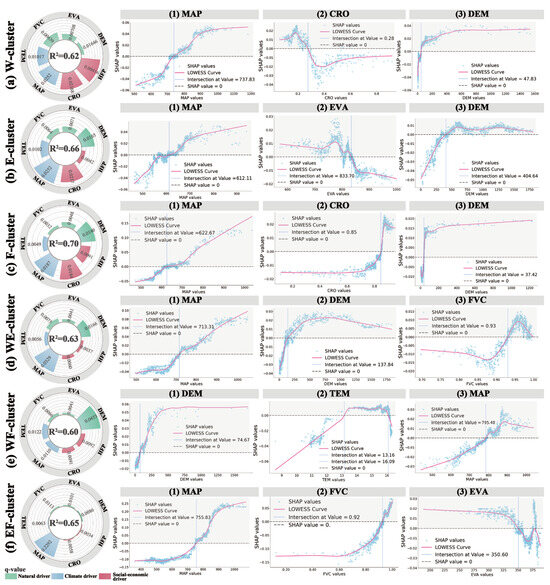
Figure 10.
Contribution weights and operating mechanisms of driving factors across partitions.
4. Discussion
4.1. The Advantages of Explainable AI in Constructing the WEF Nexus Supply–Demand Network
Within the framework for constructing the WEF Nexus supply–demand networks proposed in this study, which includes “sources—resistance surface—corridors—management zones,” the approach driven by Explainable AI demonstrates unique advantages.
In the identification of source areas, supply and demand sources serve as the starting points for the flow of materials, energy, and species dispersal, forming the foundation of the networks [69]. Accurate identification of critical thresholds and the implementation of corresponding strategies are essential for ensuring the stability and efficiency of the networks [70]. Explainable AI, through the combination of XGBoost and SHAP, can precisely capture the threshold effects and nonlinear relationships of various influencing factors, providing a scientific basis for the precise regulation of supply and demand sources. In the construction of resistance surfaces, traditional methods rely on expert experience and literature summaries, which may introduce subjective biases. In contrast, the Explainable AI-based approach can transparentize the selection and weighting of resistance factors, generating more interpretable supply–demand resistance surfaces. This data-driven method effectively reduces biases introduced by subjective experience, enhancing the scientific validity and reliability of resistance surface construction. At the corridors level, based on the circuit theory for corridors construction, Explainable AI further disentangles the interactions of resistance factors in the supply–demand network. This not only enhances the efficiency of corridor transmission but also ensures the sustainability of the network. In terms of management zoning, Explainable AI combined with the Self-Organizing Map (SOM) deep learning method allocates research units into corresponding ecological management zones based on the spatial similarity of ecosystem services [71]. By conducting attribution analysis of different supply potential areas within the WEF Nexus, this approach reveals the key influencing factors and mechanisms of supply capacity in different zones, providing an objective basis for the formulation of differentiated management strategies.
In summary, the Explainable AI approach significantly enhances the construction quality and management efficiency of the WEF Nexus networks by optimizing the precise regulation of supply and demand sources, improving the scientific basis of resistance surface construction, increasing corridor transmission efficiency, and refining management zoning. This method provides a more scientific and targeted tool for resource management decision-making and paves a new path for the coordinated development and sustainable use of the WEF Nexus, holding important theoretical and practical significance.
4.2. Management Implications
Our study identifies a critical premise: understanding key driving factors and their operational mechanisms is fundamental when constructing supply–demand networks and proposing optimization strategies [72,73]. Therefore, based on the relative importance, threshold effects, and interactive relationships of these determinants, we derive three pivotal insights for source areas, corridors, and management zones, respectively:
Firstly, protection and relief of supply and demand sources are based on the importance of influencing factors and critical thresholds. For supply sources, the dominant land use types in this area are forest and cropland (Figure 5a). Given that MAP was identified as the most important driving factor (Figure 6) and values exceeding 750.92 mm significantly enhance supply–demand balance (Figure 9b), priority should be given to implementing water resource optimization strategies in such regions [74]. Meanwhile, since FVC is the second most influential driver and exhibits a positive impact on supply–demand balance when exceeding a threshold of 92% (Figure 9d,e), large-scale vegetation restoration projects—such as forest conservation and reforestation—should be implemented to improve vegetation coverage [75]. Furthermore, the study revealed a threshold of 68% for the CRO (Figure 9f). Therefore, it is essential to strictly control the expansion of cropland and adopt measures that enhance soil fertility, thereby ensuring food production while maximizing carbon sequestration and water retention capacities of the land [76]. For demand sources (Figure 5b), which are primarily urban built-up lands, the key finding that TEM exceeding 12.97 °C exacerbates supply–demand imbalance (Figure 9g) calls for urgent measures to decentralize over-concentrated urban populations [77]. Additionally, urban planning and architectural design should be optimized to mitigate heat island effects and maintain the annual average temperature below this critical threshold. On the basis of ensuring the sustainability of supply sources, adjusting demand structure is crucial for ultimately achieving dynamic supply–demand balance.
Secondly, connectivity enhancement of supply–demand corridors is based on the interactions of influencing factors. Studies have shown that the WEF Nexus supply–demand network is driven by multiple factors. Among them, there is a negative interaction between MAP and HFP, as well as between MAP and CRO, while a significant positive synergistic effect is observed between HFP and CRO (Figure 9a,c,f). This implies that cropland distribution is often accompanied by strong human intervention, leading to increased land use intensity and ecological resistance. In contrast, increased precipitation can effectively mitigate these negative impacts. Numerous studies have demonstrated that enhancing vegetation cover can effectively increase precipitation. Additionally, FVC exhibits a significant negative synergistic effect with HFP and TEM, while a positive correlation exists between HFP and TEM (Figure 9a,d,e). This indicates that an increase in HFP, through changes in surface cover (e.g., increased impervious surfaces) and anthropogenic heat release, leads to temperature rises, thereby impeding corridor transmission efficiency. In contrast, plants can effectively reduce the greenhouse effect caused by human activities through transpiration cooling, lowering the corridor transmission resistance. In summary, increasing vegetation cover while simultaneously reducing human activity intervention and cropland distribution is a key pathway to enhancing corridor transmission efficiency. Therefore, this study proposes the optimization measure of “establishing buffer forests along corridors” and further determines the width of buffer forests (Supplementary S5). Efficient corridors should have a 100 m buffer forest, while general corridors should have a 50 m buffer forest [78]. This measure can achieve coordinated management of precipitation, vegetation cover, temperature, and human activities, thereby enhancing corridor transmission efficiency.
Finally, the exploration and enhancement of the overall supply potential are based on ecological management zoning and key influencing factors. For the W cluster, the construction of sponge cities should be strengthened to achieve effective utilization of natural ecological rainwater. The development of intelligent agricultural water management systems should be promoted to leverage the water retention function of arable land [79]. For the E cluster, energy-consuming enterprises are encouraged to use reclaimed water, and the application of advanced energy-saving technologies and equipment should be promoted to reduce industrial water pollution and waste [80]. Based on the existing forest land in the mountainous areas, the vertical stratification of vegetation communities should be enriched to increase the green volume unit per. For the F cluster, soil improvement, fertilization management, and the construction of farmland water conservancy projects should be implemented to enhance the grain production capacity of arable land. In addition, water-saving irrigation technologies should be popularized to reduce the consumption of water resources in agricultural production [81]. For the WE cluster, relying on the natural advantages of high-altitude areas, the development of renewable energy sources such as solar and wind energy should be intensified to reduce dependence on traditional energy. For the WF cluster, drip irrigation and micro-sprinkler irrigation can be adopted to minimize agricultural water waste [82]. Depending on the different temperature and water requirements of various crops, intercropping and relay cropping patterns should be used [83]. Finally, for the EF cluster, soil structure should be improved to enhance the water and nutrient retention capacity of the soil and to maximize the carbon sequestration potential of arable land.
The above insights provide a crucial foundation for decision-makers to formulate optimization strategies. Based on Explainable AI methods, this study proposes optimization measures and management plans supported by objective data from three dimensions—points, lines, and surfaces. Our research offers theoretical support and a practical paradigm for better alleviating the supply–demand imbalance of the WEF Nexus at the urban agglomeration scale.
4.3. Research Gaps and Future Prospects
This study also has certain limitations:(1) Due to the limitations of data availability, the study only quantifies the demand for ecosystem services through indicators such as population density and per capita consumption, which is somewhat one-sided. Therefore, future research could incorporate additional indicators that reflect the interactions of the WEF Nexus, such as agricultural water use, industrial water use, and energy consumption in agricultural production, to more accurately quantify the demand for WEF Nexus-related ecosystem services.(2) Although this study has quantified the Water–Energy–Food-related ecosystem supply in the Bohai Rim urban agglomeration using a multi-model approach, ecosystem services (ES) have significant externalities. The study has not yet explored the supply of ecosystem services provided by ecosystems outside the study area. Future research could first attempt to introduce a more diversified indicator system to overcome the one-sidedness of relying solely on population density and per capita consumption. Moreover, employing inter-regional input-output (IRIO) models or ecosystem service flow analysis methods to include services provided by ecosystems outside the study area could address the current limitation of focusing only on local ecosystem supply. (3) Although the robustness of the XGBoost model in this study has been ensured through 5-fold cross-validation, future research could further strengthen the analytical reliability through methods such as comparative model validation. For instance, other advanced machine learning algorithms—such as Random Forest, LightGBM, or neural networks—could be introduced for comparative analysis. By evaluating the predictive performance of different models on the same dataset and assessing the consistency in the ranking of key driving factors, the reliability of the findings in this study could be more comprehensively verified, ensuring that they are not specific to a single model.
Through these methods, the existing supply–demand network can be continuously optimized, providing a more robust theoretical basis and more operational practical guidelines for regional sustainable development.
5. Conclusions
This study focuses on the Bohai Rim region and, from the perspective of ecosystem service supply and demand related to the Water–Energy–Food (WEF) Nexus, integrates traditional models with Explainable AI methods to construct an ecological network framework of “source–resistance surface–corridor–zones”. Using an explainable machine learning model (Explainable AI), the research reveals the importance and intrinsic mechanisms of driving factors that influence the long-term dynamics of WEF Nexus supply and demand. By leveraging threshold effects and interaction mechanisms among key factors, corresponding optimization strategies are developed across “point–line–plane” dimensions. The main findings are summarized as follows:
(1) A total of 114 sources of stable supply and 128 sources of chronic shortages were identified. (2) 472 efficient supply and demand corridors and 296 general supply and demand corridors were constructed. The effects of the resistance factors on the supply and demand of WEF Nexus follow different nonlinear relationships, thresholds and interaction effects. They are mainly characterized by “S”-shaped and “U”-shaped distributions. (3) Delineated 6 major supply potential areas. It covers water-dominated, energy-dominated, food-dominated and other three types of composite clusters. Among them, precipitation, elevation, and potential evapotranspiration are the pervasive influences on each subregion.
The results of the study strongly respond to the central theme of the current international synergistic and integrated development of water, energy and food. Furthermore, this study provides other high-density urban agglomerations with a transferable empirical model and a scalable methodological framework to ensure sustainable and stable WEF Nexus supply within intensive development patterns.
Supplementary Materials
The following supporting information can be downloaded at https://www.mdpi.com/article/10.3390/land14091920/s1: Figure S1: The operating mechanism of Zonation 5; Figure S2: XGBoost operating mechanism; Figure S3: Contribution weights and operating mechanisms of driving factors across partitions; Table S1: Hyperparameter tuning results based on Optuna; Table S2: Model fitting results; Table S3: Corridor width and buffer width. References [21,27,84,85,86,87,88,89,90,91,92,93] are cited in the Supplementary Materials.
Author Contributions
Conceptualization, L.C. and H.Z.; methodology, L.C.; software, L.C.; validation, L.C.; formal analysis, L.C.; investigation, L.C. and X.Y.; resources, H.Z. and C.Z.; data curation, L.C.; writing—original draft preparation, L.C.; writing—review and editing, C.X.; visualization, L.C., H.Z. and C.X.; supervision, Y.Z. and Z.Y.; project administration, Y.Z. and Z.Y.; funding acquisition, Y.Z. All authors have read and agreed to the published version of the manuscript.
Funding
This research was funded by “National Key Research and Development Plan Program”, grant number No. 2024YFD2200900, “the Fundamental Research Funds for the Central Universities” No. QNTD202503, and “Beijing-Tianjin-Hebei ecological first breakthrough in the construction and operation of science and technology collaborative innovation center” grant number No. 2024132042.
Data Availability Statement
The dataset is available on request from the authors.
Conflicts of Interest
The authors declare no conflicts of interest.
Abbreviations
The following abbreviations are used in this manuscript:
| WEF Nexus | Water–Energy–Food Nexus |
| EAI | explainable artificial intelligence |
| WY | Water Yield |
| FP | Food Production |
| CS | Carbon Storage |
| SC | Soil Conservation |
| SHAP | SHapley Additive exPlanations |
| DEM | Digital Elevation Model |
| EVA | Annual average evapotranspiration |
| FVC | Fractional Vegetation Cover |
| MAP | Mean Annual Precipitation |
| TEM | Average annual temperature |
| CRO | Cropland distribution |
| HFP | Human Footprint |
| NIL | Night Light Index |
| GDP | Gross Domestic Product |
| POP | Population Density |
| DH | Distance from highway |
| DR | Distribution of Building Sites |
| DBS | Distribution of Building Sites |
| SDNs | Supply–Demand Networks |
References
- Gu, W.; Wang, F.; Siebert, S.; Kummu, M.; Wang, X.; Hong, C.; Zhou, F.; Zhu, Q.; Liu, Y.; Qin, Y. The asymmetric impacts of international agricultural trade on water use scarcity, inequality and inequity. Nat. Water 2024, 2, 324–336. [Google Scholar] [CrossRef]
- Geng, J.B.; Ji, Q. Multi-perspective analysis of China’s energy supply security. Energy 2014, 64, 541–550. [Google Scholar] [CrossRef]
- Lu, D.; Wang, Z.P.; Su, K.C.; Zhou, Y.J.; Li, X.X.; Lin, A.W. Understanding the impact of cultivated land-use changes on China’s grain production potential and policy implications: A perspective of non-agriculturalization, non-grainization, and marginalization. J. Clean. Prod. 2024, 436, 140647. [Google Scholar] [CrossRef]
- Zhang, G.Z.; Li, X.; Zhang, L.Y.; Wei, X.D. Dynamics and causes of cropland Non-Agriculturalization in typical regions of China: An explanation Based on interpretable Machine learning. Ecol. Indic. 2024, 166, 112348. [Google Scholar] [CrossRef]
- Ding, T.H.; Chen, J.F.; Fang, L.P.; Ji, J.; Fang, Z. Urban ecosystem services supply-demand assessment from the perspective of the water-energy-food nexus. Sustain. Cities Soc. 2023, 90, 104401. [Google Scholar] [CrossRef]
- Dang, H.; Li, J.; Zhou, Z.X. Revealing the supply-demand relationship of urban cultural ecosystem services: The combination of open-source spatial model and topic model. Appl. Geogr. 2024, 167, 103288. [Google Scholar] [CrossRef]
- Kuang, Y.Z.; Guo, X.Y.; Hu, J.R.; Li, S.; Zhang, R.J.; Gao, Q.; Yang, X.; Chen, Q.; Sun, W.L. Occurrence and risks of antibiotics in an urban river in northeastern Tibetan Plateau. Sci. Rep. 2020, 10, 20054. [Google Scholar] [CrossRef]
- Li, L.; Yan, M.X.; Hong, Y.X.; Feng, W.J.; Xie, D.; Pagani-Nunez, E. Protecting China’s major urban bird diversity hotspots. AMBIO 2024, 53, 339–350. [Google Scholar] [CrossRef]
- Grekousis, G.; Feng, Z.X.; Marakakis, I.; Lu, Y.; Wang, R.Y. Ranking the importance of demographic, socioeconomic, and underlying health factors on US COVID-19 deaths: A geographical random forest approach. Health Place 2022, 74, 102744. [Google Scholar] [CrossRef]
- Honjo, K.; Gomi, K.; Kanamori, Y.; Takahashi, K.; Matsuhashi, K. Long-term projections of economic growth in the 47 prefectures of Japan: An application of Japan shared socioeconomic pathways. Heliyon 2021, 7, e06412. [Google Scholar] [CrossRef]
- Jia, Q.Q.; Jiao, L.M.; Lian, X.H.; Wang, W.L. Linking supply-demand balance of ecosystem services to identify ecological security patterns in urban agglomerations. Sustain. Cities Soc. 2023, 92, 104497. [Google Scholar] [CrossRef]
- Chen, K.; Liu, X.; Zhang, X.; Ding, L. Spatiotemporal distribution and evolution pattern of Chinese Go League clubs in 20 years of professionalism. Front. Sports Act. Living 2023, 5, 1061751. [Google Scholar] [CrossRef]
- He, M.; Li, W.C.; Sun, D.M.; Ma, K.J.; Zhao, Z.Q.; Li, B.X.; Li, L. Epitome of China’s Unnatural Deaths A Historically Retrospective Study of Forensic Autopsy Cases in Shanghai Public Security Bureau From 1990 to 1999. Am. J. Forensic Med. Pathol. 2014, 35, 218–221. [Google Scholar] [CrossRef]
- Tang, J.T.; Xu, L.Y.; Yu, H.B.; Jiang, H.Z.S.; He, D.J.; Li, T.S.; Xiao, W.C.; Zheng, X.Y.; Liu, K.Y.; Li, Y.Q.; et al. A dataset of multi-level street-block divisions of 985 cities worldwide. Sci. Data 2025, 12, 456. [Google Scholar] [CrossRef]
- Wyatt, K.H.; Griffin, R.; Guerry, A.D.; Ruckelshaus, M.; Fogarty, M.; Arkema, K.K. Habitat risk assessment for regional ocean planning in the US Northeast and Mid-Atlantic. PLoS ONE 2017, 12, e0188776. [Google Scholar] [CrossRef] [PubMed]
- Zhang, H.; Song, T.; Zheng, J.H.; Mei, Y.Z.; Cheng, J.H.; Wang, R.Y. Evolution and drivers of green total factor productivity network structure in the Yangtze River economic belt from the perspective of urban agglomerations. Environ. Sustain. Indic. 2025, 26, 100644. [Google Scholar] [CrossRef]
- Martinez-Hernandez, E.; Leach, M.; Yang, A.D. Understanding water-energy-food and ecosystem interactions using the nexus simulation tool NexSym. Appl. Energy 2017, 206, 1009–1021. [Google Scholar] [CrossRef]
- Liu, L.F.; Wang, J.L.; Li, J.; He, S.L.; Lan, Y.C.; Liu, F. Evaluation of Ecosystem Service Capacity Using the Integrated Ecosystem Services Index at Optimal Scale in Central Yunnan, China. Ecol. Evol. 2025, 15, e71222. [Google Scholar] [CrossRef]
- Naidoo, D.; Nhamo, L.; Mpandeli, S.; Sobratee, N.; Senzanje, A.; Liphadzi, S.; Slotow, R.; Jacobson, M.; Modi, A.T.; Mabhaudhi, T. Operationalising the water-energy-food nexus through the theory of change. Renew. Sustain. Energy Rev. 2021, 149, 111416. [Google Scholar] [CrossRef]
- Ding, T.H.; Chen, J.F. Evaluating supply-demand matching of ecosystem services considering water-energy-food nexus and synergies/trade-offs in the Hangzhou of China. Environ. Sci. Pollut. Res. 2023, 30, 54568–54585. [Google Scholar] [CrossRef]
- Ding, T.H.; Chen, J.F.; Fang, L.P.; Ji, J. Identifying and optimizing ecological security patterns from the perspective of the water-energy-food nexus. J. Hydrol. 2024, 632, 130912. [Google Scholar] [CrossRef]
- Tan, Z.W.; Li, H.; Song, Q.R.; Wang, Z.C.; Cao, Y.Q. Synergistic optimization and interaction evaluation of water-energy-food-ecology nexus under uncertainty from the perspective of urban agglomeration. Sustain. Cities Soc. 2025, 124, 106291. [Google Scholar] [CrossRef]
- Yang, W.; Chen, J.; Ding, T.; Yan, X.; Gong, W. Supply-demand security assessment of water-energy-food systems: A perspective on intra-city coupling and inter-city linkages of ecosystem services. Sustain. Cities Soc. 2024, 117, 105964. [Google Scholar] [CrossRef]
- Wang, K.; Li, X.; Lyu, X.; Dang, D.; Cao, W.; Du, Y. Unraveling the complex interconnections between food-energy-water nexus sustainability and the supply-demand of related ecosystem services. J. Environ. Manag. 2024, 370, 122532. [Google Scholar] [CrossRef]
- Yin, D.Y.; Yu, H.C.; Shi, Y.Y.; Zhao, M.Y.; Zhang, J.; Li, X.S. Matching supply and demand for ecosystem services in the Yellow River Basin, China: A perspective of the water-energy-food nexus. J. Clean. Prod. 2023, 384, 135469. [Google Scholar] [CrossRef]
- Fan, C.H.; Lin, C.Y.; Hu, M.C. Empirical Framework for a Relative Sustainability Evaluation of Urbanization on the Water-Energy-Food Nexus Using Simultaneous Equation Analysis. Int. J. Environ. Res. Public Health 2019, 16, 901. [Google Scholar] [CrossRef]
- Li, Y.Y.; Wei, M.; Zhou, R.; Jin, H.; Chen, Y.S.; Hong, C.J.; Duan, W.T.; Li, Q.Y. Identifying priority restoration areas based on ecological security pattern: Implications for ecological restoration planning. Ecol. Indic. 2025, 174, 113486. [Google Scholar] [CrossRef]
- Sun, D.; Wu, X.; Wen, H.; Ma, X.; Zhang, F.; Ji, Q.; Zhang, J. Ecological Security Pattern based on XGBoost-MCR model: A case study of the Three Gorges Reservoir Region. J. Clean. Prod. 2024, 470, 143252. [Google Scholar] [CrossRef]
- Luo, K.; Wang, H.; Yan, X.; Yi, S.; Wang, C.; Lei, C. Integrating CVOR and circuit theory models to construct and reconstruct ecological networks: A case study from the Tacheng-Emin Basin, China. Ecol. Indic. 2024, 165, 112170. [Google Scholar] [CrossRef]
- Huang, H.; Fu, D.L.; Ding, G.C.; Yan, C.; Xie, X.C.; Gao, Y.L.; Liu, Q.Y. Construction and optimization of Green Infrastructure Network in mountainous cities: A case study of Fuzhou, China. Sci. Rep. 2024, 14, 11936. [Google Scholar] [CrossRef] [PubMed]
- Muhirwa, F.; Li, L.; Laspidou, C. Global ecosystem sustainability indexing and patterns in the success of SDGs of water, energy and food security. J. Clean. Prod. 2025, 516, 145830. [Google Scholar] [CrossRef]
- Mouillot, D.; Velez, L.; Albouy, C.; Casajus, N.; Claudet, J.; Delbar, V.; Devillers, R.; Letessier, T.B.; Loiseau, N.; Manel, S.; et al. The socioeconomic and environmental niche of protected areas reveals global conservation gaps and opportunities. Nat. Commun. 2024, 15, 9007. [Google Scholar] [CrossRef]
- Tang, H.; Peng, J.; Jiang, H.; Lin, Y.F.; Xu, D.M. Trade-off between comprehensive and specific ecosystem characteristics conservation in ecological security pattern construction. Glob. Ecol. Conserv. 2024, 49, e02776. [Google Scholar] [CrossRef]
- Wang, M.; Li, Y.X.; Yuan, H.J.; Zhou, S.Q.; Wang, Y.K.; Ikram, R.M.A.; Li, J.J. An XGBoost-SHAP approach to quantifying morphological impact on urban flooding susceptibility. Ecol. Indic. 2023, 156, 111137. [Google Scholar] [CrossRef]
- Zhang, C.C.; Zhou, Y.Y.; Lu, F.; Liu, J.W.; Zhang, J.Y.; Yin, Z.Y.; Ji, M.Y.; Li, B.Q. Assessing the performance and interpretability of the CNN-LSTM-Attention model for daily streamflow forecasting in typical basins of the eastern Qinghai-Tibet Plateau. Sci. Rep. 2025, 15, 82. [Google Scholar] [CrossRef] [PubMed]
- Zhang, P.; Wang, Y.; Ma, W.J.; Li, M.Y.; Zhao, Y.H.; Wang, W.T.; Jia, Y.F.; Fan, J.H.; Kong, L.F.; Hou, K.; et al. Identifying the determinants of natural, anthropogenic factors and precursors on PM1 pollution in urban agglomerations in China: Insights from optimal parameter-based geographic detector and robust geographic weighted regression models. Environ. Res. 2025, 279, 121817. [Google Scholar] [CrossRef] [PubMed]
- Ren, J.Y.; Wang, W.J.; Fei, L.; Wang, L.; Xing, S.F.; Cong, Y. Impacts of climate change and land Use/Cover change on ecological security networks in Changbai Mountains, Northeast China. Ecol. Indic. 2024, 169, 112849. [Google Scholar] [CrossRef]
- Li, K.; Liu, Z.; Shi, S.; Di, K.; Gong, W.; Li, H. The driving effect of polycentric city network on the coordinated development of regional economy in Bohai Rim region of China. Heliyon 2024, 10, e40173. [Google Scholar] [CrossRef]
- Wu, Y.Y.; Wang, P.; Liu, X.; Chen, J.D.; Song, M.L. Analysis of regional carbon allocation and carbon trading based on net primary productivity in China. China Econ. Rev. 2020, 60, 101401. [Google Scholar] [CrossRef]
- Yan, S.W.; Chen, H.; Quan, Q.; Liu, J. Evolution and coupled matching of ecosystem service supply and demand at different spatial scales in the Shandong Peninsula urban agglomeration, China. Ecol. Indic. 2023, 155, 111052. [Google Scholar] [CrossRef]
- Hou, X.; Li, J.; Li, H.; Du, S.; Liu, S.; Jiao, S.; Niu, F.; Tu, J.; Zong, Y.; Wang, X.; et al. Microplastics distribution, ecological risk and outflows of rivers in the Bohai Rim region of China- A flux model considering small and medium-sized rivers. Sci. Total Environ. 2024, 953, 176035. [Google Scholar] [CrossRef]
- Bao, C.; He, D.M. Scenario Modeling of Urbanization Development and Water Scarcity Based on System Dynamics: A Case Study of Beijing-Tianjin-Hebei Urban Agglomeration, China. Int. J. Environ. Res. Public Health 2019, 16, 3834. [Google Scholar] [CrossRef] [PubMed]
- Bi, S.; Li, Z.; Chen, Y.; Zhang, Q.; Ye, T. Identification of priority conservation areas in Beijing-Tianjin-Hebei using multi-scenario trade-offs based on different spatial scales and their drivers. Ecol. Indic. 2024, 166, 112508. [Google Scholar] [CrossRef]
- Zheng, Y.X.; Hong, J.K.; Xiao, C.L.; Li, Z.M. Unfolding the synergy and interaction of water-land-food nexus for sustainable resource management: A supernetwork analysis. Sci. Total Environ. 2021, 784, 147085. [Google Scholar]
- Ying, W.J.; Li, C.F.; Yang, L.; Hua, L.J.; Zhang, H.; Wang, R.Z.; Wang, J.Y. Global potential of continuous sorption-based atmospheric water harvesting. iScience 2025, 28, 112160. [Google Scholar] [CrossRef] [PubMed]
- Chaiya, C. Empowering climate resilience: A people-centered exploration of Thailand’s greenhouse gas emissions trading and sustainable environmental development through climate risk management in community forests. Heliyon 2025, 11, e41844. [Google Scholar] [CrossRef]
- Deng, H.M.; Wang, C.; Cai, W.J.; Liu, Y.; Zhang, L.X. Managing the water-energy-food nexus in China by adjusting critical final demands and supply chains: An input-output analysis. Sci. Total Environ. 2020, 720, 137635. [Google Scholar] [CrossRef]
- Chang, Y.W.; Wang, Y.P.; Yuan, L.; Yao, X.Y.; Zhang, R.H.; Liu, X.; Fan, Z.F.; Guo, J.Y. Spatial scale effects on the trade-offs and synergies of ecosystem services in China’s Huaihe river basin. Sci. Rep. 2025, 15, 22301. [Google Scholar] [CrossRef]
- Yang, J.J.; Chen, Z.; Zhang, W.F.; Meng, G.T.; Cao, M.; Li, J.H.; Xu, C.L.; Wu, R.D.; Leng, H.T.; Wen, Q.Z.; et al. Relationships among multiple ecosystem services in mountainous regions: A case study of the Gaoligong Mountains. J. Environ. Manag. 2025, 387, 125765. [Google Scholar] [CrossRef]
- Zhang, Y.W.; Wang, K.B.; Wang, J.; Liu, C.H.; Shangguan, Z.P. Changes in soil water holding capacity and water availability following vegetation restoration on the Chinese Loess Plateau. Sci. Rep. 2021, 11, 9692. [Google Scholar] [CrossRef]
- Huang, Y.; Gan, X.Y.; Niu, S.F.; Hao, D.S.; Zhou, B. Incorporating Ecosystem Service Multifunctionality and Its Response to Urbanization to Identify Coordinated Economic, Societal, and Environmental Relationships in China. Forests 2022, 13, 707. [Google Scholar] [CrossRef]
- Srivathsa, A.; Vasudev, D.; Nair, T.; Chakrabarti, S.; Chanchani, P.; DeFries, R.; Deomurari, A.; Dutta, S.; Ghose, D.; Goswami, V.R.; et al. Prioritizing India’s landscapes for biodiversity, ecosystem services and human well-being. Nat. Sustain. 2023, 6, 568–577. [Google Scholar] [CrossRef]
- Tang, H.; Peng, J.; Jiang, H.; Lin, Y.F.; Dong, J.Q.; Liu, M.L.; Meersmans, J. Spatial analysis enables priority selection in conservation practices for landscapes that need ecological security. J. Environ. Manag. 2023, 345, 118888. [Google Scholar] [CrossRef] [PubMed]
- Li, X.Q.; Zhu, J.J.; Lyu, X.; Sun, Y.Y.; Tan, C.D.; Zhang, B.; Tarolli, P.; Yang, Q.C. An integrative conservation and management strategy based on biological and cultural diversity assessment: A case study of Miaoling mountainous region, China. Ecol. Indic. 2025, 171, 113187. [Google Scholar] [CrossRef]
- Qiao, B.; Yang, H.; Cao, X.; Zhou, B.; Wang, N.A. Driving mechanisms and threshold identification of landscape ecological risk: A nonlinear perspective from the Qilian Mountains, China. Ecol. Indic. 2025, 173, 113342. [Google Scholar] [CrossRef]
- Xiao, Z.L.; Liu, R.; Gao, Y.H.; Yang, Q.Y.; Chen, J.L. Spatiotemporal variation characteristics of ecosystem health and its driving mechanism in the mountains of southwest China. J. Clean. Prod. 2022, 345, 131138. [Google Scholar] [CrossRef]
- An, Q.; Yuan, X.; Zhang, X.; Yang, Y.; Chen, J.; An, J. Spatio-temporal interaction and constraint effects between ecosystem services and human activity intensity in Shaanxi Province, China. Ecol. Indic. 2024, 160, 111937. [Google Scholar] [CrossRef]
- Chen, Y.; Xiong, K.N.; Luo, L.; Zhang, S.H.; Chen, J.Y. Promoting ecological conservation through multi-objective ecological early warning and network regulation in the Karst Plateau, China. J. Environ. Manag. 2025, 385, 125635. [Google Scholar] [CrossRef]
- Jiang, J.W.; Cai, J.W.; Peng, R.; Li, P.H.; Chen, W.R.; Xia, Y.N.; Deng, J.S.; Zhang, Q.Y.; Yu, Z.L. Establishment and optimization of urban ecological network based on ecological regulation services aiming at stability and connectivity. Ecol. Indic. 2024, 165, 112217. [Google Scholar] [CrossRef]
- Zhou, G.; Huan, Y.; Wang, L.; Lan, Y.; Liang, T.; Shi, B.; Zhang, Q. Linking ecosystem services and circuit theory to identify priority conservation and restoration areas from an ecological network perspective. Sci. Total Environ. 2023, 873, 162261. [Google Scholar] [CrossRef]
- Zuo, Q.; Zhou, Y.; Liu, J.Y. Construction and Optimization Strategy of an Ecological Network in Mountainous Areas: A Case Study in Southwestern Hubei Province, China. Int. J. Environ. Res. Public Health 2022, 19, 9582. [Google Scholar] [CrossRef]
- Shen, J.S.; Li, S.C.; Liu, L.B.; Liang, Z.; Wang, Y.Y.; Wang, H.; Wu, S.Y. Uncovering the relationships between ecosystem services and social- ecological drivers at different spatial scales in the Beijing-Tianjin-Hebei region. J. Clean. Prod. 2021, 290, 125193. [Google Scholar] [CrossRef]
- Wang, S.; Chen, Y.; Jin, H.; Li, Y. Ecological management zoning based on the causation between ecological risk and ecosystem services in the Gaoligong Mountain. Ecol. Indic. 2024, 167, 112673. [Google Scholar] [CrossRef]
- Li, J.; Pan, N.H.; Yao, Y.; Li, G.; Cheng, Z.Y.; Lu, Y.H.; Liu, S.N.; Liu, W.M. Coupled zoning and spatial heterogeneity of human activities and natural endowments based on self-organizing map and random forest: A case study of the agro-pastoral ecotone in Gansu, China. Ecol. Inform. 2024, 82, 102686. [Google Scholar] [CrossRef]
- Huang, C.Y.; Liu, K.; Ma, T.Y.; Xue, H.; Wang, P.F.; Li, L. Analysis of the impact mechanisms and driving factors of urban spatial morphology on urban heat islands. Sci Rep 2025, 15, 18589. [Google Scholar] [CrossRef] [PubMed]
- Huang, X.B.; Liu, X.S.; Jin, Y.H.; Gao, X.; Chen, Y.L. Identification and attribution analysis of integrated ecological zones based on the XGBoost-SHAP model: A case study of Chengdu, China. Ecol. Indic. 2025, 177, 113787. [Google Scholar] [CrossRef]
- Yang, T.W.; Chandio, A.A.; Zhang, A.P.; Liu, Y. Do Farm Subsidies Effectively Increase Grain Production? Evidence from Major Grain-Producing Regions of China. Foods 2023, 12, 1435. [Google Scholar] [CrossRef]
- Qi, R.; Li, J.; Lin, Z.; Li, Z.; Li, Y.; Yang, X.; Zhang, J.; Zhao, B. Temperature effects on soil organic carbon, soil labile organic carbon fractions, and soil enzyme activities under long-term fertilization regimes. Appl. Soil Ecol. 2016, 102, 36–45. [Google Scholar] [CrossRef]
- Wang, J.; Bai, Y.; Huang, Z.D.; Ashraf, A.; Ali, M.; Fang, Z.; Lu, X. Identifying ecological security patterns to prioritize conservation and restoration:A case study in Xishuangbanna tropical region, China. J. Clean. Prod. 2024, 444, 141222. [Google Scholar] [CrossRef]
- Xue, J.; Li, Z.X.; Feng, Q.; Gui, J.; Zhang, B.J. Spatiotemporal variations of water conservation and its influencing factors in ecological barrier region, Qinghai-Tibet Plateau. J. Hydrol. Reg. Stud. 2022, 42, 101164. [Google Scholar] [CrossRef]
- Xia, C.H.; Ma, D.H.; Wang, W.; Guo, X.D. Research on identification and zoning control of territorial spatial risk pattern based on deep learning: A case study of Shenzhen, China. J. Clean. Prod. 2024, 481, 144132. [Google Scholar] [CrossRef]
- Yuan, L.G.; Geng, M.M.; Li, F.; Xie, Y.H.; Tian, T.; Chen, Q. Spatiotemporal characteristics and drivers of ecosystem service interactions in the Dongting Lake Basin. Sci. Total Environ. 2024, 926, 172012. [Google Scholar] [CrossRef] [PubMed]
- Xie, A.Y.; Zhang, F.T.; Ding, Y.K.; Chen, J.; Yang, P.R.; Peng, G.C. Exploring the Dynamic Local and Tele-Coupling Coordination Mechanism of the Ecosystem Services Supply-Demand and Its Driving Forces: Taking China’s Yangtze River Economic Belt as an Example. Land Degrad. Dev. 2025, 36, 3178–3193. [Google Scholar] [CrossRef]
- Jiang, W.; Shu, Z.G.; Lv, Y.H.; Su, X.K.; Wu, X.; Wang, C.; Wang, K.; Sun, S.Q.; Liu, G.H. Quantifying impacts of climate and land use changes on ecosystem services from statistic perspective. Ecol. Indic. 2025, 172, 113285. [Google Scholar] [CrossRef]
- Wu, B.W.; Zhang, Y.Y.; Wang, Y.; He, Y.M.; Wang, J.W.; Wu, Y.F.; Lin, X.B.; Wu, S.D. Mitigation of urban heat island in China (2000–2020) through vegetation-induced cooling. Sustain. Cities Soc. 2024, 112, 105599. [Google Scholar] [CrossRef]
- Cao, X.; Wang, H.; Zhang, B.; Liu, J.; Yang, J. Sustainable management of land use patterns and water allocation for coordinated multidimensional development. J. Clean. Prod. 2024, 457, 142412. [Google Scholar] [CrossRef]
- Hong, W.; Ma, T.; Guo, R.; Yang, X.; Li, X.; Sun, M.; Chen, Y.; Zhong, Y. Carbon emission characteristics of urban trip based on multi-layer network modeling. Appl. Geogr. 2023, 159, 103091. [Google Scholar] [CrossRef]
- Jiang, X.; Jiang, Z.Y.; Li, Z.Y.; Su, J.; Tang, L.N.; Wu, M.D.; Wang, Y.J. A framework for the construction of effective landscape ecological network with integrating hydrological connectivity: A case study in Dongjiang River Basin, China. J. Environ. Manag. 2025, 376, 124509. [Google Scholar] [CrossRef]
- Zhao, Z.-T.; Cheng, H.-M.; Wang, S.; Liu, H.-Y.; Song, Z.-M.; Zhou, J.-H.; Pang, J.-W.; Bai, S.-W.; Yang, S.-S.; Ding, J.; et al. SCC-UEFAS, an urban-ecological-feature based assessment system for sponge city construction. Environ. Sci. Ecotechnol. 2022, 12, 100188. [Google Scholar] [CrossRef]
- An, S.; Song, Y.; Fu, Q.; Qi, R.; Wu, Z.; Ge, F.; Lu, X.; An, W.; Han, W. Reclaimed water use improved polluted water’s self-purification capacity--Evidenced by water quality factors and bacterial community structure. J. Clean. Prod. 2023, 386, 135736. [Google Scholar] [CrossRef]
- Wang, J.W.; Dai, H.N.; Feng, H.X.; Guo, M.; Zylianov, V.; Feng, Z.K.; Cui, J.P. Carbon emission of urban vehicles based on carbon emission factor correlation analysis. Sci. Rep. 2025, 15, 2037. [Google Scholar] [CrossRef]
- Faiz-ul Islam, S.; Sander, B.O.; Quilty, J.R.; de Neergaard, A.; van Groenigen, J.W.; Jensen, L.S. Mitigation of greenhouse gas emissions and reduced irrigation water use in rice production through water-saving irrigation scheduling, reduced tillage and fertiliser application strategies. Sci. Total Environ. 2020, 739, 140215. [Google Scholar] [CrossRef] [PubMed]
- Yu, H.; Shao, C.F.; Wang, X.J.; Hao, C.X. Transformation Path of Ecological Product Value and Efficiency Evaluation: The Case of the Qilihai Wetland in Tianjin. Int. J. Environ. Res. Public Health 2022, 19, 14575. [Google Scholar] [CrossRef] [PubMed]
- Wang, Y.; Wang, H.; Liu, G.; Zhang, J.; Fang, Z. Factors driving water yield ecosystem services in the Yellow River Economic Belt, China: Spatial heterogeneity and spatial spillover perspectives. J. Environ. Manag. 2022, 317, 115477. [Google Scholar] [CrossRef] [PubMed]
- Duolaiti, X.; Kasimu, A.; Reheman, R.; Aizizi, Y.; Wei, B. Assessment of Water Yield and Water Purification Services in the Arid Zone of Northwest China: The Case of the Ebinur Lake Basin. Land 2023, 12, 533. [Google Scholar] [CrossRef]
- Xia, P.; Chen, B.; Gong, B.; Liu, Z.; He, C.; Wang, Y. The supply and demand of water purification service in an urbanizing basin on the Tibetan Plateau. Landsc. Ecol. 2022, 37, 1937–1955. [Google Scholar] [CrossRef]
- An, Z.; Sun, C.; Hao, S. Exploration of ecological compensation standard: Based on ecosystem service flow path. Appl. Geogr. 2025, 178, 103588. [Google Scholar] [CrossRef]
- Lu, Z.; Li, W.; Yue, R. Investigation of the long-term supply-demand relationships of ecosystem services at multiple scales under SSP-RCP scenarios to promote ecological sustainability in China’s largest city cluster. Sustain. Cities Soc. 2024, 104, 105295. [Google Scholar] [CrossRef]
- Su, R.; Duan, C.; Chen, B. The shift in the spatiotemporal relationship between supply and demand of ecosystem services and its drivers in China. J. Environ. Manag. 2024, 365, 121698. [Google Scholar] [CrossRef]
- Liu, W.; Zhan, J.; Zhao, F.; Zhang, F.; Teng, Y.; Wang, C.; Chu, X.; Kumi, M.A. The tradeoffs between food supply and demand from the perspective of ecosystem service flows: A case study in the Pearl River Delta, China. J. Environ. Manag. 2022, 301, 113814. [Google Scholar] [CrossRef]
- Ma, Y.; Chen, H.; Yang, M.; Zhang, J.; Wang, J.; Huang, J. Assessment of supply-demand relationships considering the interregional flow of ecosystem services. Environ. Sci. Pollut. Res. Int. 2024, 31, 27710–27729. [Google Scholar] [CrossRef]
- Liu, S.; Wang, Z.; Kumilamba, G.; Yu, L. Optimizing green space configuration for mitigating land surface temperature: A case study of karst mountainous cities. Sustain. Cities Soc. 2025, 125, 106345. [Google Scholar] [CrossRef]
- Luo, L.; Wu, Y.; Li, S.; Li, F.; Wang, X.; Wei, X. Identifying the Most Critical Predictors of Workplace Violence Experienced by Junior Nurses: An Interpretable Machine Learning Perspective. J. Nurs. Manag. 2025, 2025, 40223873. [Google Scholar] [CrossRef]
Disclaimer/Publisher’s Note: The statements, opinions and data contained in all publications are solely those of the individual author(s) and contributor(s) and not of MDPI and/or the editor(s). MDPI and/or the editor(s) disclaim responsibility for any injury to people or property resulting from any ideas, methods, instructions or products referred to in the content. |
© 2025 by the authors. Licensee MDPI, Basel, Switzerland. This article is an open access article distributed under the terms and conditions of the Creative Commons Attribution (CC BY) license (https://creativecommons.org/licenses/by/4.0/).