Article

Spatiotemporal Variations and Driving Forces of Ecosystem Service Value: A Case Study of the Yellow River Basin

1
College of Geography and Environment, Shandong Normal University, Jinan 250358, China
2
The Yellow River Civilization and the Sustainable Development of Henan University Research Center, Kaifeng 475000, China
*
Author to whom correspondence should be addressed.
Land 2025, 14(9), 1907; https://doi.org/10.3390/land14091907
Submission received: 15 August 2025 / Revised: 11 September 2025 / Accepted: 17 September 2025 / Published: 18 September 2025

Abstract

Accurate assessment of ecosystem service value (ESV) is crucial for sustainable environmental management, especially in regions with high ecological sensitivity and significant socioeconomic importance. This study focuses on the Yellow River Basin and integrates the land-use transition matrix, equivalent factor method, ecosystem service trade-off and synergy analysis, and the optimized parameters geographical detector to analyze the spatiotemporal evolution and driving mechanisms of ESV from 2000 to 2023. The results show that (1) cropland and grassland are the main land-use types in the Yellow River Basin, and during rapid urbanization, the expansion of construction land mainly comes at the expense of cropland and grassland. (2) the total ESV in the basin has steadily increased, with grassland as the primary contributor among land types; regulating services, particularly hydrological regulation, are the core ecosystem services in terms of supply, regulation, support, and cultural functions. (3) High-ESV areas in the eastern and central parts of the basin have expanded over time, exhibiting a spatial pattern of higher values in the west and lower in the east, distributed mainly along the river, with clustering effects gradually weakening. (4) Ecosystem services demonstrated predominantly synergistic relationships, suggesting potential for integrated ecosystem management. (5) Population density, DEM, mean annual temperature, and slope are the dominant factors influencing spatial variation in ESV, with the combined effects of topography and climate significantly enhancing the explanation of ESV heterogeneity. This study deepens the understanding of the evolutionary mechanisms of ecosystem services in the Yellow River Basin and provides scientific support and decision-making references for regional ecological compensation mechanisms, optimized land resource allocation, and watershed ecosystem management.

1. Introduction

Ecosystem services refer to the diverse advantages conferred by natural ecosystems. These services are vital for human welfare and economic development [1]. In the past century, approximately 60% of ecosystem services experienced significant degradation [2]. This degradation primarily results from intensified human activities causing environmental degradation of land surfaces, extensive land-use changes, and substantial impairment of ecosystem functions [3]. Ecosystem service value (ESV) serves as an essential indicator of ecosystem functions [4]. With increasing population and resource demands, systematic and scientific assessment of ESV holds substantial significance for effective resource conservation, rational resource utilization, and stability and sustainability of watershed ecosystems [5,6].
Research on ecosystem services at the international level started in the 1960s, and this marked the beginning of a broader understanding of their importance [7,8]. Interest in the field grew significantly after key conceptual and theoretical frameworks were introduced by Daily [9] and Costanza [1]. Based on these foundational frameworks, Chinese scholar Xie Gaodi proposed an ecosystem equivalent factor table tailored to China’s conditions. This table facilitates the rapid estimation of ESV [10,11]. Current methods to assess ESV include the functional value method [12], equivalent factor method (EFM) [13], supply-demand balance method [14], production function method [15], and benefit-transfer method [16]. In terms of assessment models, ARIES [17], SoLVES [18], and InVEST [19] represent the main tools. Regarding spatial scales, global, national [20,21], regional, provincial, municipal [22,23,24,25], and various grid-based medium-scale studies [26] have been conducted. As to ecosystem types, the primary focus has included forests and woodlands, grasslands, wetlands, marine, and other aquatic ecosystems, which together represent the major providers of global ecosystem services [4,27,28,29]. Existing research primarily emphasizes the spatiotemporal evolution trends of ESV, trade-offs and synergies between ecosystem services, multi-scenario simulation forecasting, and identification of driving factors [30,31,32]. Although previous studies have examined different ecosystems such as grasslands and forests, research on ecosystem service functions at the basin scale remains relatively limited. Existing studies have mainly focused on the trade-offs and synergies among ecosystem services and the identification and analysis of their driving factors and influencing mechanisms. Furthermore, conventional models, including geographically weighted regression, regression analysis, and correlation analysis, have frequently been employed to examine factors influencing the spatial variations in ESV [14,33]. However, these methods exhibit limitations in accurately identifying nonlinear influences of driving factors and uncovering spatial variation mechanisms of ESV [34].
The Yellow River is crucial for sustaining agricultural production, industrial growth, and energy development, while also serving as a crucial ecological barrier [35]. The Yellow River Basin has faced persistent environmental problems due to prolonged and unsustainable exploitation of natural resources. These challenges manifest as water scarcity, soil erosion, and degradation of land ecosystems. These issues have become major constraints to the region’s pursuit of high-quality and sustainable development [36]. In this context, it is crucial to further inquire into the interactive mechanisms among the driving factors influencing ESV in the Basin. This paper would enhance its ecosystem functions and facilitate integrated, multi-factor management of its ecosystems. In addition, the Yellow River Basin is crucial for strengthening regional ecological security. It also helps in improving ecological protection strategies. Most existing studies on ecosystem services in the Yellow River Basin have revealed the relationships between ecosystem services and driving factors from a spatial perspective, but they are generally conducted at a single scale, neglecting the differences in these relationships across multiple scales. In addition, when applying the traditional geographic detector, previous research often overlooked the importance of discretizing continuous variables, typically relying on expert knowledge or experience for classification. This approach introduces subjectivity and may result in suboptimal discretization, thereby weakening the explanatory power of driving factors. The optimal parameter-based geographic detector (OPGD) addresses this issue by improving the spatial discretization of continuous variables and quantitatively analyzing both the effects of individual factors and their interactions on dependent variables. It thus serves as an efficient tool to test whether spatial stratified heterogeneity exists in geographic phenomena. Moreover, OPGD is particularly suitable for the Yellow River Basin, a typical nature–human coupled system, as it allows for more accurate identification of multidimensional driving factors and their interactions, effectively accommodating its complexity, heterogeneity, and dynamics, thereby demonstrating significant theoretical and practical applicability.
This study utilized the equivalent factor technique to assess the ESV of the Yellow River Basin from 2000 to 2023. Special attention was given to its spatial and temporal variation patterns. This study employed the optimized parameter geographical detector to reveal the spatial variability of driving forces. This enhanced model improves the accuracy of heterogeneity detection, effectively identifying key influencing factors and uncovering the mechanisms behind their interactions. The approach enhances understanding of ecosystem status and its evolution over time. It also clarifies the ecological consequences within the basin. These findings offer a scientific basis for promoting sustainable ecological practices. They also aim to support the broader goal of ecological civilization in the Yellow River Basin and other comparable regions.

2. Materials and Data Sources

2.1. Study Area

The Yellow River starts in the Bayan Har Mountains on the Qinghai–Tibet Plateau, flowing west to east through 448 counties in nine provinces or autonomous territories, and ultimately discharges into the Bohai Sea. The total area covers 54,640 km2, encompassing a drainage area of 795,000 km2. Figure 1 illustrates that the land use types of the Yellow River Basin exhibit a gradient of decreasing height from west to east. The basin has a variety of ecosystems, including forests, grasslands, agricultural plains, marshes, and deserts. The Yellow River Basin, characterized by intricate landforms and varied climatic conditions, functions as a vital ecological barrier and commercial corridor in China; nonetheless, it confronts issues such as soil erosion and ecological deterioration. It was selected as the study area due to its unique ecological, climatic, and socio-economic characteristics. As one of China’s most ecologically sensitive and socioeconomically significant regions, the basin exhibits pronounced spatial heterogeneity in land use, climate gradients, and human activities, making it an ideal system for examining the temporal dynamics of ESV. Moreover, understanding ESV changes in such a complex natural–human coupled system contributes to the international scientific debate on dynamic assessments of ecosystem services, providing insights applicable to other arid and semi-arid river basins worldwide.

2.2. Data Area

The data employed in this study cover the period from 2000 to 2023 and fall into three categories: basic geographic data, remote sensing and related product data, and statistical data. These datasets included the digital elevation model (DEM), land use data, annual average precipitation, Normalized Difference Vegetation Index (NDVI), and Net Primary Productivity (NPP), road network, statistical yearbooks from provinces and municipalities within the study area, and national agricultural cost–benefit compilations (Table 1). Based on data availability and related studies [14,34,37], the driving factors used in the geographic detector model were categorized into natural environmental and socio-economic factors. (1) Natural environmental driving factors included DEM, slope, NDVI, annual average temperature, annual precipitation, and NPP; (2) Socio-economic driving factors included GDP, road network density, population density, and the proportion of construction land. This study used nighttime light datasets to represent and analyze the spatiotemporal changes in regional GDP, thus addressing limitations inherent in traditional GDP statistics [38]. Finally, all raster datasets were standardized to the WGS_1984_Albers coordinate system and resampled to a uniform spatial resolution of 1000 m × 1000 m.

2.3. Methods

2.3.1. Spatiotemporal Analysis of Land Use Changes

This research examined alterations in land usage throughout six specific time periods. The evaluation employed the land-use dynamic degree and transition matrix as primary analytical instruments. Detailed methodologies and corresponding equations are available in Jing [39].

2.3.2. Assessment of ESV

Based on the ecosystem service value equivalence table developed by Xie Gaodi [26], the ecosystem service functions are categorized into 11 types, and the value coefficient for construction land is assumed to be 0. The water supply coefficient of cropland is set as a negative value, reflecting the high dependence of farmland irrigation on water resources and its net consumptive nature. In contrast, the coefficients for water bodies and wetlands are significantly higher, highlighting their critical ecological functions in water conservation, flood regulation, and maintaining hydrological balance. These services are characterized by strong scarcity and irreplaceability [26]. On this basis, the ESV per unit area of different ecosystem types in the Yellow River Basin was calculated. According to the rule that “one standard unit equivalent factor of ESV refers to one-seventh of the annual economic value of food produced by 1 hm2 of farmland” [26], the equivalent factor table was revised by incorporating the average grain yield from 2000 to 2023 and the grain price in 2023. This adjustment eliminates the influence of long-term price fluctuations and ensures inter-annual comparability. Based on this revised equivalent factor table, the ESV per unit area of each ecosystem type in the Yellow River Basin was derived (Table 2), as expressed in the following formula:
ESV a k = S a VC a k
ESV a = k S a VC a k = k ESV a k
ESV = a ESV a
where ESVak represents the ESV of ecosystem k of land type a (yuan); Sa is the area of land type a (hm2); VCak is the ESV coefficient of ecosystem k of land type a (yuan/hm2); ESVa is the ESV of land type a (yuan); and ESV is the total ESV in the study area (yuan).

2.3.3. Sensitivity Analysis

The ecosystem service value coefficients (VCs) are subject to a certain degree of uncertainty, and their accuracy is critical for ESV assessment. Sensitivity (CS) is calculated to quantitatively describe the responsiveness of ESV to changes in the value coefficients, thereby evaluating whether the ESV coefficients are appropriate for the study area. If CS > 1, the ESV is considered elastic with respect to VC, indicating that the results are highly sensitive to the assigned VC and thus less reliable. Conversely, if CS < 1, the ESV shows low elasticity with respect to VC, suggesting that the calculation results are robust and credible [40]. The calculation formula is as follows:
C S = E S V j E S V i / E S V i V C j k V C i k / V C i k
In the formula, CS represents the sensitivity index; ESVi and ESVj denote the initial and adjusted ecosystem service values, respectively; VCik and VCjk refer to the initial and adjusted (±50%) ecosystem service value coefficients.
Sensitivity analysis (Table 3) reveals that the CS of ESV coefficients for all land-use categories are below 1. This indicates that the ESV of land use types over the six eras has negligible sensitivity to fluctuations in VC. The ESV in the studied area is rather stable about the coefficient, reinforcing the dependability of the findings.

2.3.4. Analysis of ES Trade-Offs and Synergies

R corrgram was used to conduct correlation analysis between ecosystem services. A Pearson correlation coefficient r > 0 (p < 0.05) indicates a synergistic relationship. The higher the coefficient, the stronger the synergy. Conversely, r < 0 (p < 0.05) indicates a trade-off relationship, where lower coefficients signify stronger trade-offs. An r = 0 (p < 0.05) suggests no linear relationship.

2.3.5. Spatial Clustering Analysis

Spatial autocorrelation analysis is used to evaluate the similarity or correlation of attribute values across spatial units in geographic data. It helps identify spatial distribution patterns and determine whether there is clustering or dispersion of geographic phenomena [27].
Local Indicators of Spatial Association is a technique that uncovers local spatial patterns within spatial data. It identifies the relationships between specific regions and their neighboring areas by computing the local autocorrelation of each unit and detecting spatial clustering, dispersion, or other localized trends within the region [28].

2.3.6. Optimal Parameters-Based Geographical Detector (OPGD) Model

Geographical detectors can reveal potential influencing factors by detecting spatial variations. They reflect the similarity within a region and the difference between regions, which expose the underlying driving forces behind spatial patterns [41]. A crucial step in employing the geographical detector is determining the correct scale of geographically stratified heterogeneity through spatial data discretization [42]. This research performed an OPGD utilizing the GD package in R. Various classification methods were applied, including equal interval, natural breaks (Jenks), quantile, geometric interval, and standard deviation. The classification levels ranged from 4 to 10, and the parameter combination that had the highest q-value was chosen to discretize the independent variables.
The interaction detector was used to analyze how two factors interact and affect ESV in the Yellow River Basin. Calculating and comparing q-values for each individual factor and their combined effect, the presence, strength, and direction of their interactions were identified.

3. Results and Analysis

3.1. Spatiotemporal Characteristics of Land Use Changes

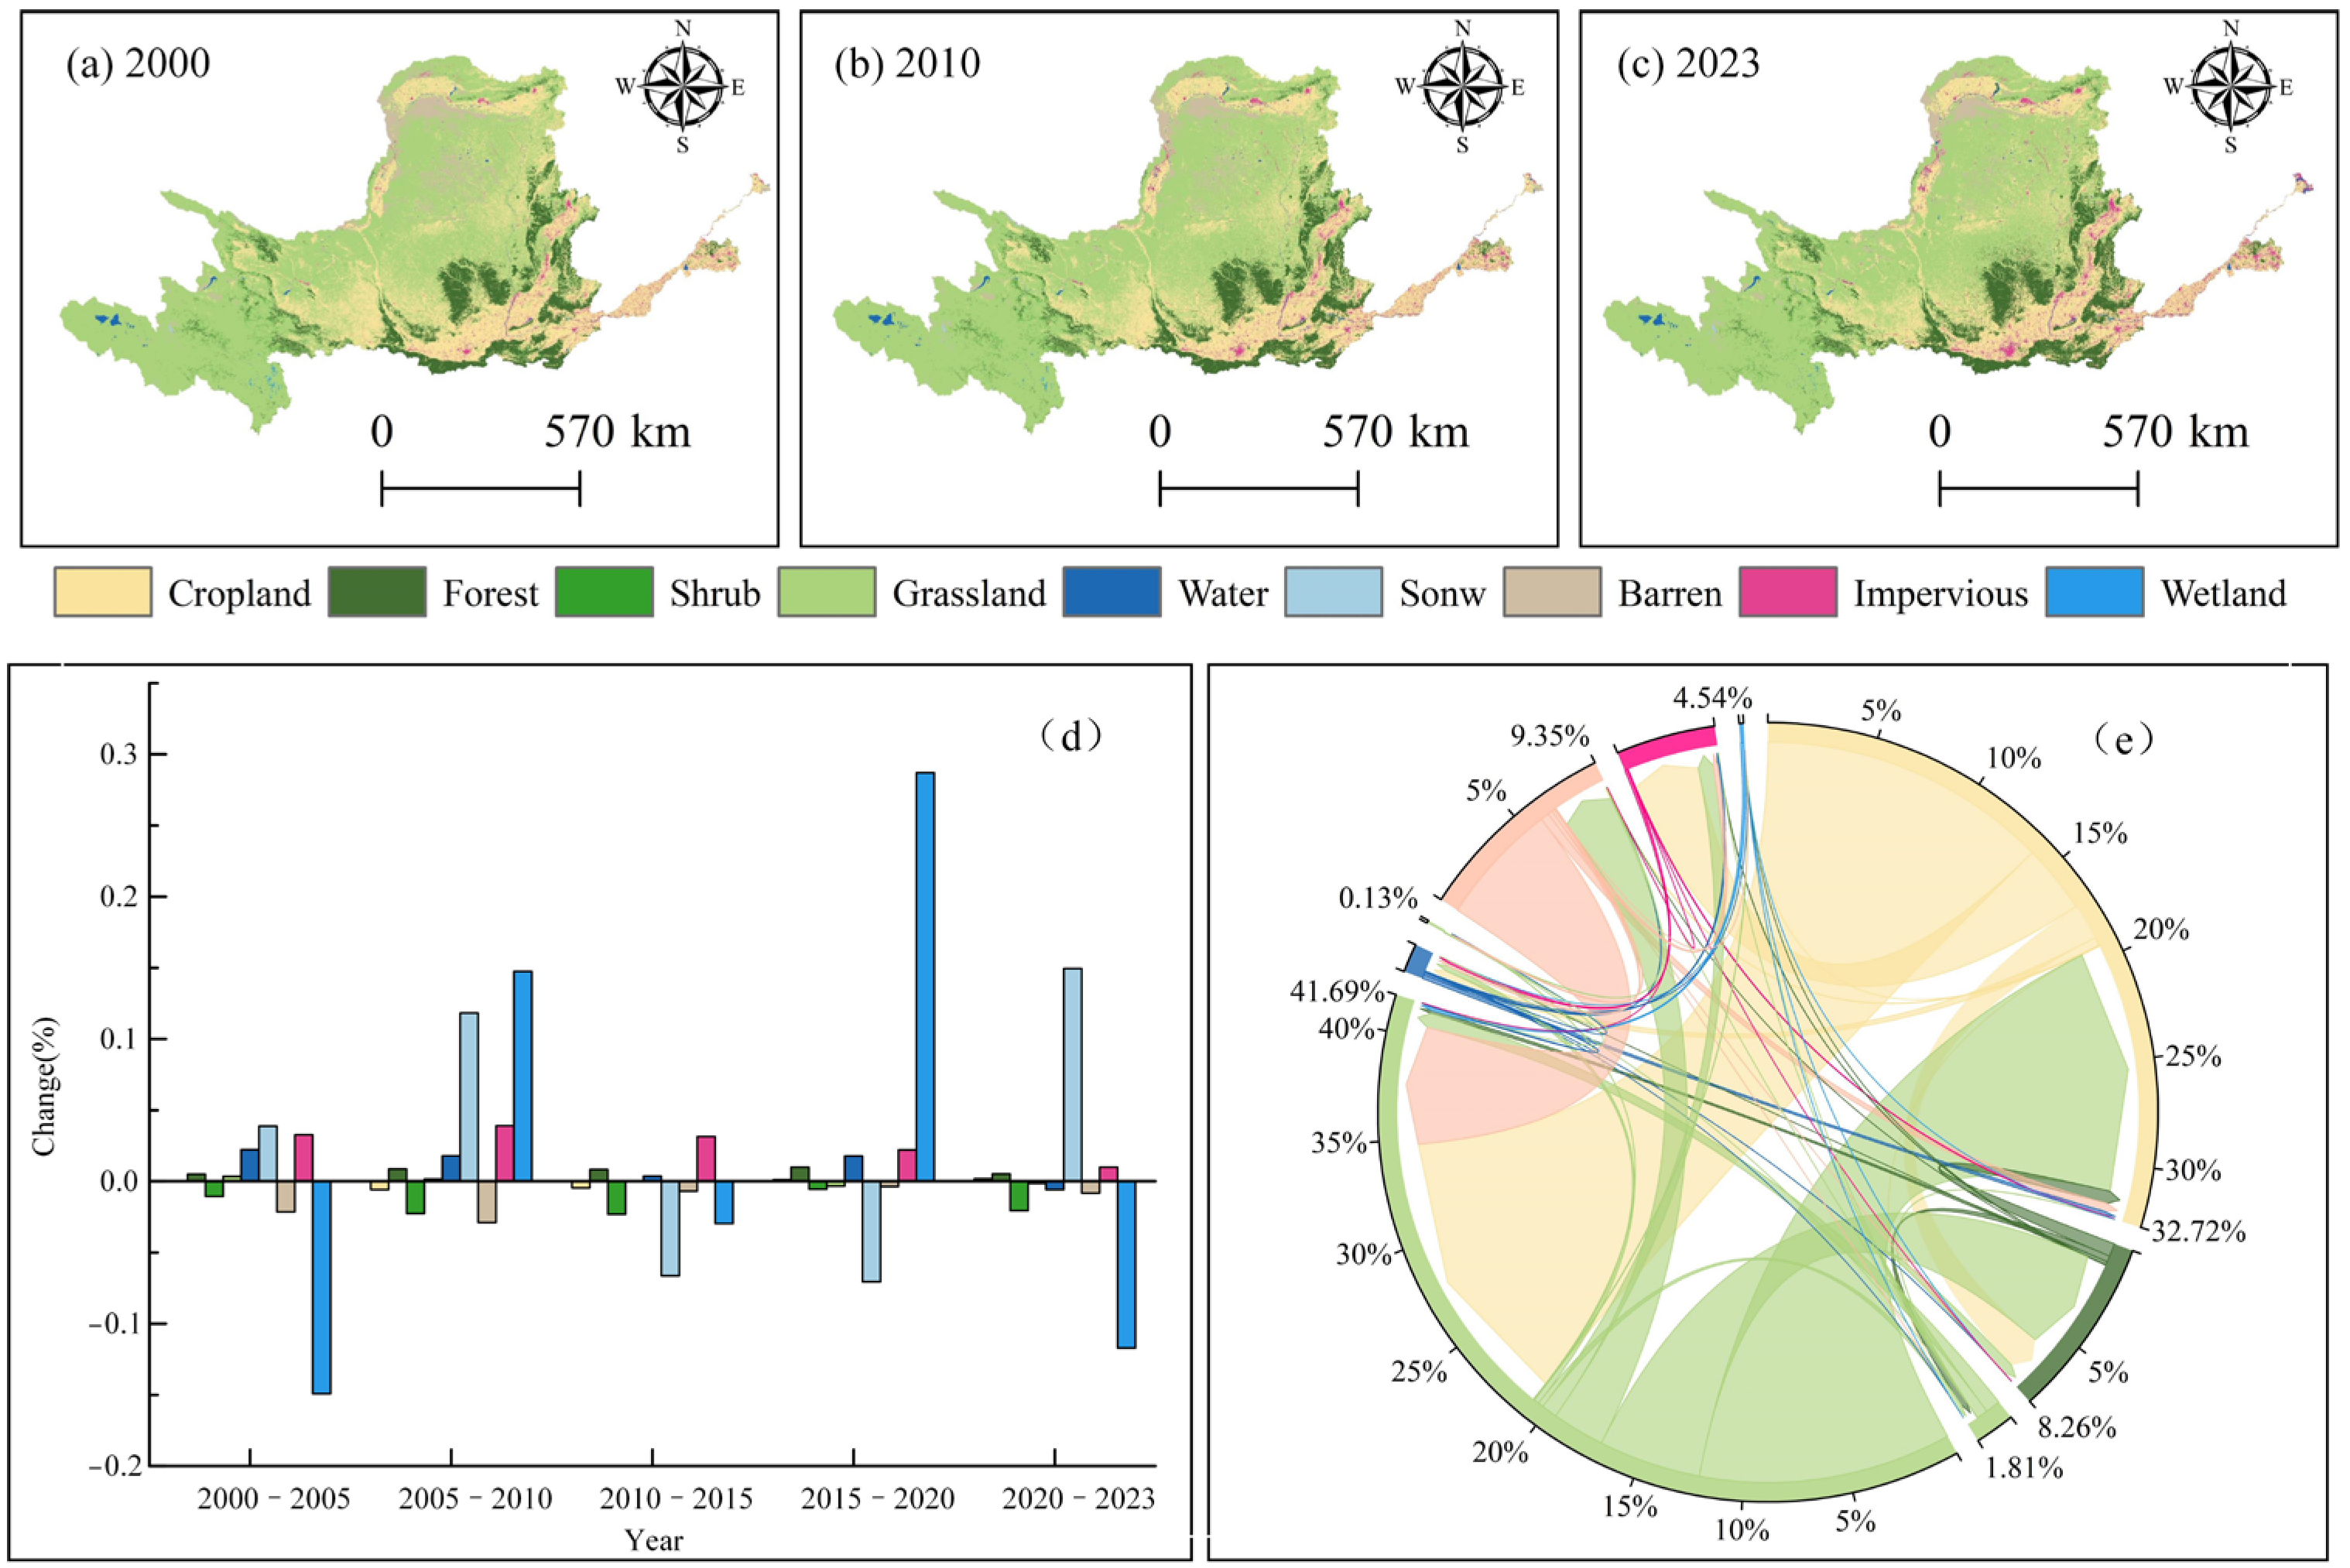
Figure 2a–c show the spatial changes in land use from 2000 to 2023. Over 80% of the land during this period was primarily made up of cultivated land and grassland, which accounted for about 25.34% and 57.51%, respectively. Snow and shrubland coverage were minimal, comprising only about 0.04% and 0.66%, respectively. Cultivated land was largely located in the middle and eastern plains. During the study period, its area notably decreased, particularly in the central and southern regions. Grassland, on the other hand, was concentrated in the northern and central arid and semi-arid areas of the Basin. Its coverage increased due to efforts in vegetation restoration and ecological conservation. Forest and water areas steadily expanded, reflecting positive ecological protection efforts. Impermeable surfaces significantly increased, particularly in central and eastern parts that underwent rapid urbanization. Compared to 2000, shrubland, wetlands, and unused land areas decreased by 2023, with shrubland showing the most significant decline.
The land-use change dynamic map (Figure 2d) and the chord diagram of the land-use transition matrix (Figure 2e reveal steady increases in forest, water, and impermeable surface areas. Although wetlands and snow areas were relatively small, their changes were notable, especially for wetlands. Other land types showed minor variations. From 2000 to 2023, approximately 12,955,844 hectares (16.26%) underwent land-use changes. Grassland had the largest area converted to other land-use types (5,397,838 hm2), especially cultivated land (3,136,540 hm2, 58.63%). Cultivated land mainly transitioned to impermeable surfaces, followed by grassland. Spatially, construction land in the Basin’s central and eastern parts exhibited aggregation and expansion, suggesting urbanization-driven encroachment primarily onto cultivated land and grassland.

3.2. Spatiotemporal Characteristics of ESV Changes

3.2.1. Temporal Evolution of ESV

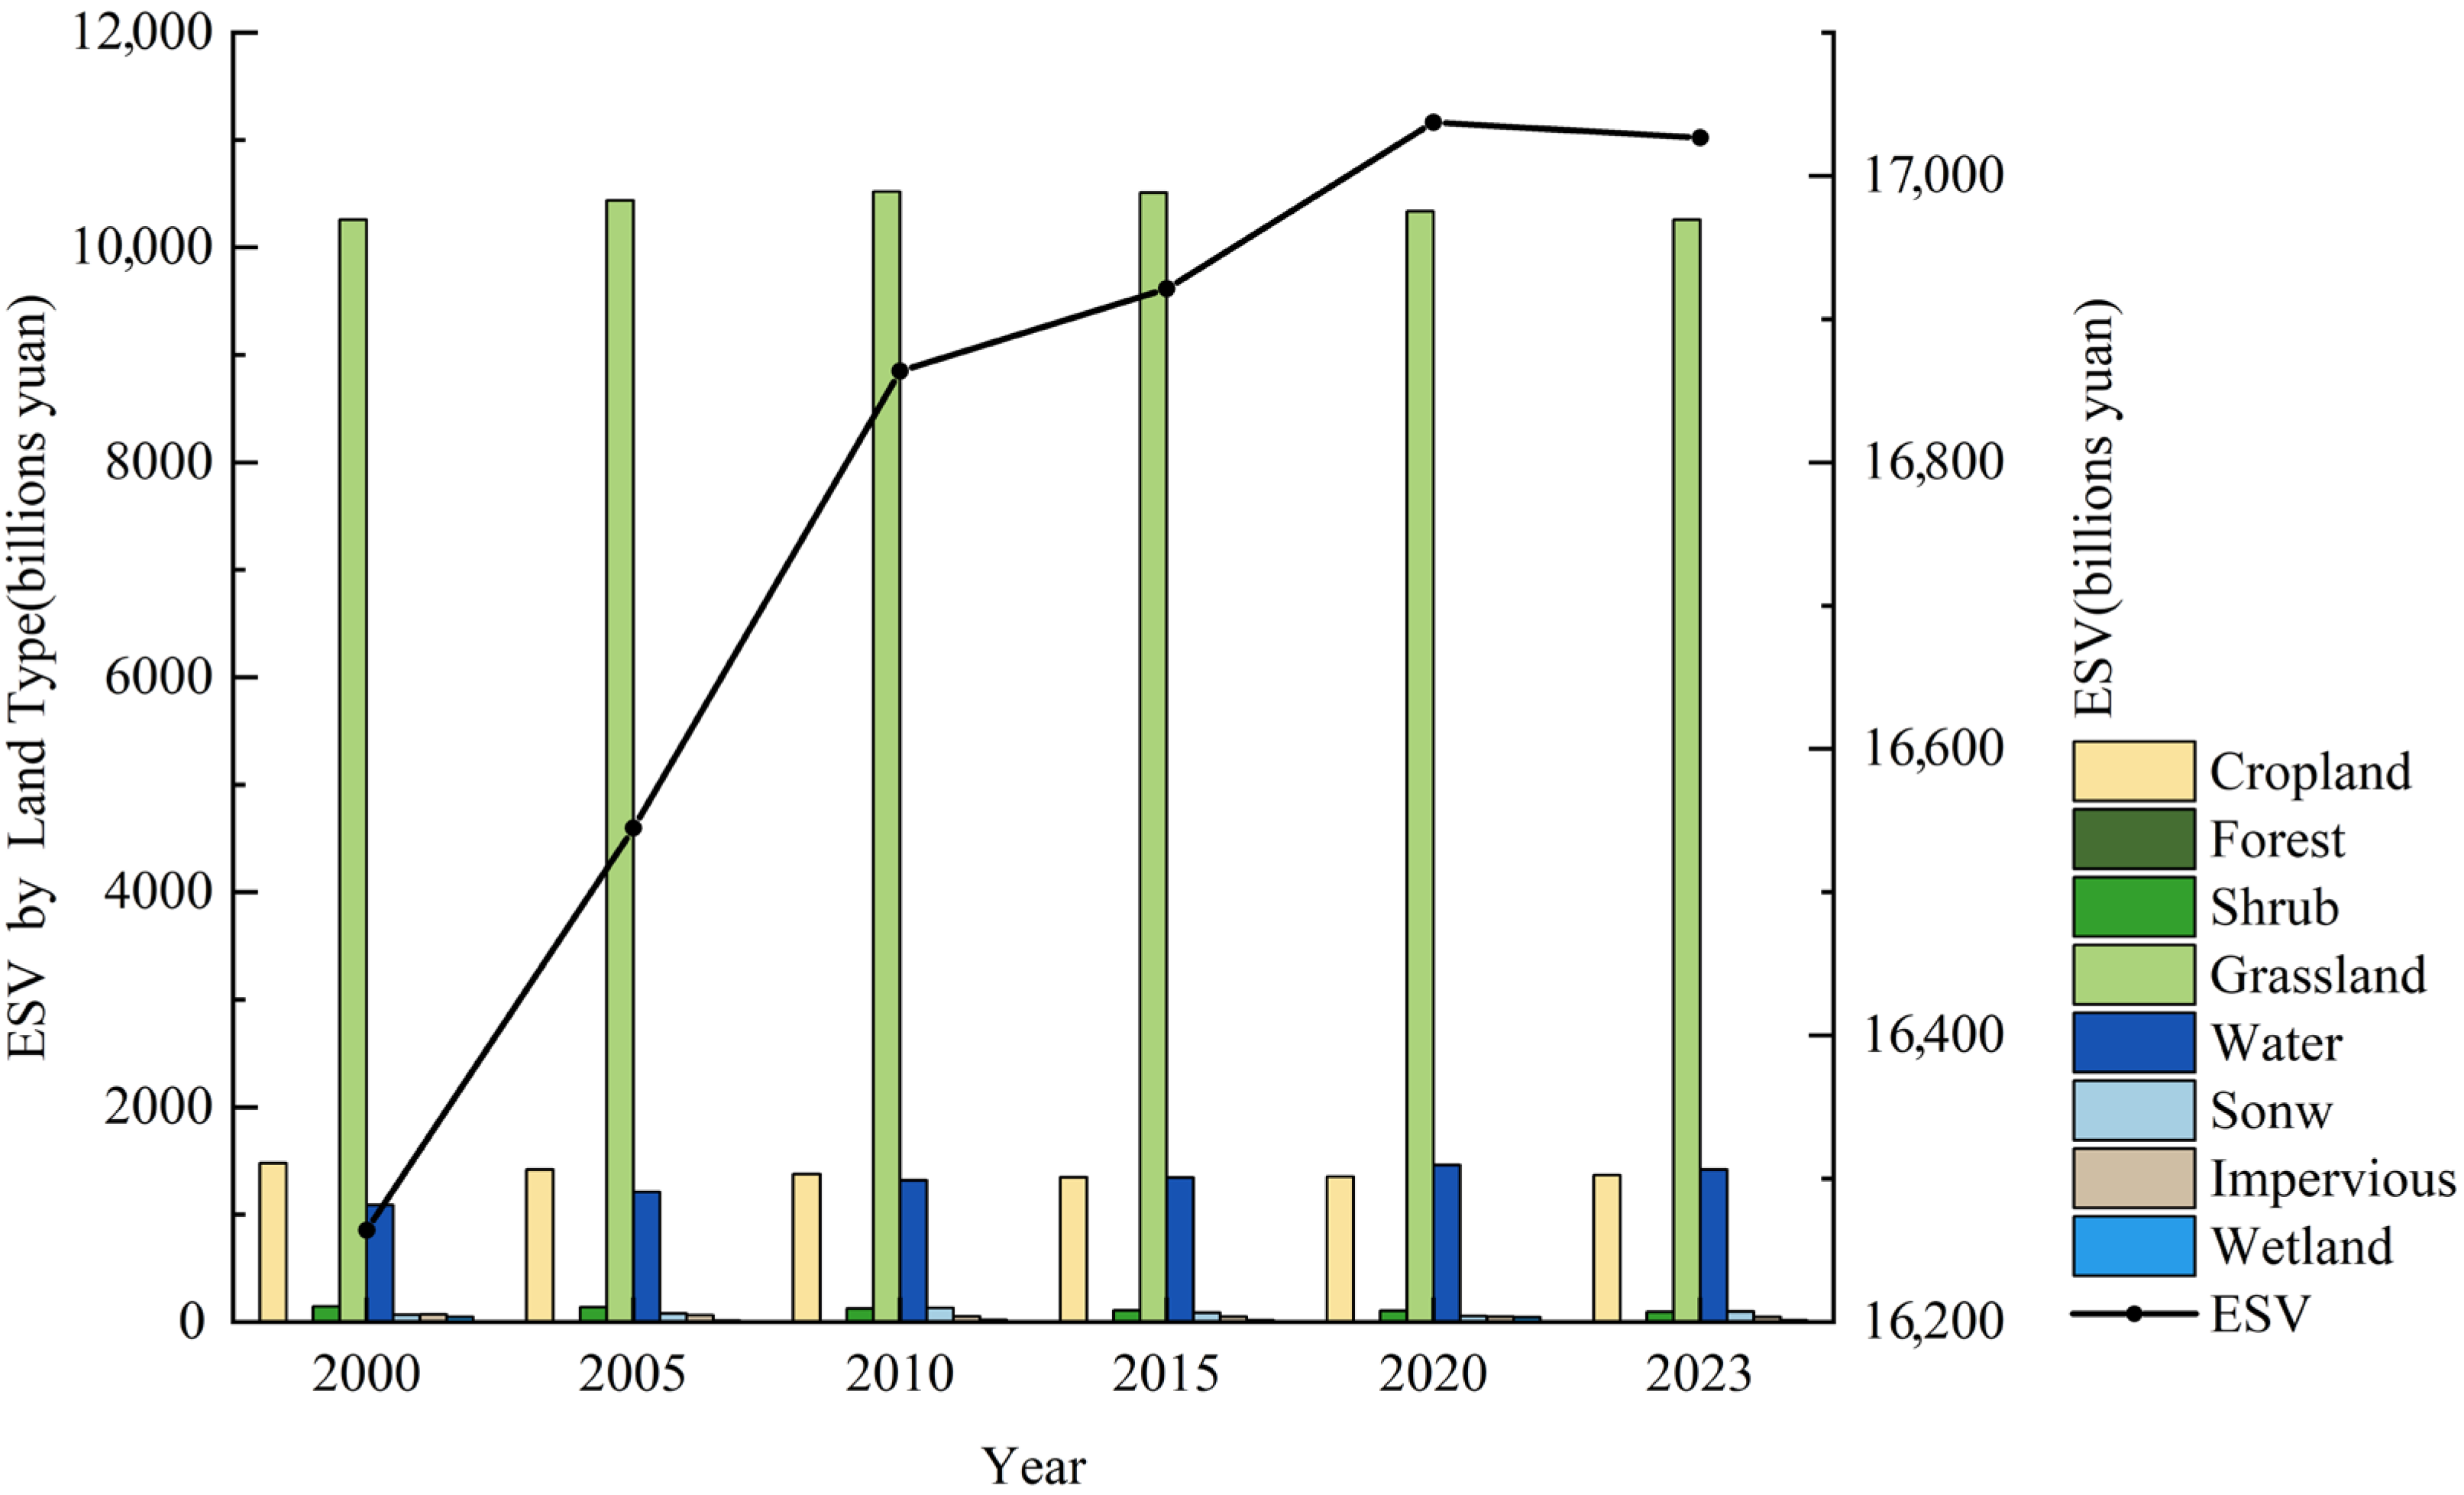
Table 4 and Figure 3 show how ESV evolved over time from 2000 to 2023. Throughout the study period, grassland consistently accounted for about 60% of the total ESV, which was markedly superior to that of other terrain types in each year. This highlights its important contribution to ecosystem services. The ESV of forest and water exhibited upward trends as well. The ESV of cultivated land declined from 147.967 billion yuan in 2000 to 136.652 billion yuan in 2023. The loss was largely related to the expansion of impermeable surfaces and grasslands, which diminished the extent of cultivated land. The ESV of other land types made low and stable contributions. This evolving trend is closely related to the natural environment and human activities in the Yellow River Basin. The high elevation and arid to semi-arid climate in the upper reaches render grasslands and forests critical for water regulation, soil conservation, and biodiversity maintenance. Large-scale ecological restoration projects in the upper basin have further enhanced the ecosystem service functions of forests and water bodies. In contrast, urban expansion and the increase in impervious surfaces in the middle and lower plains have led to a reduction in cropland area, thereby weakening its contribution to ecosystem services. Overall, the unique east–west topographic differences, climatic characteristics, and spatially heterogeneous human activities in the Yellow River Basin jointly shape the contributions of different land-use types to ESV and their spatiotemporal dynamics.
Table 4 shows that the total ESV rose from 16,264.18 billion yuan in 2000 to 17,026.59 billion yuan in 2023. This signifies a 4.69% increase. Although the increase was modest, it indicates a steady improvement. Within provisioning services, the ESV of water supply remained negative, though the magnitude of the negative value slightly decreased, suggesting some alleviation of water scarcity issues in the Basin. The share of provisioning services diminished, underscoring the necessity for further attention to water supply concerns. Among regulating services, hydrological regulation had the highest ESV and showed steady growth, reflecting its critical role in the Basin’s ecosystem services. Soil conservation significantly contributed around 11% to the total ESV and shown stability throughout the study period from 2000 to 2023. Regulating services were the predominant portion of the total ESV (about 60%), indicating that regulation is the fundamental function of ecosystem services in the Basin, especially hydrological control, which has gained significance over time. The roles of supporting and cultural services remained stable, but further efforts are needed to enhance their ecological value.

3.2.2. Spatial Dynamics of ESV

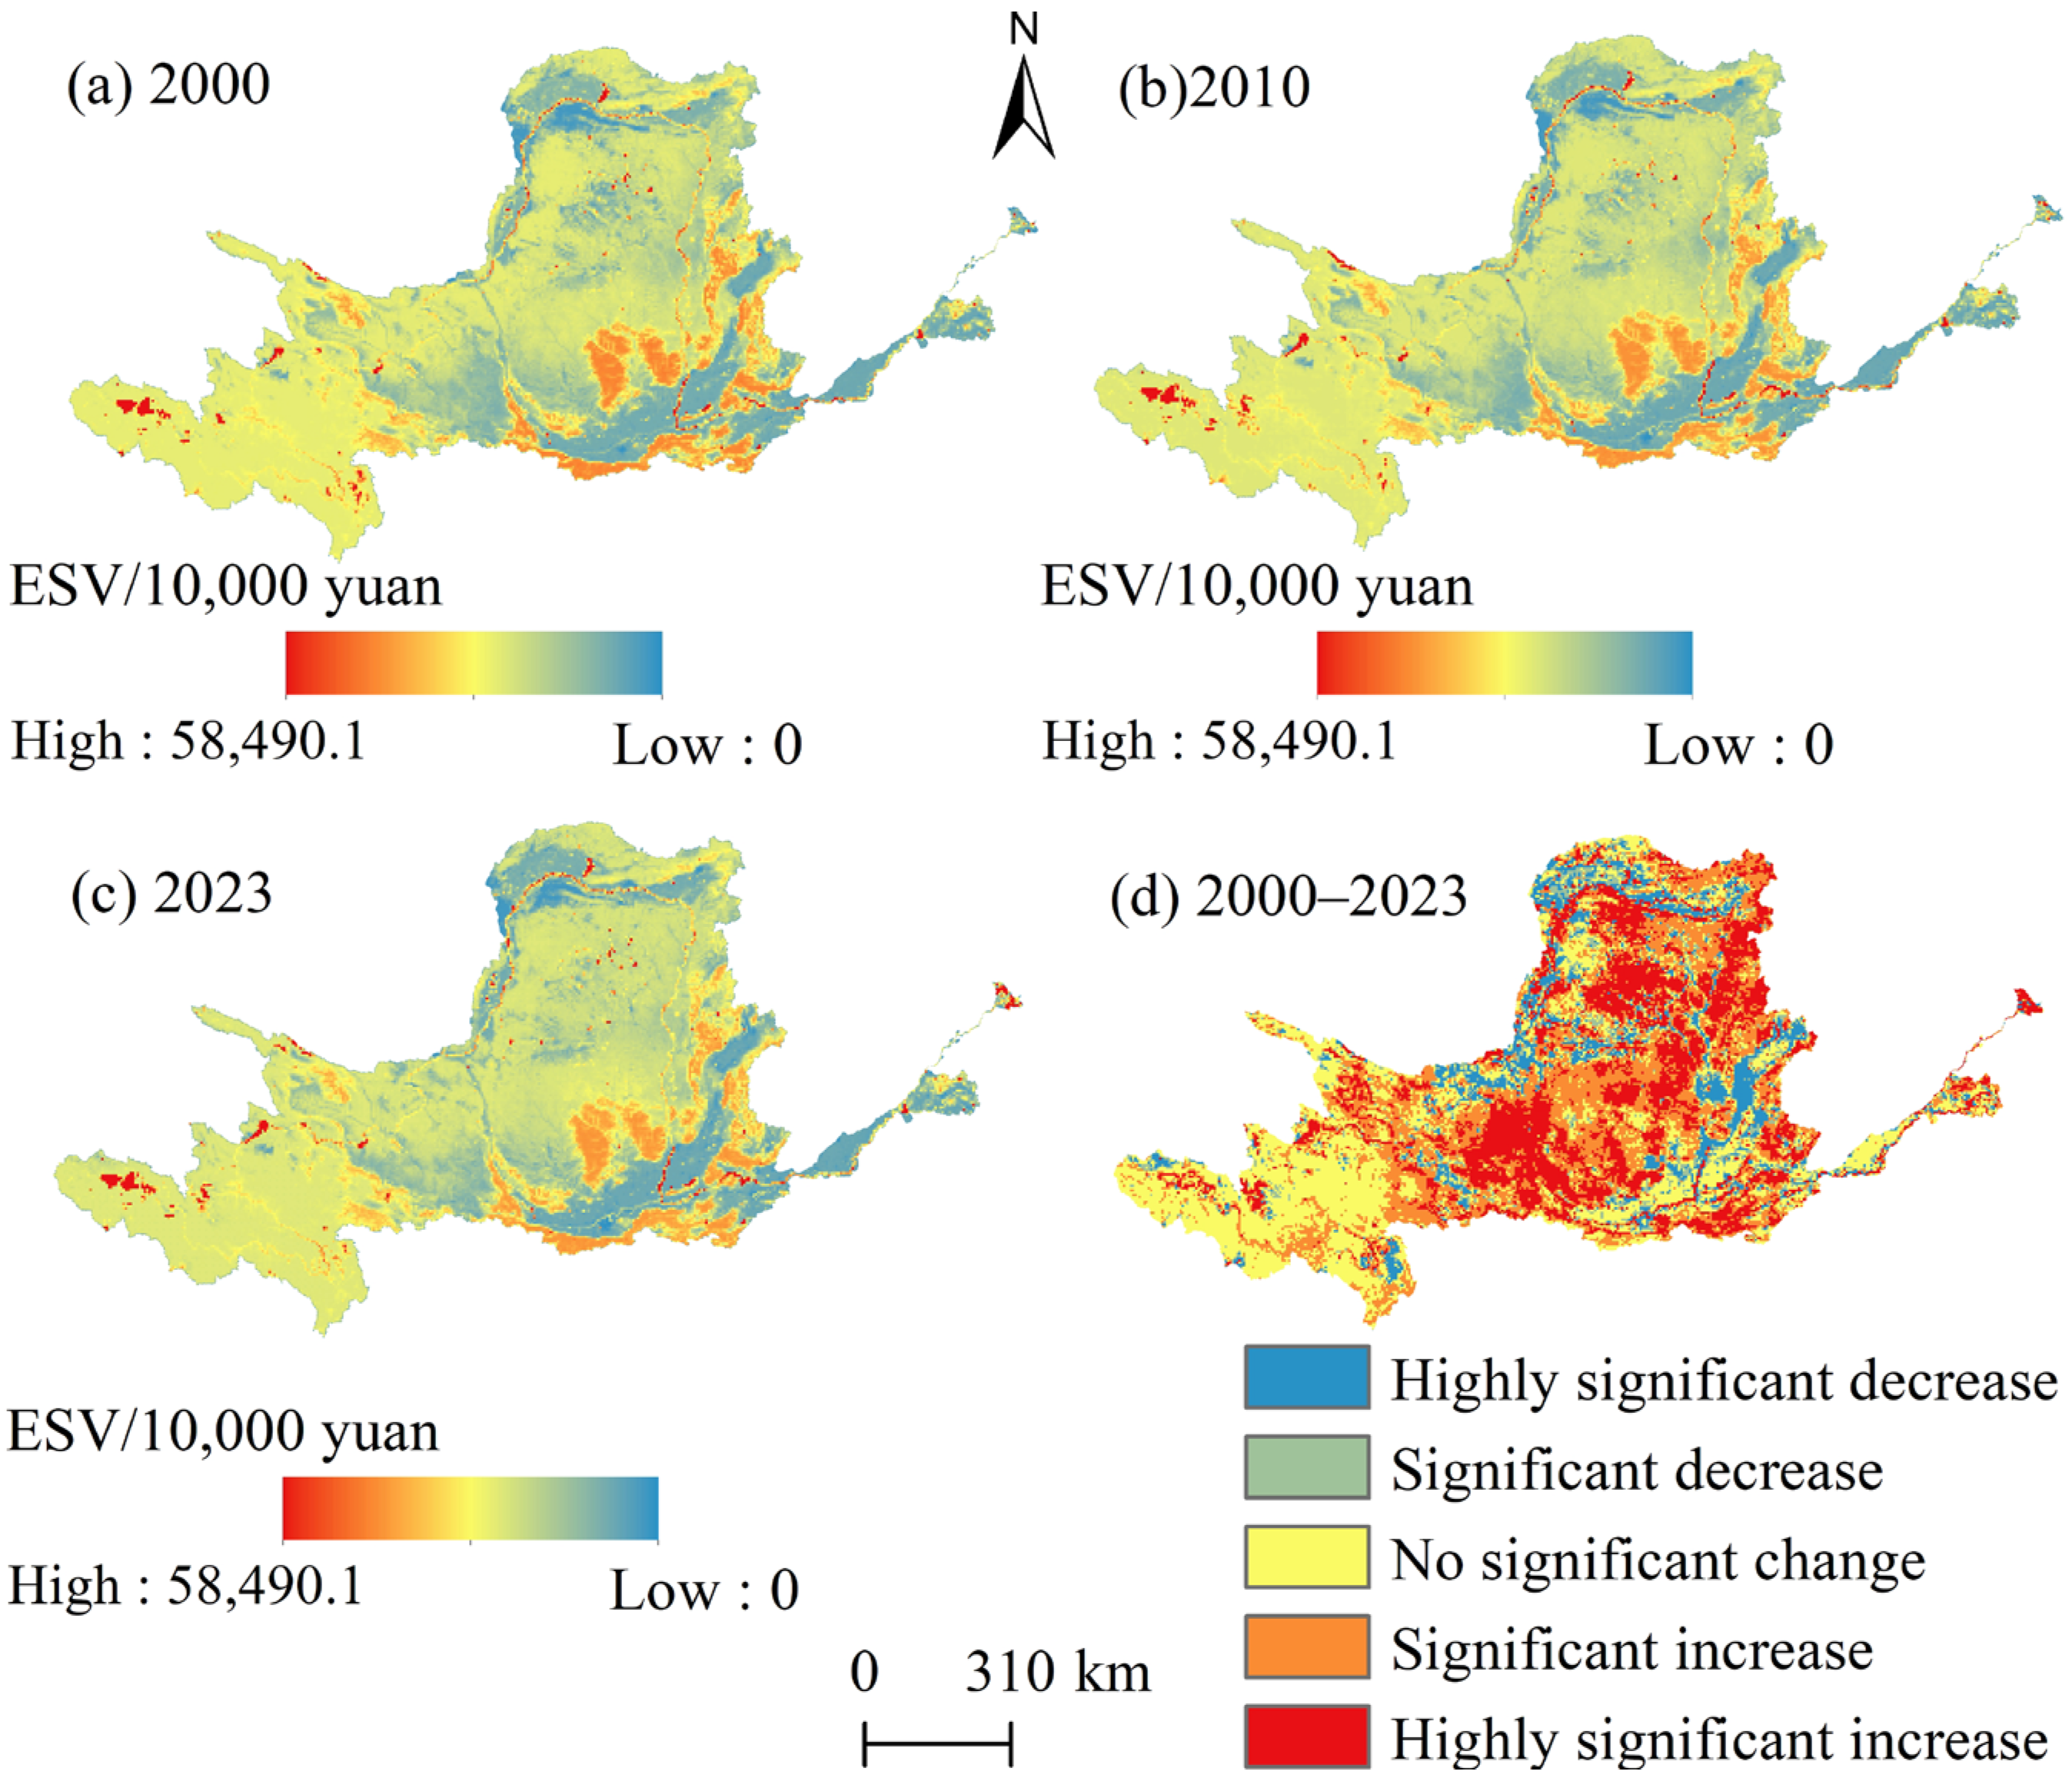
Figure 4 shows the spatial and temporal fluctuations in ESV within the Yellow River Basin. Over time, total ESV in the region steadily increased from 2000 to 2023, with a more noticeable rise after 2010. High-ESV areas, predominantly situated in the eastern and central sections of the Basin, gradually increased over the research period. Additionally, several initially low-ESV regions showed noticeable improvement by the end of the observation period, possibly caused by the execution of ecological restoration activities. Spatially, the distribution of ESV showed clear variation across the Basin. Higher values were observed in the west, while the east had lower values, with notable concentrations along the main course of the Yellow River. Areas with high ESV were mostly found in the upper reaches, in certain mountainous zones within the Basin, and in areas surrounding the river such as Sanjiangyuan and the Bayan Har Mountains. These areas are characterized by dense vegetation, mainly consisting of forests, grasslands, and wetlands, which contribute to strong ecosystem functions. A belt of high ESV also appeared along the main stem of the Yellow River. In the upper and middle reaches, ESVs near the river channel were significantly higher compared to more distant areas. In the lower sections, ESV levels along the river corridor were slightly higher than those in the surrounding regions. Low ESV areas were generally found in the lower and parts of the middle reaches, including the North China Plain and sections of Shaanxi and Shanxi provinces. These areas are characterized by intensive urban development and agricultural activity, resulting in limited ecological regulation capacity. Some areas in the middle reaches also exhibited low ESVs due to natural constraints such as arid conditions and significant soil erosion. Overall, between 2000 and 2023, regions like the Loess Plateau, along with the Weihe, Jinghe, and Luohe river basins, experienced a notable rise in ESV. This improvement can be attributed to a series of initiatives launched since the early 2000s focused on ecological conservation, restoration efforts, water resource management, and pollution control within the Basin. In contrast, ESV in areas such as Inner Mongolia, Ningxia Hui Autonomous Region, and parts of Shaanxi showed a downward trend, largely due to increased grazing pressure and accelerated urbanization.

3.2.3. Spatial Autocorrelation Analysis of ESV

Throughout the study period, Moran’s I values for ESV in the Basin continuously exceeded 0, indicating a positive spatial correlation. However, these values showed a fluctuating but overall declining trend over the previous 20 years (Figure 5). The spatial distribution of ESV exhibits significant positive spatial correlation and clustering, though these effects have shown a declining trend over time. The spatial layout exhibited a trend of shrinking clustering areas and declining correlation. This suggests the ESV exhibits a certain degree of spatial autocorrelation; in other words, areas with relatively high or low ESV tend to cluster together and display spatial similarity. The decreasing trend in Moran’s I indicates a progressive shift towards a more equitable geographical distribution of ESV throughout the Basin.
According to the LISA maps of ESV at five-year intervals (Figure 5), four clear types of spatial clustering patterns were identified. These clusters varied across different time points, reflecting changes in spatial distribution. Among them, the most prevalent were the “high-high” and “low-low” clusters, which collectively amounted for nearly 40% of the entire area. “High-high” clusters were predominantly situated in forested regions within the middle and lower parts of the Basin. Conversely, “low-low” clusters were primarily located in the northern sections of the upper reaches and certain downstream areas. Throughout the duration of the study period, these low-value clusters showed a tendency to expand outward toward the surrounding regions. These extensive “high-high” and “low-low” clustering patterns suggest a certain degree of ecological imbalance across parts of the Yellow River Basin. “Low-high” clusters were intermittently located at the peripheries of “high-high” regions and exhibited a rising trend; however, their growth was constrained. “High-low” clusters were the least common and were mainly found in the southeastern part of the Basin, with little spatial change over the study period.

3.3. Trade-Offs and Synergies Among Ecosystem Services

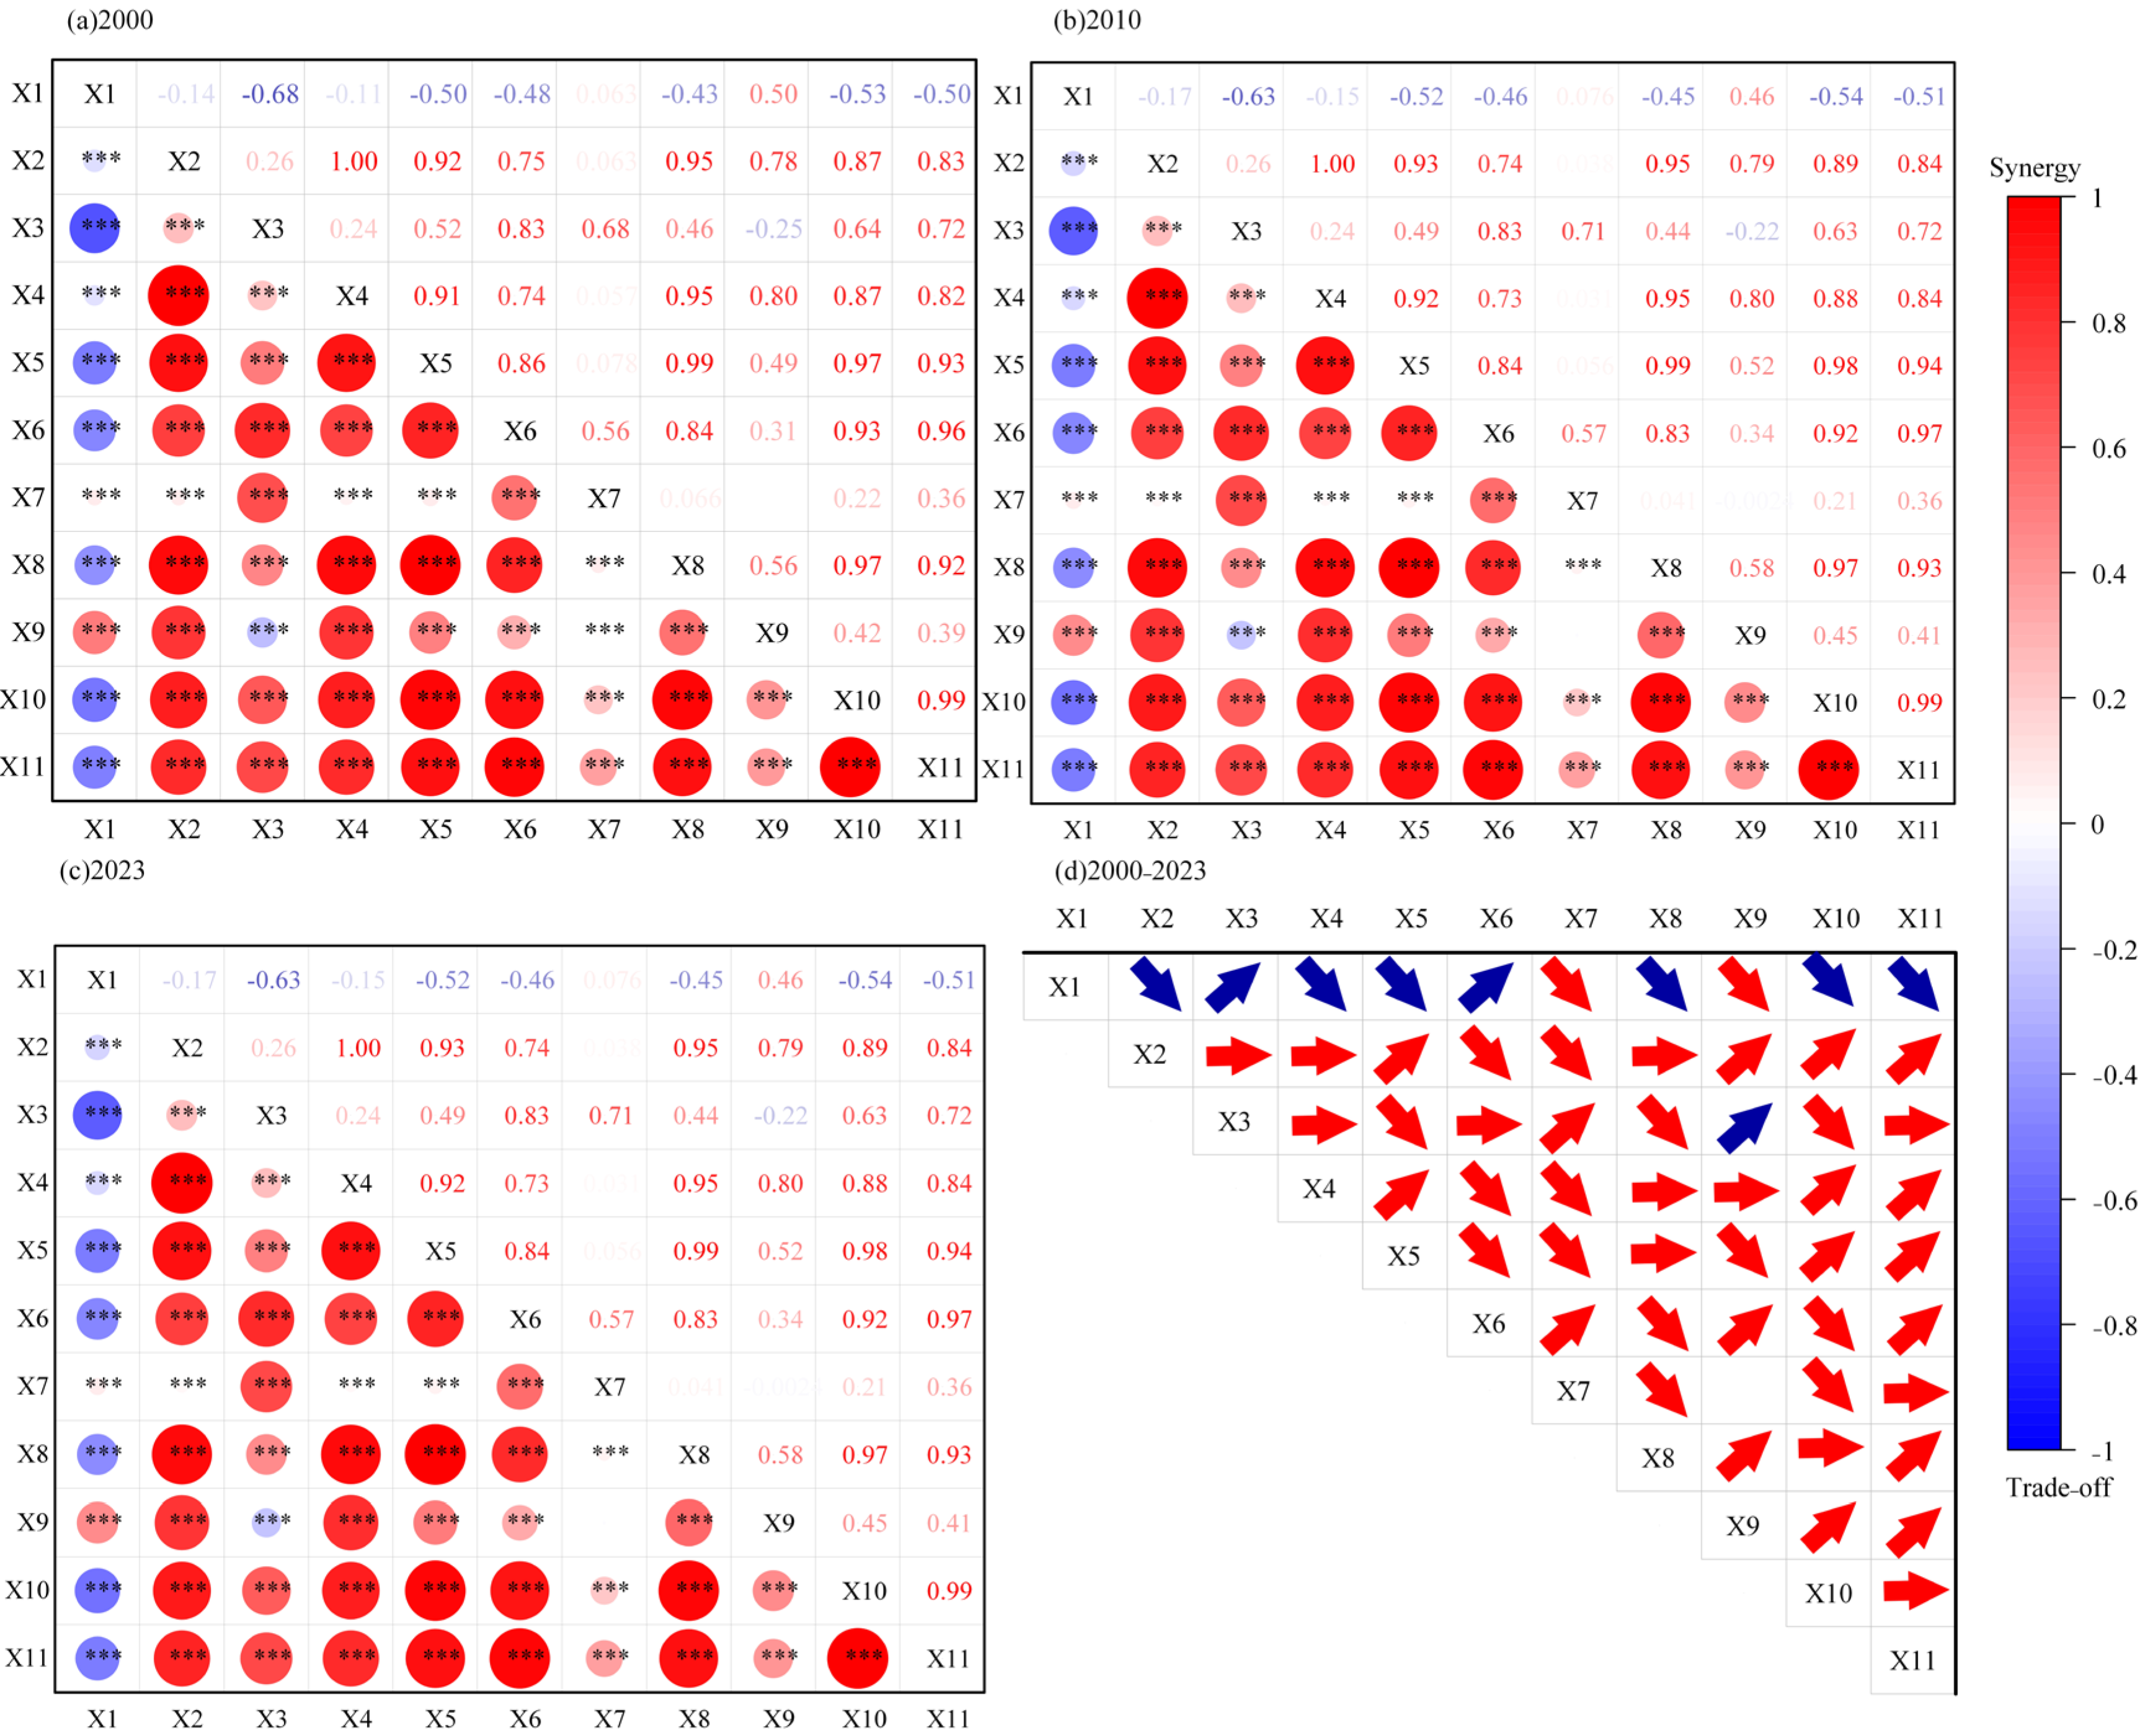
To better understand the strength and characteristics of interactions among ecosystem services, this study employed a synergy–trade-off model. This model was employed to assess the interrelations among several ecosystem services in the Yellow River Basin from 2000 to 2023. (Figure 6). As shown in the figure, a total of 55 pairs of values were observed, including 45 positive values, 9 negative values, and 1 with no trade-off or synergy, with synergistic relationships accounting for 81.8%. This demonstrates that synergy was the prevailing form of interaction among ecosystem services. However, trade-offs predominantly transpired between food production and alternative ecological services. This suggests a competitive relationship, where increases in agricultural output often came at the expense of other ecosystem functions. The most significant trade-off was identified between food production and water supply, with a correlation value of −0.68. This pronounced negative correlation may be ascribed to the restricted water availability and the irregular geographical and temporal distribution of water resources throughout the Basin. Major grain-producing regions, including the Ningxia Plain and the Hetao Irrigation District, are situated in semi-arid to arid zones where irrigation is essential for sustaining agriculture. The allocation of water for farming reduces the ecosystem’s ability to provide water-related services, and conversely, prioritizing ecological water needs can constrain agricultural production—leading to a pronounced trade-off between these two services. As depicted in Figure 6d, the classifications of trade-offs and synergies among ecosystem services were stable throughout the study period, the intensity of these relationships experienced significant variation. Specifically, 18 values increased, 21 decreased, and 10 remained stable. The majority of the declining values were still related to the interactions between food production and other services, suggesting that trade-offs between agricultural production and other ecosystem functions continued to be a significant factor in the later stages of the study period. This continued downward trend highlights a fundamental structural challenge in ecosystem management within the Yellow River Basin. Reconciling food security with the necessity to mitigate adverse effects on other ecosystem services is an urgent and unresolved challenge. The formation of these synergies and trade-offs is closely linked to the unique natural environment and human activities in the Yellow River Basin. The pronounced east–west topographic differences, with limited and unevenly distributed water resources in the upper plateau and middle hilly regions, create inherent constraints between water supply and agricultural production. In the middle and lower plains, agriculture is highly dependent on irrigation, while urban expansion and land-use changes further intensify competition between water resources and other ecosystem services. Moreover, large-scale ecological restoration projects in the upper basin have enhanced regulating and supporting services, which, to some extent, strengthen the synergies among ecosystem services, but simultaneously increase trade-off pressures with food production.

3.4. Geographic Detector Analysis of Spatial Differentiation in ESV

3.4.1. Factor Detection

This study employed the factor detection module of the geographical detector architecture to evaluate the spatial heterogeneity of ESV. This method measured the explanatory power of different influencing factors, as illustrated in Table 5. Among them, all variables demonstrated statistical significance, with the sole exception of the construction land proportion. The results revealed the q-values for the nine driving factors. These were ranked from highest to lowest as follows: NDVI > population density > DEM > annual average temperature > slope > NPP > road network density > annual precipitation > GDP. Among them, NDVI, population density, DEM, annual average temperature, and slope all had q-values above 0.1 and were identified as the main driving factors. NDVI, which reflects vegetation cover, was intricately associated with ecological processes like carbon sequestration, water conservation, and soil retention, and contributed significantly to ESV. DEM and slope are topographic factors that shape landform characteristics. They influence soil erosion, vegetation distribution, and land use patterns, which subsequently influence the stability and productivity of ecosystem temperatures, as a key climatic factor, affecting vegetation growth, evapotranspiration, and ecosystem functioning, and in turn, shape the spatial distribution and temporal trends of ESV. Among the main drivers, population density was the only socio-economic factor. It essentially reflects the degree of human impact on ecosystem services, as increased population density often alters land use patterns and intensifies pressure on natural resources and the environment, thus leading to changes in ecosystem structure and processes. Natural and anthropogenic variables collaboratively influence the spatiotemporal differentiation of ESV in the Basin and play a crucial role in driving its evolution.

3.4.2. Interaction Detection Analysis

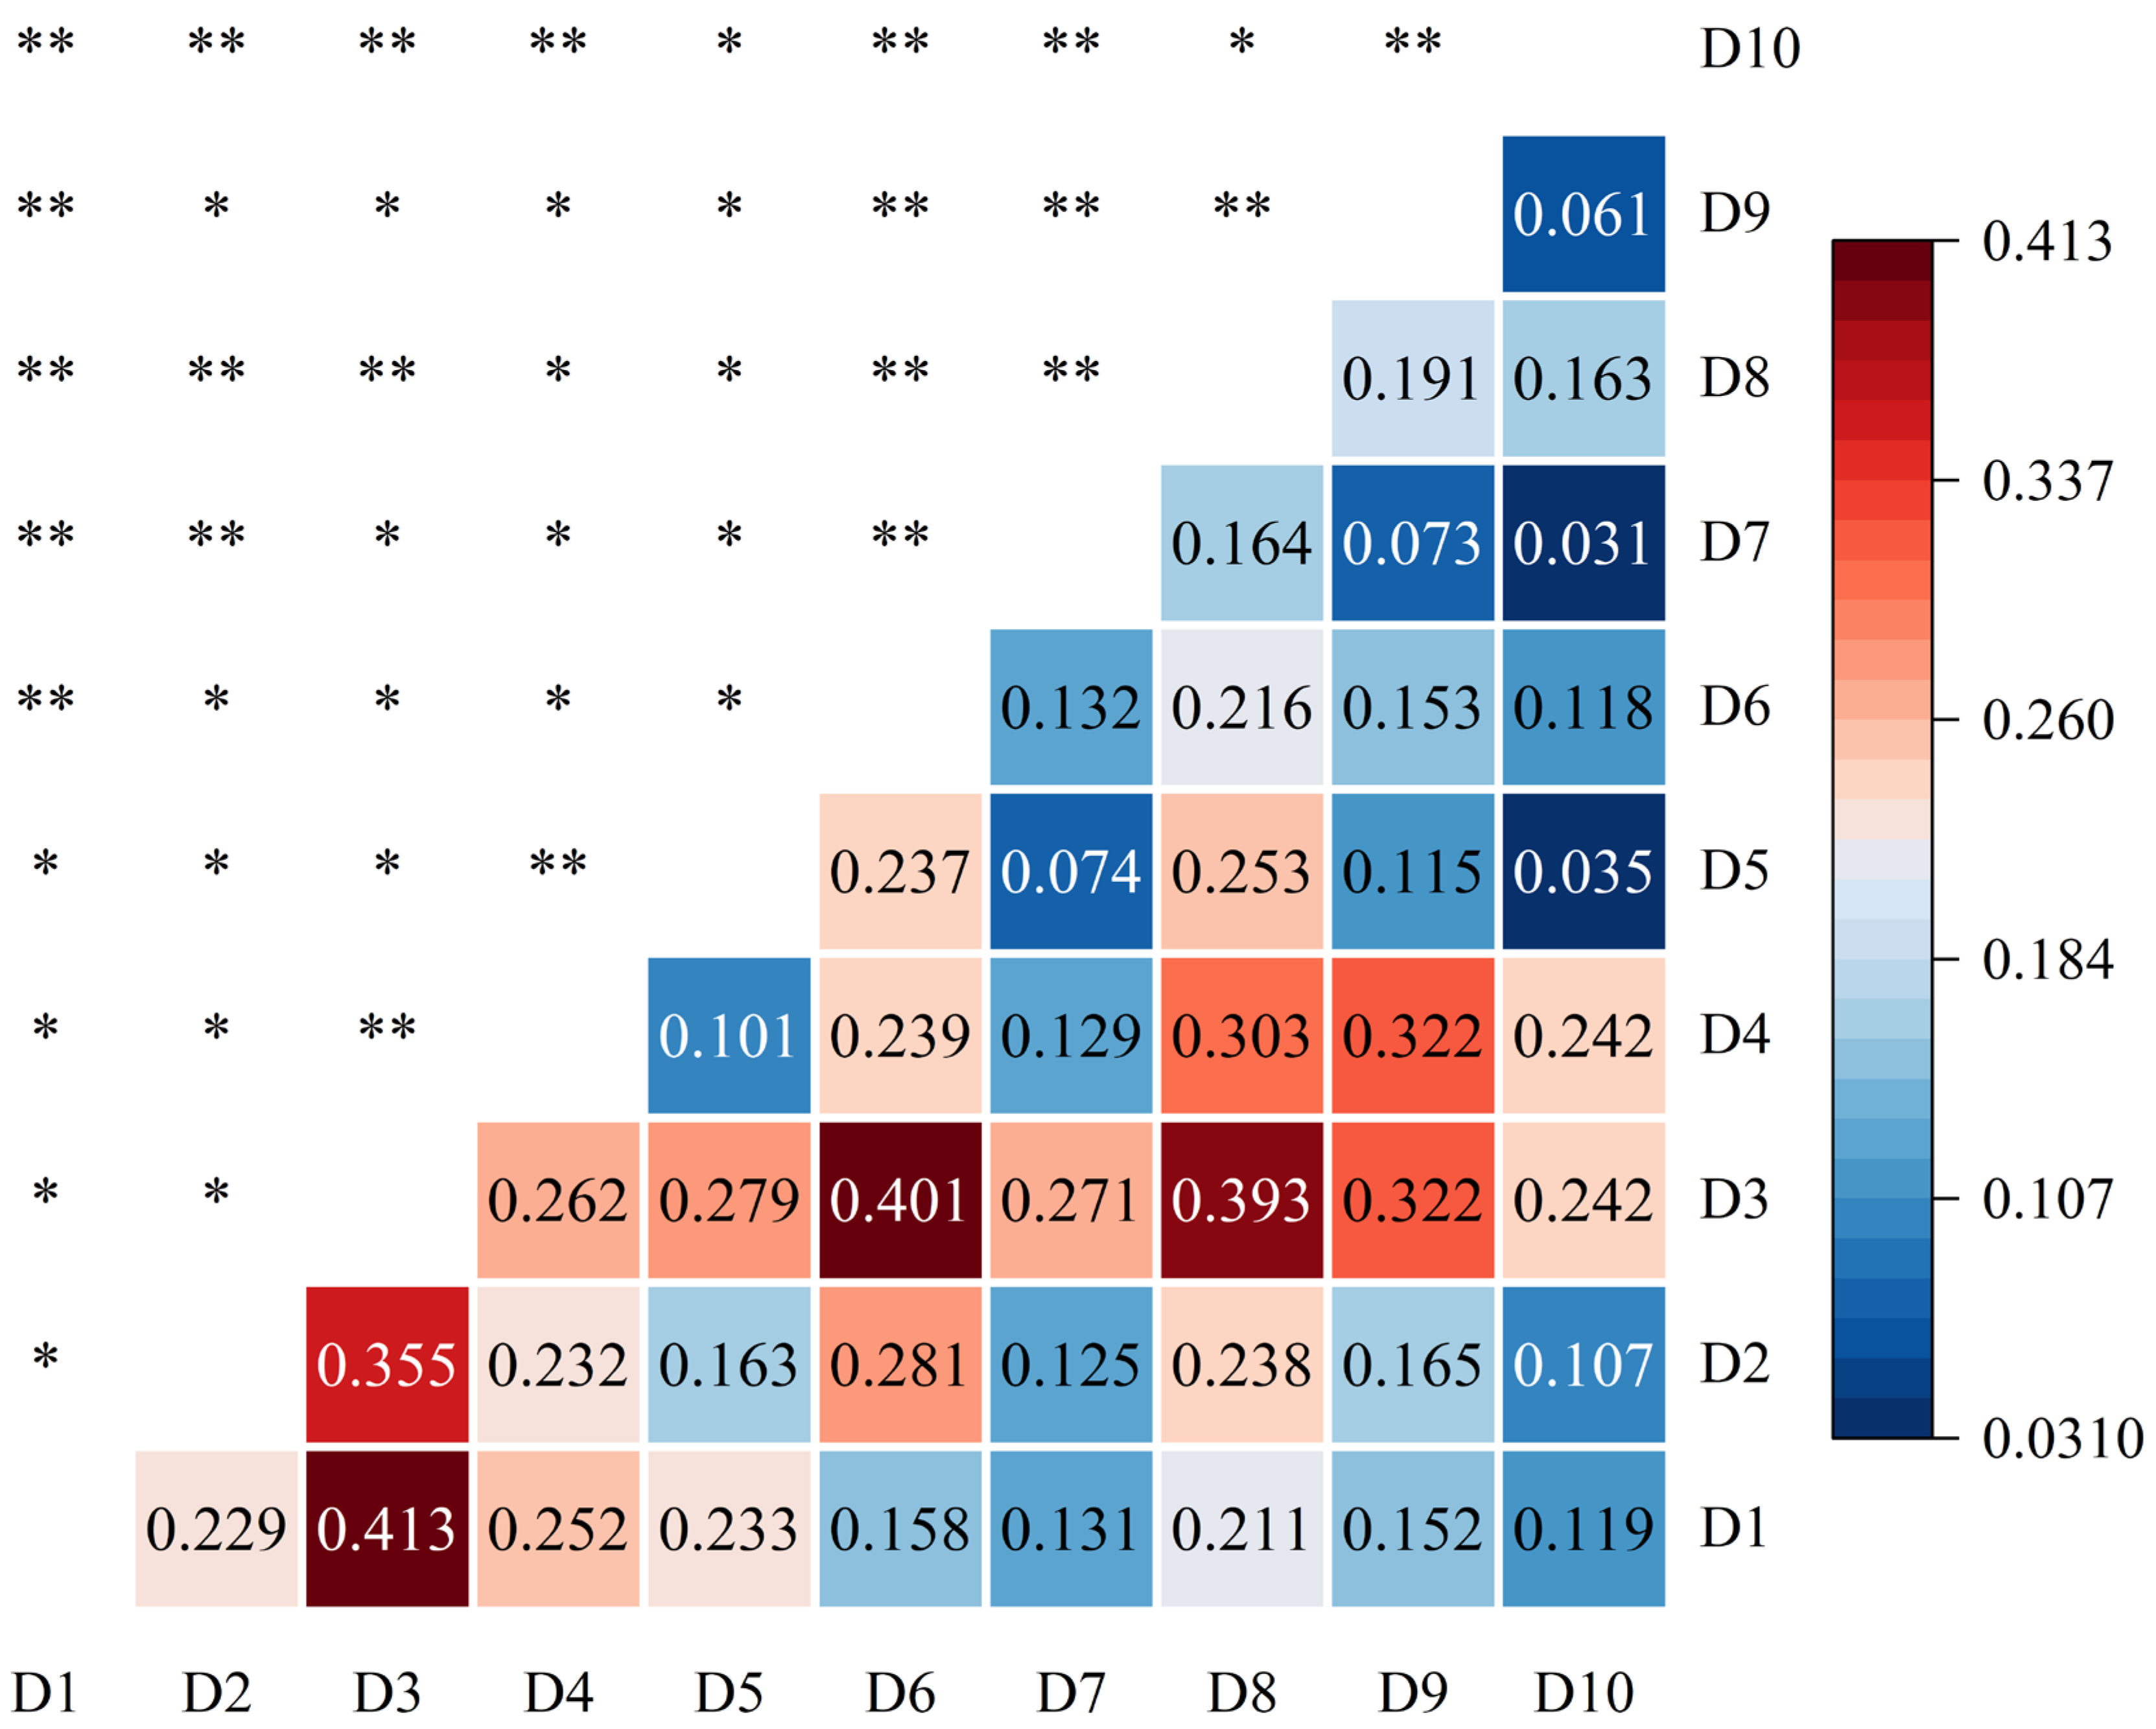
The interaction detection results using the geographical detector model (Figure 7) indicated that coupled driving factors exerted a more significant influence on the spatial variance of ESV in the research area than any singular factor alone. Most of the interactions showed bilinear enhancement, with nonlinear enhancement following. This signifies that the geographical variation in ESV is affected by the interplay of multiple natural and anthropogenic variables, rather than being driven by a single force. The interactions among DEM, slope, annual average temperature, annual precipitation, and NDVI were especially notable. This suggests that natural environmental factors, when considered together, have a significant influence on ESV. Notably, the interaction between DEM and NDVI demonstrated the most pronounced effect on ESV spatial heterogeneity, implying that topography strongly affects vegetation cover distribution, which in turn plays a key role in shaping regional ESV patterns. The interaction between NDVI and annual average temperature was the second most significant. This suggests that temperature not only independently influences ecological processes but also enhances its role in explaining the spatial variation in ESV by affecting vegetation dynamics. The interactions between population density and other factors were also strong, especially with vegetation-related factors such as NPP and NDVI. This indicates that human activities substantially affect the state of natural vegetation in the Basin. They also influence the productivity of these ecosystems. The synergistic effects resulting from the intricate interactions of multiple components elucidate the regional differentiation of ESV throughout the Basin. These interactions provide a clearer understanding of how ESV varies across the region. However, the interactions between socio-economic and environmental variables were notably weaker than those among environmental factors. This shows that natural environmental factors exert a greater influence on the geographical variation in ESV.

4. Discussion

Recent years have witnessed an increasing scholarly focus on the progression of ecological civilization in the Yellow River Basin. This subject has come to be a significant focus in environmental studies. Existing research has shown that rapid industrialization has intensified pressure on its natural resources and environment, highlighting the urgent need to enhance quality and efficiency through intensive growth and strengthen endogenous drivers of sustainability [43]. Therefore, it is necessary to make a thorough evaluation of the overall ESV level in the Yellow River Basin. Comprehending its driving dynamics is crucial for enhancing ecological conservation, facilitating superior regional development, and establishing ecological civilization on a national scale. This study thoroughly analyzed the spatiotemporal evolution patterns of ESV within the Basin. Based on this analysis, the OPGD model was used to identify the main factors driving spatial heterogeneity and their interactions. The results provide important scientific insights for policy-making in ecological civilization construction and sustainable development. These findings are relevant not only to the Yellow River Basin but also to analogous places.

4.1. Spatiotemporal Distribution and Evolution of ESV

Ecosystem services are crucial for preserving ecological security and promoting human well-being. The research identified a consistent rise in the total ESV of the Basin, corroborating the conclusions of Zhang [44]. Regulating services made up the largest portion of the ESV composition. This was succeeded by supporting, providing, and cultural services. Within regulating services, hydrological regulation had the greatest contribution, underscoring the pivotal role of water resource management and aquatic ecosystem restoration in ecological protection efforts across the Basin [45]. Changes in grasslands and forests are closely associated with the increase in ESV. Since the 20th century, a series of ecological restoration projects, such as the conversion of cropland to forest and grassland and the “Three-North Shelter Forest Program,” have been implemented on the Loess Plateau. As a result, regional forest and grassland cover has shown a significant upward trend. This change temporally coincides with improvements in ecosystem service functions, highlighting the potential role of ecological restoration in enhancing regional ecological functions [46]. The spatiotemporal distribution and evolution of ESV were primarily influenced by land use changes, natural environmental features, and human activities, and exhibited marked spatial heterogeneity and temporal dynamics. High-ESV areas were typically found in regions with well-preserved natural ecosystems, such as forests, wetlands, and grasslands. These areas included mountainous zones, nature reserves, and water conservation areas. On the other hand, low-ESV regions were mainly concentrated in urbanized areas, including industrial zones, transportation hubs, and regions with a high percentage of construction land.

4.2. Driving Factors of ESV

This study applied the OPGD model to examine the individual components and their relationships influencing ESV. The objective was to ascertain the principal determinants of geographical differentiation in the Yellow River Basin and to investigate the interactions among these factors. The findings demonstrated that ESV in the Basin was collectively affected by various factors, including NDVI, population density, DEM, annual average temperature, and slope. This indicates that, at a large temporal and spatial scale, natural factors such as topography and climate change serve as the primary drivers of variations and fluctuations in ESV, which aligns with the findings of Su [47]. Grassland was the most prevalent land use type in the Basin. Its distribution was influenced by factors such as temperature, precipitation, and topography [37]. The interplay between DEM and NDVI exerted the most substantial influence on the geographical heterogeneity of ESV. This highlights the crucial role of topography in determining vegetation distribution and the vital importance of vegetation cover in providing ecosystem services throughout the Basin. In addition, the interaction detection results revealed that, overall, interactions among natural environmental factors played a dominant role, which was largely consistent with existing studies [37,48]. Natural environmental factors impose foundational constraints on ecosystems; regardless of human development, topography, climate, and vegetation continue to determine the spatial distribution of ecosystems. Water resources are essential for maintaining the stability and functioning of ecosystems in the Basin. Precipitation and hydrological conditions are the principal factors driving water conservation and regulation functions in the region. Socio-economic factors influence water resource use to a certain extent but cannot alter the natural laws of the water cycle. Over the long term, socio-economic activities typically represent adaptations to or modifications of the natural environment, rather than independent influences. The driving forces behind ESV variations reveal a shift from natural-factor dominance to a model jointly influenced by both environmental and socio-economic dynamics. While socio-economic factors are increasingly influential, the interaction of natural environmental factors remains the primary driver of spatial heterogeneity in ESV.

4.3. Limitations and Future Directions

The current methods used to adjust ESV coefficients in research are often limited by their singularity and static nature. Although some influencing factors are considered during the correction process, river basins—where human activities and natural environments interact intensively—still pose challenges in accurately capturing the dynamic changes in ESV. Therefore, future efforts should take into account the heterogeneity within the basin and develop sub-regional ESV coefficients based on ecological zoning (e.g., upstream water conservation zone, midstream soil and water conservation zone) to improve the accuracy of ESV coefficients. In addition, this study has certain limitations in its spatial statistical analysis. First, correlation tests are based on the assumption of independence, whereas significant spatial autocorrelation exists within the study area, which may lead to an inflated significance level. Second, no multiple comparison correction was applied to the 55 pairwise tests of ecosystem services, potentially increasing the risk of false positives. Therefore, interpretations of locally significant results should be approached with caution, and future studies may consider applying spatially adjusted or permutation-based methods to improve robustness.

4.4. Targeted Measures for Enhancing Ecosystem Service Value

Based on the results of this study, several targeted measures can be adopted to enhance ESV in the Yellow River Basin. First, ecological protection and restoration should be strengthened in the western high-value areas and grassland-dominated regions to maintain their core functions in water regulation, soil conservation, and biodiversity maintenance. Second, in the intensive agricultural zones of the middle and lower reaches, coordination between food production and water resources should be optimized. This can be achieved through the promotion of efficient irrigation technologies, water-saving agricultural practices, and ecological compensation mechanisms, thereby alleviating trade-off pressures between food production and other ecosystem services. Furthermore, multi-factor management considering topography, climate, population density, and land use should be implemented to enhance synergies among ecosystem service functions.
These measures are not only applicable to the Yellow River Basin but also provide a reference for other arid and semi-arid basins with similar characteristics. In basins with climatic conditions, land-use patterns, and water resource distributions comparable to those of the Yellow River Basin, strategies such as grassland and forest protection, strengthening of regulating services, and optimization of agricultural water management may effectively enhance regional ESV. However, implementation should be tailored to the specific natural and socio-economic conditions of each basin to ensure feasibility and effectiveness.

5. Conclusions

This research meticulously examined the spatiotemporal patterns of ESV in the Yellow River Basin from 2000 to 2023. Additionally, the OPGD model was used to identify the primary factors influencing its spatial differentiation. The main conclusions of the investigation are as follows:
(1) Grassland and cultivated land together accounted for approximately 80% of the land area in the Yellow River Basin and represented the primary land use types. Land-use transitions primarily occurred between grassland and cultivated land. Although wetlands and snow-covered areas occupied relatively small proportions, the degree of land-use change in these areas was substantial.
(2) From 2000 to 2023, the total ESV in the Yellow River Basin displayed a general increase. Grassland consistently generated the highest percentage of ESV. Spatially, the ESV had a pattern with greater values in the west and lower levels in the east, with high-value areas showing a tendency to cluster along the River. The spatial distribution exhibited a significant positive correlation and clustering. Regulating services served as the dominant ecosystem service function in the Basin.
(3) Ecosystem services in the Yellow River Basin were predominantly characterized by synergistic relationships, with 81.8% of the service pairs showing positive correlations. A total of 55 interaction pairs were identified, including 45 positive, 9 negative, and 1 with no significant relationship. Trade-offs were mainly observed between food production and other ecosystem services, with the strongest trade-off occurring between food production and water supply. Over time, the strength of these relationships changed: 18 pairs showed an increase in coordination, 21 pairs declined, and 10 remained stable. This indicates that while the overall pattern of interactions remained relatively consistent, the intensity of relationships among services exhibited dynamic changes throughout the study period.
(4) Natural environmental factors were the primary drivers of the spatial differentiation of ESV in the Yellow River Basin. Key factors such as NDVI, population density, DEM, annual average temperature, and slope were identified as the most influential. The interaction detection results revealed that the combined effects of multiple factors had a more significant impact on ESV than any individual factor, with each pairwise interaction yielding a greater effect than the individual factors alone.
The methodology developed in this study for assessing the temporal dynamics of ESV in the Yellow River Basin can be potentially applied to other international contexts, particularly in arid and semi-arid river basins that share similar ecological, climatic, and socio-economic characteristics. Its advantages include the ability to capture spatial heterogeneity, account for multi-factor interactions, and provide a robust framework for linking ecosystem service dynamics with human activities. Limitations include the reliance on high-quality spatial and temporal data and the need for careful calibration of value coefficients to ensure cross-regional comparability. Overall, the study demonstrates the added value of integrating optimized-parameter GeoDetector analysis and sensitivity assessments, offering a transferable approach that can support ecosystem management and policy planning in other complex river basins globally.

Author Contributions

Conceptualization, W.Y.; methodology, W.Y.; software, W.Y.; validation, W.Y., Z.J. and Y.L.; formal analysis, W.Y. and L.W.; investigation, W.Y.; resources, W.Y.; data curation, W.Y.; writing—original draft preparation, W.Y.; writing—review and editing, W.Y. and C.W. and L.W.; visualization, W.Y.; supervision, C.W.; project administration, C.W.; funding acquisition, C.W. All authors have read and agreed to the published version of the manuscript.

Funding

This work was supported by the Natural Science Foundation of Shandong (Grant No. ZR2024MD034), the Taishan Scholars Project (Grant No. 20240821) and the Major Project of Key Research Bases for Humanities and Social Sciences Funded by the Ministry of Education of China (Grant No. 22JJD790015).

Data Availability Statement

The original contributions presented in the study are included in the article; further inquiries can be directed to the corresponding author.

Conflicts of Interest

The authors declare no conflicts of interest.

References

  1. Costanza, R.; D’Arge, R.C.; Groot, R.D.; Farber, S.B.; Grasso, M.; Hannon, B.M.; Limburg, K.E.; Naeem, S.; O’Neill, R.V.; Paruelo, J.M.; et al. The value of the world’s ecosystem services and natural capital. Nature 1997, 387, 253–260. [Google Scholar] [CrossRef]
  2. Wang, S.; Song, S.; Zhang, J.; Wu, X.; Fu, B. Achieving a fit between social and ecological systems in drylands for sustainability. Curr. Opin. Environ. Sustain. 2020, 48, 53–58. [Google Scholar] [CrossRef]
  3. Assessment, M.E. Ecosystems and Human Well-Being: Wetlands and Water; World Resources Institute: Washington, DC, USA, 2005. [Google Scholar]
  4. Taffarello, D.; Bittar, M.S.; Sass, K.S.; Calijuri, M.D.C.; Cunha, D.G.F.; Mendiondo, E.M. Ecosystem service valuation method through grey water footprint in partially-monitored subtropical watersheds. Sci. Total Environ. 2020, 738, 139408. [Google Scholar] [CrossRef]
  5. Zhou, Z.; Sun, X.; Zhang, X.; Wang, Y. Inter-regional ecological compensation in the Yellow River Basin based on the value of ecosystem services. J. Environ. Manag. 2022, 322, 116073. [Google Scholar] [CrossRef] [PubMed]
  6. Fu, B.; Li, Y.; Wang, Y.; Zhang, B.; Yin, S.; Zhu, H.; Xing, Z. Evaluation of ecosystem service value of riparian zone using land use data from 1986 to 2012. Ecol. Indic. 2016, 69, 873–881. [Google Scholar] [CrossRef]
  7. Helliwell, D.R. Valuation of wildlife resources. Reg. Stud. 1969, 3, 41–47. [Google Scholar] [CrossRef]
  8. Westman, W.E. How Much Are Nature’s Services Worth? Science 1977, 197, 960–964. [Google Scholar] [CrossRef]
  9. Daily, G.; Postel, S.; Bawa, K.; Kaufman, L. Nature’s Services: Societal Dependence on Natural Ecosystems; Bibliovault OAI Repository, the University of Chicago Press: Chicago, IL, USA, 1997. [Google Scholar]
  10. Xie, G.; Zhen, L.; Lu, C.X.; Zhang, Y.; Xiao, Y.; Cao, S.; Liu, C. Sustainability Status and Trends of China’s Development: An Assessment based on the Natural Resource Base. Resour. Sci. 2008, 30, 1349–1355. [Google Scholar]
  11. Xie, G.; Zhang, C.; Zhang, L.; Chen, W.; Li, S. Improvement of the Evaluation Method for Ecosystem Service Value Based on Per Unit Area. J. Nat. Resour. 2015, 30, 1243–1254. [Google Scholar]
  12. Tan, Z.; Guan, Q.; Lin, J.; Yang, L.; Luo, H.; Ma, Y.; Tian, J.; Wang, Q.; Wang, N. The response and simulation of ecosystem services value to land use/land cover in an oasis, Northwest China. Ecol. Indic. 2020, 118, 106711. [Google Scholar] [CrossRef]
  13. Liu, M.; Jia, Y.; Zhao, J.; Shen, Y.; Pei, H.; Zhang, H.; Li, Y. Revegetation projects significantly improved ecosystem service values in the agro-pastoral ecotone of northern China in recent 20 years. Sci. Total Environ. 2021, 788, 147756. [Google Scholar] [CrossRef]
  14. Pan, N.; Guan, Q.; Wang, Q.; Sun, Y.; Li, H.; Ma, Y. Spatial Differentiation and Driving Mechanisms in Ecosystem Service Value of Arid Region: A case study in the middle and lower reaches of Shule River Basin, NW China. J. Clean. Prod. 2021, 319, 128718. [Google Scholar] [CrossRef]
  15. Gómez-Baggethun, E.; Barton, D.N. Classifying and valuing ecosystem services for urban planning. Ecol. Econ. 2013, 86, 235–245. [Google Scholar] [CrossRef]
  16. Trégarot, E.; Touron-Gardic, G.; Cornet, C.C.; Failler, P. Valuation of coastal ecosystem services in the Large Marine Ecosystems of Africa. Environ. Dev. 2020, 36, 100584. [Google Scholar] [CrossRef]
  17. Villa, F.; Bagstad, K.; Johnson, G.; Voigt, B. Scientific instruments for climate change adaptation: Estimating and optimizing the efficiency of ecosystem service provision. Econ. Agrar. Recur. Nat. 2011, 11, 83–98. [Google Scholar]
  18. Sherrouse, B.C.; Semmens, D.J.; Ancona, Z.H. Social Values for Ecosystem Services (SolVES): Open-source spatial modeling of cultural services. Environ. Model. Softw. 2022, 148, 105259. [Google Scholar]
  19. Ouyang, Z.; Zheng, H.; Xiao, Y.; Polasky, S.; Liu, J.; Xu, W.; Wang, Q.; Zhang, L.; Rao, E.; Jiang, L.; et al. Improvements in ecosystem services from investments in natural capital. Science 2016, 352, 1455–1459. [Google Scholar] [CrossRef]
  20. Yang, L.; Zhang, S.; Yin, L.; Zhang, B. Global occupation of wetland by artificial impervious surface area expansion and its impact on ecosystem service value for 2001–2018. Ecol. Indic. 2022, 142, 109307. [Google Scholar] [CrossRef]
  21. Liu, H.; Lu, J.; Li, X.; Wang, Y.; Xu, D.; Yin, J.; Xu, G. Evaluating human-nature relationships at a grid scale in China, 2000–2020. Habitat Int. 2025, 156, 103282. [Google Scholar] [CrossRef]
  22. Åhlén, I.; Hambäck, P.A.; Thorslund, J.; Frampton, A.; Destouni, G.; Jarsjö, J. Wetlandscape size thresholds for ecosystem service delivery: Evidence from the Norrström drainage basin, Sweden. Sci. Total Environ. 2019, 704, 135452. [Google Scholar] [CrossRef]
  23. Nie, X.; Huang, C.; Wang, H. A new method to classify cultural ecosystem services and visualize their economic value: A case study of Guilin, a famous tourist destination in China. Ecosyst. Serv. 2025, 72, 101708. [Google Scholar] [CrossRef]
  24. Wang, W.; Xu, J.; Luan, X.; Zhang, Z. Wetland ecosystem service values in Beijing significantly increased from 1984 to 2020: Trend changes, type evolution, and driving factor. Ecol. Indic. 2024, 166, 112235. [Google Scholar] [CrossRef]
  25. Luan, C.; Liu, R.; Li, Y.; Zhang, Q. Comparison of various models for multi-scenario simulation of land use/land cover to predict ecosystem service value: A case study of Harbin-Changchun Urban Agglomeration, China. J. Clean. Prod. 2024, 478, 144012. [Google Scholar] [CrossRef]
  26. Zeng, S.; Jiang, C.; Bai, Y.; Wang, H.; Liu, E.; Guo, L.; Chen, S.; Zhang, J. Understanding scale effects and differentiation mechanisms of ecosystem services tradeoffs and synergies relationship: A case study of the Lishui River Basin, China. Ecol. Indic. 2024, 167, 112648. [Google Scholar] [CrossRef]
  27. Blanusa, T.; Garratt, M.; Cathcart-James, M.; Hunt, L.; Cameron, R. Urban hedges: A review of plant species and cultivars for ecosystem service delivery in north-west Europe. Urban For. Urban Green. 2019, 44, 126391. [Google Scholar] [CrossRef]
  28. Wei, L.; Mao, M.; Zhao, Y.; Wu, G.; Wang, H.; Li, M.; Liu, T.; Wei, Y.; Huang, S.; Huang, L.; et al. Spatio-temporal characteristics and multi-scenario simulation analysis of ecosystem service value in coastal wetland: A case study of the coastal zone of Hainan Island, China. J. Environ. Manag. 2024, 368, 122199. [Google Scholar] [CrossRef]
  29. Luo, Y.; Lü, Y.; Guo, X.; Liu, Y.; Zhang, L.; Li, T. The thresholds of forest-to-grassland ratios can be critical for harmonizing ecosystem service relationships spatiotemporally in dryland regions. Appl. Geogr. 2024, 169, 103334. [Google Scholar] [CrossRef]
  30. Yang, Y.; Yuan, X.; An, J.; Su, Q.; Chen, B. Drivers of ecosystem services and their trade-offs and synergies in different land use policy zones of Shaanxi Province, China. J. Clean. Prod. 2024, 452, 142077. [Google Scholar] [CrossRef]
  31. Wu, C.; Wang, Z. Multi-scenario simulation and evaluation of the impacts of land use change on ecosystem service values in the Chishui River Basin of Guizhou Province, China. Ecol. Indic. 2024, 163, 112078. [Google Scholar] [CrossRef]
  32. Liu, H.; Xing, L.; Wang, C.; Zhang, H. Sustainability assessment of coupled human and natural systems from the perspective of the supply and demand of ecosystem services. Frontiers in Earth Science. Front. Earth Sci. 2022, 10, 1025787. [Google Scholar] [CrossRef]
  33. Hu, X.; Hong, W.; Qiu, R.; Hong, T.; Chen, C.; Wu, C. Geographic variations of ecosystem service intensity in Fuzhou City, China. Sci. Total Environ. 2015, 512–513, 215–226. [Google Scholar]
  34. Zhang, Z.; Tong, Z.; Zhang, L.; Liu, Y. What are the dominant factors and optimal driving threshold for the synergy and tradeoff between ecosystem services, from a nonlinear coupling perspective? J. Clean. Prod. 2023, 422, 138609. [Google Scholar] [CrossRef]
  35. Zhang, Y.; Wang, Y.; Fu, B.; Lü, Y.; Liang, X.; Yang, Y.; Ma, R.; Yan, S.; Wu, X. Identification of critical ecological areas using the ecosystem multifunctionality-stability-integrity framework: A case study in the Yellow River basin, China. J. Environ. Manag. 2023, 348, 119296. [Google Scholar] [CrossRef] [PubMed]
  36. Zhang, X.; Liu, K.; Wang, S.; Wu, T.; Li, X.; Wang, J.; Wang, D.; Zhu, H.; Tan, C.; Ji, Y. Spatiotemporal evolution of ecological vulnerability in the Yellow River Basin under ecological restoration initiatives. Ecol. Indic. 2022, 135, 108586. [Google Scholar] [CrossRef]
  37. Yang, Y.; Qin, T.; Yan, D.; Liu, S.; Feng, J.; Wang, Q.; Liu, H.; Gao, H. Analysis of the evolution of ecosystem service value and its driving factors in the Yellow River Source Area, China. Ecol. Indic. 2024, 158, 111344. [Google Scholar] [CrossRef]
  38. Li, Y.; Hao, S.; Han, Q.; Guo, X.; Zhong, Y.; Zou, T.; Fan, C. Study on urban economic resilience of Beijing, Tianjin and Hebei based on night light remote sensing data during COVID-19. Sci. Remote Sens. 2024, 9, 100126. [Google Scholar] [CrossRef]
  39. Jing, X.; Tian, G.; He, Y.; Wang, M. Spatial and temporal differentiation and coupling analysis of land use change and ecosystem service value in Jiangsu Province. Ecol. Indic. 2024, 163, 112076. [Google Scholar] [CrossRef]
  40. He, X.; Cai, C.; Tang, J.; Shi, J.; Yang, R. Analysis of coupling coordination and obstacle factors between tourism development and ecosystem services value: A case study of the Yellow River Basin, China. Ecol. Indic. 2023, 157, 111234. [Google Scholar] [CrossRef]
  41. Wang, J.; Xu, C. Geodetector: Principle and prospective. Acta Geogr. Sin. 2017, 72, 116–134. [Google Scholar]
  42. Song, Y.; Wang, J.; Ge, Y.; And Xu, C. An optimal parameters-based geographical detector model enhances geographic characteristics of explanatory variables for spatial heterogeneity analysis: Cases with different types of spatial data. GISci. Remote Sens. 2020, 57, 593–610. [Google Scholar]
  43. Ji, Q.; Feng, X.; Sun, S.; Zhang, J.; Li, S.; Fu, B. Cross-scale coupling of ecosystem service flows and socio-ecological interactions in the Yellow River Basin. J. Environ. Manag. 2024, 367, 122071. [Google Scholar] [CrossRef]
  44. Zhang, S.; Huang, C.; Li, X.; Song, M. The spatial–temporal evolution and influencing factors of the coupling coordination of new-type urbanization and ecosystem services value in the Yellow River Basin. Ecol. Indic. 2024, 166, 112300. [Google Scholar] [CrossRef]
  45. Yuan, D.; Du, M.; Yan, C.; Wang, J.; Wang, C.; Zhu, Y.; Wang, H.; Kou, Y. Coupling coordination degree analysis and spatiotemporal heterogeneity between water ecosystem service value and water system in Yellow River Basin cities. Ecol. Inform. 2024, 79, 102440. [Google Scholar] [CrossRef]
  46. Zhang, Q.; Wang, G.; Yuan, R.; Singh, V.P.; Wu, W.; Wang, D. Dynamic responses of ecological vulnerability to land cover shifts over the Yellow river Basin, China. Ecol. Indic. 2022, 144, 109554. [Google Scholar] [CrossRef]
  47. Su, C.; Fu, B. Evolution of ecosystem services in the Chinese Loess Plateau under climatic and land use changes. Glob. Planet. Change 2013, 101, 119–128. [Google Scholar] [CrossRef]
  48. Zhang, Y.; Zhao, Z.; Zhu, J.; Wang, Y.; Wang, H.; Fu, B.; Lü, Y.; Jiang, W.; Hu, Y.; Wu, X. The dynamic patterns of critical ecological areas in the Yellow River Basin are driven primarily by climate factors but threatened by human activities. J. Environ. Manag. 2024, 371, 123282. [Google Scholar] [CrossRef]
Figure 1. Land use types in the Yellow River Basin.
Land 14 01907 g001
Figure 2. Land use changes in the Yellow River Basin (2000–2023). Note: (ac) 2000–2023 Land Use Type Map; (d) Land Use Dynamic Degree; (e) Land Use Transition Matrix.
Land 14 01907 g002
Figure 3. ESV by land type and its changes.
Land 14 01907 g003
Figure 4. Spatial distribution of land use and ESV in the Yellow River Basin. Note: (ac) Evolution of the Temporal-Spatial Pattern of ESV; (d) ESV Changes from 2000 to 2023.
Land 14 01907 g004
Figure 5. LISA cluster map of ESV in the Yellow River Basin.
Land 14 01907 g005
Figure 6. Correlation coefficients of ES synergies in the Yellow River Basin. Note: (ac) Correlation coefficients of ES synergies; (d) Changes in Trade-off Coordination Degree from 2000 to 2023; See Table 2 for explanation of X1 to X11; *** indicates p < 0.01.
Land 14 01907 g006
Figure 7. Results for interaction detection between the driving factors of ESV in the Yellow River Basin. Note: * and ** represent nonlinear enhancement and bilinear enhancement, respectively.
Land 14 01907 g007
Table 1. Data types and sources.
DataResolution (m)Data Source
DEM30Geospatial Data Cloud (https://www.gscloud.cn) (accessed on 20 May 2024)
Land use30Wuhan University (https://zenodo.org/records/12779975) (accessed on 18 June 2024)
Precipitation1000National Tibetan Plateau Data Center (https://data.tpdc.ac.cn) (accessed on 9 July 2024)
NDVI1000Resource and Environment Science Data Center (https://www.resdc.cn/) (accessed on 26 August 2024)
NPP500Net Primary Productivity (NPP) product MOD17A3H from the Moderate Resolution Imaging Spectroradiometer (MODIS), US Geological Survey (https://lpdaac.usgs.gov) (accessed on 15 October 2024)
Population1000The LandScan dataset, Oak Ridge National Laboratory (https://landscan.ornl.gov/) (accessed on 30 November 2024)
Nighttime light1000National Earth System Science Data Center (http://www.geodata.cn) (accessed on 12 January 2025)
Road networkVectorOpenHistoricalMap (https://www.openhistoricalmap.org/) (accessed on 8 April 2025)
Statistical data-Provincial and municipal statistical yearbooks, national agricultural cost–benefit compilations
Table 2. ESV coefficients for the Yellow River Basin (yuan/hm2).
Primary CategorySecondary CategoryVariableCroplandForestShrubGrasslandWaterSnowWetlandBarren
Provisioning servicesFood supplyX12049.96507.07352.48432.871484.131484.13946.1318.55
Raw material supplyX2454.511168.75797.72636.94426.68426.68927.5855.65
Water supplyX3−2420.99606.02408.13352.4815,379.3315,379.334804.8837.10
Regulating servicesGas regulationX41651.093846.382615.782238.561428.471428.473524.81204.06
Climate regulationX5862.6511,502.047847.355917.984248.334248.336678.60185.51
Environmental
purification
X6250.443345.482374.611954.1010,296.1810,296.186678.60575.10
Hydrological regulationX72773.477167.126214.814334.90189,672.30189,672.344,950.7389.58
Supporting servicesSoil conservationX8964.684681.203190.882727.091725.301725.304285.43241.17
Nutrient cyclingX9287.55358.66241.17210.25129.86129.86333.9318.55
Maintaining biodiversityX10315.374260.722912.612479.744730.674730.6714,600.16222.62
Cultural servicesProviding an aesthetic
landscape
X11139.131867.531280.061094.543506.263506.268774.9492.75
Total/ 7327.9139,310.9928,235.6422,379.53233,027.54233,027.5196,505.792040.68
Table 3. Sensitivity Index.
200020052010201520202023
Cropland0.47980.38940.48950.37310.48590.4103
Forest0.19060.19210.19670.20410.21280.2184
Shrub0.00910.00840.00730.00650.00630.0056
Grassland0.63070.63090.62380.62110.60670.6025
Water0.06700.07320.07820.07930.08580.0833
Snow0.00430.00500.00780.00520.00330.0058
Barren0.00300.00070.00130.00110.00260.0011
Wetland0.00440.00380.00320.00310.00300.0029
Table 4. ESV changes in the Yellow River Basin (108 yuan).
Primary ClassificationSecondary Classification200020052010201520202023Changes
ESVESVESVESVESVESV2000–2023
Provisioning servicesFood supply662.6844650.5023643.0673635.5617637.444640.1825−3.40%
Raw material supply484.5945487.7621491.2848492.6368493.5889494.31312.01%
Water supply−197.147−166.196−138.681−128.077−123.793−129.128−34.50%
Regulating servicesGas regulation1692.4611702.5071713.7061717.4061719.7351721.7411.73%
Climate regulation3865.8543926.4713981.7254010.9814018.6044021.9254.04%
Environmental purification1297.071318.0571339.1231346.1021350.9731349.2724.02%
Hydrological regulation4124.4114239.824391.8624382.2584465.8554457.6168.08%
Supporting servicesSoil conservation1849.7761870.7151890.281899.2451900.9031901.5872.80%
Nutrient cycling185.4406185.2791185.5755185.3518185.7053186.11140.36%
Maintaining biodiversity1590.1751611.6671635.7671645.7021650.7091647.4983.60%
Cultural servicesProviding an aesthetic landscape708.8584718.2812730.0765734.2279737.5522735.48233.76%
Total16,075.3116,386.4316,656.4316,762.8316,884.516,859.414.88%
Table 5. Explanatory power of driving factors for ecosystem service value in the Yellow River Basin.
Driving Factorq Valuep Value OrderDriving Factorq Valuep Value Order
D10.11760.00003D60.11600.00004
D20.10510.00005D70.03000.00009
D30.23970.00001D80.16080.00002
D40.09460.00006D90.05990.00007
D50.03260.00008D100.0027 0.5132/
Note: D1–D10 represent DEM, slope, NDVI, NPP, annual precipitation, annual average temperature, GDP, population density, road network density, and the proportion of construction land.
Disclaimer/Publisher’s Note: The statements, opinions and data contained in all publications are solely those of the individual author(s) and contributor(s) and not of MDPI and/or the editor(s). MDPI and/or the editor(s) disclaim responsibility for any injury to people or property resulting from any ideas, methods, instructions or products referred to in the content.