Abstract
Vegetation serves as a crucial indicator for monitoring ecosystems and plays a vital role. This paper employs remote sensing techniques to monitor vegetation in Taojiang County, aiming to explore the effects of ecological restoration projects on vegetation in mining areas. The study uses the Theil–Sen median slope and Mann–Kendall tests to analyze the trend of fractional vegetation coverage (FVC) changes in mining areas, the CASA model to estimate net primary productivity (NPP) in mining areas, and random forest models to assess the importance of influencing factors. Overall, FVC in the study area has slightly increased from 0.729 to 0.847. The FVC in mining areas reached its lowest point at 0.423 in 2011 and recovered to 0.718 in 2023 due to artificial restoration. From 2004 to 2011, FVC in mining areas showed an overall downward trend, while from 2013 to 2023, it showed an overall upward trend. The trend of NPP in mining areas is similar to that of FVC, with NPP being 939.8 g/m2 y in 2004, 2011, and 2020, 788.3 g/m2 y in 2011, and 855.7 g/m2 y in 2020. Results from the random forest simulation indicate that the primary factor affecting FVC in mining areas is distance from roads, followed by elevation. This study finds that ecological restoration projects play a significant role in achieving ecological recovery and sustainable development in mining areas.
1. Introduction
Vegetation constitutes 20% of the Earth’s surface, serving as a crucial indicator for monitoring ecosystem changes and significantly contributing to both ecological and societal development [1,2]. Net primary productivity (NPP) refers to the amount of organic matter accumulated in vegetation per unit area [3]. Vegetation absorbs carbon dioxide from the atmosphere and sequesters it in organisms and soil, directly participating in the carbon cycle and playing an important role in carbon sink [4]. There are many factors affecting vegetation cover and forest carbon sink, which are not only affected by natural factors, but also affected by human factors, among which human factors account for a larger proportion [5,6,7]. Mining activities exert the most significant impact on vegetation among anthropogenic influences. In recent years, frequent mining activities have severely harmed vegetation [8], with open mining causing the most significant damage [9]. These mining operations modify plant cover at a localized scale [10]. By 2017, 3.9 × 10⁴ km2 of land had been mined [11]. The carbon sink of forest is also affected by mining activities. Therefore, it is very important to investigate the vegetation change law within the mining area for ecological environment protection and carbon neutrality.
This study focusses on the stone coal mining region as the subject of investigation. Stone coal is a fuel characterized by low carbon content and poor calorific value, typically combined with various heavy metals [12], which can generate pollution similar to that of coal [13]. The mining process of stone coal also affects the natural environment, in addition to the influence of the combustion process. The predominant mining technique employed in stone coal extraction is open-pit mining, which inflicts significant harm to the vegetation within the mining vicinity during the extraction process [14]. Besides the mining technique, other human factors will also influence the mining vegetation [15]. In order to restore the damaged vegetation and carbon sink capacity, artificial restoration has become the main means [16]. In recent years, the policy attaches more and more importance to the ecological restoration of mining areas [17].
Satellite remote sensing provides a powerful tool for monitoring vegetation cover change; this study uses remote sensing to monitor the changes of vegetation and carbon storage in mining areas [18]. In prior research, vegetation indices gleaned from satellite-based remote sensing imagery, like the Normalized Difference Vegetation Index (NDVI), Enhanced Vegetation Index (EVI), and Leaf Area Index (LAI), have shown themselves to be quite the ticket for portraying regional vegetation shifts [19,20,21,22]. Recent research has mainly employed an improved vegetation index, namely the fractional vegetation coverage (FVC), for vegetation change monitoring [23,24]. FVC denotes the proportion of the vertically projected vegetative area to the total ground area and is a crucial indicator of ecological quality [25,26]. In this study, we made use of remote sensing imagery from the Landsat series of satellites, and the change of vegetation carbon sink in the mining area was estimated. By computing the Fractional Vegetation Cover (FVC), we were able to assess the vegetation coverage in the mining area. One of the hallmarks of the Landsat satellite imagery is its high-resolution quality and the fact that it allows for long-term monitoring [27]. Remote sensing image data with long time series can more easily describe the change process of vegetation, and it is more realistic to monitor the ecological environment through long time series remote sensing images [8].
Previous studies predominantly focused on the impact of natural factors on vegetation. In Ma et al. research, the main emphasis was placed on how climate affects grassland vegetation, while the effects of human activities on vegetation were largely overlooked [28]. In Bai et al. research, the main emphasis was on how climate affected grassland vegetation, with the impacts of human-induced activities on vegetation being neglected [29]. This study examined the influence of natural and anthropogenic factors on vegetation, and the influence of ecological restoration projects on vegetation was analyzed. Utilizing the random forest model to examine the determinants influencing vegetation, we established that anthropogenic factors impact vegetation cover in localized regions, while natural factors also influence vegetation within the same scope. In this study, an InVest model and CASA model were used to investigate the vegetation change in the mining area and the impact of ecological restoration project on NPP, so as to investigate the contribution of an ecological restoration project to carbon sink. The impact of mining and ecological restoration on the ecological environment of the mining area is shown in Figure 1.
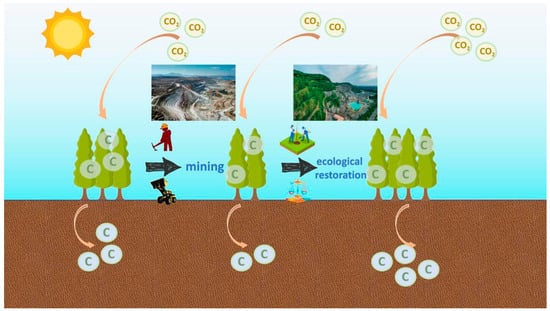
Figure 1.
The impact of mining and ecological restoration on mine ecology.
The objective of this research is to explore the elements affecting vegetation cover in Taojiang County and achieve the subsequent goals: (1) study the temporal variation characteristics of FVC within the mining area; (2) analyze the trend of FVC changes in the mining area using the Theil–Sen median slope and Mann–Kendall test; (3) investigate the contribution of ecological restoration projects to carbon sinks using the InVest model and CASA model; and (4) explore the importance of factors affecting FVC using the random forest model.
2. Research Area
The research area is situated in Taojiang County, Yiyang City, Hunan Province, which is abundant in mineral resources, particularly stone coal. Stone coal in Taojiang County is characterized by shallow burial, wide distribution, easy mining, and high pollution. In the mining history of more than 100 years, the method of open-pit mining has caused serious damage to the ecosystem of Taojiang County. The pollution of Songmutang town is the most serious in Taojiang County, so Songmutang town is selected as the monitoring area.
In China’s central environmental protection supervision, the environmental pollution and ecological damage of the stone coal mine in Yiyang city are very prominent, threatening the safety of Dongting Lake and the ecological environment. The pollution problem of stone coal mines in Yiyang city is serious, and there are still many stone coal mines left over from history. By gathering data and conducting interviews with relevant personnel, 27 stone coal mining regions in Taojiang County have been identified. Spanning a total area of 1,131,147.3 square meters, these areas are predominantly located in the northern and western parts of Taojiang County, as depicted in Figure 2. Owing to years of haphazard mining, the local ecological environment has been badly hit. Even following the closure of the mines, the problem of mine wastewater still lingers and has not been fully addressed. However, after ecological restoration projects, the vegetation damage in the mining area has been restored, and the ecological environment has been initially repaired.
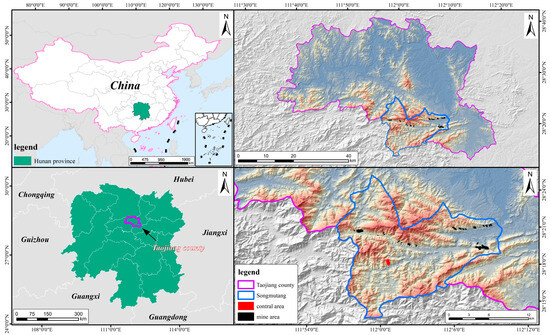
Figure 2.
Summary of monitoring area.
Out of the 27 stone coal mining zones, one was selected as a typical case for examination. The focus was on looking into the changes in FVC both before and after the ecological restoration efforts in the stone coal mining site and evaluating the effect of these restoration schemes. In Taojiang County, a control area free from human interference was marked out to gauge the impact of natural elements on FVC. The locations of the selected typical mining area and control area are shown in Figure 2.
3. Method
3.1. Data Source
The remote sensing image data employed in this study come from the Landsat series of satellites, which feature long-term monitoring and high resolution [30], which is suitable for long-term monitoring of vegetation changes in a mining area. The remote sensing imagery was obtained from the US Geological Survey website. The Collection 2 Level-1 image data downloaded have been preprocessed and do not require additional radiation calibration or bridge correction [31]. To mitigate the influence of clouds on the data, the utilized dataset aims to circumvent the cloud coverage over Taojiang County to enhance data accuracy. FVC was calculated from the data using ENVI 5.3 software. This study selected the remote sensing images without cloud cover every year as the research data. Table 1 presents the specifics of the data utilized in this study, encompassing the sensor model and temporal aspects. I will share my remote sensing data publicly.

Table 1.
Remote sensing data information.
3.2. The Calculation Method of the NDVI
The standard dense time-series NDVI functions as an efficient model and parameter indicator for vegetation classification and environmental surveillance [32]. The calculation method of NDVI is as follows (1) [33]:
where NIR denotes the reflectance of the near-infrared band, while RED represents the reflectivity of the red-light band.
3.3. The Calculation Method of the FVC
FVC has a high correlation with NDVI, Ref. [34] and FVC was calculated from NDVI obtained in this study. FVC is calculated by using the pixel dichotomy model in ENVI 5.6 software. FVC is calculated as shown in Formula (2) [35]:
where NDVIsoil represents the NDVI value of a pixel consisting solely of bare ground, while NDVIveg denotes the NDVI value of a pixel comprised entirely of vegetation. In principle, NDVIsoil should be approximately 0, while NDVIveg should approach 1. This study determines the upper and lower NDVI thresholds at a 5% confidence level, averaging the regions with the 95% and 5% NDVI values to derive NDVIsoil and NDVIveg.
To better describe the FVC, the calculated FVC is divided into five categories, and the classification results are shown in Table 2:
Table 2.
Classification of vegetation coverage.
3.4. Trend Testing Method
FVC concluded utilizing the Theil–Sen median slope and the Mann–Kendall test. The Theil–Sen median slope effectively mitigates the influence of outliers by addressing the limitations of linear trends to enhance accuracy [36]. This paper employs the Theil–Sen median slope, utilizing the subsequent formula [37]:
where 1 < i < j < n and n represent the length of the sequence. NDVIi and NDVIj refer to the vegetation indices at times i and j. The symbol θ denotes the trend in vegetative change. When θ > 0, a positive trend over time is indicated, while a negative value indicates a downward trend.
The nonparametric Mann–Kendall trend test is commonly employed to evaluate the significance of monotonic trends within time-series data [38]. The calculation formula is as follows [39]:
where n represents the number of data points, while the data values in the time series are denoted as i and j (j > i), and are defined by symbolic functions as follows:
The variance was calculated by the formula of
where n is the number of samples, q is the number of juxtaposed groups, and represents the amount of data with the same value. Given a sample size of n > 10, the Z test statistic from the standard normal distribution was computed using Equation (7):
Positive S of Z indicates an increasing trend, while negative Z indicates an S value showing a decreasing trend. The time series changed significantly at the significance level of > for Z < − or for α < 0.05. Otherwise, the time series did not change significantly at the significance level of α > 0.05.
3.5. NPP Count
In this study, a CASA model was used to calculate the carbon storage in mining areas. The CASA model calculated NPP based on light energy utilization through remote sensing images. The estimation formula of NPP was as follows [40]:
where x represents pixels, and t represents time. NPP(x,t) indicates the NPP absorbed by pixel x in month t, measured in g/m2. APAR(x,t) indicates the photosynthetically active radiation absorbed by pixel x in month t, measured in MJ/m2. indicates the actual light use efficiency of pixel x in month t, measured in g/MJ.
The ε used in this study is consistent with Zhu’s study [40], and the ε parameters are shown in Table 3.
Table 3.
Carbon density by section (t/hm2).
3.6. Random Forest Model
The random forest model comprises numerous decision trees that integrate regression trees and lifting techniques, facilitating the creation of multiple simple tree models, which are subsequently amalgamated into the final optimization model [41]. Random forests possess the ability to manage various types of predictive variables without necessitating data transformation or optimization [42]. The random forest regression model is constructed by aggregating multiple decision trees derived from the CART algorithm, with each tree trained on a dataset of randomly selected variables [43]. As each training dataset was sampled randomly, we conducted the process 10 times and averaged the outcomes to confirm the validation results’ reliability.
This study employed Landsat imagery to investigate vegetation changes in mining areas, utilizing ENVI software to calculate the FVC of the mining area. The median slope of Theil–Sen and Mann–Kendall test were used to explore the variation trend of FVC in the mining area. The CASA software was used to evaluate the NPP changes caused by mining activities. Finally, a random forest model was implemented to identify factors influencing vegetation conditions in the mining area. The comprehensive findings are presented in Figure 3.
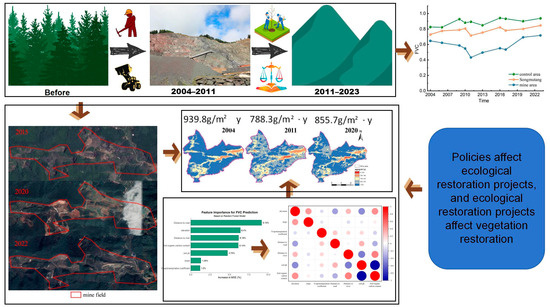
Figure 3.
Research overall profile.
4. Results and Analysis
4.1. Temporal Change in the FVC
The temporal trend of FVC was analyzed by calculating the overall average FVC in Songmutang town, mining area, and control area. From 2004 to 2023, the overall FVC in Taojiang County increased slightly, increasing from 0.729 to 0.847. In the selected control zone, the FVC stayed fairly steady, which was in line with the overall pattern of FVC variations in Taojiang County. This indicates that from 2004 to 2023, natural elements did not have a substantial impact on the vegetation in Taojiang County. FVC exhibited a pattern of decline initially, followed by a subsequent rise, a trend illustrated in Figure 4. Throughout its ongoing mining operations up to 2011, the FVC in the mining region, specifically in Mine FVC, experienced a drop from 0.647 in 2003 to 0.432 by 2011. After 2011, influenced by Chinese policies, a progressive cessation of mining activities took place. In 2013, Taojiang County was identified as a vital ecological function zone at the national level. To enhance the local ecological landscape, efforts have been initiated to manage the environmental aspects of the region’s historical stone coal mining sites. This includes the consolidation and cessation of operations at these mining locations. Gradually, governance projects began to be implemented, the destruction of the vegetation was suppressed, and the mine FVC gradually recovered after 2011. It achieved a maximum of 0.718 in 2023. After 2018, the investment in Taojiang County was increased, the FVC recovery in Taojiang County was accelerated, and the devastated mines were effectively restored.
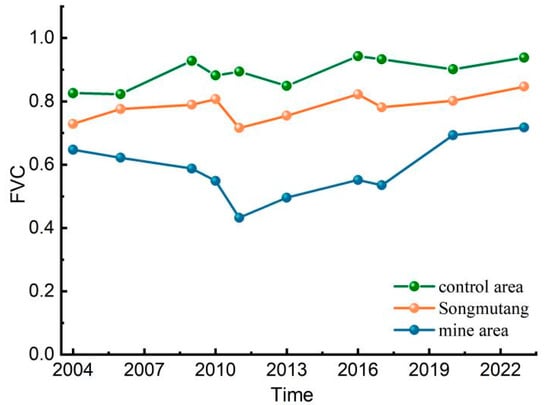
Figure 4.
The FVC time variation situation.
The trends of FVC in mining areas were proved via Theil–Sen median slope analysis, and the outcomes were later corroborated by the Mann–Kendall test. The FVC analysis results covering the periods from 2004 to 2011 and from 2013 to 2023 are depicted in Figure 5A and Figure 5B respectively. According to the change of FVC, it is divided into four grades, namely, vegetation degradation, recover normal, recover well, and recover excellently. Values less than 0 were defined as vegetation degradation, values of 0–0.05 as recover normal, values of 0.05–0.15 as recover well, and values greater than 0.15 as recover excellent. From 2004 to 2011, extensive regions of the mining area exhibited a trend of vegetation degradation. Between 2013 and 2023, the majority exhibited recovery, while a minor area demonstrated vegetation degradation. The Mann–Kendall method was employed to assess FVC, and the results depicted in Figure 5C,D indicate a significant trend in vegetation change between 2004 and 2011, characterized by a decline in overall FVC in the mining area and substantial vegetation degradation during this timeframe. From 2013 to 2024, significant alterations in vegetation were observed, with the overall FVC in the mining area exhibiting an upward trajectory, indicating a pronounced effect of vegetation restoration during this timeframe.
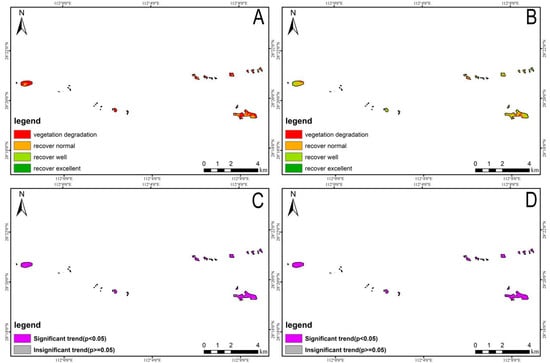
Figure 5.
(A) Change trend of FVC in mining area from 2004–2011. (B) Change trend of FVC in mining area from 2013–2023. (C) FVC Mann–Kendall test in mining area from 2004–2011. (D) FVC Mann–Kendall test in mining area from 2013–2023.
4.2. Characteristics of Typical Regional FVC
The typical mining area selected is the Yangjiadong Stone coal mining area, with an area of 488,000 square meters. In 2020, the mining area will initiate a legacy pollution control project to manage waste residue and wastewater, as well as to conduct ecological restoration. Figure 6 illustrates a notable increase in the area of sparse vegetation coverage in Yangjiadong attributable to mining activities from 2004 to 2017. The proportion of FVC in typical mining areas from 2004 to 2023 is shown in Table 4. In 2004, the mining area exhibited a lack of significant vegetation. By 2011, minimal vegetation coverage in the area had increased to 0.171, reflecting a gradual rise that paralleled the expansion of mining operations. In 2017, the open-pit mining activities led to the permanent destruction of the local flora, leaving the area with a strikingly low vegetation coverage ratio of just 0.136 even after mining operations ceased. However, after the implementation of a rehabilitation project in 2020, there has been a notable recovery in vegetative cover within the mining site. In 2020, the vegetation in the mining was almost completely destroyed. The combined proportion of areas with extremely low and low vegetation cover dropped from 0.327 in 2017 to a mere 0.031 in 2020, which substantially reduced the expanse of barren land in the mining zone. After several years of natural restoration, the growth of man-made vegetation was quite remarkable. In 2023, there was a modest uptick in areas with low vegetation, despite a lack of very low coverage. Additionally, the percentage of good-to-excellent vegetation coverage saw an improvement of 0.116. Within the mining region, the share of high-quality vegetation coverage surged from 0.05 in 2004 to 0.374 by 2023.
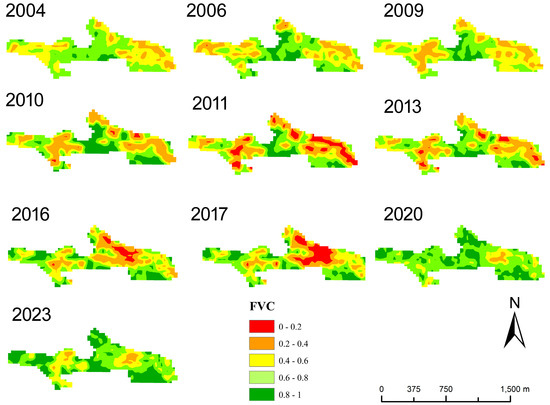
Figure 6.
Vegetation coverage in the typical mining area from 2004 to 2023.
Table 4.
Distribution of FVC at each grade within the typical mining area from 2004 to 2023.
The FVC of typical mining areas is divided into five categories, and the distribution is shown by the bar chart (Figure 7). It is evident that the percentage of very low and low vegetation coverage in the mining area increased gradually between 2004 and 2011, remained essentially unchanged between 2013 and 2017, and then declined in 2020.
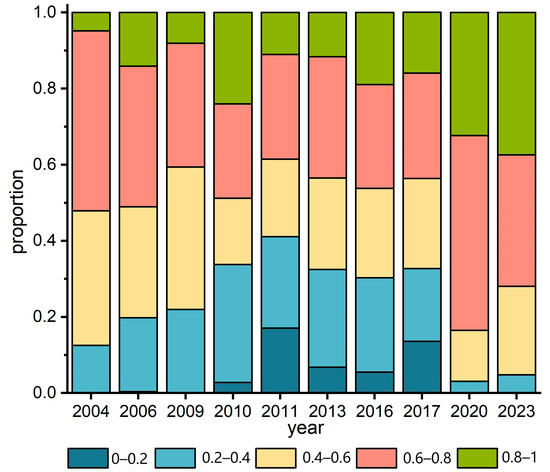
Figure 7.
Distribution of FVC grades in typical mining areas from 2004 to 2023.
The means of using remote sensing images is very mature, and there are many new images to monitor mining areas [44]. The vegetation change process (Figure 8) within the mining area can be more clearly observed by satellite remote sensing images. The 2015 remote sensing image reveals an extensive expanse of barren land within the mining region. In the open-pit mining of stone coal, it is challenging to cultivate vegetation in the original area following the removal of the surface and the application of soil. In the 2020 remote sensing images, following the execution of the ecological restoration project in the mining area, distinct evidence of artificial vegetation is observable. Although much of the barren land has been vegetated, the growth of vegetation requires a cycle, resulting in inadequate coverage in certain areas. In 2022, the artificial planting of vegetation is generally stabilized after a certain growth cycle, and it is difficult to see the bare land in the remote sensing map, and the vegetation coverage is good. There is no evidence of waste residue accumulation or wastewater buildup in the mining area. The ecological restoration project has yielded significant outcomes, rehabilitating the region’s environment that had experienced severe degradation.
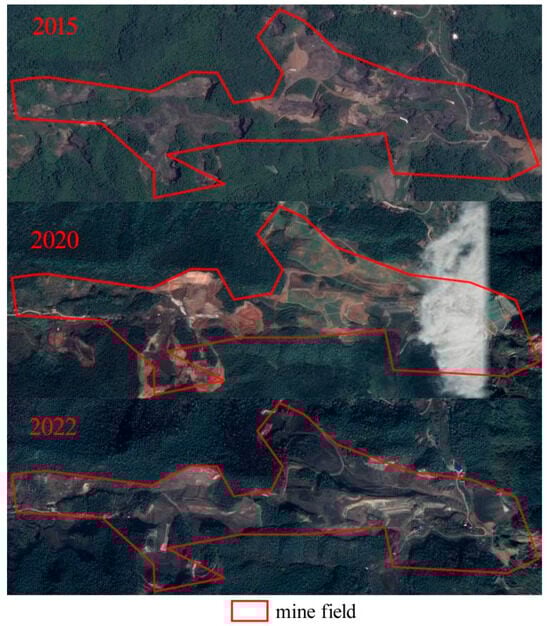
Figure 8.
Remote sensing image map of typical mining area in 2015, 2020, and 2022.
4.3. Time Variation of NPP in Mining Area
Figure 9 shows the spatial distribution of NPP in three years before, after, and during the mining of Songmutang town. The NPP of the mining area is related to regional land use types, NDVI, solar radiation, and climate change. The NPP in the mining area was 939.8 g/m2·y in 2004, 788.3 g/m2·y in 2011, and 855.7 g/m2·y in 2020. During the mining phase from 2004 to 2011, the rate of change in NPP reached 21.6 g/m2·y. The vegetation destruction caused by mining led to a continuous decline in NPP, reaching its lowest point in 2011. After 2011, due to policy and ecological restoration projects, the NPP in the mining area continued to rise, with a change rate of 7.5 g/m2·y, a much slower rate of increase than the decrease. After the ecological restoration project, changes in NPP indicate a slow recovery of vegetation in the mining area. Under the ongoing restoration process, NPP may return to pre-mining levels. The implementation of ecological restoration projects is of great significance for achieving carbon neutrality.
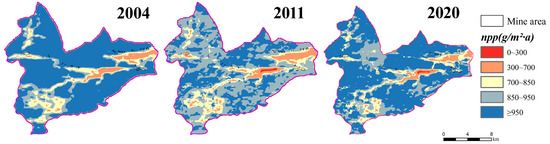
Figure 9.
Spatial distribution map of NPP in the study area in 2004, 2011, and 2020.
4.4. Analysis of the Importance of Influencing Factors
The findings underscore the importance of evaluating the key factors that affect vegetation recovery using a random forest model. This model gauges each feature’s impact on predicting vegetation recovery by calculating the Increase in Mean Squared Error (MSE) (%) for every variable considered. Seven factors affecting vegetation recovery were selected and input into the random forest model, and the importance of each index was obtained according to the model. The random forest algorithm is random, and each calculation obtains a different feature importance score [45], so the comprehensive analysis of the results after 10 calculations will get the final results.
There are many factors that affect the vegetation in mining areas. Previous studies have proved that human factors, such as mining activities, can seriously affect the vegetation and will lead to a series of ecological and environmental problems [46]. Human factors also have an important impact on vegetation recovery [47]. Other natural factors also have an important influence on FVC in mining areas, such as altitude and the water system. Seven influencing factors were selected to combine natural and human factors. Among the natural factors, the influence of altitude on vegetation is considered first. The altitude affects environmental indicators such as temperature and humidity, which in turn affects vegetation growth [48]. Secondly, the slope in the growth area also affects the growth of vegetation. In the area with a large slope, the vegetation coefficient can easily cause a landslide, which affects the growth of vegetation [49]. The effect of evaporation and transpiration coefficients on vegetation affect the growth of vegetation by affecting its transpiration [50]. Water is a necessary condition for vegetation growth, so the distance from the river is also one of the factors to be considered. Soil ph value is an important indicator in soil testing. A higher pH will affect the availability of heavy metals in the soil, and also affect the content of other nutrients [51]. The content of organic matter in soil also affects the content of nutrients in soil, so it is also used as an indicator for model simulation [52]. The human factors selected in most studies include population density, GDP density, and distance from towns etc. [15]. However, because they belong to the same town, this study only considers the distance from the road as a human factor.
As can be seen from the model results (Figure 10), the importance of each factor to the prediction of vegetation recovery is ranked as follows. Distance to road: of the highest importance—the increase in MSE is 9.15%. Elevation: the second in importance—the increase in MSE is 6.4%. The importance of the other factors is, in this order: the increase in MSE of distance to river—6.18%; the increase in MSE with soil organic carbon content—6.18%; and the increase in MSE of soil pH—4.75%. Slope had an increase in MSE of 1.29%, and the evapotranspiration coefficient, the least significant factor, recorded an increase of 1.2% in MSE. In contrast, the distance from the roadway emerged as the key element in the recovery of vegetation, suggesting that the presence of highways plays a crucial role in influencing vegetation cover. This effect may stem from the fact that highway development facilitates the initiation of ecological restoration efforts in mining regions, thereby providing the essential groundwork necessary for successful vegetation recovery projects. The high importance of elevation and distance to river indicates that topographic and hydrological conditions have an important impact on the distribution of vegetation, probably because of the low altitude temperatures and abundant water supply close to rivers, which is conducive to vegetation growth. The importance of soil organic carbon content and soil pH indicates a significant effect of soil quality on vegetation cover. Soils with a high organic carbon content are usually more fertile and suitable for vegetation growth and the vegetation recovery effect is better, and soil pH affects nutrient availability and thus affects vegetation health. The slope in the mining area is not different, so the influence of slope on the growth of vegetation is not obvious. The main reason for the small importance of the evapotranspiration coefficient is that the span of the mining area is not large, and the light and temperature are almost the same in Songmutang town.
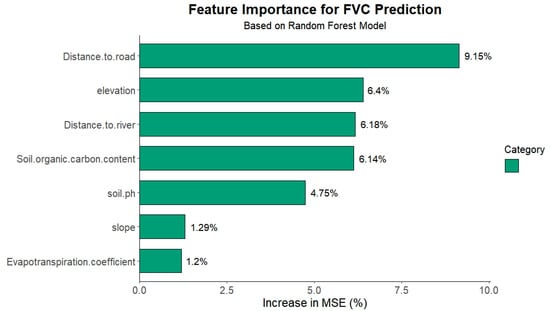
Figure 10.
Even factorial importance distributions obtained from the random forest model simulation.
4.5. The Interaction Between the Influencing Factors
Interactions occur between various elements, influencing each other. The Pearson’s correlation coefficient is used to analyze the correlations among these elements. The correlation matrix constructed by the Pearson correlation coefficient shows that the larger the sphere, the stronger the correlation. Red represents positive correlation, and blue represents mutual correlation (Figure 11). There was a significant negative correlation between soil pH and soil organic matter content, which was consistent with the analysis results in the previous chapter. An increase in soil pH reduces the organic matter content in the soil, as higher pH levels hinder the dissolution of organic matter. At the same time, it was found that slope and altitude have a strong positive correlation with soil organic matter and distance from the river. The reason for the correlation between slope and altitude is that Taoyang County is predominantly flat, with rapid elevation increases in mountainous areas, leading to steeper slopes at higher altitudes. The correlation between soil organic matter and altitude lies in the fact that vegetation is sparse in high-altitude regions, resulting in less consumption of organic matter in the soil. The correlation between the distance from the river and soil organic matter needs to be considered in relation to the relationship between distance from the river and the soil pH. Areas close to the river are often submerged, causing the concentration of substances in the soil to decrease due to river erosion, making the pH more neutral compared to surrounding soils with higher pH values. Therefore, the organic matter content in soils near rivers is also higher. Additionally, when the river floods, sediment carried by the river replenishes the organic matter in the soil.
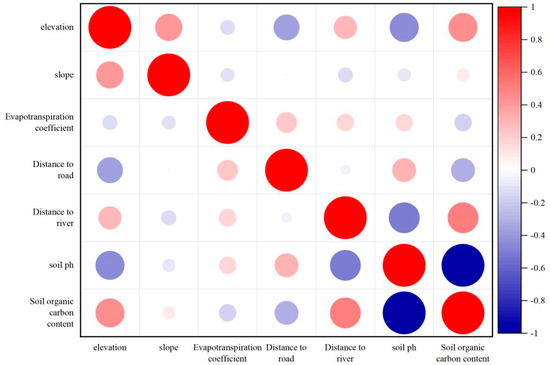
Figure 11.
Correlation between influencing factors.
5. Discussion
Thanks to a number of ecological restoration initiatives undertaken in Songmutang town, the local flora has made a remarkable recovery [47,53]. In the past few years, the Chinese government has rolled out a number of policies with an eye on ecological conservation. Nevertheless, before 2012, China’s environmental protection efforts left much to be desired. This led to unregulated mining operations that did a great deal of damage to the vegetation in mining areas [54]. The history of anthracite mining in Taojiang County has exceeded 100 years. Prolonged disorganized mining has resulted in a significant exposure of waste containing heavy metals and the pollution of mine water, causing extensive harm to the surrounding ecological environment and adversely affecting the living and production conditions of nearby and downstream inhabitants. The FVC in the mining area has exhibited a persistent decline since 2004 due to ongoing mining activities. It was characterized by a decrease in FVC and NPP.
Starting from 2008, several laws and regulations have been gradually enacted to protect the mining environment and regulate disorderly mining activities. The “Regulations on the Protection of Geological Environment in Mines,” released in 2009, outlines in its opening article the necessity of minimizing the harm to the geological environment stemming from mineral exploration and extraction activities. It emphasizes the importance of promoting the sensible development and use of mineral resources while ensuring a balanced growth of the economy, society, and the resource environment. Nonetheless, this did not impede the trend of vegetation degradation in the stone coal mining region of Taojiang County. Since 2011, vegetation has regenerated. In 2012, China began to actively promote the idea that “clear waters and green mountains are as valuable as stores of gold and silver” while also stepping up efforts to protect the ecological environment. Then, in 2013, Taojiang County was identified as the national key ecological function area. The local government from the stone coal mining area ordered the county’s 127 mining sites to integrate and close, adopted a series of measures to mine management, and invested a lot of money in governance engineering, cleaning waste wastewater, and covering soil after greening. Since then, the mining area ecological environment has improved. Later, the Chinese government formulated more policies to ensure that the ecological environment can be further improved. In 2015, the State Council put forth recommendations in the Opinions of the CPC Central Committee and the State Council regarding the expedited development of ecological civilization. They emphasized that efforts for ecological construction and rehabilitation should primarily prioritize natural recovery, with human intervention serving as a complementary approach. This initiative directly supports the regrowth of vegetation in mining regions. In 2016, the Ministry of Natural Resources issued the Guiding Opinions regarding the Strengthening of Mine Geological Environment Restoration and Comprehensive Management. This advocated for the swift establishment of a novel model for mines under construction and the settlement of historical “both new and old issues”. The opinions emphasize addressing the ecological issues in historically impacted mining areas. The ecological restoration of the main mining area in Taojiang County, which has been mining for more than 100 years, has policy support. However, the promulgation of these policies still did not stimulate the ecological restoration project in Taojiang County. After 2016, some policies were introduced one after another. Following that, in 2019, the Ministry of Natural Resources and the Ministry of Ecology and Environment put forth their Recommendations for the Swift Overhaul of Open-Pit Mining Operations. It was not until the implementation of the Land Administration Law in 2019 that Taojiang County began its ecological restoration initiatives aimed at revitalizing areas damaged by mining. This move facilitated a quicker regeneration of forest vegetation in the mining zone, aligning with national policies. In 2019, a number of treatment projects were carried out in the research area, and these projects transferred and cleared the residual waste residue in the mining area, leveled the damaged surface, and covered the soil. Because the rock was exposed in the mining process, soil should cover on the surface. Ultimately, vegetation was introduced into the mining zone to facilitate ecological recovery. Following the implementation of the restoration initiative, the results in the mining area have been striking. The FVC in the designated mining site saw a substantial rise post-treatment, and satellite remote sensing imagery vividly illustrated the resurgence of plant life. In 2022, the “14th Five-Year Plan” for Ecological Restoration of Historic Mines aimed to execute the national action plan for the ecological restoration of historic abandoned mines. In 2022, the initiative for the integrated protection and restoration of mountains, water, forests, farmland, lakes, grasslands, and sand in the Dongting Lake region was rolled out, and it has’s been carried out with flying colors. This extensive restoration project encompasses the ecological rehabilitation of 12 mineral sites in Taojiang. Through data collection, many large and small ecological restoration projects have taken place in the research area. These include Taojiang County Yangjiadong Xiangui coal mine legacy pollution control projects; other stone coal mine legacy pollution control projects in the Yangjiadong Huang jiaba area; Yangjiadong dongshan stone coal mine legacy pollution control projects; Yangjiadong Shiban Chong coal mine legacy pollution control projects; and Yangjiadong Yangjia Dong stone coal mine legacy pollution control projects. The implementation of these initiatives has greatly aided in restoring the ecology of the historical mining area in Songmutang town.
Under the policy drive, the ecological restoration project was implemented. Under the effect of the restoration project, the vegetation in the mining area was restored, and the FVC and NPP in the mining area were improved. These changes were all due to the promulgation of the policy. Therefore, in the final analysis, the policy improved the FVC of the mining area of Taojiang County. The policy is constantly affecting human activities. Under the influence of previous policies, mining activities were carried out wantonly. Under the influence of the current policies, disorderly mining activities have not only stopped but ecological restoration projects are also vigorously carried out in mining areas left by history. Due to the policy, the mining area’s ecological environment is steadily improving.
The Landsat images used in this study were affected by cloud cover and other factors, making it impossible to select images from the same month for all analyses. This results in slight variations in vegetation growth patterns, which may introduce minor errors when calculating FVC. Additionally, the satellite’s extended operation duration could introduce measurement inaccuracies in microwave reflection reception. Consequently, uncertainties may arise during the identification of bare land and vegetation in FVC calculations.
6. Conclusions
In this study, Landsat series images were used to monitor the vegetation in the Shikou coal mining area of Taojiang County. The FVC changes were analyzed by the Theil–Sen median slope and Mann–Kendall test, the NPP of the mining area was estimated by the CASA model, and the importance of the factors of image vegetation was evaluated by random forest model. The conclusions obtained were as follows:
- (1)
- The overall FVC in Taojiang County increased slightly during the 2004–2023 period, rising from 0.729 to 0.847. Mine FVC reached a minimum of 0.432 in 2011 and a maximum of 0.718 in 2023. The Theil–Sen median slope analysis and Mann–Kendall trend test showed that FVC declined from 2003 to 2011, then increased from 2013 to 2023. The selected typical mining areas also showed a trend of decreasing first and then rising.
- (2)
- The NPP of the mining area in 2004, 2011, and 2020 was 939.8 g/m2·y, 788.3 g/m2·y in 2011 and 855.7 g/m2·y in 2020. The change trend was the same as that of FVC, and the NPP was also restored after the ecological restoration project.
- (3)
- In 2011, China commenced enhancing ecological environmental protection and implemented numerous pertinent policies to facilitate vegetation restoration in mining regions. Moreover, influenced by policy and ecological restoration initiatives, the FVC in the mining region has progressively risen, signifying that anthropogenic factors predominantly impact FVC in this area.
Through the study of vegetation cover in the mining area of Taojiang County, it is found that the implementation of the ecological restoration project has a very obvious effect on the improvement of the ecological environment in the mining area. The recovery effect is manifested as the increase of FVC and NPP, which provides a theoretical basis for other regions to carry out ecological restoration projects, and also promotes the ecological environment recovery in the mining area, which is conducive to the sustainable development of the mining area. This study only studied the ecological restoration of open-pit coal mining areas; the conclusions of this study are limited, and can not be applied to underground mining coal mines, nor to other open-pit mining areas. Further studies will be conducted to further study the law of vegetation restoration in different mining methods and different mineral species.
Author Contributions
Conceptualization, R.Z. and Z.H.; data curation, R.Z.; formal analysis, R.Z.; funding acquisition, Z.H. and H.S.; investigation, X.L.; methodology, R.Z.; software, R.Z., J.W. and J.L.; supervision, Z.H. and S.H.; writing—original draft, R.Z.; writing—review and editing, R.Z. All authors have read and agreed to the published version of the manuscript.
Funding
This work has received joint funding from the following: China’s National Key Technology Research and Development Program (2022YFC3704805); Procurement Project for the Investigation of Historical Solid Waste in Closed Mines of Datian County and the Pollution Status of Surrounding Agricultural Land ([350425]YP [GK]2022002); The Collaborative Research on the Protection and Restoration of the Yangtze River’s Ecological Environment (Phase II) (2022-LHYJ-02-0404); and Xinxiang City Project on Investigating the Causes of Heavy Metal Pollution in Arable Land Soil and Historical Pollution Sources and Agricultural Land Conditions in the Vicinity of Typical Cadmium—impacted Mining Areas in Hunan (Hunan Finance Procurement Plan [2022] No. 002214).
Data Availability Statement
The data will be made available upon request.
Conflicts of Interest
The authors declare no conflict of interest.
References
- Meng, Q.; Peng, X.; Zhang, S. Spatio-temporal response of vegetation coverage at multiple time scales to extreme climate in the Qinling mountains in Northwest China. Res. Cold Arid. Reg. 2024, 16, 302–309. [Google Scholar] [CrossRef]
- Daham, A.; Han, D.W.; Rico-Ramirez, M.; Marsh, A. Analysis of NVDI variability in response to precipitation and air temperature in different regions of Iraq, using MODIS vegetation indices. Environ. Earth Sci. 2018, 77, 24. [Google Scholar] [CrossRef]
- Pengfan, Z.; Gang, L.; Jing, H. Spatio-temporal variation and impacting factors of NPP from 2001 to 2020 in Sanjiangyuan region, China: A deep neural network-based quantitative estimation approach. Ecol. Inform. 2023, 78, 102345. [Google Scholar]
- Walter, R.L.M.; Daniele, O.S.; Sebastian, B.; Sophia, D.; Giorgio, V. Interplay of species mixture, climate change, and management regimes on carbon stocks and sinks in a Mediterranean beech forest. For. Ecol. Manag. 2025, 578, 14. [Google Scholar] [CrossRef]
- Chen, Y.; Zhang, T.B.; Zhu, X.; Yi, G.H.; Li, J.J.; Bie, X.J.; Hu, J.; Liu, X. Quantitatively analyzing the driving factors of vegetation change in China: Climate change and human activities. Ecol. Inform. 2024, 82, 19. [Google Scholar] [CrossRef]
- Zhang, W.Q.; Dai, L.D.; Yan, Y.G.; Han, X.Q.; Teng, Y.J.; Li, M.; Zhu, Y.H.; Zhang, Y.J. Multiscale geographically weighted regression-based analysis of vegetation driving factors and mining-induced quantification in the Fengfeng District, China. Ecol. Inform. 2024, 80, 13. [Google Scholar] [CrossRef]
- Tang, R.; He, B.; Chen, H.W.; Chen, D.L.; Chen, Y.N.; Fu, Y.S.H.; Yuan, W.P.; Li, B.F.; Li, Z.; Guo, L.L.; et al. Increasing terrestrial ecosystem carbon release in response to autumn cooling and warming. Nat. Clim. Change 2022, 12, 380–385. [Google Scholar]
- Li, N.; Guo, Y.H.; Wang, L.G.; Wang, Q.Z.; Yan, D.R.; Zhao, S.G.; Lei, T. Evaluation and quantitative characterization for the ecological environment impact of open pit mining on vegetation destruction from landsat time series: A case study of Wulishan limestone mine. Ecol. Indic. 2024, 158, 13. [Google Scholar]
- Wang, J.M.; Jiao, Z.Z.; Bai, Z.K. Changes in carbon sink value based on RS and GIS in the Heidaigou opencast coal mine. Environ. Earth Sci. 2014, 71, 863–871. [Google Scholar]
- Peng, Q.; Wang, R.H.; Jiang, Y.L.; Li, C. Contributions of climate change and human activities to vegetation dynamics in Qilian Mountain National Park, northwest China. Glob. Ecol. Conserv. 2021, 32, 13. [Google Scholar] [CrossRef]
- Guan, Y.J.; Wang, J.; Zhou, W.; Bai, Z.K.; Cao, Y.G. Delimiting supervision zones to inform the revision of land reclamation management modes in coal mining areas: A perspective from the succession characteristics of rehabilitated vegetation. Land Use Pol. 2023, 131, 15. [Google Scholar]
- Dai, S.F.; Zheng, X.; Wang, X.B.; Finkelman, R.B.; Jiang, Y.F.; Ren, D.Y.; Yan, X.Y.; Zhou, Y.P. Stone coal in China: A review. Int. Geol. Rev. 2018, 60, 736–753. [Google Scholar]
- Li, Z.G.; Li, X.Y.; Liu, J.; Zhang, L.M.; Chen, J.; Feng, X.B. Stone coal as a potential atmospheric mercury source in Da-Ba-Shan mountain areas, China. Int. J. Coal Geol. 2019, 206, 21–30. [Google Scholar] [CrossRef]
- Zhang, J.W.; Cheng, D.L.; Wang, J.C.; Yang, S.L.; Wan, X.H.; Li, X.Y. Improving recovery in sublevel top coal caving mining by using partially reverse drawing technique. Int. J. Min. Sci. Technol. 2024, 34, 1655–1676. [Google Scholar] [CrossRef]
- Chen, L.F.; Zhang, H.; Zhang, X.Y.; Liu, P.H.; Zhang, W.C.; Ma, X.Y. Vegetation changes in coal mining areas: Naturally or anthropogenically Driven? Catena 2022, 208, 13. [Google Scholar] [CrossRef]
- Aili, A.; Zhang, Y.G.; Tao, L.; Xu, H.L.; Bakayisire, F.; Waheed, A.; Qin, Z. Ecological benefits of artificial vegetation restoration on local climate condition in abandoned mining area. Ecol. Indic. 2024, 169, 9. [Google Scholar] [CrossRef]
- Li, S.; Wang, J.; Zhang, M.; Tang, Q. Characterizing and attributing the vegetation coverage changes in North Shanxi coal base of China from 1987 to 2020. Resour. Policy 2021, 74, 102331. [Google Scholar] [CrossRef]
- Lu, P.; Shi, W.Y.; Wang, Q.M.; Li, Z.B.; Qin, Y.Y.; Fan, X.M. Co-seismic landslide mapping using Sentinel-2 10-m fused NIR narrow, red-edge, and SWIR bands. Landslides 2021, 18, 2017–2037. [Google Scholar] [CrossRef]
- Zuo, Y.F.; Li, Y.H.; He, K.N.; Wen, Y.S. Temporal and spatial variation characteristics of vegetation coverage and quantitative analysis of its potential driving forces in the Qilian Mountains, China, 2000–2020. Ecol. Indic. 2022, 143, 15. [Google Scholar] [CrossRef]
- Sun, Y.; Liu, H.; Guo, Z. Capsule network-based approach for estimating grassland coverage using time series data from enhanced vegetation index. Artif. Intell. Geosci. 2021, 2, 26–34. [Google Scholar] [CrossRef]
- Lai, Y.; Mu, X.; Fan, D.; Zou, J.; Xie, D.; Yan, G. Methodology comparison for correcting woody component effects in leaf area index calculations from digital cover images in broadleaf forests. Remote Sens. Environ. 2025, 321, 114659. [Google Scholar]
- Liu, L.L.; Zheng, B.H. Greenspace coverage vs. enhanced vegetation index: Correlations with surface urban heat island intensity in different climate zones. Urban Clim. 2024, 58, 11. [Google Scholar] [CrossRef]
- Yu, H.X.; Zahidi, I.; Chow, M.F. Vegetation as an ecological indicator in assessing environmental restoration in mining areas. iScience 2023, 26, 10. [Google Scholar] [CrossRef]
- Chen, M.Z.; Xue, Y.Y.; Xue, Y.B.; Peng, J.; Guo, J.W.; Liang, H.B. Assessing the effects of climate and human activity on vegetation change in Northern China. Environ. Res. 2024, 247, 11. [Google Scholar] [CrossRef]
- Yang, S.J.; Song, S.; Li, F.D.; Yu, M.Z.; Yu, G.M.; Zhang, Q.Y.; Cui, H.T.; Wang, R.; Wu, Y.Q. Vegetation coverage changes driven by a combination of climate change and human activities in Ethiopia, 2003–2018. Ecol. Inform. 2022, 71, 12. [Google Scholar] [CrossRef]
- Wu, D.H.; Wu, H.; Zhao, X.; Zhou, T.; Tang, B.J.; Zhao, W.Q.; Jia, K. Evaluation of Spatiotemporal Variations of Global Fractional Vegetation Cover Based on GIMMS NDVI Data from 1982 to 2011. Remote Sens. 2014, 6, 4217–4239. [Google Scholar] [CrossRef]
- Kennedy, R.E.; Andréfouët, S.; Cohen, W.B.; Gómez, C.; Griffiths, P.; Hais, M.; Healey, S.P.; Helmer, E.H.; Hostert, P.; Lyons, M.B.; et al. Bringing an ecological view of change to Landsat-based remote sensing. Front. Ecol. Environ. 2014, 12, 339–346. [Google Scholar] [CrossRef]
- Ma, R.; Zhang, J.Q.; Shen, X.J.; Liu, B.H.; Lu, X.G.; Jiang, M. Impacts of climate change on fractional vegetation coverage of temperate grasslands in China from 1982 to 2015. J. Environ. Manag. 2024, 350, 10. [Google Scholar] [CrossRef]
- Bai, X.L.; Zhao, W.Z.; Luo, W.C.; An, N. Effect of climate change on the seasonal variation in photosynthetic and non-photosynthetic vegetation coverage in desert areas, Northwest China. Catena 2024, 239, 16. [Google Scholar] [CrossRef]
- Poussin, C.; Peduzzi, P.; Giuliani, G. Snow observation from space: An approach to improving snow cover detection using four decades of Landsat and Sentinel-2 imageries across Switzerland. Sci. Remote Sens. 2025, 11, 100182. [Google Scholar] [CrossRef]
- Guan, Y.J.; Wang, J.; Zhou, W.; Bai, Z.K.; Cao, Y.G. Identification of land reclamation stages based on succession characteristics of rehabilitated vegetation in the Pingshuo opencast coal mine. J. Environ. Manag. 2022, 305, 14. [Google Scholar] [CrossRef]
- Zhang, K.; Zhu, C.M.; Li, J.L.; Shi, K.T.; Zhang, X. Reconstruction of dense time series high spatial resolution NDVI data using a spatiotemporal optimal weighted combination estimation model based on Sentinel-2 and MODIS. Ecol. Inform. 2024, 82, 15. [Google Scholar]
- Zhang, M.; Wang, J.M.; Li, S.J. Tempo-spatial changes and main anthropogenic influence factors of vegetation fractional coverage in a large-scale opencast coal mine area from 1992 to 2015. J. Clean Prod. 2019, 232, 940–952. [Google Scholar]
- Zhao, X.Y.; Tan, S.C.; Li, Y.P.; Wu, H.; Wu, R.J. Quantitative analysis of fractional vegetation cover in southern Sichuan urban agglomeration using optimal parameter geographic detector model, China. Ecol. Indic. 2024, 158, 15. [Google Scholar] [CrossRef]
- Zheng, K.; Wei, J.Z.; Pei, J.Y.; Cheng, H.; Zhang, X.L.; Huang, F.Q.; Li, F.M.; Ye, J.S. Impacts of climate change and human activities on grassland vegetation variation in the Chinese Loess Plateau. Sci. Total Environ. 2019, 660, 236–244. [Google Scholar]
- Fensholt, R.; Langanke, T.; Rasmussen, K.; Reenberg, A.; Prince, S.D.; Tucker, C.; Scholes, R.J.; Le, Q.B.; Bondeau, A.; Eastman, R.; et al. Greenness in semi-arid areas across the globe 1981–2007—An Earth Observing Satellite based analysis of trends and drivers. Remote Sens. Environ. 2012, 121, 144–158. [Google Scholar]
- Feng, D.R.; Wang, J.M.; Fu, M.C.; Liu, G.C.; Zhang, M.; Tang, R.B. Spatiotemporal variation and influencing factors of vegetation cover in the ecologically fragile areas of China from 2000 to 2015: A case study in Shaanxi Province. Environ. Sci. Pollut. Res. 2019, 26, 28977–28992. [Google Scholar] [CrossRef]
- Güçlü, Y.S. Improved visualization for trend analysis by comparing with classical Mann-Kendall test and ITA. J. Hydrol. 2020, 584, 9. [Google Scholar] [CrossRef]
- Gocic, M.; Trajkovic, S. Analysis of changes in meteorological variables using Mann-Kendall and Sen’s slope estimator statistical tests in Serbia. Glob. Planet. Change 2013, 100, 172–182. [Google Scholar] [CrossRef]
- Zhu, W.Q.; Pan, Y.Z.; He, H.; Yu, D.Y.; Hu, H.B. Simulation of maximum light use efficiency for some typical vegetation types in China. Chin. Sci. Bull. 2006, 51, 457–463. [Google Scholar] [CrossRef]
- Wang, Y.Y.; Chen, X.; Gao, M.; Dong, J.Z. The use of random forest to identify climate and human interference on vegetation coverage changes in southwest China. Ecol. Indic. 2022, 144, 13. [Google Scholar] [CrossRef]
- Adnan, M.N. On Reducing the Bias of Random Forest. In Proceedings of the 18th International Conference on Advanced Data Mining and Applications (ADMA), Brisbane, Australia, 28–30 November 2022; Springer International Publishing AG: Brisbane, Australia, 2022; pp. 187–195. [Google Scholar]
- Xu, Z.; Zhou, X. Determination of the Critical Slip Surface of Slope Based on the Improved Quantum Genetic Algorithm and Random Forest. KSCE J. Civ. Eng. 2022, 26, 2126–2138. [Google Scholar] [CrossRef]
- Xie, Z.L.; Li, K.N.; Jiang, J.B.; Yang, J.Z.; Qiao, X.J.; Yuan, D.S.; Nie, C. An integrated neighborhood and scale information network for open-pit mine change detection in high-resolution remote sensing images. Comput. Geosci. 2025, 196, 14. [Google Scholar] [CrossRef]
- Zhao, Y.F.; Zhu, W.W.; Wei, P.P.; Fang, P.; Zhang, X.W.; Yan, N.N.; Liu, W.J.; Zhao, H.; Wu, Q.R. Classification of Zambian grasslands using random forest feature importance selection during the optimal phenological period. Ecol. Indic. 2022, 135, 13. [Google Scholar] [CrossRef]
- Wu, Z.H.; Lei, S.G.; Yan, Q.W.; Bian, Z.F.; Lu, Q.Q. Landscape ecological network construction controlling surface coal mining effect on landscape ecology: A case study of a mining city in semi-arid steppe. Ecol. Indic. 2021, 133, 13. [Google Scholar] [CrossRef]
- Zhu, R.F.; He, Z.X.; Huang, S.H.; Shi, H.D.; Liu, X.L.; Wang, J.K.; Liu, J.B.; Liu, A.F.; Li, L. Spatial and temporal changes in vegetation coverage in Huayuan County and the influence of Chinese policies on vegetation coverage. Ecol. Indic. 2025, 171, 14. [Google Scholar] [CrossRef]
- Xu, J.F.; Wang, X.Y.; Liu, C.X.; Yang, X.Y.; Zhang, J.L.; Han, X.L.; Wang, T. Widespread homogenization in vegetation activities along the elevational gradients across the Himalaya over the past 40 years. Sci. Total Environ. 2024, 953, 13. [Google Scholar] [CrossRef] [PubMed]
- Yousefi, S.; Imaizumi, F.; Hasui, R.; Nishii, R.; Hayakawa, Y.S. Quantitative analysis of landslide impact on vegetation: Insights from field surveys and UAV imagery. Ecol. Eng. 2025, 214, 16. [Google Scholar] [CrossRef]
- Ren, H.Y.; Tan, K.; Zhang, G.Y.; Wang, Z.P.; Shi, H.J.; Wen, Z.M.; Liu, Y.Y. Diverse responses of the changes in evapotranspiration and water yield to vegetation and climate change in the Yanhe River watershed. Ecol. Indic. 2024, 168, 22. [Google Scholar] [CrossRef]
- Lombi, E.; Zhao, F.J.; Zhang, G.Y.; Sun, B.; Fitz, W.; Zhang, H.; McGrath, S.P. In situ fixation of metals in soils using bauxite residue: Chemical assessment. Environ. Pollut. 2002, 118, 435–443. [Google Scholar] [CrossRef]
- Zhang, M.; Liu, S.; An, Y.; Zhang, D.; Tan, J.; Wang, L.; Li, Y.; Jiang, M.; Wu, H.; Tong, S. Exogenous nitrogen enhances aboveground plant phosphorus accumulation through soil moisture and organic carbon in semi-arid grazed wetlands. Agric. Ecosyst. Environ. 2025, 388, 109635. [Google Scholar] [CrossRef]
- Liu, J.; He, Z.; Shi, H.; Zhao, Y.; Wang, J.; Liu, A.; Li, L.; Zhu, R. The Analysis of Spatiotemporal Changes in Vegetation Coverage and Driving Factors in the Historically Affected Manganese Mining Areas of Yongzhou City, Hunan Province. Land 2025, 14, 133. [Google Scholar] [CrossRef]
- Wu, N. Study on the protection and restoration of mine geological environment in Yiyang City. World Nonferrous Met. 2020, 3, 189–191. [Google Scholar]
Disclaimer/Publisher’s Note: The statements, opinions and data contained in all publications are solely those of the individual author(s) and contributor(s) and not of MDPI and/or the editor(s). MDPI and/or the editor(s) disclaim responsibility for any injury to people or property resulting from any ideas, methods, instructions or products referred to in the content. |
© 2025 by the authors. Licensee MDPI, Basel, Switzerland. This article is an open access article distributed under the terms and conditions of the Creative Commons Attribution (CC BY) license (https://creativecommons.org/licenses/by/4.0/).