2.1. Case Study Area Analysis: Application at Vikos’s Gorge
The landscape is never static; on the contrary, various forces are constantly applied upon it, resulting in its gradual and continuous change. Settlements are simultaneously influenced by the forces exerted by the environment and by the people who inhabit them. This case study focuses on the Vikos Gorge and the surrounding settlements. Specifically, the Vikos Gorge is located in the northern part of Epirus, Greece, near the Greek/Albanian border, and is part of the Pindos Mountain range. The area’s highest point, Tymfi’s peak of Gamila, stands at an impressive height of 2497 m. The gorge boasts a maximum depth and opening of 1144 m and 2420 m, respectively, resulting in a depth/aperture ratio of 0.76. The Voidomatis River traverses the gorge, spanning a total length of 15 km and covering a catchment area of 384 square kilometers.
The terrain of the greater area is characterized by uplifted topography, featuring numerous narrow V-shaped valleys [
8]. The unique landscape of that area has resulted in the development of a distinct ecosystem with diverse and rare species. The residents have taken full advantage of the natural resources, engaging them in their occupations. For instance, the “Vikogiatros” is a typical occupation in the region where the healing properties of local herbs are used for therapeutic purposes.
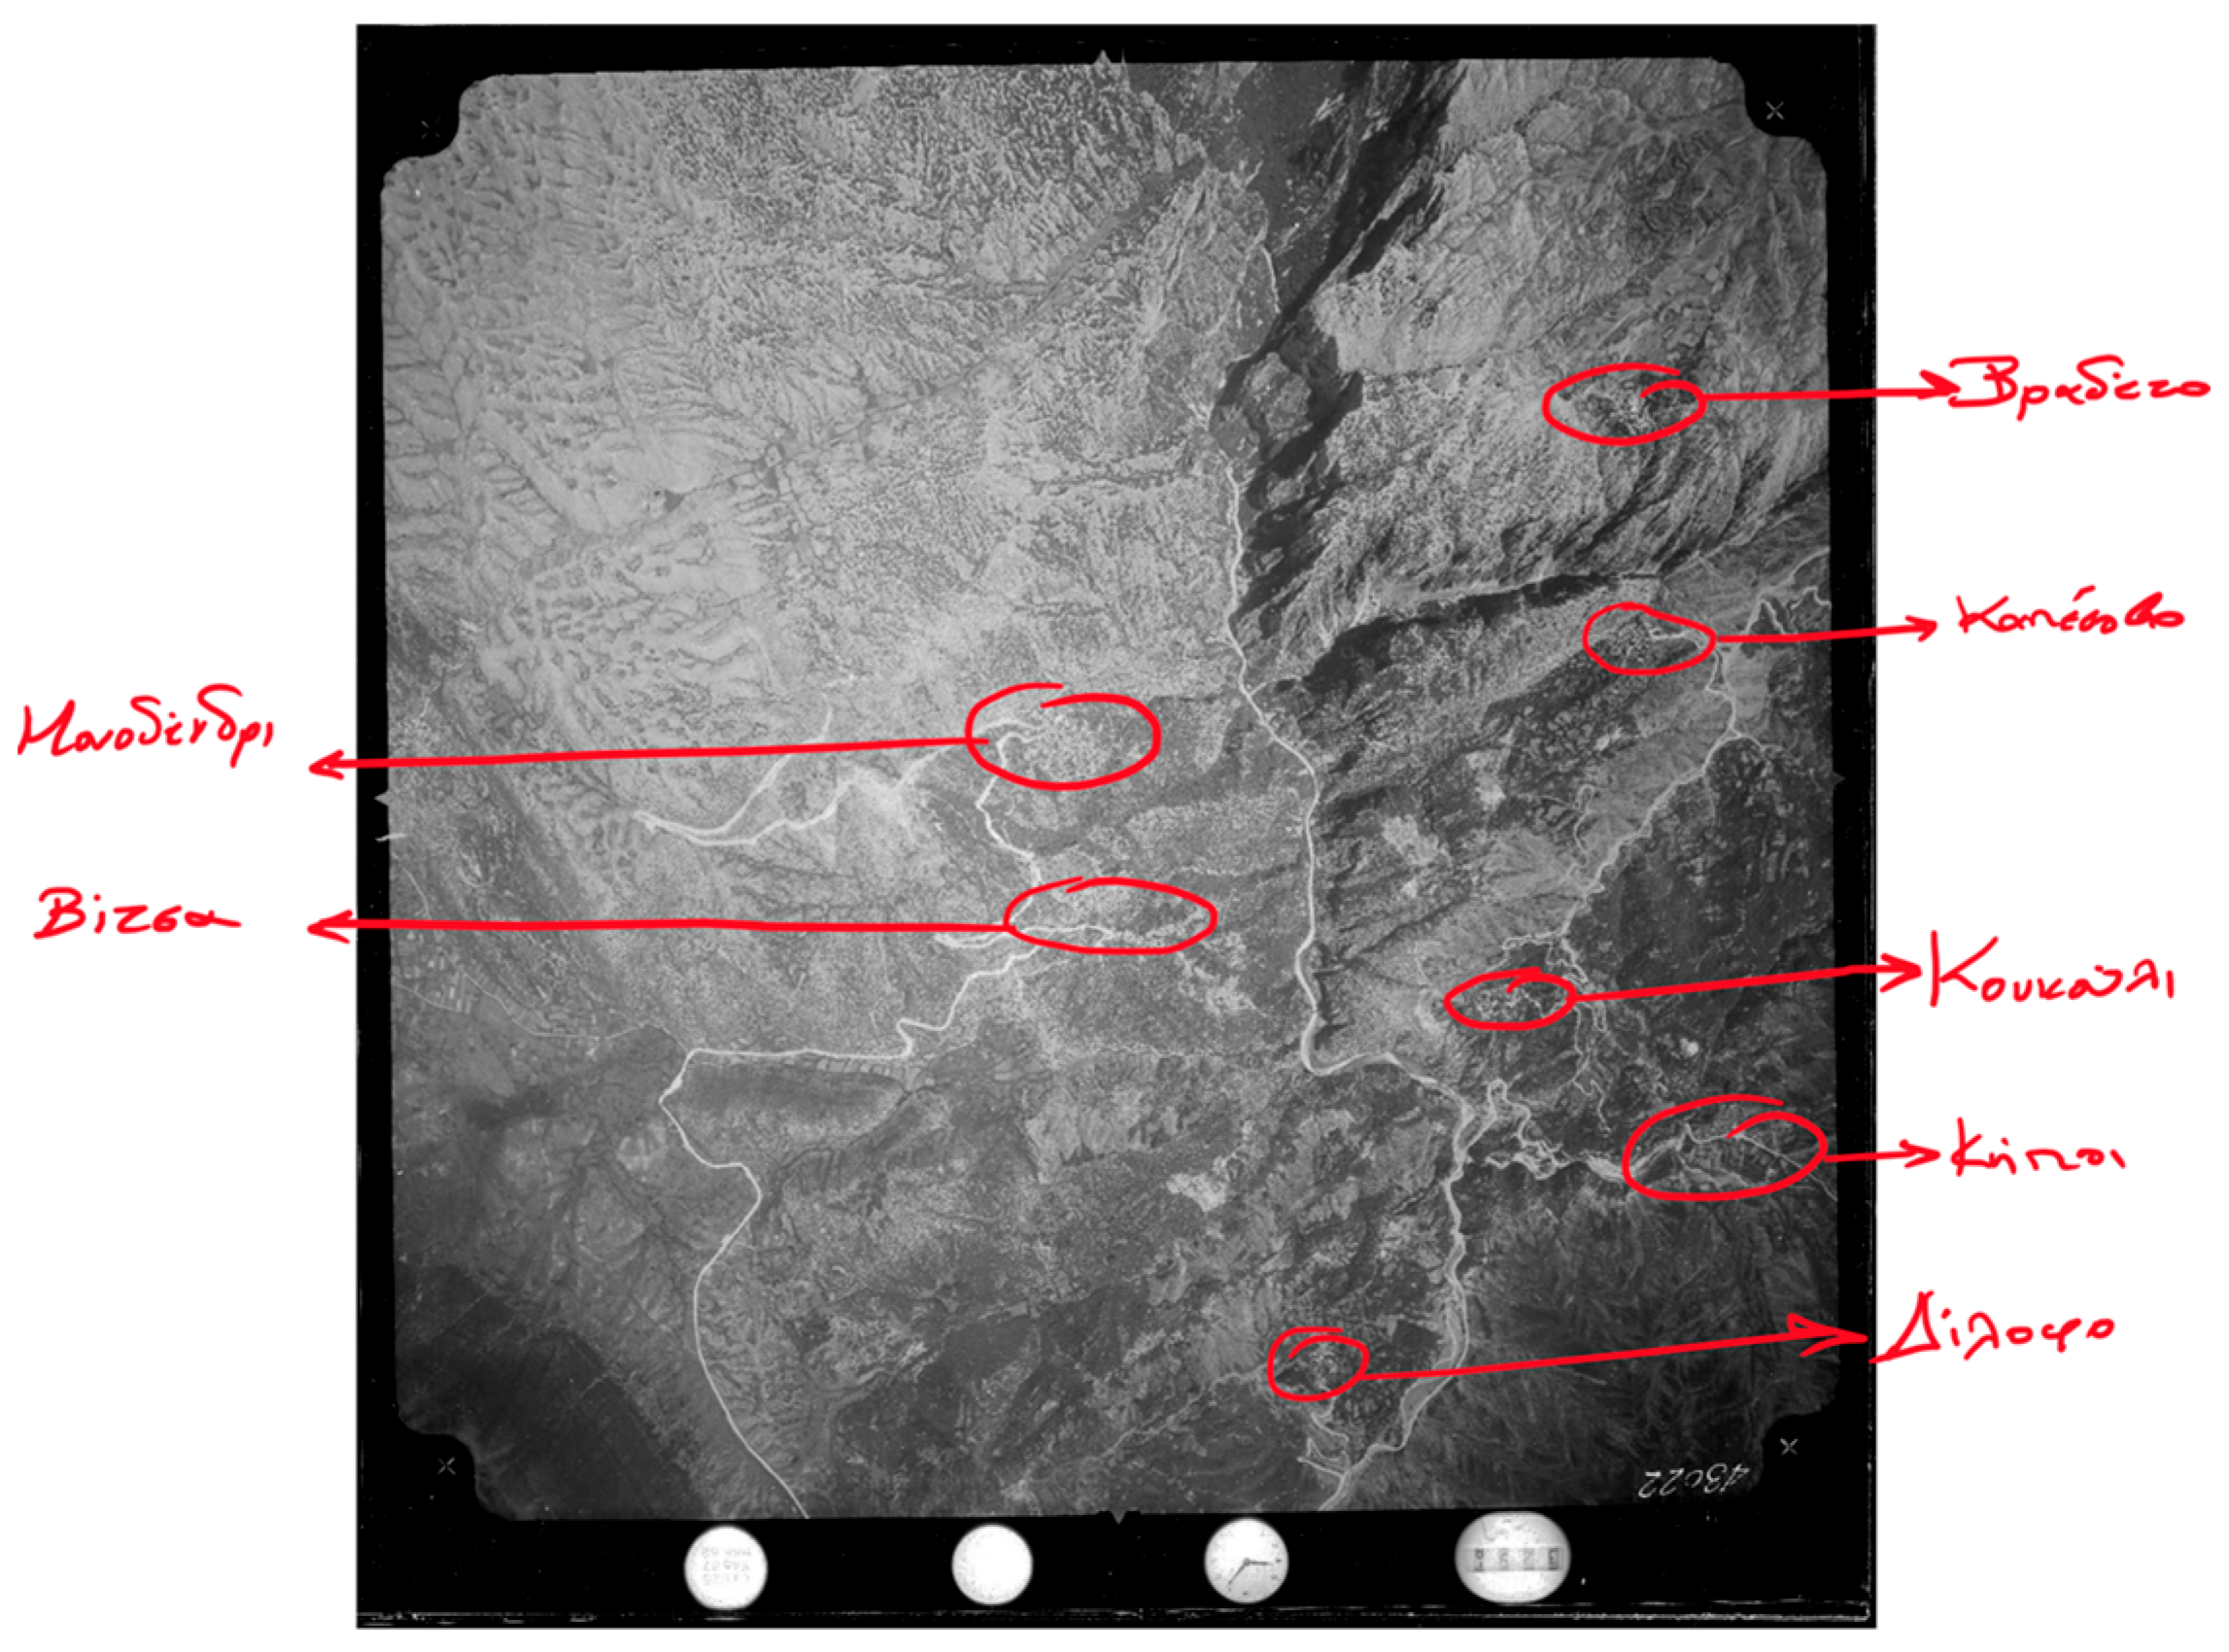
The intricate topography of the region has not only influenced its ecosystem but also shaped the morphology of the settlements, defining their key features such as stone structures with wooden beams, which form the main framework of the buildings, as well as the placement and size of openings and the overall location of each building within the settlement. In the Zagori region, there are a total of 46 settlements, which are informally divided into Central, Western, and Eastern Zagori. The research covers the broader Zagori area, but it focuses on Central Zagori and the settlements around the Vikos Gorge, such as Monodendri, Kapesovo, Vitsa, and Vradeto,
Figure 1. This area boasts a rich cultural heritage and a strong identity, reflecting the region’s unique character.
The settlements are connected by a network of roads, which evolves alongside the settlements themselves. The relationship between human activity and the development of settlements will be examined from the early 20th century to the present day, encompassing the beginning of the 21st century [
9,
10,
11]. During these years, significant political-economic changes are identified, with the most decisive being the Second World War and the period that followed it. Significant changes are observed, initially, in the occupation of the inhabitants, where there is a shift from predominantly agricultural and livestock activities, during the 1960s, to tourism-related businesses in the more recent period. “7000 acres of land surround Kapesovo and 8500 acres are within a few hours’ walking distance. Livestock farming provides the village with a slightly better income than crop income (16% of total village income, compared to 15.2% of agriculture)” (Baud-Bovy & Papageorgiou, etc.) [
12]. Another key point in the research is the decline in population in traditional settlements due to intense urbanization, causing significant gaps in the residential complex, which are being filled by the gradual increase in tourism. It is observed that out of the 1241 permanent residents of the area, referring to the four main villages around the Vikos Gorge, only 267 residents remained by 2020, suggesting a tremendous decrease in population. On the other hand, there has been a noticeable rise in tourist activity, shaping the area’s dynamics. This population flow creates a strong contrast in the region, affecting both the activities of the residents and the morphology of the houses. As related reports note, “the people of Zagori are generally skilled, active, and engaged in commercial activities. We find rich merchants in Kapesovo and Veija who have trading houses in Vienna, Moscow, and Breslau. In Leipzig and Amsterdam. Most of these big traders are getting rich in Germany.” (Baud-Bovy & Papageorgiou, etc.) [
12].
A pivotal characteristic of the residents of Zagori is their interest in trade, which brought about economic prosperity to the region during challenging periods, such as the Ottoman occupation. Among the fields of occupation, we also find the profession of builder, which is quite widespread in the region. The combination of this craftsmanship and the special terrain resulted in the formation of elaborate buildings. The cold climate of the area left its imprint on the evolution of morphological elements, resulting in structures characterized by simplicity, geometric shapes, and limited openings, mainly to avoid extensive exposure to strong winds. The location of the buildings within the settlements was also influenced by the environment, resulting in structures located close to each other and courtyards either enclosed by high walls or nonexistent. The road network within the settlements consists of narrow paths surrounded by high walls, causing the formation of a dense structure in the area, with limited public space available. This specific architectural typology is found in various regions in the Balkans and is mainly attributed to the migratory tendency of the builders of Epirus during the winter months. This migration pattern probably influenced the architectural styles observed in both regions.
2.2. Developing Relationships and Their Associated Variables: From Abstract to Diagram to Dynamic to Parametric
“To abstract means to take away, to isolate, to remove” (Cache, 1995) [
13].
An integrated system, to effectively adapt to diverse conditions, must have the form of a diagram where the elements and relationships are transformed into dynamic variables and constants. This process of “abstraction” presupposes the isolation of the fundamental characteristics of a whole in such a way that some elements of the subject are removed, while other core ones are preserved. However, the adaptable nature of the new system allows for various interpretations based on the observer and the broader context in which it exists, opening up new perspectives for interpretation, often unforeseen ones. The generation of various possible scenarios increases the potential of the diagram, as the prediction of adverse situations and the in-depth understanding of the causal relationship that is created between the input data and the results.
The development of advanced computational design tools has made the formation of multiple scenarios possible. In the field of architecture, the search and modification of new techniques from other fields into applicable tools of the industry is a process that has its roots in the depths of time [
14,
15,
16]. “Coming from the mechanical industry, computational drafting tools have their origins in the post-war research projects of American universities, most notably MIT. As is the case with many other appropriate technologies, their diffusion had to wait many years” (Echenagucia, 6 May 2014) [
17].
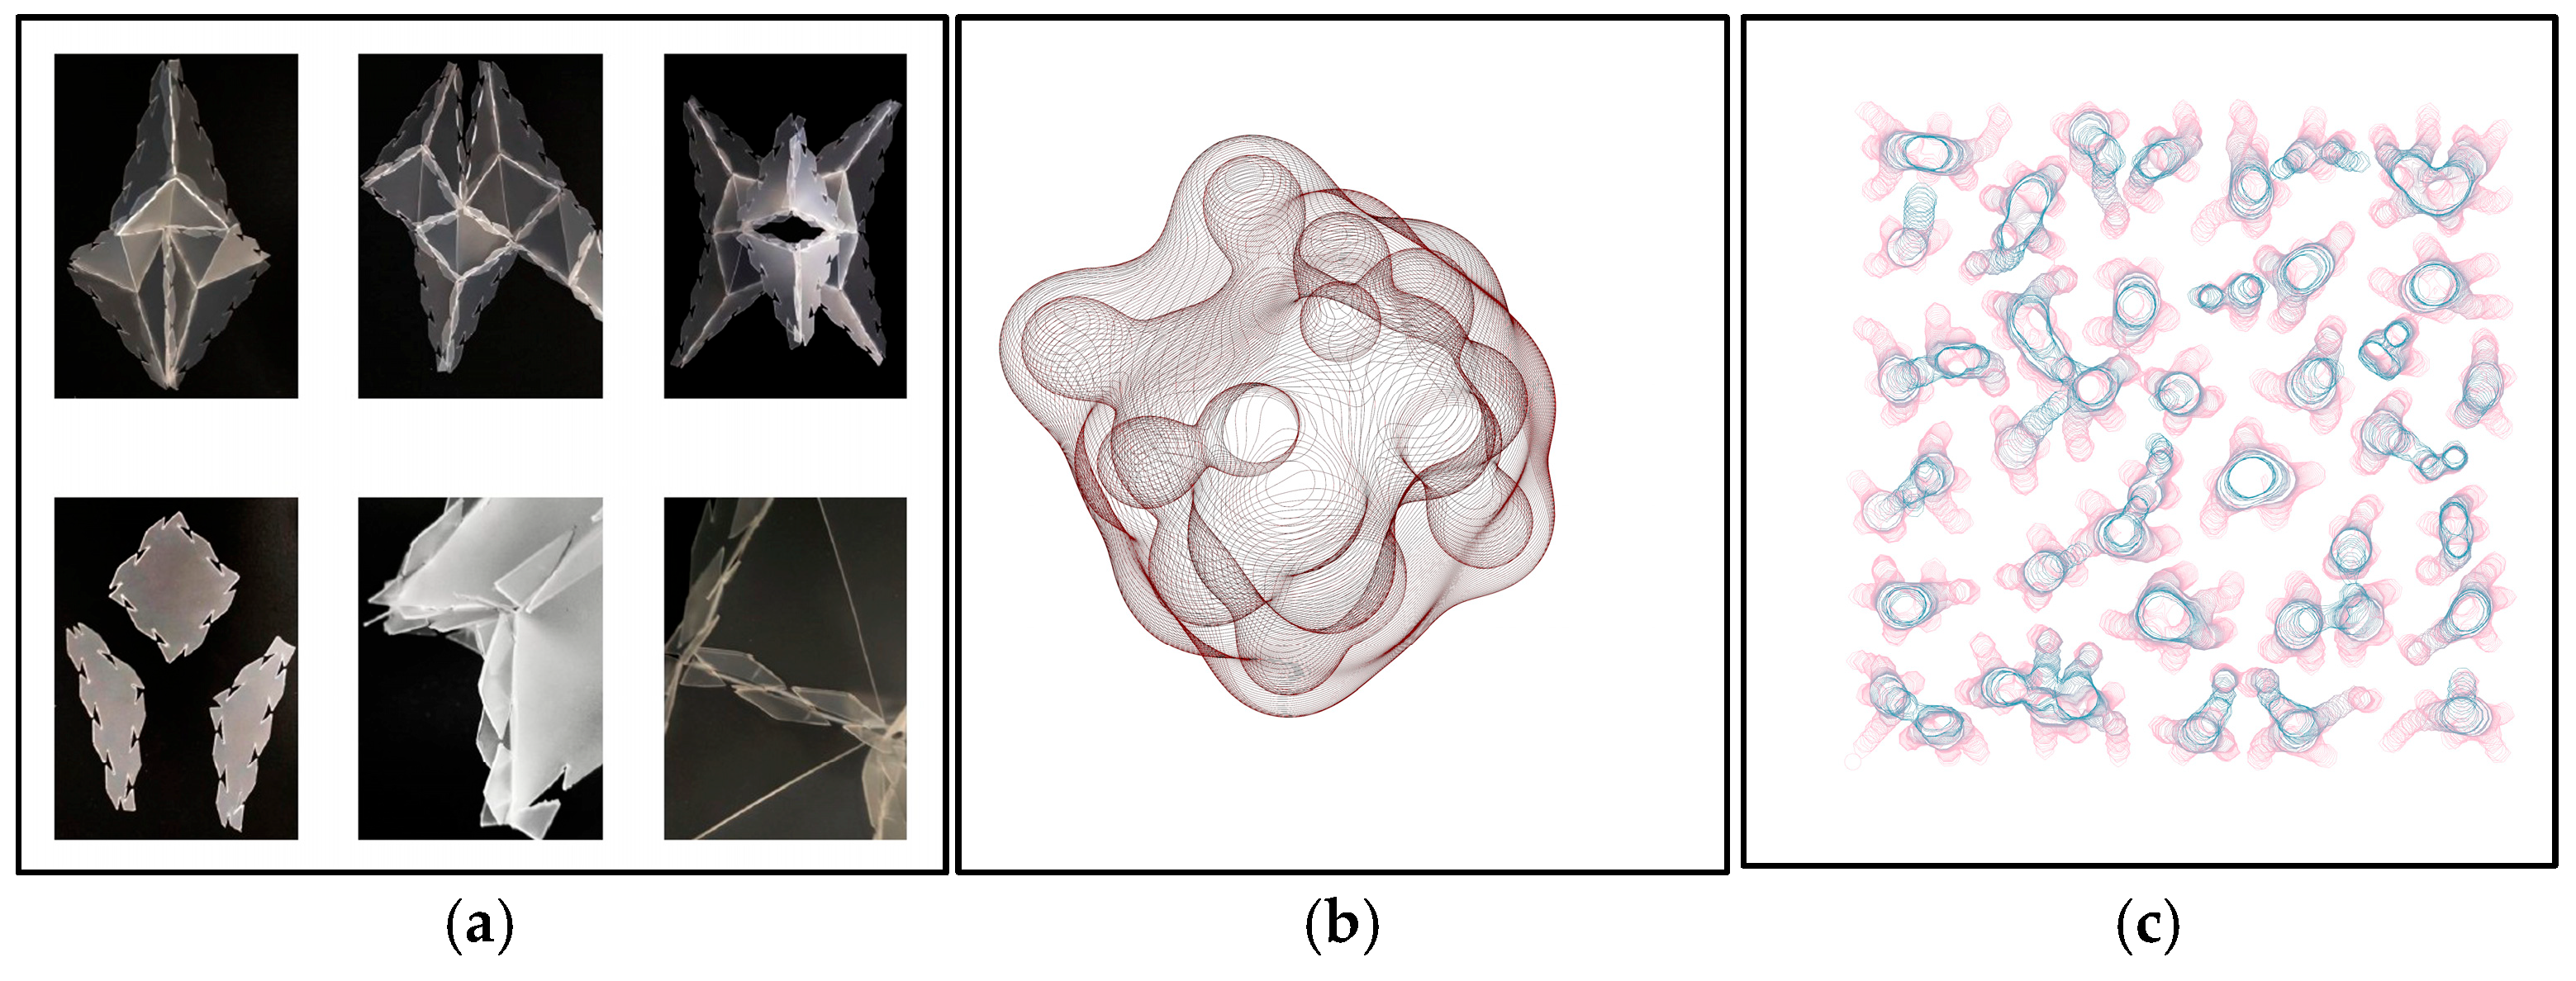
As a consequence, the rapid development of computation has shifted architectural design towards parametric design tools,
Figure 2 [
18]. According to Patrik Schumacher, parametric design represents the culmination of a contemporary mindset, harnessing computational power to its fullest extent [
19]. Parametric design can process vast amounts of data to optimize design, minimizing any errors [
20,
21]. This approach has significantly influenced the morphology of buildings, creating manageable forms that have a rather complex character, not falling into the Cartesian representational system. The primary goal shifts from merely documenting and describing the designs to developing interactive relationships between the user and the software. “Nevertheless, the actual revolutionization of architectural workflows came due to the advent of ML and deep learning (DL) technologies. Unlike rule-based systems, AI algorithms can learn from vast datasets and generate new design solutions by identifying patterns and trends, making them dynamic and versatile” (Albukhari 2025) [
3]. Since the beginning of the 21st century, AI has been progressively integrated into the design process, eventually affecting the growth of ML, a subfield of AI. ML can be defined as the process by which the computer system identifies complex patterns and relationships from the input data, imitating human practices.
Architecture has often sought advanced design tools, motivating the development of the parametric system, from natural elements, such as climate, human movement, and structural functionality, to the digital form of these and some additional parameters [
21]. In smaller-scale areas, such as the traditional settlements of Epirus, the integration of natural parameters into the design process is quite a common strategy; however, the applied processes do not always keep up with technological advancements, as a delay is often witnessed regarding the practice of upgrading to new workflows. The integration of advanced computer systems in design prompts a thorough understanding of the dynamic relationships shaping a place, and this potential leads to the creation of effective design plans for sustainable integration into the environment. In the present case study, the use of advanced design methods forms the basis for a system that integrates the rich environmental and cultural context of the wider Zagori region.
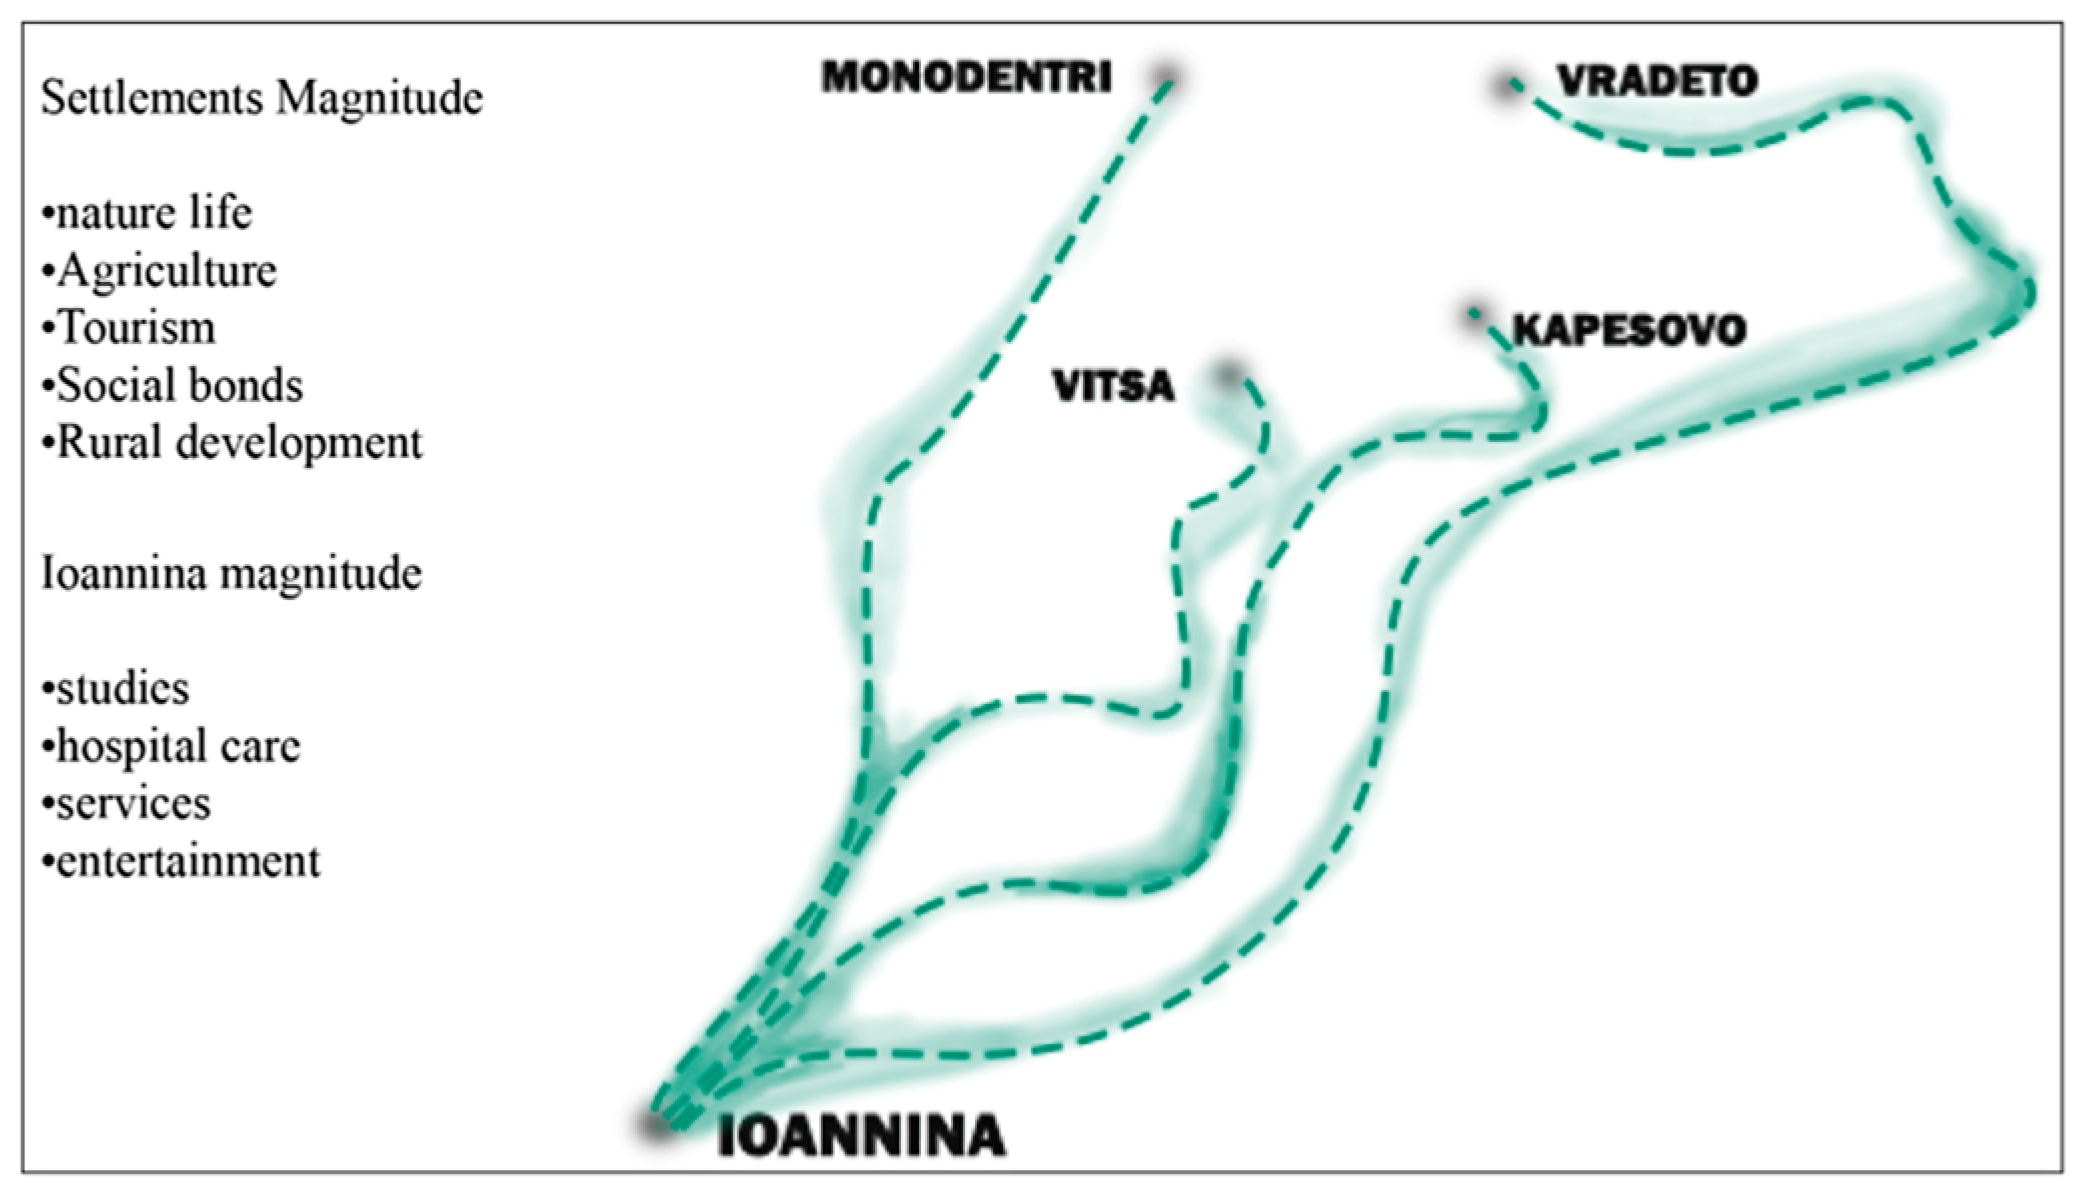
As we examine the Zagori region, it is evident that in recent years there has been a critical shift in population from traditional villages to large urban centers. Delving deeper into the reasons for this movement, one may identify the variables that contribute to the dynamic relationship between people and their environment. In the past, the difficult terrain provided security for the residents, portraying them as the main force that held the particles, i.e., the residents, at the core of the settlements. However, over the years this force has weakened, giving space to the growing influence of urban centers, as variables such as education, health care, and services gain viability. More recently, however, a new variable has been on the rise, namely tourism, which is also a consequence of the landscape’s special character. With the emergence of tourism, a new flow of population towards settlements is being created, reinforced by the evolution of technology and the growth of the internet. The former ties that bound residents to their villages no longer have the same power, such as traditional occupations, as opposed to remote work. Additionally, the growth of tourism has spurred infrastructure improvement, particularly in health care and education, fostering a sustainable return of permanent residents,
Figure 3.
On the other hand, the increase in tourism can have devastating consequences, especially for the environment. The vast influx of temporary inhabitants, combined with the duration of their stay in the area, can be detrimental to the natural environment, modifying factors such as water purity, soil quality, wildlife population, and fire risk. The terrain is directly related to tourism, as its special relief increases the area’s magnitude, attracting a vast number of tourists, yet this extensiveness may threaten environmental and ecosystemic stability. The relationship between a place and its inhabitants needs to remain functional, and if one factor changes, a new balance point needs to be set to prevent disturbances.
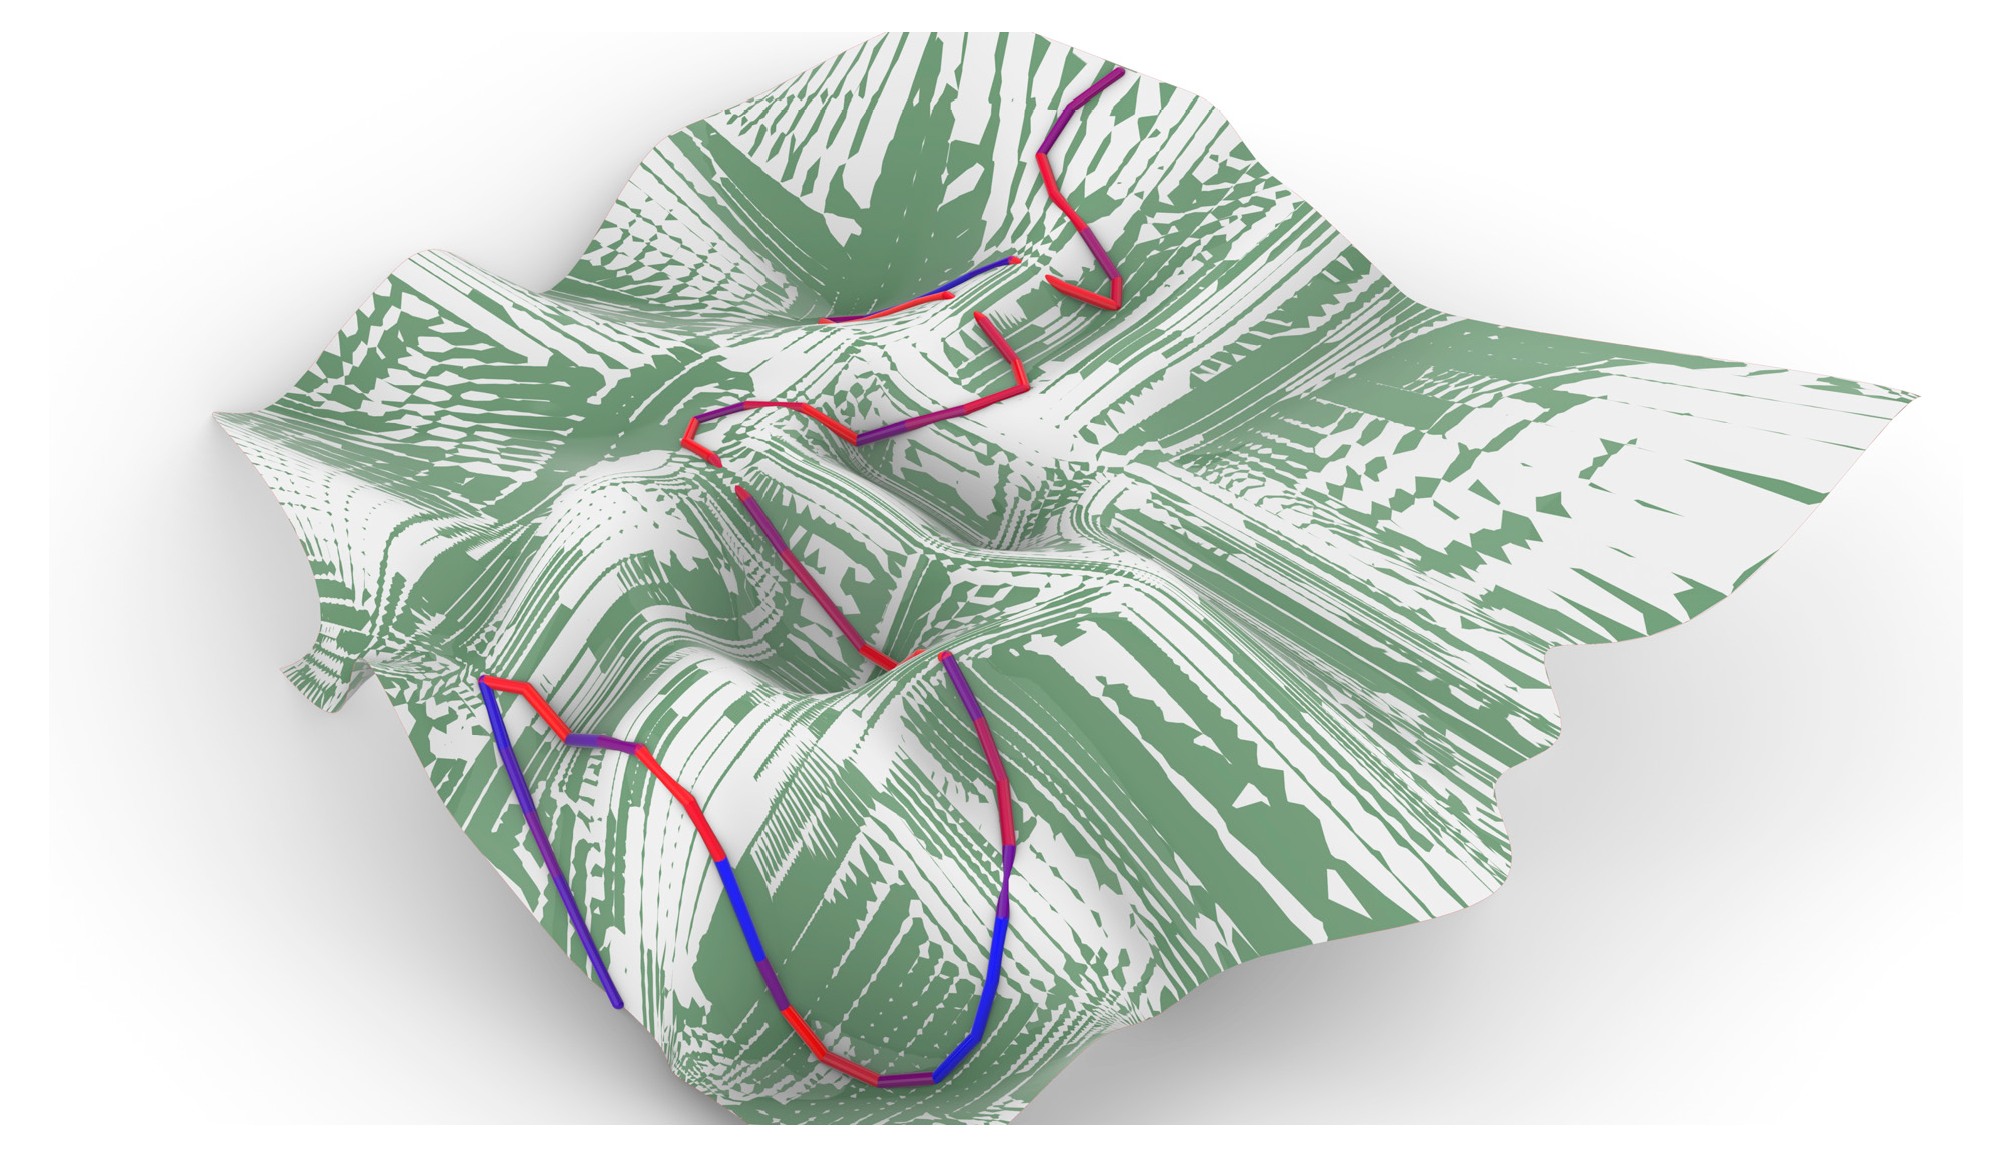
Following this observation, this research examines the complex relationship between the formation of the road network for current residents and the natural environment in the region. A key factor influencing their formation is the terrain, as steep slopes, vegetation, river flows, and existing obstacles are some of the elements that intervene in the curve of the roads. The network is built to serve settlements, and therefore their location and the direct connection to the nearest urban center play a decisive role. Over time, some routes were transformed into main road axes, providing access to the villages, while others disappeared into the dense vegetation that covered them. In recent times, the rise in tourism has brought about changes to this network. The goal is not so much speed and efficiency, but the route itself, offering an experiential relationship with nature and the surrounding landscape. In this way, various attractors are identified in the curve of the routes, such as points of historical interest, for example, bridges and churches, also points of natural beauty, and even areas with a strong slope for hiking and excursions, which improve the traveler’s experience,
Figure 4. At a second level of analysis comes the correlation between the morphology of the roads and the rivers. It seems that the variables that influence the two curves are similar, with the terrain, which implies intense relief, dense vegetation, and the presence of obstacles, having the dominant role in shaping them. The two routes aim to transition between the points of interest, seeking the optimal application in the environment. The impact of the networks created in the natural landscape should not be overlooked, as they form a bidirectional relationship.
The Zagori region carries a rich cultural heritage, with an abundance of historical monuments and traditional bridges. The terrain has also influenced this sector, as the rocky soil provided the foundation for the construction of residential complexes out of stone, while simultaneously the construction process promoted the art of the builders, whose skill and dedication to their craft are evident in the lasting legacy of these historical monuments. The combination of these two factors, during the 18th and 19th centuries, led, among other things, to the construction of stone bridges, which were a vital connection between the settlements, being isolated otherwise due to the difficult terrain. Thus, stone structures are an important element of the region. Although access to isolated villages is no longer based on stone bridges, the latter remains a pole of attraction, resulting in the development of tourism in the area and offering a fulfilling experience to visitors, especially in relation to the natural environment in which they are contained. In this case, architecture becomes an operation of space, defined by its nature (Cache, 1995) [
13].
Focusing on the analysis of the relationships and internal forces that are created, the attention shifts towards the scale of the dwelling. In the settlements of Zagori, the organization is observed as an autonomous system whose shape is based on internal forces and external factors. Architecture is the process of designing and organizing space in a way that is functional, aesthetic, and meaningful at the same time: “On the outside the vector indicated the site as an eminence in order to determine a territorial identity; on the inside the vector is this object opposite which one must position oneself to determine a sexual identity” (Cache 1995) [
13].
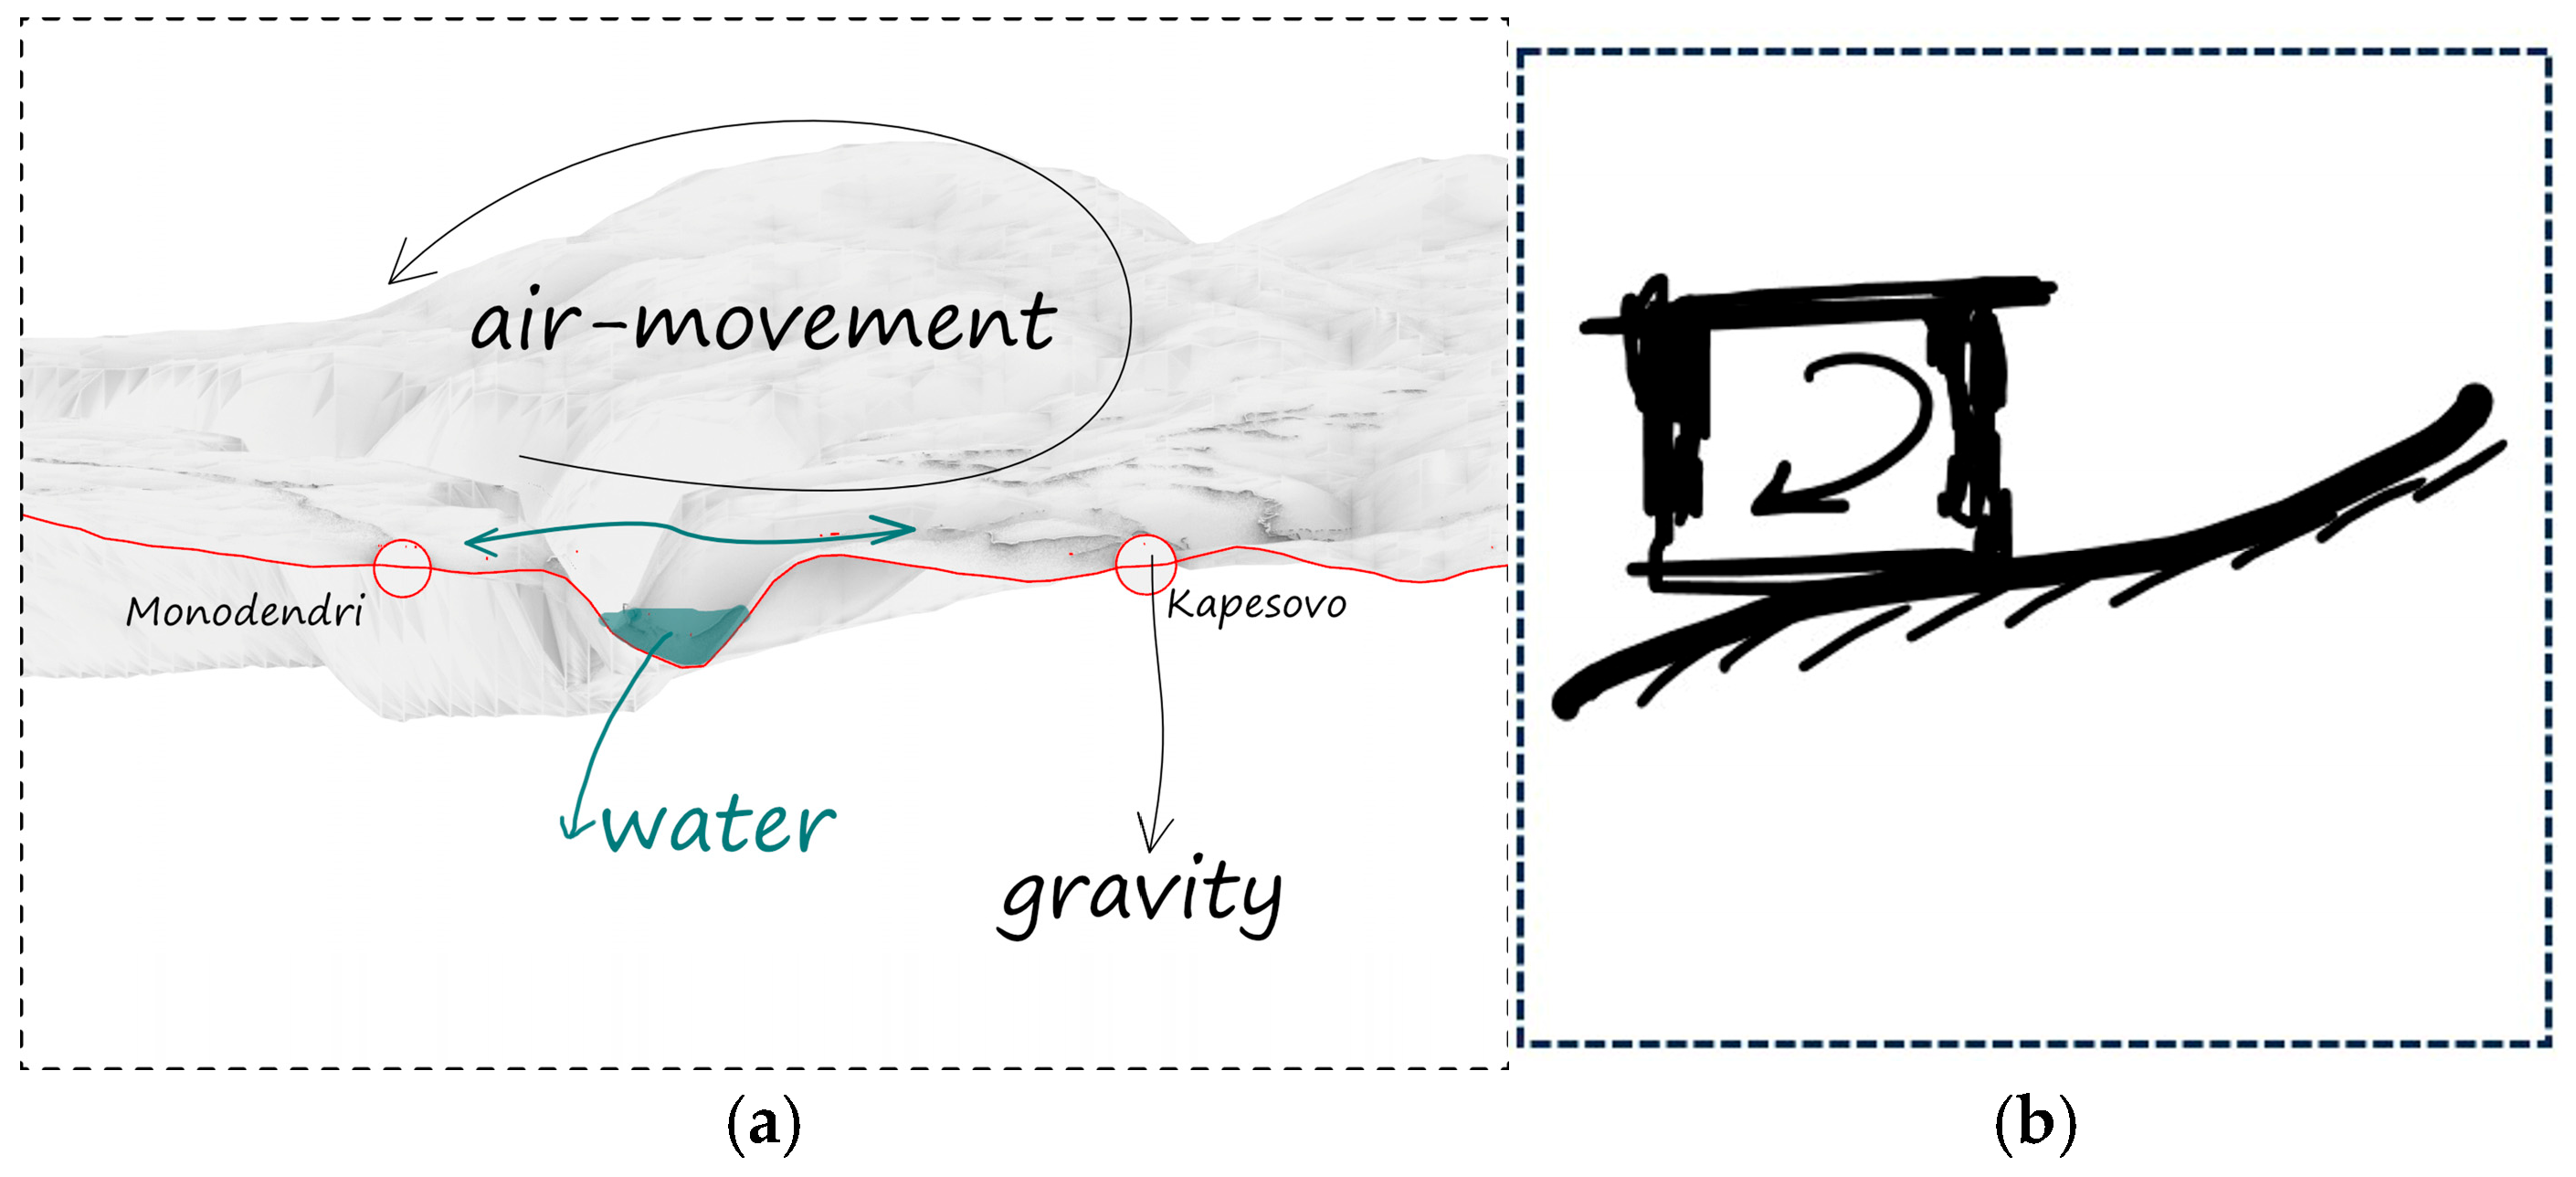
In this context, a vector can be identified as a force that molds the identity of a space or an individual within that space. The build is the combination of the forces exerted on it, either by the environment or by the user. It can initially be treated as an object that receives forces, but at a second level it turns into a dynamic object, where the same forces interact with the environment,
Figure 5. There are two main categories of factors that influence the interaction between two variables, which are divided into endogenous and exogenous factors. The former factors are associated with changes that occur within an element, such as user status and scale, while the latter include external forces that act on it, such as gravity, weather conditions, and terrain (
Figure 6). The main difference between the user and the environment lies in their change over time. Terrain formation undertakes limited changes, so it is defined as a constant element. On the contrary, the user status varies, and for this reason it is defined as a variable with the corresponding range of values including age, length of residence, and type of property. So, in a system of continuous changes, one may observe how external geography impacts internal morphology. Thus, in the case of the Vikos region, it is evident that the forces of location have influenced the formation of the settlements with distinct characteristics in their entirety, but also in each house individually. Concerning the whole, narrow paths are identified that run through the settlements and create areas with high density in the center, which are surrounded by arable land, whereas the houses are defined by simple geometric shapes with limited openings.
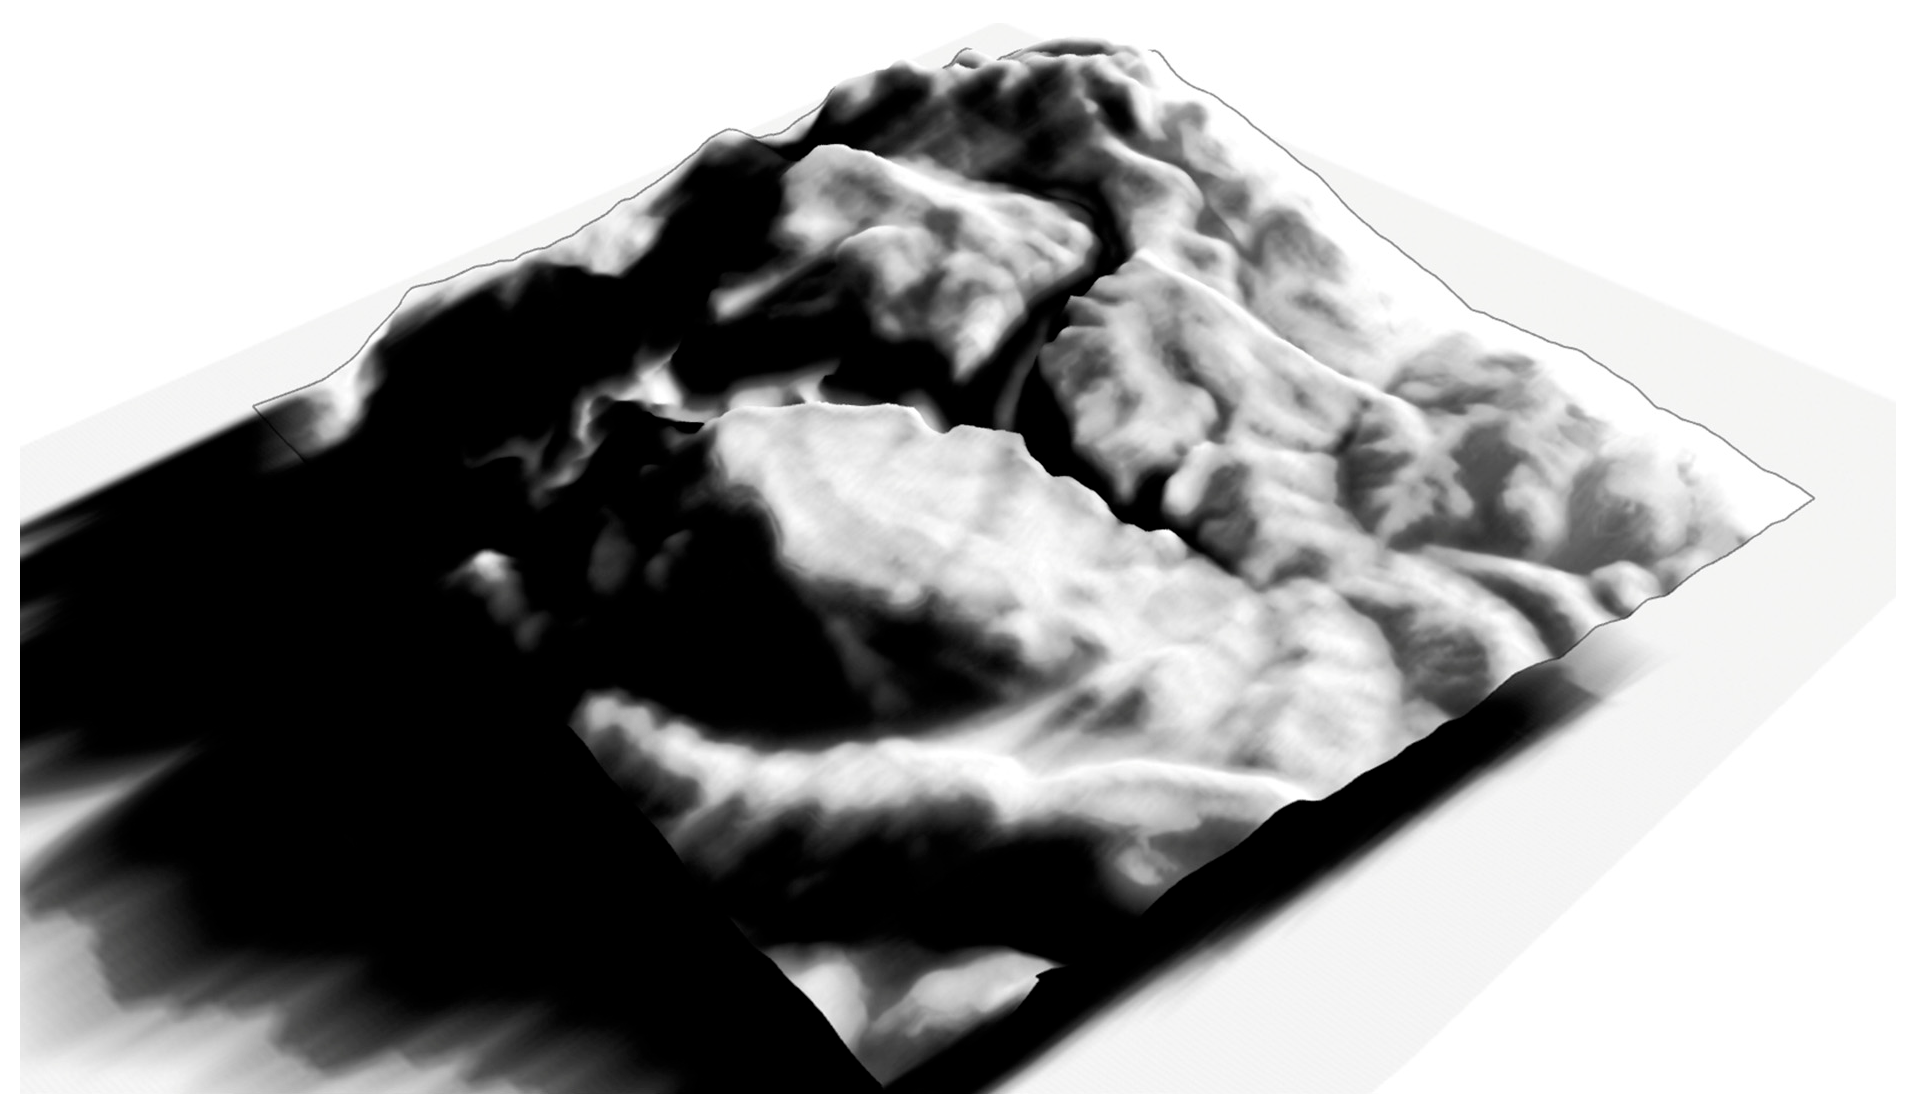
More specifically, the influence of the terrain on the settlements in Zagori is evident in both their locations, carefully chosen to offer protection during the winter months from heavy rainfall and stream formations, and to assist the activities of the residents, as the quality of the terrain dictates different agricultural activities, while the rocky surfaces present challenges and opportunities for development,
Figure 6. Regarding the building units, specifically the residences, we identify external and internal forces from which the morphological and design choices derive. Starting from the external factors that shaped the morphology of the residences, the long winter, with strong winds, led to the construction of limited openings, and the rocky terrain became the reason for the construction of buildings of the same composition, which in turn created static limitations. Moving on to the internal factors, a key point is the user and his/her status. The involvement in livestock farming and limited heating systems created a system where they coexisted harmoniously. The design of the houses seems to adapt to the changes in the status of the user, mainly in terms of economic prosperity, as it becomes gradually more elaborate, creating three basic typologies: the “grandmother”, the “mother”, and the “daughter” (Kitsakis, Tsiliakou, Labropoulos, Dimopoulou, 2017) [
22]. However, the relationship of the user with the building seems to have weakened in recent years, as the status of the former is no longer reflected in the latter. For example, in a 1960 house, the user was mainly involved in livestock farming, while in the same house in 2025, the user’s activity has turned into remote work. Consequently, the resident of Zagori seems to adapt more to the shell, which tends to remain unchanged, especially in cases where the traditional architectural style is maintained, while the typology of the past does not reflect the needs of today, such as the strong difference in user activity.
2.3. Introduction to Software System Design
To formulate the system, it is necessary to specify the tools upon which it will be built for its optimal representation. The proposed system’s purpose is to integrate existing datasets as inputs, predicting the prospective evolution of settlements. The ML technique is a way of training a model, since it can identify patterns in data and then use similar patterns to predict future data. Prediction comes with a degree of uncertainty, which admittedly comes in many forms: “what is the best prediction about the future given some past data? What is the best model to explain some data?” (Murphy 2012) [
23].
In the context of this study, ML has been used as a tool for learning about the complex, multi-variable system of the settlements in Zagori. This methodology is set to overcome the limitations of conventional analytical methods when applied to the unique terrain of Vikos’ Gorge. By training the model with historical and environmental inputs, the system discovers underlying patterns and relationships that may not be obvious through traditional methods. A key element for the development of a predictive model is the process of learning through the analysis of the case study’s specific data. The aim is to develop a system that is adaptable to the field’s characteristics and able to predict its sustainable future development.
There are three main areas that ML is divided into. To begin with, we have the predictive/supervised learning on which the new system model will be based. The second type is the descriptive/unsupervised, which has inputs but not outputs while looking for interesting patterns, and the third type is reinforcement learning, which is trained through “reward” or “punishment” techniques. In the field of urban development, similar systems can be identified based on their operational mechanisms, such as cellular automata [
24]. “Cellular model assumes only an action space (usually a grid), a set of initial conditions, and a set of behavior rules. Characteristic of such models of complexity is that behavior is emergent, that is, it is generated by repetitive application of the rules beyond the initial conditions,
Figure 7. Complex systems are also termed self-organizing and are remarkably suitable to computational simulation” (Wolfram 1984) [
25]. The applications of model data vary depending on the sector it serves. In the field of urban planning, these models are used to simulate urban development based on spatial and environmental data. The procedure followed includes the division of the map of the study area into “cells” based on predefined rules, with each cell changing its current state depending on the given variables. Another noteworthy application used to predict urban development is Land Use Regression Models, which focus mainly on predicting land use, settlement development, and environmental impacts [
26,
27,
28]. The main parameters utilized are population, climate, vegetation, and infrastructure, and their application is accomplished by combining spatial data with regression or classification [
29]. Similarly, ML systems are used for Urban Development, classifying it firstly into DL for image analysis through GIS and secondly into systems using Random Forests and Gradient Boosting, where they are used to predict development categories such as urban, rural, or mixed [
30,
31,
32].
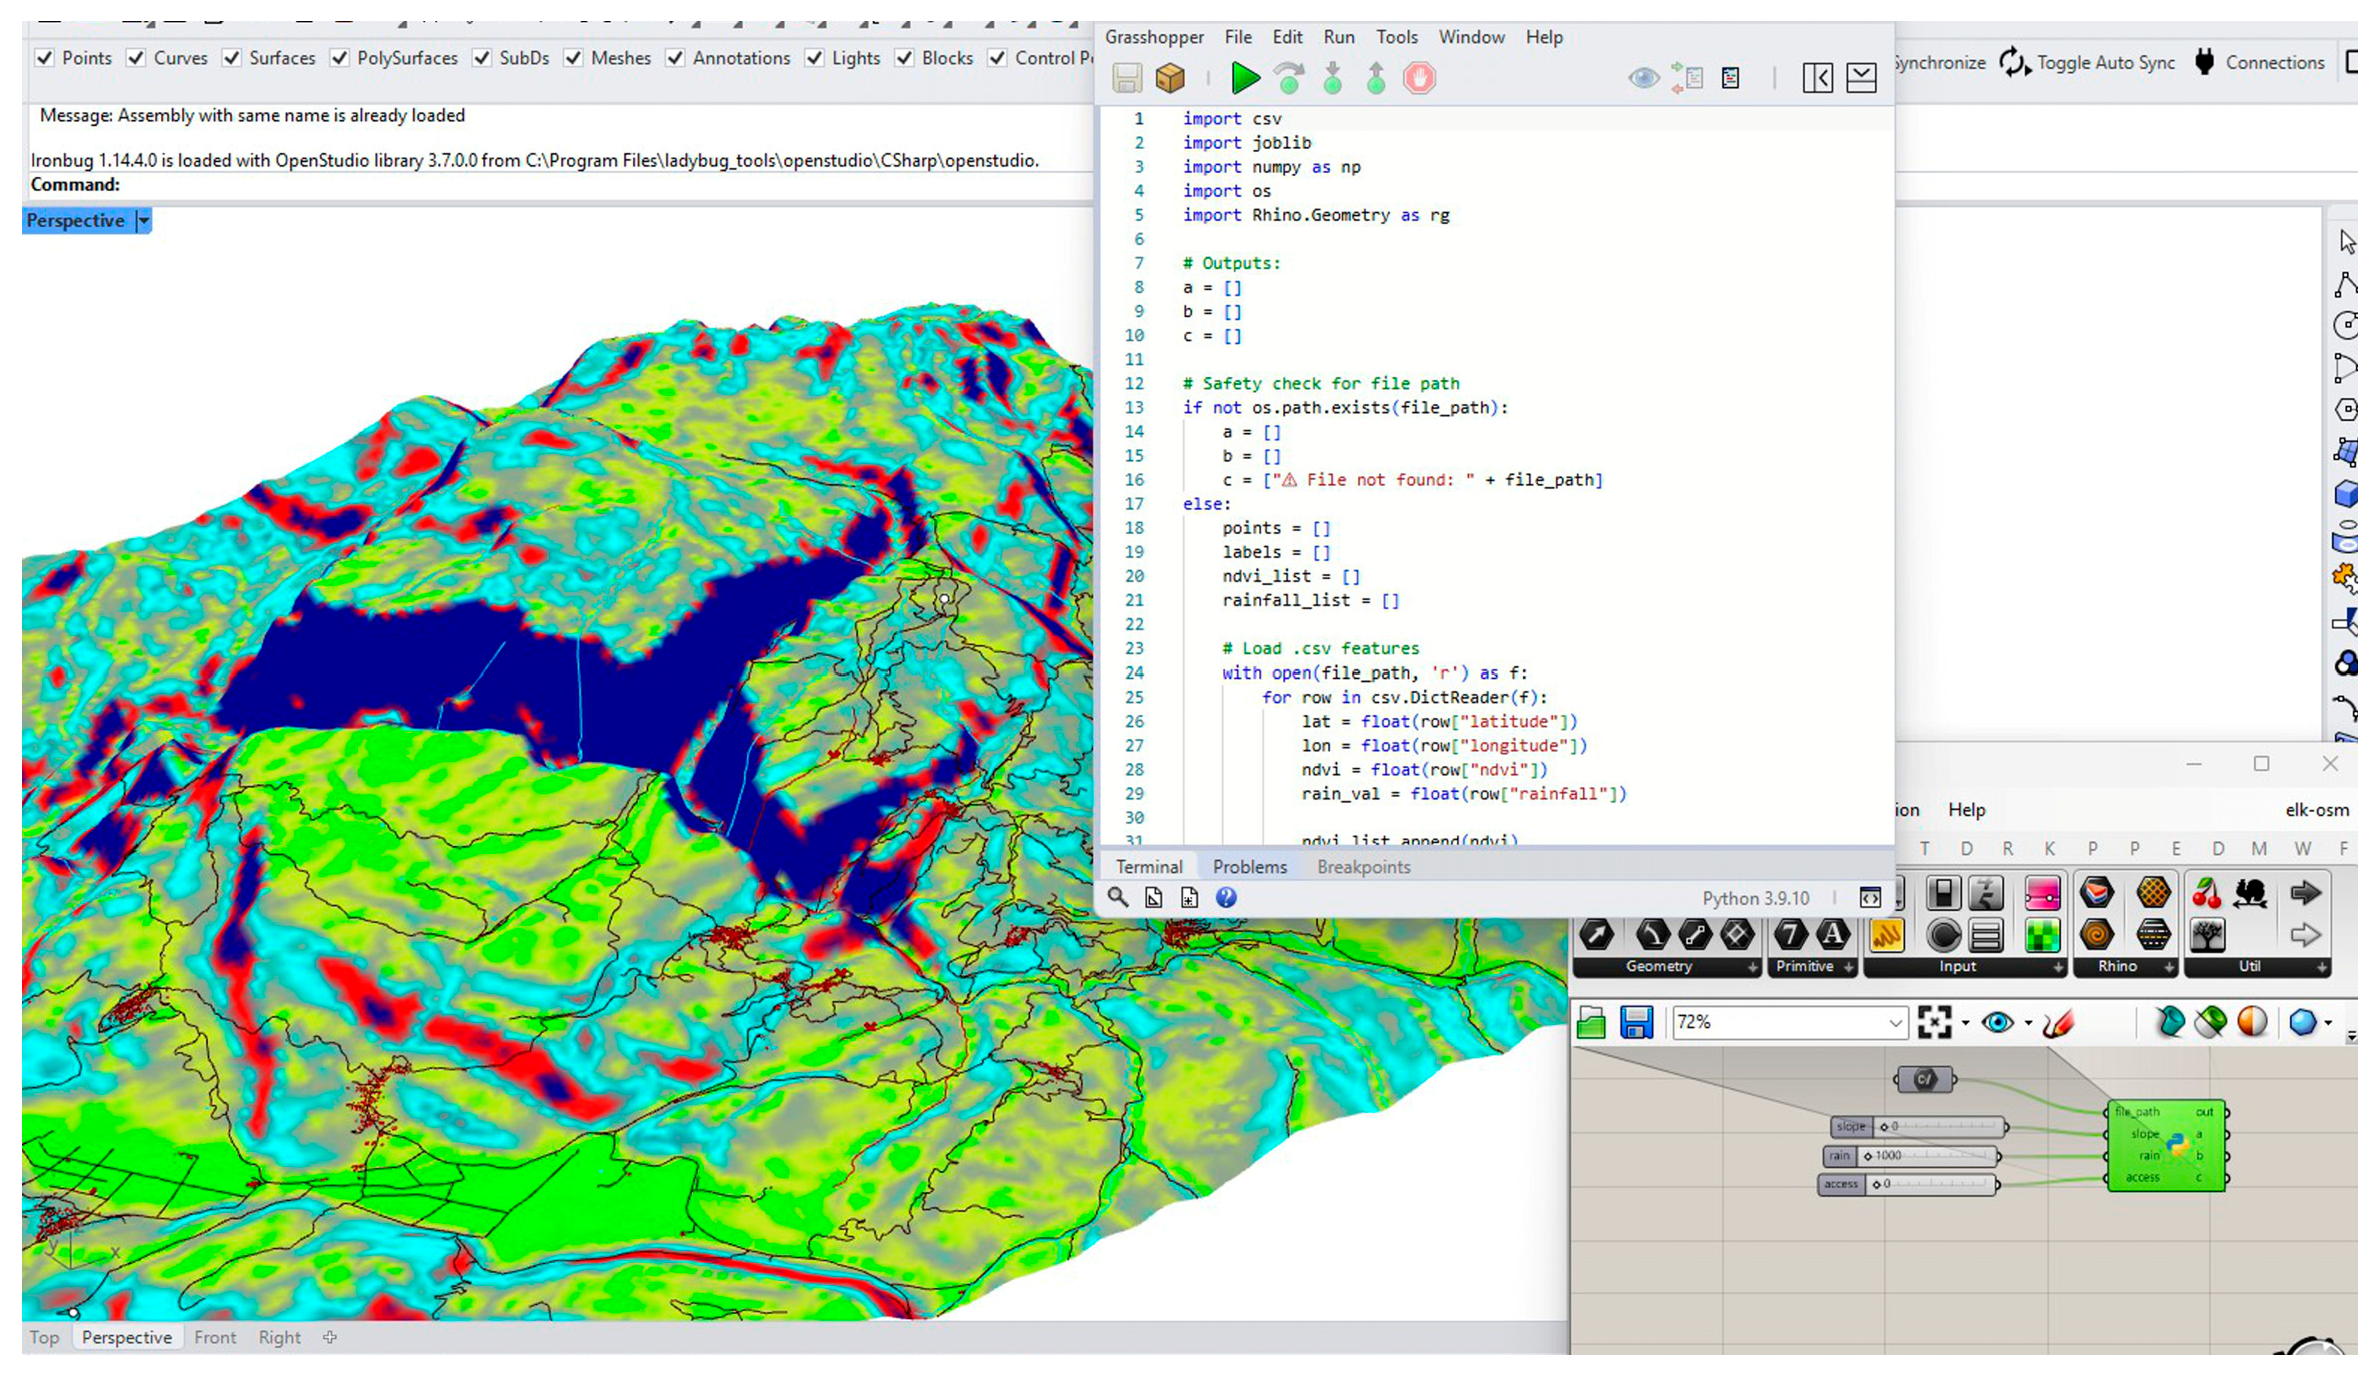
According to the information given, the main tools that will shape the system are Python 3.9.11 (CPython), as a programming language, which will be accompanied by libraries such as Scikit-Learn1.3.2 (in Script Editor of Rhino 8), GeoPandas, Matplotlib/Seaborn, and TensorFlow or PyTorch (Rhino 8 CPython), and the QGIS 3.34.12 and grasshopper (in Rhino 8) programs for spatial visualization and analysis of the process. However, to achieve the goal, various digital tools are used supplementally in order to provide the framework of the application within which the data is integrated [
33].
The first step in the process necessitates the collection and processing of data as inputs for training the ML system [
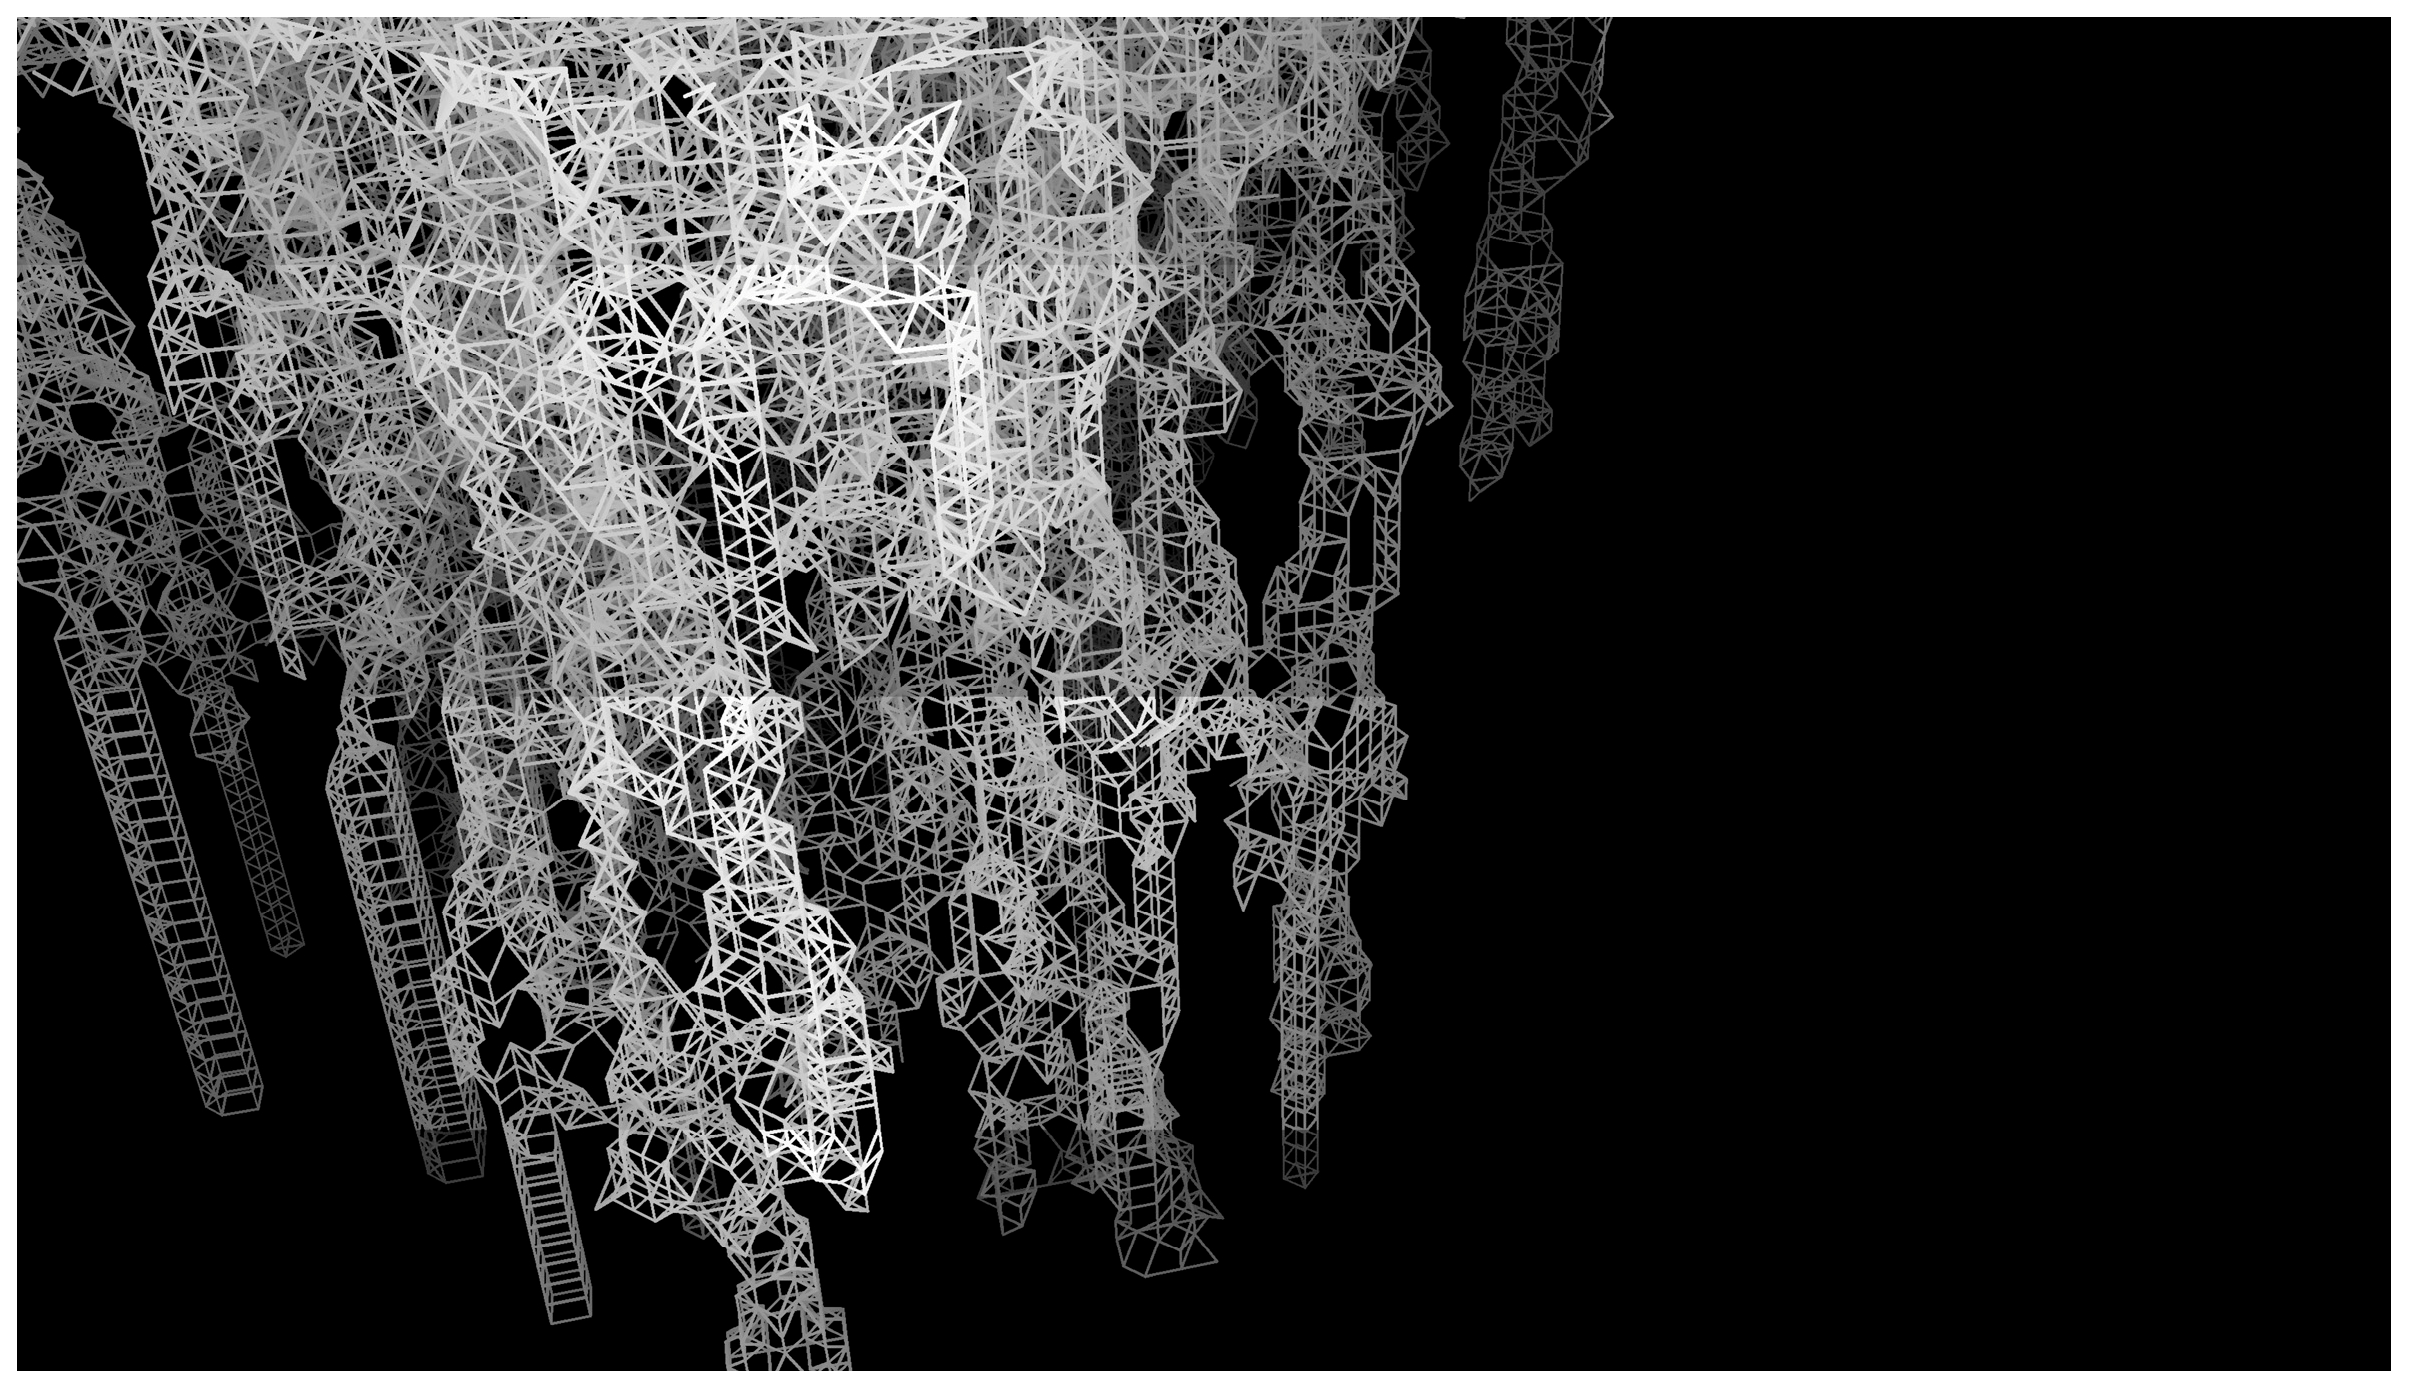
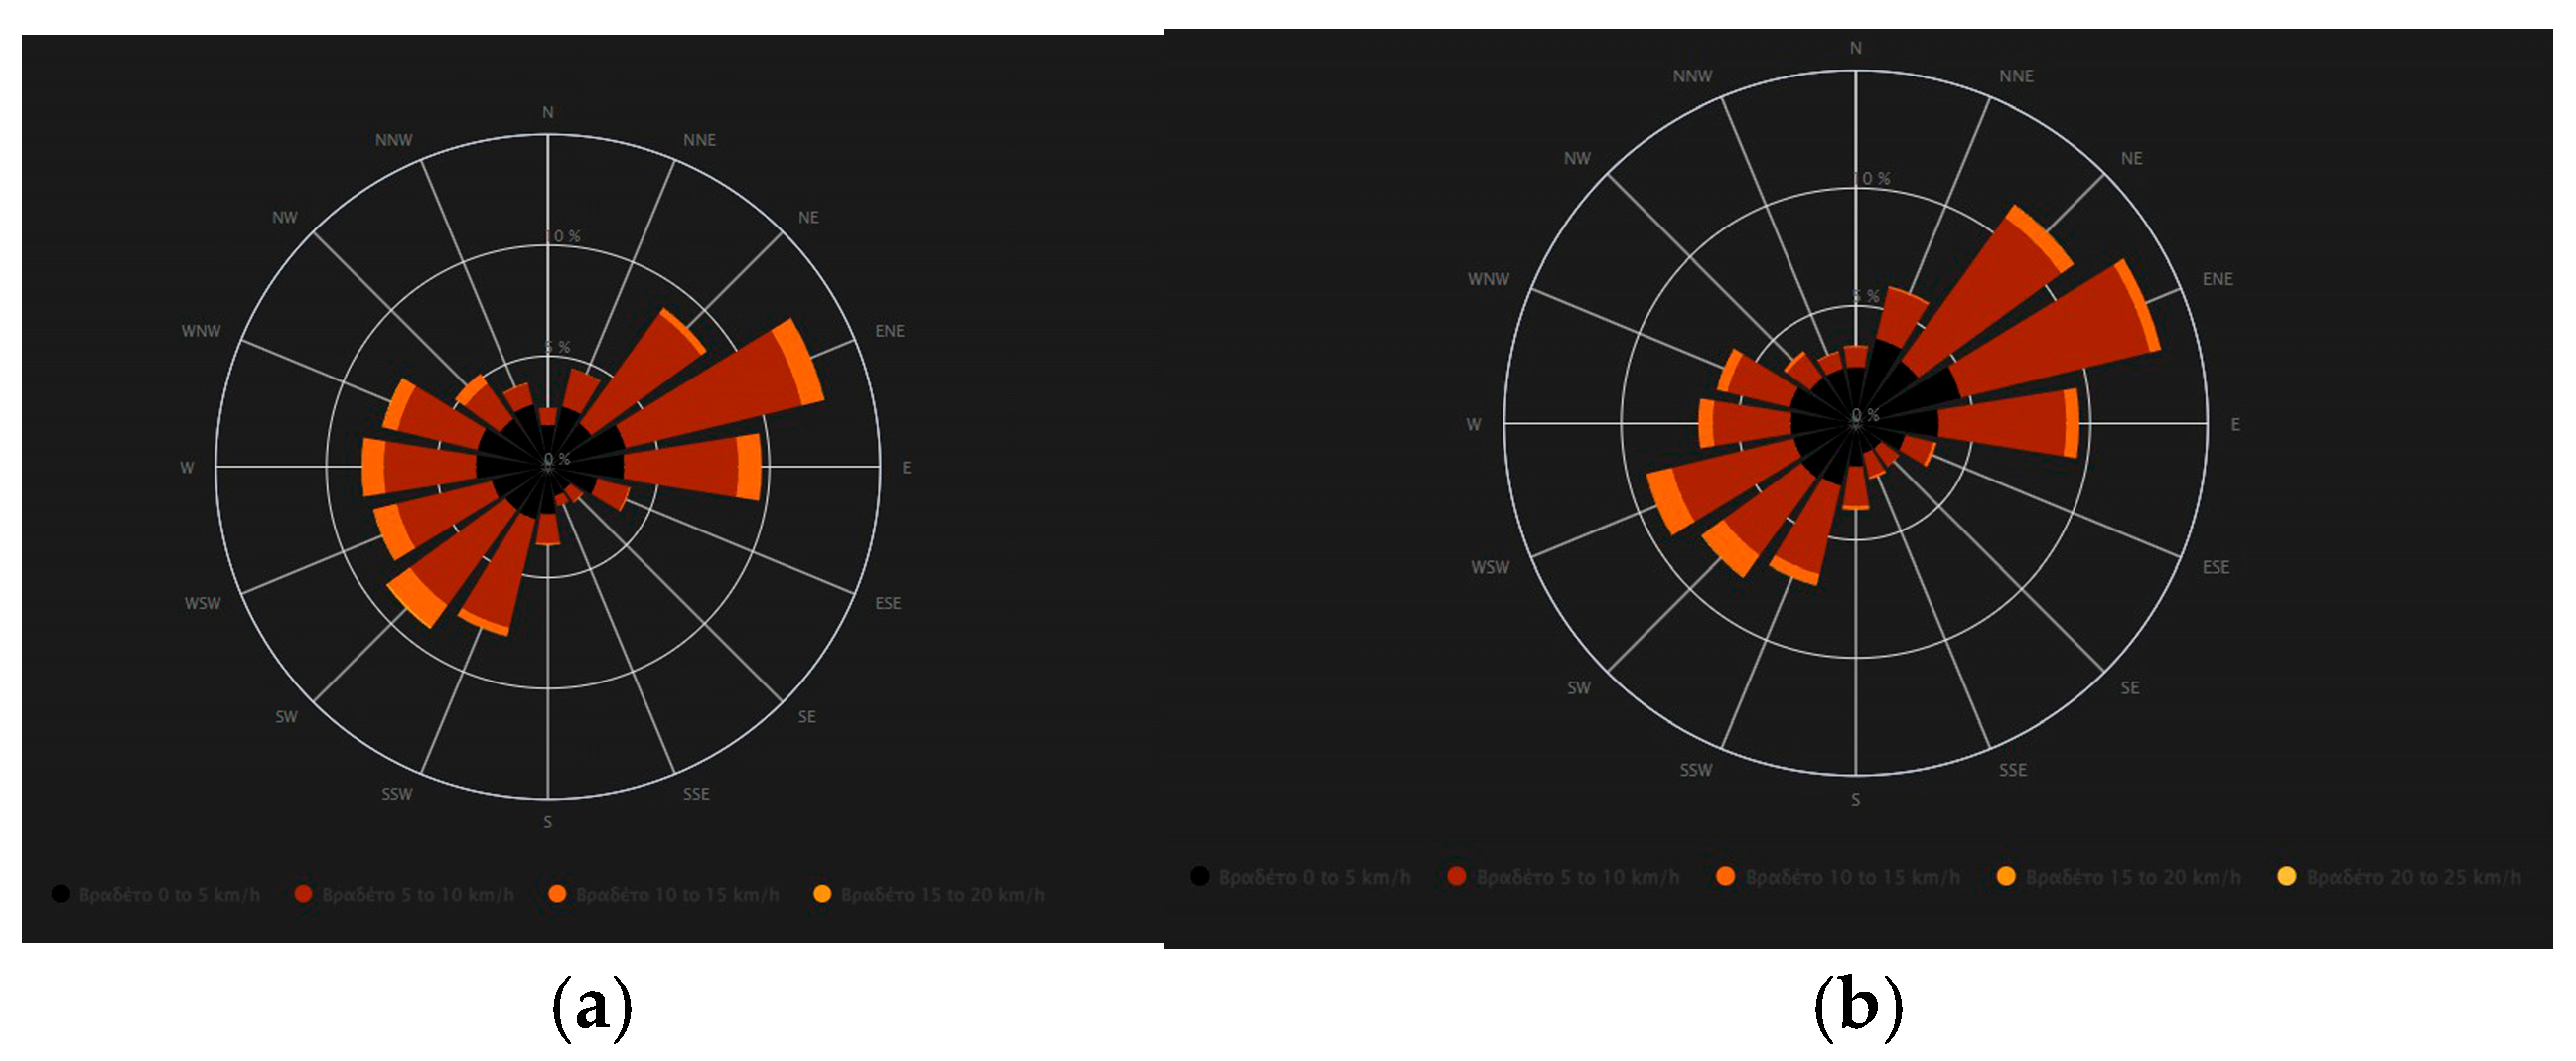
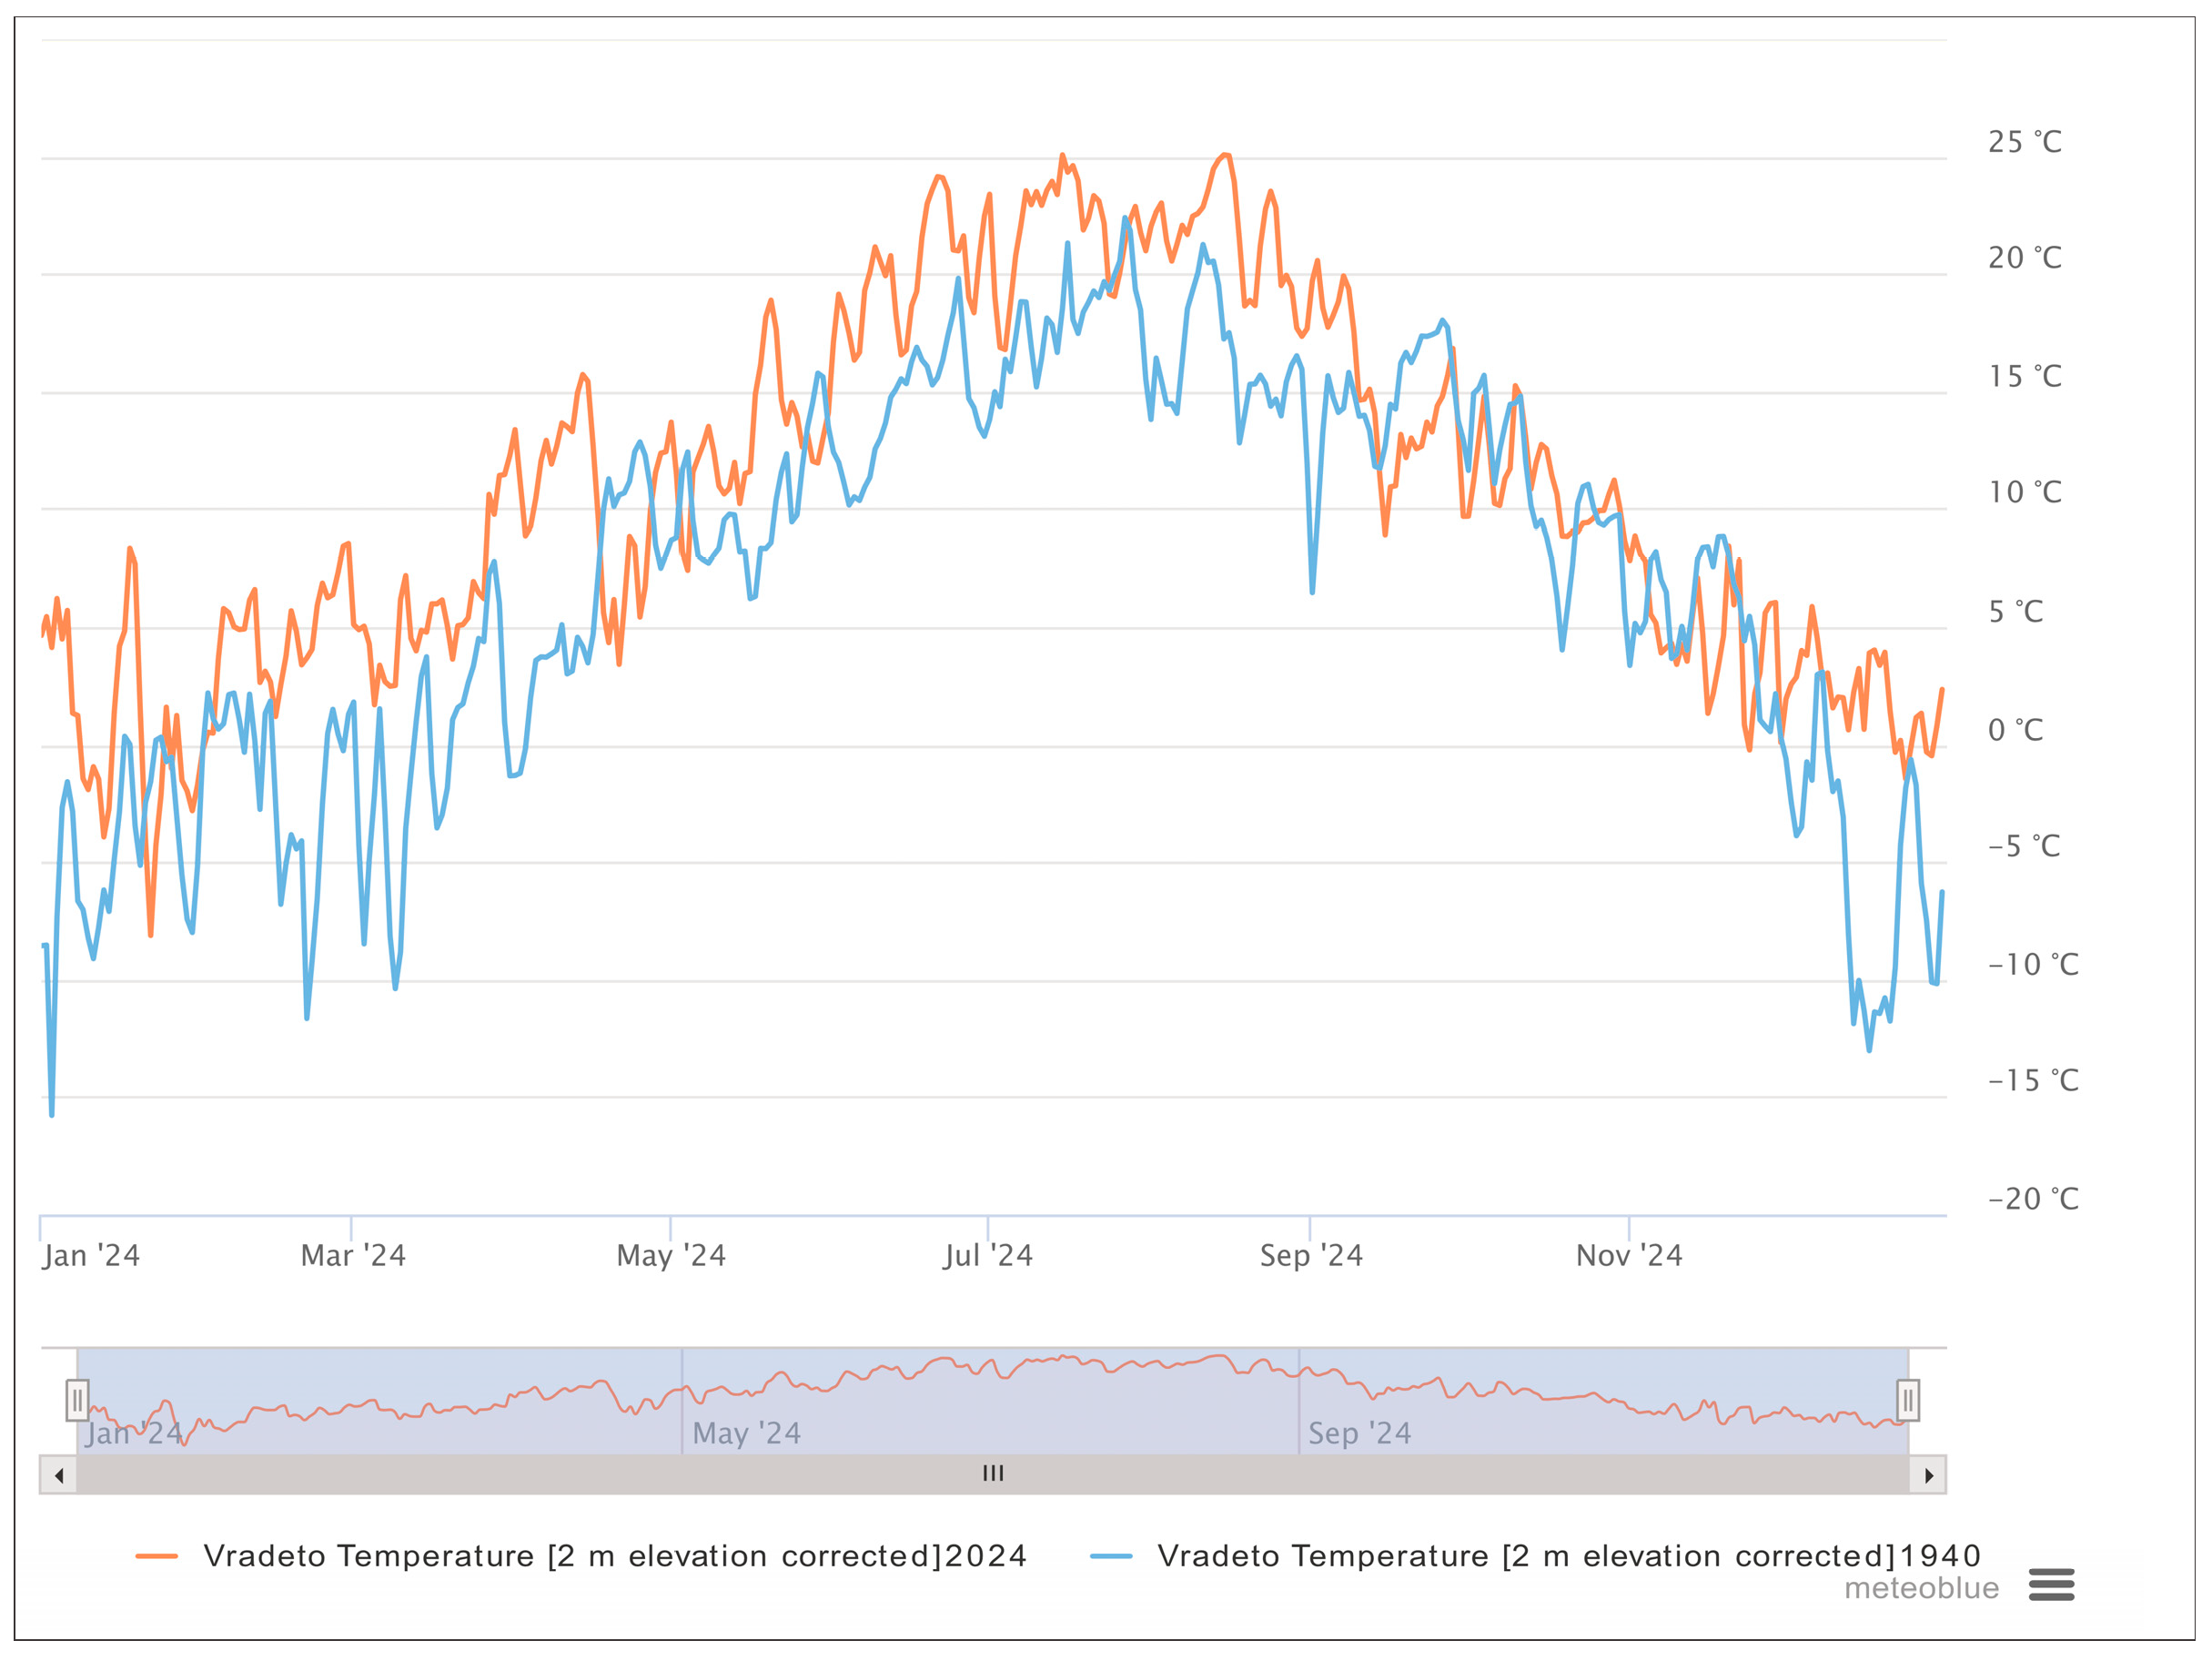
34]. From the analysis of the Vikos region, we can divide the inputs into two elementary categories, constants, and variables, and identify the appropriate form that will represent them. Constants include elements such as the geographical location as coordinates, the terrain as a mesh, the soil composition in a scaled form from rough to soft, and the altitude as a number. On the other hand, the variables can be equally divided into two subcategories: variables as numerical values and attractors. In the first case, components like the climate are included as a table of elements. The final form comprises the percentage of the annual number of days, with each element illustrating a natural phenomenon. Additional data relates to variables such as permanent and temporary residents, their average length of stay, their activity, cultivable area, the percentage of fluids, the extent of forests, the risk of environmental pollution, as well as economic prosperity. Attractors, on the other hand, represent dynamic variables, such as curves that demonstrate the routes between settlements and how they are affected by various factors such as points of interest, the slope of the ground, and the distance from a water source. Furthermore, a dynamic attractor could include the number of permanent and temporary residents, and their magnitude can be influenced by the infrastructure in the settlements, the progress of technology and the digitization of processes, the rise in tourism, and the political instability that a place may face,
Figure 8,
Figure 9 and
Figure 10.
To effectively process and analyze the input data, a more general structure must be applied to it. Creating tables in CSV/Excel format, with each row to represent a settlement and each column a variable (Area, Population, Forest Percentage, Climate Index, etc.), will simplify data management and analysis. Along with this, a range of images of the settlements can be incorporated into the tables in order to identify the broader morphology of the area.
Input data example 1:
data = {
“Area”: [500, 800, 300],
“Permanent Residents”: [100, 200, 50],
“Climate_Index”: [0.8, 0.7, 0.9],
“Forest Percentage”: [0.3, 0.4, 0.2],
“Development Level”: [“High”, “Medium”, “Low”] # tags for categorization
}
Input data example 2:
Import pandas as pd
#Data for Vradeto settlement
data = {
“name”: [“Vradeto”],“latitude”: [39.9051],“longitude”: [20.8172],“altitude”: [1340], “pop_permanent”: [15],“pop_seasonal”: [80],“climate_avg_temp”: [9.5],“rainfall”: [1300], “forest_pct”: [50], “infrastructure_access”: [“Low”]
}
#DataFrame
df=pd.DataFrame(data)
#save as CSV
df.to_csv(“Vradeto_data.csv”, index=False)
print(“Vradeto_data.csv file has been created)
|
The development and use of computational tools mark a major turning point in the disciplines of architecture. These tools’ ability to process complex datasets and prevent negative outcomes allows for the creation of design models that incorporate the prevailing theoretical principles. We can identify two main limitations in the use of ML. One is the reliance on large amounts of data to improve accuracy, and the other is the difficulty in including qualitative variables, such as cultural and experiential factors. Both of these limitations, individually or together, can lead to inaccurate results and weaken their reliability. This technological shift aims to bridge the gap between tradition and new technological achievements, enriching traditional architecture with elements of contemporary culture. In addition, the use of these tools benefits regional tourism, among other things. This involves improving services, infrastructure, and transportation while avoiding any negative impact on the environment. The tool’s intention is seamless integration of settlements into the environment; therefore, any application prioritizing profit could undoubtedly lead to negative results.
