Abstract
China’s major function-oriented zoning (MFOZ) serves as a crucial policy instrument for functional regulation of land use, playing a significant role in the latest territorial spatial planning. Studies on the implementation of MFOZ have been conducted since its release in 2012, but there is a lack of comprehensive methods to assess the effectiveness of its implementation. In China, the newly initiated City Examination provides novel technical support for verifying MFOZ planning, addressing the gap in comprehensive evaluation methodologies and channels. This study proposes a comprehensive urban assessment framework and a major function classification approach based on City Examination data, enabling the identification of implementation deviations in MFOZ planning based on the current urban conditions reflected by City Examination. The methodology incorporates dimensionality reduction, multi-indicator clustering, entropy-weighted overlays, and natural break classification techniques and examines the degree of strategic deviation in China’s MFOZ through a comprehensive and systematic assessment. Due to the timeliness and long-term nature City Examination data, the method allows for the long-time dynamic tracking and evaluation of the real-time progress in MFOZ. Empirical analysis of Hubei Province revealed that 77.9% of its urban development aligns with the 2011 MFOZ scheme while demonstrating discernible deviation types and hierarchical discrepancies, with geographically clustered patterns observed among cities exhibiting such deviations.
1. Introduction
Land use regulation constitutes a fundamental management concept in the domain of urban and regional planning. It refers to the government or a planning department’s endeavor to regulate and guide the development and utilization of land. This regulatory mechanism plays a pivotal role in promoting regional economic growth and achieving optimal spatial allocation of factors. It also highlights the macro-conceptual constraints on the utilization of a city [1,2]. This article delves into this concept in greater detail. Land use regulation constitutes a pivotal resource for nations seeking to advance the sustainable development of human society and enhance their national strength in a comprehensive manner. Problems such as resource and food security, as well as the disparity between urban and rural development, necessitate that nations worldwide examine their utilization of their national land space from a more elevated perspective and over a more extended time frame. This examination should involve the rational resolution of challenges related to resources, the environment, and development [3]. The concept first emerged in Western countries, as evidenced by the 1944 Greater London Plan, which imposed stringent restrictions on functional zoning, dividing the urban area into industrial, residential, and commercial and administrative zones. A similar approach was adopted during the 19th-century Ottoman renovation of Paris, which entailed the establishment of a network of roads to delineate functional areas. These plans aim to minimize the waste of spatial attributes and inefficient land use development. Now, land use regulation is still a rather important concept in the field of urban planning in Europe and the United States and is practiced in planning projects and policies [4,5]. For instance, Natura 2000 [6,7], implemented by European Union countries, the National Wilderness Preservation System [8,9], implemented by the United States of America, and Spatial Development and Spatial Planning in Germany [10] all embody the concept of land use regulation. These decrees are of great significance for the protection of the natural environment and ecological environment, as well as for the division of regional functions and synergistic regional development. The relevant regulations include policies that prohibit development in nature reserves, set restrictions on development in ecologically fragile areas, and establish policies to reduce the urban pressure on outward suburban development in economically overcrowded areas, and they provide important references for China’s land use regulation.
Influenced by Western concepts of land use regulation, China introduced the MFOZ framework in 2012, which has since evolved and become a core component of the current territorial spatial planning system. Although the MFOZ plan has been progressively refined and implemented across national, provincial, and regional levels, there remains a lack of standardized methodologies to evaluate its implementation effectiveness. As a result, the actual outcomes and impacts of the plan remain unclear. At this critical juncture in the construction of China’s territorial spatial planning system, it is essential to assess the current status of MFOZ implementation and to establish a unified framework for evaluating the effectiveness of major function objectives. To address this gap, this study proposes a comprehensive urban assessment and major function calibration methodology, using Hubei Province in an early year of the 2020s as a case study for an initial application. The proposed method provides theoretical support for the development of automated health check and evaluation mechanisms for smart cities. It also offers a reference framework for the dynamic maintenance of urban systems and for enhancing the alignment between urban planning objectives and actual development outcomes.
2. Literature Review
2.1. Progress in the Implementation of MFOZ in China
Regional disparities in economic development, resource endowments, and environmental carrying capacities are evident across China. In this context, China’s ongoing urbanization necessitates differentiated land use functional zoning strategies to guide sustainable and effective growth [11,12,13]. The MFOZ framework is based on the premise that different regions should fulfill different functions according to their natural environment, strategic location, and developmental foundations and that citizens should enjoy an equal quality of life across territories with varying functions [14]. The MFOZ approach addresses several longstanding challenges in territorial governance, including the absence of a coherent strategic blueprint for spatial development and protection, overly broad regional policy units focused predominantly on economic growth, and persistent issues of spatial disorder and structural imbalances [15]. The identification and assignment of major regional functions facilitate the narrowing of regional disparities and promote the free flow of inter-regional resources, serving as a necessary condition for achieving balanced spatial development across regions [16]. In 2012, China initiated a large-scale MFOZ planning project (2012–2020), which classified regional functions and development intensities based on the development modes and levels and thematic content. It delineated the territorial functions of different areas to determine development priorities and scales. Originally proposed as an independent planning concept for guiding the regional division of labor and development, the MFOZ framework has gradually evolved through territorial spatial planning reforms. It has been integrated into multi-level spatial master plans through top-down refinement and implementation from the national to the provincial and regional levels. The MFOZ framework has inherited key principles from international planning theories and practices, effectively shaping the form and direction of territorial development. It also represents China’s first systematic model of territorial space protection and utilization based on integrated regionalization. Furthermore, MFOZ planning synthesizes the imperatives of spatial governance and the practical needs for regional innovation and development. As such, it serves not only as a foundational policy tool but also as a strategic framework of critical importance, playing a pivotal role in China’s territorial management and national spatial development agenda.
2.2. Practice and Shortcomings of MFOZ
Since the implementation of China’s MFOZ in 2012, a scientific evaluation of the implementation effect of MFOZ has not yet been explored, and the reality is that there have been public policy deviations in the implementation of the plan over the years, so there is a need to evaluate the implementation of MFOZ in order to facilitate adjustments in a subsequent policy. Public policy deviation is an actual phenomenon that occurs when policies are transmitted and implemented, and there are many factors in reality that can cause policies to gradually deviate from their objectives during implementation. When the government transmits public policies downward, transforming them into realistic policy objectives is not a straightforward process, and policy objectives undergo a process of layer-by-layer refinement or re-planning. And there is also a certain amount of distance between policy formulation and policy implementation, and this distance provides an opportunity for the policy objectives to become distorted [17]. After the MFOZ plan was formulated in 2012, China proposed the formulation of a new territorial spatial plan by 2020, which may have generated public policy bias during the eight years of policy implementation and ushered in an opportunity for changes in MFOZ when this new chapter of territorial spatial plan formulation began. At this critical point in time, the original plan’s implementation needs to be evaluated to verify the suitability of the plan in this new development context. The current research on urban planning deviation does not yet include a planning deviation study on MFOZ planning, mainly focusing on the study of planning deviations in land use in individual cities [18,19], exploring the reasons for policy implementation deviation in a certain area [20], and focusing on the interaction between policy implementation deviation and other strategies in the same area [21]. The existing research on MFOZ in practice mainly focuses on the construction of provincial-, municipal-, and county-level MFOZ or evaluation system indicators through quantitative analysis [22,23,24], the interrelationship between MFOZ planning and the existing planning methods [25], the implementation effect of MFOZ from the perspective of sustainable development [26], and the impact of the MFOZ strategy on urban development [27,28]. To judge the implementation effect of MFOZ, only a few studies have explored the evolution of MFOZ in recent years, as well as the temporal and spatial mechanisms of occurrence and feedback, and analyzed the characteristics of MFOZ by using the five basic elements of people, land, industry, and finance and the relevant provincial technical regulations and indicators to determine the type of occurrence mechanism. Research on the interactive testing of public policy bias phenomena to determine the implementation effects of MFOZ planning to enhance the rationality of territorial spatial planning is still being explored. Preliminary research findings indicate the presence of two distinct research deficiencies. Firstly, the effects of MFOZ have not been thoroughly evaluated following its completion. Despite the identification of MFOZ implementations, there remains a dearth of precise tracking and feedback mechanisms to ascertain their genuine effects. Consequently, the implementation of these measures is constrained to the cultivation of specific industries, and the original assessment methodologies must be enhanced. Secondly, the implementation of major function objectives is deficient in standards for assessing progress during intermediate stages or processes, and there is no clear method for judging the development of industry, people’s well-being, and other indicators. As a result, it is difficult to measure the progress of their implementation, and the lack of a mechanism for dynamic adjustments and corrections has made it difficult to identify problems and make timely corrections in the development stage. This has affected long-term development planning and the achievement of cities’ objectives.
Two measures to achieve research breakthroughs are proposed to address the current lack of research: a test of the effects of the 2012 MFOZ and an assessment of the progress made toward the realization of the future MFOZ framework. First, a method involving the coupled assessment of major functions and realities is proposed to test the effects of the 2012 MFOZ. In 2020, China proposed the formulation of a new territorial spatial plan, accompanied by the introduction of City Examination and Evaluation in Spatial Planning. This physical examination was earmarked for implementation nationwide in 2024. The objective of this initiative was twofold: first, to formulate targeted countermeasures to address the issue of “urban diseases”, and second, to optimize urban development goals and address the shortcomings of urban construction. The data obtained from the aforementioned examination can provide a comprehensive picture of the basic situation in a city. The utilization of data at the provincial, municipal, and county levels, as collected by the city, facilitates a comprehensive understanding of their respective characteristics and a coupling assessment of the 2012 MFOZ. This approach enables the delineation of future urban development trajectories and the adjustment of the developmental pace. Secondly, the proposal outlines the implementation of assessment tools to evaluate the progress made toward meeting the objectives for the major functions. These tools will be utilized to assess the progress made toward the future MFOZ process. A City Examination necessitates a one-year examination and a five-year assessment. The annual data obtained can clearly reflect the direction of urban development and the magnitude of the adjustment. Based on these findings, a calibration system concerning progress in the implementation of the major function objectives can be constructed to accurately grasp the focus of urban development. A clear comparative assessment of implementation effects and target discrepancies provides an objective basis for further adjustments to MFOZ planning and the detailed planning of territorial space, guiding the future development directions and intensity.
2.3. Constructing a Calibration Method for MFOZ Based on the Six Dimensions of City Examination
Given the above context, the development of a comprehensive urban assessment and major function calibration methodology has become a pressing requirement for territorial spatial planning. In response, this study employs City Examination data to classify cities and extract their characteristics based on the City Examination index system and its six dimensions. These characteristics are then compared with the calibration of the MFOZ planning to identify discrepancies in the direction, pace, and targets of urban development. Accordingly, this study proposes recommendations for MFOZ planning and urban development in this new era—recommendations that align with both the existing planning framework and the current stage of urban growth.
The City Examination assessment of territorial spatial planning provides crucial support for the evaluation of MFOZ. This assessment involves the periodic analysis and evaluation of urban development stage characteristics and the implementation effectiveness of the overall territorial spatial plan. It serves as a vital instrument for promoting high-quality urban development and enhancing the effectiveness of territorial spatial planning implementation. Sustainable development has become a fundamental goal of ecological protection and environmental restoration and one of the core issues facing international projects. Urban sustainability is a multi-dimensional concept that is constantly evolving. Analyzing multiple dimensions and constructing an indicator system is now internationally recognized as the basic method for assessing sustainable development goals, after many years of use and testing [29,30,31,32,33,34,35,36]. China’s City Examination is an evolving policy for assessing sustainable development in cities, and through the development of a complete indicator system and the establishment of dimensions, it basically covers all the aspects of an international test for use in cities [37,38,39,40,41].
The City Examination is guided by the idea of ecological civilization, fully embodying the development concepts of safety, innovation, coordination, greenness, openness, and sharing, and is based on the six dimensions of the first-level category of the City Examination indicator system. According to the current development of Chinese society, it is further divided into 18 secondary categories and 110 tertiary indicators in accordance with the needs of this society. The indicators are categorized into basic indicators (Class A indicators) and recommended indicators (Class B indicators) according to the degree of closeness of their connection with the spatial planning of the country and the level of spatial governance, and localities can set up other spatial and temporal indicators of their own choosing (Class C indicators) according to their actual situation. The six dimensions cover different subsystems of the urban life system, and the subsystems coordinate with each other to ensure the normal operation of the city. The six dimensions of safety, innovation, coordination, greenness, openness, and sharing are used as the goals of sustainable urban development to guide the direction of comprehensive urban development in the future. The City Examination indicator system can be used to initially refine representative indicators consistent with the objectives of territorial spatial planning, clarify the application objectives of the City Examination indicators, and construct a correspondence with the thematic content of territorial spatial planning.
3. Theoretical Framework and Methods
3.1. Theoretical Framework
3.1.1. City Examination in Method Construction
City Examination data can be used to investigate the MFOZ delineations in the spatial master plan of the country. The introduction of the City Examination mechanism adheres to a goal-oriented, problem-oriented, and result-oriented approach. It aims to promptly identify issues and shortcomings in urban spatial governance. By comparing these findings with the overarching and phased objectives outlined in the territorial spatial plan, the mechanism monitors urban development and the implementation of the overall territorial spatial plan, facilitating timely corrections to address emerging problems. Consequently, the City Examination aligns closely with the objectives, indicators, and value orientations of the territorial spatial plan. This alignment allows for the utilization of City Examination to assess the MFOZ delineations within the territorial spatial plan. Within the six dimensions of City Examination, different indicators essentially encompass the status and characteristics of cities from multiple perspectives. Consequently, the data obtained from City Examination can inherently reflect the disparities in the development of different cities when subjected to horizontal comparison. Moreover, when subjected to vertical comparison, the direction and status of the city’s development can be distinctly delineated. Therefore, the classification of cities based on City Examination data, along with the analysis of performance data regarding the six dimensions for the classified cities, facilitates the matching and verification of the types and characteristics of the cities in MFOZ (Figure 1). This process enables the observation of deviations and the rate of a city’s development, providing guidance for the development of these cities.
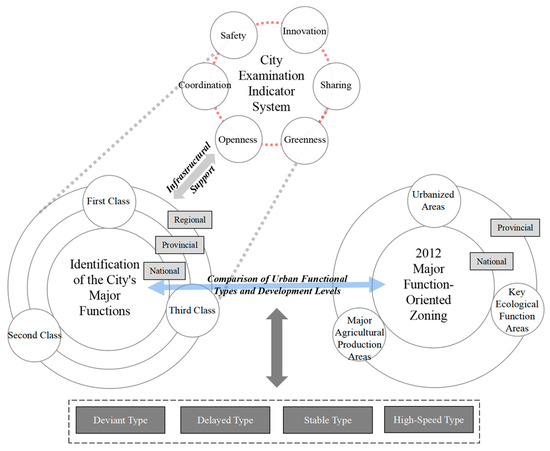
Figure 1.
Theoretical model.
3.1.2. The Process of and Results from Using the Methodology for Integrated Urban Assessment and Major Function Calibration
To this end, this paper constructs a method for comprehensive urban evaluation and MFOZ verification based on City Examination data. This method primarily comprises the following steps (Figure 2): The initial step in this process is to identify and evaluate the key indicators. The collection and integration of the City Examination data of the regional unit is essential for analyzing the data of this larger geographic unit and identifying key indicators that are representative and guide the comprehensive development of corresponding small areas within the geographic unit [33,34,36]. These indicators should have a high fill-in rate, ensuring comprehensive reflection of the current situation of regional development and the potential problems. In this experiment, we selected Hubei Province as a case study and examined and analyzed the urban centers within this province. This methodological approach can be extrapolated to other substantial geographical units and divided regions [42,43,44,45]. In the subsequent step, the urban centers are methodically categorized, and their salient features are systematically extracted. The screened data are then subjected to a hierarchical clustering process to derive the city classification, and the core influence indicators are extracted. Subsequently, an evaluation index system is constructed for each city type. Finally, the city characteristics are extracted according to the evaluation index system. The third step in this process is to determine the city’s development positioning based on its score. The evaluation index system is a methodical framework employed to calculate the city’s score. This score calculated using this system is further substantiated by the actual situation, and the city is then categorized into two to three development levels. The fourth step involves the implementation of coupling and calibration in conjunction with MFOZ planning. A coupling check, a critical component of the assessment, is performed to identify discrepancies between the classification and zoning. This analysis enables an accurate evaluation of the congruence between the main function zoning and the city’s actual development. A taxonomy of urban development is finally forthcoming, comprising four distinct classifications: the deviation type, retardation type, stabilization type, and high-speed type. The deviation type is characterized by a deviation from the original major function, necessitating a temporal adjustment in the direction of development. The retardation type is typified by a development speed that falls below the established development level, thus requiring an acceleration in the development pace. The stabilization type and high-speed type are indicative of consistent and advanced development in urban centers. In the subsequent planning stages, practical policy recommendations for the development of the four types of cities will be formulated.
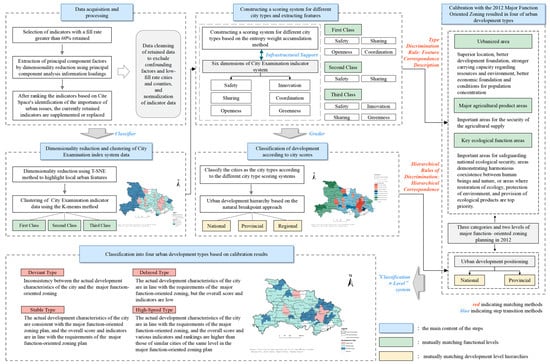
Figure 2.
Technological route.
The four urban classifications derived from the final methodology (deviation type, delayed type, stable type, and high-speed type) each exhibit distinctive characteristics. The following definitions are provided for the four types of urban development: A deviation-type city is defined as a city whose development characteristics are incongruent with the MFOZ. Such incongruence can manifest in a variety of ways, including, but not limited to, a divergence between the focus of development and the strategic plan. For instance, the prioritization of agricultural development may supersede the emphasis on economic development, potentially compromising food security and arable land usage and causing a range of other issues. Additionally, the development of these cities may result in the city’s development characteristics being less pronounced, hindering its ability to establish a distinct identity within the province’s division of labor. The city will not be able to ascertain its own position in the province’s division of labor. A delayed-type city is defined as one whose development characteristics align with the MFOZ, yet its overall score and indicators are low. This suggests that the city’s development speed is suboptimal, and there may be issues with resource distribution within the province or a lack of proactive promotion of key industries. Consequently, the city’s positioning within the province does not align with expectations. A stable-type city means that the actual development characteristics of the city are consistent with the MFOZ, and the comprehensive score and various indicators are in line with the requirements of the MFOZ, indicating that the city is developing in the right direction and at a stable speed. A high-speed-type city means that the actual development characteristics of the city are in line with the requirements of the MFOZ, and the comprehensive score and various indicators and rankings are higher than those of similar cities of the same level in the MFOZ, which indicates that the city is developing in the right direction and at a fast pace, and there may be a breakthrough in the development of industries, so this city type can be focused on and promoted for development.
The comprehensive analysis of City Examination indicators can inform adjustments to future MFOZ delineations. By integrating urban typologies derived from empirical data with urban development types, a more scientific determination of the future urban development trajectories and, consequently, the MFOZ designation can be achieved. Furthermore, the internal development hierarchies within urban typologies can facilitate the establishment of a “classification X level” regional system. This enables a more scientifically sound determination of urban development positioning and the setting of development level objectives.
3.2. Method
3.2.1. Unsupervised Learning T-SNE Nonlinear Dimensionality Reduction
T-SNE is a nonlinear dimensionality reduction algorithm for exploring high-dimensional data. It is designed to capture the local features of the data more effectively and is employed for data dimensionality reduction. In this experiment, it is utilized to reflect the unique characteristics of the cities. The T-SNE algorithm identifies clusters observed in the data by examining the similarity of data points with multiple features, essentially serving as both a dimensionality reduction and visualization technique, primarily used for data exploration and visualizing high-dimensional data. T-SNE does not rely on prior distribution assumptions about the data, and it is capable of dynamically capturing the local structure and evolutionary patterns of variables in a lower-dimensional space [46,47,48]. The basic computational process of T-SNE is as follows:
In the equation, represents the similarity between data points and in the high-dimensional space, where and are the high-dimensional coordinates of the data points, and is the neighborhood width for data point .
In the low-dimensional space, the similarity is modeled using Student’s t-distribution:
In the equation, represents the similarity between data points and in the low-dimensional space, where and are the low-dimensional coordinates corresponding to the original high-dimensional data points and .
By minimizing the Kullback–Leibler (KL) divergence between the similarity distributions in the high-dimensional and low-dimensional spaces, t-SNE can generate a low-dimensional representation:
In the equation, represents the loss function in t-SNE, which is the Kullback–Leibler (KL) divergence.
3.2.2. Unsupervised Learning—K-Means Clustering
K-means clustering, a typical distance-based, iteratively solved cluster analysis algorithm that uses the Euclidean distance as a similarity measure, is used in this experiment for the typology of the cities. It is commonly used in fields such as data mining, image analysis, natural language processing, and bioinformatics. It is well-suited for handling large datasets and has a broad range of applications. The algorithm partitions the data into clusters based on the similarity between the data points. K-means clustering iteratively updates the cluster centers to minimize the distance between the data points within each cluster, thereby revealing the clustering characteristics and underlying structure of the data. It does not rely on prior distribution assumptions about the data, allowing for dynamic analysis of the data’s distribution [42,43,44,45]. The basic process of K-means clustering is as follows: for each data point, , the algorithm finds the closest cluster center, , and assigns the data point to the corresponding cluster.
Update the center of each cluster, .
In the equation, is the set of data points, , in the cluster.
Repeat the above steps until the cluster centers no longer change significantly, ultimately reaching the optimal clustering.
3.2.3. Entropy Weight Accumulation
The entropy weight method is a weight calculation method based on information entropy theory, which determines the relative importance of each indicator by calculating the size of its information entropy; the entropy weight method is employed to categorize the urban development hierarchy of the cities. The smaller the information entropy, the higher the concentration of the indicator data, and the greater the importance of that indicator. The entropy weight method does not rely on prior assumptions and can dynamically determine the weights of various indicators in the evaluation system. It is widely used in multi-attribute decision-making problems. The calculation of the entropy weight first normalizes the original data:
In the equation, represents the normalized value, and is the observed value for sample of indicator .
To calculate the information entropy of each indicator,
In the equation, is the entropy value of the th indicator; represents the number of samples.
When , is defined.
Calculate the entropy weight of each indicator:
In the equation, represents the weight of the th indicator.
4. Study Area and Data
4.1. Study Area
Hubei Province, located in central China, covers a total area of 185,900 square kilometers (Figure 3). As of June 2023, the province governed 12 prefecture-level cities, one autonomous prefecture, 4 provincial directly administered counties, 26 county-level cities, and 35 counties. By the end of 2023, the permanent resident population of Hubei Province was 58.38 million. The topography of Hubei is generally characterized by mountains on the eastern, western, and northern sides, with a low and flat central region that forms an incomplete basin opening slightly to the south. Hubei is situated in the subtropical zone and is part of the Yangtze River basin. The province benefits from favorable natural conditions, with a diverse range of landforms, including mountains, hills, ridges, and plains. It is rich in historical and cultural heritage, with a strong revolutionary background. As the capital city of Hubei, Wuhan has led the economic development of the province, driving growth across other prefecture-level cities. In 2023, Hubei’s GDP reached CNY 5.58036 trillion, with rapid growth in the primary, secondary, and tertiary industries.
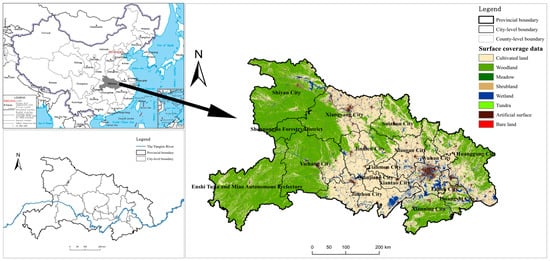
Figure 3.
Study area.
Therefore, there are significant differences in the natural conditions, economic conditions, and historical–cultural factors among the various cities and regions within Hubei Province. These differences require development models more tailored to the growth of the different types of cities. In the 2012 MFOZ, Hubei Province categorized its areas into three types of functional zones in accordance with national policies. However, the practical basis for such classifications remains relatively weak. By 2020, MFOZ planning had reached a critical stage, and there was an urgent need to conduct an evaluation of the outcomes of this plan to provide theoretical insights for the overall territorial spatial planning of each city and county.
4.2. Research Data
4.2.1. Dataset Description
The statistics for Hubei Province are based on City Examination indicator data from a certain year between 2020–2024, total 122 items. Among these, 33 items are classified as A-level indicators, while B-level and C-level indicators account for 192 items. The overall reporting rate for the indicators is 67.46%, with the lowest reporting rate at 10.39% and the highest reporting rate at 93.51%.
4.2.2. Data Acquisition and Processing
A preliminary screening of the indicators was conducted. The A-level data, which are relatively accurate and the collection of which is mandatory, were retained in full. The collection of B-level and C-level data is optional and recommended, with the possibility of data distortion and lower reporting rates. For B-level and C-level indicators, a reporting rate threshold of 60% was applied, resulting in 89 indicators being retained. These retained indicators underwent dimensionality reduction using principal component analysis (PCA) based on their information load, leading to the extraction of 24 principal component factors. Consequently, 24 B-level and C-level indicators were retained. Next, by combining the A-level indicators and conducting an importance ranking of urban issues based on Cite Space, the retained indicators were further supplemented or replaced with those strongly correlated with the goals of territorial spatial planning. In the end, 59 indicators were retained.
The retained indicator data underwent data cleaning. For instances where there were clear unit errors, such as percentage values being reported as decimals less than 1, these values were deleted and cross-checked using the previous year’s data. If the previous year’s data was unavailable, the provincial average was used for imputation. Similarly, for data that was clearly inconsistent with the actual conditions, such as a county reporting a road network density of 201 km per square kilometer in urban areas, the previous year’s data was again used for verification, and if unavailable, the provincial average was applied for imputation. For cases where data was missing, the provincial average was used to fill the gaps. However, if the reporting rate for indicators in a county or district was less than 60%, the sample was excluded to ensure accuracy. After cleaning the data, normalization was performed to eliminate the impact of different units of measurement. The T-SNE method was then applied for dimensionality reduction, which helped highlight local urban features, making clustering operations more precise and improving the accuracy of clustering and scoring.
5. Result and Analysis
5.1. The Results of the Classification of County and District Development Types in Hubei Province
The City Examination data, T-SNE dimensionality reduction, and K-means algorithm were used to identify three types of cities. Since the administrative divisions categorize cities in Hubei Province into urbanized areas, major agricultural production areas, and key ecological function areas, there was no need to further merge the cities based on their characteristics after classification. As shown in the figure below (Figure 4), Zaoyang City, Jianli County, Yangxin County, and Tongshan County were excluded due to a reporting rate of less than 60%.
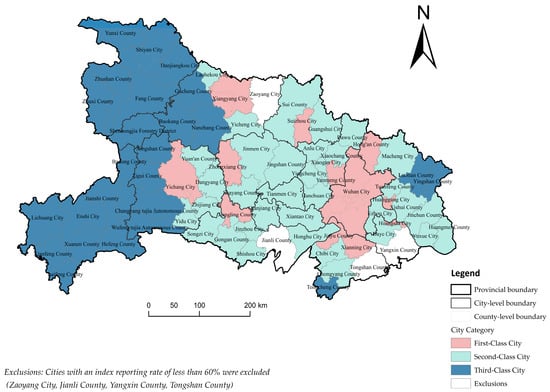
Figure 4.
Classification results for cities.
First-Class Cities: Represented by Wuhan, this type included several rapidly developing cities and counties such as Xiangyang, Yichang, Huanggang, and other urban areas, mainly distributed in the central part of Hubei Province.
Second-Class Cities: Represented by Honghu City, Hanchuan City, and others, this type consisted of cities and counties where agriculture is the main industry, mainly distributed in the central–eastern part of Hubei Province.
Third-Class Cities: Represented by Enshi City, Shennongjia Forestry District, and others, this type included cities and counties with good ecological environments and numerous nature reserves, where ecological protection is a key task, mainly distributed in the western part of Hubei Province.
Among these city types, the Yangtze River spanned more areas including First-Class and Second-Class cities, providing more assistance to these two categories of cities in irrigated agriculture and industrial integration.
Based on the administrative divisions, the following classification of cities based on the MFOZ could be obtained. Hubei Province’s territorial space is divided into urbanized areas, major agricultural production areas, and key ecological function areas (Figure 5), with the classification based on the main type of products provided. Urbanized areas are regions where the main function is to provide industrial goods and service products, though they also provide agricultural and ecological products. Major agricultural production areas are regions where the main function is to provide agricultural products, though they also provide ecological products, service products, and industrial goods. Key ecological function areas are regions where the main function is to provide ecological products, though they also provide a certain number of agricultural products, service products, and industrial goods.
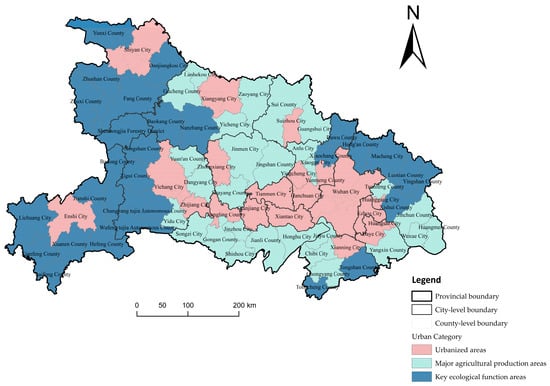
Figure 5.
Main urban types of function zones.
Urbanized areas (Key Development Zones) are regions with favorable location conditions, a strong development foundation, high resource and environmental carrying capacities, and a good economic base and population agglomeration conditions. These areas are relatively contiguous and play a significant role in promoting coordinated regional development across the province. They are important areas that support the sustained economic growth of the province. The main areas include the core region of the Wuhan Metropolitan Area, as well as the Xiangshi-Sui Area, Yijingjing Area, and Enshi City in the Enshi Tujia and Miao Autonomous Prefecture.
Major agricultural production areas are crucial regions for ensuring the security of the agricultural product supply. These areas require coordinated planning and protection. It is necessary to restrict large-scale, high-intensity industrial and urban territorial space development to safeguard the national supply of agricultural products.
The functional positioning of key ecological function areas is to serve as important regions for ensuring national ecological security. These areas are zones demonstrating harmonious coexistence between humans and nature or are focused on ecological restoration, environmental protection, and the provision of ecological products as their primary tasks. They are areas where large-scale, high-intensity industrial and urban development is not suitable.
5.2. Score Ranking from “Six-Dimensional Evaluation” of Hubei Province Counties and Districts
The overall combination of City Examination indicators reflects the direction and type of urban development and can be combined with the MFOZ to guide macro-level regulation of local development. Based on a clustering dendrogram, 23 analysis indicators that significantly influenced the final classification were identified (Table 1). According to national norms and standards, the value orientations of the indicators were determined to be positive, negative, or neutral, thus standardizing the indicators. The indicator types were selected with reference to a series of statutes published by Chinese officials, which includes 14 A-level indicators and 9 B-level indicators.

Table 1.
Standardization of indicators.
Based on the dimensions provided by the City Examination, a six-dimensional evaluation of the cities was conducted, which included four safety-related indicators, six innovation-related indicators, two coordination-related indicators, four greenness-related indicators, one openness-related indicator, and six sharing-related indicators. The distribution of indicators within each dimension was relatively balanced, providing a solid foundation for urban feature analysis. Subsequently, using the entropy weight method, the combination weights for each of the three types of cities were determined [34,36,49]. There were significant differences in the internal information dispersion states among the different types of cities. Based on the coefficient values for each module in the evaluation system for the three types of cities (table in the Appendix A), from horizontal comparisons within the modules and vertical comparisons of the weight share of the same module among different types of cities, it was found that the First-Class cities were dominated by safety and sharing, the Second Class was dominated by safety, and the Third Class was dominated by safety, sharing, and innovation.
In the evaluation for the First-Class cities, safety-related indicators accounted for the highest proportion of indicators, followed by sharing-related indicators. In comparison with the evaluations for the Second-Class and Third-Class cities, the dimensions of coordination, openness, and sharing had a higher proportion, suggesting that First-Class cities were primarily focused on safety, sharing, coordination, and openness. In the evaluation of the Second-Class cities, safety-related indicators accounted for the highest proportion, followed by sharing-related indicators. When compared with the evaluations of the First-Class and Third-Class cities, the safety dimension occupied a larger proportion, indicating that Second-Class cities were primarily focused on safety and sharing. In the evaluation of the Third-Class cities, safety-related indicators occupied the highest proportion, followed by sharing-related indicators. When compared with the evaluations of the First-Class and Second-Class cities, the innovation and green dimensions had higher proportions, suggesting that Third-Class cities were primarily focused on safety, sharing, innovation, and green development.
From the table in the Appendix A and the analysis of the module weighting factors, it can be seen that the safety and sharing dimensions had a high proportion in the evaluations of all the city types. This is because safety indicators represent the most fundamental aspects of a city, reflecting the government’s management and security capabilities and, thus, are the weightiest in all three city types. The second most important dimension, sharing, represents the degree of happiness and quality of life of the people, which is reflected in the indicators for all three types of cities. This also highlights the importance of ensuring people’s safety and well-being via national governance. However, when considering specific proportions and conducting longitudinal comparison with other dimensions, the distinct characteristics and focuses of different counties and cities within each city type become apparent. Looking at the city dimension scores, the rankings of each city in different dimensions also reveal the city’s development priorities and gaps. For example, Wuhan ranks first overall, but its rankings in the innovation and sharing dimensions are relatively low. The analysis of specific dimension indicators shows that Wuhan scores poorly in three indicators: Proportion of stock land supply, Urban road network density, and Community primary school walking coverage within 10 min. Wuhan’s reported data for these indicators are far below the provincial average level and significantly lower than first-tier cities like Beijing, Shanghai, Guangzhou, and Shenzhen. This may be due to an overly broad definition of urban area and rapid urban expansion. The internal scoring table can help each city and county identify their urban characteristics and development priorities, allowing them to quickly pinpoint issues in urban development and planning.
A city’s ranking is determined using the natural breaks method based on the overall city scores (Figure 6). First, the scores are divided into two groups: high-value and low-value. If the first-degree (centrality) exceeds 2, the high-value group is further divided into national-level and regional-level categories, while the low-value group is considered at the regional level. If the first-degree does not exceed 2, there is no national-level center for that type, and the high-value group is classified as regional-level, while the low-value group remains at the regional level. For First-Class and Second-Class cities, the classification is divided into three levels: national-level, provincial-level, and regional-level. For Third Class cities, the classification is divided into two levels: provincial-level and regional-level.
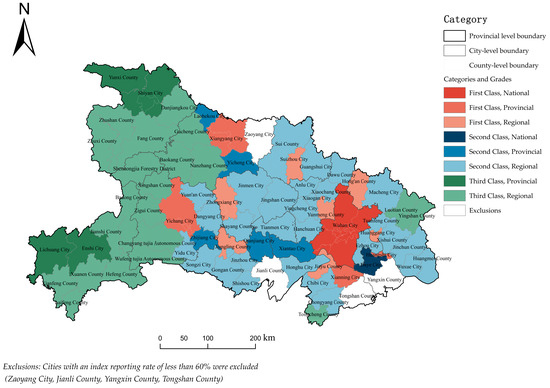
Figure 6.
Urban zoning within the city area.
Among First-Class cities, Wuhan is positioned as a national-level city, while Xiangyang, Yichang, Xianning, and Huangshi are classified as regional-level cities. First-Class cities are primarily fast-developing areas within Hubei Province that have a significant impact on surrounding cities. Among them, Wuhan, as a key provincial city, has notable advantages in terms of economy, culture, technology, and transportation. Wuhan and its surrounding cities, such as Huangshi and Xiangyang, have become important support points for the provincial economic development due to their favorable transportation conditions. These cities, relying on the locational advantages of the Yangtze River Economic Belt, have attracted high-tech industries such as optoelectronics, new materials, and automobile manufacturing, as well as traditional industrial resources, thus promoting the transformation and improvement of the regional economy. They are also leading cities within the province, driving the development of surrounding areas in terms of auxiliary industries, agriculture, and processing industries.
Among Second-Class cities, Daye is positioned as a national-level city, while Laohekou, Yicheng, Zhijiang, Qianjiang, and Xiantao are classified as regional-level cities. These cities play a crucial supporting role in the regional economy of Hubei Province and have a core function in agricultural product production and distribution. These cities possess unique agricultural resource advantages, as they are not only major producers of grains, oilseeds, vegetables, and fruits in Hubei Province but also drive the modernization of agriculture within the region through well-established agricultural processing and distribution systems. Among them, Xiantao is known for its abundant rice, vegetables, and aquatic product production, making it important to Hubei’s agriculture. Qianjiang, on the other hand, has a strong advantage in the context of aquaculture, particularly in freshwater fish farming. Additionally, the development of agricultural processing industries is one of the main development pathways of these cities. Furthermore, many of these cities have developed transportation networks that connect to surrounding agricultural production bases, which play an important role in the transportation and distribution of agricultural products and contribute to the efficient allocation and mobilization of agricultural resources in Hubei Province.
Among Third-Class cities, regional-level cities include Shiyan, Enshi, Lichuan, and Yunxi counties. These cities are located in relatively remote areas, mostly in mountainous or ecologically sensitive regions, and are rich in ecological resources. Enshi and Lichuan are situated in the Wuling Mountains, with good forest coverage and rich biodiversity, making them important water source conservation areas for the South-to-North Water Diversion Project. Shiyan, centered around the Danjiangkou Reservoir, is the core water source protection area for the national South-to-North Water Diversion Central Route Project. It plays a significant ecological role in ensuring water security for the Beijing–Tianjin–Hebei region.
5.3. Analysis of Hubei Province Major Function Interaction Test
The urban development types identified in this paper are largely very similar to the territorial divisions. From the “Six-Dimensional Evaluation Score Ranking,” it can be seen that First Class cities are primarily focused on safety, sharing, coordination, and openness. The coordination indicators are mainly related to population density and housing area, the openness indicators are mainly related to foreign trade, and the sharing indicators are primarily related to infrastructure construction. Since these are mainly associated with urban construction and industrial development, they can be considered equivalent to the urbanized areas in the territorial divisions. Second-Class cities focus on safety and sharing. The safety indicators are mainly related to urban resilience, which is also considered to protect urban security, especially in terms of food security. These cities can be regarded as equivalent to major agricultural production areas. Third-Class cities focus on safety, sharing, innovation, and green development. The innovation indicators are mainly related to urban development models, while the green indicators are primarily related to ecology, indicating that these cities have a different development model compared to other cities and possess rich ecological functions. These cities can be considered equivalent to key ecological function areas in the territorial divisions. The “Six-Dimensional Evaluation” indicator system provides supporting data for the validity and rationality of the major function zone classification. The urban development types identified in this paper were found to have a similarity of 77.9% in regional function division after corresponding with the functional zones in the 2012 MFOZ. This indicates that the provincial-level major function-oriented zoning has fully considered the actual development status of cities when defining urban development goals and leading functions. It also indirectly demonstrates the effectiveness and rationality of the City Examination data analysis.
Based on this, in order to identify urban development issues, cities are classified into four types based on the effectiveness of planning implementation: “Deviant-type,” “Delayed-type,” “Stable-type,” and “High-Speed-type” cities (Figure 7).
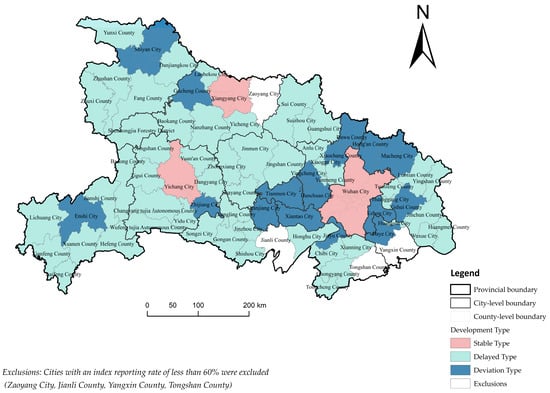
Figure 7.
Classification of urban development types.
The distribution of deviated-type cities is primarily concentrated in counties surrounding Wuhan that have not yet met the criteria for designation as national-level development zones. These cities include Zijiang City, Qianjiang City, Tianmen City, Xiantao City, Hanchuan City, Yingcheng City, and Jingzhou City. The following regions are of particular interest: Daye City, Shiyan City, Enshi City’s urbanized areas, Jiayu County and Gucheng County in the main agricultural products production areas, and Xiaochang County, Dawu County, Macheng City, Xishui County, and Hong’an County in the key ecological functional zones. The distribution area indicates that the majority of cities surrounding Wuhan are unaware of their own positioning and lack the strategic integration of their geographic locations’ advantages to capitalize on Wuhan’s spillover industries. In the subsequent development stage, it is imperative to consider access to these spillover industries and to effectively facilitate upstream and downstream collaborative development, as well as the planning of transportation routes.
With the exception of Wuhan, Yichang, Xiangyang, Lichuan, and Utopia County, whose zoning design corresponds to their actual development level, the positioning of the remaining cities in the zoning is higher than their actual development level. These cities are designated as “delayed-type cities” and are widely distributed in Hubei Province. At the national level, the resultant positioning aligns with the zoning, and the regional level corresponds to the provincial level. In the event that the positioning in the zoning is higher than the positioning in the experimental results, the city will be determined as a retarded city. While there are more underdeveloped cities, this phenomenon can be partially explained by three factors. First, the implementation of MFOZ as a planning deployment necessitates a prolonged time frame. In consideration of the city’s future development over an extended period, its development positioning within the MFOZ framework can be elevated beyond the status quo. As a developmental objective for the region, it also articulates particular anticipations for the prospective evolution of the city. Second, zoning, given its convenience and generalizability, tends to create geographic clusters of similar attributes, leading to localized errors. Third, current zoning planning is limited to national and provincial levels, whereas the present study proposes an additional level, aligning more closely with the actual situation.
Stable-type and high-speed-type cities include Wuhan, Yichang, Xiangyang, Lichuan, and Utopia County, which must maintain their development focus and speed. These cities must demand higher standards and goals for themselves in subsequent planning.
6. Discussion and Conclusions
6.1. Discussion
Using China’s existing City Examination index system for sustainable development, this study evaluates the implementation effectiveness of the MFOZ policy and the degree of policy deviation in Hubei Province using the index values. It identifies deviations in urban functions during the course of urban development, as well as disparities in development speed. This research addresses a gap in international studies by employing a data-driven approach to identifying urban functions and assessing policy implementation. It innovatively utilizes a relatively mature indicator system to classify urban function types and characterize cities, thereby enabling the derivation of policy effects across different urban contexts. Given that the policies examined operate across multiple spatial scales—national, provincial, and regional—the proposed methodology is broadly applicable to different geographic scales and national contexts. As the concept of sustainable development has been globally established and most countries have their own indicator systems, this method offers a universally adaptable tool for identifying urban development functions and evaluating policy effectiveness, ultimately supporting objective policy adjustment.
The methodology can be universally applied to the coupled calibration of MFOZ in Chinese provinces and cities, as evidenced by Hubei Province, and can be used to identify urban planning problems in other provinces and cities worldwide when considered from a macroscopic point of view. The research data and policy background utilized in this methodology are examined within the context of China’s national circumstances. In the context of China, this framework facilitates a precise evaluation of the implementation outcomes of MFOZ and the identification of prevailing urban development challenges through the systematic processing of urban diagnostic data. Presently, all countries have initiatives to protect and restrict the development of ecologically sensitive areas, although the policy background is not entirely consistent. Extending the technical path of the method, it can be used flexibly for the comparison of various policies’ effects and the identification of deviations in urban development through the establishment of a system of evaluation indexes characteristic of each country or province and city. Moreover, the methodology is highly scalable, capable of being downscaled to municipal-district or district-subdistrict levels to refine the identification of development issues and enhance spatial governance or upscaled to the national–provincial level to provide empirical support for strategic planning. Countries and regions worldwide can adopt appropriate indicators in alignment with their unique contextual characteristics, thereby constructing tailored frameworks for planning objectives and development trajectories and enabling the explicit identification of planning deficiencies.
These findings offer robust scientific support for further optimization of Hubei Province’s functional zoning system and provide concrete guidance for local jurisdictions in enhancing their territorial spatial planning processes. The key policy recommendations are as follows. First, at the provincial level, while the existing functional zoning framework is broadly reasonable at the macro level, its practical application reveals that the predominant determinant remains the type of primary products supplied by each region. Although existing criteria encompass factors such as resource and environmental carrying capacity, development intensity, growth potential, economic foundation, population agglomeration, and agricultural suitability, these standards remain overly generalized, insufficiently specific, and lack strong data support, necessitating further refinement of evaluation criteria. Second, the establishment of differentiated City Examination systems tailored to various city types is recommended. Given the disparities in economic development levels, resource endowments, and social structures across regions within Hubei Province, alongside the availability of City Examination data, provincial authorities should develop more nuanced classification frameworks aligned with the unique development characteristics of each city. Particular attention should be given to recognizing the internal dynamics and heterogeneity of urban development within regions, thereby avoiding a one-size-fits-all approach to urban planning. This will enable more precise guidance for cities in achieving their functional objectives. Moreover, in response to the identified limitation of insufficient classification granularity, it is advised to further refine the hierarchy of urban development positioning in the MFOZ beyond the existing national and provincial levels to better reflect regional variations. A multi-tiered planning model will more effectively guide local urban development trajectories and strengthen the effectiveness of spatial governance, ensuring that cities maximize their development potential within their designated functional roles. Finally, at the local level, cities should integrate insights from the latest City Examination reports to thoroughly analyze their strengths and weaknesses, verify their functional positioning, and refine their development goals accordingly. By accurately identifying indicators misaligned with functional zoning objectives, local governments can formulate and adjust targeted development strategies, thereby avoiding inefficient resource allocation and strategic misdirection. The practice of continuously refining local development goals will ensure alignment with provincial functional zoning plans. Such a place-based approach to planning will not only enhance urban development efficiency but also promote balanced regional development across Hubei Province, providing a solid foundation for sustainable growth.
6.2. Conclusions
Against the backdrop of China’s territorial spatial planning agenda, there is an urgent need to assess the effectiveness of the implementation of the MFOZ plan. To better understand the current state of MFOZ implementation and to develop a unified framework for evaluating the achievement of major functional objectives, this study proposes an applicability analysis framework that integrates urban data with functional zoning analysis. The framework is applied using the City Examination data from Hubei Province as a practical case study. The empirical results confirm the validity and robustness of the proposed approach for conducting comprehensive urban assessments and calibrating major functional roles based on City Examination indicators. The key research findings are summarized as follows:
- (1)
- The classification results of Hubei Province using the City Examination data of an early year of the 2020s are highly consistent with the province’s 2012 MFOZ plan. The similarity between the city types based on the City Examination data and provincial MFOZ reaches 77.9%. This indicates that the provincial-level MFOZ fully considers the actual development status of cities when defining urban development goals and leading functions, and it also indirectly demonstrates the effectiveness and rationality of this study.
- (2)
- The urban positioning in Hubei Province’s MFOZ is generally overestimated, with a higher number of “Slow Cities.” The MFOZ is divided into only two levels, “national-provincial,” while this study divides it into three levels, namely “regional-regional-national.” This has led to an overestimation of positioning in many cases. However, overall, the positioning of core cities is accurate, including Wuhan, Xiangyang, Yichang, and others. To create more precise territorial spatial planning for different cities, MFOZ positioning should be further refined to align with the development levels of various cities.
- (3)
- A four-tiered classification system is proposed for urban management, with adjustments to policies based on the specific characteristics of each city and its geographical location. Deviant Cities are mainly located around Wuhan. They should actively undertake Wuhan’s spillover industries and seek upstream and downstream collaboration. Additionally, they should explore mechanisms for joint construction and shared use of regional facilities, improving the quality of infrastructure development. Special Cities like Enshi and Shiyan should focus on developing regional economies and play a leading role in driving the collaborative development of surrounding cities. They should enhance urbanization and industrial diversification. Slow Cities should strengthen the development of their major functions. Urbanized areas should focus on economic development, major agricultural production areas should concentrate on agricultural and agro-industrial development, and key ecological function areas should work on improving environmental quality. They should also actively apply for status as national parks and protected areas and other relevant projects. Stable and High-Speed Cities should maintain their current development status, aiming for even higher standards and goals in their future planning. They should apply for national projects such as civilized cities, ecological cities, and other related initiatives.
The primary function calibration method developed in this study introduces an assessment framework that leverages City Examination data to establish a coherent data linkage between the evaluation of planning outcomes and the designation of major functional zones. The approach analyzes the current planning status under existing policy frameworks, extracts key urban development features, and proactively aligns them with implemented spatial planning policies. It further enables empirical intervention based on observed data to evaluate policy effectiveness and identify potential planning deviations. The process of city classification, characteristic extraction, and evaluation system design culminates in the construction of a regional framework referred to as the “Classification × Level” system. This framework clearly delineates the developmental characteristics and strategic priorities of different city types within the region, providing critical guidance for municipalities in determining their functional positioning. Applying the proposed methodology, the study investigates diverse patterns of urban development and offers planning recommendations across multiple spatial scales. This approach contributes significantly to the refinement and governance of China’s territorial spatial planning system. Furthermore, the insights generated serve as a valuable reference for spatial planning practices in other national contexts. The study also extends the applicability of City Examination indicators and provides a theoretical foundation for further exploration of their conceptual framework. The formulation of urban assessment indicators at the national, provincial, and regional levels can be benchmarked against national standards, peer cities, exemplary models, and historical benchmarks, supporting implementation evaluation, phased planning, and performance-based assessment.
However, the method is still difficult to ultimately implement; the identification of problems is still reflected in the data of certain indicators, and in the implementation of the improvement of each city, it is still necessary to explore what kind of initiatives can more accurately adjust and optimize development pathways without causing other major problems and changes. The implementation of planning policies is holistic; the implementation of a policy may lead to other aspects of the problem. The method can only identify the problem, and in the context of policy governance, must still adapt to the local circumstances of each province and city and gradually explore the appropriate method of improvement. Secondly, due to the uncertainty of indicator data reporting and the unique characteristics of different cities, such as the reporting rate of indicators in each province, the different standardization of some indicators, and the significant differences in data reporting provincial positioning, the method, when used, requires provinces to standardize their indicator systems to more accurately reveal the problems of provincial and municipal development.
Author Contributions
Conceptualization, L.W. and Q.N.; software, D.W. and Y.W.; validation, D.W., L.W. and Y.Z.; formal analysis, D.W.; investigation, Y.Z.; resources, Q.N.; writing—original draft preparation, D.W.; writing—review and editing, D.W.; visualization, Y.W.; supervision, L.W.; project administration, L.W.; funding acquisition, Q.N. All authors have read and agreed to the published version of the manuscript.
Funding
This research was funded by the Hubei Provincial Science and Technology Project on Natural Resources, grant number: ZRZY2025KJ04.
Data Availability Statement
The datasets presented in this article are not readily available because they contain confidential government information. Requests for data access may be directed to the corresponding authors and will be considered on a case-by-case basis in accordance with institutional and regulatory guidelines.
Conflicts of Interest
The authors declare no conflict of interest.
Correction Statement
This article has been republished with a minor correction to the Data Availability Statement. This change does not affect the scientific content of the article.
Appendix A
Table A1.
The evaluation system for the First-Class cities.
Table A1.
The evaluation system for the First-Class cities.
| Number | Indicator Category | Indicator Item | Module Weight Coefficient | Weight Coefficient Value |
|---|---|---|---|---|
| 1 | Safety | Per Capita Area of Emergency Shelter Facilities (sqm) | 0.30877 | 0.03552 |
| 2 | Fire and Rescue 5 min Coverage Rate (%) | 0.00969 | ||
| 3 | Number of Super High-rise Buildings (Urban Resilience) | 0.23390 | ||
| 4 | Proportion of Groundwater Supply to Total Water Supply (%) | 0.02965 | ||
| 5 | Innovation | Idle Land Disposal Rate (%) | 0.161441723 | 0.02791 |
| 6 | Proportion of Stock Land Supply (%) | 0.02884 | ||
| 7 | Proportion of Land Transfer Revenue in Government Budget Revenue (%) | 0.01639 | ||
| 8 | Urban Road Network Density (km/km2) | 0.03243 | ||
| 9 | Proportion of County-level Units Implementing the ‘Unified Platform’ (%) | 0.04083 | ||
| 10 | Proportion of Residential Land in Urban-Rural Construction Land (%) | 0.01504 | ||
| 11 | Coordination | Urban Resident Population Density (10,000 persons/km2) | 0.05698625 | 0.02538 |
| 12 | Per Capita Urban Residential Land Area (sqm) | 0.03160 | ||
| 13 | Green | Land Consumption per 10,000 RMB GDP (sqm) | 0.091734305 | 0.01166 |
| 14 | Industrial Land GDP per Square Kilometer (billion RMB/km2) | 0.05323 | ||
| 15 | Urban Domestic Waste Recycling Rate (%) | 0.01669 | ||
| 16 | Rural Domestic Waste Treatment Rate (%) | 0.01016 | ||
| 17 | Openness | Total Import and Export Trade Volume (billion RMB) | 0.124291086 | 0.12429 |
| 18 | Sharing | Coverage Rate of 15 min Community Life Circle (%) | 0.256778904 | 0.03236 |
| 19 | Number of Hospital Beds per 1000 Residents | 0.11859 | ||
| 20 | Per Capita Urban Residential Floor Area (sqm) | 0.03798 | ||
| 21 | Per Capita Urban Park Green Space Area (sqm) | 0.02489 | ||
| 22 | Coverage Rate of 10 min Walking Distance to Community Primary Schools (%) | 0.02300 | ||
| 23 | Coverage Rate of 15 min Walking Distance to Community Sports Facilities (%) | 0.01995 |
Table A2.
The evaluation system for the Second-Class cities.
Table A2.
The evaluation system for the Second-Class cities.
| Number | Indicator Category | Indicator Item | Module Weight Coefficient | Weight Coefficient Value |
|---|---|---|---|---|
| 1 | Safety | Per Capita Area of Emergency Shelter Facilities (sqm) | 0.55260 | 0.08186 |
| 2 | Fire and Rescue 5 min Coverage Rate (%) | 0.01086 | ||
| 3 | Number of Super High-rise Buildings (Urban Resilience) | 0.37034 | ||
| 4 | Proportion of Groundwater Supply to Total Water Supply (%) | 0.08954 | ||
| 5 | Innovation | Idle Land Disposal Rate (%) | 0.107988273 | 0.01222 |
| 6 | Proportion of Stock Land Supply (%) | 0.03312 | ||
| 7 | Proportion of Land Transfer Revenue in Government Budget Revenue (%) | 0.01187 | ||
| 8 | Urban Road Network Density (km/km2) | 0.01806 | ||
| 9 | Proportion of County-level Units Implementing the ‘Unified Platform’ (%) | 0.02072 | ||
| 10 | Proportion of Residential Land in Urban-Rural Construction Land (%) | 0.01199 | ||
| 11 | Coordination | Urban Resident Population Density (10,000 persons/km2) | 0.033348418 | 0.01887 |
| 12 | Per Capita Urban Residential Land Area (sqm) | 0.01448 | ||
| 13 | Green | Land Consumption per 10,000 RMB GDP (sqm) | 0.077332542 | 0.01675 |
| 14 | Industrial Land GDP per Square Kilometer (billion RMB/km2) | 0.01286 | ||
| 15 | Urban Domestic Waste Recycling Rate (%) | 0.04468 | ||
| 16 | Rural Domestic Waste Treatment Rate (%) | 0.00304 | ||
| 17 | Openness | Total Import and Export Trade Volume (billion RMB) | 0.052409349 | 0.05241 |
| 18 | Sharing | Coverage Rate of 15 min Community Life Circle (%) | 0.176321892 | 0.03088 |
| 19 | Number of Hospital Beds per 1000 Residents | 0.07394 | ||
| 20 | Per Capita Urban Residential Floor Area (sqm) | 0.02127 | ||
| 21 | Per Capita Urban Park Green Space Area (sqm) | 0.02216 | ||
| 22 | Coverage Rate of 10 min Walking Distance to Community Primary Schools (%) | 0.01306 | ||
| 23 | Coverage Rate of 15 min Walking Distance to Community Sports Facilities (%) | 0.01500 |
Table A3.
The evaluation system for the Third-Class cities.
Table A3.
The evaluation system for the Third-Class cities.
| Number | Indicator Category | Indicator Item | Module Weight Coefficient | Weight Coefficient Value |
|---|---|---|---|---|
| 1 | Safety | Per Capita Area of Emergency Shelter Facilities (sqm) | 0.38473 | 0.06027 |
| 2 | Fire and Rescue 5 min Coverage Rate (%) | 0.02003 | ||
| 3 | Number of Super High-rise Buildings (Urban Resilience) | 0.21413 | ||
| 4 | Proportion of Groundwater Supply to Total Water Supply (%) | 0.09031 | ||
| 5 | Innovation | Idle Land Disposal Rate (%) | 0.172830368 | 0.02527 |
| 6 | Proportion of Stock Land Supply (%) | 0.02914 | ||
| 7 | Proportion of Land Transfer Revenue in Government Budget Revenue (%) | 0.01179 | ||
| 8 | Urban Road Network Density (km/km2) | 0.02260 | ||
| 9 | Proportion of County-level Units Implementing the ‘Unified Platform’ (%) | 0.03264 | ||
| 10 | Proportion of Residential Land in Urban-Rural Construction Land (%) | 0.05140 | ||
| 11 | Coordination | Urban Resident Population Density (10,000 persons/km2) | 0.039507478 | 0.01961 |
| 12 | Per Capita Urban Residential Land Area (sqm) | 0.01989 | ||
| 13 | Green | Land Consumption per 10,000 RMB GDP (sqm) | 0.099974678 | 0.01462 |
| 14 | Industrial Land GDP per Square Kilometer (billion RMB/km2) | 0.03972 | ||
| 15 | Urban Domestic Waste Recycling Rate (%) | 0.03410 | ||
| 16 | Rural Domestic Waste Treatment Rate (%) | 0.01153 | ||
| 17 | Openness | Total Import and Export Trade Volume (billion RMB) | 0.101836349 | 0.10184 |
| 18 | Sharing | Coverage Rate of 15 min Community Life Circle (%) | 0.201119985 | |
| 19 | Number of Hospital Beds per 1000 Residents | 0.05109 | ||
| 20 | Per Capita Urban Residential Floor Area (sqm) | 0.02328 | ||
| 21 | Per Capita Urban Park Green Space Area (sqm) | 0.07165 | ||
| 22 | Coverage Rate of 10 min Walking Distance to Community Primary Schools (%) | 0.01730 | ||
| 23 | Coverage Rate of 15 min Walking Distance to Community Sports Facilities (%) | 0.01526 |
References
- Duranton, G.; Puga, D. From sectoral to functional urban specialisation. J. Urban Econ. 2005, 57, 343–370. [Google Scholar] [CrossRef]
- Guo, S.; Ma, H. Can the Spatial Function Division of Urbanization Promote Regional Coordinated Development? Evidence from the Yangtze River Economic Belt in China. Sustainability 2022, 14, 7115. [Google Scholar] [CrossRef]
- Kramer, D.B.; Hartter, J.; Boag, A.E.; Jain, M.; Stevens, K.; Nicholas, K.A.; McConnell, W.J.; Liu, A.J. Top 40 questions in coupled human and natural systems (CHANS) research. Ecol. Soc. 2017, 22, 44. [Google Scholar] [CrossRef]
- Conway, T.M.; Lathrop, R.G. Modeling the ecological consequences of land-use policies in an urbanizing region. Environ. Manag. 2005, 35, 278–291. [Google Scholar] [CrossRef] [PubMed]
- Liu, H.; Fan, J.; Li, Y. “America 2050” strategic spatial planning and its inspiration to China. Geogr. Res. 2013, 32, 90–98. [Google Scholar]
- Santoro, A.; Piras, F.; Fiore, B.; Bazzurro, A.; Agnoletti, M. Forest-cover changes in European Natura 2000 sites in the Period 2012–2018. Forests 2024, 15, 232. [Google Scholar] [CrossRef]
- Mücher, C.A.; Hennekens, S.M.; Bunce, R.G.; Schaminée, J.H.; Schaepman, M.E. Modelling the spatial distribution of Natura 2000 habitats across Europe. Landsc. Urban Plan. 2009, 92, 148–159. [Google Scholar] [CrossRef]
- Carlson, T.; Barns, C.; Brownlie, D.; Cordell, K.; Dawson, C.; Koch, W.; Oye, G.; Ryan, C. An Overview of America’s National Wilderness Preservation System. J. For. 2016, 114, 289–291. [Google Scholar] [CrossRef]
- Landres, P.; Barns, C.; Dennis, J.G.; Devine, T.; Geissler, P.; McCasland, C.S.; Merigliano, L.; Seastrand, J.; Swain, R. Keeping it wild: An interagency strategy to monitor trends in wilderness character across the National Wilderness Preservation System. Gen. Tech. Rep. RMRS-GTR-212. Fort Collins CO US Dep. Agric. For. Serv. Rocky Mt. Res. Stn. 2008, 77, 212. [Google Scholar]
- BBSR. Available online: https://www.bbsr.bund.de/BBSR/EN/publications/CompletedSeries/Berichte/2000_2009/BrochureSpatialDevelopment.html (accessed on 30 May 2025).
- Zhang, Q.; Wang, L.; Wang, H.; Chen, Y.; Tian, C.; Shao, Y.; Liu, T. An Improved Framework of Major Function-Oriented Zoning Based on Carrying Capacity: A Case Study of the Yangtze River Delta Region. Land 2024, 13, 1732. [Google Scholar] [CrossRef]
- Qu, Y.; Zhang, Y.; Wang, S.; Shang, R.; Zong, H.; Zhan, L. Coordinated development of land multi-function space: An analytical framework for matching the supply of resources and environment with the use of land space for ecological protection, agricultural production and urban construction. J. Geogr. Sci. 2023, 33, 311–339. [Google Scholar] [CrossRef]
- Zhang, Y.; Yu, P.; Tian, Y.; Chen, H.; Chen, Y. Exploring the impact of integrated spatial function zones on land use dynamics and ecosystem services tradeoffs based on a future land use simulation (FLUS) model. Ecol. Indic. 2023, 150, 110246. [Google Scholar] [CrossRef]
- Fan, J.; Sun, W.; Zhou, K.; Chen, D. Major Function Oriented Zone: New Method of Spatial Regulation for Reshaping Regional Development Pattern in China. Chin. Geogra. Sci. 2012, 22, 196–209. [Google Scholar] [CrossRef]
- Chen, D.; Liu, B.; Fan, J.; Zhou, D.; Guo, R.; Wang, Z.; Wu, J. Implementation evaluation and outlook of Major Function Oriented Zone. Bull. Chin. Acad. Sci. (Chin. Version) 2024, 39, 620–628. [Google Scholar]
- Xu, Q.; Gao, L. The Causes Analysis of Public Policy Implementation Deviation: Based on a Framework of Paul A. Sabatier and Daniel A. Mazmanian. In Proceedings of the ICEISS 2017, Jinan, China, 29–30 November 2017; Atlantis Press: Dordrecht, The Netherlands, 2017. [Google Scholar]
- Fan, J.; Li, P. The scientific foundation of major function oriented zoning in China. J. Geogr. Sci. 2009, 19, 515–531. [Google Scholar] [CrossRef]
- Mehraj, M.; Trippathi, L. Deviations in Master Plan of Nokha Town: Geospatial Science and Technology based Analysis. Ann. Natl. Assoc. Geogr. 2022, 42, 136–148. [Google Scholar] [CrossRef]
- Hao, P.; Sliuzas, R.; Zhan, Q.; Geertman, S. Land use deviations from the plan: A GIS based analysis of urban development in Shenzhen. In Proceedings of the The 11th International Conference on Computers in Urban Planning and Urban Management, Hong Kong, China, 16–18 June 2009. [Google Scholar]
- Jia, M.; Liu, G. Research on the Implementation Deviation of New Rural Construction Policies and Its Countermeasures in the Context of Rural Revitalization. In Proceedings of the ICDSM 2021, Hong Kong, China, 8–10 January 2021; Wang, T., Patnaik, S., Ip, A.W., Tavana, M., Eds.; Springer: Singapore, 2021. [Google Scholar]
- Zhang, X.; Chen, D.; Lu, X.; Tang, Y.; Jiang, B. Interaction between land financing strategy and the implementation deviation of local governments’ cultivated land protection policy in China. Land 2021, 10, 803. [Google Scholar] [CrossRef]
- Xin, Z.; Shuwen, N.; Yonghua, L.; Jianlan, L.; Yixin, L. Major function oriented zoning at provincial level based on spatial analysis: A case study of Gansu Province, China. In Proceedings of the 4th International Conference on Recent Advances in Space Technologies, Istanbul, Turkey, 11–13 June 2009; IEEE: New York, NY, USA, 2009. [Google Scholar]
- Zhao, Y.; Leng, H.; Sun, P.; Yuan, Q. A spatial zoning model of municipal administrative areas based on major function-oriented zones. Sustainability 2018, 10, 2976. [Google Scholar] [CrossRef]
- Chen, S.Z.; Zhou, Z.F.; Wang, P.; Sun, X.T. A New Methodology to Quantitatively Define Major Function Oriented Zones of County: The Case of Libo County. In Proceedings of the ECCSD 2016, Beijing, China, 28–29 May 2016. [Google Scholar]
- Zhang, S.; Shi, P.; Yang, X. The comprehensive summarization and analysis on the relationship of major function oriented zoning and regional administration. In Proceedings of the 2011 2nd International Conference on Artificial Intelligence, Management Science and Electronic Commerce (AIMSEC), Dengfeng, China, 8–10 August 2011; IEEE: New York, NY, USA, 2011. [Google Scholar]
- Fu, H.; Liu, J.; Dong, X.; Chen, Z.; He, M. Evaluating the sustainable development goals within spatial planning for decision-making: A major function-oriented zone planning strategy in China. Land 2024, 13, 390. [Google Scholar] [CrossRef]
- Xu, X.; Na, R.; Shen, Z.; Deng, X. Impact of major function-oriented zone planning on spatial and temporal evolution of “three zone space” in China. Sustainability 2023, 15, 8312. [Google Scholar] [CrossRef]
- Bao, S.; Lu, L.; Zhi, J.; Li, J. An optimization strategy for provincial “production–living–ecological” spaces under the guidance of major function-oriented zoning in China. Sustainability 2024, 16, 2248. [Google Scholar] [CrossRef]
- Crosas, C.; Gómez-Escoda, E.; Villavieja, E. Interplay between Land Use Planning and Functional Mix Dimensions: An Assemblage Approach for Metropolitan Barcelona. Sustainability 2024, 16, 7734. [Google Scholar] [CrossRef]
- Brodny, J.; Tutak, M.; Bindzár, P. Measuring and assessing the level of living conditions and quality of life in smart sustainable cities in poland—Framework for evaluation based on MCDM methods. Smart Cities 2024, 7, 1221–1260. [Google Scholar] [CrossRef]
- Bhagat, A.; Kumar, A. An Evaluation Framework for Sustainable Urban Streets (SUS) in India: The Case Study of Bengaluru City. Eng. Technol. Appl. Sci. Res. 2025, 15, 25014–25020. [Google Scholar] [CrossRef]
- Oliveira, V.; Pinho, P. Evaluation in urban planning: Advances and prospects. J. Plan. Lit. 2010, 24, 343–361. [Google Scholar] [CrossRef]
- Garau, C.; Pavan, V.M. Evaluating urban quality: Indicators and assessment tools for smart sustainable cities. Sustainability 2018, 10, 575. [Google Scholar] [CrossRef]
- Zhalehdoost, A.; Taleai, M. Enhancing urban quality of life evaluation using spatial multi criteria analysis. Sci. Rep. 2025, 15, 22048. [Google Scholar] [CrossRef]
- Sipahi, M.; Sipahi, S.; Kırmızıbiber, İ. The Evaluation of Historical Urban Areas by Urban Users in the Context of a Sustainable Envi-Ronment: The Case of Erzurum. Turk. Online J. Des. Art Commun. 2025, 15, 691–701. [Google Scholar] [CrossRef]
- Prakash, M.; Shukla, R.; Chakraborty, A.; Joshi, P.K. Multi-criteria approach to geographically visualize the quality of life in India. Int. J. Sustain. Dev. World Ecol. 2016, 23, 469–481. [Google Scholar] [CrossRef]
- Allen, C.; Nejdawi, R.; El-Baba, J.; Hamati, K.; Metternicht, G.; Wiedmann, T. Indicator-based assessments of progress towards the sustainable development goals (SDGs): A case study from the Arab region. Sustain. Sci. 2017, 12, 975–989. [Google Scholar] [CrossRef]
- Moussiopoulos, N.; Achillas, C.; Vlachokostas, C.; Spyridi, D.; Nikolaou, K. Environmental, social and economic information management for the evaluation of sustainability in urban areas: A system of indicators for Thessaloniki, Greece. Cities 2010, 27, 377–384. [Google Scholar] [CrossRef]
- Wang, S.; Chen, J.; Hou, D.; Zhou, X.; Cui, B.; Zhang, X.; Wang, Y.; Li, D.; Cui, J.; Luo, S.; et al. Development and application of knowledge graph-based spatiotemporal data model for urban physical examination. Int. J. Digit. Earth 2025, 18, 2512060. [Google Scholar] [CrossRef]
- Yan, H.; Liu, Z. A new perspective on the evaluation of urbanization sustainability: Urban health examination. Sustainability 2023, 15, 9338. [Google Scholar] [CrossRef]
- Zhang, X.; Wu, Y.; Shen, L. An evaluation framework for the sustainability of urban land use: A study of capital cities and municipalities in China. Habitat Int. 2011, 35, 141–149. [Google Scholar] [CrossRef]
- Moradpour, N.; Pourahmad, A.; Ziari, K.; Hataminejad, H.; Sharifi, A. Downscaling urban resilience assessment: A spatiotemporal analysis of urban blocks using the fuzzy Delphi method and K-means clustering. Build. Environ. 2024, 263, 111898. [Google Scholar] [CrossRef]
- Ji, D.; Tian, J.; Zhang, J.; Zeng, J.; Namaiti, A. Identification and Spatiotemporal Evolution Analysis of the Urban–Rural Fringe in Polycentric Cities Based on K-Means Clustering and Multi-Source Data: A Case Study of Chengdu City. Land 2024, 13, 1727. [Google Scholar] [CrossRef]
- Kim, Y.; Kim, Y. Global regionalization of heat environment quality perception based on K-means clustering and Google trends data. Sustain. Cities Soc. 2023, 96, 104710. [Google Scholar] [CrossRef]
- Raya-Tapia, A.Y.; Ramírez-Márquez, C.; Ponce-Ortega, J.M. Clustering of zones according to the level of gentrification by using an unsupervised learning algorithm. Cities 2024, 151, 105133. [Google Scholar] [CrossRef]
- Khan, W.; Walker, S.; Zeiler, W. A bottom-up framework for analysing city-scale energy data using high dimension reduction techniques. Sustain. Cities Soc. 2023, 89, 104323. [Google Scholar] [CrossRef]
- Lopes, M.A.D.S.; Neto, A.D.D.; Martins, A.D.M. Parallel t-sne applied to data visualization in smart cities. IEEE Access 2020, 8, 11482–11490. [Google Scholar] [CrossRef]
- Cai, T.T.; Ma, R. Theoretical foundations of t-sne for visualizing high-dimensional clustered data. J. Mach. Learn. Res. 2022, 23, 1–54. [Google Scholar]
- Abd El Karim, A.; Awawdeh, M.M. Integrating GIS accessibility and location-allocation models with multicriteria decision analysis for evaluating quality of life in Buraidah city, KSA. Sustainability 2020, 12, 1412. [Google Scholar] [CrossRef]
Disclaimer/Publisher’s Note: The statements, opinions and data contained in all publications are solely those of the individual author(s) and contributor(s) and not of MDPI and/or the editor(s). MDPI and/or the editor(s) disclaim responsibility for any injury to people or property resulting from any ideas, methods, instructions or products referred to in the content. |
© 2025 by the authors. Licensee MDPI, Basel, Switzerland. This article is an open access article distributed under the terms and conditions of the Creative Commons Attribution (CC BY) license (https://creativecommons.org/licenses/by/4.0/).