1. Introduction
Coastal cities worldwide face mounting risks from sea level rise (SLR), intensified storm events, and their cascading effects on rapidly urbanized places. These challenges are particularly acute in low-lying urban regions, where exposure to flooding and shoreline erosion threatens both human and ecological systems. IPCC projections indicate that by the end of the century, millions of people will be displaced by coastal hazards unless major adaptation measures are implemented [
1,
2]. This is causing a growing urgency to design adaptive, multifunctional coastal landscapes that can respond to both chronic and acute climate threats while providing greener, safer, and healthier places.
Nature-based solutions (NbSs) have gained prominence as strategic alternatives or as a complement to grey infrastructure in addressing coastal risks. These green interventions—ranging from land restoration and planting strategies to levee systems and urban greenways—offer integrated benefits including storm surge attenuation, habitat enhancement, and public space creation [
3,
4,
5]. Landscape architecture, with its capacity to synthesize spatial, ecological, and social systems, is uniquely positioned to lead coastal NbS design strategies [
6,
7]. However, a critical gap persists in the systematic understanding of how these projects are designed, justified, and evaluated in practice. While there is an abundance of individual case studies and modeling experiments, there is a limited cross-case synthesis of implemented interventions linking spatial design typologies to project framing narratives and reported performance outcomes [
8]. The absence of standardized reporting on monitoring practices, institutional barriers, and SLR integration further impedes the development of transferable design knowledge and policy guidance.
This study addresses these knowledge gaps through the following three specific research questions: (1) What design typologies characterize implemented coastal landscape interventions? (2) How do framing strategies influence intervention selection and evaluation? (3) To what extent do projects integrate sea level rise projections into design specifications? We attempt to address these questions through a systematic analysis of 123 implemented SLR design interventions. In the process, we hope to help bridge the science–practice gap that has limited the effective translation of climate knowledge into actionable design strategies [
9,
10].
This analysis employs an integrated theoretical framework with the following three pathways: (1) Ecological Function—restoration interventions align with ecological framings and field monitoring due to ecosystem service delivery; (2) Risk Mitigation—hybrid systems align with flood risk framings and modeling due to infrastructure performance requirements; and (3) Adaptive Capacity—community engagement enhances integration across performance dimensions through social–ecological governance.
Our analysis is presented in four main sections. In
Section 2, we review the literature on coastal risk, nature-based solutions, and the persistent challenges in translating scientific projections into implemented design interventions. In
Section 3, we detail our systematic methodology for identifying, screening, and coding coastal landscape interventions, including our framework for classifying design typologies, framing strategies, and performance reporting practices. In
Section 4, we present our findings on intervention patterns, including the distribution of design typologies, the role of project framing in shaping implementation and monitoring practices across different intervention types, and the integration of sea level rise considerations into design specifications. Our results can help provide landscape architects, land planners, and land-based policymakers with evidence-based guidance for selecting, adapting, and advocating for effective landscape-based, green coastal resilience strategies.
3. Materials and Methods
In this study, we employ a systematic meta-synthesis approach to analyze the implemented coastal landscape interventions that are documented in the peer-reviewed literature. The methodology was designed to address our three research questions through systematic literature identification, comprehensive data extraction, and a structured analytical framework. Our approach combines automated search strategies with manual coding to ensure both comprehensiveness and analytical rigor, while developing reproducible classification systems that could accommodate the diversity of the intervention types, framing approaches, and implementation contexts found in the literature.
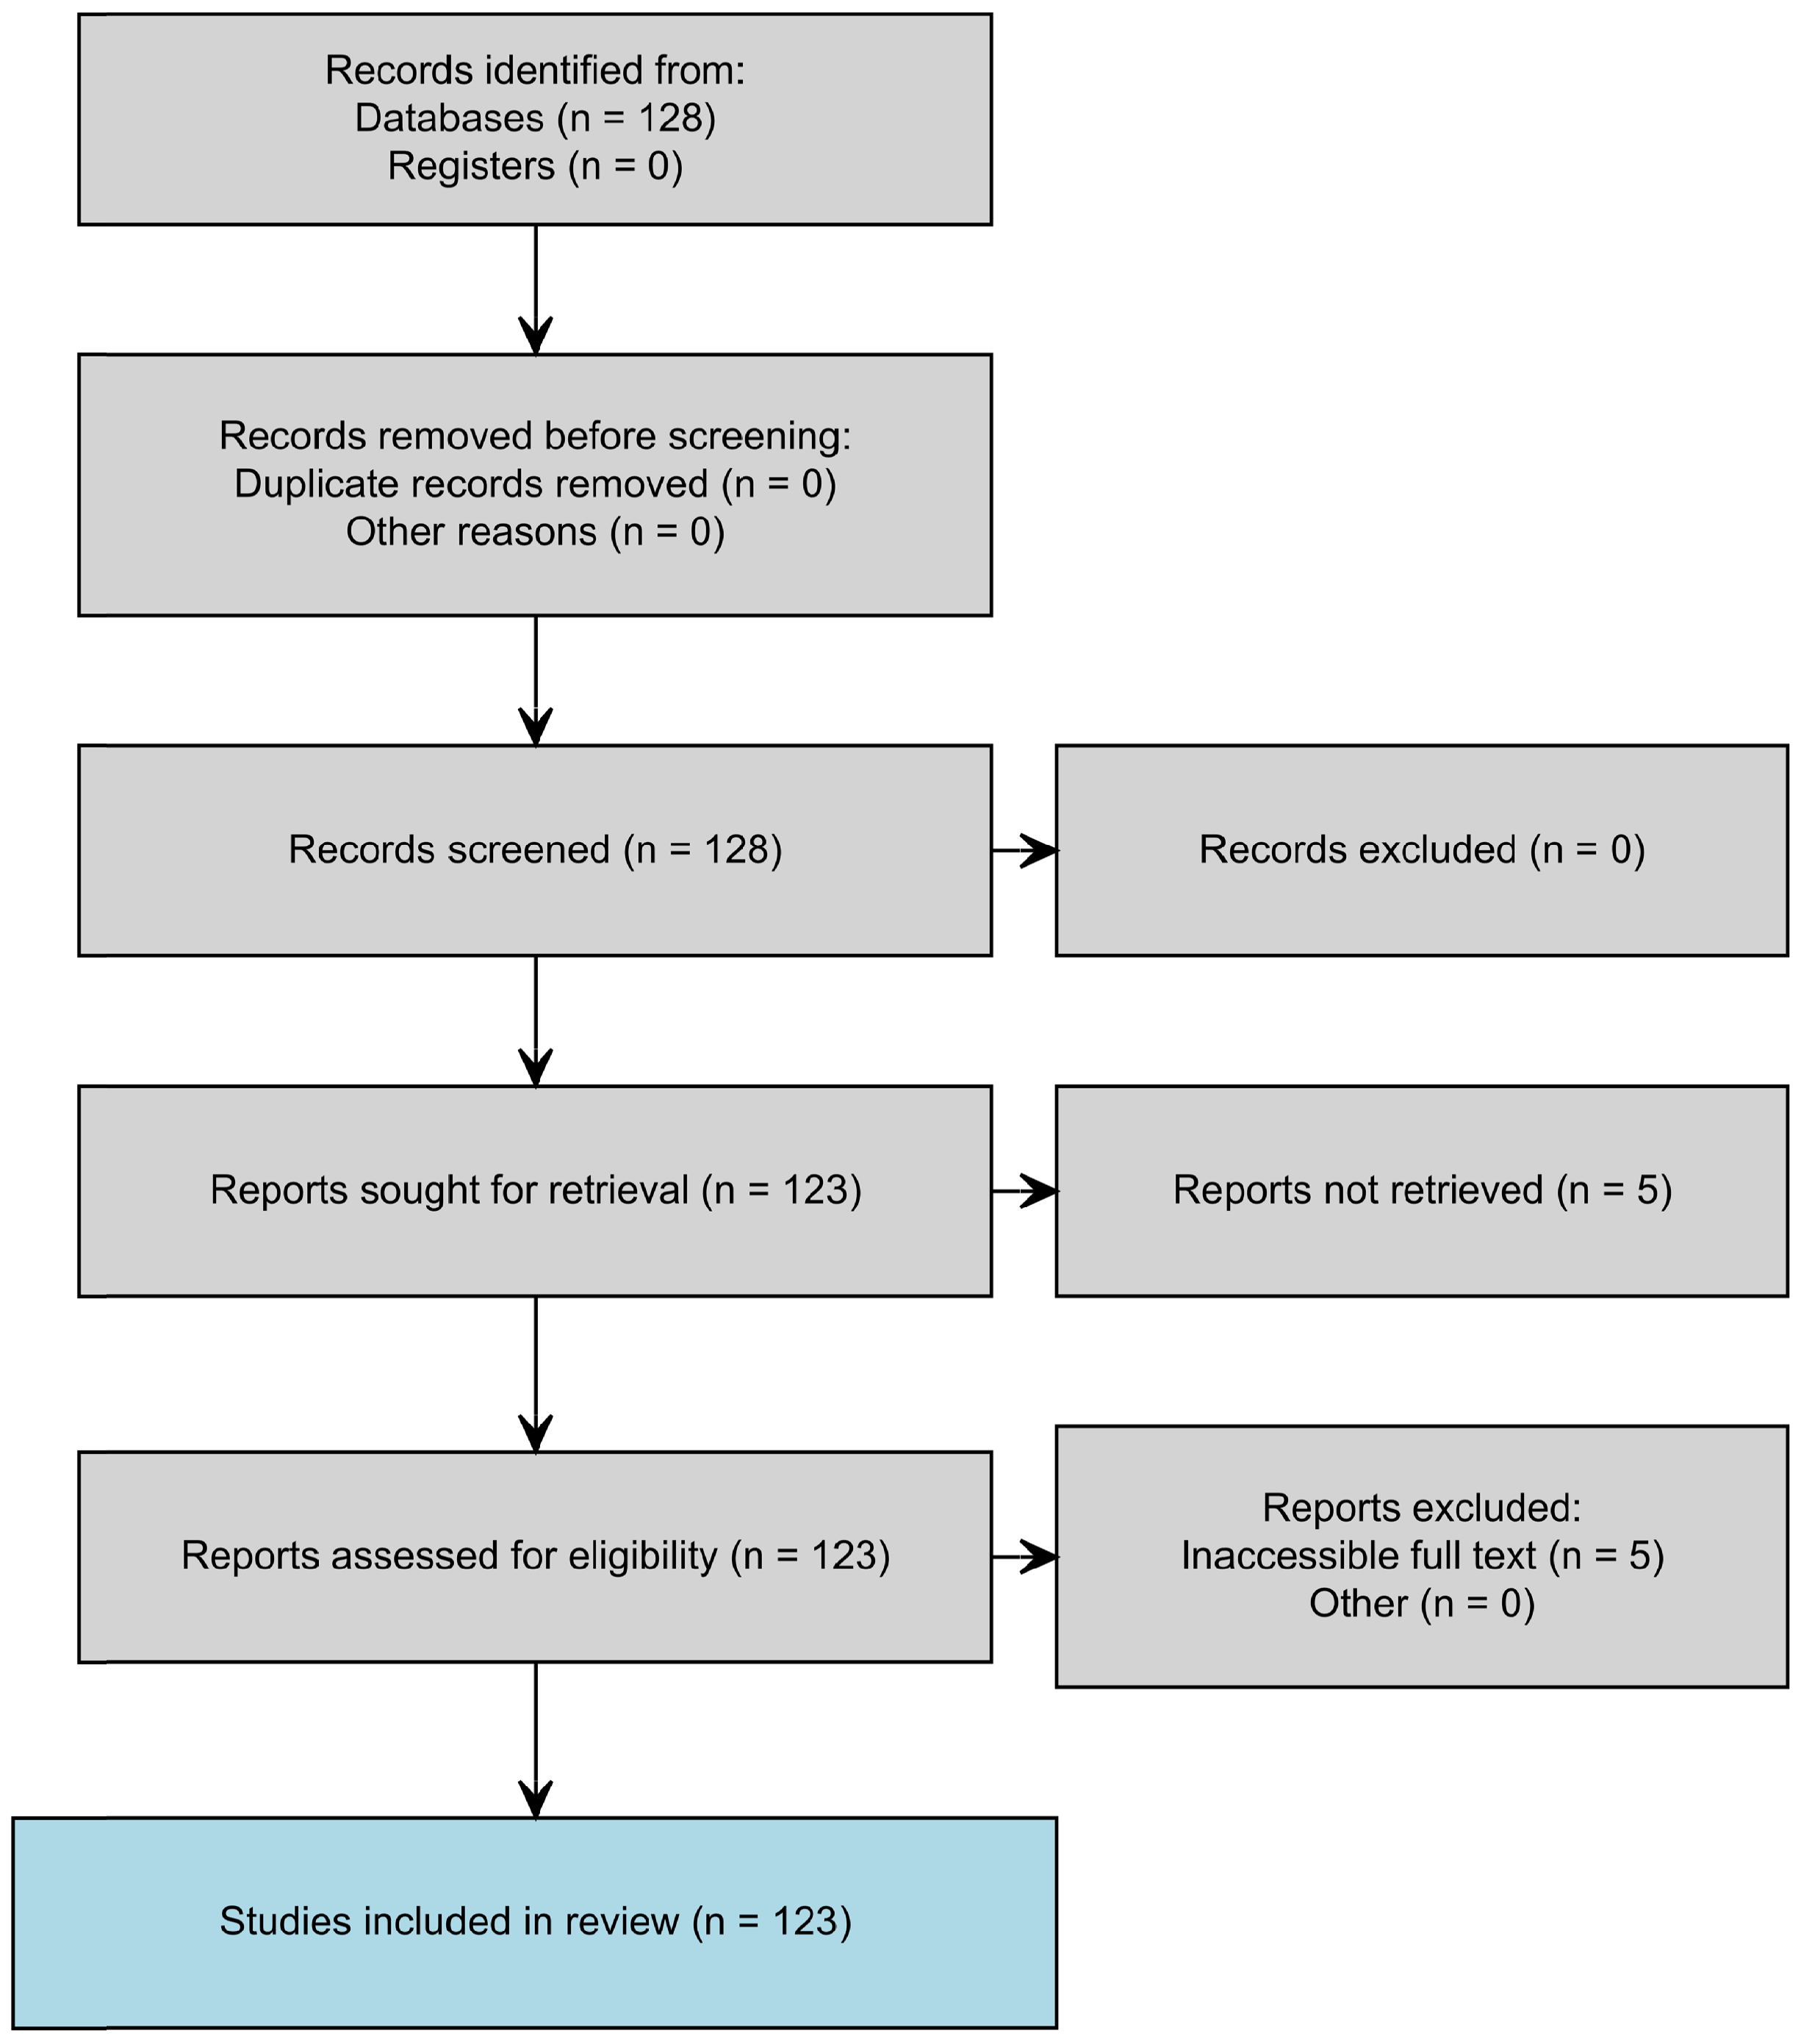
This systematic review follows the PRISMA 2020 guidelines for reporting systematic reviews. The systematic literature search and screening process followed PRISMA 2020 guidelines (
Figure 1).
3.1. Literature Identification and Screening
To identify relevant studies of implemented coastal landscape interventions, we performed a systematic search using the Scopus data API with the following query: TITLE-ABS-KEY(“sea level rise”) AND TITLE-ABS-KEY(“landscape intervention” OR “nature-based solution”) AND PUBYEAR > 2009 AND PUBYEAR < 2025 AND SRCTYPE(j). This search strategy was designed to capture the intersection of climate drivers (sea level rise) with landscape-scale responses (nature-based solutions and landscape interventions), focusing on peer-reviewed implementation studies rather than theoretical or modeling-only papers. A Boolean search string query was executed programmatically in R using the httr and jsonlite libraries. To ensure reliable record retrieval, articles were obtained individually using a count of 1 to avoid API response errors, with delays added between calls to comply with usage limits. Metadata fields, including article title, authors, publication year, abstract, journal name, and DOI were extracted and saved to a structured CSV file. The search was limited to journal articles (SRCTYPE(j)) to ensure peer-reviewed quality. The initial search yielded 128 records, which were then screened for full-text accessibility and inclusion criteria.
While government reports, NGO publications, and policy documents may contain valuable implementation insights, this systematic review focused on peer-reviewed sources to ensure consistent quality standards and methodological rigor.
3.2. Inclusion and Exclusion Criteria
Studies were included if they met the following criteria:
Implementation focus: Described an implemented coastal landscape intervention rather than theoretical proposals, conceptual designs, or simulation studies.
Coastal adaptation relevance: Focused on interventions related to sea level rise, storm surges, or broader coastal adaptation challenges.
Sufficient detail: Provided adequate information to extract at least one key variable, including intervention type, design rationale, reported performance, monitoring practices, or implementation context.
Publication timeline: Published between 2010 and 2024 in peer-reviewed journals.
Geographic scope: Located in coastal environments with explicit adaptation components.
The screening process systematically excluded duplicate entries, purely conceptual papers, modeling studies without implementation components, and interventions addressing inland or riverine systems without the relevance of coastal adaptation. Abstracts and full texts were systematically reviewed to ensure the consistent application of inclusion criteria, with borderline cases being re-evaluated to verify classification decisions.
Survivorship Bias Acknowledgment: The inclusion criteria for “implemented coastal landscape interventions” creates systematic survivorship bias by excluding terminated or failed projects that may not reach publication. This bias likely results in an overestimation of the intervention success rates and an underestimation of implementation barriers relative to the full spectrum of attempted coastal adaptation projects. While the systematic inclusion of failed cases faces methodological constraints, including limited documentation and institutional access barriers, our findings should be interpreted as representing coastal adaptation practice under favorable implementation conditions.
Terminological Consistency: To ensure analytical precision, this study employs standardized definitions. Nature-based solutions (NbSs) refers to the overarching approach utilizing natural processes for coastal adaptation challenges; green infrastructure emphasizes the functional infrastructure role of these interventions within broader coastal protection systems; marsh/wetland restoration encompasses brackish and saltwater marsh systems in temperate and subtropical regions. Meanwhile, mangrove restoration refers specifically to tropical and subtropical coastal forest restoration, reflecting distinct ecological characteristics, restoration techniques, and geographic distributions that warrant separate analytical treatment.
3.3. Data Extraction and Coding Framework
Following inclusion screening, full-text PDFs were manually reviewed and coded using a structured Excel database. The data extraction and classification process was supported by R programming (R 4.3.1) to ensure consistency, reproducibility, and efficient summary analysis. Each article was coded across several analytical dimensions designed to address our three research questions.
Design Typology Classification: To address Research Question 1 (What design typologies characterize implemented coastal landscape interventions?), intervention types were grouped into seven primary categories based on spatial form, ecological function, and infrastructural role, using pattern-based logic in R. The categories are as follows:
Marsh/Wetland Restoration;
Mangrove Restoration;
Beach/Dune Nourishment;
Hybrid/Engineered Systems (e.g., living shorelines, reefs, levees);
Urban Green/Resilience Strategies;
Governance/Synthesis (e.g., planning frameworks, comparative reviews);
Unspecified/Mixed (where typology was ambiguous or not reported).
Classification was automated using conditional logic (via case_when()), improving consistency while allowing for manual override where ambiguity was noted.
Framing Strategy Analysis: To address Research Question 2 (How do framing strategies influence intervention selection and evaluation?), we applied keyword-based pattern matching (via stringr::str_detect) to classify how each project justified its intervention. Six dominant framing categories were developed, as follows:
Climate Adaptation (e.g., “SLR”, “adaptive design”, “future scenarios”);
Climate Resilience (e.g., “resilient”, “multi-benefit”, “systems approach”);
Ecological Restoration (e.g., “wetland”, “habitat”, “carbon sequestration”);
Flood Risk Reduction (e.g., “storm surge”, “flood protection”);
Innovation/Demonstration (e.g., “pilot project”, “test bed”);
Other/Mixed Goals (e.g., “urban regeneration”, “equity”, “placemaking”).
Performance Monitoring and SLR Integration Assessment: To address Research Question 3 (To what extent do projects integrate sea level rise projections into design specifications?), we classified each study’s approach as follows.
Monitoring practices were categorized as follows:
- −
Modeling-based: Hydrodynamic simulations, flood projections.
- −
Ecological Field Methods: Biodiversity surveys, vegetation transects.
- −
Community/Perception-based: Stakeholder interviews, participatory evaluation.
- −
Integrated Mixed-methods: Combining multiple approaches.
- −
Ambiguously Reported: General terms without specific methods.
Sea Level Rise Integration was classified into three treatment types based on project rationale and design specification analysis, as follows:
- −
Explicit Design Integration: Direct incorporation of SLR projections into design processes.
- −
Contextual Justification: SLR cited as motivation without design influence.
- −
Background Framing: SLR mentioned only in general statements.
Implementation barriers were coded through a thematic analysis of author-reported challenges, resulting in ten categories including technical constraints, institutional barriers, data limitations, financial limitations, regulatory complexity, environmental degradation, disciplinary fragmentation, social barriers, and conceptual ambiguity.
Geographic distribution was analyzed by coding study locations into regional categories (North America, Europe, Asia—Developing, Global/Other) to examine patterns in intervention types, monitoring practices, and evidence quality across different contexts.
Coding Procedures and Reliability Assessment: To address concerns about subjective bias in single-coder extraction, coding reliability was assessed through the temporal re-coding of 12 studies (9.8%); this was conducted 12 weeks after initial coding using standardized decision trees. This temporal approach eliminates memory bias while testing the stability and consistency of classification criteria over time. Systematic decision trees were developed for all four primary variables, employing sequential keyword-based logic to minimize subjective interpretation. For intervention typology, decisions followed ecological function hierarchy (wetland → mangrove → beach → hybrid → urban → governance). Project framing prioritized explicit rationale statements using innovation → flood risk → resilience → climate adaptation → ecological restoration sequences. Monitoring approaches distinguished integration keywords from single-method descriptions, while SLR integration required both climate scenario references and quantitative design parameters for explicit classification.
Cohen’s Kappa analysis demonstrated an acceptable-to-substantial agreement across all variables (mean ), as follows: intervention typology (), project framing (), monitoring approaches (), and SLR integration (). Detailed coding decision trees with sequential logic and keyword specifications are available upon request to ensure methodological transparency and enable replication. The particularly high reliability for SLR integration () reflects the effectiveness of strict operational criteria requiring both scenario anchors and parametric specifications. While independent multi-coder reliability represents optimal practice, this temporal reliability approach with systematic decision trees demonstrates the consistent application of coding criteria while acknowledging resource constraints faced by systematic review research.
SLR Integration Operational Classification: SLR integration assessment employed the following explicit operational definitions. Explicit design integration required both (a) climate scenario references (specific SLR projections, RCP/SSP pathways, or temporal benchmarks) AND (b) quantitative design parameters (elevation thresholds ≥0.5 m, adaptive triggers with defined time horizons, or scenario-informed spatial configurations). Contextual justification included SLR as a project motivation without technical design influence. Background framing comprised general SLR mentions without meaningful project connection. All classifications were assigned confidence scores (0–1.0) based on evidence clarity, with inter-category boundaries verified through a systematic re-review of borderline cases.
3.4. Data Analysis and Visualization
All categorical variables were summarized using
dplyr::count() and were visualized using
ggplot2::geom_bar() or
geom_tile() for typology–framing cross-tabulations. Categorical codes were applied consistently using an iterative process, where initial codes were refined and consolidated into higher-level typologies. The following table summarizes the key variables systematically collected (
Table 1).
3.5. Monitoring Quality Assessment Framework
To address the substantial proportion of studies with ambiguous monitoring descriptions (30.1%, ) and to systematically evaluate monitoring rigor, we developed a 0–5 monitoring quality scoring framework built upon our foundational categorical classification, as follows:
Score 0: no or ambiguous monitoring;
Score 1: single method with basic implementation;
Score 2: single method with detailed protocols;
Score 3: multiple methods integration;
Score 4: integrated mixed-methods with systematic triangulation;
Score 5: comprehensive adaptive monitoring with feedback mechanisms.
Quality scores were assigned through a systematic text analysis of monitoring descriptions, with the algorithm first identifying ambiguous cases using our established “Ambiguously Reported” category (30.1%, ), then applying pattern recognition to assess methodological detail and integration complexity within modeling-based, field monitoring, and community-based approaches. The framework achieved exact correspondence with foundational categories and enabled the statistical analysis of correlations between monitoring quality and sustainability indicators (quantitative outcomes, long-term planning, and explicit SLR integration) using Pearson’s correlations and independent samples t-tests (), providing a quantitative assessment of methodological rigor while maintaining compatibility with established monitoring classifications.
3.6. Statistical Analysis Framework
We employed non-parametric statistical methods to examine associations between intervention characteristics, framing strategies, and community monitoring practices. Given categorical variables and small cell counts, we selected chi-square and exact tests appropriate for sparse data structures.
Statistical Analysis Procedures: Categorical associations between intervention typologies and framing strategies were assessed using Pearson’s chi-square tests, with assumptions being verified by ensuring ≤20% of cells had expected frequencies < 5. Effect size was measured using Cramér’s V, with standardized residuals being analyzed to identify cells contributing significantly to associations (). For community monitoring relationships, Fisher’s exact tests were employed where chi-square assumptions were violated due to small expected frequencies. All statistical analyses were conducted in R 4.3.1, with significance set at , acknowledging that multiple comparisons may inflate Type I error rates. Non-significant associations were retained in analysis to document the absence of systematic patterns rather than the selective reporting of significant results.
Scale Proxy Development: To address limited spatial extent reporting (only 2.4% of studies provided quantitative spatial data), we developed composite scale proxy variables using available project characteristics. The scale proxy integrated the following four dimensions: (1) intervention type scores based on typical project scales (1–4 scale), (2) duration-based complexity indicators, (3) regional development context, and (4) project complexity measures including monitoring integration and SLR incorporation. This composite approach (mean = 2.02, SD = 0.30) enabled scale-stratified analysis despite the systematic under-reporting of spatial extent data.
Scale Analysis Limitations: Project scale analysis was constrained by systematic under-reporting, whereby only three studies (2.4%) provided quantitative spatial extent data that were sufficient for scale-stratified analysis. While this documentation gap prevents the systematic examination of scale-dependent monitoring patterns that may disadvantage small-scale projects, the gap itself represents an important methodological finding about reporting standards in coastal adaptation research that constrains evidence-based practice development.
4. Results
A total of 123 studies were included in the final analysis, spanning diverse geographic contexts, intervention types, and disciplinary perspectives. The reviewed studies ranged from singular case studies to comprehensive syntheses of multiple implemented interventions. Publication dates were concentrated between 2015 and 2024, with 89% of studies being published during this period, reflecting accelerating attention to nature-based and landscape-scale coastal adaptation strategies (
Table 2).
4.1. Design Typologies of Coastal Landscape Interventions
Seven primary intervention categories were identified through a systematic classification of the 123 studies (
Figure 2). Marsh/Wetland Restoration (
n = 46; 37.4%) was the most frequent intervention type, employing tidal reconnection and sediment placement techniques including breach-and-fill and thin-layer deposition methods. Hybrid/Engineered Systems (
n = 20; 16.3%) included reef structures, living shorelines, and vegetated revetments that combine engineered protection with ecological enhancement. Unspecified/Mixed typologies (
n = 18; 14.6%) captured studies lacking specific intervention detail or focusing on global syntheses, with 44% being explicitly labeled as meta-analyses or scenario-modeling studies. Urban Green/Resilience interventions (
n = 11; 8.9%) addressed compound risks in densely populated areas, combining stormwater management, urban greening, and public co-benefits. Mangrove Restoration (
n = 10; 8.1%) and Beach/Dune Nourishment (
n = 10; 8.1%) represented location-specific ecological strategies. Governance/Synthesis projects (
n = 8; 6.5%) emphasized institutional arrangements, policy innovation, or comparative frameworks without site-specific interventions.
Project Scale Documentation Gap: Systematic analysis revealed critical documentation gaps—only three studies (2.4%) reported quantitative spatial extent data, with variation ranging from pilot projects (9.4 ha) to landscape-scale interventions (4964 ha). This near-complete absence of scale reporting (97.6% of studies) constrains the scale-stratified analysis of monitoring effectiveness and may mask monitoring disadvantages that disproportionately affect small-scale projects with limited resources and institutional capacity.
Scale–Monitoring Relationships: Analysis using composite scale proxies (mean = 2.02, SD = 0.30, range: 1.17–2.67) across scale categories of Smaller (41 projects; 33.3%), Medium (50 projects; 40.7%), and Larger (32 projects; 26.0%) revealed that monitoring quality showed no significant relationship with project scale. Community monitoring showed no scale dependence (, CI: −0.195 to 0.159, ), with negligible effect size (Cohen’s ). However, long-term focus correlated significantly with project scope (, CI: 0.093 to 0.423, ).
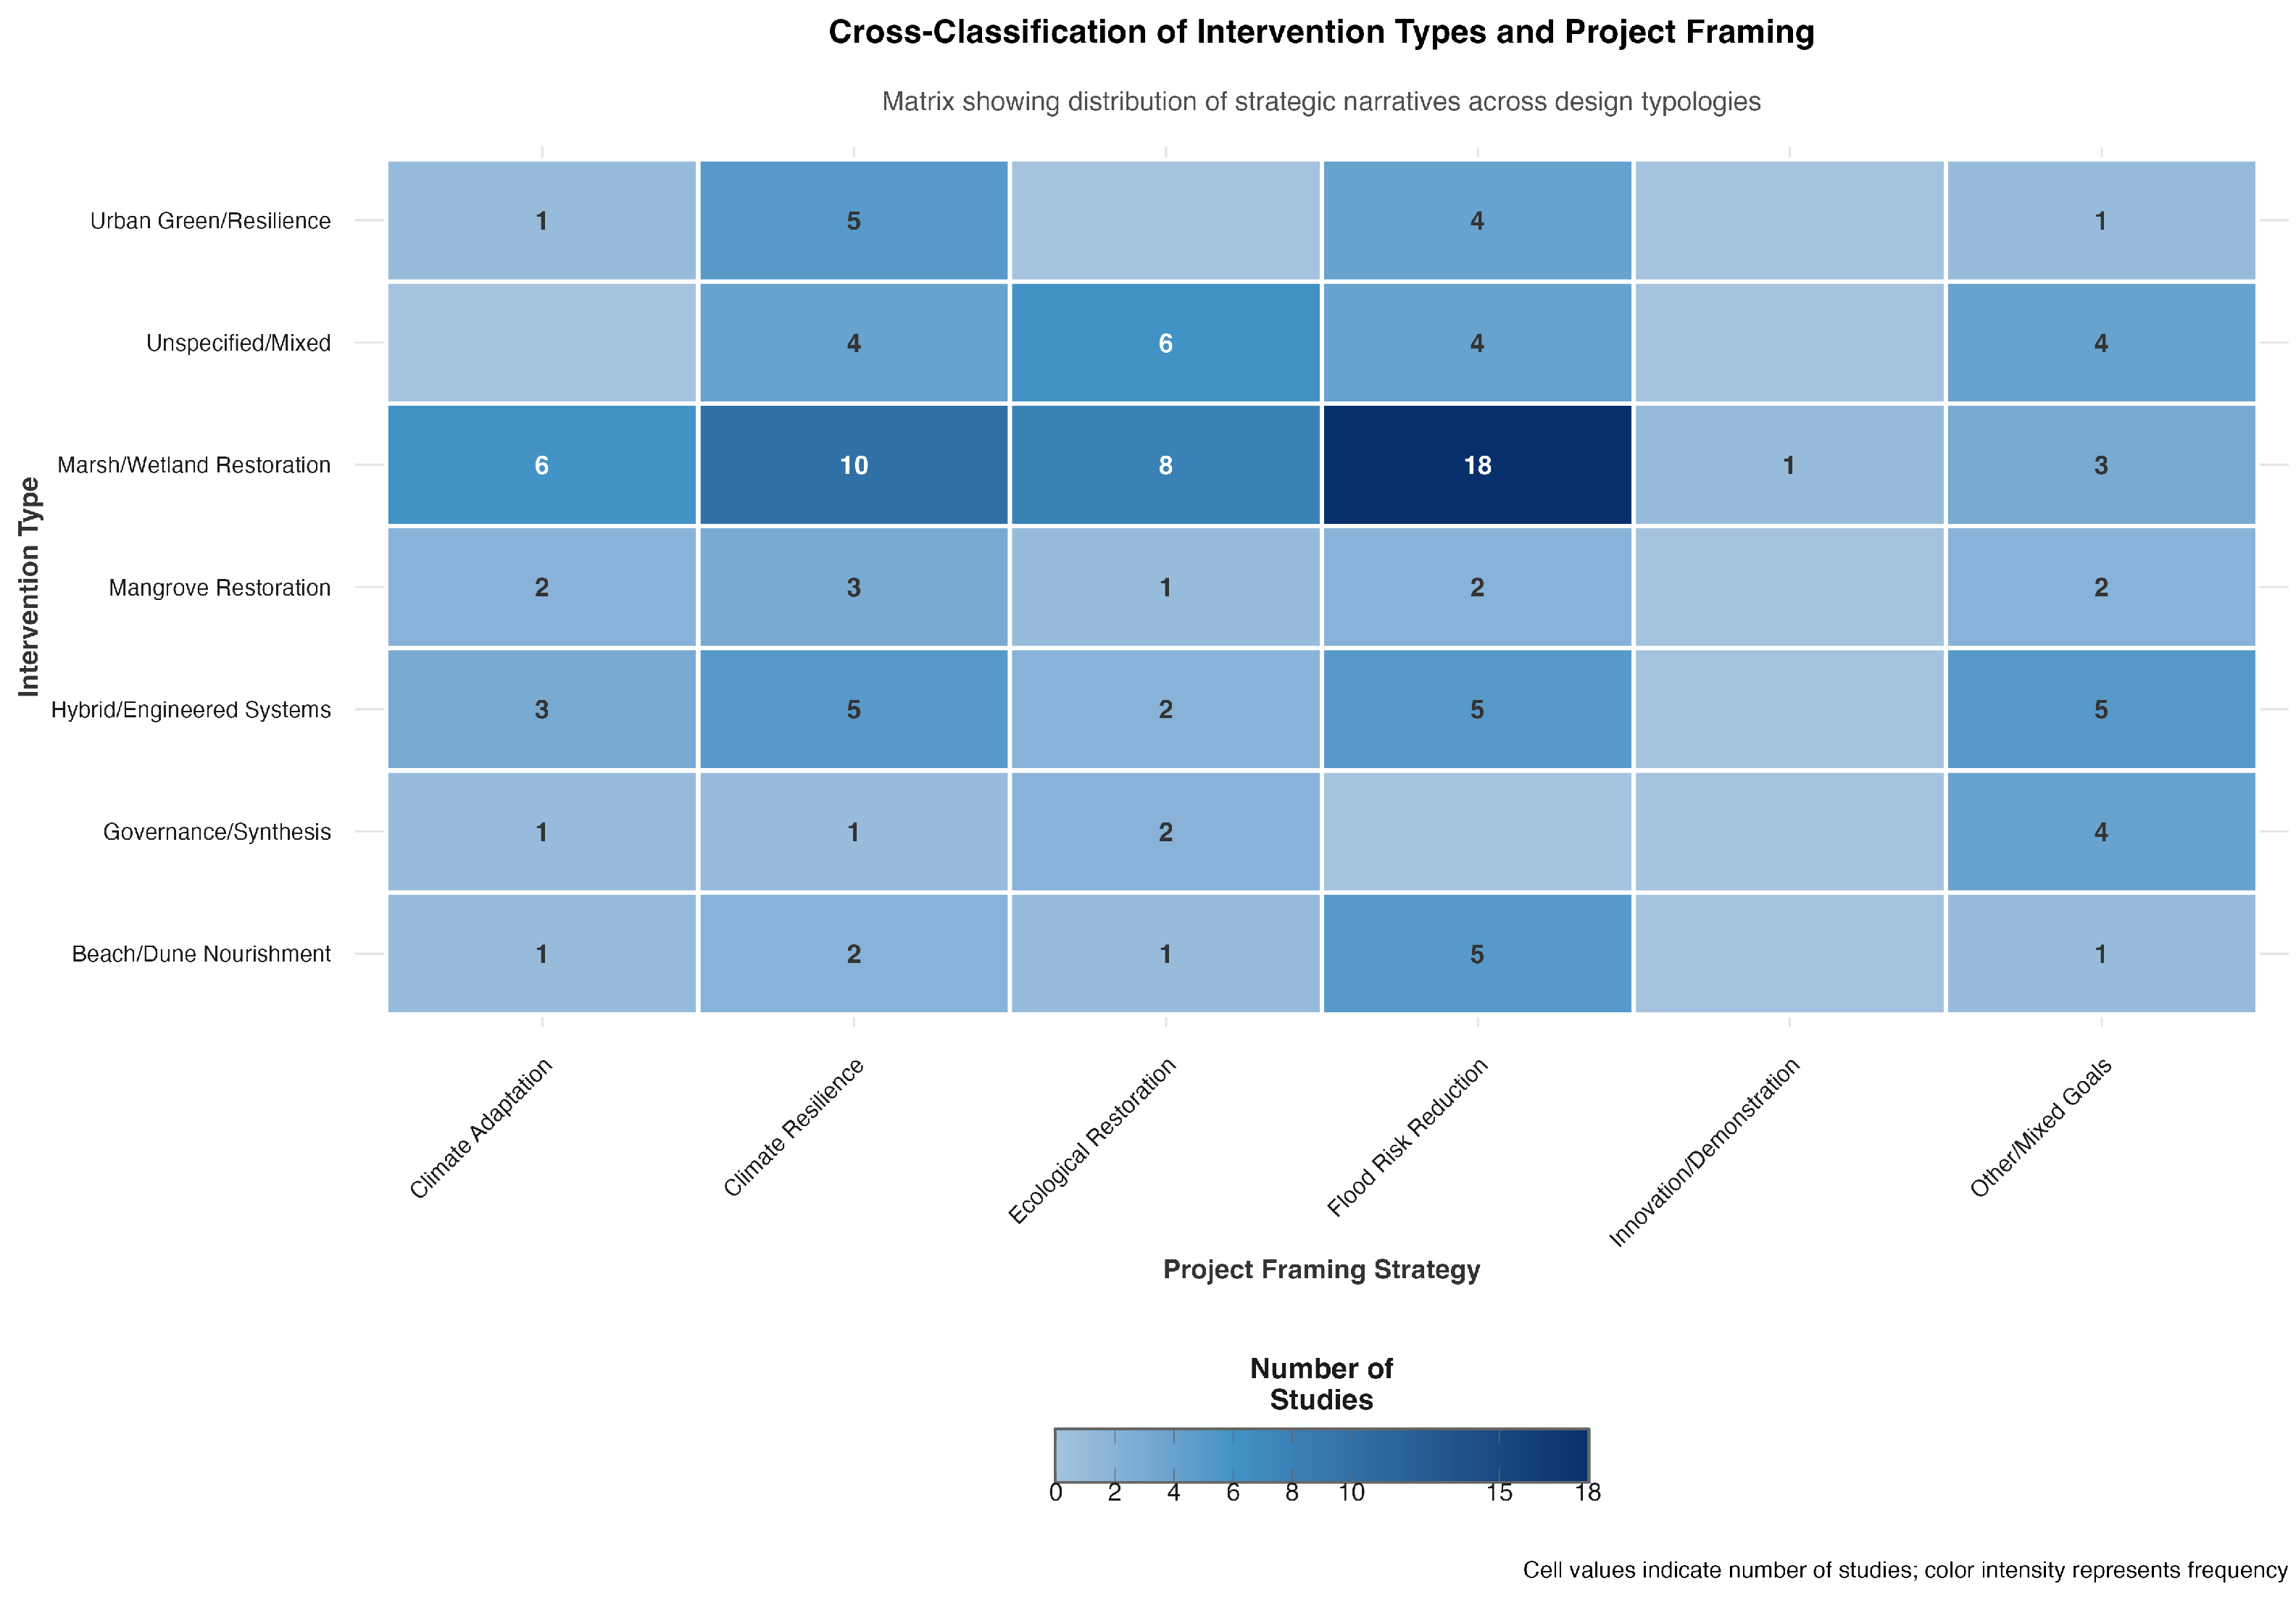
The typology × framing analysis (
Figure 3) revealed that while flood risk reduction was the most common justification for Marsh/Wetland Restoration (18 of 46 projects), these projects also frequently emphasized Climate Resilience (
n = 10) and ecological restoration (
n = 8) goals. Chi-square analysis revealed no significant association between intervention types and framing strategies (
,
,
, Cramér’s
), indicating framing flexibility across intervention types.
4.2. Project Framing and Rationale Patterns
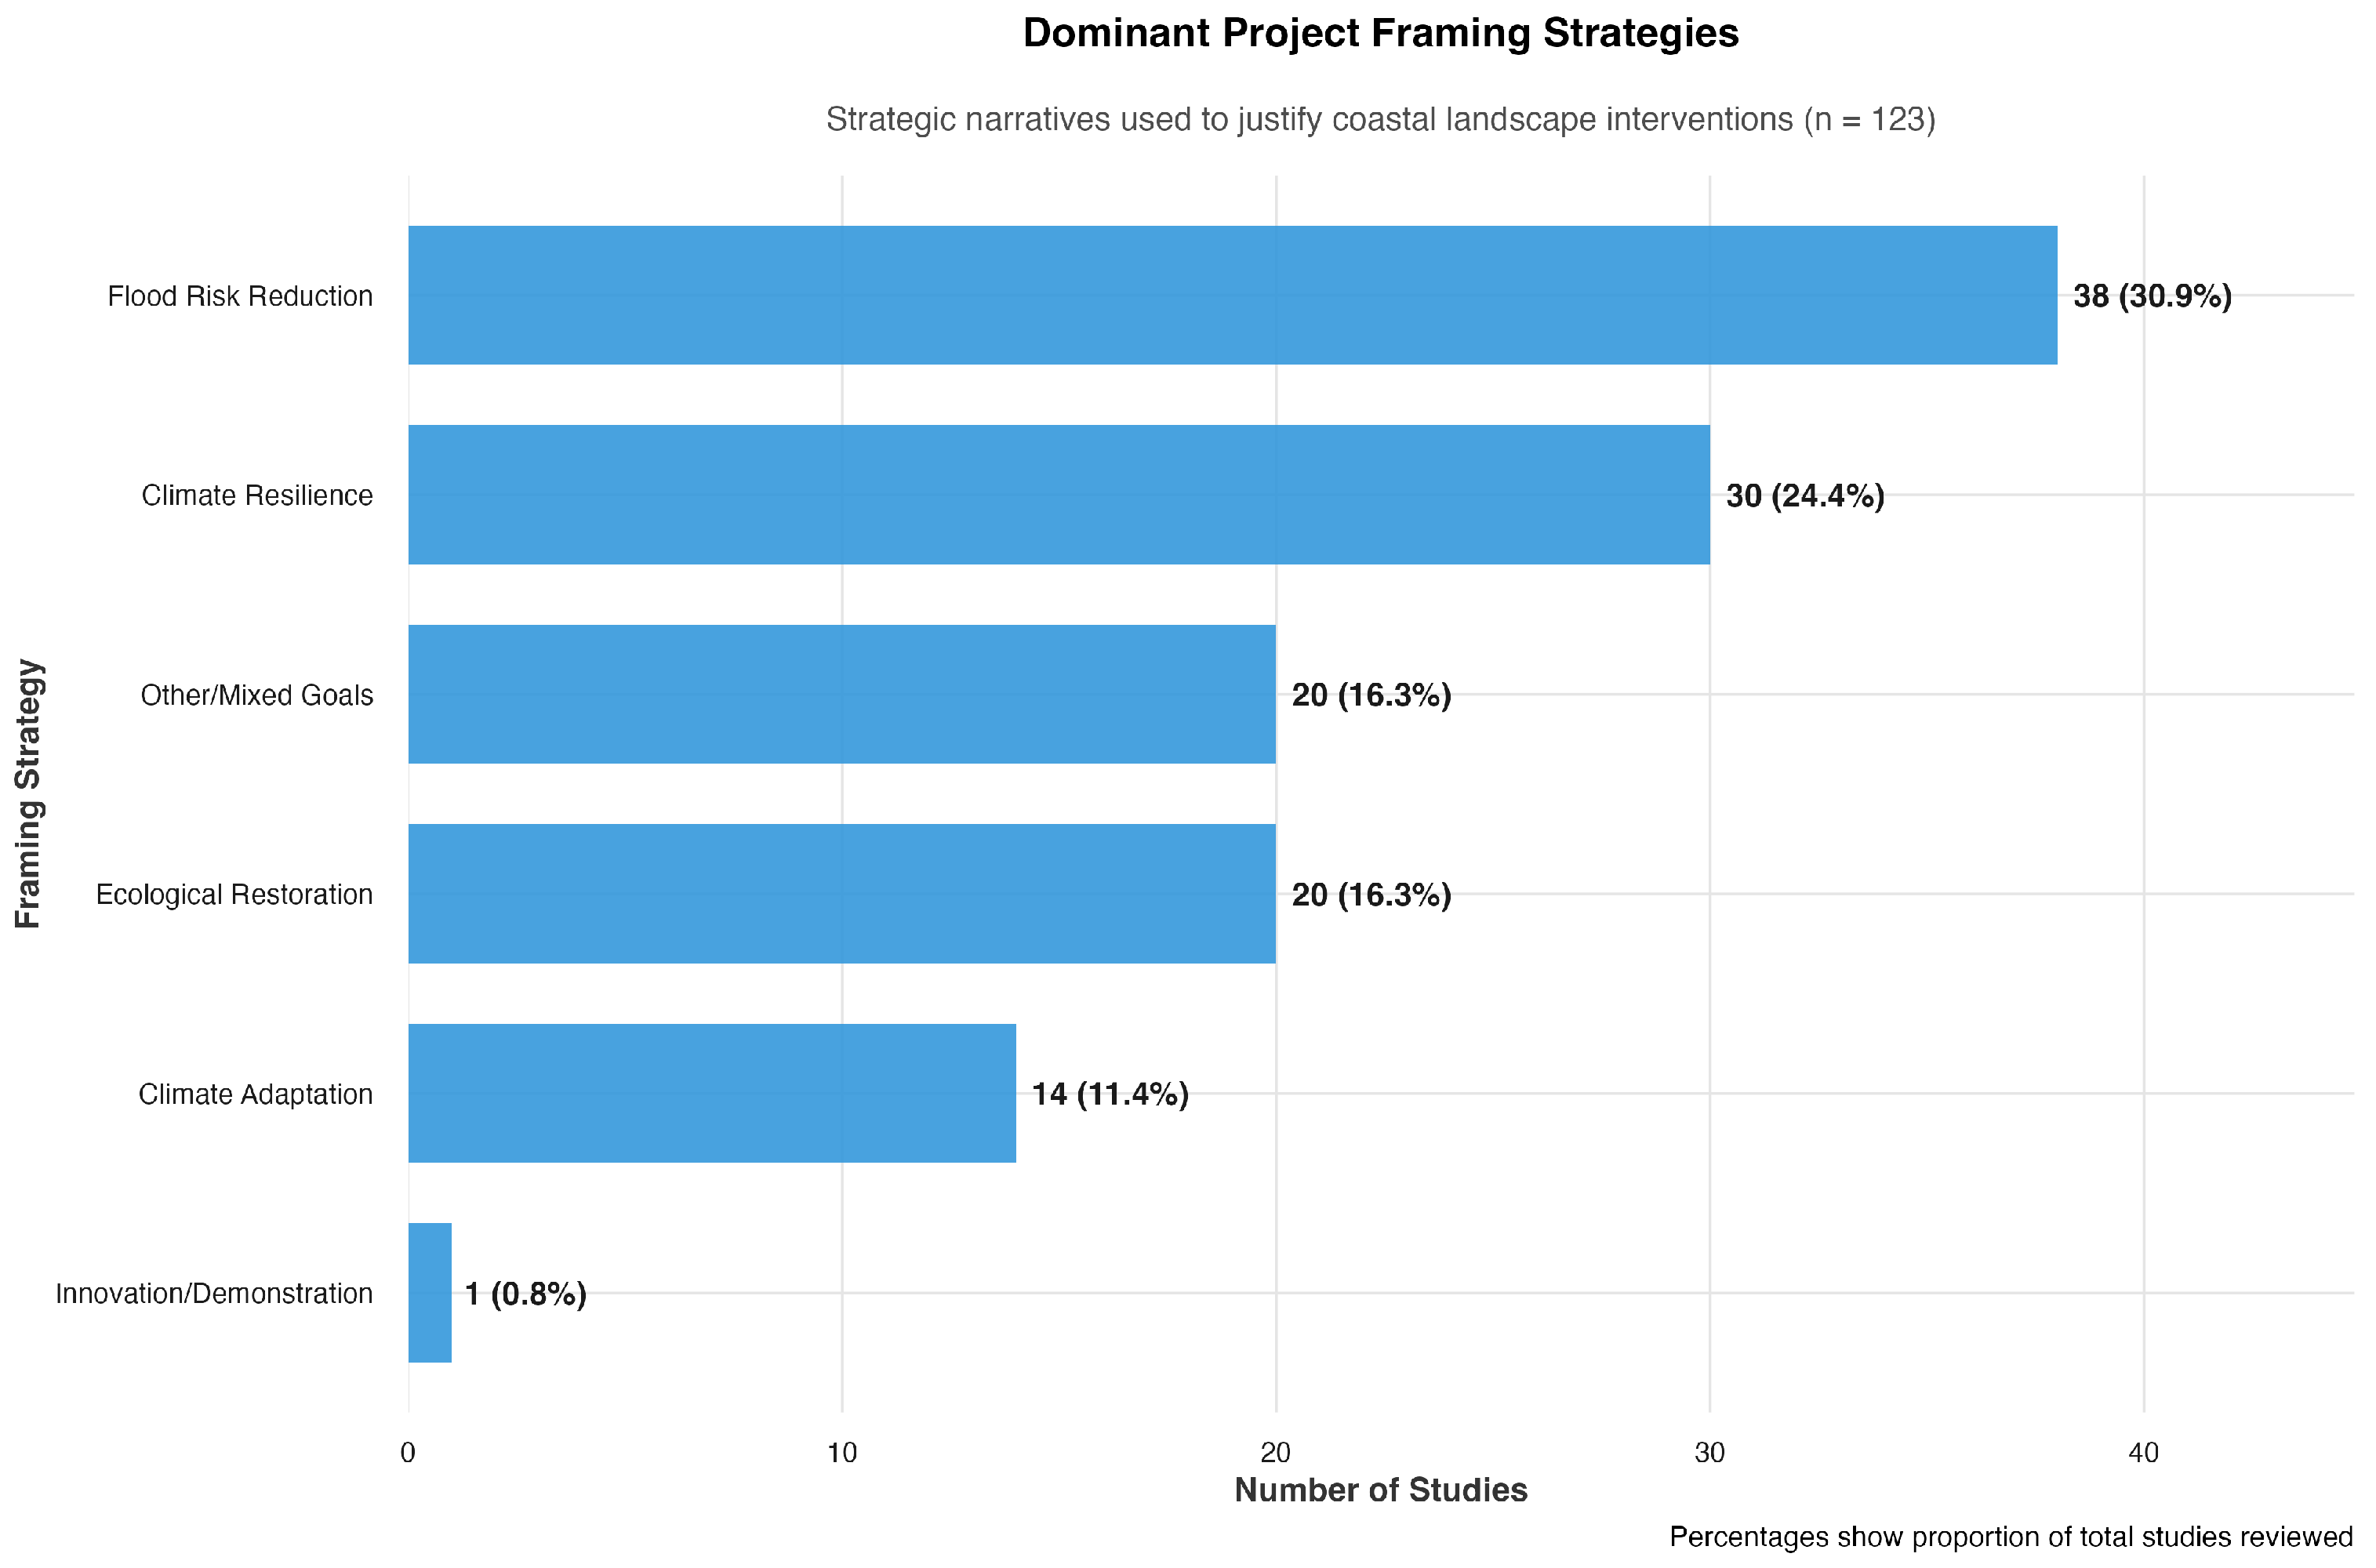
Six dominant framing narratives were identified across the 123 studies (
Figure 4). Flood Risk Reduction was the most prevalent framing (
n = 38; 30.9%), emphasizing surge protection, erosion control, and hazard mitigation with quantifiable outcomes such as reduced inundation and wave attenuation.
Climate Resilience appeared in 30 studies (24.4%), emphasizing long-term adaptation capacity and system robustness through flexible design strategies and multi-benefit outcomes. Ecological Restoration was the primary rationale in 20 studies (16.3%), focusing on biodiversity recovery, ecosystem services, and natural processes.
Other/Mixed Goals encompassed 20 studies (16.3%), with compound rationales including environmental justice, spatial quality, urban greening, or multifunctional co-benefits. Climate Adaptation was explicitly referenced in 14 studies (11.4%) as a response to sea level rise, storm surge intensification, or compound climate threats. Innovation/Demonstration framing appeared in only one study (0.8%).
4.3. Performance Monitoring Practices
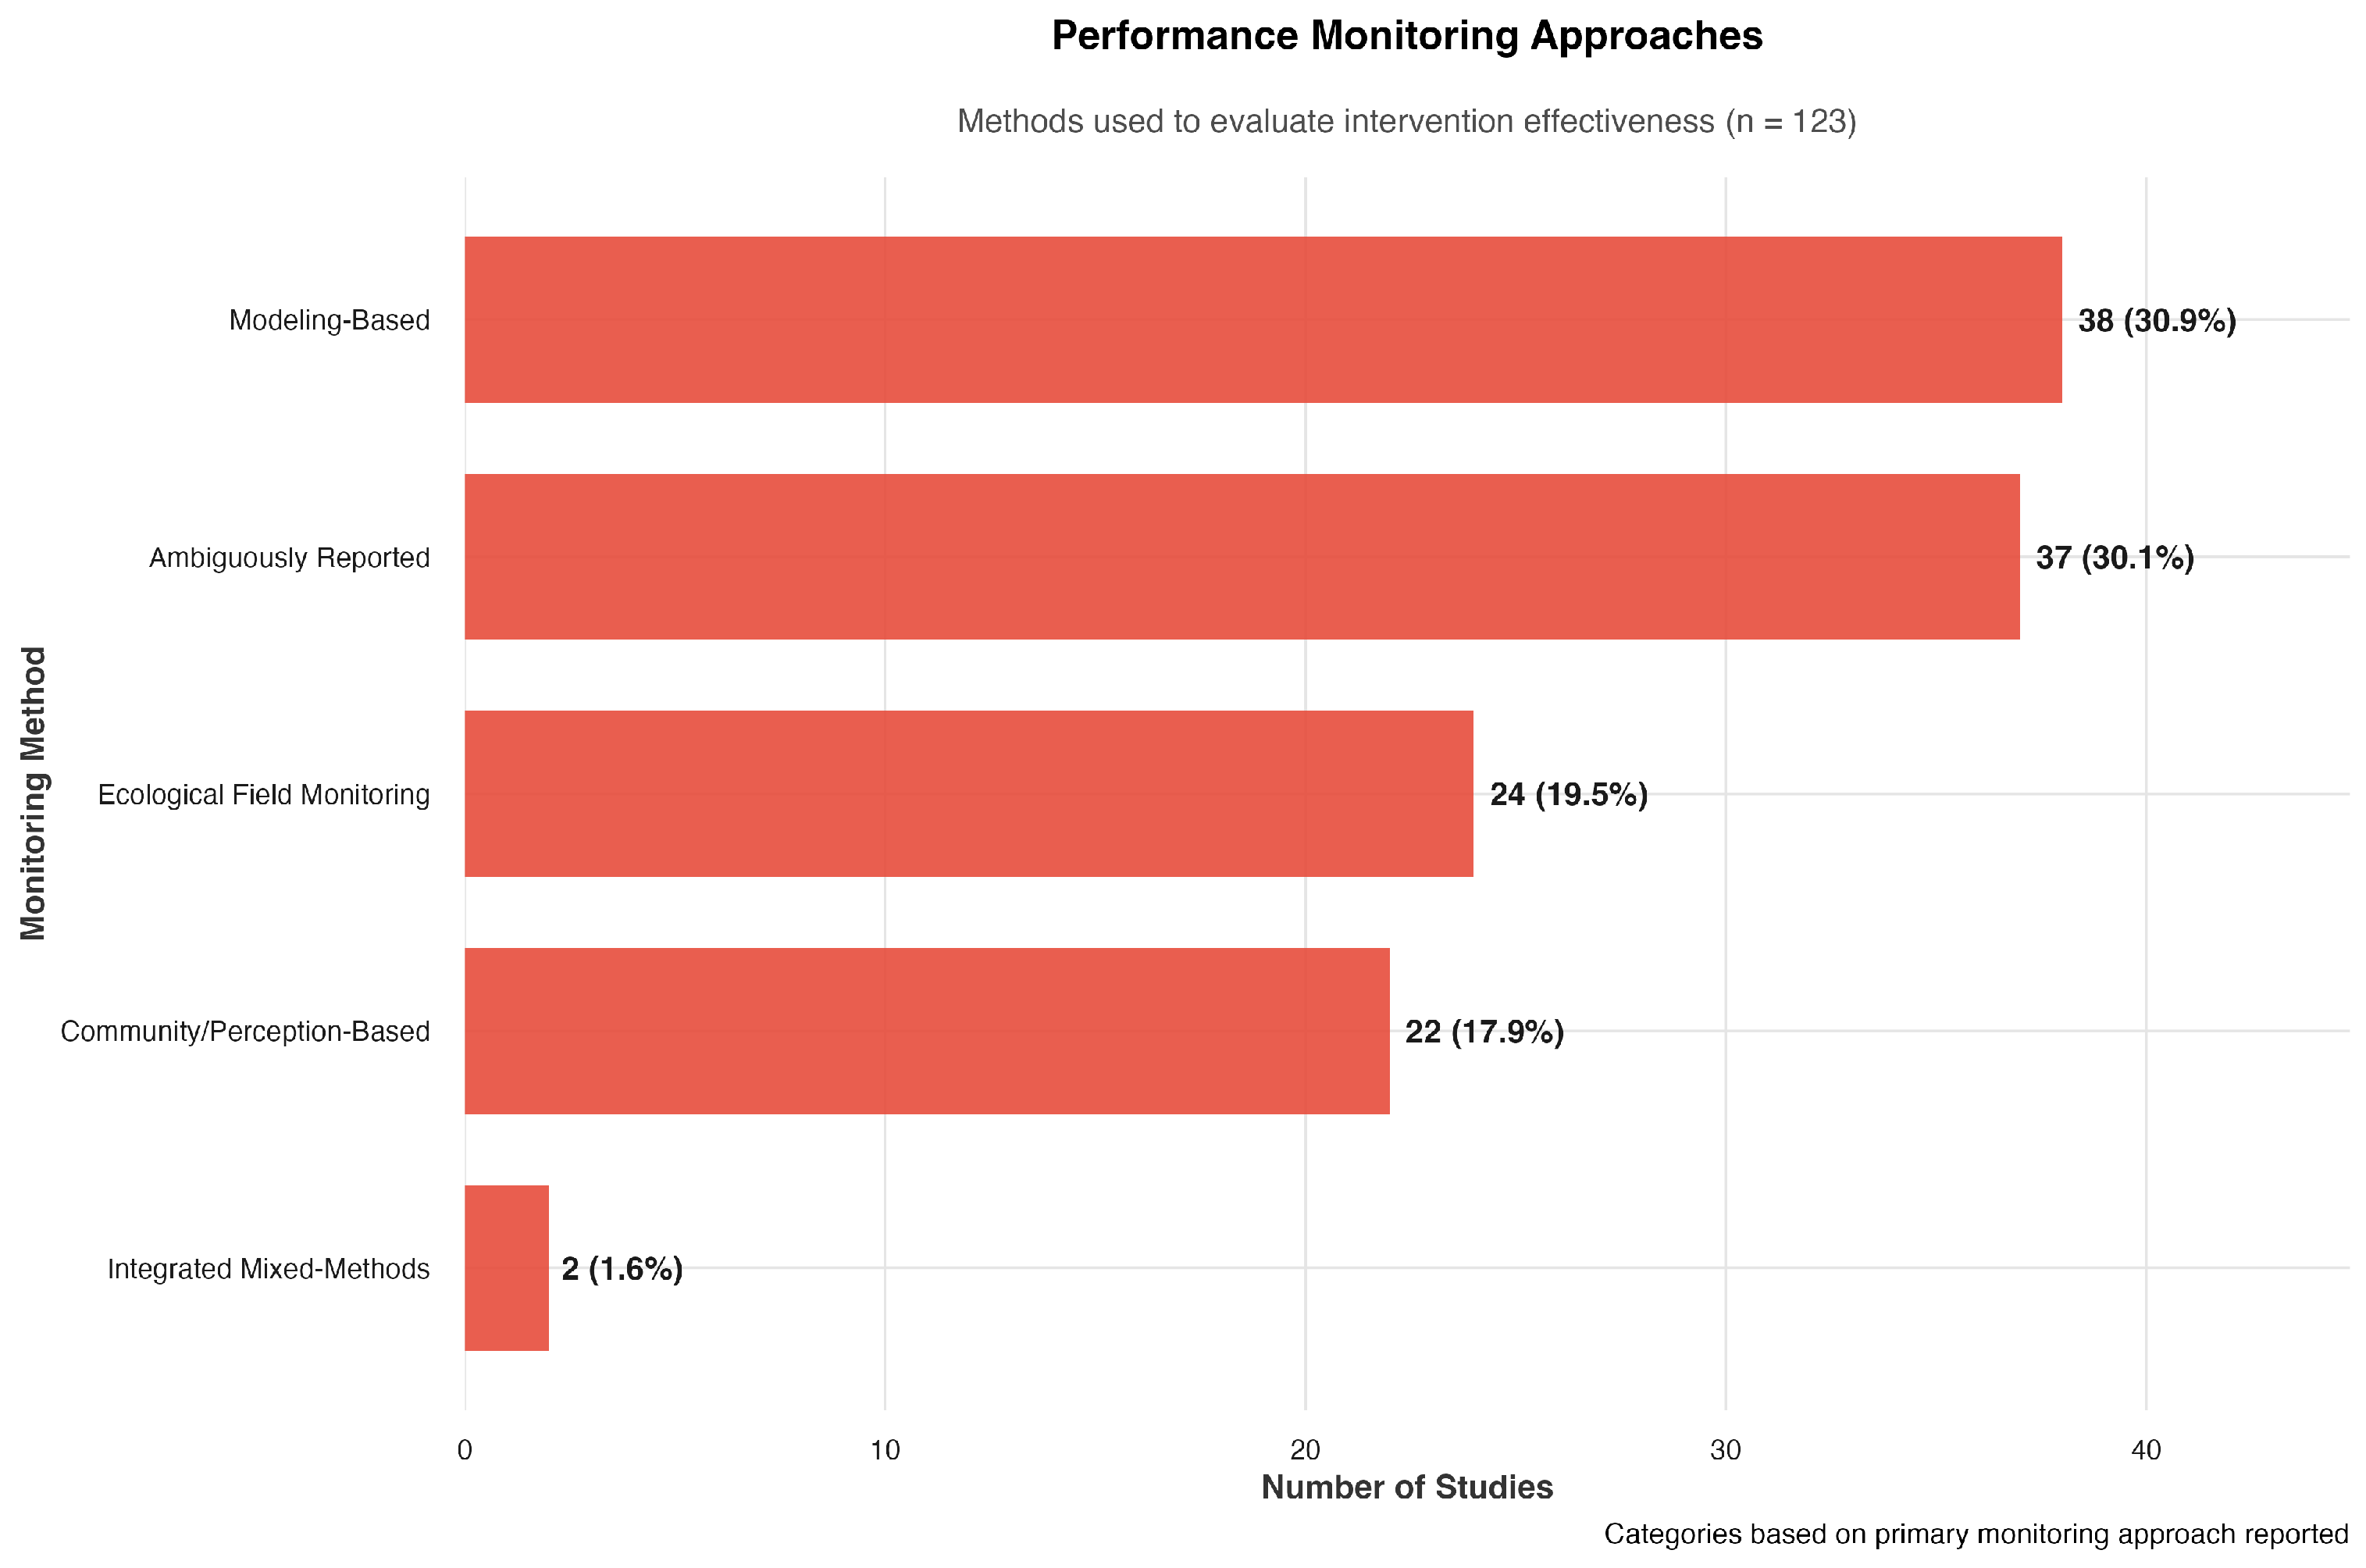
Monitoring approaches were classified into five categories based on reported methods (
Figure 5). Modeling-based evaluation was most common (
n = 38; 30.9%), typically involving hydrodynamic simulations, sediment transport models, or flood projections. A concerning 30.1% of studies (
n = 37) reported monitoring ambiguously without specific methods or indicators, using vague terms such as “impact assessment” or “monitoring planned” that provided little actionable detail. Ecological field monitoring appeared in 24 studies (19.5%), including biodiversity surveys, vegetation transects, and habitat mapping. Community/perception-based monitoring appeared in 22 projects (17.9%), incorporating stakeholder interviews, participatory evaluation, and social impact assessment. Integrated mixed-methods monitoring was documented in only two projects (1.6%), representing a fundamental research infrastructure gap.
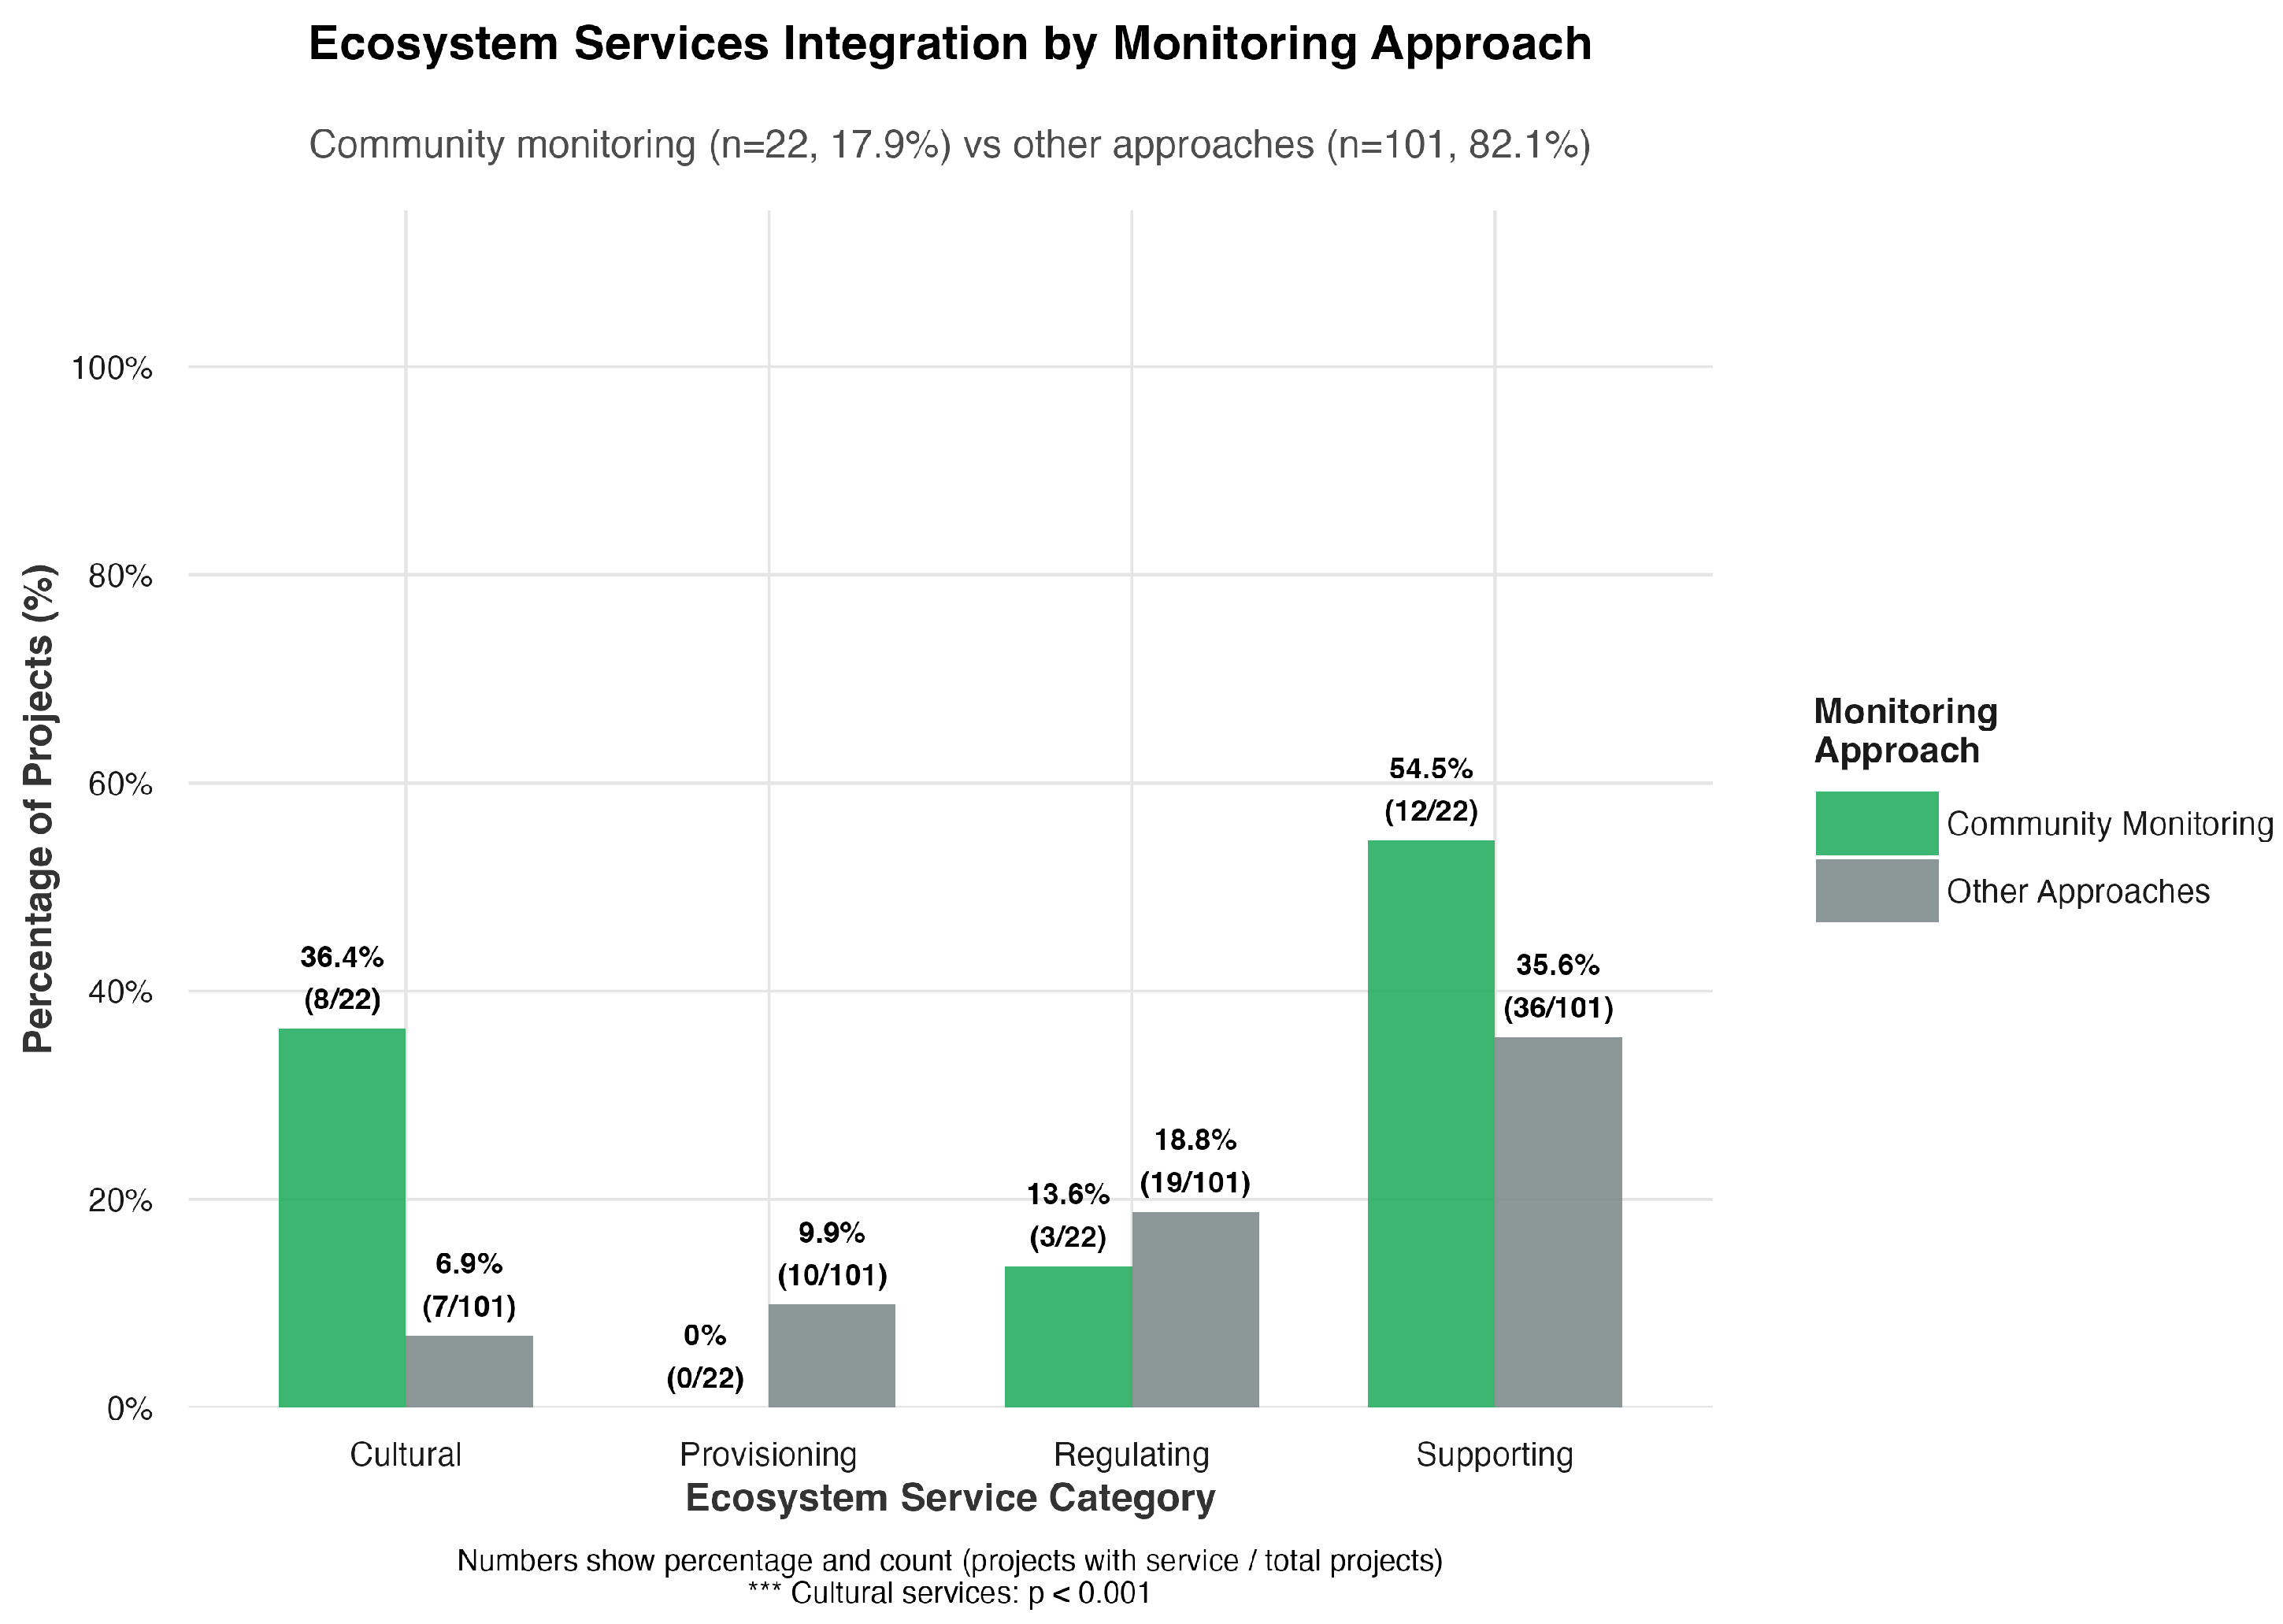
Community Monitoring and Social–Ecological Integration: Statistical analysis revealed that community monitoring projects showed markedly higher ecosystem services integration across multiple categories. Cultural services integration was 29.5 percentage points higher (36.4% vs. 6.9%, ), reflecting emphasis on recreational amenities, esthetic values, and public space creation. Supporting services showed elevated integration rates (54.5% vs. 35.6%), while provisioning services were notably absent in community monitoring projects (0% vs. 9.9% for other approaches), indicating the prioritization of non-extractive, public benefit outcomes over commercial resource utilization.
Community monitoring projects addressed an average of 1.05 ecosystem service categories compared to 0.71 for other approaches (
,
), suggesting that participatory engagement expands project consideration beyond technical flood protection to encompass multiple social–ecological benefits. Community monitoring projects demonstrated a significantly higher maintenance focus, with 77.3% explicitly addressing long-term considerations compared to 52.5% for other approaches (
,
), as well as showing an enhanced monitoring quality (mean score 1.64 vs. 0.76,
), indicating a strong integration between social engagement and methodological rigor (
Figure 6).
Quantitative Performance Outcomes and Evidence Quality: Only 18 projects (14.6%) reported quantifiable metrics, representing a fundamental research infrastructure gap. By intervention type, quantitative outcomes varied, as follows: Marsh/Wetland Restoration showed the highest rates (21.7%; 10/46 projects), followed by Urban Green/Resilience (18.2%; 2/11 projects), Beach/Dune Nourishment (10%; 1/10 projects), Hybrid/Engineered Systems (10%; 2/20 projects), and Mangrove Restoration (10%; 1/10 projects). Projects with quantitative outcomes included 11 with flood control metrics—6 with ecological metrics and 4 with cost–benefit metrics.
4.4. Monitoring Quality and Sustainability Outcomes
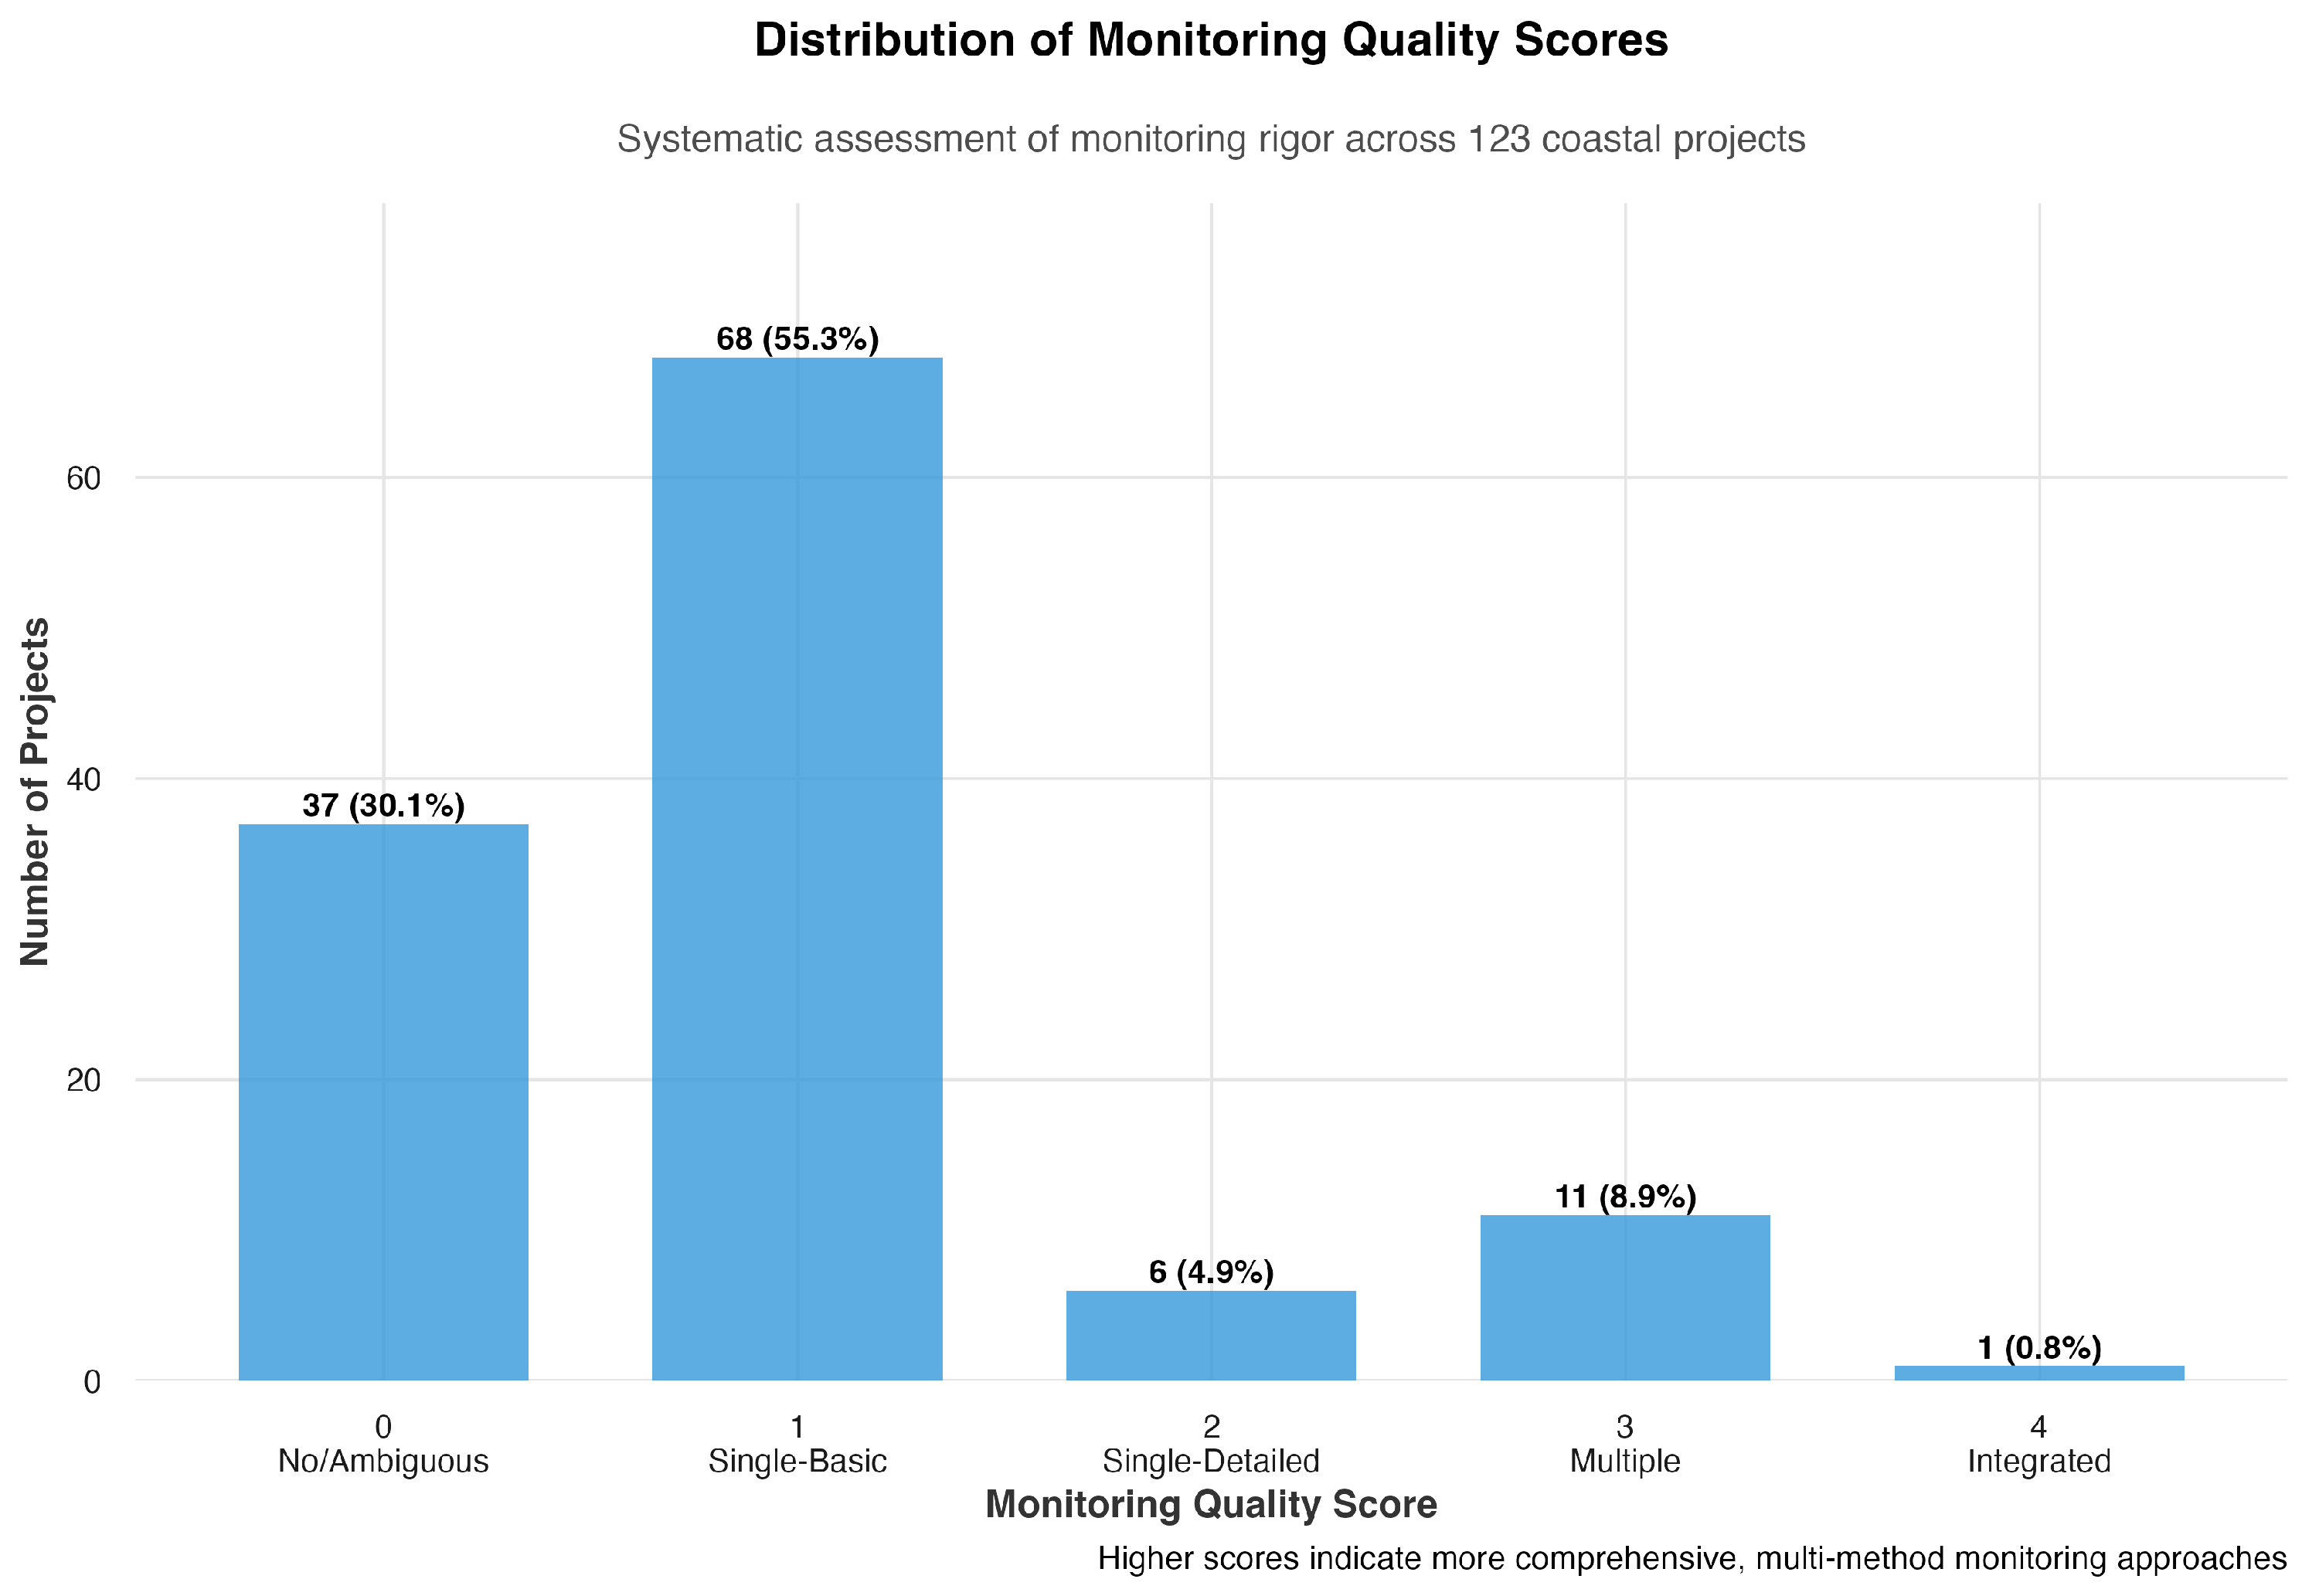
Monitoring Quality Scoring Framework: To address the substantial proportion of studies with ambiguous monitoring descriptions, we implemented a systematic monitoring quality scoring framework (0-5 scale) based on methodological rigor and comprehensiveness. The assessment revealed critical monitoring gaps across coastal adaptation practice (
Figure 7).
Monitoring Quality Distribution: The mean monitoring quality score across all projects was 0.89 out of 5.0, indicating fundamental capacity limitations. The distribution showed 30.1% with ambiguous or no clear monitoring (score 0, ), 55.3% using basic single methods (score 1, ), 4.9% employing detailed single methods (score 2, ), 8.9% using multiple methods (score 3, ), and 0.8% achieving integrated mixed-methods standards (score 4, ). Zero projects achieved comprehensive adaptive monitoring (score 5), representing a critical gap in multidisciplinary assessment approaches that could support adaptive management.
Community Monitoring Quality Patterns: Community monitoring projects demonstrated significantly higher quality scores (mean = 1.64) compared to other approaches (mean = 0.76, ). Among community monitoring projects, 59.1% employed basic methods (), 18.2% used detailed protocols (), and 22.7% integrated multiple approaches (), indicating enhanced methodological sophistication in participatory evaluation contexts.
Quality–Sustainability Correlations: Correlation analysis revealed significant associations between monitoring quality and key sustainability indicators. Higher quality monitoring correlated significantly with explicit SLR integration (, ), though correlations with quantitative outcomes (, ) and long-term focus (, ) were not statistically significant. This establishes monitoring rigor as a predictor of climate-informed design practice while highlighting the need for stronger connections between monitoring quality and measurable outcomes.
Temporal Patterns and Intervention Outcomes: Duration information was available for 46 projects (37.4%), with 77 projects (62.6%) not reporting duration data. Among teh projects with duration data, 6 were short-term (≤3 years) and 40 were long-term (>3 years) projects, with durations ranging from 0.3 to 100 years. Dynamic or adaptive monitoring appeared in only six projects (4.9%), representing substantial gaps in adaptive management capacity.
Systematic outcome classification revealed 54 projects (43.9%) with positive outcomes reported, 37 projects (30.1%) with no clear outcome assessment, 19 projects (15.4%) reporting challenges/limitations, and 13 projects (10.6%) with mixed/ongoing outcomes. However, these success rates may overestimate intervention effectiveness due to the systematic exclusion of terminated or failed projects from the published literature.
4.5. Integration of Sea Level Rise in Design
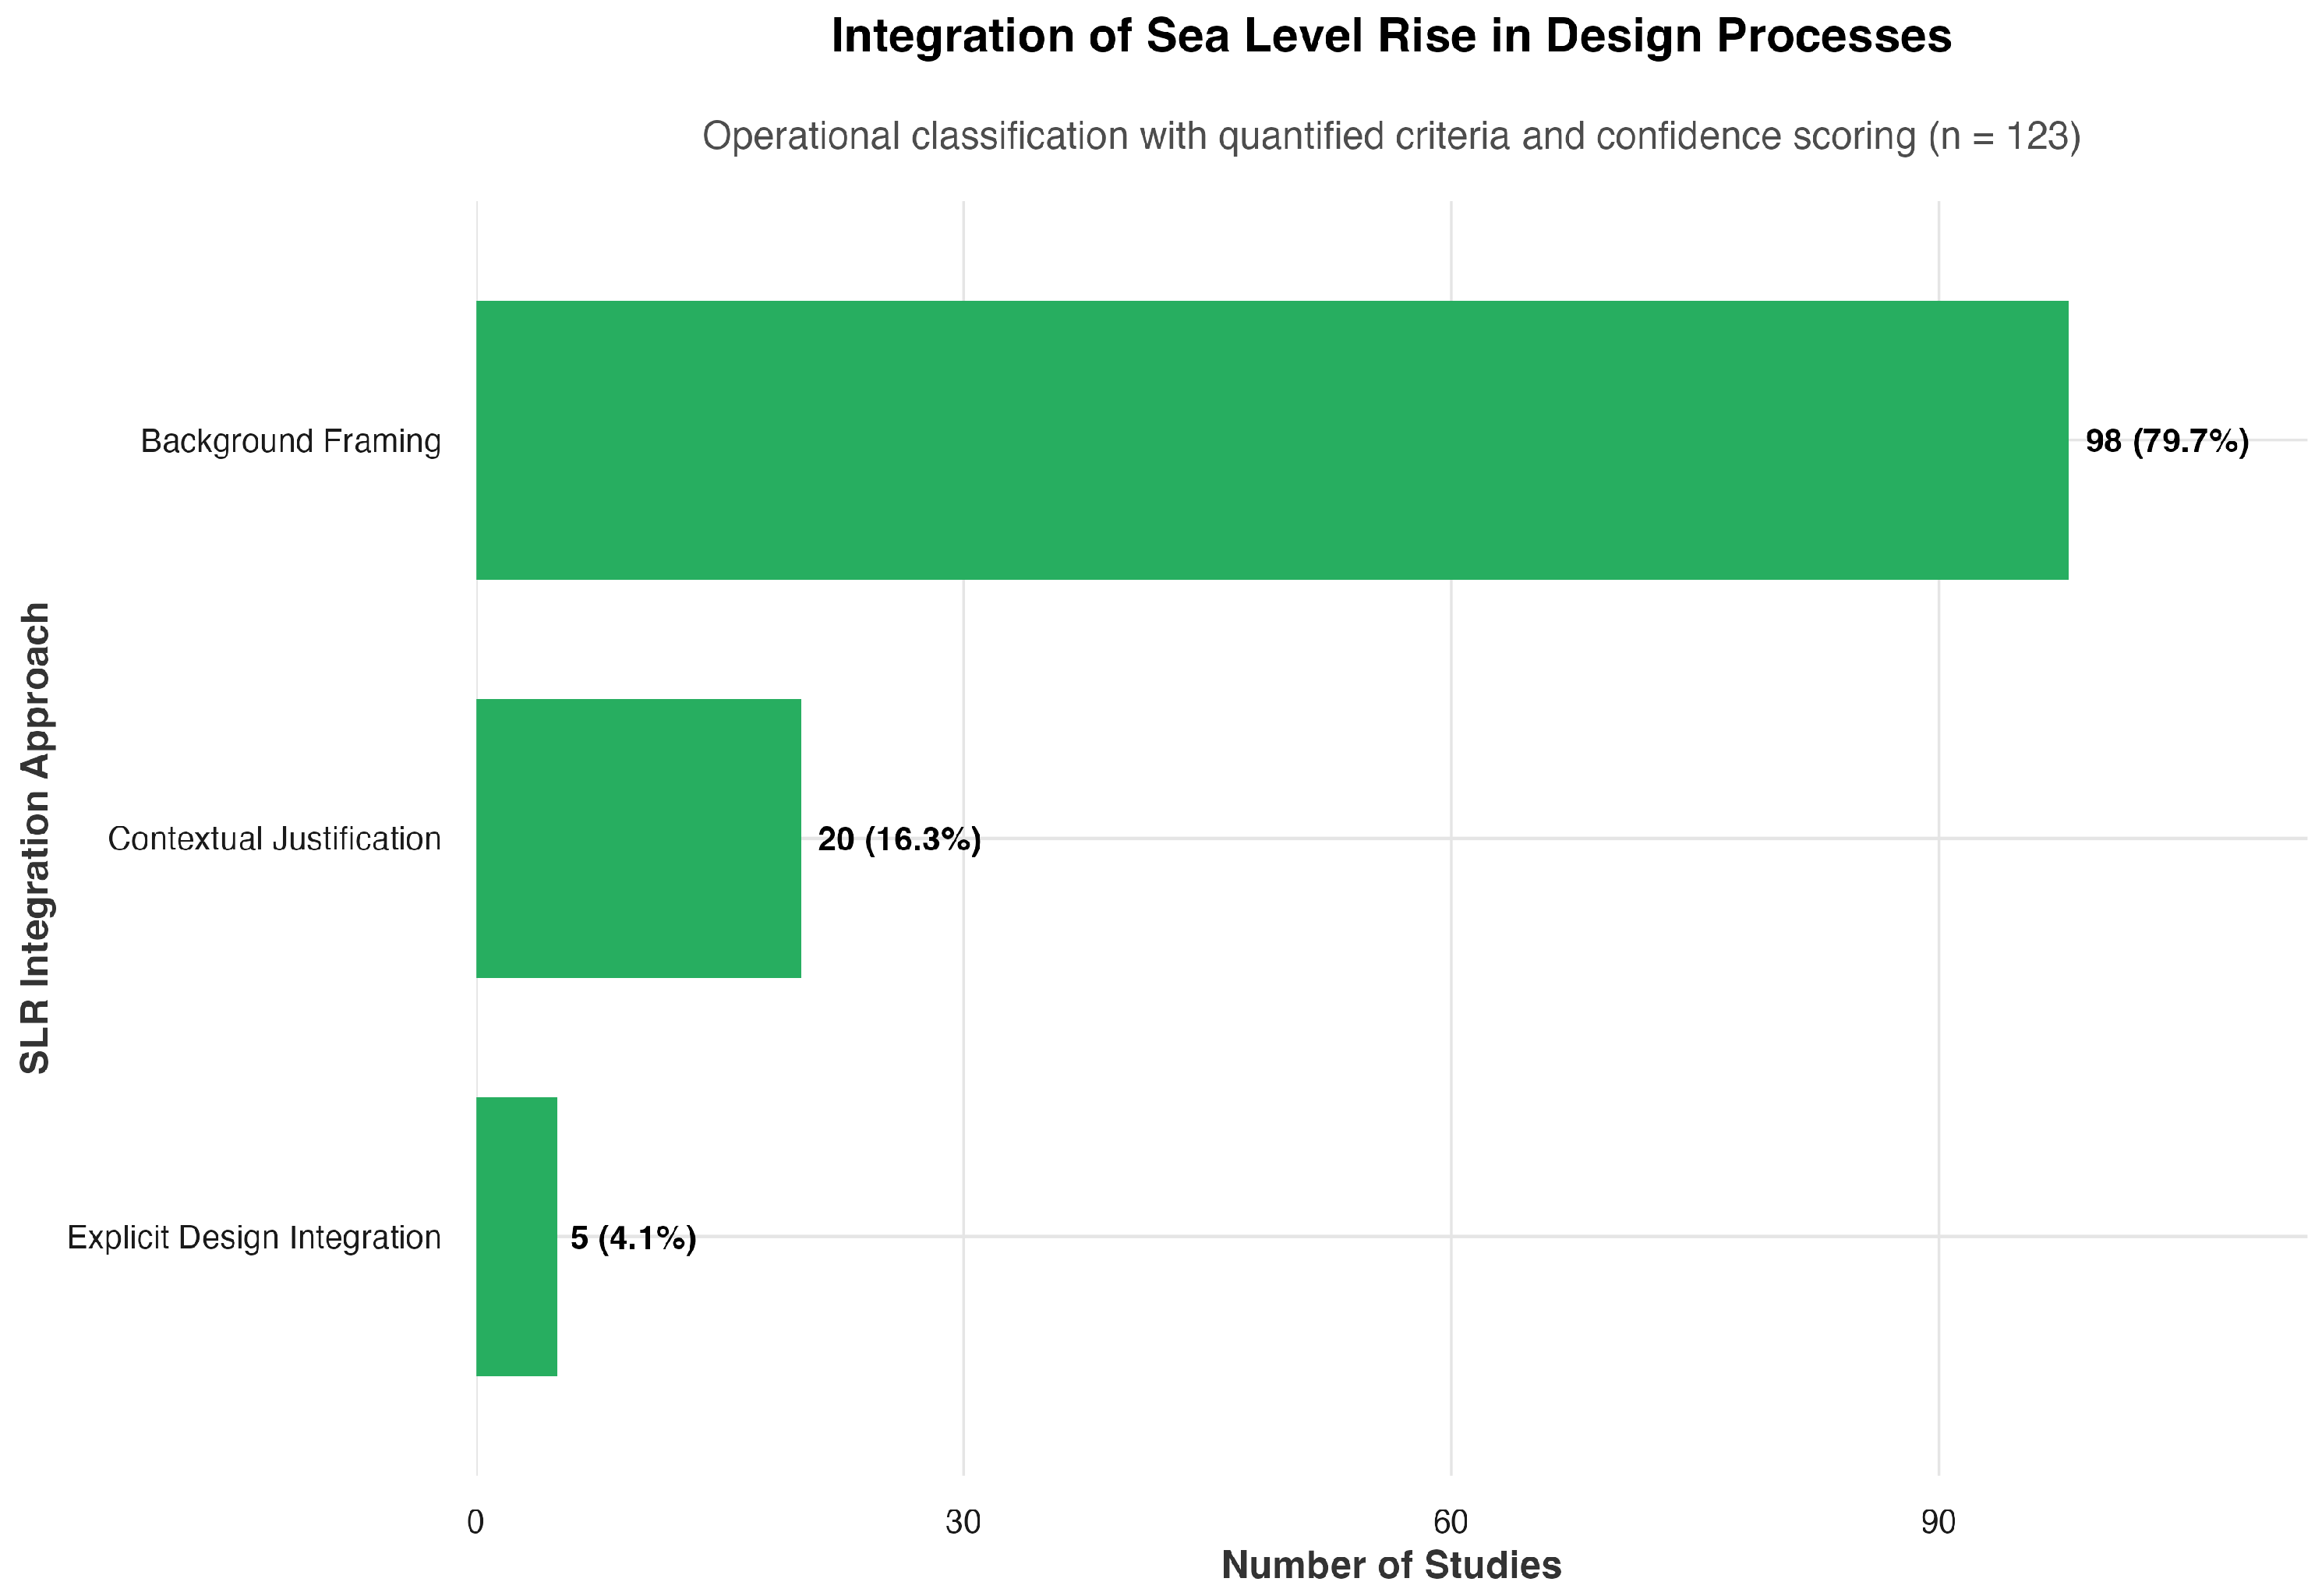
The application of operational classification criteria with confidence scoring revealed minimal explicit SLR integration in coastal design practice. Only five studies (4.1%) demonstrated explicit design integration, characterized by both climate scenario references (RCP/SSP projections, temporal benchmarks) and quantitative design parameters (specific elevations, adaptive thresholds). The majority of studies (98 studies, 79.7%) provided only background framing of SLR without meaningful connection to project design. Contextual justification appeared in 20 studies (16.3%), where SLR motivated project development but did not influence design specifications (
Figure 8).
Climate Scenario Integration Gaps: All studies achieving explicit integration demonstrated high confidence scores (0.8), with 100% including both scenario anchors and parametric specifications. However, no projects used standardized IPCC scenario frameworks (0 projects used RCP scenarios, 0 used SSP scenarios, 0 referenced IPCC), though 5 projects included quantitative SLR values. This science–practice gap reveals that while climate awareness is widespread (95.9% of projects acknowledge SLR), translating this awareness into operational design parameters remains a fundamental challenge.
4.6. Implementation Challenge Typology
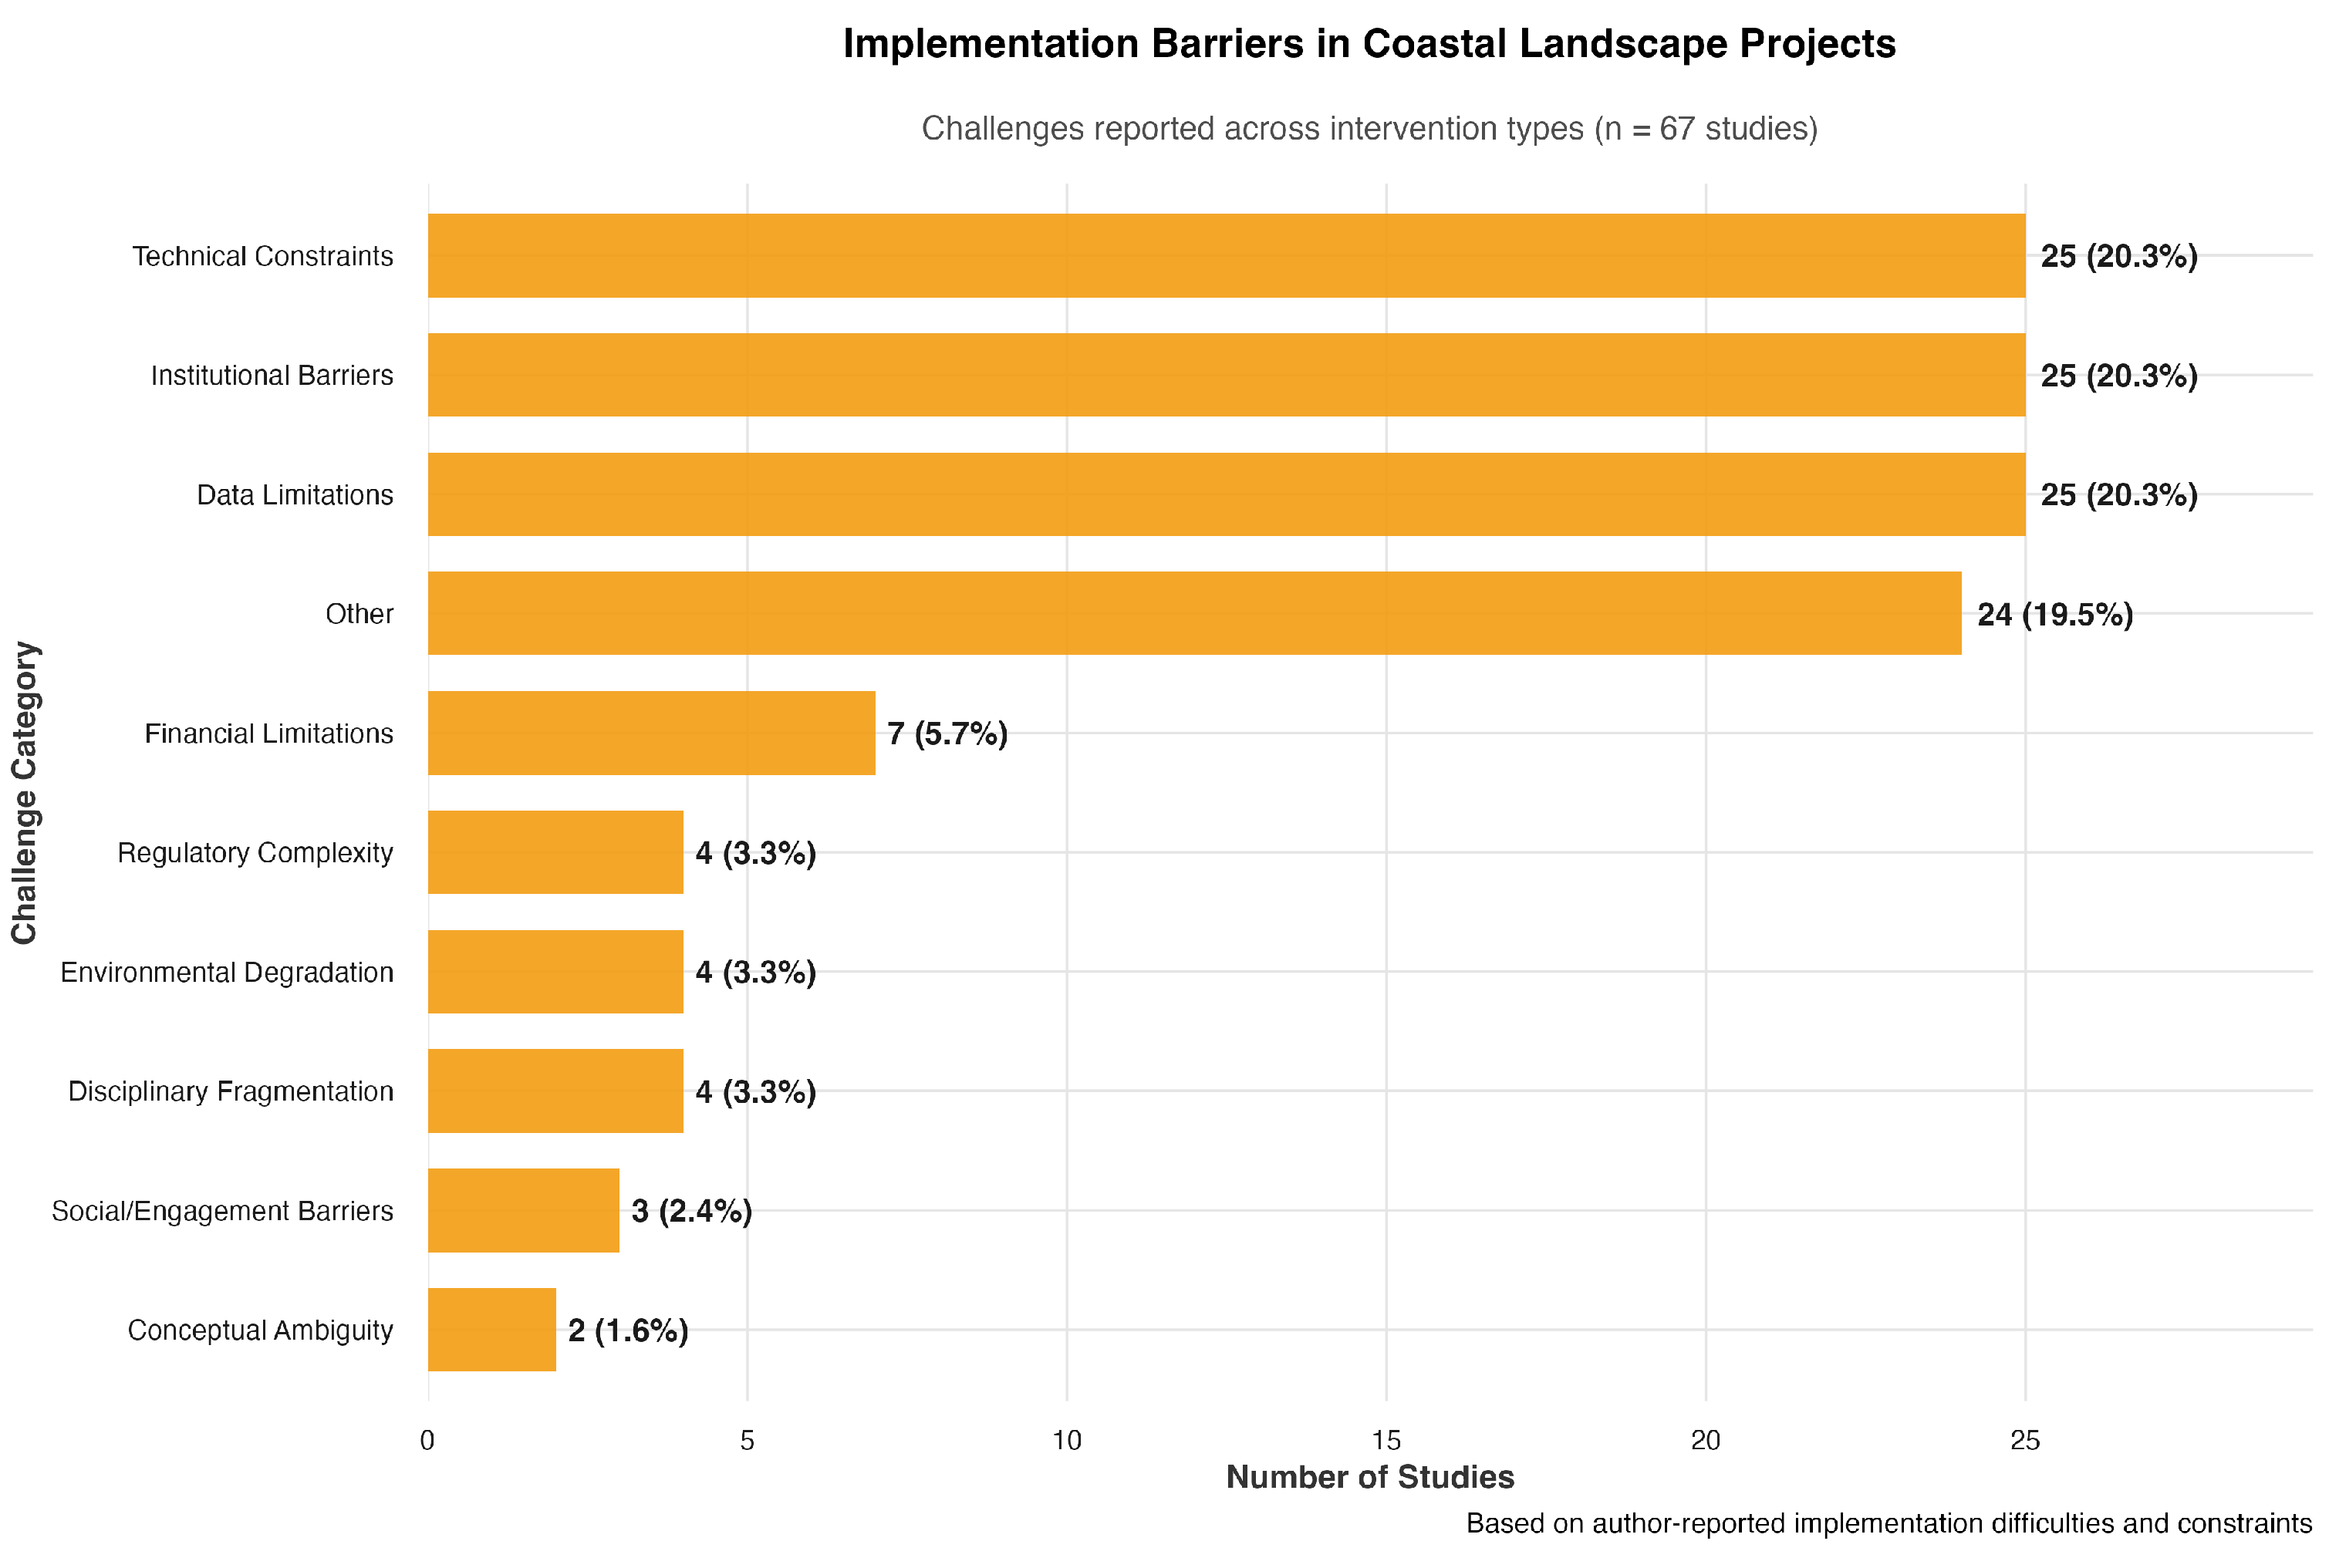
Implementation barriers were reported in 67 studies (54.5%), revealing ten recurring constraint categories (
Figure 9). The three most prevalent challenges were technical constraints (
; 20.3%), institutional barriers (
; 20.3%), and data limitations (
; 20.3%).
Technical constraints included hydrological mismatches, substrate incompatibility, and limitations in sediment transport or salinity regimes. Institutional barriers involved fragmented governance, conflicting mandates, or lack of legal clarity around nature-based solutions. Data limitations included outdated elevation models, coarse-resolution subsidence estimates, or unvalidated hydrodynamic inputs.
Financial limitations appeared in seven studies (5.7%), regulatory complexity in four studies (3.3%), and environmental degradation or external risks in four studies (3.3%). Disciplinary fragmentation (; 3.3%) involved conflicting priorities between professionals, while social or engagement barriers (; 2.4%) included limited consultation or local opposition. Conceptual ambiguity appeared in two studies (1.6%).
4.7. Geographic Distribution and Regional Monitoring Patterns
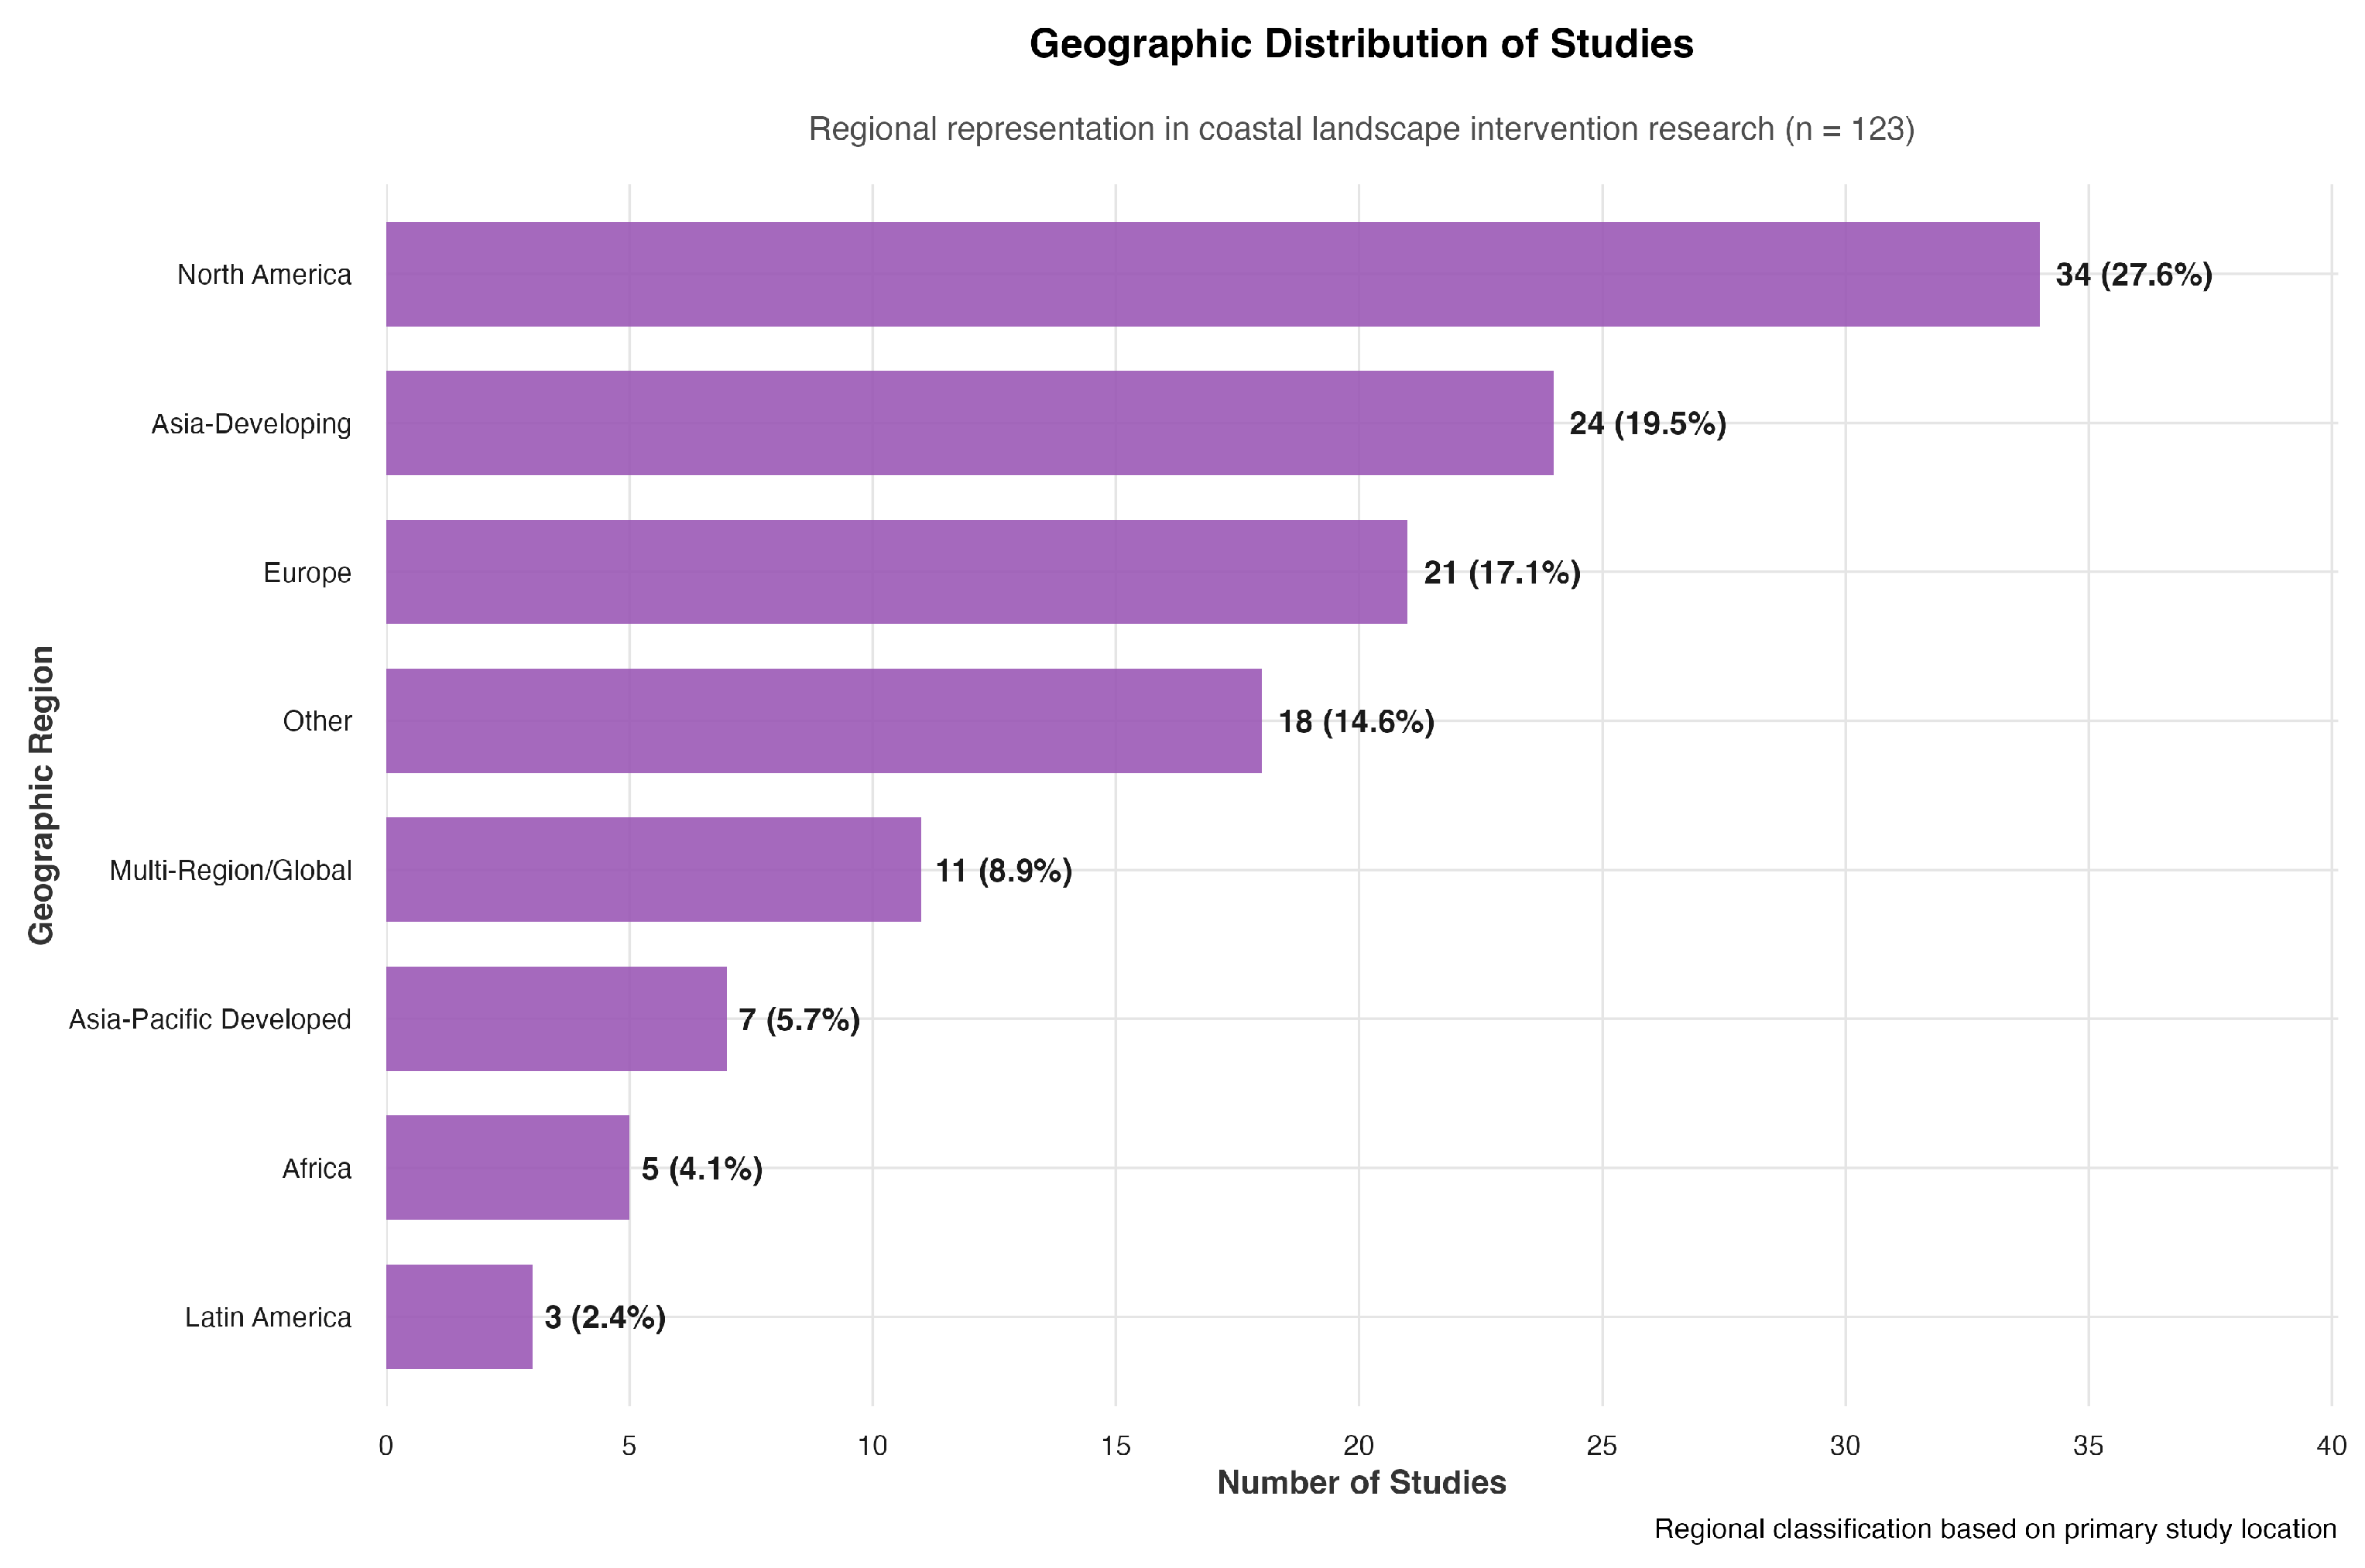
Regional Distribution: Studies originated from eight regional categories (
Figure 10). North America contributed the largest number of studies (
n = 34; 27.6%), followed by Asia—Developing (
n = 24; 19.5%), Europe (
n = 21; 17.1%), and Other regions (
n = 18; 14.6%). Multi-Region/Global studies accounted for 11 studies (8.9%), Asia-Pacific—Developed accounted for 7 studies (5.7%), Africa accounted for 5 studies (4.1%), and Latin America accounted for 3 studies (2.4%).
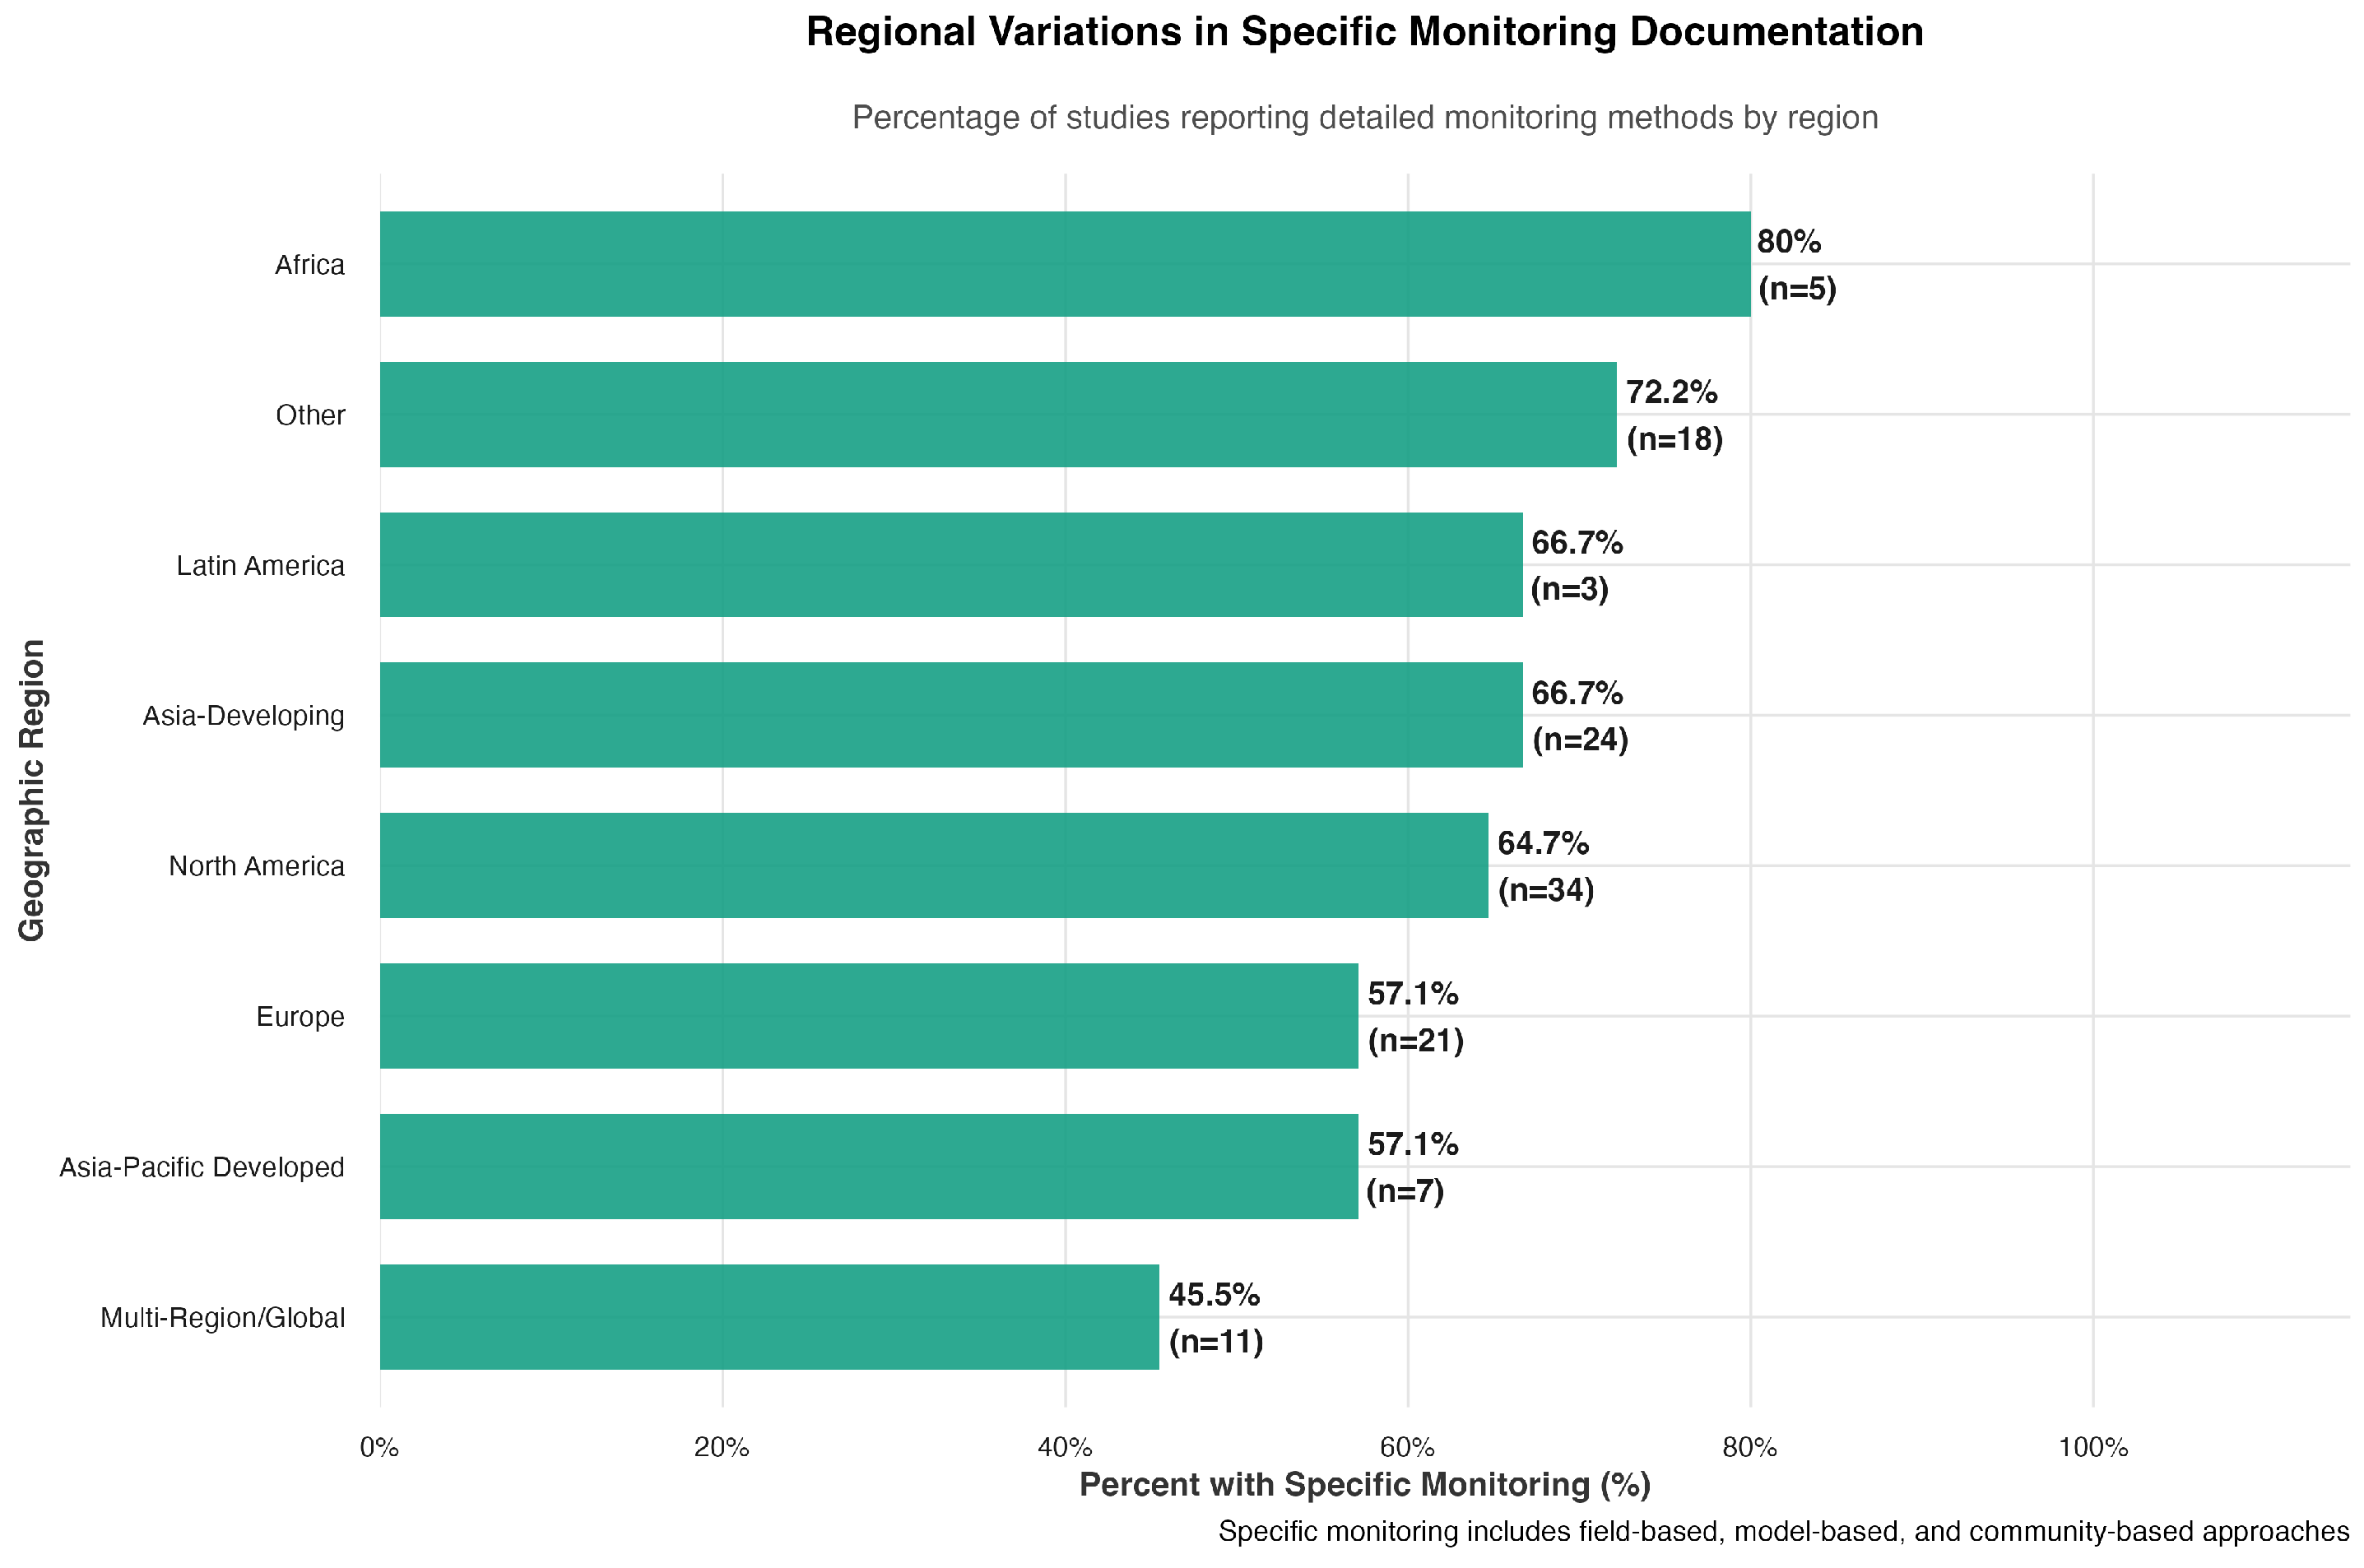
Regional Variations in Specific Monitoring Documentation. The percentage of studies reporting specific monitoring methods varied considerably across regions (
Figure 11). Africa demonstrated the highest rate of specific monitoring documentation (80.0%; 4 of 5 studies), followed by Other regions (72.2%; 13 of 18 studies) and Asia—Developing (66.7%; 16 of 24 studies). Latin America showed specific monitoring in 66.7% of studies (2 of 3 studies), while North America reported specific monitoring in 64.7% of studies (22 of 34 studies). Asia-Pacific— Developed and Europe each documented specific monitoring in 57.1% of studies (4 of 7 studies and 12 of 21 studies, respectively). Multi-Region/Global studies showed the lowest rate of specific monitoring documentation at 45.5% (5 of 11 studies).
Distribution of Monitoring Methods by Region: Model-based monitoring was most prevalent in North America (
n = 12), followed by Asia—Developing (
n = 8) and Other regions (
n = 8). Europe showed equal distribution between model-based and field-based approaches (
n = 6 each). Field-based monitoring was most common in the North America (
n = 9) and Asia—Developing regions (
n = 6). Community-based monitoring appeared infrequently across all regions, with Asia—Developing (
n = 2) and Other regions (
n = 2) showing the highest counts (
Figure 12).
4.8. Coding Reliability Assessment
Inter-rater reliability was assessed through the independent re-coding of a random sample of 12 studies (9.8%) using standardized operational definitions consistent with all systematic classifications. Cohen’s Kappa analysis demonstrated acceptable-to-substantial agreement across core variables—intervention typology (, moderate agreement), project framing (, substantial agreement), monitoring approaches (, moderate agreement), and SLR integration (, almost-perfect agreement). Mean reliability across available variables was , confirming the consistent application of systematic classification criteria matching those used throughout the analysis.
5. Discussion
This meta-synthesis of 123 documented coastal landscape interventions reveals both the promise and limitations of current nature-based adaptation practice, as represented in the peer-reviewed literature. While the diversity of implemented typologies demonstrates growing sophistication in coastal adaptation strategies, persistent gaps in performance monitoring, climate integration, and institutional capacity constrain the development of evidence-based practice. The findings highlight critical disconnects between the scientific understanding of coastal risks and operational design implementation, while also revealing significant geographic disparities in evidence quality that threaten equitable adaptation outcomes.
5.1. Design Typologies and Project Framing Reveal Practice Maturation
The seven intervention typologies identified in this meta-synthesis reveal how coastal adaptation is evolving from singular ecological restoration efforts to more complex, hybridized, and multifunctional design strategies. The continued dominance of Marsh/Wetland Restoration (37.4%) confirms the practical reliability and ecological familiarity of these interventions—“low-regret” solutions that offer both risk reduction and habitat benefits with established implementation pathways. The underrepresentation of Urban Green/Resilience strategies (8.9%) reflects an evidence gap rather than a lack of relevance. Multifunctional urban coastal spaces are likely documented in municipal reports and design briefs that fall outside the academic literature, suggesting a priority area for research translation and the systematic documentation of urban implementation outcomes.
While Flood Risk Reduction (30.9%) remains the dominant narrative, the rise in Climate Resilience (24.4%) and Ecological Restoration (16.3%) reflects growing institutional alignment with long-term adaptation thinking. The lack of significant association between intervention types and framing strategies (, ) reveals strategic opportunities for improved institutional alignment, where hybrid systems could leverage restoration narratives to access ecological funding streams while maintaining their resilience focus.
Community Monitoring as an Integration Catalyst: Community monitoring projects demonstrate significantly higher ecosystem services integration across multiple categories, particularly cultural services (36.4% vs. 6.9%, ), reflecting emphasis on recreational amenities, esthetic values, and public space creation. The complete absence of provisioning services in community monitoring projects (0% vs. 9.9% for other approaches) indicates the prioritization of non-extractive, public benefit outcomes over commercial resource utilization.
These projects addressed an average of 1.05 ecosystem service categories compared to 0.71 for other approaches (), demonstrating a significantly higher maintenance focus (77.3% vs. 52.5%, ) and an enhanced monitoring quality (mean score 1.64 vs. 0.76, ). The scale-independence of community monitoring (, ) demonstrates that participatory approaches are equally viable across project sizes, offering opportunities for systematic integration across diverse coastal contexts without scale-dependent constraints.
5.2. Critical Evidence Gaps and Climate Integration Failures
Despite no studies omitting monitoring entirely, fundamental limitations constrain the field’s capacity for evidence-based advancement. The monitoring quality assessment revealed a mean score of 0.89 out of 5.0, with 30.1% offering only ambiguous monitoring (), 55.3% using basic single methods (), and zero projects achieving comprehensive adaptive monitoring standards. Higher quality monitoring correlated significantly with explicit SLR integration (, ), establishing monitoring rigor as a predictor of climate-informed design practice, while highlighting disconnects between evaluation capacity and measurable outcomes.
Only 18 projects (14.6%) reported quantifiable metrics, with Marsh/Wetland Restoration showing the highest rates (21.7%), with significant variation across intervention types. Duration information was available for only 46 projects (37.4%), with dynamic or adaptive monitoring appearing in merely six projects (4.9%), revealing substantial gaps in adaptive management capacity essential for climate-responsive coastal interventions.
Sea Level Rise Integration Reveals Science–Practice Disconnect: The operational classification revealed minimal explicit SLR integration, with only five studies (4.1%) demonstrating both climate scenario references and quantitative design parameters. While 95.9% of projects acknowledge SLR, the majority (79.7%) provided only background framing without meaningful connection to design specifications. No projects used standardized IPCC scenario frameworks (0 projects used RCP scenarios and 0 used SSP scenarios), though 5 projects included quantitative SLR values. This science–practice gap reveals that while climate awareness is widespread, translating this awareness into operational design parameters remains a fundamental challenge.
5.3. Geographic Inequities and Implementation Barriers
Regional distribution shows a systematic underrepresentation of high-risk regions—Africa (4.1%), Latin America (2.4%) versus concentration in North America (27.6%) and Europe (17.1%). Paradoxically, Africa demonstrated the highest rate of specific monitoring documentation (80%), while Multi-Region/Global studies showed the lowest (45.5%). North America exhibits the most diverse monitoring portfolio with the highest absolute numbers across categories, while community-based monitoring concentrates in the Asia—Developing () and Other regions (), with complete absence in Europe and Latin America.
Implementation barriers were reported in 67 studies (54.5%), with three dominant challenges each affecting 20.3% of projects—Technical Constraints, Institutional Barriers, and Data Limitations. The convergence of these primary barriers suggests that successful implementation requires coordinated capacity-building approaches rather than addressing individual constraints in isolation. Systematic outcome classification revealed 54 projects (43.9%) with positive outcomes versus 19 projects (15.4%) reporting challenges. However, these success rates likely overestimate intervention effectiveness due to the systematic exclusion of terminated or failed projects from the published literature, representing survivorship bias where only successfully completed projects reach documentation and peer review stages.
The limited adoption of integrated mixed-methods monitoring (1.6% of projects) reflects institutional silos and resource constraints, preventing multidisciplinary assessment integration across all regions, regardless of resource availability.
5.4. Framework for Evidence-Based Implementation
The correlation between monitoring quality and sustainability outcomes demonstrates that rigorous evaluation frameworks are not merely assessment tools but fundamental enablers of climate-responsive design practice. Projects must embed multidimensional monitoring protocols from inception, incorporating climate scenario thresholds directly into design specifications. The systematic underrepresentation of high-risk regions requires targeted capacity-building investments where monitoring and institutional infrastructure remain underdeveloped.
For practitioners, this evidence foundation demands proactive engagement with data planning, advocacy for cross-sectoral performance metrics, and the integration of climate thresholds into core design logic. The transition from promising pilots to robust, replicable interventions depends on cultivating an evidence base that is both technically rigorous and globally accessible, requiring systematic documentation of both successes and failures, standardized reporting protocols enabling cross-project learning, and institutional frameworks supporting long-term adaptive management across diverse geographic and socioeconomic contexts.
5.5. Study Limitations and Future Research Directions
This meta-synthesis exhibits several limitations. The focus on the peer-reviewed literature may underrepresent community-based interventions, while geographic bias toward well-resourced regions limits generalizability to contexts where coastal risks are most acute. The systematic absence of project scale documentation (2.4% of studies) highlights the urgent need for standardized spatial extent reporting protocols. This systematic review exhibits survivorship bias by focusing on implemented interventions while excluding terminated projects, with findings representing “best-case scenario” coastal adaptation practice under favorable implementation conditions.
Critical areas for future investigation include (1) longitudinal performance studies tracking intervention effectiveness under changing climate conditions; (2) the systematic documentation of project failures and adaptive management responses; (3) the development of standardized monitoring protocols integrating ecological, engineering, and social metrics; (4) enhanced focus on evidence generation in underrepresented regions; and (5) the investigation of scale-dependent factors affecting monitoring quality and implementation success.
Inter-rater reliability demonstrated acceptable-to-substantial agreement across all variables (mean ), including the following: intervention typology (), project framing (), monitoring approaches (), and SLR integration (). The high agreement for SLR integration reflects the effectiveness of operational criteria requiring both climate scenario references and quantitative design parameters for explicit integration classification.
6. Conclusions
This meta-synthesis of 123 documented coastal landscape interventions addresses critical gaps at the intersection of coastal science and landscape practice in the peer-reviewed literature.
The findings reveal both the promise and limitations of current nature-based coastal climate adaptation. Seven intervention typologies emerged, with Marsh/Wetland Restoration dominating (37.4%) and Hybrid Engineered Systems (16.3%) representing evolution toward multifunctional solutions. However, critical gaps persist that constrain effective adaptation scaling—only 1.6% employed integrated monitoring approaches and 30.1% provided ambiguous performance documentation. Meanwhile, 95.9% of projects acknowledge sea level rise and only 4.1% explicitly integrate climate projections into design parameters.
Regional Patterns and Capacity Disparities: Geographic analysis exposed complex regional patterns challenging simple developed/developing distinctions. Africa demonstrated the highest specific monitoring documentation (80%), while Multi-Region/Global studies showed the lowest rates (45.5%). These patterns reflect different institutional priorities and methodological traditions rather than simply resource availability, pointing toward targeted, region-specific capacity development needs. The systematic underrepresentation of high-risk regions (Africa: 4.1%; Latin America: 2.4%) versus concentration in well-resourced areas (North America: 27.6%; Europe: 17.1%) reveals critical evidence generation inequities where adaptation needs are most urgent.
Monitoring Quality as a Design Determinant: Systematic monitoring quality assessment (mean score 0.89/5.0) reveals critical capacity gaps, with higher quality monitoring being significantly correlated with explicit SLR integration (, ). The correlation between monitoring quality and sustainability outcomes demonstrates that rigorous evaluation frameworks are fundamental enablers of climate-responsive design practice rather than merely assessment tools.
Community Engagement and Social–Ecological Integration: Community monitoring approaches demonstrate significantly higher ecosystem services integration, particularly cultural services (36.4% vs. 6.9%, ) and supporting services (54.5% vs. 35.6%), confirming that participatory engagement enhances both social acceptance and ecological sustainability. Community monitoring projects also showed a higher maintenance focus (77.3% vs. 52.5%, ) and an enhanced monitoring quality (mean score 1.64 vs. 0.76, ), establishing community engagement as being essential for developing adaptive coastal management capacity and long-term intervention maintenance.
Research Contributions and Practical Applications: This research contributes systematic typological frameworks and implementation guidance that provide actionable direction for practitioners while identifying priorities for scaling effective coastal adaptation. The evidence-based typology × framing analysis reveals strategic opportunities for institutional alignment, while the monitoring quality framework provides replicable assessment criteria for evaluating coastal adaptation rigor. Inter-rater reliability demonstrated acceptable-to-substantial agreement across all variables (mean ), validating the systematic classification approach and ensuring reproducible methodology for future coastal adaptation research.
Future Research Priorities: Several critical areas emerge for future investigation. Longitudinal performance studies are urgently needed to understand the long-term effectiveness and adaptive capacity of different intervention types under changing climate conditions, integrating ecological, engineering, and social metrics. Climate scenario integration requires developing tools and protocols that enable landscape designers to translate SLR projections into spatial design parameters, elevation thresholds, and adaptive management triggers. Equity and justice analysis should examine how different intervention types affect vulnerable coastal communities, ensuring that nature-based solutions contribute to just adaptation outcomes.
Research should develop systematic approaches to document implementation failures through enhanced gray literature analysis and institutional partnerships in order to provide a complete understanding of coastal adaptation success and failure patterns, while prioritizing evidence generation in underrepresented regions through institutional support for integrated monitoring approaches. The systematic absence of project-scale documentation (2.4% of studies) highlights the urgent need for standardized spatial extent reporting protocols to enable a scale-stratified analysis of monitoring effectiveness and implementation outcomes.
Given the geographic limitations of this review and the survivorship bias inherent in focusing on successfully implemented interventions, future research must prioritize the systematic documentation of coastal adaptation practice in underrepresented regions and the systematic inclusion of terminated or failed projects. This comprehensive evidence base is essential for developing coastal adaptation strategies that are both scientifically rigorous and globally relevant to the diverse contexts facing accelerating sea level rise.
