Article

An Evaluation Framework for Regional Ecological Security Pattern Quality: A Case Study of the Taihang–Qinling Intersection Zone, China

1
College of Resources and Environment, Henan Agricultural University, Zhengzhou 450046, China
2
Henan Engineering Research Center of Land Consolidation and Ecological Restoration, Zhengzhou 450046, China
3
School of Engineering Management and Real Estate, Henan University of Economics and Law, Zhengzhou 450046, China
4
College of Resources and Environment, Huazhong Agricultural University, Wuhan 430070, China
*
Author to whom correspondence should be addressed.
Land 2025, 14(9), 1706; https://doi.org/10.3390/land14091706
Submission received: 23 July 2025 / Revised: 19 August 2025 / Accepted: 21 August 2025 / Published: 23 August 2025
(This article belongs to the Section Landscape Ecology)

Abstract

Scientific evaluation of ecological security pattern (ESP) quality provides a crucial foundation for regional ecological protection and spatial planning. Addressing the problem that current research on ESP quality generally lacks a systematic evaluation framework and excessively relies on qualitative descriptions, this study aims to explore a scientific and quantitative evaluation method for ESP quality. By combining landscape pattern and ecological network analysis, this study develops an evaluation framework for regional ESP quality that encompasses 12 key factors and utilizes parallel coordinate plots for visualization. Applying this framework, this study quantified the spatiotemporal evolution characteristics of ESP quality in the Taihang–Qinling intersection zone, China, from 2000 to 2020. The findings were as follows: (1) Both the number and total area of ecological sources increased markedly, accompanied by heightened spatial heterogeneity of the ecological resistance surface. The number of ecological corridors rose, although their total length decreased. Ecological strategic points increased substantially. (2) Despite the increase in the scale of ecological sources and the number of corridors, considering the comprehensive impact of multiple evaluation factors, the overall ESP quality declined across the region. In particular, the Taihang and Qinling Mountain regions experienced degradation, whereas the Songji Mountains region showed improvement. (3) This study discussed an ecological protection and restoration scheme comprising the Taihang ecological barrier region, the Songji ecological restoration region, and the Qinling ecological conservation region, and formulated region-specific optimization strategies. Overall, the proposed evaluation framework and local quality analysis methods of ESP in this study offer new perspectives for advancing ecological planning research.

1. Introduction

With the advancement of urbanization and the continuous pressure from human activities, ecosystems are under increasing stress. As a critical pillar for ecosystem stability, the ecological security pattern (ESP) has become increasingly significant [1,2,3]. ESP refers to the spatial pattern composed of various landscape elements, spatial locations, and their interconnections, aiming to coordinate conflicts between ecological protection and human development and ensure the sustainable supply of ecological services through the scientific allocation of ecological elements [4]. On the one hand, a well-structured ESP provides a solid guarantee for the ecosystem, maintaining its integrity and stability and directly affecting both human well-being and ecosystem health. On the other hand, damage to the ESP leads to challenges such as ecological space fragmentation, degradation of ecosystem services, and biodiversity loss, all of which restrict regional sustainable development capacity [5,6,7]. The Chinese government has recognized the significance of ecological security for national development and public welfare. To enhance ecosystem protection and restoration, establish regional ESPs, promote green economic and social transformation, and achieve sustainable development, the government has prioritized ecological security, incorporated ecological civilization construction into the “Five-sphere Integrated Plan”, and implemented comprehensive policies for the integrated protection and restoration of mountain, water, forest, farmland, grassland, and desert ecosystems [8,9]. In this context, research on regional ESP quality can help identify existing challenges in regional ESP, provide a basis for formulating precise ecological protection and restoration strategies, and fulfill the requirements for comprehensive ecological civilization advancement and regional sustainable development.
The theory of ESP originated from the “pattern–process” interaction research in landscape ecology in the late 20th century. The theory emphasizes optimizing land use and ecosystem management within specific geographical spaces to construct a spatial pattern that can ensure ecological security, maintain ecosystem service functions, and resist natural disasters and human disturbances [1]. Foreign-related research started earlier. Initially, Western scholars put forward the concept of urban growth boundary to address the issue of unordered urban expansion [10,11]. Subsequently, in response to the decline in the quality of wildlife habitats, European scholars proposed ecological networks aimed at nature conservation [12,13]. In the 1990s, Yu et al. took the lead in putting forward the concept of landscape ecological security pattern in China, emphasizing the critical role of key spatial patterns in landscape for controlling ecological processes [1]. On this basis, Ma et al. proposed the concept of regional ecological security pattern, focusing on biodiversity conservation and ecosystem integrity [14]. Currently, research by domestic and international scholars on ESPs mainly centers on three areas: construction, evaluation, and optimization [15,16]. For construction, a fundamental paradigm of “ecological source identification–ecological resistance surface construction–ecological corridor extraction” has been established [17,18,19,20]. Ecological source identification commonly employs comprehensive evaluation, morphological spatial pattern analysis, and grain size inversion methods [21,22,23,24]. Ecological resistance surface construction typically uses resistance correction methods and the ecological security index [25,26]. Ecological corridor extraction mainly utilizes the minimum cumulative resistance model [27,28], circuit theory [29,30], and the gravity model [31,32]. For ecological security evaluation, prevailing studies often adopt the PSR (Pressure–State–Response) model and the ecological footprint model [33,34,35,36] but generally lack a systematic framework for ESP evaluation and analysis [37,38]. After identifying the ESP, most studies rely on qualitative descriptions for ecological function regionalization and pattern evaluation [39,40,41]. Some scholars have attempted to quantitatively evaluate ESPs from a topological network perspective, though often in a simplified manner [42,43,44,45,46]. For example, Yu et al. used graph theory to assess ESPs based on three structural characteristics: cycle degree, average connectivity, and possible connectivity rate [47]. Overall, existing research has primarily focused on evaluating the overall quality of ESPs [41,44] while largely neglecting local quality evaluation. However, He et al. addressed the community structure within ecological networks, employing the cohesive subgroup method to divide groups and assess regional stability [48]. For optimization, most studies integrate urban planning with regional development strategies, outline ecological protection regions based on ecological element characteristics, and then propose targeted optimization strategies [49,50,51]. With advancements in network analysis methods, some studies simulate disturbance scenarios to clarify robustness thresholds in ecological networks and formulate corresponding optimization strategies [52,53,54].
In summary, although substantial progress has been made in research on ESPs, several issues remain. Existing studies often emphasize identification over evaluation, and notably lack comparative quality evaluation of whole regions across different periods or of local regions within the same period [55]. Even if there are a small number of quality evaluation studies, they mostly rely on qualitative description or select isolated factors for simple quantification. The general lack of a systematic framework for ESP assessment and analysis makes it difficult to form a comprehensive and in-depth assessment. Therefore, this study focused on two main aspects. First, by comprehensively considering the interactions among ecological sources, resistance surfaces, ecological corridors, and ecological networks, this study integrated landscape pattern and ecological network analysis methods to construct a more scientific and robust framework for evaluating ESP quality. Second, by combining community detection methods with cost allocation analysis, this study outlined ecological regions to propose a method for local quality evaluation of the ESP within the evaluation framework. The construction of this framework not only makes up for the deficiencies in the evaluation systems of existing studies but also provides a standard for cross-temporal and multi-scale comparisons of ESP quality.
The Taihang–Qinling intersection zone serves as a typical ecological multifunctional area and a key biodiversity area in China. The zone stretches across the hinterland of China, serving as an ecological hub connecting the North China Plain with the middle and lower reaches of the Yangtze River. At the same time, the zone spans the Yellow River and Huaihe River basins, carrying the core function of maintaining regional biodiversity. The zone’s ecological status is directly related to the stability of the national ecological barrier and the sustainability of regional development. However, current research on this zone mostly focuses on identifying static ESP, with obvious deficiencies in the dynamic spatiotemporal evolution and comprehensive quality evaluation of ESP. Crucially, the scientific evaluation of ESP quality constitutes the foundational basis for accurately identifying ecological problems and optimizing protection strategies. Therefore, this study adopted landscape ecology theory and ecological network analysis to construct a framework for evaluating ESP quality. By selecting three key policy time points—2000 (priority to economic development), 2010 (initiation of eco-construction), and 2020 (emergence of eco-construction effects)—this study explored spatiotemporal evolution characteristics of ESP quality in China’s Taihang–Qinling intersection zone.
The study is organized as follows: Section 1 reviews previous studies, particularly emphasizing the limitations of previous studies and the improvements made in this study. Section 2 elaborates on the construction of the ESP quality evaluation framework, explaining the significance of the study area and data sources, and detailing the specific methods adopted for ESP identification, ecological network topological structure analysis, and ESP quality evaluation. Section 3 applies the proposed framework to conduct practical analysis on the overall and local quality of China’s Taihang–Qinling intersection zone, obtaining the research results. Section 4 discusses the regional ecological protection and restoration pattern, exploring regionally differentiated optimization strategies based on the above research results. Section 5 concludes the study with implications and directions for future research.

2. Materials and Methods

2.1. Study Area

This study focused on the Taihang–Qinling intersection zone in China, located at the junction of Shanxi, Shaanxi, and Henan Provinces. This area serves as an important geographical boundary and ecological barrier in China (Figure 1). The delineation follows the general principle of preserving the integrity of the natural ecosystem. Geographically, the zone lies between 33°50′–35°52′ N and 110°29′–113°68′ E, with the Taihang Mountains and Qinling Mountains forming its core. The zone includes the central Luoyang Basin and its surrounding mountain ecosystems, and is bordered by the Wangwu Mountains to the north, the Funiu Mountains to the south, the Zhongtiao Mountains to the west, and the Songshan Mountains to the east. This delineation avoids fragmenting natural ecological units that would result from using administrative boundaries as the study area. The zone spans the Yellow River and Huaihe River basins, with particular emphasis on the Yellow River and its main tributaries, the Yihe and Luohe Rivers. The Yellow River, regarded as the mother river of the Chinese nation and the second longest river in China, is central to ecological protection and high-quality development, which have become national strategic priorities. The middle reaches of the Yellow River, where the study zone is located, play a critical role in advancing sustainable development across the basin. The climate in the region transitions from northern subtropical to warm temperate zones, and topographically, the area lies between the second and third terraces, featuring complex landforms and abundant ecological resources. The zone contains several national nature reserves, including the Henan Taihangshan Macaque National Nature Reserve, the Yellow River Wetland National Nature Reserve, and the Xiaoqinling National Nature Reserve, all of which contribute to its high ecological value. The total area of the zone is 66,772.5 km2, covering 14 cities such as Zhengzhou, Luoyang, Jiaozuo, Sanmenxia, and Yuncheng. Economic development levels vary significantly within the region. Core cities such as Zhengzhou are relatively advanced, whereas some mountainous cities lag behind. Economic development demands have driven changes in land use patterns. Simultaneously, rapid urbanization and industrialization have exerted considerable pressure on the regional ecological environment, resulting in prominent issues such as a reduction in ecological land and increasing environmental pollution. Therefore, assessing the ESP quality in the Taihang–Qinling intersection zone will contribute to a scientific understanding of the structure and functions of the regional ecosystem, support the implementation of targeted ecological protection and restoration, and further promote coordinated ecological and economic development.

2.2. Research Methods

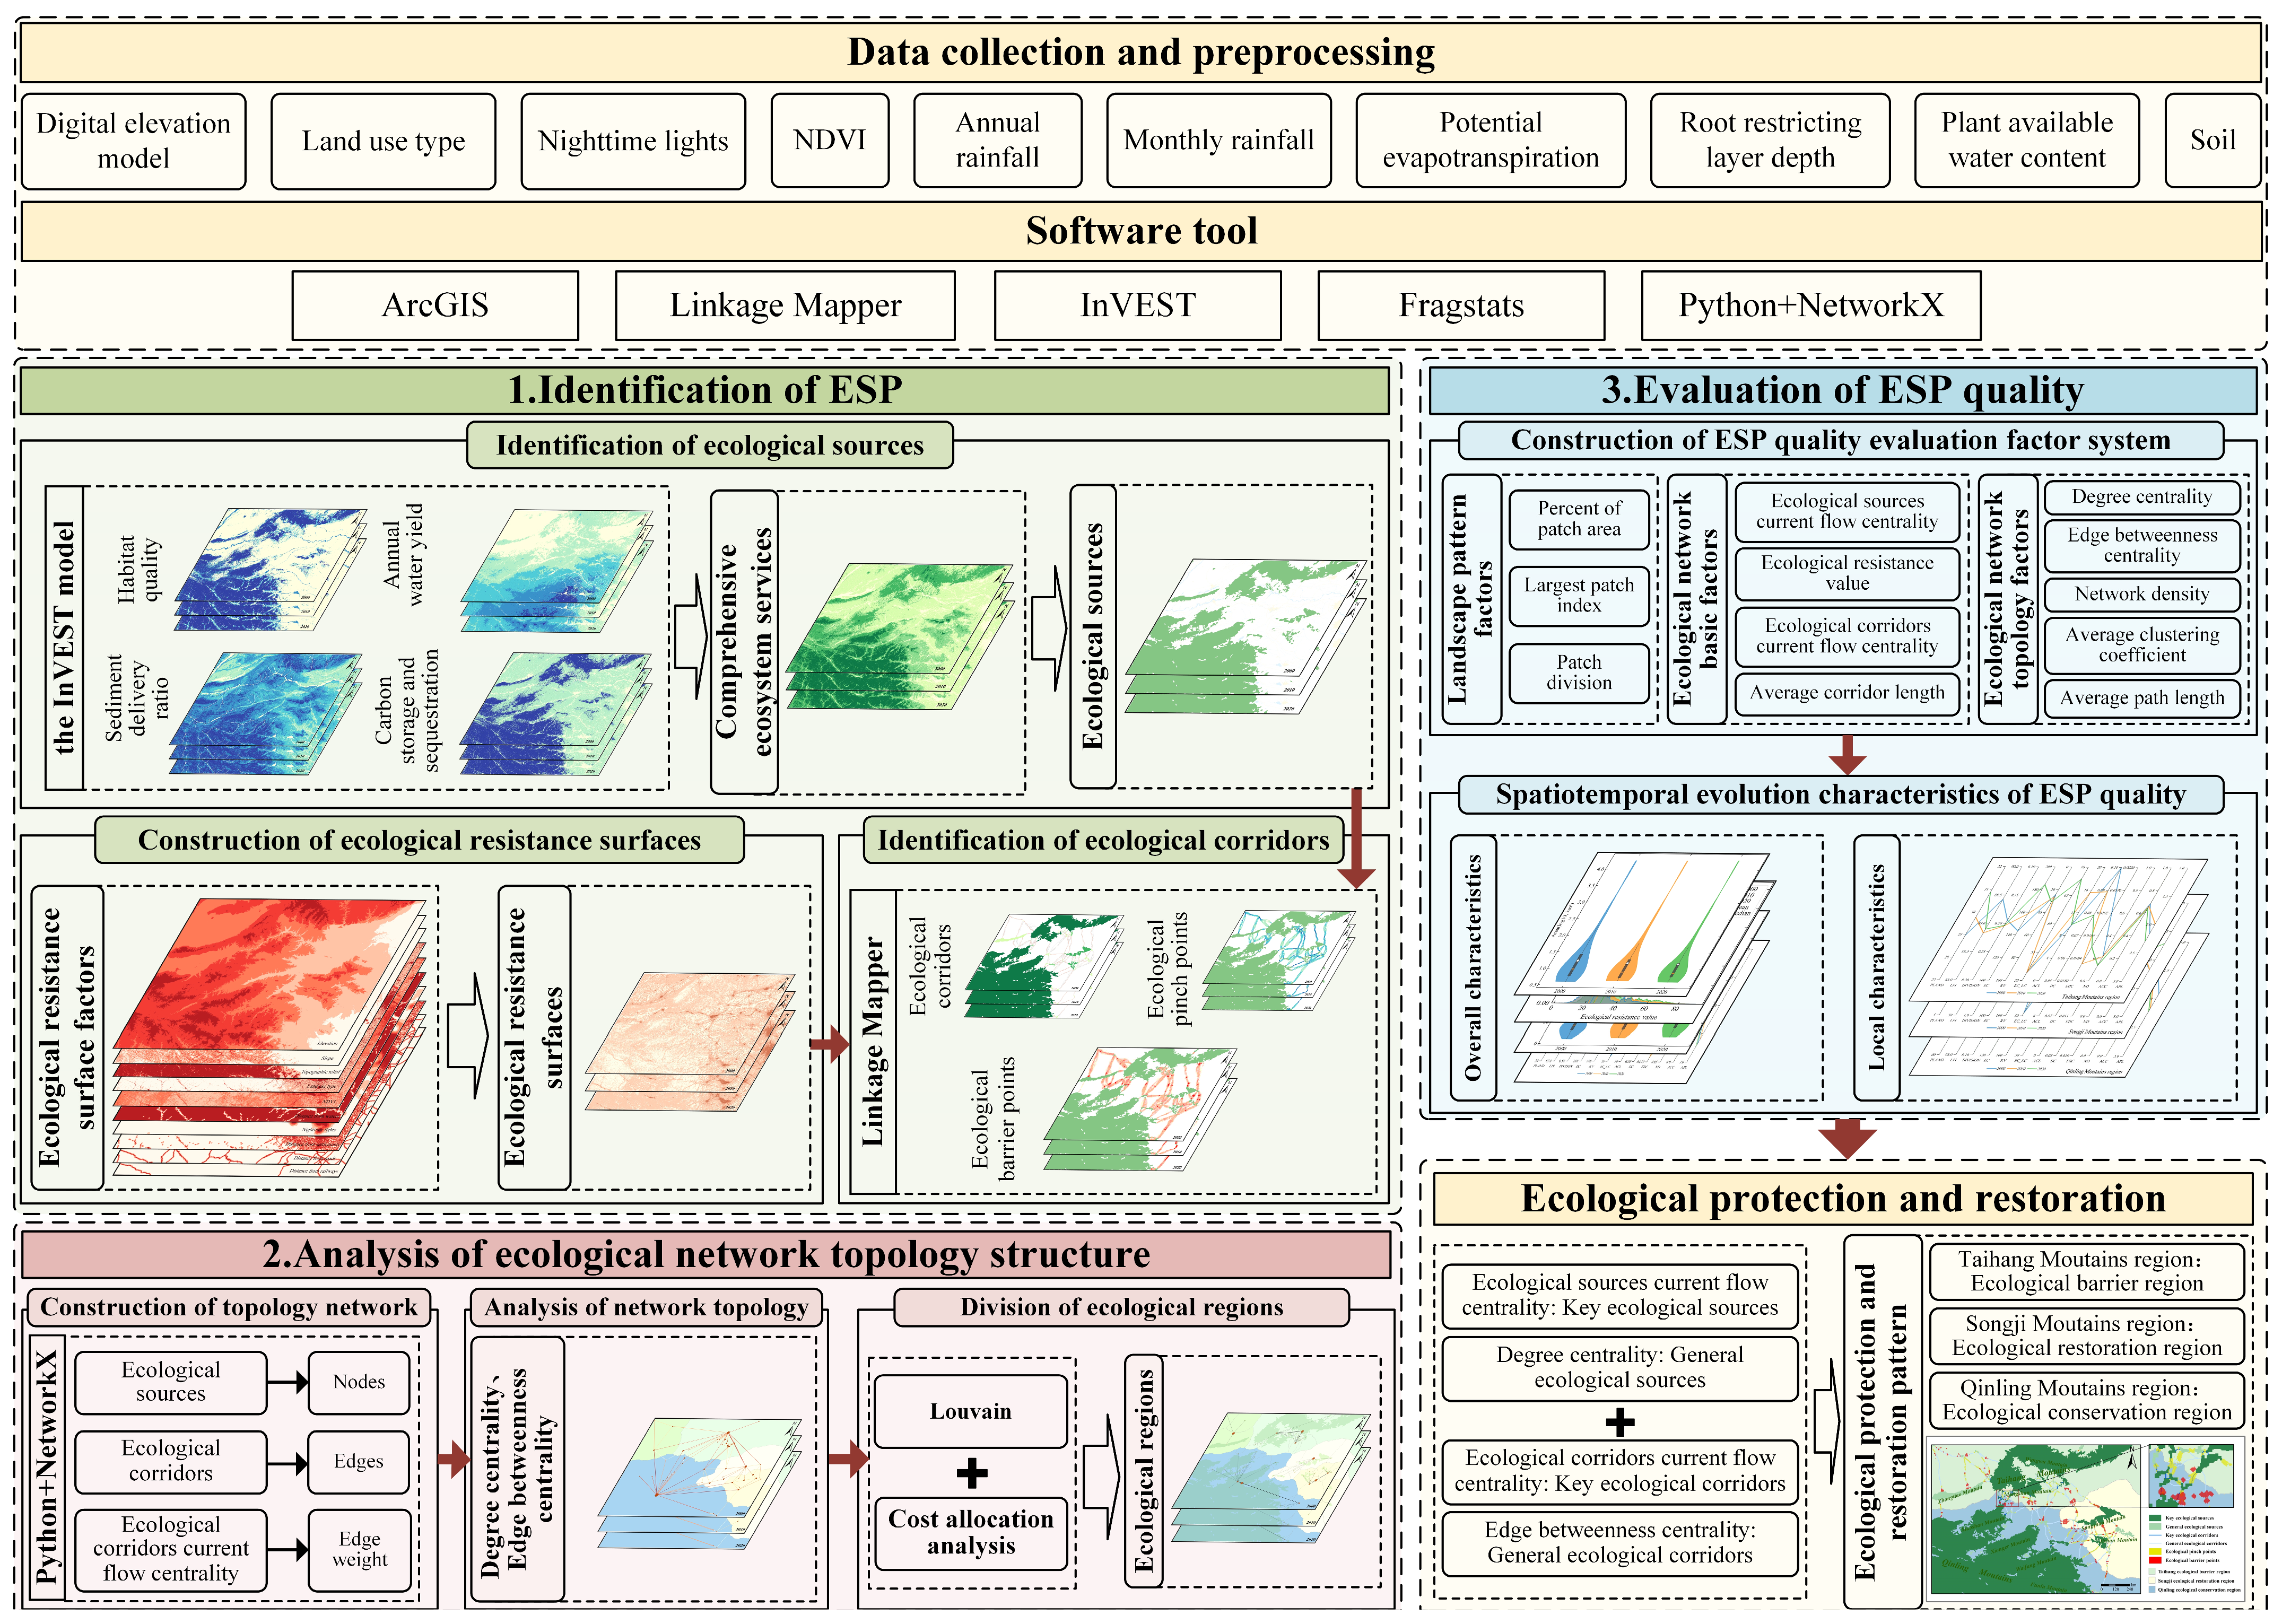
This study systematically investigated the spatiotemporal evolution characteristics of the ESP and its quality in the Taihang–Qinling intersection zone from 2000 to 2020 (Figure 2). The specific research contents and methods were as follows: (1) Identification of ESP: A comprehensive ecosystem service evaluation factor system was developed using the InVEST (Integrated Valuation of Ecosystem Services and Tradeoffs) 3.14.2 model. Patches with high comprehensive value were selected as ecological sources. Ten natural and socio-economic resistance factors were selected to construct the ecological resistance surface factor system, thereby generating a comprehensive ecological resistance surface. Linkage Mapper 3.0.0 software was then used to identify ecological corridors and strategic points based on the minimum cumulative resistance model and circuit theory, thus identifying the ESP. (2) Analysis of ecological network topological structure: The ESP was abstracted into an ecological network. The community detection algorithm from complex network theory, combined with ArcGIS 10.8 cost allocation analysis, was applied to outline ecological regions within the study area. This method facilitated an in-depth exploration of the spatiotemporal evolution characteristics of local ESPs. (3) Evaluation of ESP quality: Based on landscape ecology and ecological network theory, an evaluation system for ESP quality was constructed. The spatiotemporal evolution characteristics of ESP quality were analyzed using parallel coordinate plots.

2.2.1. Identification of ESP

(1)
Identification of Ecological Sources
Ecological sources are not only the foundation for constructing the ESP but also the core regions for providing key ecological service functions. Consequently, the identification of ecological sources should focus on ecosystem service capacity. Specifically, biodiversity maintenance is the basis for species habitation and diffusion; water resource supply and regulation are related to regional water security and hydrological stability; soil conservation directly contributes to maintaining land productivity and controlling soil erosion; and carbon storage can quantify the contribution of ecosystems to mitigating climate change. The intensity and stability of these service functions collectively determine the overall effectiveness of the ecosystem service capacity of ecological sources. Therefore, referring to previous studies [56,57] and the ecological background of the study area, four evaluation factors—habitat quality, annual water yield, sediment delivery ratio, and carbon storage and sequestration—were selected to construct a comprehensive ecosystem service evaluation factor system (Table 1). The dimensional differences among factors were eliminated using range standardization. Subsequently, referring to previous studies [58,59,60,61], this study applied the equal-weight overlay method to conduct spatial superposition analysis and calculate comprehensive ecosystem service values. Finally, this study used Python 3.11.9 and ArcGIS 10.8 to extract the regions accounting for the 25%, 30%, and 35% quantile standards of the service values over the three years as ecological sources, respectively. By comprehensively comparing the results of spatial overlay analysis between these extraction results and the land use data of the same period, it was found that the extraction result based on the 30% quantile standard was most consistent with the actual situation. Combined with the statistical distribution characteristics of the data, the regions corresponding to this quantile were finally selected as the ecological source.
(2)
Construction of Ecological Resistance Surfaces
Ecological resistance surfaces represent the degree of spatial obstruction to biological migration and quantify the cost of biological flow. The basis for constructing ecological resistance surfaces lies in the scientific selection of resistance factors, which need to accurately reflect both the background constraints of the natural environment on biological flow and the intensity of interference from socio-economic activities on biological flow. Specifically, elevation, slope, and topographic relief determine the difficulty of biological flow through the complexity of the surface; land use type and NDVI affect the resistance to biological circulation through differences in habitat quality; distance from water indirectly influences the willingness and efficiency of biological flow through water accessibility; nighttime lights can reflect the intensity of human activities, which is related to the risks of biological flow; distance from settlements, distance from roads, and distance from railways affect biological flow by disrupting habitat continuity through artificial interference. Based on the above, and with reference to existing studies [62,63,64,65], six natural environmental resistance factors were selected: elevation, slope, topographic relief, land use type, normalized difference vegetation index (NDVI), and distance from water. In addition, four socio-economic resistance factors were considered: nighttime lights, distance from settlements, distance from roads, and distance from railways (Table 2). Applying the analytic hierarchy process (AHP), this study determined the weights of each factor by building a judgment matrix and passing the consistency test. ArcGIS 10.8 was used for range standardization and weighted overlay analysis to generate the comprehensive ecological resistance surface.
(3)
Extraction of Ecological Corridors and Ecological Strategic Points
Ecological corridors were identified using the Build Network and Map Linkages module of the Linkage Mapper toolbox, with the distance threshold set to 20 km. Cumulative current density was obtained using the Pinch Point Mapper module in “all-to-one” mode, and the improvement score was calculated with the Barrier Mapper module in “Maximum” mode. The minimum detection radius, maximum detection radius, and step size were set to 500 m, 2000 m, and 500 m, respectively. Similar to the method for extracting ecological sources, this study also set different standards and conducted a number of experiments. Considering the statistical distribution characteristics of current density and improvement scores, as well as the spatial distribution characteristics of strategic points and the rationality of their area sizes, we ultimately extracted ecological pinch points and ecological barriers based on the 98% quantile of the cumulative current density over the three years and the 95% quantile of the improvement scores over the three years, which ensures that all years adopt the consistent threshold standard. Additionally, the Centrality Mapper module was used to acquire the current centrality of ecological sources and corridors to assess their importance in biological circulation.

2.2.2. Analysis of Ecological Network Topology Structure

(1)
Construction of Topology Network
With ecological sources as nodes, ecological corridors as edges, and corridor current centrality as edge weights, weighted ecological networks for 2000, 2010, and 2020 were constructed using Python 3.11.9 and the NetworkX library. Five key topological factors were used to analyze the network structure: degree centrality (DC), edge betweenness centrality (EBC), network density (ND), average clustering coefficient (ACC), and average path length (APL). DC identifies key ecological nodes within the network; EBC evaluates the mediating function of corridors in maintaining network connectivity; ND reflects the overall degree of connection in the network; ACC represents the local clustering characteristics; and APL measures the efficiency of global connectivity. Systematic analysis of the network topology structure enables quantitative characterization of the ESP and reveals its spatial and temporal structural characteristics.
(2)
Division of Ecological Regions
To further analyze the local quality characteristics of the ESP, ecological regions were outlined using a combination of the community detection algorithm and the cost allocation method. This approach divides the study area into several spatial units with relatively consistent ecosystem characteristics and functions, providing a scientific basis for developing differentiated protection and restoration strategies. First, the Louvain algorithm from complex network science was applied to identify communities within the ecological network. Then, based on the ecological resistance surface, the ArcGIS cost allocation tool was used to outline the spatial influence range of each ecological node. The community detection results were overlaid with the cost allocation results to generate the final ecological regions. The combination of these methods not only reflects the hierarchical structure of the ESP but also identifies the characteristics of regional ecological security in a more scientific manner.

2.2.3. Evaluation of ESP Quality

Higher regional ESP quality possesses the capabilities of maintaining the stability of structure and function, effectively resisting external disturbances, and continuously providing ecological services [14]. Reflected in the spatial pattern, higher regional ESP quality includes the integrity of landscape structure, the stability of system functions, and the connectivity of ecological networks. Therefore, based on the above and referring to existing studies [12,29,46,66], this study employed a combined quantitative and qualitative analysis to construct an evaluation factor system for ESP quality, comprising 12 key factors (Table 3). Among them, landscape pattern factors can reflect the degree of ecological integrity and fragmentation. Specifically, PLAND and LPI directly indicate the spatial scale and dominance of core patches, while DIVISION quantifies the degree of landscape fragmentation. Ecological network basic factors can reflect the efficiency of material and energy flow between ecological elements. Specifically, EC and EC_LC measure the functional importance of ecological sources and the carrying capacity of corridors in connecting the network, respectively. RV reflects the intensity of barriers to biological flows. ACL affects migration costs and connectivity efficiency. Ecological network topological factors are used to measure the connectivity of the spatial structure of ecological networks. Specifically, DC and EBC reflect structural resilience by identifying network hub nodes and key corridors. ND, ACC, and APL reflect the rationality of network topology from the perspectives of node correlation, local aggregation, and overall flow efficiency, respectively. The combination of these factors can comprehensively and systematically measure ESP quality. Furthermore, in order to present the spatiotemporal evolution of regional ESP quality more clearly, visual analysis was conducted using parallel coordinate plots. The coordinate axes for negative factors such as DIVISION, RV, and APL were reversed so that an increase in value corresponds to quality improvement. This approach allows for comprehensive comparative analysis across multiple dimensions.

2.3. Data Sources

This study selected 2000, 2010, and 2020 as time points to systematically analyze the spatiotemporal evolution of ESP quality in the Taihang–Qinling intersection zone, China. The basic data used are divided into two main categories. The first category consists of eight datasets: digital elevation model, land use type, annual rainfall, monthly rainfall, potential evapotranspiration, root restricting layer depth, plant available water content, and soil data. These were used to calculate comprehensive ecosystem services during the identification of ecological sources. The second category includes four datasets: digital elevation model, land use type, nighttime lights, and NDVI, which were applied to quantify ecological resistance in constructing the ecological resistance surface (Table 4).

3. Results

3.1. Spatiotemporal Evolution Characteristics of ESP

3.1.1. Ecological Sources

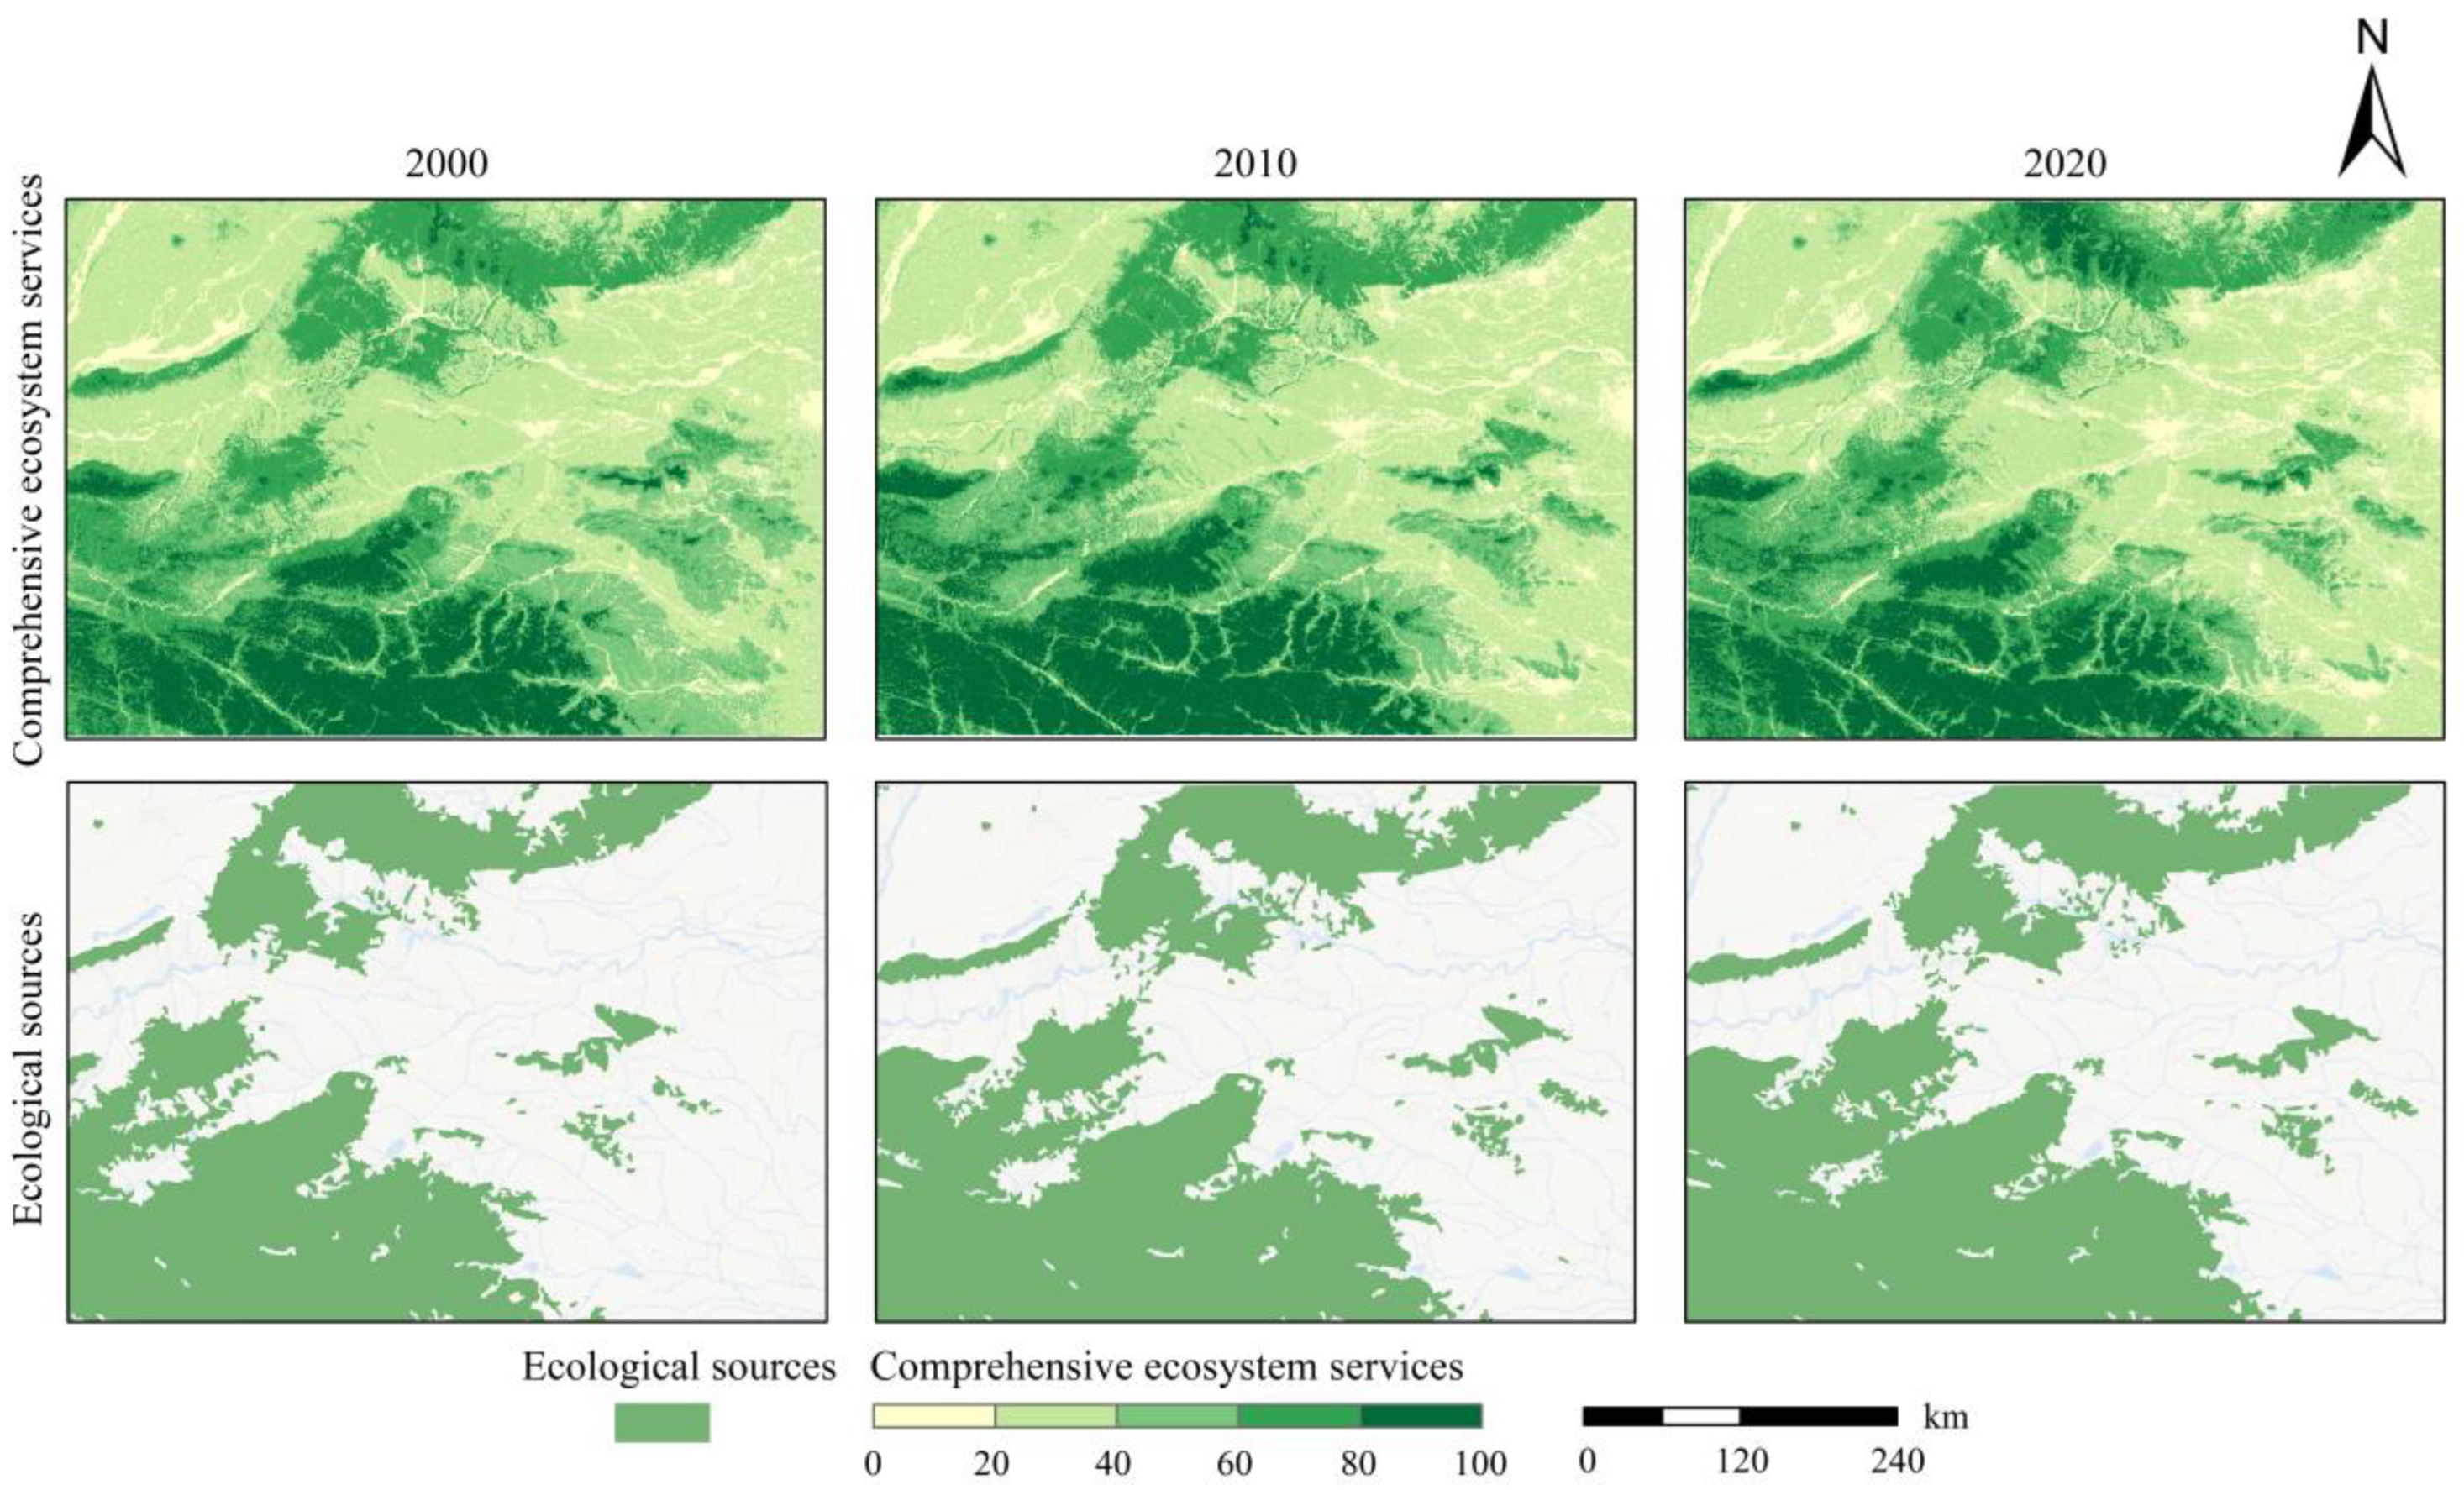
The spatial distribution of comprehensive ecosystem services (Figure 3) generally showed higher values in the southwest and lower values in the east. High-value regions were mainly located in the core areas of the Xionger, Waifang, and Funiu Mountains in the southwest, as well as the Wangwu Mountains in the north. Low-value regions were primarily concentrated near urban settlements. Regarding spatial changes in comprehensive ecosystem services (Figure 3), high-value regions improved, low-value regions declined, and spatial heterogeneity became more pronounced. Ecosystem services in the Wangwu and Zhongtiao Mountains in the north increased significantly, whereas the southeastern region showed a declining trend.
In this study, 49, 57, and 60 ecological sources were identified in 2000, 2010, and 2020, respectively, accounting for 39.60%, 41.01%, and 42.37% of the study area. The spatial distribution of ecological sources (Figure 3) showed that the largest sources were located in the core regions of the Xionger, Waifang, and Funiu Mountains in the southwest, as well as the Wangwu Mountains in the north. The eastern region contained relatively sparse ecological sources, consistent with the spatial distribution of comprehensive ecosystem services. Regarding spatial changes in ecological sources (Figure 3), both the number and area of ecological sources increased significantly, matching the spatial pattern of improvement in high-value ecosystem service regions. Specifically, the area of ecological sources in the Wangwu Mountains in the north, and the Songshan and Jishan Mountains in the east, increased markedly.

3.1.2. Ecological Resistance Surfaces

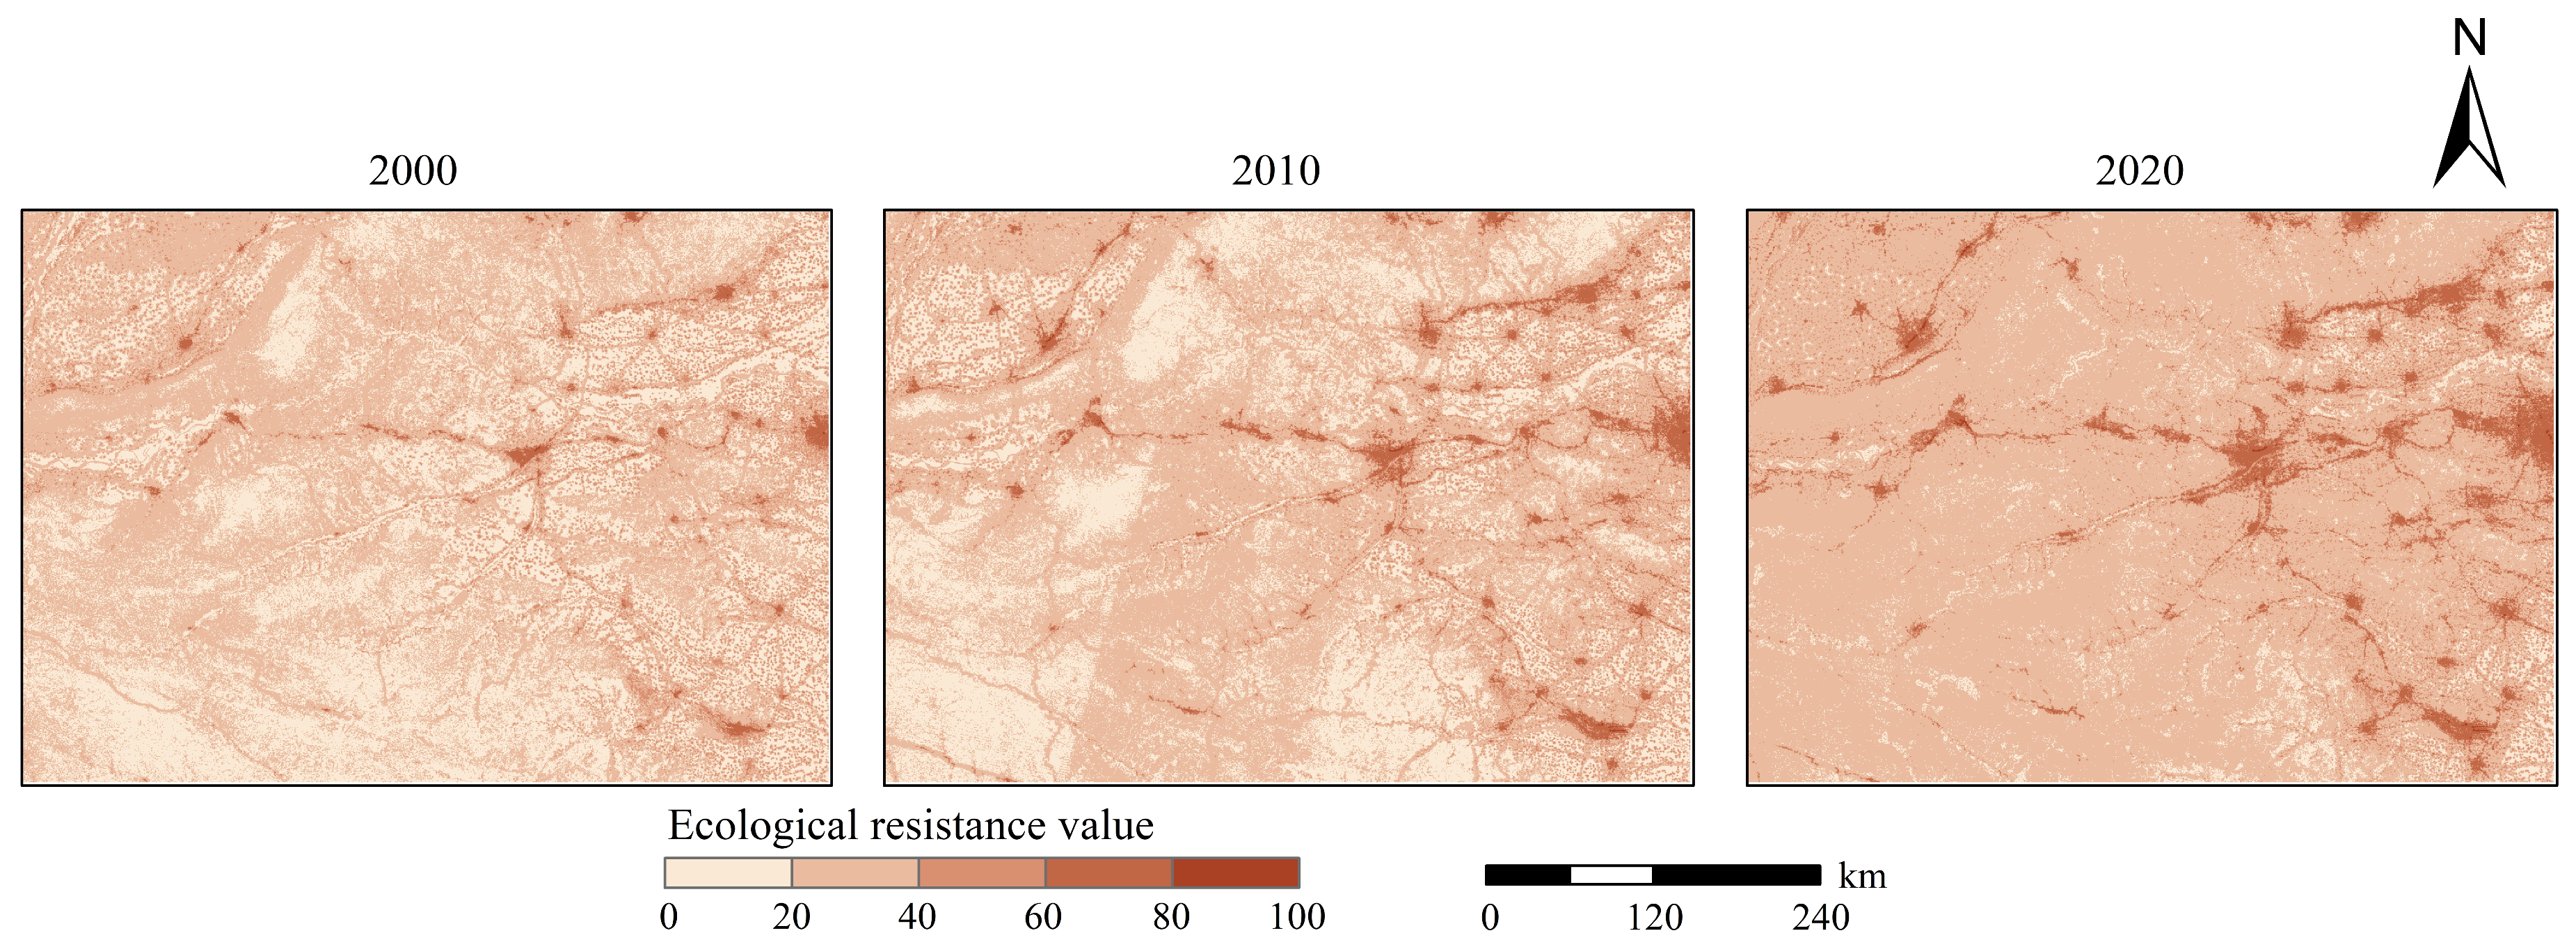
The spatial distribution of ecological resistance surfaces (Figure 4) generally showed higher values in the east and lower values in the southwest. High-value regions were mainly found in urban settlements and surrounding transportation hub areas, while low-value regions were concentrated in the Xionger, Waifang, and Funiu Mountains in the southwest, as well as the Wangwu Mountains in the north. Regarding spatial changes in ecological resistance surfaces (Figure 4), an overall increasing trend was indicated, with resistance values rising most significantly in urban settlements and adjacent transportation hubs.

3.1.3. Ecological Corridors and Ecological Strategic Points

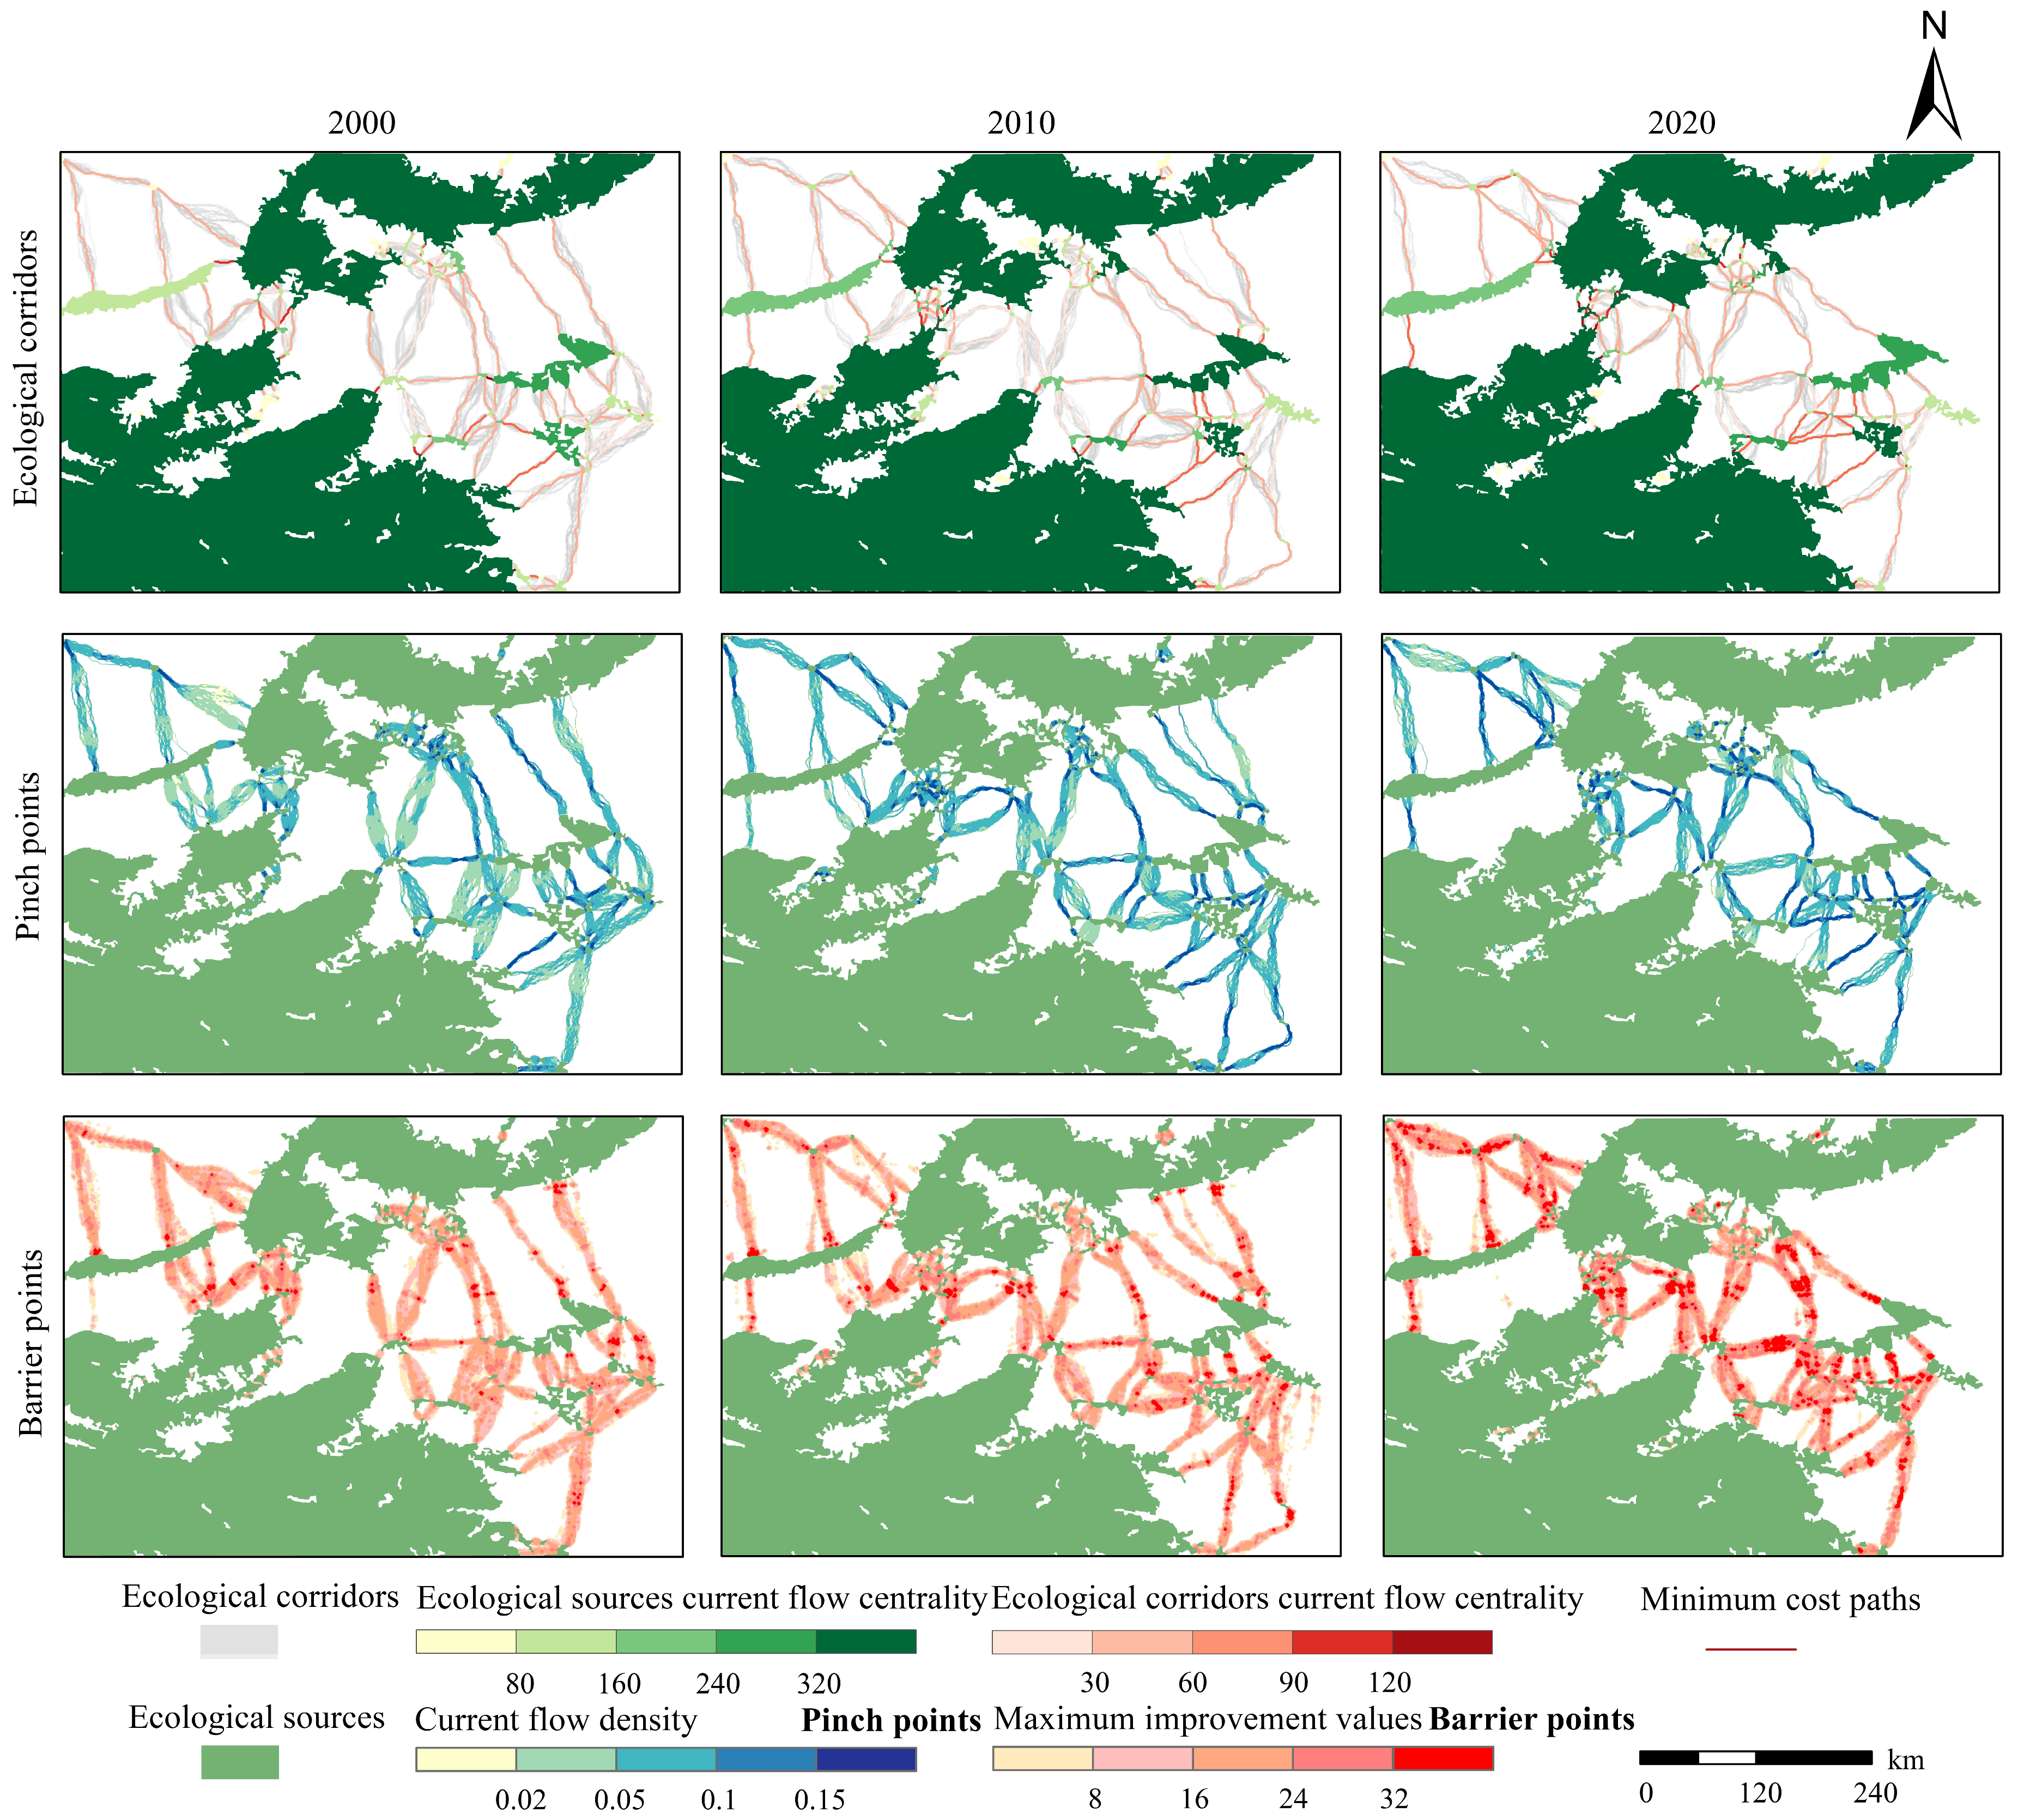
This study identified 116, 135, and 140 ecological corridors in 2000, 2010, and 2020, with average lengths of 16.25 km, 15.67 km, and 13.51 km, respectively. The number of ecological corridors increased, whereas the average length decreased. Spatially, ecological corridors (Figure 5) generally extended from northwest to southeast, with high-density corridors around the Songshan and Jishan Mountains in the east. Newly added corridors were mainly distributed in the central region, while those in the east decreased substantially.
The spatial distribution of EC (Figure 5) generally showed that larger sources had stronger current centrality, whereas smaller sources had weaker centrality. High-value regions were mainly located in the southwestern Qinling Mountains and the northern Wangwu Mountains. The current centrality of ecological sources showed significant increases in the Zhongtiao Mountains in the west and the Jishan Mountains in the east. The spatial distribution of EC_LC (Figure 5) generally showed that shorter corridors had stronger current centrality, whereas longer corridors had weaker centrality. High-value regions were concentrated in the connecting regions between the Songshan and Jishan Mountains and their surroundings. The current centrality of ecological corridors in these regions increased most significantly.
The Pinch Point Mapper tool identified 59, 91, and 110 ecological pinch points in 2000, 2010, and 2020, covering total areas of 246.66 km2, 527.45 km2, and 699.61 km2, respectively. These pinch points were mainly distributed around the Jishan Mountains in the east (Figure 5). The Barrier Mapper tool identified 31, 60, and 106 ecological barrier points in 2000, 2010, and 2020, with total areas of 96.28 km2, 264.85 km2, and 611.06 km2, respectively, mostly around the Songshan Mountains in the east (Figure 5). Over the study period, both ecological pinch points and barrier points exhibited a substantial increasing trend.

3.1.4. Ecological Network Topology Structure

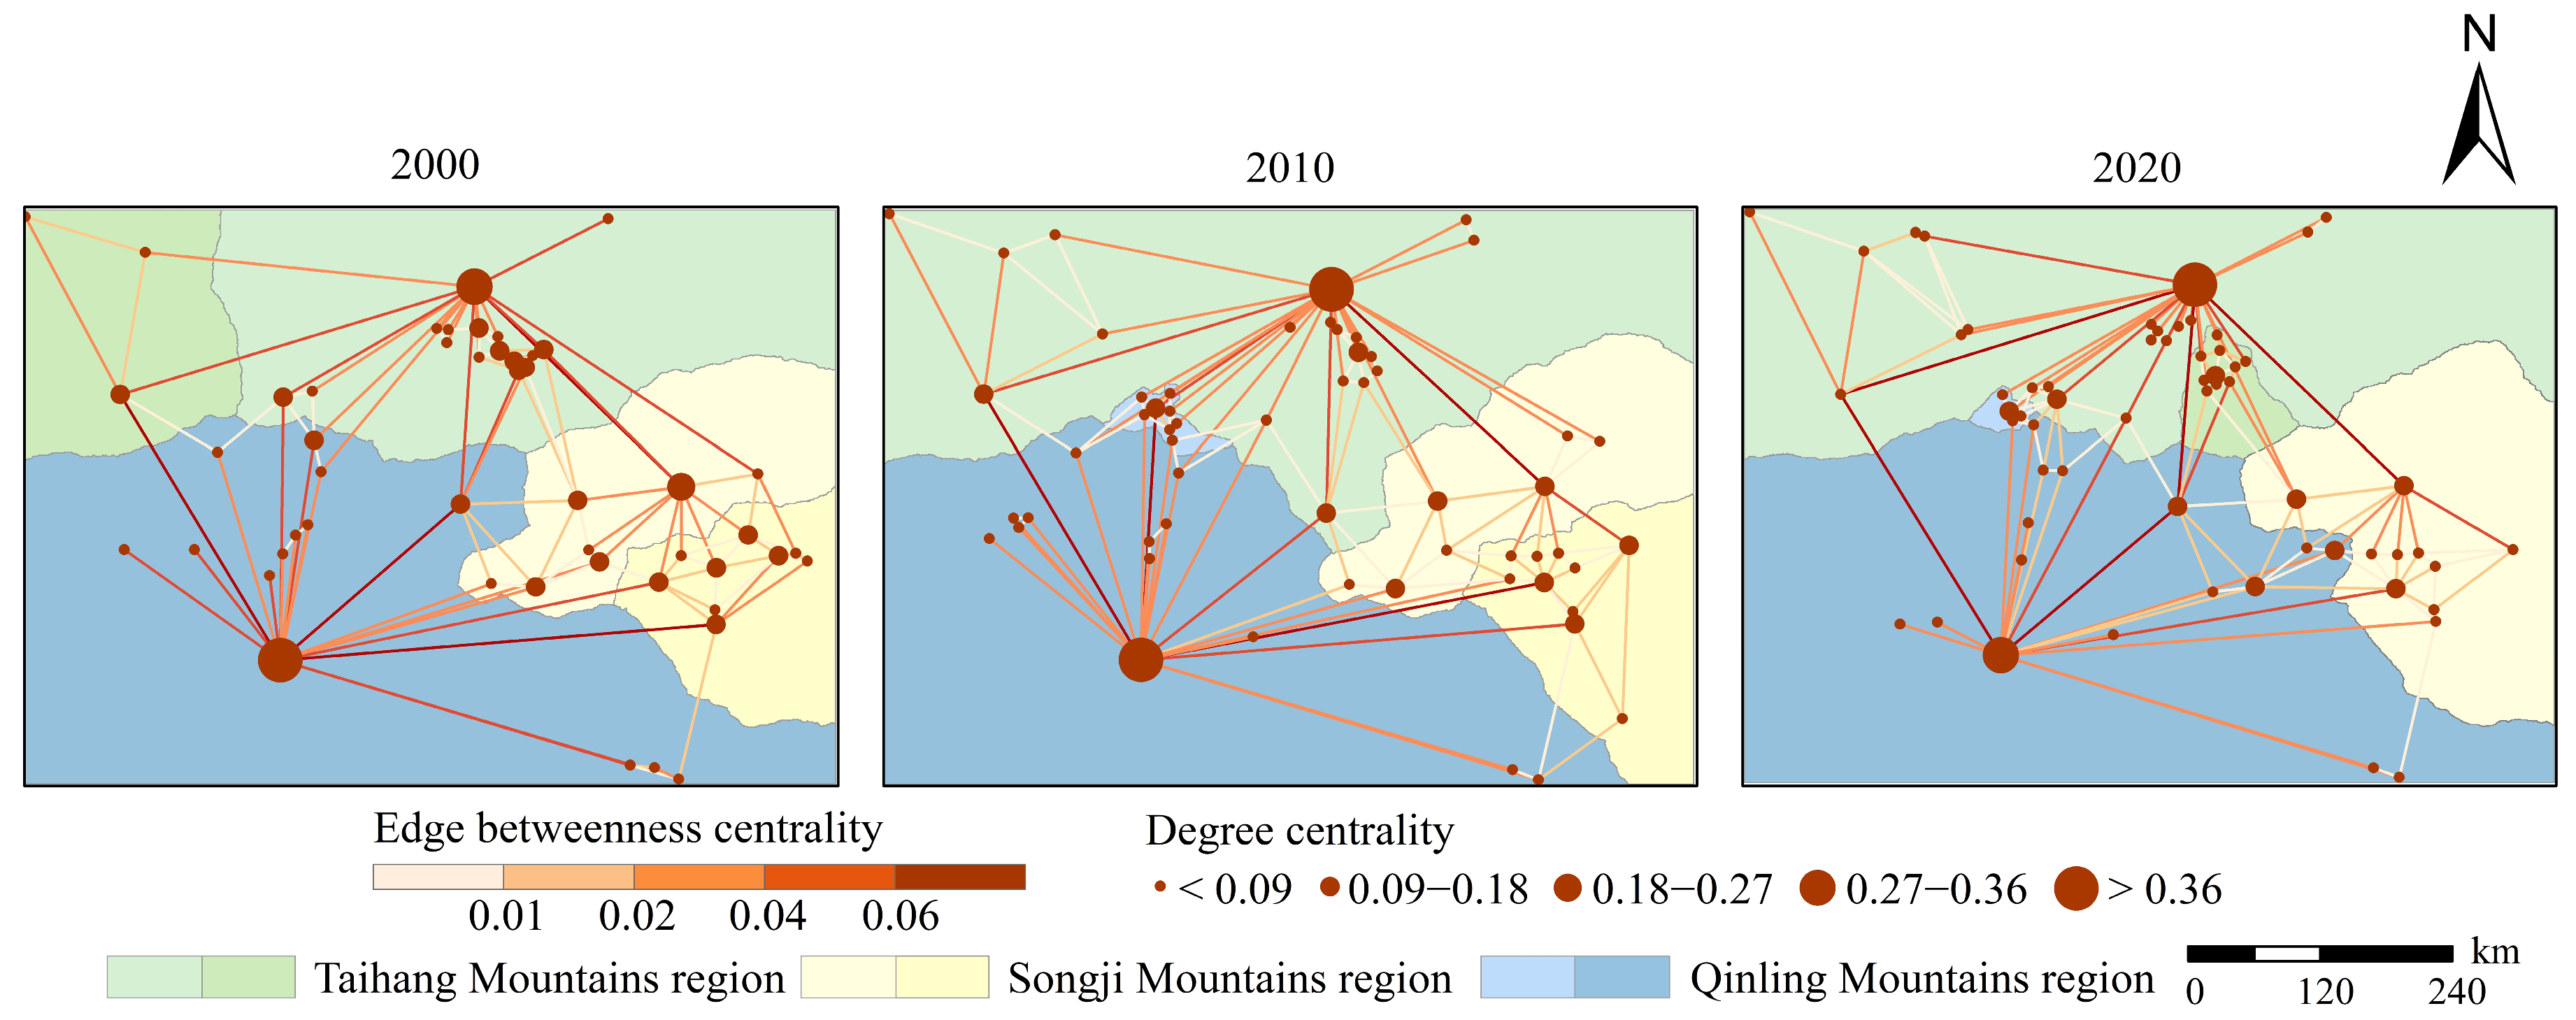
The spatial distribution of DC (Figure 6) generally showed that high-value nodes were mainly found in the Wangwu Mountains in the northern Taihang Mountains region and the core of the Qinling Mountains region. In contrast, low-value nodes were concentrated along the edges of sub-regions. Spatial changes in DC (Figure 6) generally showed a declining trend. The most pronounced changes occurred in the southern Taihang Mountains region, the western Songji Mountains region, and the northern Qinling Mountains region. The spatial distribution of EBC (Figure 6), edges with high centrality were mainly located in the Taihang and Qinling Mountains regions, connecting ecological nodes with high centrality. In contrast, edges with low centrality were mostly found in areas with sparse ecological nodes, such as the northwestern Taihang Mountains region, the western Songji Mountains region, and the northwestern Qinling Mountains region. Spatial changes in EBC (Figure 6) generally showed that the most significant declines occurred in the northwestern Taihang Mountains region and in the junction between the Songji and Qinling Mountains regions.
This study divided the Taihang–Qinling intersection zone in China into three ecological regions using the Louvain community detection method and the ArcGIS cost allocation tool: the Taihang Mountains region, the Songji Mountains region, and the Qinling Mountains region. The spatial distribution of ecological regions (Figure 7) showed that the Taihang Mountains region is located in the north and covers a relatively large area. Its central ecological nodes were closely connected, whereas nodes in the western part had weaker connections. The Songji Mountains region, in the east, is the smallest and features scattered ecological nodes with weak connectivity. The Qinling Mountains region, in the southwest, is the largest, with ecological nodes that are relatively concentrated and strongly connected. Regarding spatial changes in ecological regions (Figure 7), the boundaries of these three regions remained mostly unchanged from 2000 to 2020. The area of both the Taihang and Songji Mountains regions first increased and then decreased, while the area of the Qinling Mountains region first decreased and then increased. Meanwhile, connections between nodes in the Taihang Mountains region first strengthened and then weakened, whereas those in the Songji Mountains region showed the opposite trend, and those in the Qinling Mountains region strengthened significantly.

3.2. Spatiotemporal Evolution Characteristics of ESP Quality

3.2.1. Overall Characteristics

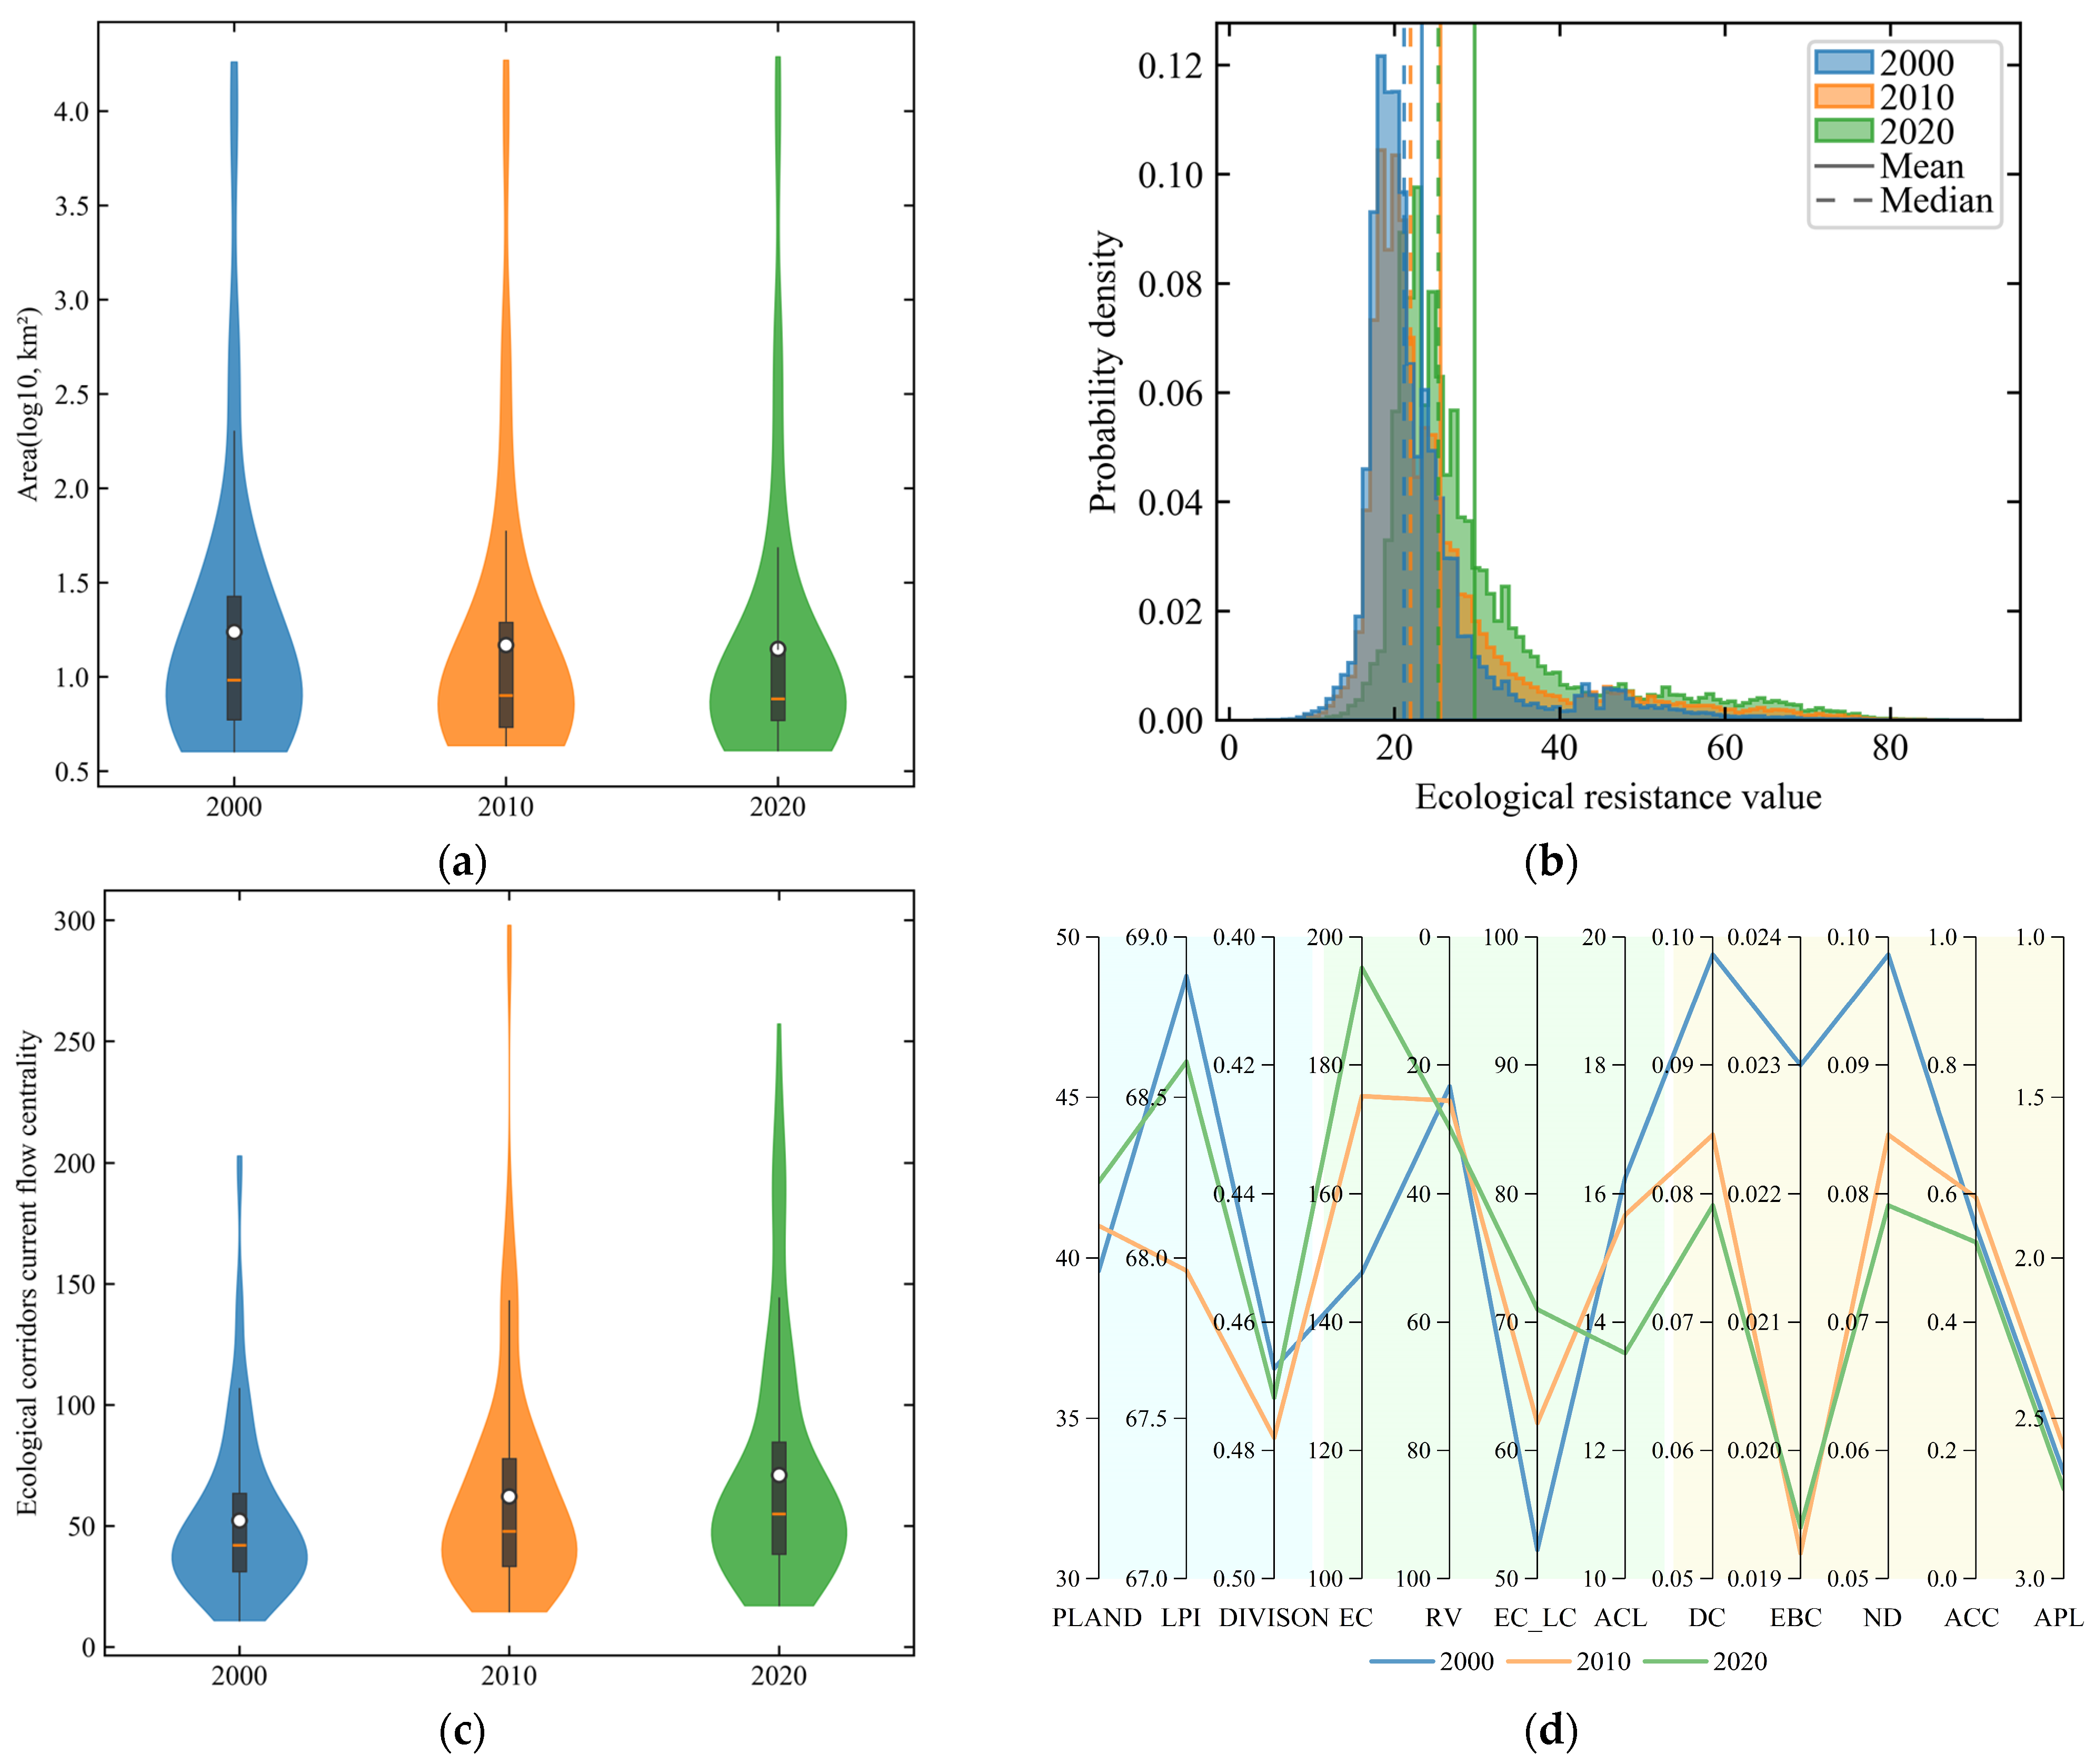
In terms of landscape pattern characteristics in the Taihang–Qinling intersection zone in China (Figure 8a,d), from 2000 to 2020, PLAND increased annually from 39.60% to 42.37%, indicating the continuous expansion of the ecological source area. LPI values were 68.88, 67.96, and 68.61, showing an overall trend of marked decrease followed by a slight increase, which indicates a weakening influence of the largest ecological source. The average DIVISION values were 0.4672, 0.4780, and 0.4718, indicating a trend of significant increase followed by a slight decline, and reflecting increased fragmentation of ecological sources.
In terms of ecological network basic characteristics (Figure 8b–d), the average EC value increased annually from 147.70 to 195.16, which demonstrates an enhanced role of ecological sources in biological circulation, related in part to their expansion. The average RV value increased annually from 23.32 to 29.70, indicating greater difficulty in biological circulation. The average EC_LC value increased annually from 52.25 to 71.00, reflecting a strengthening role of ecological corridors in biological circulation. ACL decreased from 16.25 km to 13.51 km. Combined with the characteristics of an expanded total scale of ecological sources but a reduced average area, as well as the continuous rise in resistance values, this indicates an intensification of ecological source fragmentation.
In terms of ecological network topological characteristics (Figure 8d), the average DC value decreased annually from 0.0986 to 0.0791, indicating a reduced influence of nodes in the network. The average EBC value generally decreased from 0.0230 to 0.0194, suggesting a weakened role of edges in biological circulation. ND decreased annually from 0.0986 to 0.0791, indicating a trend toward a sparser network structure. ACC values were 0.5477, 0.5941, and 0.5242, showing an initial increase followed by a decrease, which suggests weakening node connectivity. APL values were 2.67, 2.59, and 2.72, showing a trend of initial reduction followed by an increase, and indicating decreased efficiency of ecological circulation.
In summary, despite the increase in the scale of ecological sources and the number of corridors, considering the comprehensive impact of multiple evaluation factors, the overall quality of the ESP in the Taihang–Qinling intersection zone in China declined from 2000 to 2020 (Figure 8d). Landscape pattern characteristics show increasing fragmentation and decreasing integrity of ecological sources, which may affect the radiation and driving effect of these sources on the surrounding ecosystem, reducing overall connectivity and stability. Ecological network basic characteristics show that although the expansion of ecological sources has enhanced their role in biological circulation, persistent fragmentation poses a risk to ESP quality. Increased RV further restricts connectivity between ecological sources. Ecological network topological characteristics show that the ecological network has also become less connected and more fragmented, with looser connections between ecosystem components.

3.2.2. Local Characteristics

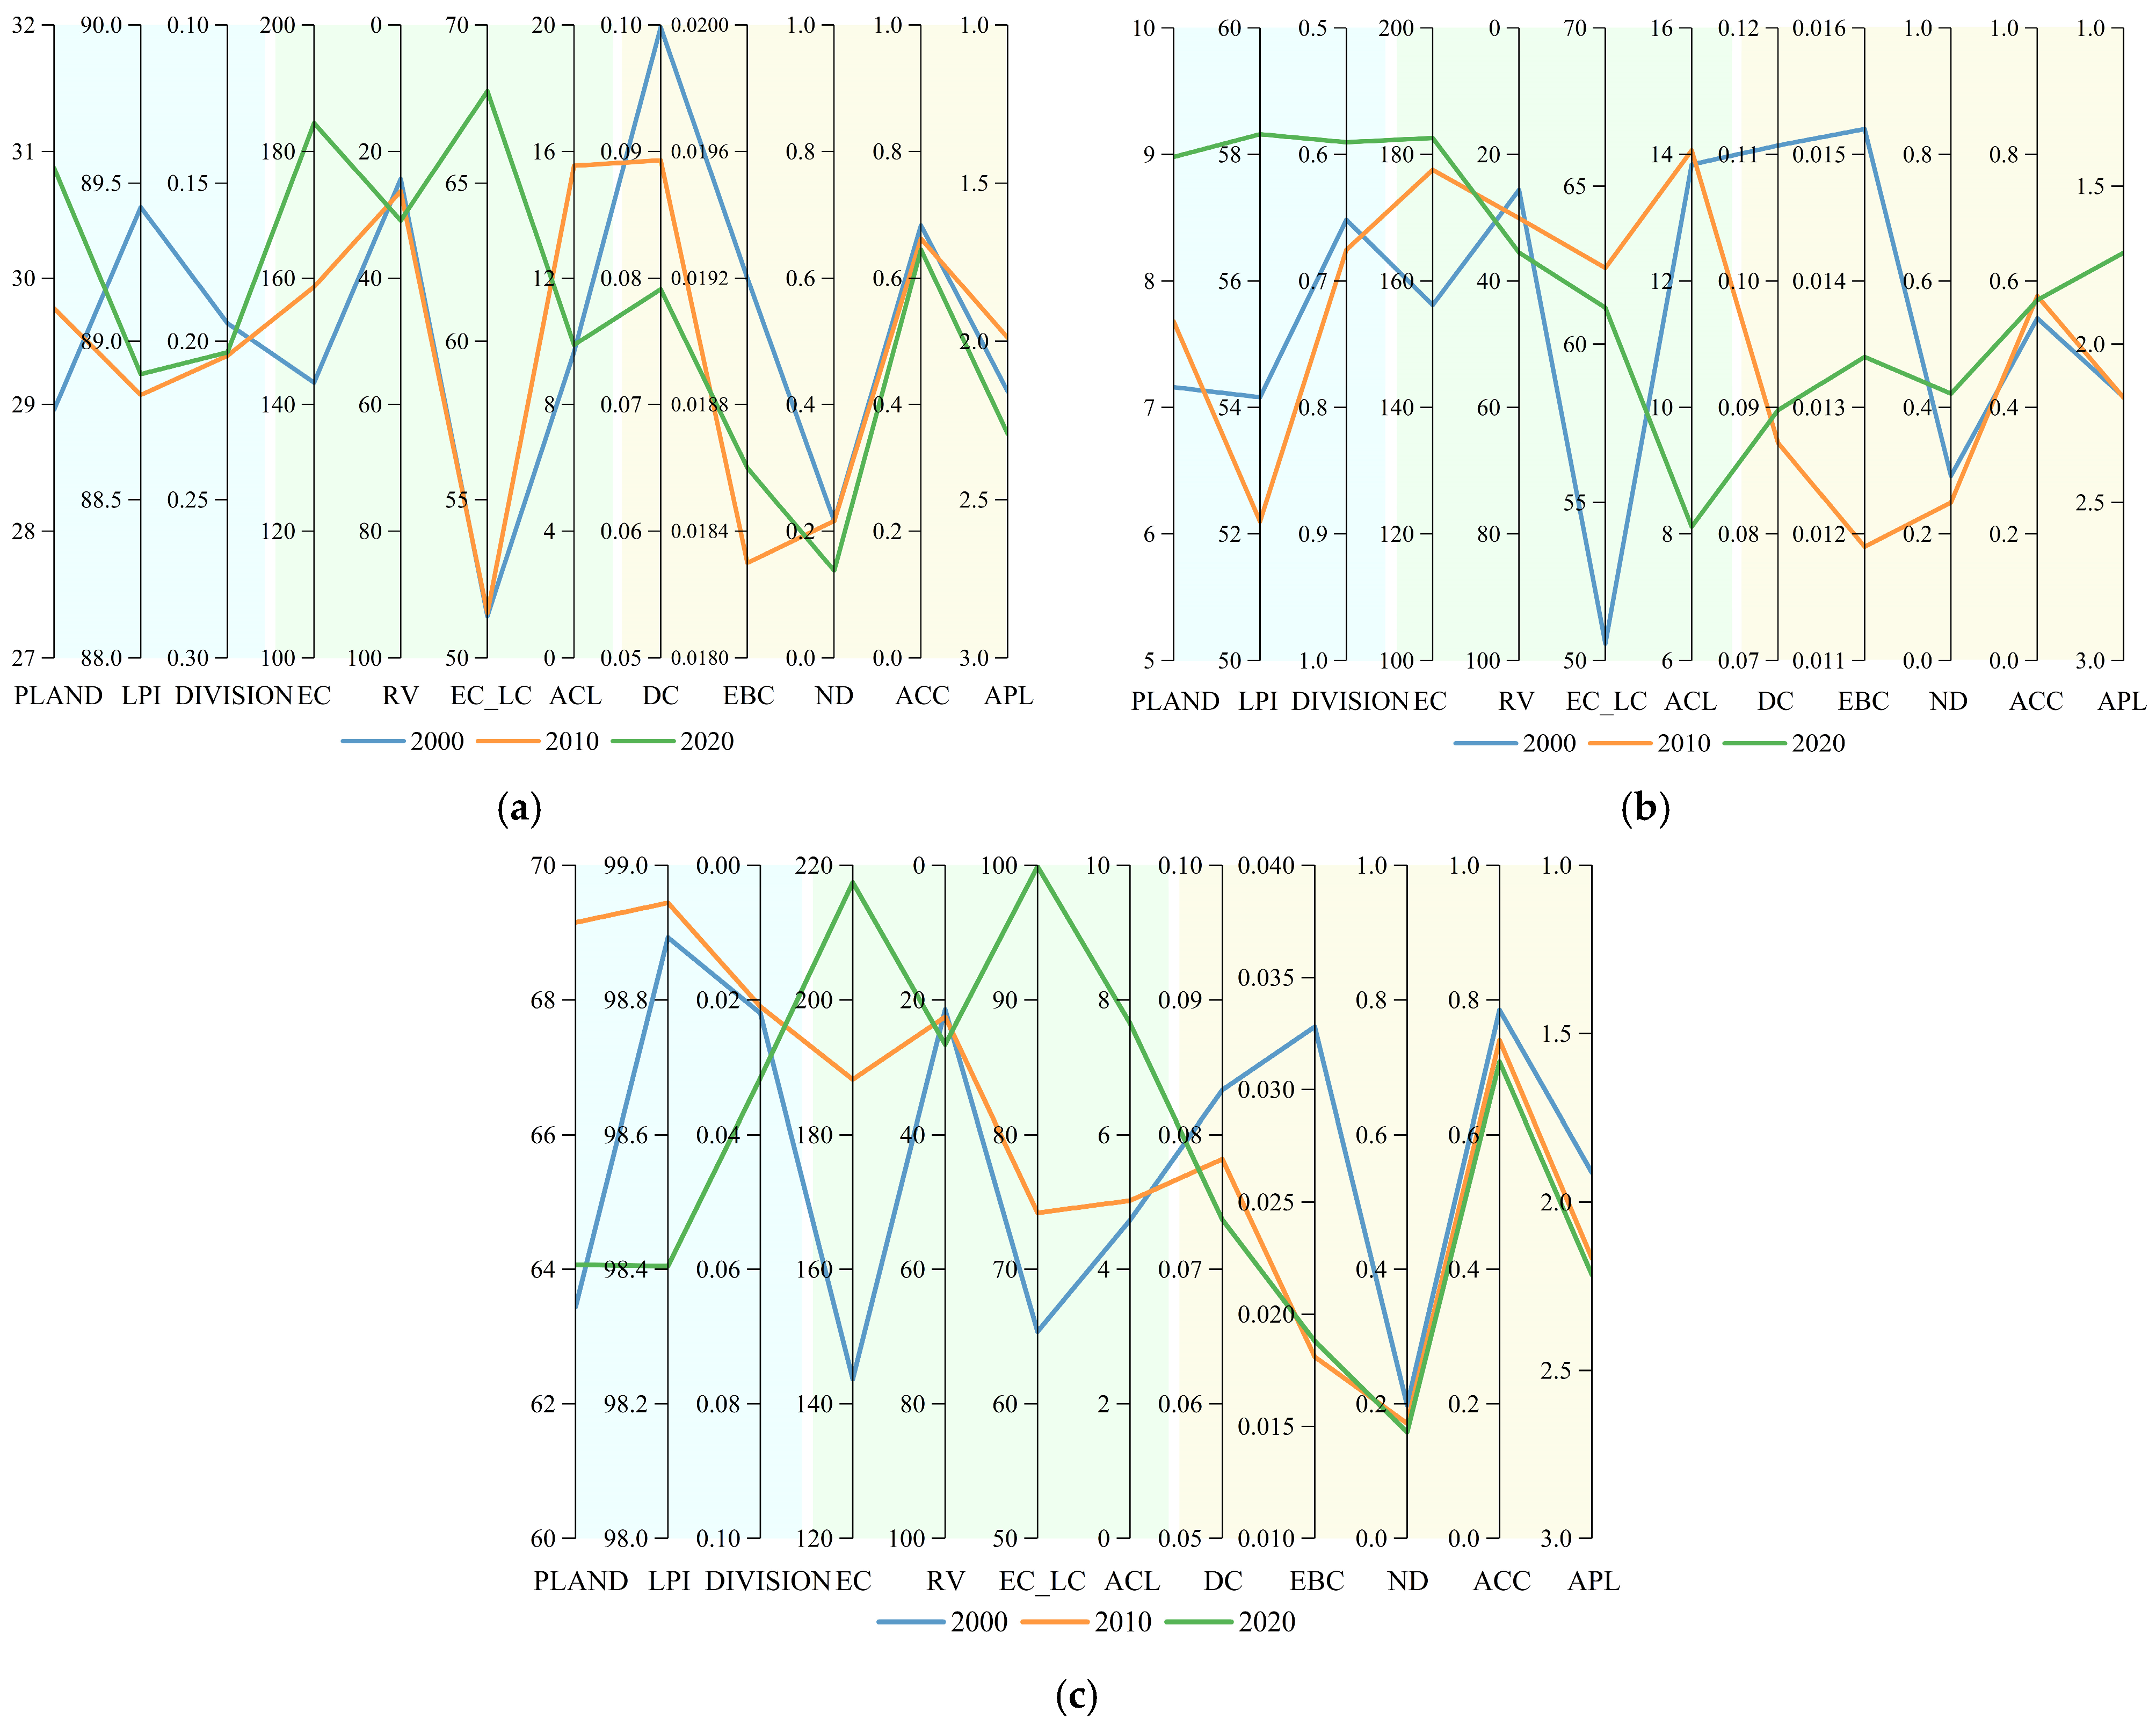
From the perspective of ESP quality in the Taihang Mountains region (Figure 9a), the area in 2000, 2010, and 2020 was 24,495.93 km2, 25,179.39 km2, and 24,493.86 km2, respectively. Both the number and area of ecological sources increased. For landscape pattern characteristics, PLAND increased from 28.96% to 30.87%. LPI changed from 89.42 to 88.90, showing a marked decrease followed by a slight recovery. The average DIVISION increased from 0.1943 to 0.2035, with a significant rise followed by a minor decline. For the ecological network’s basic characteristics, the average EC increased annually from 143.49 to 184.47. The average RV rose each year from 24.35 to 30.91. The average EC_LC increased from 51.32 to 67.91. ACL changed from 9.66 km to 9.89 km, showing an initial increase followed by a notable decline. For the ecological network’s topological characteristics, the average DC decreased annually from 0.0998 to 0.0791. The average EBC fell from 0.0192 to 0.0186. ND decreased from 0.2170 to 0.1380. ACC declined from 0.6830 to 0.6450. APL changed from 2.16 to 2.29, first decreasing and then increasing significantly. In summary, the ESP quality in the Taihang Mountains region declined from 2000 to 2020 (Figure 9a). The number and area of ecological sources expanded, with a slight increase in fragmentation, though it remained within a manageable range. The role of ecological sources and corridors in biological circulation was enhanced, but growing resistance limited these gains. Ecological network connectivity and transmission efficiency decreased, further weakening the ecosystem’s integrity and function.
From the perspective of ESP quality in the Songji Mountains region (Figure 9b), the area in 2000, 2010, and 2020 was 12,901.23 km2, 14,051.16 km2, and 11,146.32 km2, respectively. The number and area of ecological sources first increased, then decreased. For landscape pattern characteristics, PLAND increased from 7.16% to 8.98%. LPI changed from 54.16 to 58.31, showing a slight decrease followed by a substantial rise. The average DIVISION decreased from 0.6517 to 0.5904, reflecting a minor increase and then a significant decrease. For the ecological network’s basic characteristics, the average EC rose from 156.21 to 182.60. The average RV grew annually from 25.61 to 35.51. The average EC_LC changed from 50.54 to 61.16, with a clear rise followed by a slight decline. ACL decreased from 13.84 km to 8.12 km, with a slight increase followed by a sharp decline. For the ecological network’s topological characteristics, the average DC changed from 0.1107 to 0.0898, with a significant decrease and then a small recovery. The average EBC dropped from 0.0152 to 0.0134, first declining and then recovering. ND increased from 0.2920 to 0.4220, with a slight decrease followed by a substantial rise. ACC increased from 0.5410 to 0.5700. APL changed from 2.17 to 1.71, with a minor rise and then a marked decrease. In summary, the ESP quality in the Songji Mountains region improved from 2000 to 2020 (Figure 9b). This trend correlated directly with changes in the regional area. Although the proportion of ecological source areas increased, the instability in the number and area of ecological sources suggested volatility in their development. While fragmentation decreased in later years, it remained high. The strengthened role of ecological sources in biological circulation was partly offset by persistent resistance. Fluctuations in node and edge numbers resulted in connectivity and transmission efficiency first declining and then improving, impacting the ecosystem accordingly.
From the perspective of ESP quality in the Qinling Mountains region (Figure 9c), the area in 2000, 2010, and 2020 was 29,039.31 km2, 27,205.92 km2, and 30,796.29 km2, respectively. The number and area of ecological sources first rose and then fell, whereas the area showed a steady annual increase. For landscape pattern characteristics, PLAND changed from 63.44% to 64.07%, showing an initial increase and then a marked decrease. LPI changed from 98.89 to 98.40, with a similar trend. DIVISION shifted from 0.0220 to 0.0316, indicating a slight decrease and then a notable increase. For the ecological network’s basic characteristics, the average EC rose annually from 143.70 to 217.46. The average RV increased from 21.44 to 26.63. The average EC_LC rose from 65.38 to 99.92. ACL grew from 4.73 km to 7.65 km. For the ecological network’s topological characteristics, the average DC decreased annually from 0.0833 to 0.0737, the average EBC declined from 0.0328 to 0.0188, ND fell from 0.1980 to 0.1580, ACC dropped from 0.7850 to 0.7080, and APL increased from 1.91 to 2.22. In summary, the ESP quality in the Qinling Mountains region declined from 2000 to 2020, but the foundational quality remained strong (Figure 9c). Initial improvement in source fragmentation was followed by deterioration, negatively affecting ecosystem connectivity and stability. Rising resistance further restricted biological circulation. The degree of aggregation within the network decreased, with looser connections and reduced overall connectivity.

4. Discussion

This study systematically analyzed the spatiotemporal evolution characteristics of ESP quality in the Taihang–Qinling intersection zone of China from 2000 to 2020. The results indicate that the overall quality of regional ESP showed a downward trend. Although the scale of ecological sources and the biological circulation function of ecological sources and corridors have improved, the overall quality is still decreasing due to the negative effects, such as intensified source fragmentation, increased ecological resistance, and a loose network structure. Specifically, the ESP quality of the Taihang Mountains region exhibited a downward trend. However, the high scale and complete structure of the ecological sources effectively offset the negative impacts of fragmentation and rising resistance, so that the quality did not experience a significant decline and maintained a good level overall. The ESP quality of the Songji Mountains region showed an upward trend. Although the biological circulation function and network connectivity of the ecological sources have improved, the overall quality foundation is still weak due to the low PLAND, LPI, and the high DIVISION. Only limited improvements have been achieved. The ESP quality of the Qinling Mountains region generally decreased, but the advantage of high PLAND significantly buffered the impacts of rising ecological resistance and declining network aggregation, ensuring the overall quality foundation remained stable.
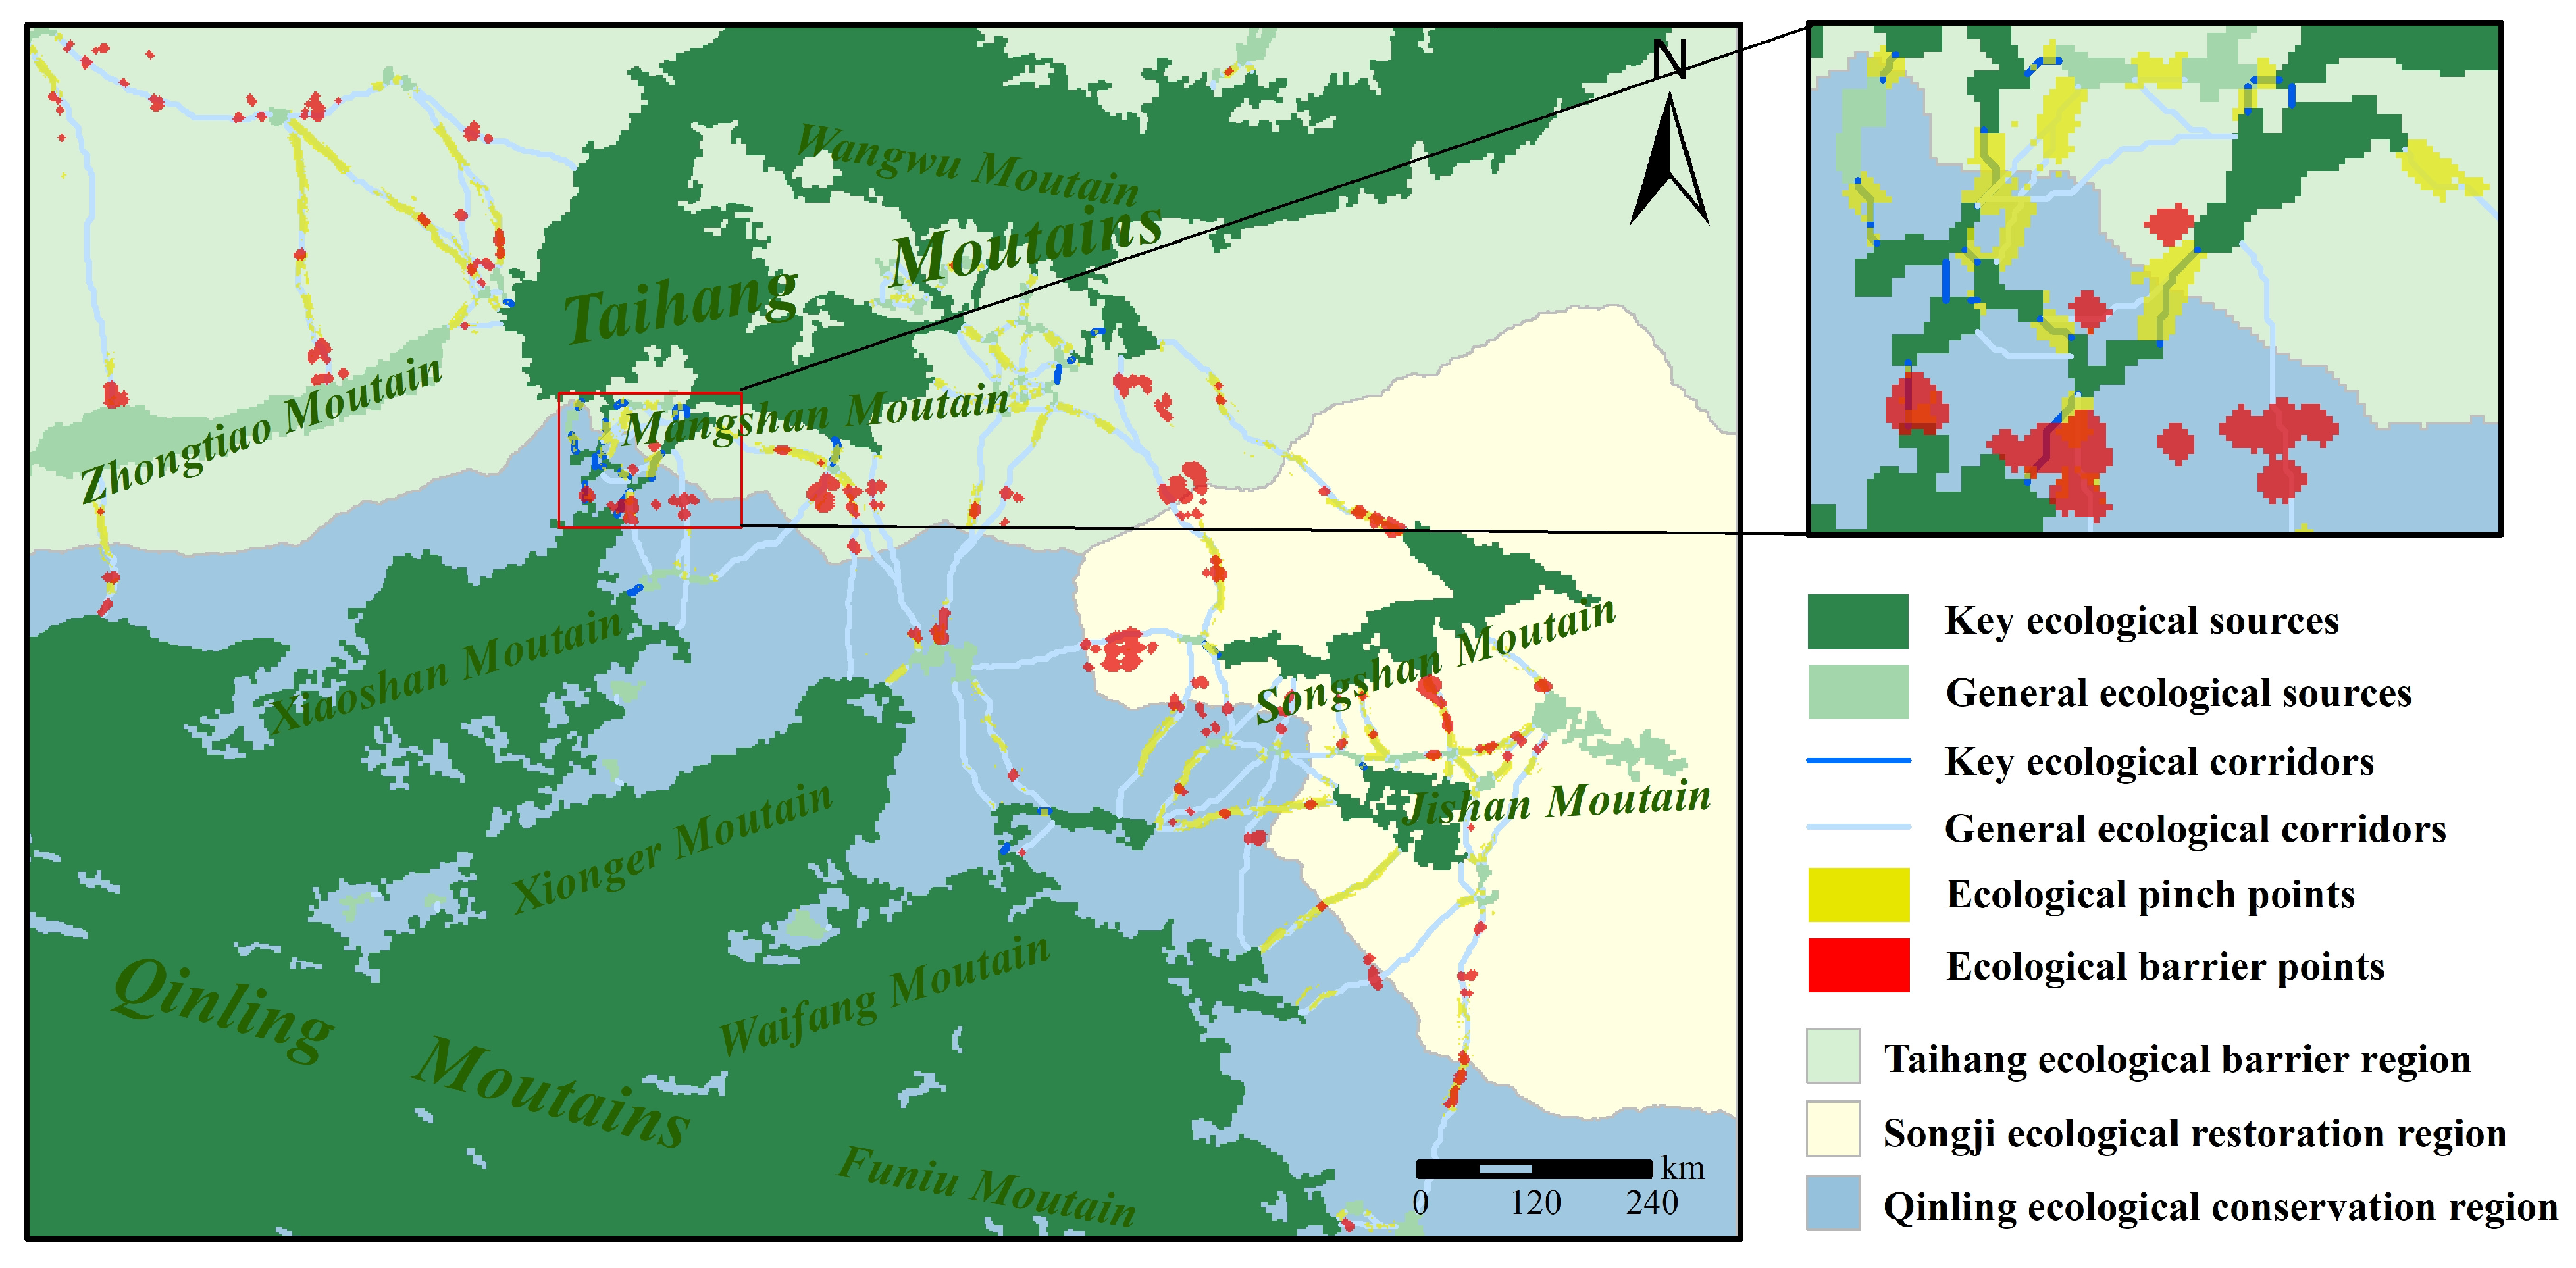
The core goal of ESP quality assessment is to provide accurate scientific support for regional ecological protection and restoration. However, there are still significant gaps between existing research results and this goal. On one hand, multi-dimensional evaluation and systematic restoration are insufficient, leading to incomplete restoration strategies. Most studies are based on the constructed ESP, focusing on the spatial location identification of core elements such as ecological sources, corridors, and strategic points, delineating the key regions of ecological restoration only according to the distribution of spatial elements, and proposing targeted restoration strategies [49,50,51,67,68]. This approach fails to consider multiple factors affecting ESP quality, making it difficult to effectively improve ESP quality. On the other hand, existing studies ignore internal regional differences, resulting in poor adaptability of restoration strategies. Most studies treat the entire study area as a single restoration unit and do not fully integrate the differences in ESP quality and ecological background characteristics among different sub-regions within the study area [67,69,70,71]. Consequently, the proposed restoration strategies cannot meet the differentiated needs of various sub-regions. In view of the above limitations, combined with the systematic clarification of the spatiotemporal evolution characteristics of ESP quality in the Taihang–Qinling intersection zone, this study tried to designate the Taihang Mountains region as the ecological barrier region, the Songji Mountains region as the ecological restoration region, and the Qinling Mountains region as the ecological conservation region. On this basis, elements of the ESP were further exploratively superimposed, with key and general ecological sources determined by EC and DC, and key and general ecological corridors identified by EC_LC and EBC. Based on these analyses, this study attempted to construct an ecological protection and restoration pattern for the Taihang–Qinling intersection zone (Figure 10) and further discussed regionally differentiated ecological protection and restoration strategies, so as to provide scientific support for improving ESP quality.
(1)
Taihang ecological barrier region: Key ecological sources in this region are relatively concentrated and large in area, whereas general ecological sources are dispersed around these core patches. The fragmentation of ecological sources remains low. A high density of general ecological corridors, interwoven with key ecological corridors, effectively enhances network connectivity. Numerous ecological pinch points play a critical role in maintaining ecological network connectivity and ecosystem stability. Ecological barrier points are few and mainly situated near major transportation lines and residential areas, causing only minor interference to the ecosystem. Therefore, the Taihang Mountains region is suitable as an ecological barrier region. To safeguard and enhance ecosystem service functions, future measures should include strict enforcement of ecological protection red lines, prioritizing key ecological sources for protection, and restricting development activities that could negatively affect the ecological environment. Establishing a comprehensive ecological monitoring system is also essential for tracking dynamic changes and consolidating the foundation of ecological security. Special attention should be paid to the Wangwu Mountains region in the north. Additionally, ecological restoration projects—such as establishing buffer zones along transportation corridors and ecological enhancement near residential areas—can mitigate the negative effects of ecological barrier points and promote the sustained strengthening of barrier functions.
(2)
Songji ecological restoration region: Key ecological sources in this region are scattered in small, isolated patches, and general ecological sources are also widely separated. The fragmentation of ecological sources is very high. There are a few key ecological corridors, and many are narrow and discontinuous, resulting in poor connectivity of the general ecological corridors. Severe ecological degradation around ecological pinch points hinders the effective performance of ecosystem functions. Numerous ecological barrier points are concentrated in urban expansion areas, mining zones, and around transportation hubs, causing significant ecological disturbance. Therefore, the Songji Mountains region is suitable as an ecological restoration region. Restoration priorities should include the consolidation and expansion of ecological sources through afforestation and restoration of degraded forests, as well as enhancing source connectivity. Improving ecological corridor connectivity will require corridor restoration and reconstruction, bridging discontinuities, widening narrow segments, and building wildlife passages. Strengthening urban green infrastructure, building urban greening systems, increasing efforts in mine rehabilitation, and promoting green mining are necessary for gradually restoring the regional ecosystem and reestablishing ecological balance.
(3)
Qinling ecological conservation region: Key ecological sources in this region are distributed in continuous patches with strong integrity and connectivity. Key ecological corridors align with the mountain ranges, forming a stable and well-connected network. Ecological pinch points are reasonably distributed, supporting the stable functioning of the ecosystem, while ecological barrier points are extremely limited and exert minimal disturbance. Therefore, the Qinling Mountains region is suitable as an ecological conservation region. Future strategies should focus on combining strict ecological protection with moderate, sustainable development, leveraging the region’s rich ecological resources for activities such as ecological education and tourism. These actions can raise public awareness of ecological protection and facilitate the sustainable use of ecological resources. It is also necessary to ensure the conservation of “stepping stone” patches, thereby strengthening corridor connectivity, enhancing the functional influence of ecological sources, and promoting ongoing improvement of ecosystem service functions.
In summary, the Taihang ecological barrier region, Songji ecological restoration region, and Qinling ecological conservation region each exhibit distinct ecological characteristics and management requirements (Figure 10). The Taihang ecological barrier region features extensive, concentrated key ecological sources and high ecological corridor connectivity, forming a robust ecological foundation. Conversely, the Songji ecological restoration region suffers from severe fragmentation of ecological sources and weak corridor connectivity, yet holds potential to become an ecological bridge connecting the Taihang ecological barrier region and Qinling ecological conservation region through restoration efforts. Meanwhile, the Qinling ecological conservation region maintains contiguous ecological sources, stable ecological corridors, and a holistic ecological network. Based on these characteristics, collaborative conservation strategies should be adopted to promote ecological connectivity and functional improvement between regions. In the future, the ecological source protection experience from the Taihang ecological barrier region and the ecological corridor construction experience from the Qinling ecological conservation region should be cross-regionally applied to provide robust support for ecological restoration in the Songji Mountains region, gradually reviving its ecological functions. Simultaneously, leveraging the feedback effect of the Songji ecological restoration region’s restoration achievements will promote species migration and ecological functional flows, strengthening regional ecological linkages. Furthermore, a cross-regional ecological monitoring system should be established to coordinate ecological protection, development constraints, and functional enhancement, enabling integrated management. To ensure the long-term effectiveness and fairness of collaborative strategies, it is also necessary to establish a cross-regional ecological protection compensation mechanism, clarify the responsibilities of ecological beneficiaries, and balance protection costs and ecological benefits through means such as financial support and technical collaboration, so as to achieve shared responsibility for protection, joint governance of environmental pollution, and shared ecological benefits. In summary, scientific planning and collaborative management can fully leverage the ecological advantages of each region, promote the ecological governance of the Taihang–Qinling intersection zone to transition from “fragmented efforts” to “synergistic advancement”, ultimately enhancing the overall efficacy of ecological governance and achieving sustainable development of regional ecosystems.

5. Conclusions

Addressing the shortcomings of previous research, which has often emphasized identification rather than evaluation, this study developed a systematic framework for evaluating ESP quality. This framework enables both temporal comparison across periods and spatial comparison within local regions. Using this evaluation framework, the spatiotemporal evolution of ESP quality in the Taihang–Qinling intersection zone in China was systematically analyzed from 2000 to 2020. Furthermore, a regional ecological protection and restoration pattern was constructed to explore differentiated protection and restoration strategies for the Taihang–Qinling intersection zone. The main findings are as follows:
(1)
From 2000 to 2020, both the number and area of ecological sources increased substantially. The ecological resistance surface displayed consistently higher values in the east and lower values in the southwest, with pronounced spatial heterogeneity. The number of ecological corridors increased, whereas their average length decreased; corridors predominantly extended from northwest to southeast. Both ecological pinch points and barrier points showed significant growth.
(2)
From 2000 to 2020, despite the increase in the scale of ecological sources and the number of corridors, considering the comprehensive impact of multiple evaluation factors, the overall ESP quality in the Taihang–Qinling intersection zone exhibited a declining trend. The Taihang and Qinling Mountains regions also showed an overall decline, though the quality remained within a controllable range and the overall foundation was relatively sound. In contrast, the Songji Mountains region demonstrated an overall improvement in quality. However, ecological source fragmentation remained high, and the overall quality foundation was weak in this region. Consequently, the quality decline in these two larger regions drove the overall decline. Despite its improvement, the smaller Songji Mountains region could not counteract the decreasing trend in regional ESP quality or achieve fundamental improvement.
(3)
Based on the identified ESP and quality characteristics, an ecological protection and restoration pattern was proposed, comprising the Taihang ecological barrier region, the Songji ecological restoration region, and the Qinling ecological conservation region. Differentiated optimization strategies were developed for ecological protection and restoration in each region to promote regional ecological security.
This study overcomes the limitations of conventional ESP research, which has primarily focused on pattern identification with limited systematic quantitative evaluation. By constructing a comprehensive evaluation framework—incorporating landscape pattern factors, ecological network basic factors, and ecological network topological factors—this research enhances the scientific rigor and systematicity of ESP quality assessment. Additionally, a local quality evaluation method was introduced to address the issue of regional heterogeneity, enabling the development of targeted strategies according to the quality characteristics of each region and providing a scientific basis for decision-making in ecological protection and restoration. However, this study still has limitations that require improvement. First, there are significant differences in ecological endowments among regions, and there is a lack of theoretical and methodological support for horizontal comparisons between different regions. Therefore, we mainly focus on vertical temporal comparisons of the study area as a whole and each individual region. Second, the key parameters involved in the identification of ESPs, such as weights and distance thresholds, have no unified standards. Meanwhile, parameter sensitivity analysis has not been carried out, so the robustness of the model needs further discussion. Third, this research mainly analyzed the characteristics of ESP quality. Future studies should further explore the driving mechanisms affecting quality. Furthermore, where data availability allows, subsequent studies can also adopt methods such as increasing the density of time points, verifying the regional applicability of the species-generalist assumptions, and introducing scenario simulation to more accurately explore the paths for improving ESP quality, thereby providing a more robust scientific foundation for ecological protection and restoration decision-making.

Author Contributions

Conceptualization, Y.C. and J.L.; methodology, Y.C. and J.L.; software, Y.C., S.Z. and X.M.; validation, J.L. and Q.Y.; formal analysis, Y.C., S.Z. and X.M.; investigation, Y.C., S.Z. and X.M.; resources, Y.C., S.Z. and X.M.; data curation, Y.C., S.Z. and X.M.; writing—original draft preparation, Y.C., S.Z. and X.M.; writing—review and editing, J.L., Q.Y., G.J. and W.H.; visualization, Y.C., S.Z. and X.M.; supervision, J.L.; project administration, W.C.; funding acquisition, J.L., Q.Y., H.W. and L.G. All authors have read and agreed to the published version of the manuscript.

Funding

This research was funded by National Natural Science Foundation of China, grant number 41901259; Scientific and Technological Innovation Project of “The Open Competition Mechanism to Select The Best Candidates” of Natural Resources in Henan Province, grant number 2024-11; Henan Provincial Philosophy and Social Science Planning Project, grant number 2024BJJ190, and Technological Innovation Foundation of Henan Agricultural University, grant number KJCX2018B04.

Data Availability Statement

The data presented in this study are available upon request from the corresponding author.

Acknowledgments

We are grateful to the reviewers for their constructive and valuable comments.

Conflicts of Interest

The authors declare no conflicts of interest.

References

  1. Yu, K. Landscape ecological security patterns in biological conservation. Acta Ecol. Sin. 1999, 19, 8–15. [Google Scholar]
  2. Nobel, A.; Lizin, S.; Brouwer, R.; Bruns, S.B.; Stern, D.I.; Malina, R. Are biodiversity losses valued differently when they are caused by human activities? A meta-analysis of the non-use valuation literature. Environ. Res. Lett. 2020, 15, 73003. [Google Scholar] [CrossRef]
  3. Wu, M.; Wu, X. Urban ecological network planning based on “eco-integrated city” concept: On the division and re-connection of ecological functions in spatial planning. City Plan. Rev. 2018, 42, 9–17. [Google Scholar]
  4. Peng, J.; Liu, Y.; Corstanje, R.; Meersmans, J. Promoting sustainable landscape pattern for landscape sustainability. Landsc. Ecol. 2021, 36, 1839–1844. [Google Scholar] [CrossRef]
  5. Willemen, L.; Barger, N.N.; Brink, B.T.; Cantele, M.; Erasmus, B.F.N.; Fisher, J.L.; Gardner, T.; Holland, T.G.; Kohler, F.; Kotiaho, J.S.; et al. How to halt the global decline of lands. Nat. Sustain. 2020, 3, 164–166. [Google Scholar] [CrossRef]
  6. Yi, L.; Sun, Y.; Yin, S.; Wei, X. Construction of ecological security pattern: Concept, framework and prospect. Ecol. Environ. Sci. 2022, 31, 845–856. [Google Scholar]
  7. Baste, I.A.; Watson, R.T. Tackling the climate, biodiversity and pollution emergencies by making peace with nature 50 years after the Stockholm Conference. Glob. Environ. Change 2022, 73, 102466. [Google Scholar] [CrossRef]
  8. Bryan, B.A.; Gao, L.; Ye, Y.; Sun, X.; Connor, J.D.; Crossman, N.D.; Stafford-Smith, M.; Wu, J.; He, C.; Yu, D.; et al. China’s response to a national land-system sustainability emergency. Nature 2018, 559, 193–204. [Google Scholar] [CrossRef]
  9. Chen, Y.; Zhang, Y.; Zhang, X.; Zhang, Y. The institutional construction of territorial spatial governance for “integrated mountains, rivers, forests, fields, lakes, grasses and deserts” in China. J. Nat. Resour. 2025, 40, 1174–1193. [Google Scholar] [CrossRef]
  10. Nelson, A.C.; Moore, T. Assessing urban growth management: The case of Portland, Oregon, the USA’s largest urban growth boundary. Land Use Policy 1993, 10, 293–302. [Google Scholar] [CrossRef]
  11. Ding, C.; Knaap, G.J.; Hopkins, L.D. Managing Urban Growth with Urban Growth Boundaries: A Theoretical Analysis. J. Urban Econ. 1999, 46, 53–68. [Google Scholar] [CrossRef]
  12. Opdam, P.; Steingröver, E.; van Rooij, S. Ecological networks: A spatial concept for multi-actor planning of sustainable landscapes. Landsc. Urban Plan. 2006, 75, 322–332. [Google Scholar] [CrossRef]
  13. Bani, L.; Baietto, M.; Bottoni, L.; Massa, R. The Use of Focal Species in Designing a Habitat Network for a Lowland Area of Lombardy, Italy. Conserv. Biol. 2002, 16, 826–831. [Google Scholar] [CrossRef]
  14. Ma, K.; Fu, B.; Li, X.; Guan, W. The regional pattern for ecological security (RPES): The concept and theoretical basis. Acta Ecol. Sin. 2004, 24, 761–768. [Google Scholar]
  15. Ye, X.; Zou, C.; Liu, G.; Lin, N.; Xu, M. Main research contents and advances in the ecological security pattern. Acta Ecol. Sin. 2018, 38, 3382–3392. [Google Scholar] [CrossRef]
  16. Zhou, Y.; Feng, Z.; Lin, Q.; Wang, J.; Zhang, K.; Wu, K. Research progress on the width of ecological corridors in ecological security pattern. J. Appl. Ecol. 2025, 36, 918–926. [Google Scholar]
  17. Mu, H.; Li, X.; Ma, H.; Du, X.; Huang, J.; Su, W.; Yu, Z.; Xu, C.; Liu, H.; Yin, D.; et al. Evaluation of the policy-driven ecological network in the Three-North Shelterbelt region of China. Landsc. Urban Plan. 2022, 218, 104305. [Google Scholar] [CrossRef]
  18. Wei, Q.; Halike, A.; Yao, K.; Chen, L.; Balati, M. Construction and optimization of ecological security pattern in Ebinur Lake Basin based on MSPA-MCR models. Ecol. Indic. 2022, 138, 108857. [Google Scholar] [CrossRef]
  19. Fang, Y.; Wang, J.; Huang, L.; Zhai, T. Determining and identifying key areas of ecosystem preservation and restoration for territorial spatial planning based on ecological security patterns:A case study of Yantai city. J. Nat. Resour. 2020, 35, 190–203. [Google Scholar]
  20. Yu, K. Security patterns and surface model in landscape ecological planning. Landsc. Urban Plan. 1996, 36, 1–17. [Google Scholar] [CrossRef]
  21. Qin, B.; Lin, Y.; Zhao, J.; Chen, G.; He, W.; Lv, Q. Identification of key areas for the ecological restoration of territorial space in Kunming based on the InVEST model andcircuit theory. Chin. Environ. Sci. 2023, 43, 809–820. [Google Scholar]
  22. Li, Q.; Tang, L.; Qiu, Q.; Li, S.; Xu, Y. Construction of urban ecological security pattern based on MSPA and MCR Model: A case study of Xiamen. Acta Ecol. Sin. 2024, 44, 2284–2294. [Google Scholar]
  23. Xu, J.; Wang, D. Construction and optimization of ecological network of Lanzhou-Xining urban agglomeration based on adaptive cycle. Arid Zone Res. 2024, 41, 856–864. [Google Scholar]
  24. Pascual-Hortal, L.; Saura, S. Comparison and development of new graph-based landscape connectivity indices: Towards the priorization of habitat patches and corridors for conservation. Landsc. Ecol. 2006, 21, 959–967. [Google Scholar] [CrossRef]
  25. Jin, M.; Yan, W.; Zou, H.; Ge, X.; Wang, J. Construction of watershed ecological network based on spatial syntax—Taking Dianchi Lake Basin as a case study. Bull. Soil Water Conserv. 2023, 43, 133–140. [Google Scholar]
  26. Dai, Y. Identifying the ecological security patterns of the Three Gorges Reservoir Region, China. Environ. Sci. Pollut. Res. 2022, 29, 45837–45847. [Google Scholar] [CrossRef] [PubMed]
  27. Li, S.; Zhao, Y.; Xiao, W.; Yue, W.; Wu, T. Optimizing ecological security pattern in the coal resource-based city: A case study in Shuozhou City, China. Ecol. Indic. 2021, 130, 108026. [Google Scholar] [CrossRef]
  28. Knaapen, J.P.; Scheffer, M.; Harms, B. Estimating habitat isolation in landscape planning. Landsc. Urban Plan. 1992, 23, 1–16. [Google Scholar] [CrossRef]
  29. McRae, B.H.; Beier, P. Circuit theory predicts gene flow in plant and animal populations. Proc. Natl. Acad. Sci. USA 2007, 104, 19885–19890. [Google Scholar] [CrossRef]
  30. Wu, Y.; Han, Z.; Meng, J.; Zhu, L. Circuit theory-based ecological security pattern could promote ecological protection in the Heihe River Basin of China. Environ. Sci. Pollut. Res. 2023, 30, 27340–27356. [Google Scholar] [CrossRef]
  31. Hou, L.; Hu, H.; Liu, T.; Ma, C. Ecological security pattern construction for carbon sink capacity enhancement: The case of Chengdu Metropolitan Area. Sustainability 2025, 17, 4483. [Google Scholar] [CrossRef]
  32. Han, R.; Zhao, Z.; Xiao, N.; Shi, N.; Zhang, F.; Gao, X.; Liu, G. Diffusion path of sand source in Hotan Area of Xinjiang, China based on “source-sink” theory and Urban Expansion Eco-logical Resistance (UEER) model. Earth Sci. Environ. 2020, 42, 701–710. [Google Scholar]
  33. Ghosh, S.; Chatterjee, N.D.; Dinda, S. Urban ecological security assessment and forecasting using integrated DEMATEL-ANP and CA-Markov models: A case study on Kolkata Metropolitan Area, India. Sustain. Cities Soc. 2021, 68, 102773. [Google Scholar] [CrossRef]
  34. Cao, B.; Xu, D.; Dou, H.; Pang, B.; Ao, W.; Gu, Y.; Shan, N.; Wang, W.; Liu, B.; Zou, C. Index system of ecological security of inland lakes in cold arid region:a case study of Hulun Lake, China. Acta Ecol. Sin. 2021, 41, 2996–3006. [Google Scholar]
  35. Li, Z.; Gao, J.; Zhong, Y. Assessment on grassland ecological security in Tibet based on ecological footprint model improved by ecosystem services value. Arid Land Res. Environ. 2023, 37, 9–19. [Google Scholar]
  36. Jing, P.; Sheng, J.; Wang, Y.; Hu, T.; Guo, L.; Zhu, R.; Dong, K.; Mahmoud, A.; Liu, Y.; Li, X. Assessing the ecological security of the Three Gorges reservoir complex ecosystem based on the improved three-dimensional emergy ecological footprint model. Sci. Total Environ. 2024, 933, 173086. [Google Scholar] [CrossRef]
  37. Liu, C.; Li, W.; Xu, J.; Zhou, H.; Li, C.; Wang, W. Global trends and characteristics of ecological security research in the early 21st century: A literature review and bibliometric analysis. Ecol. Indic. 2022, 137, 108734. [Google Scholar] [CrossRef]
  38. Liu, S.; Hou, X.; Yin, Y.; Cheng, F.; Zhang, Y.; Dong, S. Research progress on landscape ecological networks. Acta Ecol. Sin. 2017, 37, 3947–3956. [Google Scholar] [CrossRef]
  39. Tian, Y.; Zhang, M.; Xu, D.; Zhang, S. Landscape ecological security patterns in an ecological city, based on source-sink theory. Acta Ecol. Sin. 2019, 39, 2311–2321. [Google Scholar] [CrossRef]
  40. An, R.; Dou, C.; Lu, Y.; Tong, Z.; Wang, N.; Liu, Y.; Pang, H.; Liu, Y. Construction of multi-feature ecological security patterns by coupling SOM-MCR Model: A case study of Wuhan Metropolitan Area. Acta Ecol. Sin. 2023, 43, 9486–9499. [Google Scholar]
  41. Wei, B.; Su, J.; Hu, X.; Xu, K.; Zhu, M.; Liu, L. Comprehensive identification of eco-corridors and eco-nodes based on principle of hydrological analysis and Linkage Mapper. Acta Ecol. Sin. 2022, 42, 2995–3009. [Google Scholar]
  42. Wang, T.; Li, H.; Huang, Y. The complex ecological network’s resilience of the Wuhan metropolitan area. Ecol. Indic. 2021, 130, 108101. [Google Scholar] [CrossRef]
  43. Yao, C.; An, R.; Dou, C.; Liu, Y. Research on construction and evaluation of forest land ecological network in Three Gorges Reservoir Area based on MSPA and MCR model. Resour. Environ. Yangtze Basin 2022, 31, 1953–1962. [Google Scholar]
  44. Sun, F.; Zhang, J.; Wang, P.; Wei, G.; Chu, G.; Cao, Y. Construction and evaluation of urban ecological security pattern: A case study of Suzhou city. Geogr. Res. 2021, 40, 2476–2493. [Google Scholar]
  45. Jeynes-Smith, C.; Bode, M.; Araujo, R.P. Identifying and explaining resilience in ecological networks. Ecol. Lett. 2024, 27, e14484. [Google Scholar] [CrossRef]
  46. Chen, Z.; Tan, P.; Zheng, X.; Chen, Y. Construction and optimization of ecological security pattern in Poyang Lake Urban Agglomeration. Trans. Chin. Soc. Agric. Mach. 2025, 56, 397–409. [Google Scholar]
  47. Yu, J.; Du, H.; Wang, J.; Zhang, Y. Construction and assessment of ecological security pattern in Gansu along the Yellow River based on Zonation-MSPA coupling model. Environ. Sci. 2025, 46, 3085–3097. [Google Scholar]
  48. He, J.; Yuan, Y.; Zhang, M.; Qin, R.; Chen, Z. Ecological management zoning based on network group characteristics: A case study of Wuhan City. Acta Ecol. Sin. 2024, 44, 1514–1525. [Google Scholar]
  49. Li, Q.; Zhou, Y.; Yi, S. An integrated approach to constructing ecological security patterns and identifying ecological restoration and protection areas: A case study of Jingmen, China. Ecol. Indic. 2022, 137, 108723. [Google Scholar] [CrossRef]
  50. Fu, F.; Liu, Z.; Liu, H. Identifying key areas of ecosystem restoration for territorial space based on ecological security pattern: A case study in Hezhou City. Acta Ecol. Sin. 2021, 41, 3406–3414. [Google Scholar] [CrossRef]
  51. Ding, M.; Liu, W.; Xiao, L.; Zhong, F.; Lu, N.; Zhang, J.; Zhang, Z.; Xu, X.; Wang, K. Construction and optimization strategy of ecological security pattern in a rapidly urbanizing region: A case study in central-south China. Ecol. Indic. 2022, 136, 108604. [Google Scholar] [CrossRef]
  52. Lian, H.; Liu, C.; Ni, B.; Qu, Z. Construction and optimization of ecological network of natural protected areas in the northwestern arid region:A case study of Hexi Corridor. J. Appl. Ecol. 2025, 36, 259–270. [Google Scholar]
  53. Zhang, Y.; Cao, Y.; Huang, Y.; Wu, J. Integrating ecosystem services and complex network theory to construct and optimize ecological security patterns: A case study of Guangdong-Hong Kong-Macao Greater Bay Area, China. Environ. Sci. Pollut. Res. 2023, 30, 76891–76910. [Google Scholar] [CrossRef]
  54. Jiang, H.; Peng, J.; Liu, M.; Dong, J.; Ma, C. Integrating patch stability and network connectivity to optimize ecological security pattern. Landsc. Ecol. 2024, 39, 54. [Google Scholar] [CrossRef]
  55. Shi, J.; Tang, X. Multi-scenario simulation evaluation and strategic zoning of habitat services based on habitat quality and ecological network: A case study of Lanzhou City. ISPRS Int. J. Geo-Inf. 2025, 14, 7. [Google Scholar] [CrossRef]
  56. Aobulitalipu, A.; Saidiaihemaiti, J.; Shabiti, M.; Chen, H. Construction of the ecological security pattern of Kriya RiverBasin based on InVEST-MCR model. Bull. Soil Water Conserv. 2025, 45, 1–14. [Google Scholar]
  57. Li, T.; Gong, Y.; Ge, J.; Qi, Z.; Xie, S. Construction of urban landscape ecological security pattern based on circuit theory: A case study of Hengyang City, Hunan Province, China. J. Appl. Ecol. 2021, 32, 2555–2564. [Google Scholar]
  58. Schröter, M.; Remme, R.P. Spatial prioritisation for conserving ecosystem services: Comparing hotspots with heuristic optimisation. Landsc. Ecol. 2016, 31, 431–450. [Google Scholar] [CrossRef]
  59. Niu, T.; Yu, J.; Yue, D.; Yang, L.; Mao, X.; Hu, Y.; Long, Q. The Temporal and Spatial Evolution of Ecosystem Service Synergy/Trade-Offs Based on Ecological Units. Forests 2021, 12, 992. [Google Scholar] [CrossRef]
  60. Zhao, J.; Wang, Y.; Li, Y.; Song, Y. Construction and evaluation of ecological security pattern in Yuanjiang-Red River Basin (China section) based on ecosystem services. Res. Soil Water Conserv. 2025, 32, 363–373. [Google Scholar]
  61. Yuan, Y.; Bai, Z.; Shi, X.; Zhao, X.; Zhang, J.; Yang, B. Determining priority areas for ecosystem preservation and restoration of territory based on ecological security: A case study in Zunhua City, Hebei Province. Chin. J. Ecol. 2022, 41, 750–759. [Google Scholar]
  62. Peng, J.; Cai, H.; Zhang, X.; Zhang, T.; Lv, D. Spatial pattern analysis of ecological security in Fuhe River Basin based on dominant ecological function. Acta Ecol. Sin. 2022, 42, 7430–7444. [Google Scholar] [CrossRef]
  63. Wang, Z.; Wang, H.; Yang, S.; Liu, Q.; Gao, Y.; Heng, J.; Zhang, H. Identification and optimization strategy of ecological security pattern of Oasis in Xinjiang based on ecosystem service function: Taking Baicheng County as an example. Acta Ecol. Sin. 2022, 42, 91–104. [Google Scholar] [CrossRef]
  64. Chen, J.; Zhao, C.; Zhao, Q.; Xu, C.; Lin, S.; Qiu, R.; Hu, X. Construction of ecological network in Fuian Provinee based on Morphological SpatialPattern Analysis. Acta Ecol. Sin. 2023, 43, 603–614. [Google Scholar]
  65. Han, W.; Xia, S.; Zhou, W.; Shen, Y.; Su, X.; Liu, G. Constructing ecological security pattern based on ecological corridor identificationin Lhasa River Basin. Acta Ecol. Sin. 2023, 43, 8948–8957. [Google Scholar]
  66. Sahraoui, Y.; De Godoy Leski, C.; Benot, M.; Revers, F.; Salles, D.; van Halder, I.; Barneix, M.; Carassou, L. Integrating ecological networks modelling in a participatory approach for assessing impacts of planning scenarios on landscape connectivity. Landsc. Urban Plan. 2021, 209, 104039. [Google Scholar] [CrossRef]
  67. Liping, H.; Fangfang, X.; Rongqing, C. Identification of key areas for ecological protection and restoration of countyterritorial space based on ecological security pattern: A case study in Yihuang County of Fuzhou City. J. Environ. Eng. Technol. 2023, 13, 1334–1344. [Google Scholar]
  68. Yue, D.; Yu, Q.; Zhang, Q.; Su, K.; Huang, Y.; Ma, H. Progress in research on regional ecological security pattern optimization. Trans. Chin. Soc. Agric. Mach. 2017, 48, 1–10. [Google Scholar]
  69. Zhou, G.; Huan, Y.; Wang, L.; Lan, Y.; Liang, T.; Shi, B.; Zhang, Q. Linking ecosystem services and circuit theory to identify priority conservation and restoration areas from an ecological network perspective. Sci. Total Environ. 2023, 873, 162261. [Google Scholar] [CrossRef]
  70. Convertino, M.; Muñoz-Carpena, R.; Kiker, G.A.; Perz, S.G. Design of optimal ecosystem monitoring networks: Hotspot detection and biodiversity patterns. Stoch. Environ. Res. Risk Assess. 2015, 29, 1085–1101. [Google Scholar] [CrossRef]
  71. O’Hare, M.T.; Gunn, I.D.M.; Critchlow-Watton, N.; Guthrie, R.; Taylor, C.; Chapman, D.S. Fewer sites but better data? Optimising the representativeness and statistical power of a national monitoring network. Ecol. Indic. 2020, 114, 106321. [Google Scholar] [CrossRef]
Figure 1. Location of the study area.
Land 14 01706 g001
Figure 2. The research framework and technical methodology.
Land 14 01706 g002
Figure 3. Spatiotemporal evolution characteristics of ecological sources in the Taihang–Qinling intersection zone in China from 2000 to 2020.
Land 14 01706 g003
Figure 4. Spatiotemporal evolution characteristics of ecological resistance surfaces in the Taihang–Qinling intersection zone in China from 2000 to 2020.
Land 14 01706 g004
Figure 5. Spatiotemporal evolution characteristics of ecological corridors and ecological strategic points in the Taihang–Qinling intersection zone in China from 2000 to 2020.
Land 14 01706 g005
Figure 6. Spatiotemporal evolution characteristics of ecological network DC and EBC in the Taihang–Qinling intersection zone in China from 2000 to 2020.
Land 14 01706 g006
Figure 7. Spatiotemporal evolution characteristics of ecological regions in the Taihang–Qinling intersection zone in China from 2000 to 2020.
Land 14 01706 g007
Figure 8. Evolution characteristics of ESP overall quality in the Taihang–Qinling intersection zone in China from 2000 to 2020: (a) area distribution of ecological sources; (b) resistance value distribution of ecological resistance surfaces; (c) current flow centrality distribution of ecological corridors; (d) parallel coordinate plot of overall quality.
Land 14 01706 g008
Figure 9. Evolution characteristics of ESP local quality in the Taihang–Qinling intersection zone in China from 2000 to 2020: (a) parallel coordinate plot for the Taihang Mountains region; (b) parallel coordinate plot for the Songji Mountains region; (c) parallel coordinate plot for the Qinling Mountains region.
Land 14 01706 g009
Figure 10. Ecological protection and restoration pattern of the Taihang–Qinling intersection zone in China.
Land 14 01706 g010
Table 1. Comprehensive ecosystem service evaluation factor system.
FactorWeightAttributeFormula
Habitat quality0.25+ Q x j = H j 1 D x j z D x j z + k z
Annual water yield0.25+ Y x = 1 A E T x P x · P x
Sediment delivery ratio0.25+ S D R i = S D R m a x 1 + exp I C o I C i k
Carbon storage and sequestration0.25+ v a l u e s e q x = V s x q p t = 0 q p 1 1 1 + r 100 t 1 + c 100 t
Q x j is the habitat quality of grid cell x in land use type j ; H j is the habitat suitability of land use type j ; D x j is the habitat degradation degree of grid cell x in land use type j ; z is a normalization constant, usually set to 2.5; k is a scaling constant, which is set to 0.5 in this study; Y x is the water yield of grid cell x ; A E T x is the annual actual evapotranspiration of grid cell x ; P x is the annual precipitation of grid cell x ; S D R i is the sediment delivery ratio of grid cell i ; S D R m a x is the theoretical maximum sediment delivery ratio, which is set to 0.8 in this study; I C o and k are calibration parameters defining the SDR-IC relationship; I C i is the spatial connectivity index of grid cell i ; v a l u e s e q x is the carbon sequestration value of a specific plot x ; V is the price of carbon per metric ton; s x is the amount of carbon on the plot; q is the future year; p is the current year; r is the annual market discount rate of carbon price; c is the annual change rate of carbon price.
Table 2. Ecological resistance surface factor system.
FactorWeightResistance Value
120304080100
Elevation (m)0.0458<100100–300-300–600600–1200≥1200
Slope (°)0.0536<55–15-15–2525–35≥35
Topographic relief (m)0.0536<2525–50-50–7575–100≥100
Land use type0.2200Forest,
Grassland,
Shrub
CroplandBarrenWater-Impervious
NDVI0.1439>0.80.6–0.8-0.4–0.60.2–0.4≤0.2
Distance from waters (m)0.0664≤300300–600-600–900900–1200>1200
Nighttime lights0.1278<1010–20-20–4040–50≥50
Distance from settlements (m)0.1056>1000750–1000-500–750250–500≤250
Distance from roads (m)0.0820>1000750–1000-500–750250–500≤250
Distance from railways (m)0.1012>1000750–1000-500–750250–500≤250
Table 3. ESP quality evaluation factor system.
TypeFactorAttributeMeaning
Landscape pattern
factors
Patch area percentage
(PLAND)
+The proportion of patch area
to total landscape area
Largest patch index
(LPI)
+The proportion of the largest patch area
to the total landscape area
Division index
(DIVISION)
The patch fragmentation degree
in the landscape
Ecological network
basic factors
Ecological sources’ current centrality
(EC)
+The importance of ecological sources
in the ecological flow
Ecological resistance value
(RV)
The resistance degree of landscape units
to ecological processes
Ecological corridor current centrality
(EC_LC)
+The key role of ecological corridors
in ecological networks
Average corridor length
(ACL)
+The average length of all corridors
in the ecosystem
Ecological network
topological factors
Degree centrality
(DC)
+The connection degree of nodes
in the network
Edge betweenness centrality
(EBC)
+The strength of the mediating role
of the edge in the network
Network density
(ND)
+Ratio of actual to maximum
possible connections
Average clustering coefficient
(ACC)
+The agglomeration degree
of network nodes
Average path length
(APL)
The average of the shortest paths
between any two nodes in the network
Table 4. Basic data and sources.
DataNameSourceResolution
Digital elevation
model
Copernicus DEM datasetEuropean Space Agency30 m
Land use typeChina land cover productsWuhan University Institute of
Remote Sensing Information Processing
30 m
Nighttime lightsAnnual dataset of nighttime
lights in China
Resource and Environmental Science and Data Center, Institute of Geographic Sciences and Natural Resources Research,
Chinese Academy of Sciences
1 km
NDVIThe largest annual NDVI
dataset in China
National Ecological Science
Data Center
30 m
annual rainfallAnnual precipitation
dataset in China
National Earth System
Science Data Centers
1 km
Monthly rainfallMonthly precipitation
dataset in China
National Earth System
Science Data Centers
1 km
Potential
evapotranspiration
Monthly potential evapotranspiration
dataset for China
National Earth System
Science Data Centers
1 km
Root restricting
layer depth
Absolute depth to bedrockWorld Soil Information
Data Center
250 m
Plant available
water content
Derived available soil water capacity
(volumetric fraction) until wilting point
World Soil Information
Data Center
250 m
SoilHarmonized World Soil
Database v2.0
Food and Agriculture Organization
of the United Nations
1 km
Disclaimer/Publisher’s Note: The statements, opinions and data contained in all publications are solely those of the individual author(s) and contributor(s) and not of MDPI and/or the editor(s). MDPI and/or the editor(s) disclaim responsibility for any injury to people or property resulting from any ideas, methods, instructions or products referred to in the content.