Article

How Land-Take Impacts the Provision of Ecosystem Services—The Case of the Province of Monza and Brianza (Italy)

Department of Agricultural and Environmental Sciences, University of Milan, 20133 Milano, Italy
*
Author to whom correspondence should be addressed.
Land 2025, 14(9), 1700; https://doi.org/10.3390/land14091700
Submission received: 6 August 2025 / Revised: 20 August 2025 / Accepted: 21 August 2025 / Published: 22 August 2025

Abstract

Non-urbanized areas (NUAs), including residual urban green areas, urban parks, agricultural, natural and semi-natural areas, are a fundamental part of the green infrastructure. They are essential in sustaining life and future development, providing a series of ecosystem services (ESs) vital to human society. However, the rapid expansion of urban areas has led to a significant reduction in green spaces. Land-take, reducing available land resources, impacts ecosystem functionality, making it crucial to preserve high-quality territories and the relative ESs provided. In this context, the aim of this study was to evaluate the reduction in ESs due to the land-take having occurred in the last 20 years in the Province of Monza–Brianza, the Italian province with the highest land-take. To achieve this goal, authors used the official data of land use/cover of the Lombardy Region, with three time thresholds (T0: 1999–2003, T1: 2012–2013, T2: 2021) and applied a methodology for ESs assessment originally developed for the municipal level, adapting it to the provincial scale. The study analyzes trends in land-take and land-use changes and assesses how these changes have led to variations in ES provision. The approach involves calculating multiple indices reflecting different ESs provided by NUAs: provisioning ESs coming from agriculture, regulating ESs provided by natural resources, cultural ESs provided by landscape. Findings reveal that urban expansion has decreased provisioning ESs coming from agriculture, while ESs provided by landscape and natural resources have remained stable or improved, respectively. The natural quality index has improved due to conservation policies, despite the high land-take recorded. Anyway, although regional policies have mitigated some negative effects, the overall reduction in green spaces remains a critical issue.

1. Introduction

Green infrastructure, which includes urban green spaces, agricultural areas, natural and semi-natural areas, can largely be traced back to all non-urbanized areas (NUAs). It represents a fundamental element for supporting present and future society [1,2,3,4,5]. Natural ecosystems are fundamental to human life as they provide a series of ecosystem services (ESs) from which humans benefit [6], essential for human survival and well-being.
Despite its fundamental role, green infrastructure is constantly being eroded by land-take, the irreversible transformation of natural or agricultural land into urbanized areas [7,8], which consequently leads to a reduction in the ecosystem services provided by the land taken. Land-take is a process, often driven by economic development needs, that transforms natural and semi-natural areas (including agricultural and forestry land, gardens, and parks) into artificial land development. It is a land-use change in favor of artificial areas and at the expense of natural and agricultural land. For this reason, the European Union, with Decision No. 1386/2013/EU of the European Parliament and of the Council, has set the ambitious goal of achieving “zero net land-take by 2050”.
The Lombardy Region, the leading Italian region in terms of land-take [9], has adopted this objective with the Regional Law 31/2014. With this law, provinces and municipalities are obliged to reduce, on one hand, the land-take and, on the other, to assess the quality, in terms of agricultural, pedological, naturalistic, and landscape values, of non-urbanized areas in their land use plan [10,11].
In this framework, assessing the ESs provided by urban and rural green areas can be a valuable approach to evaluating the overall quality of the territory [12,13,14,15]. In fact, the types and amounts of ESs lost due to land-take depend on the territorial quality [16]. The analysis of the temporal variation in ecosystem services provided by a specific portion of territory allows us to evaluate the effects of land-take on the overall territorial quality.
The heterogeneity of ecosystem services and the contexts in which they occur has led to the development of a variety of methodological approaches for their assessment, with a tendency to focus on a limited number of services, often using highly diverse techniques, making it difficult to compare and integrate different studies.
Some studies evaluate ESs by assigning an economic value to the benefits produced. Costanza et al. [17] were the first to lay the foundations for determining Ecosystem Service Value (ESV), and since then, ESV research has been further developed and applied in various parts of the world [18,19,20,21], especially in China, where a Chinese-specific ESV calculation method has been developed [22]. ESV has often been used as the average value at a regional or national scale, without being able to take into account the spatial variability of the phenomena analyzed [23,24,25]. Some studies on ESV use the economic value of food produced to adapt the global approach to the local scale [18,20,26]; others use net primary productivity (NPP) [25,27,28,29]; others use the changes in agricultural carbon emission and carbon fixation related to agricultural production [30]. Finally, several authors have used ESV to calculate the effect of changes in Land Use/Land Cover (LULC) on ESs provided. In these cases, each land use is given a score that quantifies the economic value of the specific LULC class, which is then multiplied by the area of each LULC class [31,32,33,34]. Sometimes, a weighting value for each ES is defined to account for the relative importance of different ESs in relation to food production from cultivated land [35,36,37,38].
Other studies investigate the topic by involving experts, stakeholders, and citizens, seeking, in particular, to highlight the social and cultural values attributed to ecosystem services. Erős et al. [39] used a stakeholder-based participatory approach to assign the value of three categories of ESs (biodiversity conservation, human utilization, recreational use) for several water bodies in Hungary. Montoya-Tangarife et al. [40] used an expert consultation to assess the potential of each LULC class to provide specific ESs in the Santiago-Valparaíso region in Chile, using a qualitative 0 to 5 scale. Ramirez-Gomez et al. [41] assessed through focus group discussions the impact of changes in the provision of important ESs that indigenous peoples in the lower Caquetá River basin in Colombia have experienced after conducting participatory mapping activities. Kopperoinen et al. [42] involved both experts as well as local and regional stakeholders in assessing ES provision in southern Finland, while Frank et al. [43] formulated six possible scenarios together with experts from the regional planning authority and used Multi-Criteria Evaluation to calculate the contribution of all land-use classes to the provision of ESs on a 0 to 100 scale.
Finally, several studies use LULC data within spatially localized models, the most widely used of which is InVEST (Integrated Valuation of Ecosystem Services and Tradeoffs), consisting of a set of modeling 3.16.2. software used to map and evaluate ecosystem services. Different InVEST models have been used: the Habitat Quality model, to assess habitat quality and the impact of anthropogenic pressures on biodiversity [44,45,46]; the Sediment Delivery Ratio model, which estimates the amount of sediment transported and retained, is useful for soil management and assess water quality [44,47,48,49]; the Carbon Storage model, which aims to quantify the carbon stored in the various components of the environmental system (vegetation, soil, etc.) [44,50]; the Water Yield model, which estimates potential water availability as a function of land use as well as climatic and topographical characteristics [44,47,48,50,51]; and the Nutrient Delivery Ratio model, which evaluates the transport of nutrients (such as nitrogen and phosphorus) across the land, contributing to the analysis of eutrophication and diffuse pollution [47,52].
Several studies combine, in different ways, one or more of the approaches/methodologies outlined above [53]. Among the methodologies that use spatially localized LULC data to assess ESs, simultaneously applying Multi-Criteria Analysis to determine the relative importance of the different ESs and developing hypothetical scenarios involving interested stakeholders, the one developed by Senes et al. [54] seems to be extremely valid, even if it has been applied at the municipal level and only to quantify the actual situation. This methodology, providing relative indicators on a 0 to 1 scale, does not produce an economic estimate of ESs, which is often very difficult (or arbitrary), especially for those services that are difficult to monetize.
Furthermore, it is able to incorporate stakeholder engagement without losing the spatialization of the information. Moreover, compared to other spatially based methodologies such as InVEST models, it is able to more easily integrate the different types of ESs (particularly cultural ones) in order to calculate a composite index. Finally, it is particularly suited to the Italian context, with its typical socio-territorial variability and limited data availability.
This methodology constructs a composite quality index (CQI) that synthesizes various indicators derived from spatial and environmental data, each associated with specific ecosystem services, identified using the CICES V.5.1 classification [55]. It also involves the use of the Analytic Hierarchy Process (AHP) to assign weights to the indicators, thus allowing for the production of flexible and territorially contextualized assessment scenarios. A further strength of the methodology is the exclusive use of official, accessible, and easily available data from institutional sources (such as regional, provincial, and municipal databases), which ensures the reproducibility of the analysis and the possibility of extending it to other territorial contexts.
In this context, the aim of the study was to assess the impact of land-take over time, one of the main threats to environmental quality and territorial sustainability, on the provision of ecosystem services. The analysis focuses on the Province of Monza–Brianza, the Italian province with the highest land-take, examining the evolution of ecosystem services provided by NUAs between 1999 and 2021. Given the successful application of the methodology developed by Senes et al. [54], this was utilized as a basis for the present study adapting it to the provincial scale.

2. Materials and Methods

The study area (Figure 1) is the Province of Monza–Brianza (Lombardy Region, Northern Italy), consisting of 55 municipalities with a total area of 405.1 sq.km. It is a very densely populated area, with about 880,000 inhabitants and a population density of approximately 2170 inhabitants per sq.km, according to 2024 data from the Italian National Institute of Statistics [56]. Approximately 56% of the territory is urbanized, 33% is agricultural, and the remaining 11% consists of wooded areas and natural/semi-natural environments, according to the most recent LULC data available at the regional level, coming from the DUSAF (Agricultural and Forestry Land Use) database, version 7.0 (dated 2021), a geographic database (with a resolution of 1:10,000) based on the photointerpretation of digital orthophotos.
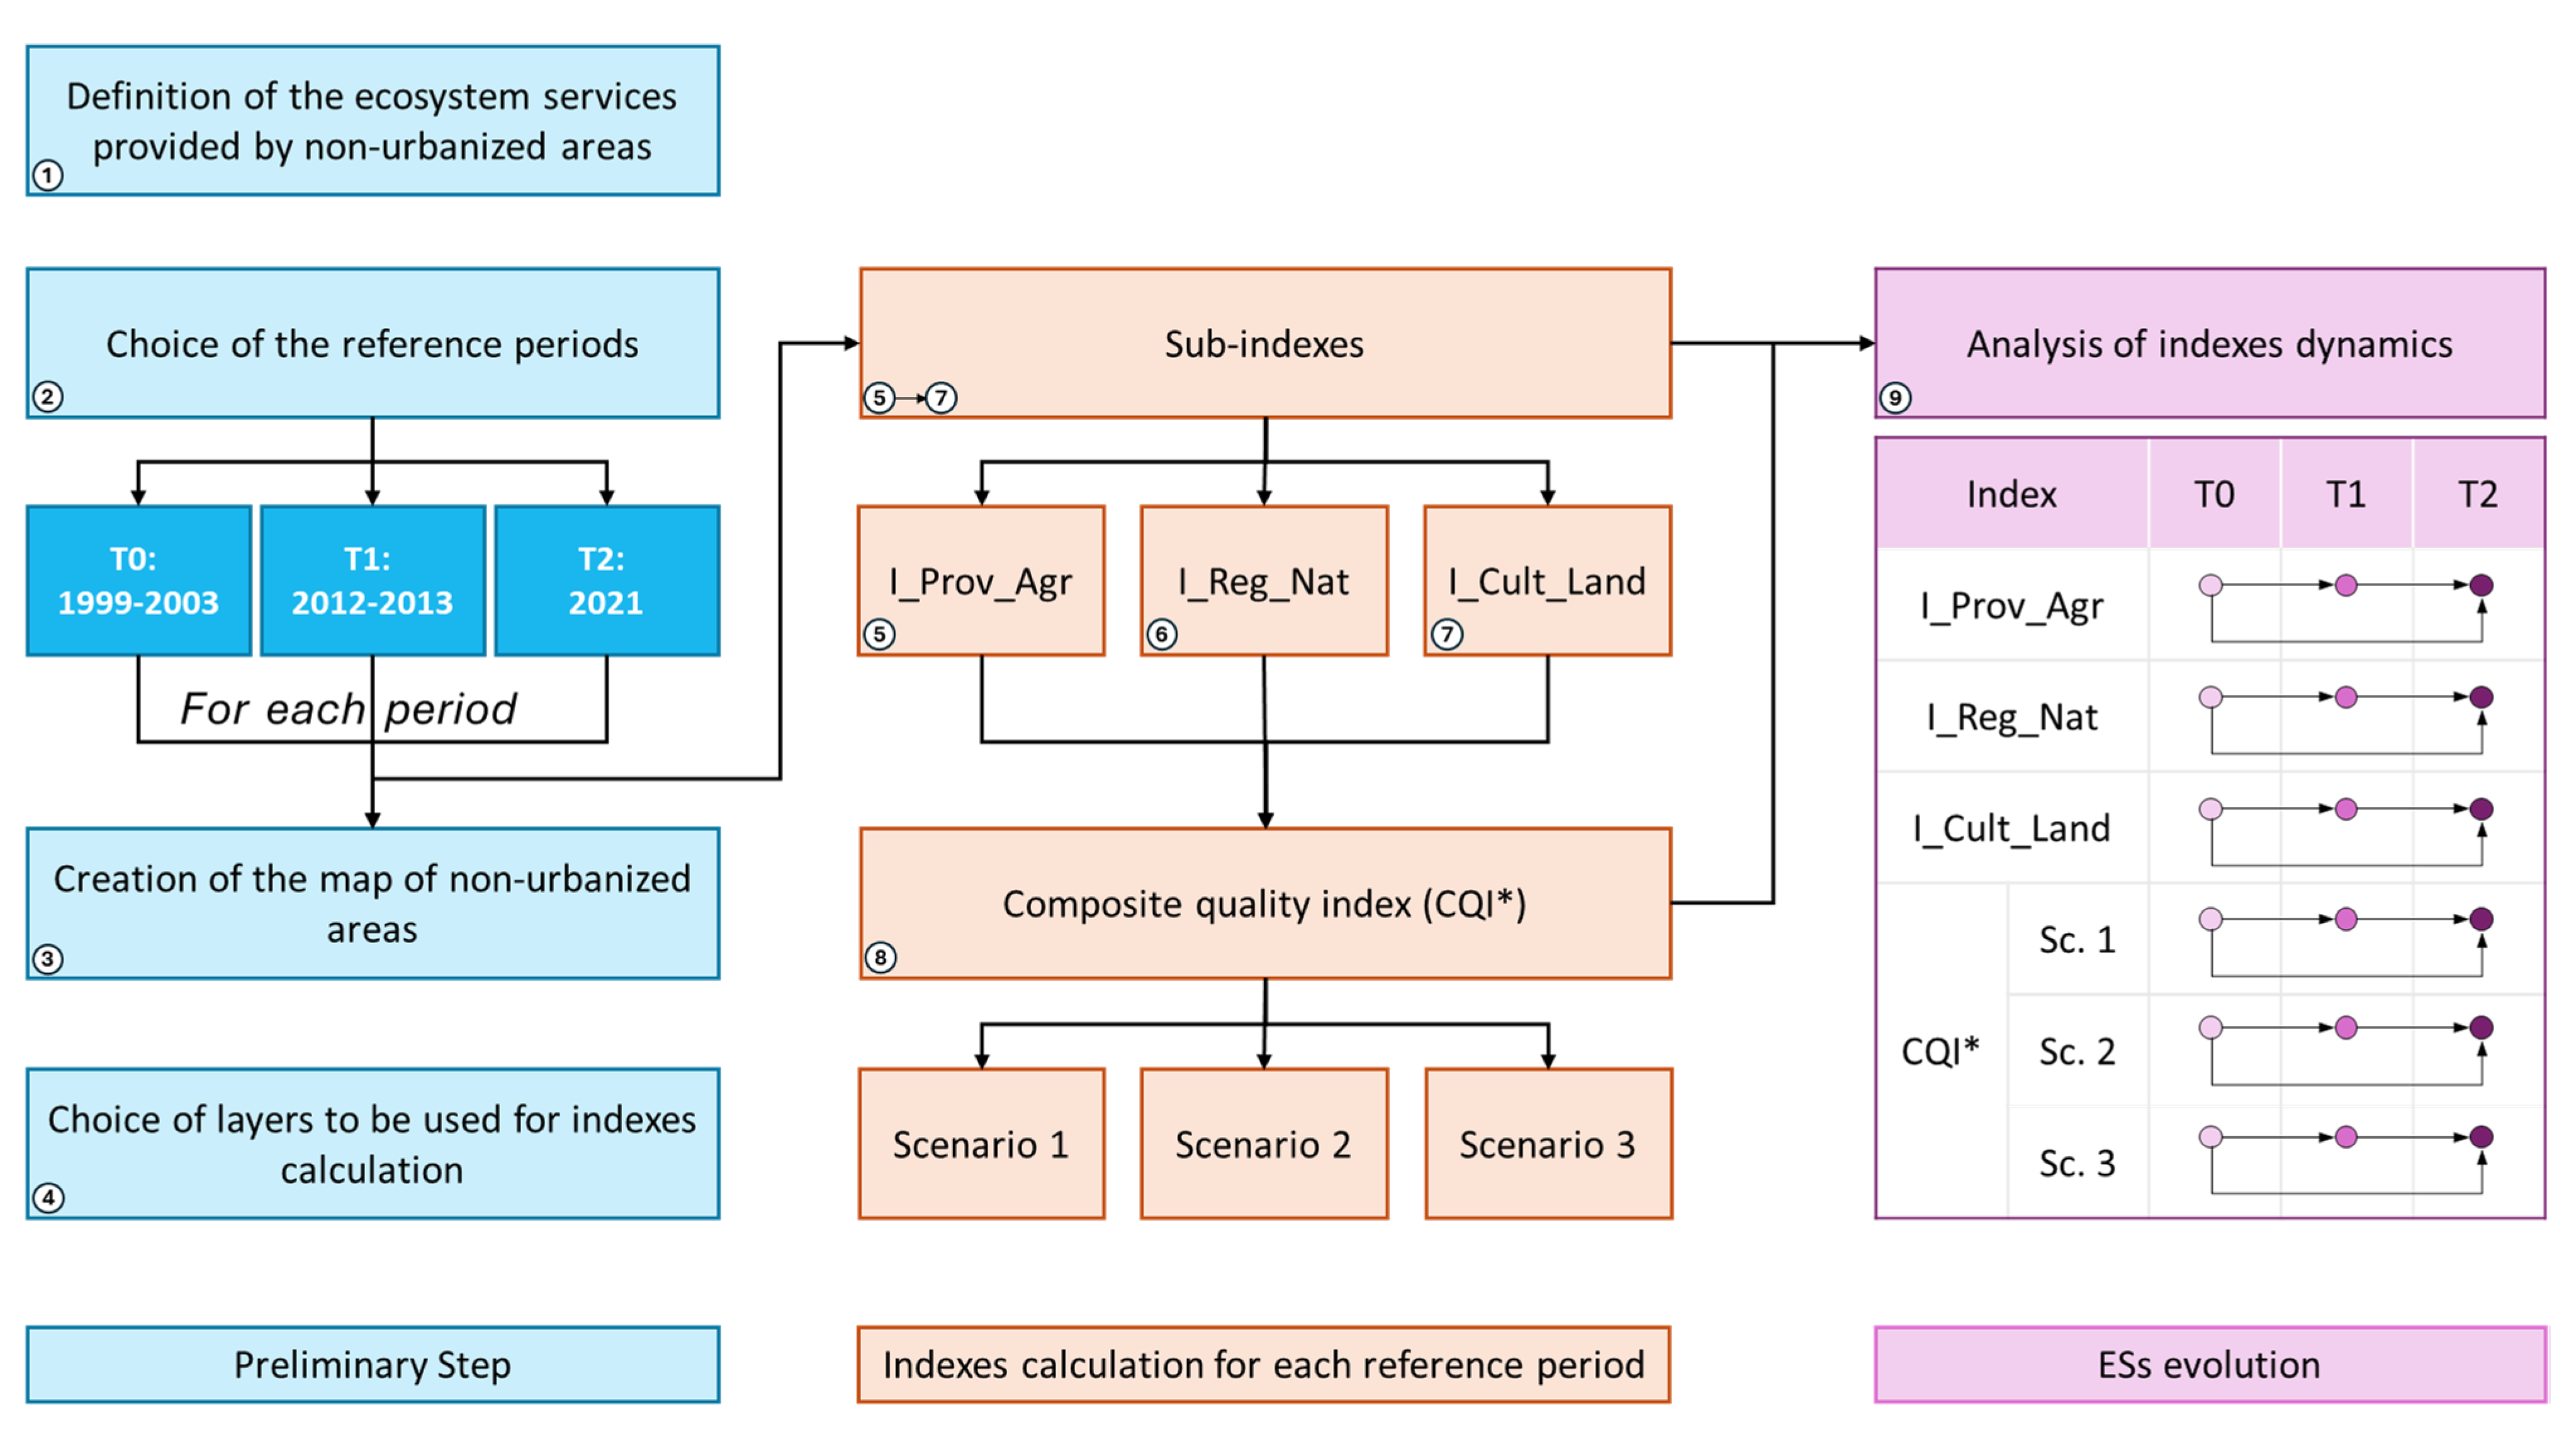
The methodology, based on the study of Senes et al. [54], consists of 3 main steps, each of which is divided into one or more phases (Figure 2).
Research manuscripts reporting large datasets that are deposited in a publicly available database should specify where the data have been deposited and provide the relevant accession numbers. If the accession numbers have not yet been obtained at the time of submission, please state that they will be provided during review. They must be provided prior to publication.

2.1. Preliminary Step

This is the first step, which includes the preliminary phases in which the initial choices regarding the ES and the periods to be considered are made, as well as the basic information to be used for calculating the indices and defining the NUAs is decided.

2.2. Phase 1: Definition of the ESs Provided by NUAs

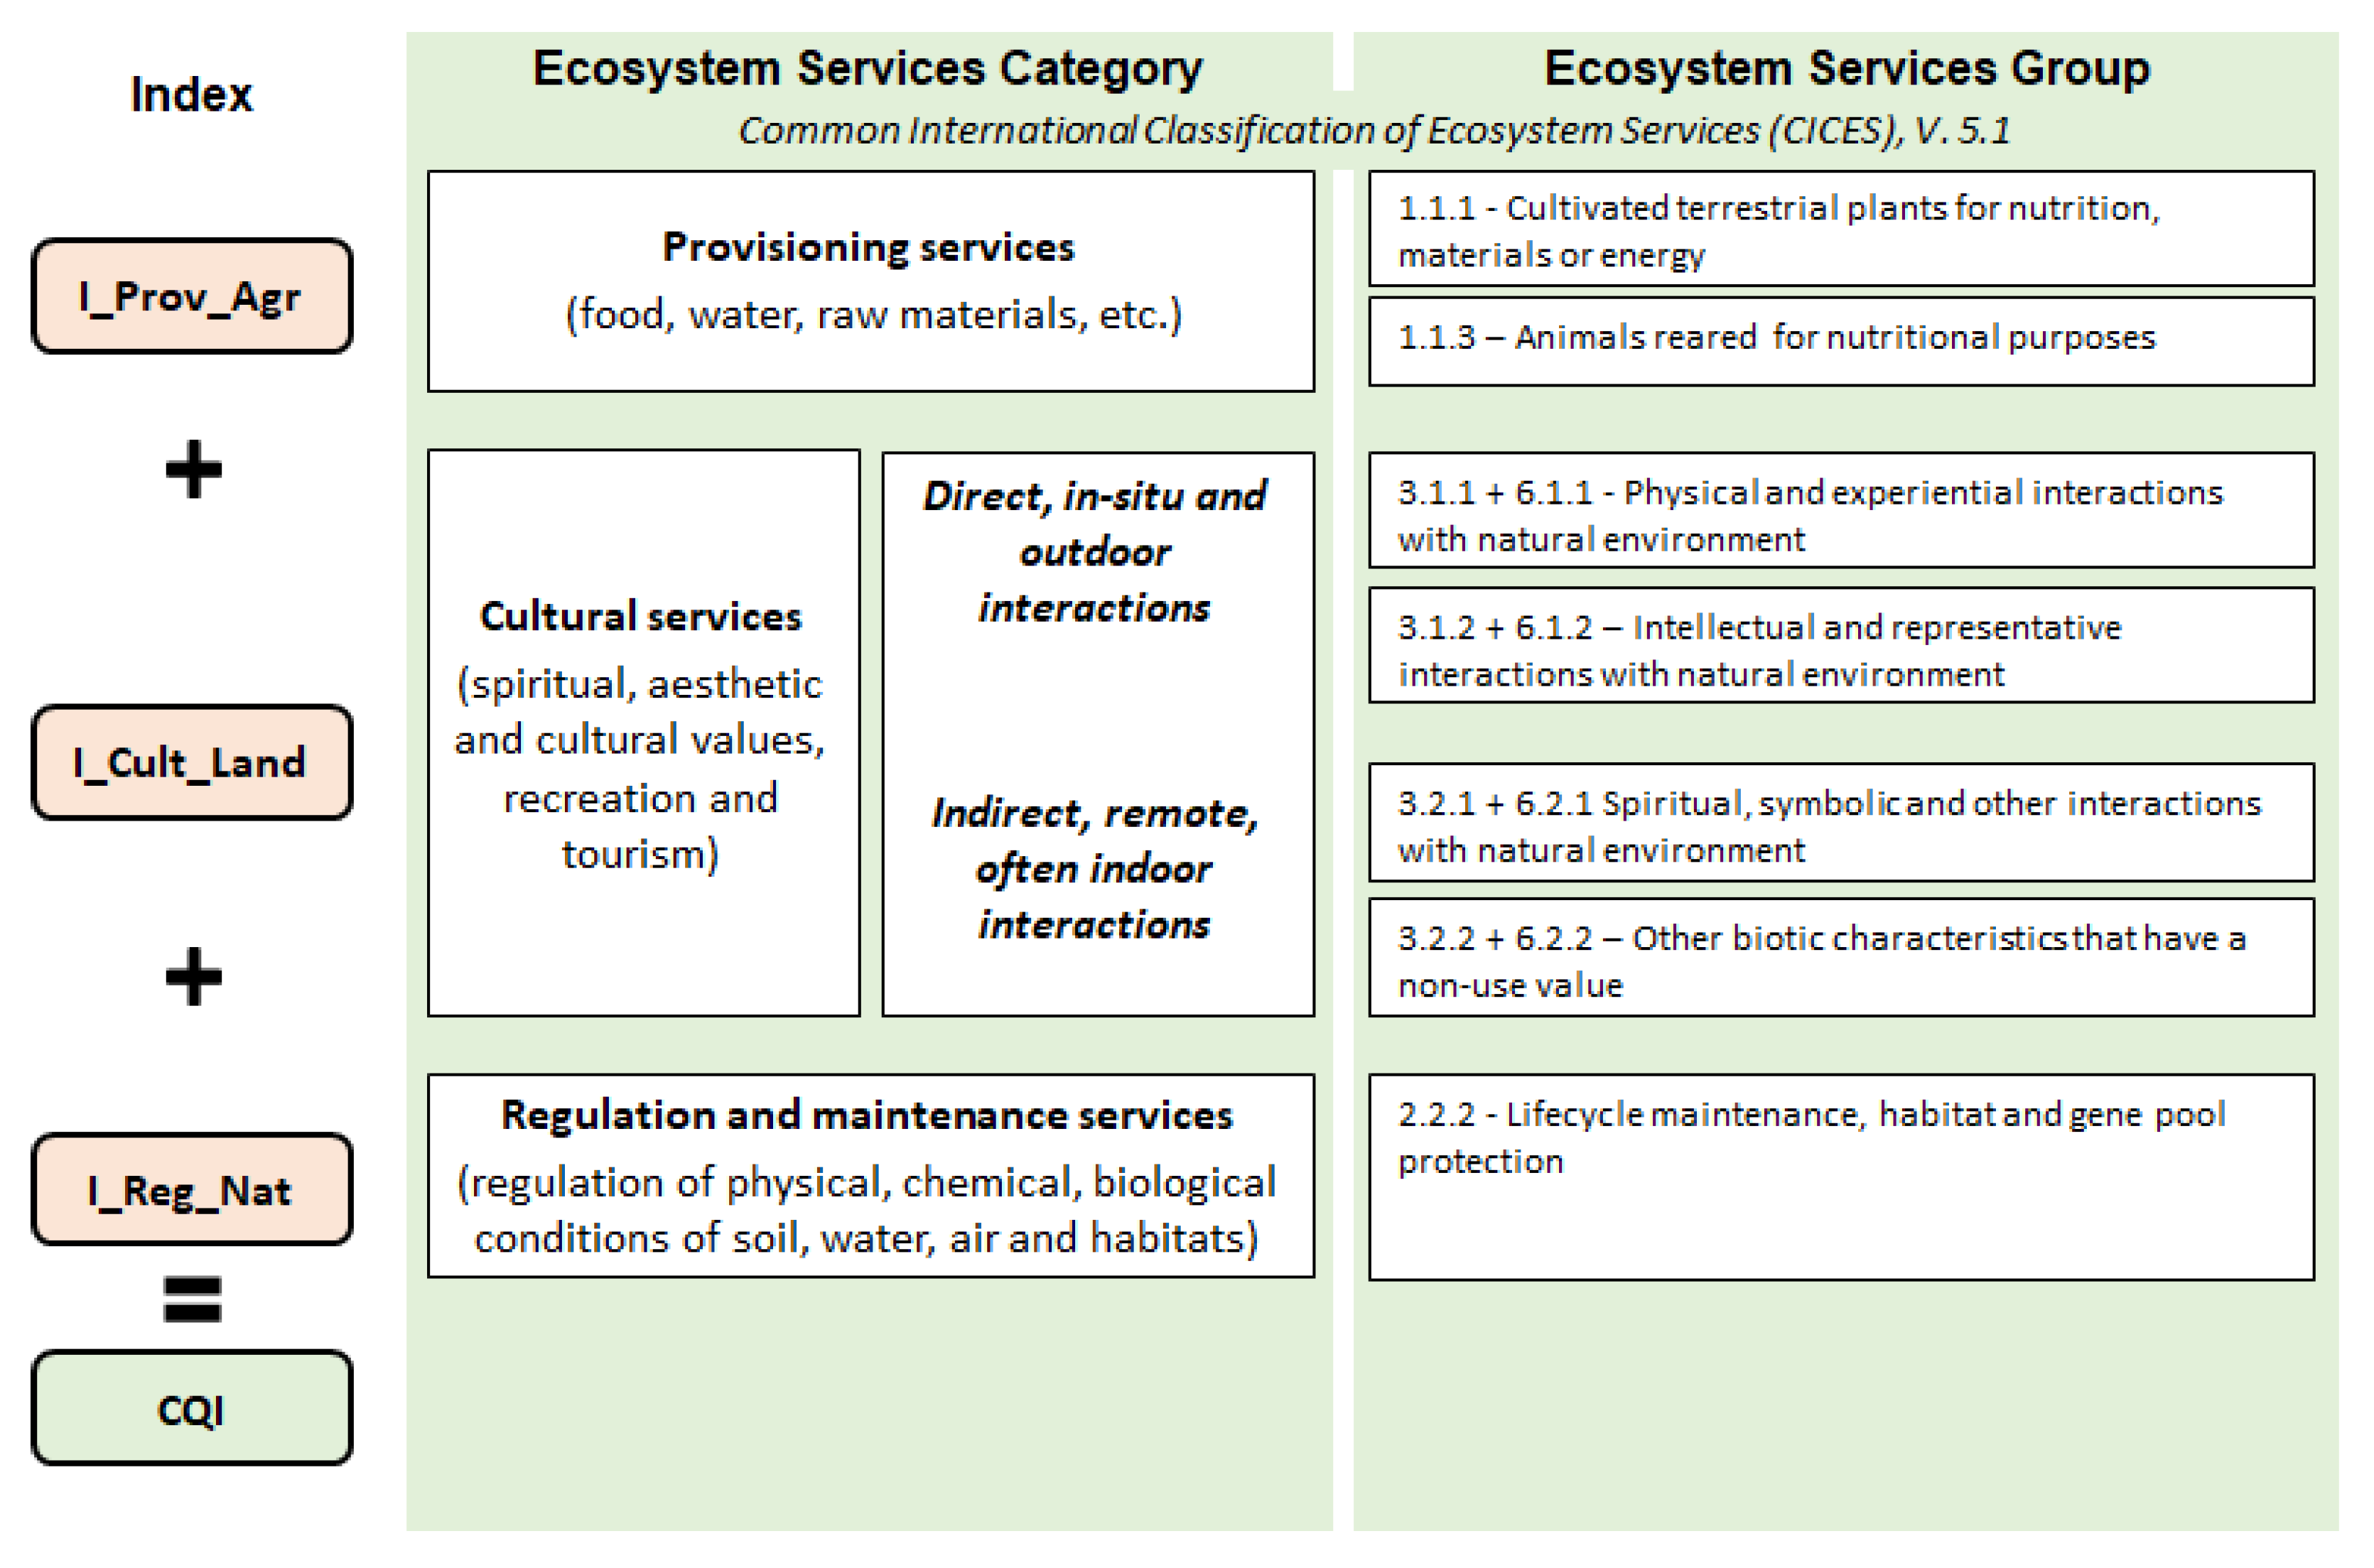
The ecosystem services (ESs) provided by NUAs considered in this study are based on the CICES V.5.1 classification and the methodology of Senes et al. [54] (Figure 3). The ESs are assessed through a series of indices, related to agricultural production, natural resources, and landscape, and then summarized through a composite index.

2.3. Phase 2: Choice of the Reference Periods

Given the aim of the study was to analyze the temporal evolution of ESs, it was necessary to define time thresholds for assessing the capacity of NUAs provided to them. The choice of these thresholds was primarily driven by the availability of data, which had to be official, accessible, available at the appropriate scale, and with a defined update or creation date. At the end of the evaluation phase, three time periods, not perfectly coeval, were identified: (i) the first between 1999 and 2003 (T0); (ii) the second between 2012 and 2013 (T1); (iii) the third referring to 2021 (T2). In T0 and T1, time intervals have been used because data with the same reference date were not always available. The data used are derived from regional or provincial databases (updated to 2003, 2013, and 2021). For LULC data (coming from the DUSAF database, Lombardy Region, scale 1:10,000) the dates closest to these time periods were chosen, i.e., 1999 (DUSAF 1.1), 2012 (DUSAF 4.0), and 2021 (DUSAF 7.0).
Using periods rather than specific dates can certainly lead to potential bias in trend attribution, even though the temporal variations in ESs provided by NUAs due to land-take are appreciable in the long term, while they are negligible from one year to the next, especially at the provincial scale. The impact of small time variations within the same period (at most 4 years, in T0) has very little impact on the index value and its trend, while the advantage of using official data produced by the region is enormous, as the databases used to calculate the indices are the same ones used by municipalities, provinces, and the region for urban and territorial planning.

2.4. Phase 3: Creation of the NUAs Map

The identification of NUAs was based on the LULC classes derived from the Lombardy Region’s DUSAF databases for 1999 (DUSAF 1.1), 2012 (DUSAF 4.0), and 2021 (DUSAF 7.0). The following steps were undertaken: (i) selection of non-urbanized areas; (ii) verification of dubious land use classes using satellite images; (iii) creation of NUA maps for each period (Figure 4). The image verification were performed using digital orthophotos available through the Lombardy Region geo-portal.

2.5. Phase 4: Choice of the Layers to Be Used for Indexes Calculation

For each ecosystem service, the most suitable databases for calculating the relative index were identified. The data had to be official, accessible, available at the appropriate scale, and updated to one of the dates considered (Table 1).
In this study, the I_Reg_Soil index defined by Senes et al. [54] to evaluate the regulating ESs related to the soil characteristics was not calculated. There are no data available for the different periods considered since the soil characteristics did not change in the last 25 years.

2.6. Step 2: Indexes Calculation for Each Reference Period

This is the second step, in which, for each reference period, the indices were calculated for each of the three scenarios considered.

2.7. Phase 5: Assessment of Provisioning ESs and Calculation of the I_Prov_Agr Index

To calculate the index related to provisioning ESs coming from agriculture, the methodology of [54] was adapted to the current study. The calculation of the I_Prov_Agr index involves the assignment of a score (SAgr) that expresses the intensity and the economic value of the agricultural activity (Table 2). The calculation was performed for each time threshold, applying the following formula:
I _ P r o v _ A g r [ 0 1 ] =   S A g r 125
where
I_Prov_Agr is the index that expresses provisioning Ess related to agricultural activity;
SAgr is the score related to the intensity and the economic value of the agricultural land-use class.
Table 2. Scores (SAgr) assigned to land-use classes and calculation of the I_Prov_Agr Index.
Land Use ClassSAgrI_Prov_Agr
Vineyards and orchards1251.00
Horticulture, floriculture, and plant nurseries in greenhouses1100.88
Crops, vegetable gardens, meadows, horticulture, floriculture, and plant nurseries (not in greenhouses).1000.80
Farms and agricultural production settlements900.72
Poplars250.20

2.8. Phase 6: Assessment of Regulating ESs and Calculation of the I_Reg_Nat Index

The index related to regulating ESs provided by natural resources was calculated by assigning differentiated scores based on the naturalistic value of the land, its capacity to protect biodiversity, and the land use/cover (natural or agricultural). The assigned scores have been partially modified from Senes et al. [54] (Table 3 and Table 4). The index was calculated, for each period, by applying the following formula:
I _ R e g _ N a t [ 0 1 ] = B i o P r o t   ·   N V S   ·   L _ U s e         ,       B i o P r o t >   0 0,1 ,       B i o P r o t   =   0     L _ U s e   =   1 0 ,         B i o P r o t =   0     L _ U s e     1
where
B i o P r o t represents the score based on the level of Biodiversity Protection;
N V S indicates the score based on the Naturalistic Value of Soils;
and L _ U s e corresponds to the score based on the type of land use.
Table 3. Scores assigned to the different typologies of biodiversity protection.
LayerTypologyScore
Protected area and local parkNatura 2000 sites1.00
Priority areas of intervention1.00
Natural parks0.75
Regional parks0.50
Local parks0.25
Regional ecological networkPrimary elements0.50
Secondary elements0.25
Priority areas for biodiversityPriority areas for biodiversity0.50
Provincial ecological networkPrimary corridors0.25
Secondary corridors0.15
Table 4. Scores assigned to the naturalistic value of soils and to LULC classes.
Naturalistic Value of SoilsLand Use/Land Cover
ClassScoreClassScore
High *1.1Natural1.0
Medium1.0Agricultural0.9
Low1.0Urban0.0
* According to ref. [54], only an high naturalistic value of soils can slightly increase the naturalistic quality of a territory.

2.9. Phase 7: Assessment of Cultural ESs and Calculation of the I_Cult_Land Index

The I_Cult_Land index was calculated by assigning scores related to the ESs provided by landscape, using those of Senes et al. [54], if possible, and assigning new ones when different databases were used. Table 5 shows all the scores used. The index was calculated, for each period, by applying the following formula:
I _ C u l t _ L a n d [ 0 1 ] = M a x   ( L a n d _ R e s ; S c _ T r a i l s ; L E P P ; L U L C )
where
L a n d _ R e s represents the score based on the Landscape Restrictions;
S c _ T r a i l s indicates the score based on the presence of Historical and Scenic trails;
L E P P corresponds to the score based on the presence of Landscape Elements coming from Provincial Plans;
and L U L C corresponds to the score based on the LULC class.
Table 5. Scores assigned to calculate the I_Cult_Land Index.
Landscape
Restrictions
(Land_Res) *
Historical and
Scenic Trails
(Sc_Trails)
Landscape Elements
from Provincial Plans
(LEPP)
Land Use/Land Cover (LULC)
ClassScoreClassScoreClassScoreClassScore
yes1.0yes1.0Historical gardens1.0Woods0.8
no0.0no0.0Monumental trees1.0Vineyards0.6
Geosites1.0Riparian woods0.4
Areas of landscape significance0.8Wetland vegetation0.4
Rural settlements of landscape significance (50 m buffer)0.6Bush with trees0.4
* According to ref. [54], landscape restrictions are areas, identified by the regional landscape plan, to be protected from transformation for their high landscape value. For this reason, they have been assigned a maximum score of 1.

2.10. Phase 8: Calculation of Composite Index

For each of the three periods considered, the previously calculated indices were aggregated to calculate an overall quality index (CQI*), which represents the total ESs provided by the NUAs and differs from the CQI of [54] in that it does not include I_Reg_Soil. However, as previously highlighted, since its value has not changed over the last 20 years, the trend evaluation of the other three calculated indicators and of CQI* are not influenced by this exclusion.
The composite quality index is calculated using a weighted sum:
C Q I i *   =   I P r o v A g r · W A g r + I R e g N a t ·   W N a t   + I C u l t L a n d · W L a n d
where
W A g r is the weight of provisioning ESs coming from agriculture;
W N a t is the weight of regulating ESs related to natural resources,
W L a n d is the weight of cultural ESs related to landscape;
and
W A g r + W N a t + W L a n d = 1
The weight of each indicator expresses the relative importance that the related indicator assumes in the calculation of the composite index. To evaluate how the attribution of a different importance to each index by planners and the communities involved can influence the final value of the composite index, three alternative hypothetical scenarios were defined using the Analytic Hierarchy Process [57].
Three categories of stakeholders were involved (local planners, environmental associations, university researchers) for a total of 15 people. The weights for each scenario have been calculated as the average of the scores each stakeholder entered in the corresponding Saaty matrix.
The three scenarios are as follows (Table 6): (i) the three indices have the same importance; (ii) ESs related to natural resources have greater importance than the others; (iii) ESs provided related to landscape have greater importance than the others.

2.11. Step 3: ESs Evolution

It is the final step, in which the evolution of the ESs provided by NUAs in the study area was evaluated, through the analysis of the variation over time of the individual indices and of the composite one in the different hypothesized scenarios.

2.12. Phase 9: Analysis of Indexes Dynamics

In order to assess the variations over time of the various calculated indices, the value of each index was calculated for each municipality (IMUN) and for the entire study area (IPROV), considering both the entire municipal (MUN) or provincial (PROV) area and only the portion of non-urbanized areas (NUAs). Specifically, the following formulas were applied:
I M U N x =   i = 1 n ( I i   ·   A i ) M U N x
I N U A s x = i = 1 n ( I i   ·   A i ) N U A S x
where
I M U N x represents the global value of the index ( I _ R e g _ N a t , I _ C u l t _ L a n d , I _ P r o v _ A g r , C Q I i * ) referred to the surface area of the x-th municipality ( M U N x );
I i represents the value of the index ( I _ R e g _ N a t , I _ C u l t _ L a n d , I _ P r o v _ A g r , C Q I i * ) of the i-th area of the x-th municipality;
A i represents the extension in sq.km of the i-th area of the x-th municipality;
I N U A s x represents the global value of the index referred only to the non-urbanized areas of the x-th municipality ( N U A S x );
I P R O V = i = 1 n ( I i   ·   A i ) P R O V
I N U A s P R O V = i = 1 n ( I i   ·   A i ) N U A S P R O V
where
I P R O V represents the global value of the index ( I _ R e g _ N a t , I _ C u l t _ L a n d , I _ P r o v _ A g r , C Q I i * ) referred to the surface area of province (PROV);
I i represents the value of the index ( I _ R e g _ N a t , I _ C u l t _ L a n d , I _ P r o v _ A g r , C Q I i * ) of the i-th area of the province;
A i represents the extension in sq.km of the i-th area of the province;
I N U A s P R O V represents the global value of the index referred only to the non-urbanized areas of the province ( N U A S P R O V ).
Once the values of each index (I_Reg_Nat, I_Cult_Land, I_Prov_Agr, C Q I i * ) has been calculated for each municipality and for the province, the absolute and percentage variation that occurred over time was calculated. For the municipal indices, the results were divided into classes to facilitate their analysis and highlight which municipalities had experienced (i) a decrease in the value of the municipal index greater than 20%, (ii) a decrease between 5% and 20%, (iii) a variation within ±5% (stable value), and (iv) an increase between 5% and 20%, (v) or greater than 20%.

3. Results and Discussion

3.1. Land-Take and NUAs Evolution

Between T0 and T2, a loss of 18.4 sq.km of NUAs (−8.3%) was recorded in the Province of Monza–Brianza (Table 7). The reduction was more pronounced in the first period (T0-T1), when 7.7% of NUAs were lost; in the second period (T1-T2), the reduction was smaller, being equal to 0.7%.
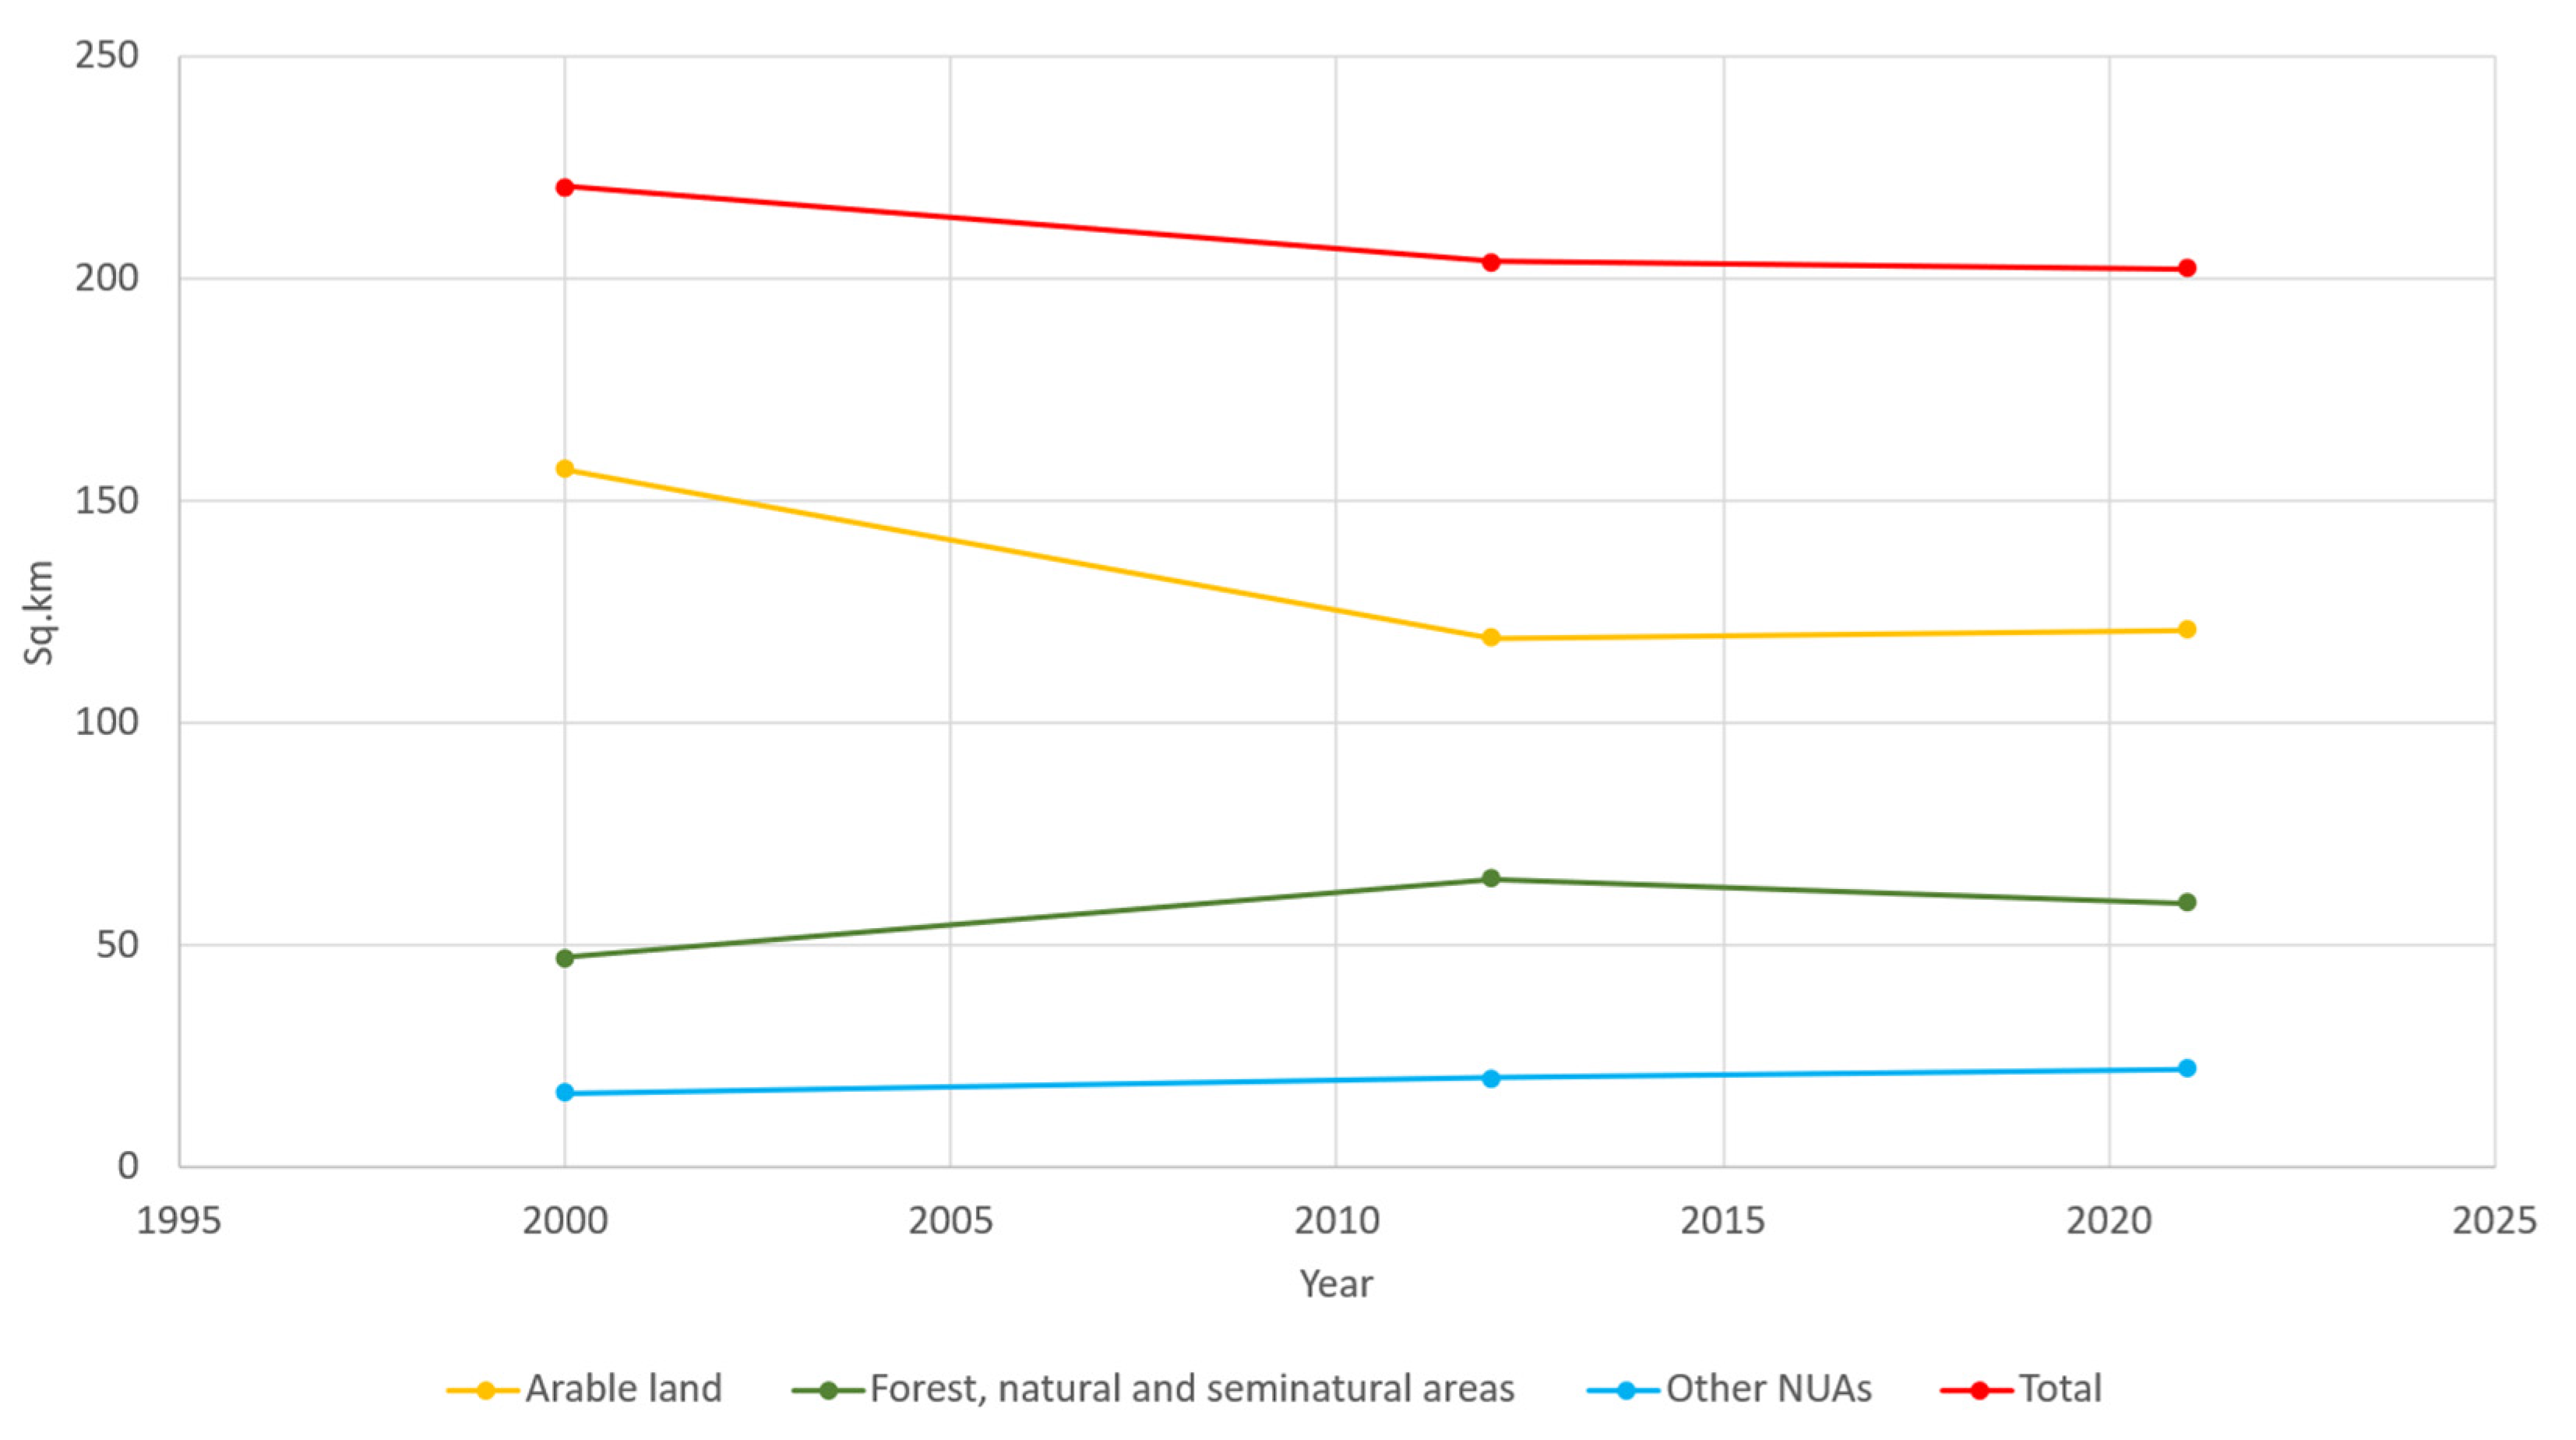
Overall (T0–T2), despite a significant decrease in arable land (−36.1 sq.km), there was an increase in forests and natural and semi-natural areas (+12.3 sq.km) and other NUAs (+5.4 sq.km) (Table 7 and Figure 5). The slight increase in arable land recorded between T1 and T2 is due to the change in the interpretation of some LULC classes, such as the green areas of motorway junctions, which were included in the “Infrastructure” class in T0, while they were included in the “green areas attached to road infrastructures” class in T1. This is, of course, a limitation that generates some uncertainty in the interpretation of the results, even if at the provincial scale the impact is truly limited.
Analyzing the changes between each LULC class (Table 8, Figure 6), it can be seen that more than 70% of the arable land has remained unchanged, more than 10% has been transformed into the forest and natural and semi-natural class, and the same amount transformed into urbanized areas (UAs), mainly industrial, commercial, and sport areas (the main driver of land-take). The forest and natural and semi-natural class, on the one hand, showed an increase (+12.2 sq.km), essentially due to the abandonment of agricultural land (20.4 sq.km of arable land has transformed into forest and natural and semi-natural areas). On the other hand, we recorded a worrying phenomenon of land-take in favor of residential areas (1.7 sq.km) and industrial, commercial, and sport areas (1.7 sq.km).
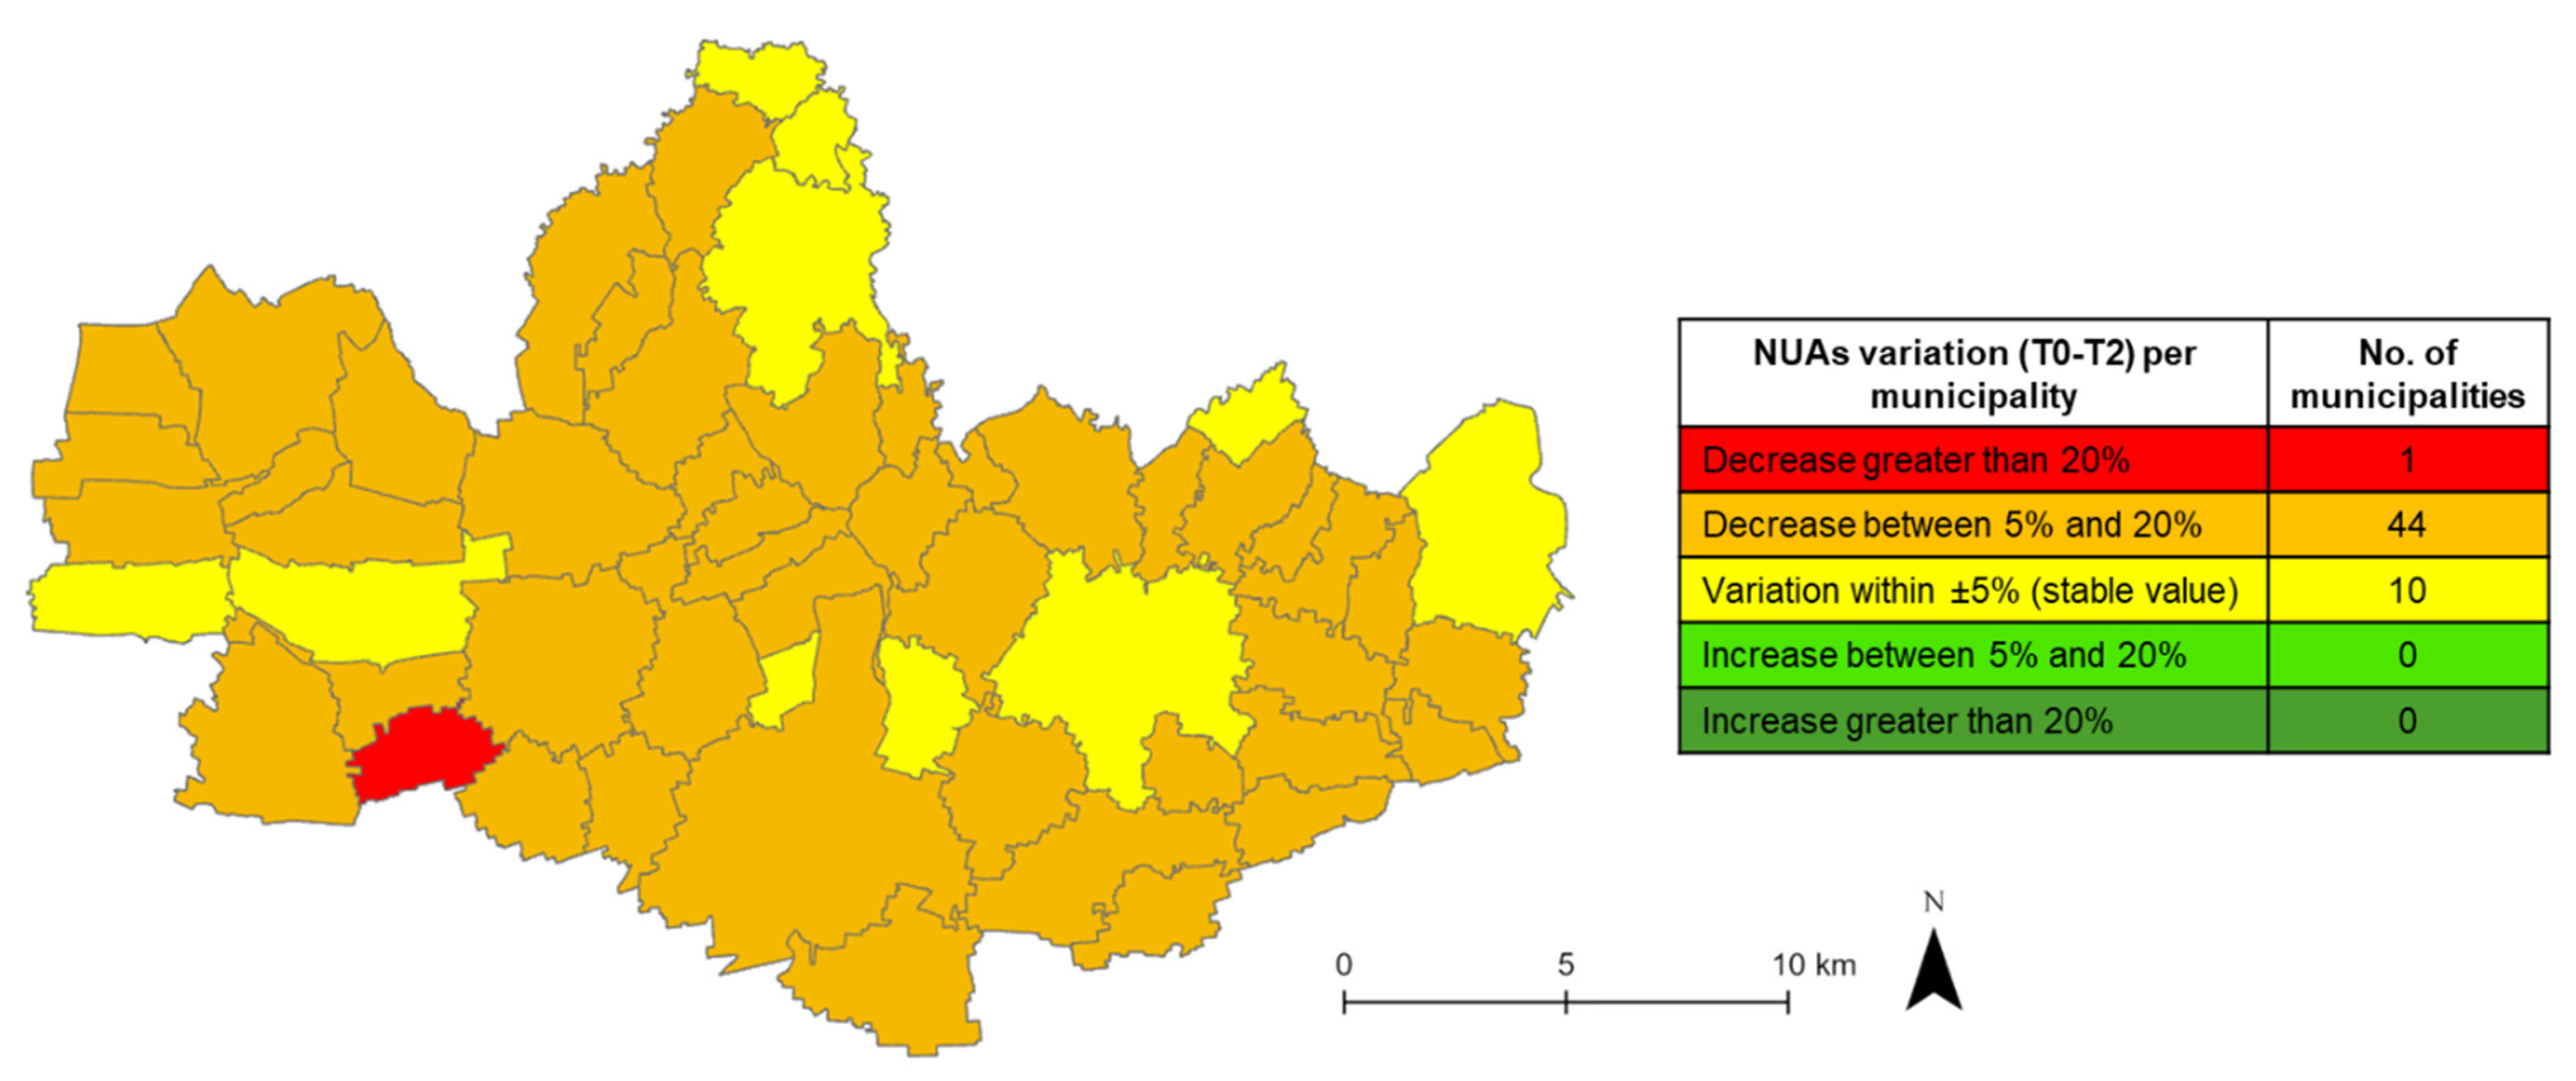
The analysis at the municipal level across the 55 municipalities confirms a generalized reduction in NUAs across all the municipalities examined. Specifically, one municipality (Varedo) experienced a decline of more than 20%, 44 municipalities experienced a reduction between 5 and 20%, and 10 municipalities experienced general stability (variation within ±5%) (Figure 7).

3.2. Evolution of the Provisioning ESs Coming from Agriculture (I_Prov_Agr Index)

The I_Prov_AgrPROV of the study area from T0 to T2 decreased from a value of 0.340 (T0) to 0.284 (T2). This trend reflects the progressive land-take within the province. When referring only to NUAs, I_Prov_AgrNUAs records a less marked decrease, from 0.624 (T0) to 0.569 (T2) (Table 9).
Although indices calculated only on NUAs may lead to an overestimation of the ESs provided, data suggest that the reduction in ESs provided by agricultural areas is mainly due to their reduction over time and that the remaining agricultural areas maintain a reasonable capacity to provide ESs. This is the first negative consequence of land-take: the erosion of the green infrastructure leads to an inevitable reduction in ESs provided, with a detriment to human society. The overall decrease of −0.056 (−16.5%) reflects the significant decline in agricultural areas (−23.0% of arable land between T0 and T2) (Table 7). Furthermore, the reduction of I_Prov_AgrNUAs, although significantly smaller, highlights that the amount of ESs provided per unit of non-urbanized area has also decreased, demonstrating that land-use planning policies have failed to safeguard and enhance the most valuable agricultural areas, thus counteracting the reduction in agricultural area.
Finally, it is clear that the increase in forests and natural and semi-natural areas has failed to provide the ESs typical of agricultural areas.
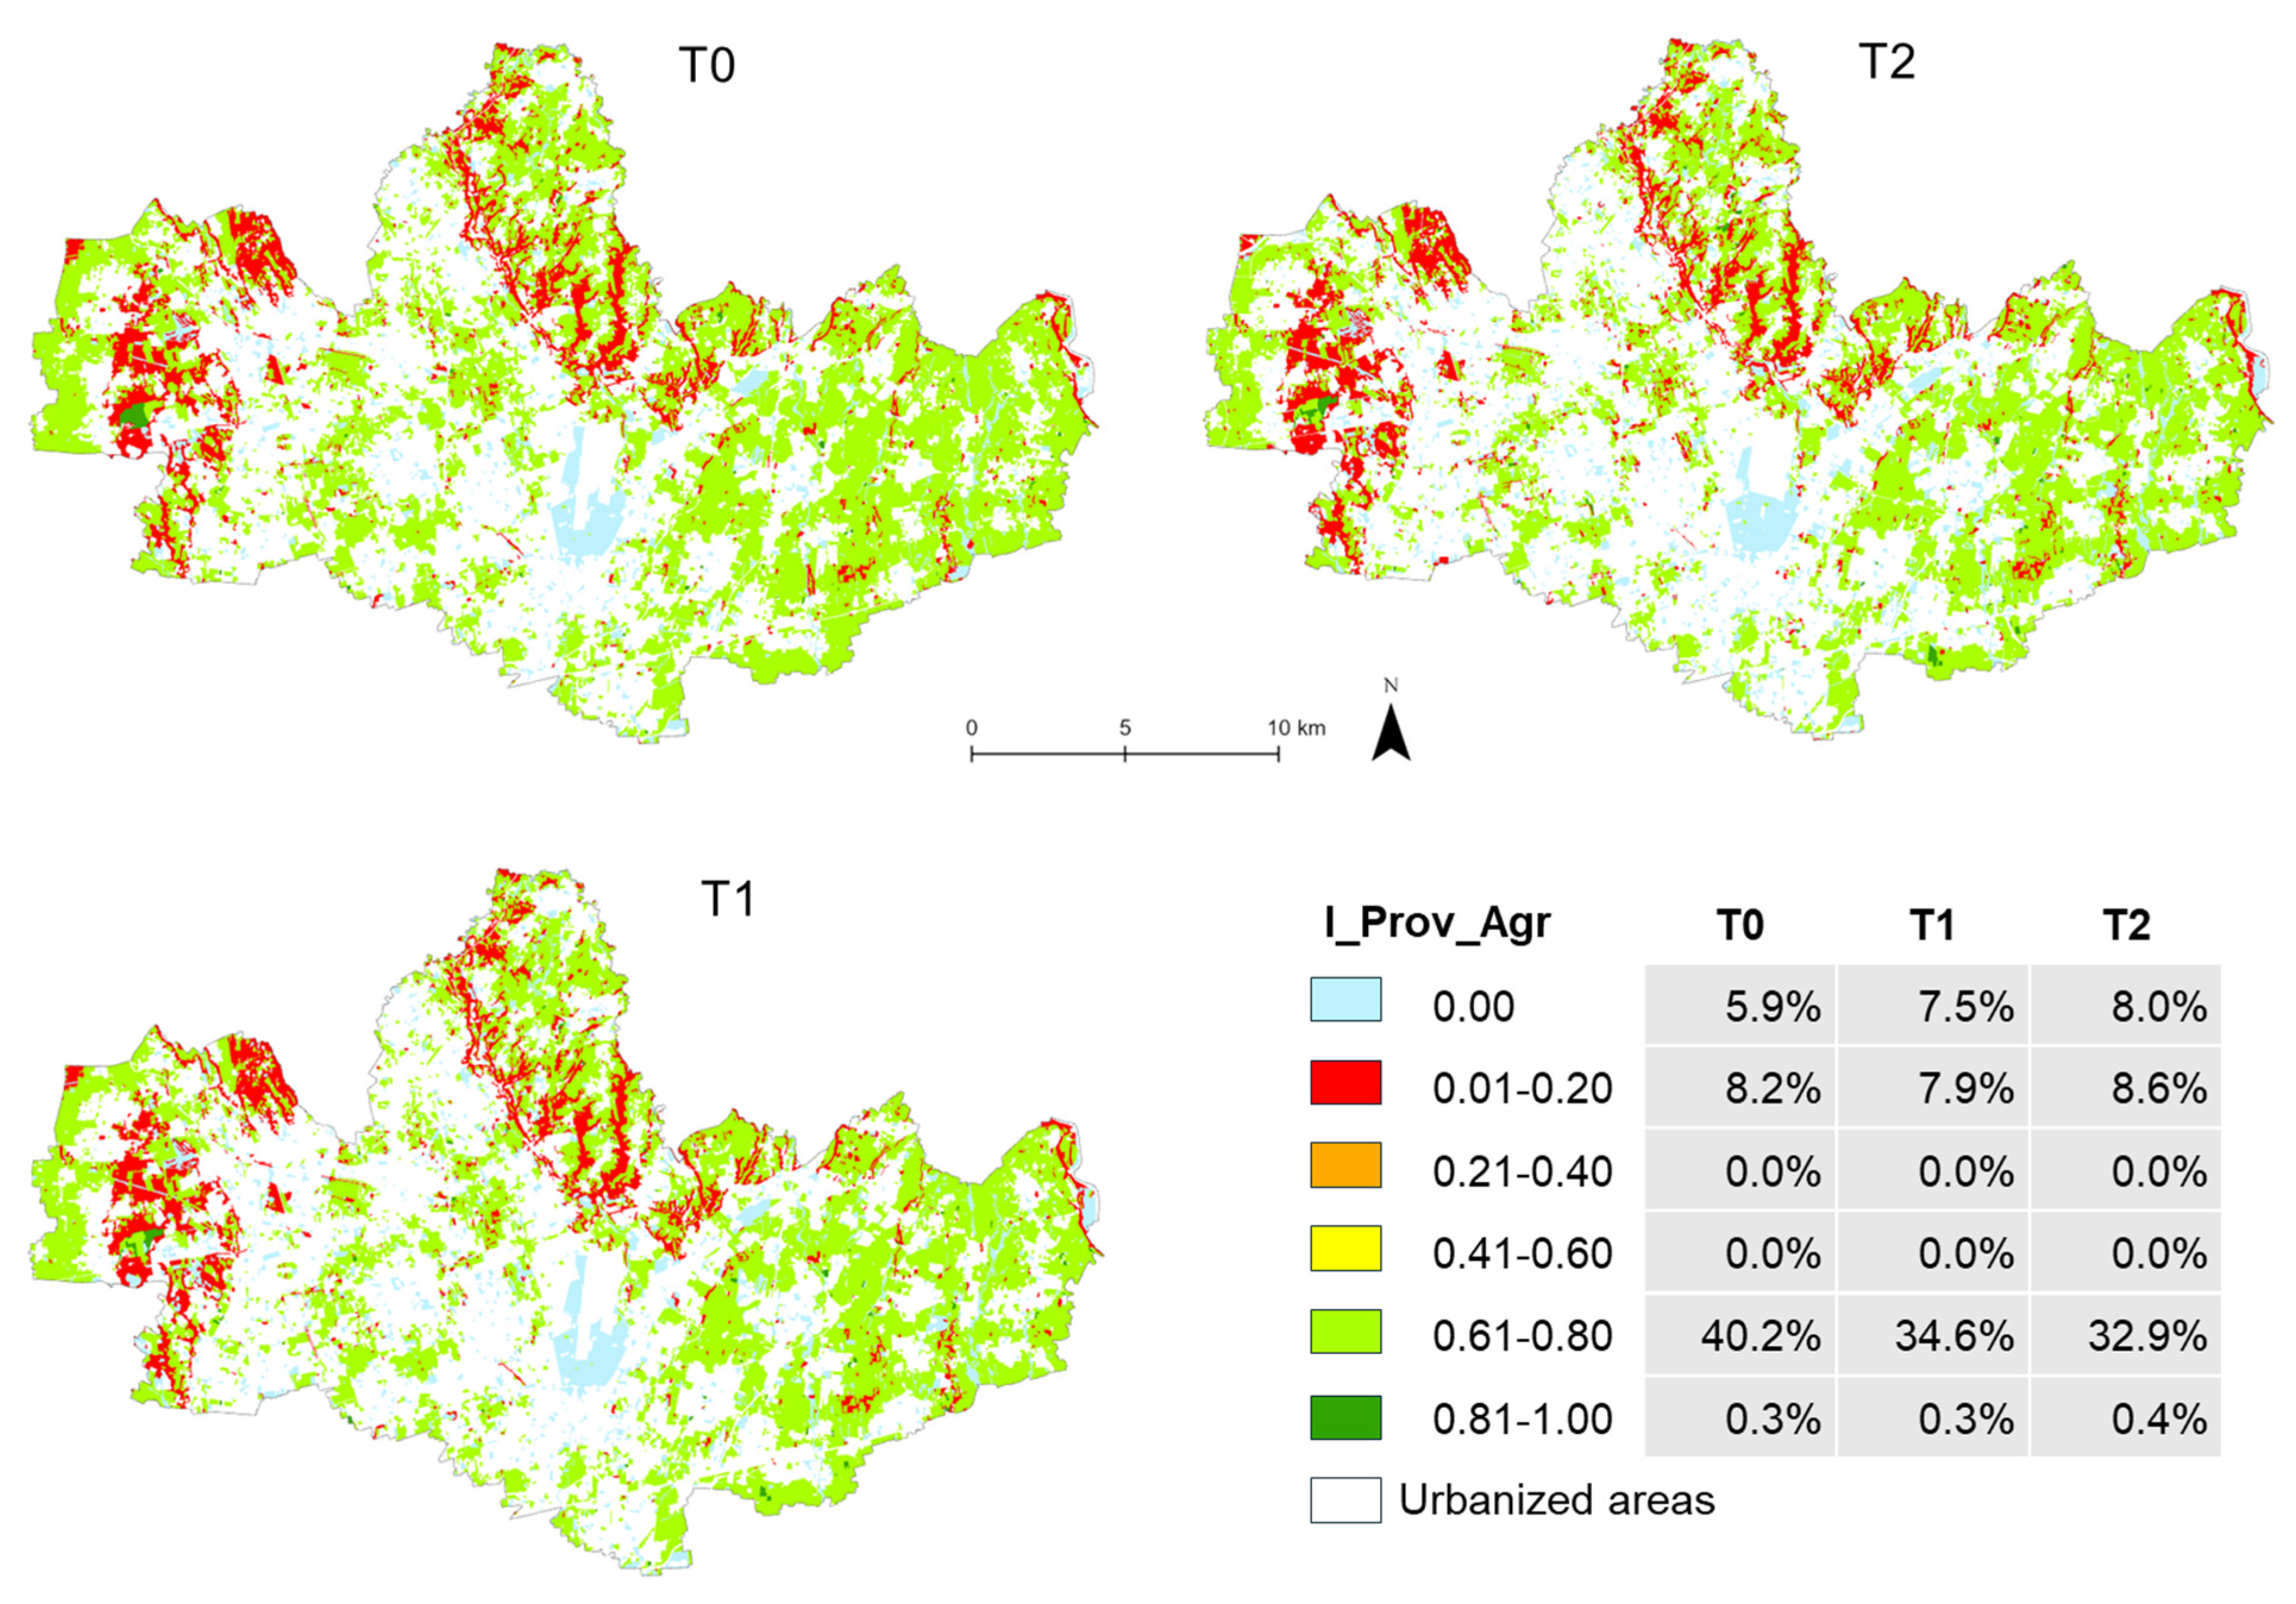
The distribution within the study area of the provisioning ESs coming from agriculture is not homogeneous (the areas with the lowest levels of ESs provision are located in the west and east of the province), and the greatest decrease was recorded in areas with high I_Prov_Agr values (class 0.61–0.80), which decreased from 40.2% of the provincial territory to only 32.9% (Figure 8).
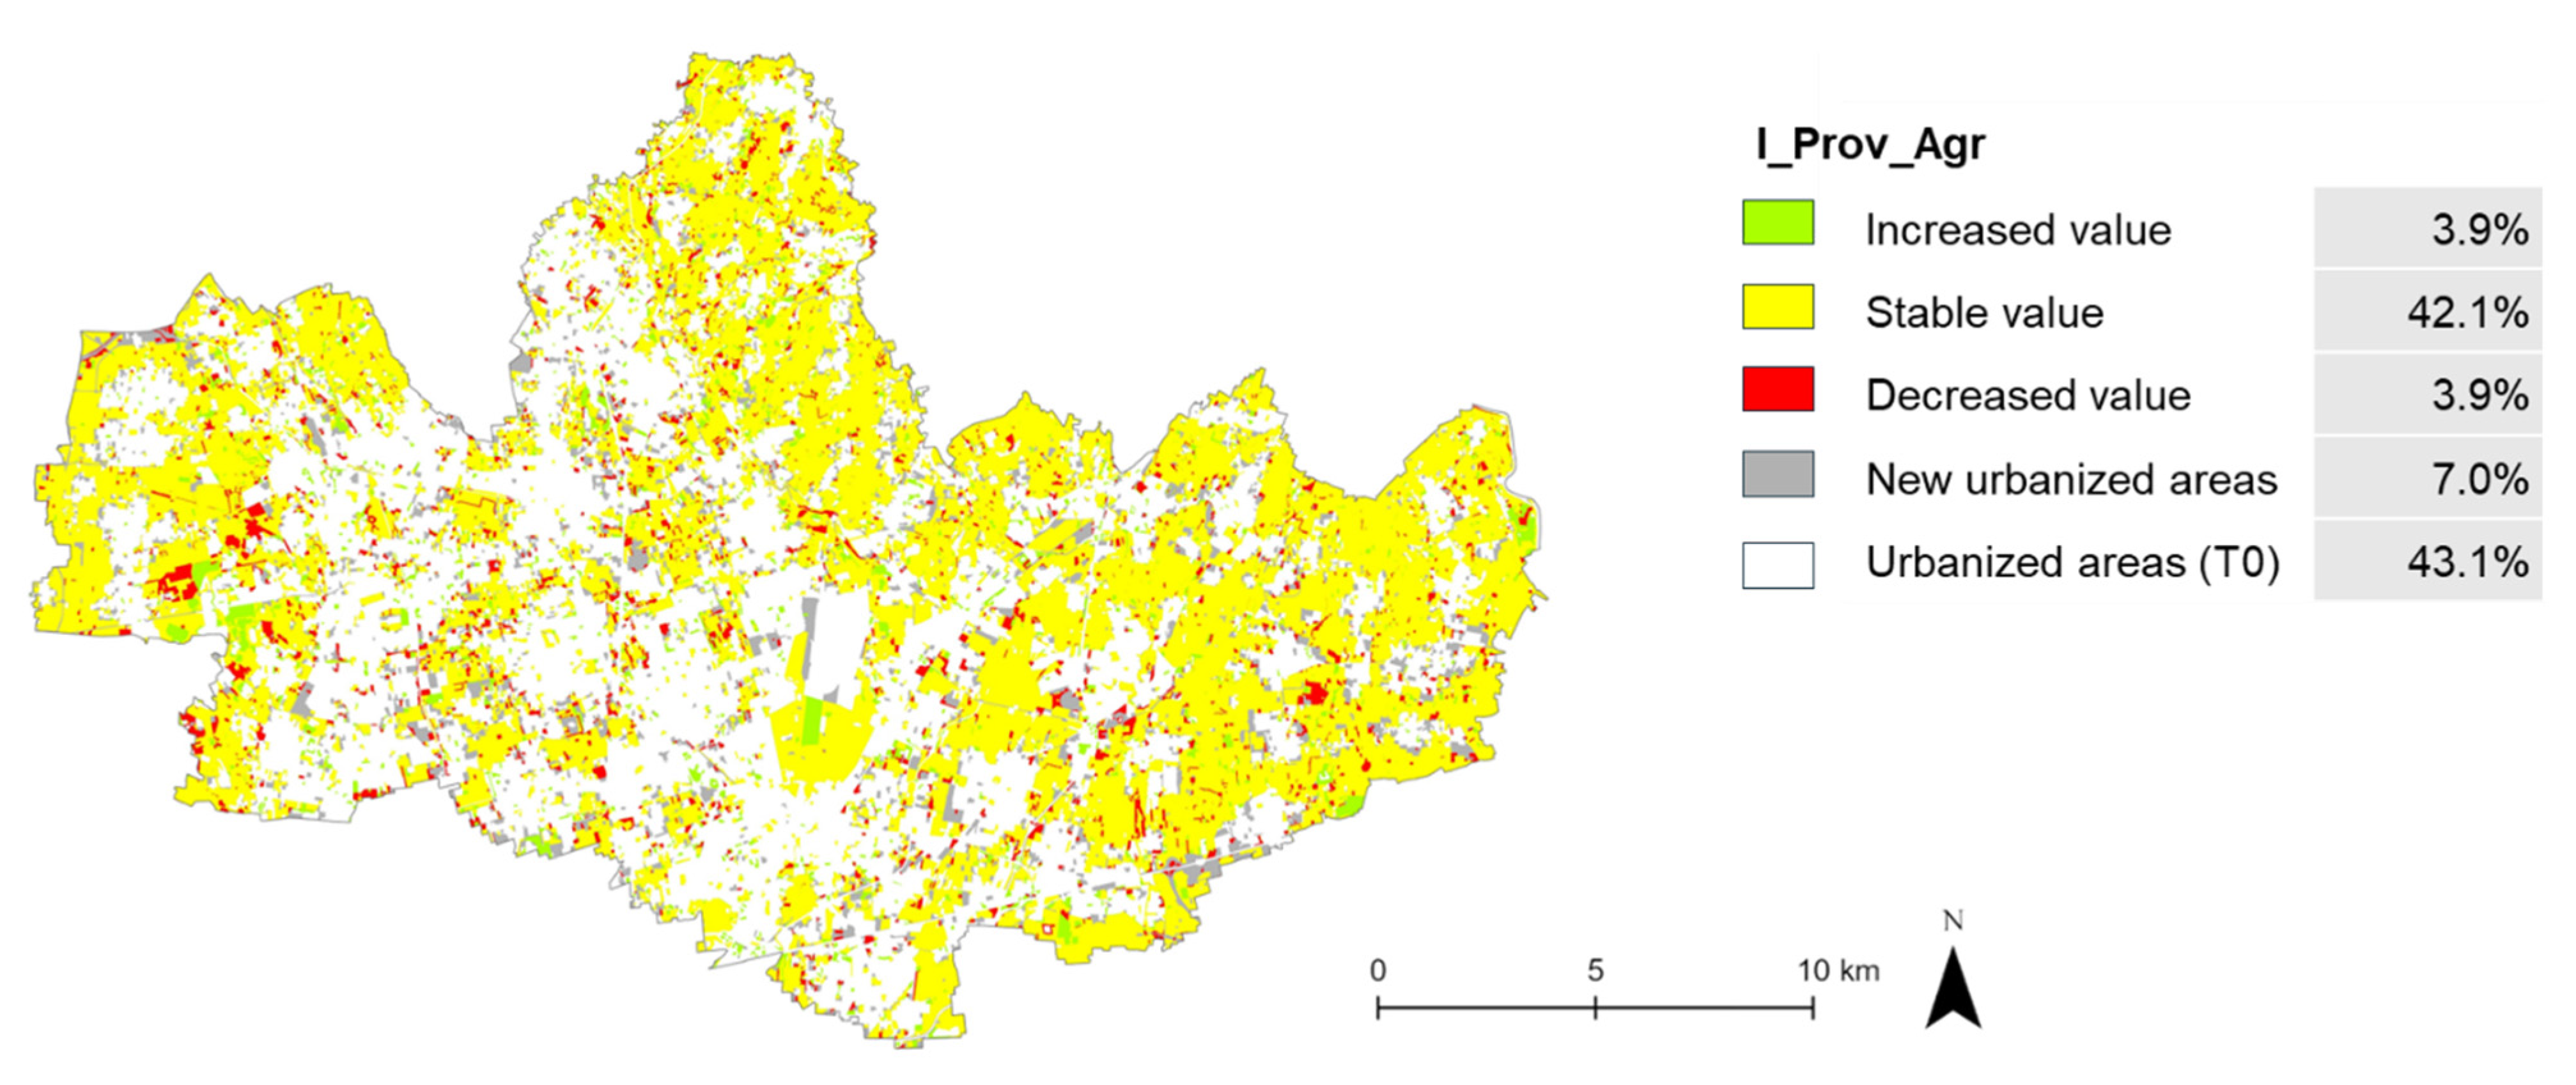
Approximately 42.1% of the study area (170.7 sq.km) did not record a change in I_Prov_Agr from T0 to T2. Only a small portion of the territory showed changes: 3.9% (15.9 sq.km) recorded a worsening of the index, and just 1.4% (5.7 sq.km) an improvement (Figure 9).
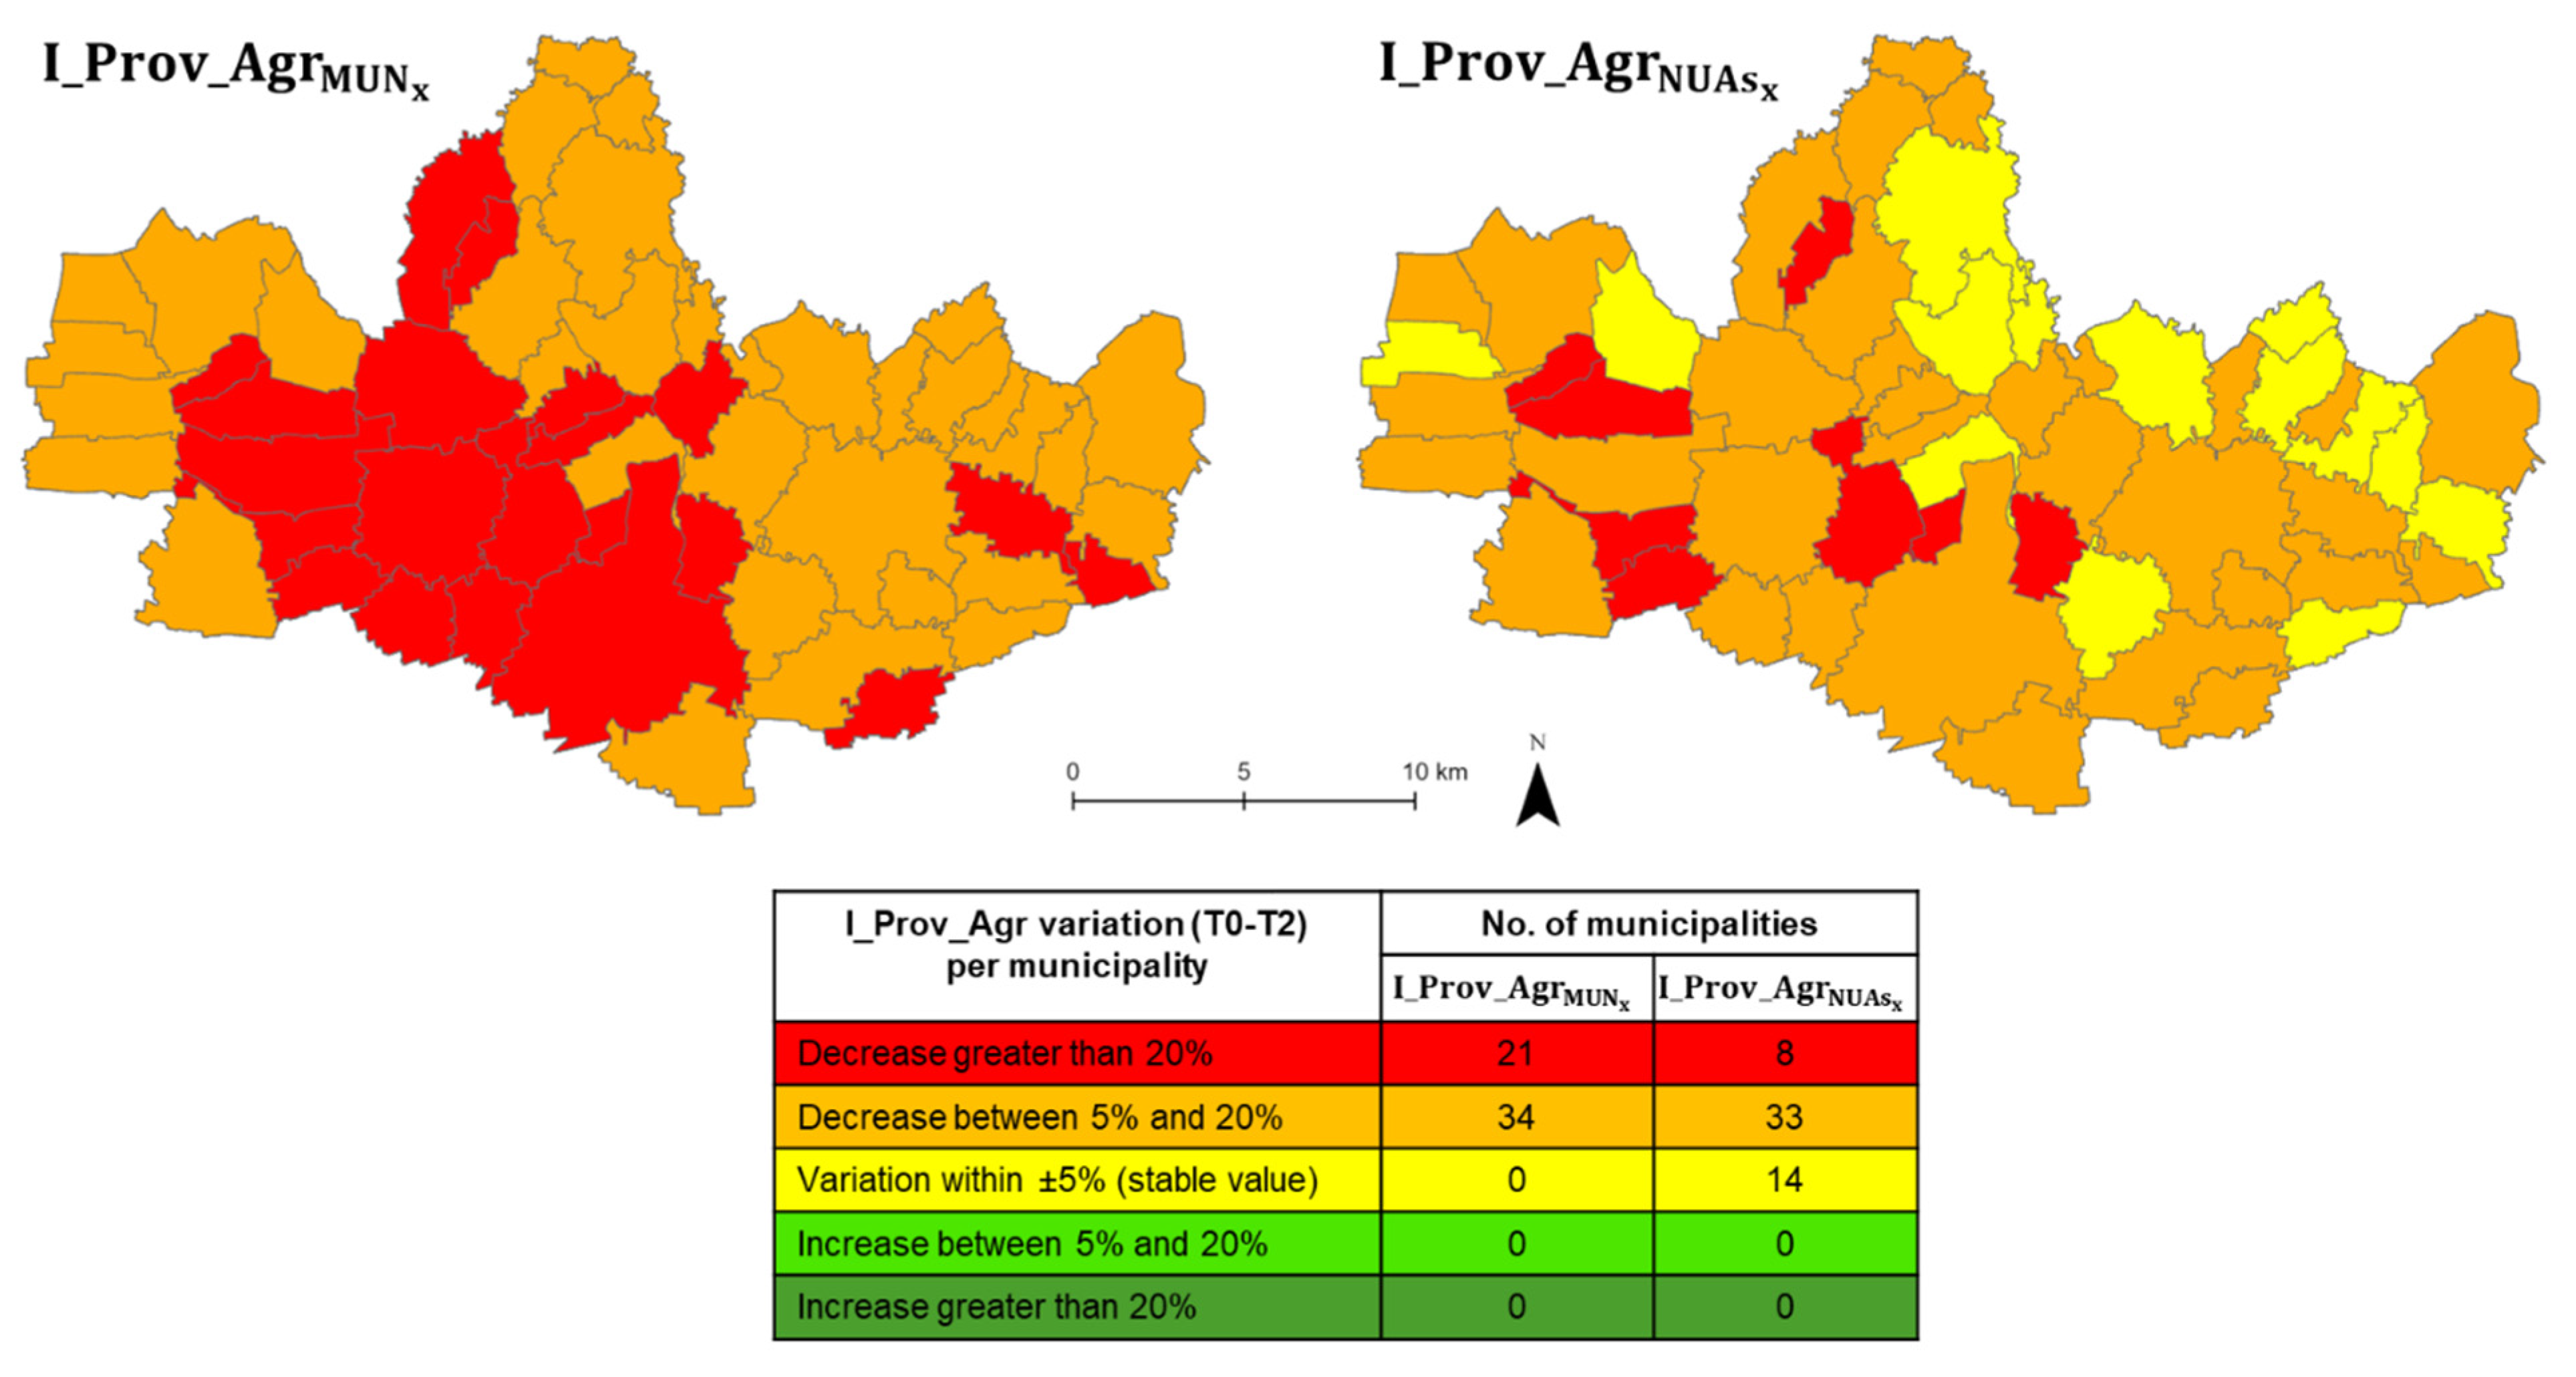
Analyzing the trend of the index at the municipal level, both for the entire municipal area (I_Prov_AgrPROV) and for the NUAs alone (I_Prov_AgrNUAs), it is noted that no municipality recorded an improvement, a clear sign that municipal planning has failed to safeguard the ESs provided by agriculture. I_Prov_AgrPROV recorded a decrease in all municipalities (significant in 21, more moderate in the other 34), while I_Prov_AgrNUAs remained fairly constant in 14 municipalities (Figure 10).

3.3. Evolution of the Regulating ESs Provided by Natural Resources (I_Reg_Nat Index)

The I_Reg_NatPROV of the study area from T0 to T2 increased (+72.5%) from a very low value of 0.091 (T0) to 0.157 (T2).
This trend may be due to several factors. First is the growing attention that the institutions (Region, Provinces and municipalities) placed on nature conservation over the last two decades: they established new parks and protected areas of different type and size (in the province of Monza–Brianza for approximately 95 sq.km) and planned and implemented the ecological network, with both at the regional, provincial, and municipal level. Secondly, there has been an increase in forests and natural and semi-natural areas (+26%, +12.2 sq.km) (Table 8), due to both re-naturalization, both spontaneous and planned, of agricultural or anthropized areas
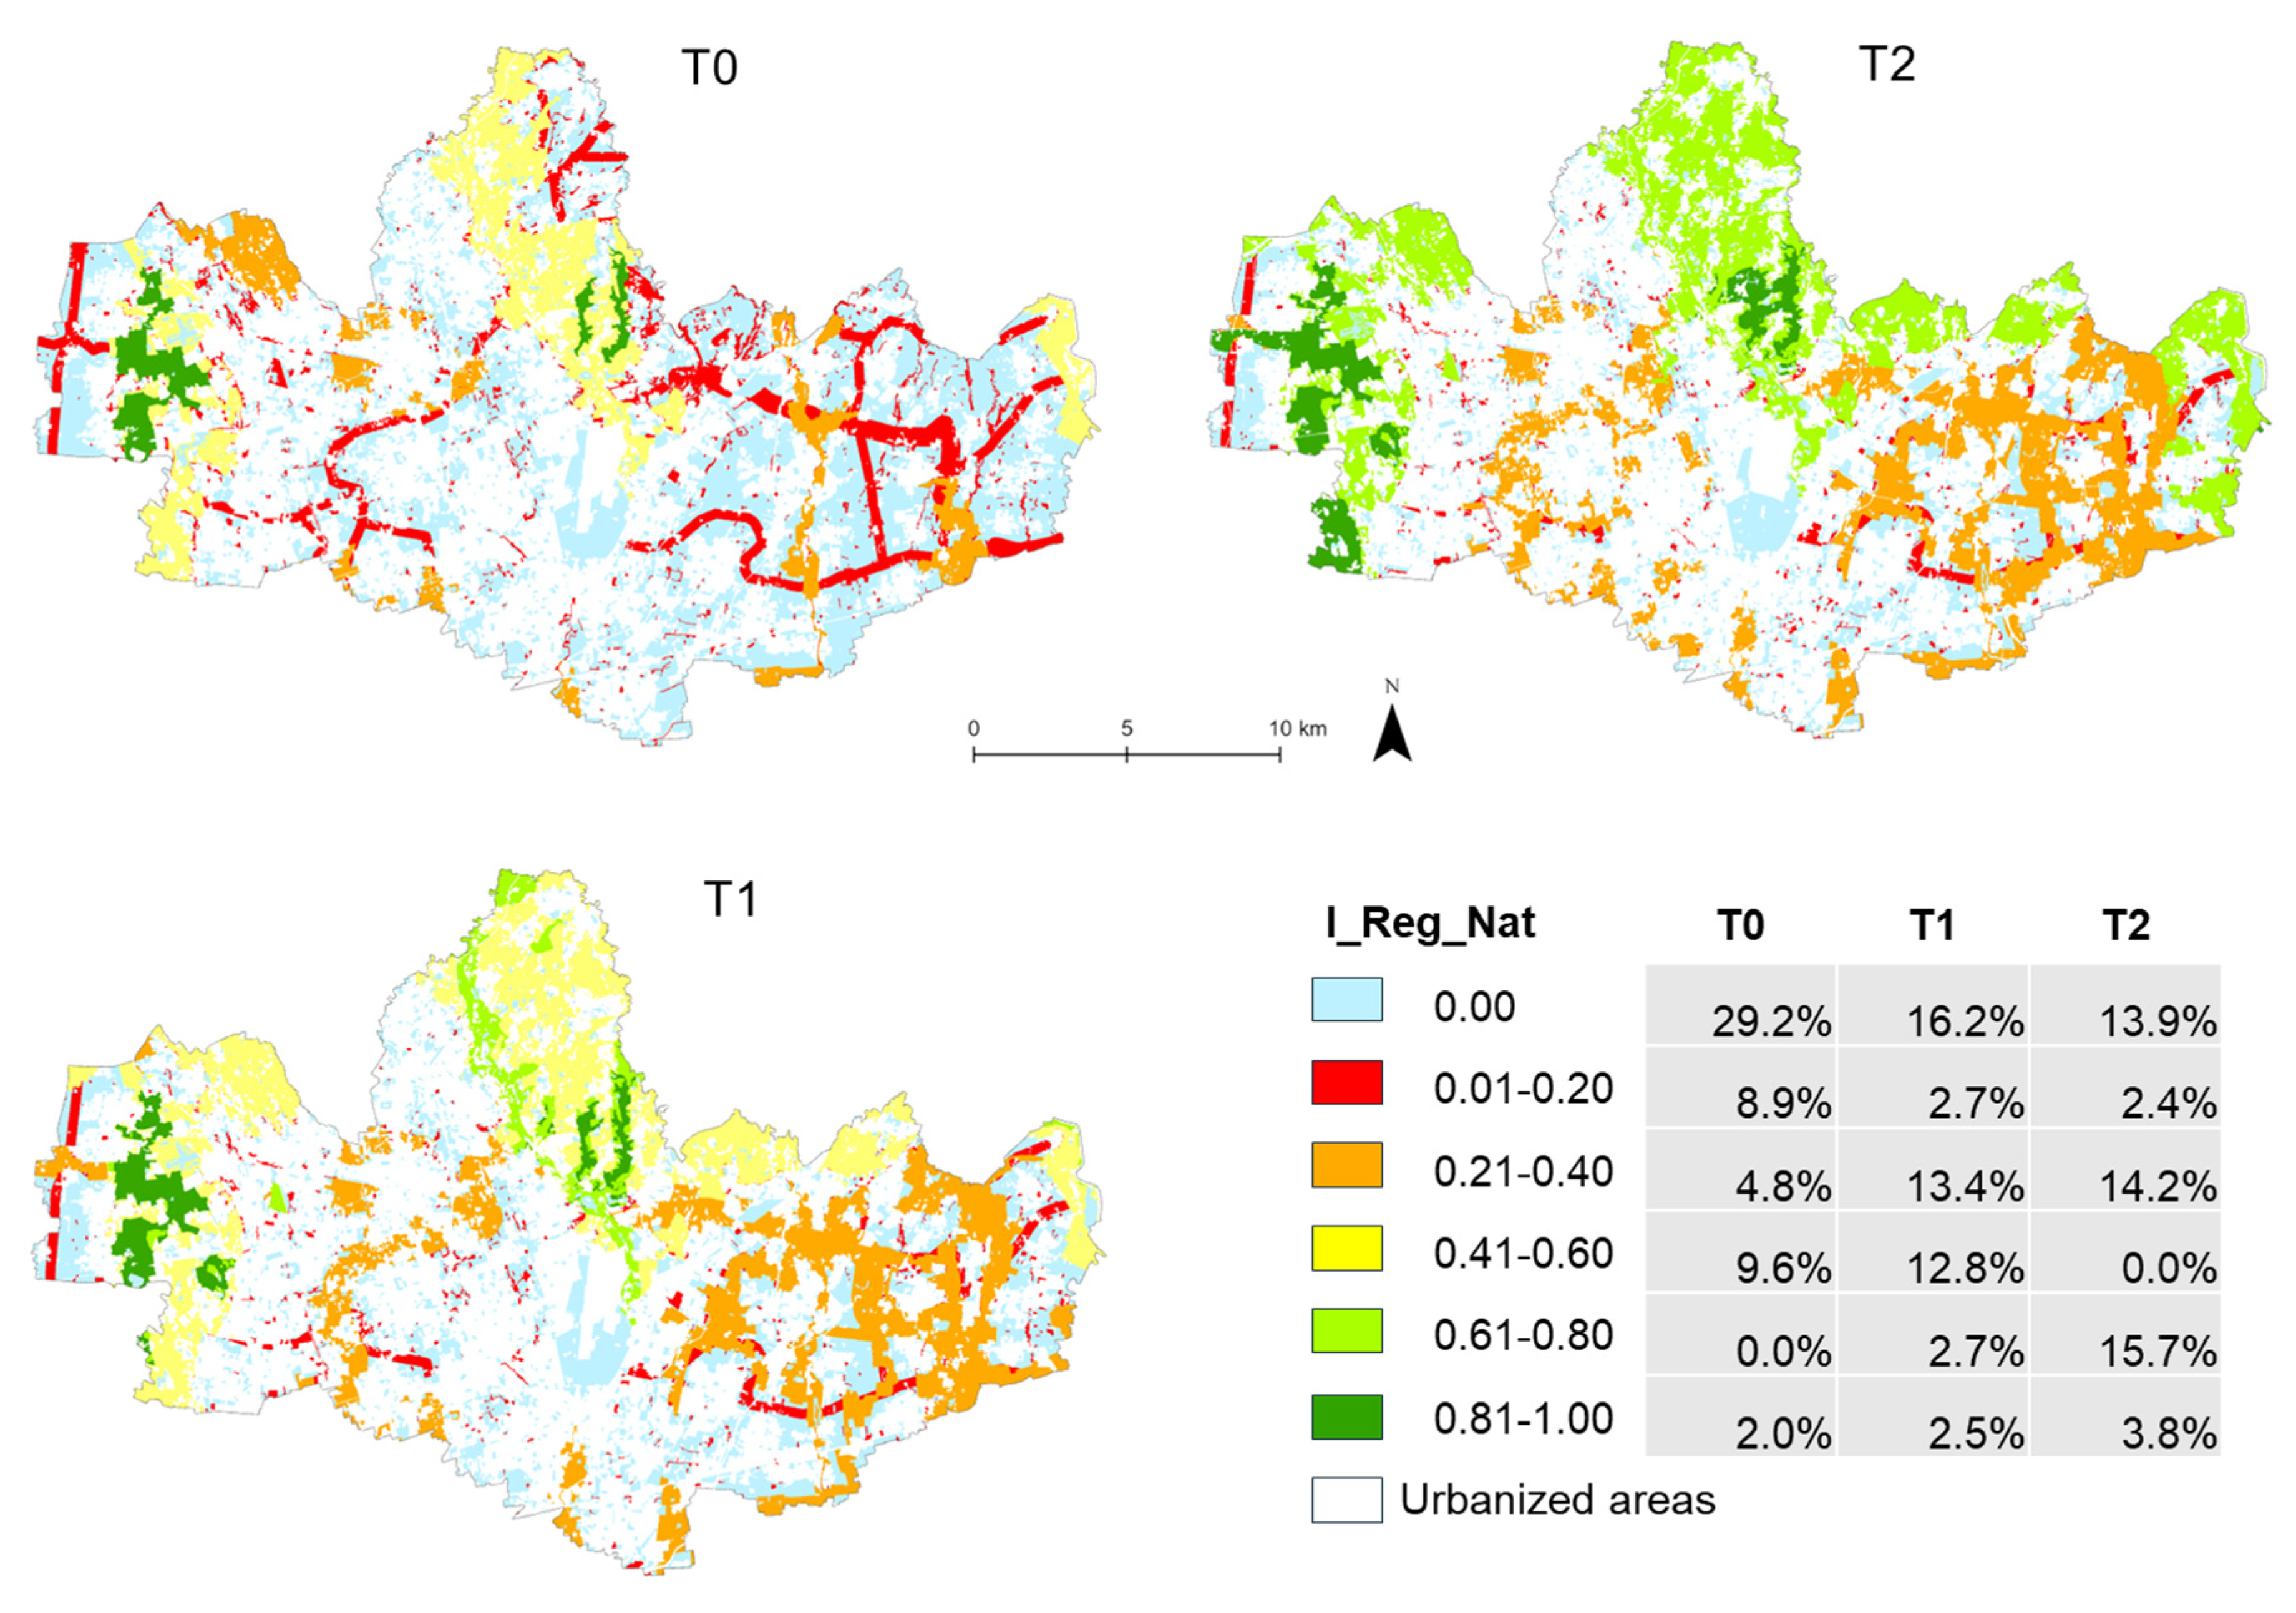
When referring to NUAs, I_Reg_NatNUAs records an even more pronounced increase (+88.6%), from 0.167 (T0) to 0.315 (T2) (Table 9), suggesting an important increase in the regulating ESs provided by green infrastructure, although it can be noted that indices calculated only on NUAs may lead to an overestimation of the ESs provided. The distribution of these ESs within the study area is not homogeneous, although a general decrease in the two lowest classes (≤0.20) is observed, which went from 38.1% in T0 to 16.3% in T2. Conversely, the two highest classes (>0.60) went from 2.0% in T0 to 19.5% in T2 (Figure 11). It is also noticeable how the change was gradual, especially observing the areas of the intermediate class (0.41–0.6), especially in the central part in the north of the province (yellow classes in Figure 11): from T0 to T1 the yellow strip increases (in total, it increases from 9.6% to 12.8%), but some of the yellow areas turn light green (class 0.61–0.80); from T1 to T2, the yellow areas disappear to make room for green areas (of both highest classes).
Another interesting aspect is linked to the “red corridors” in Figure 11. In T0, they are very evident and represent the initial structure of the ecological network. Over the years, the implementation and strengthening of this ecological network has led to a gradual increase in ESs provided, with more and more areas moving up a class (orange and yellow).
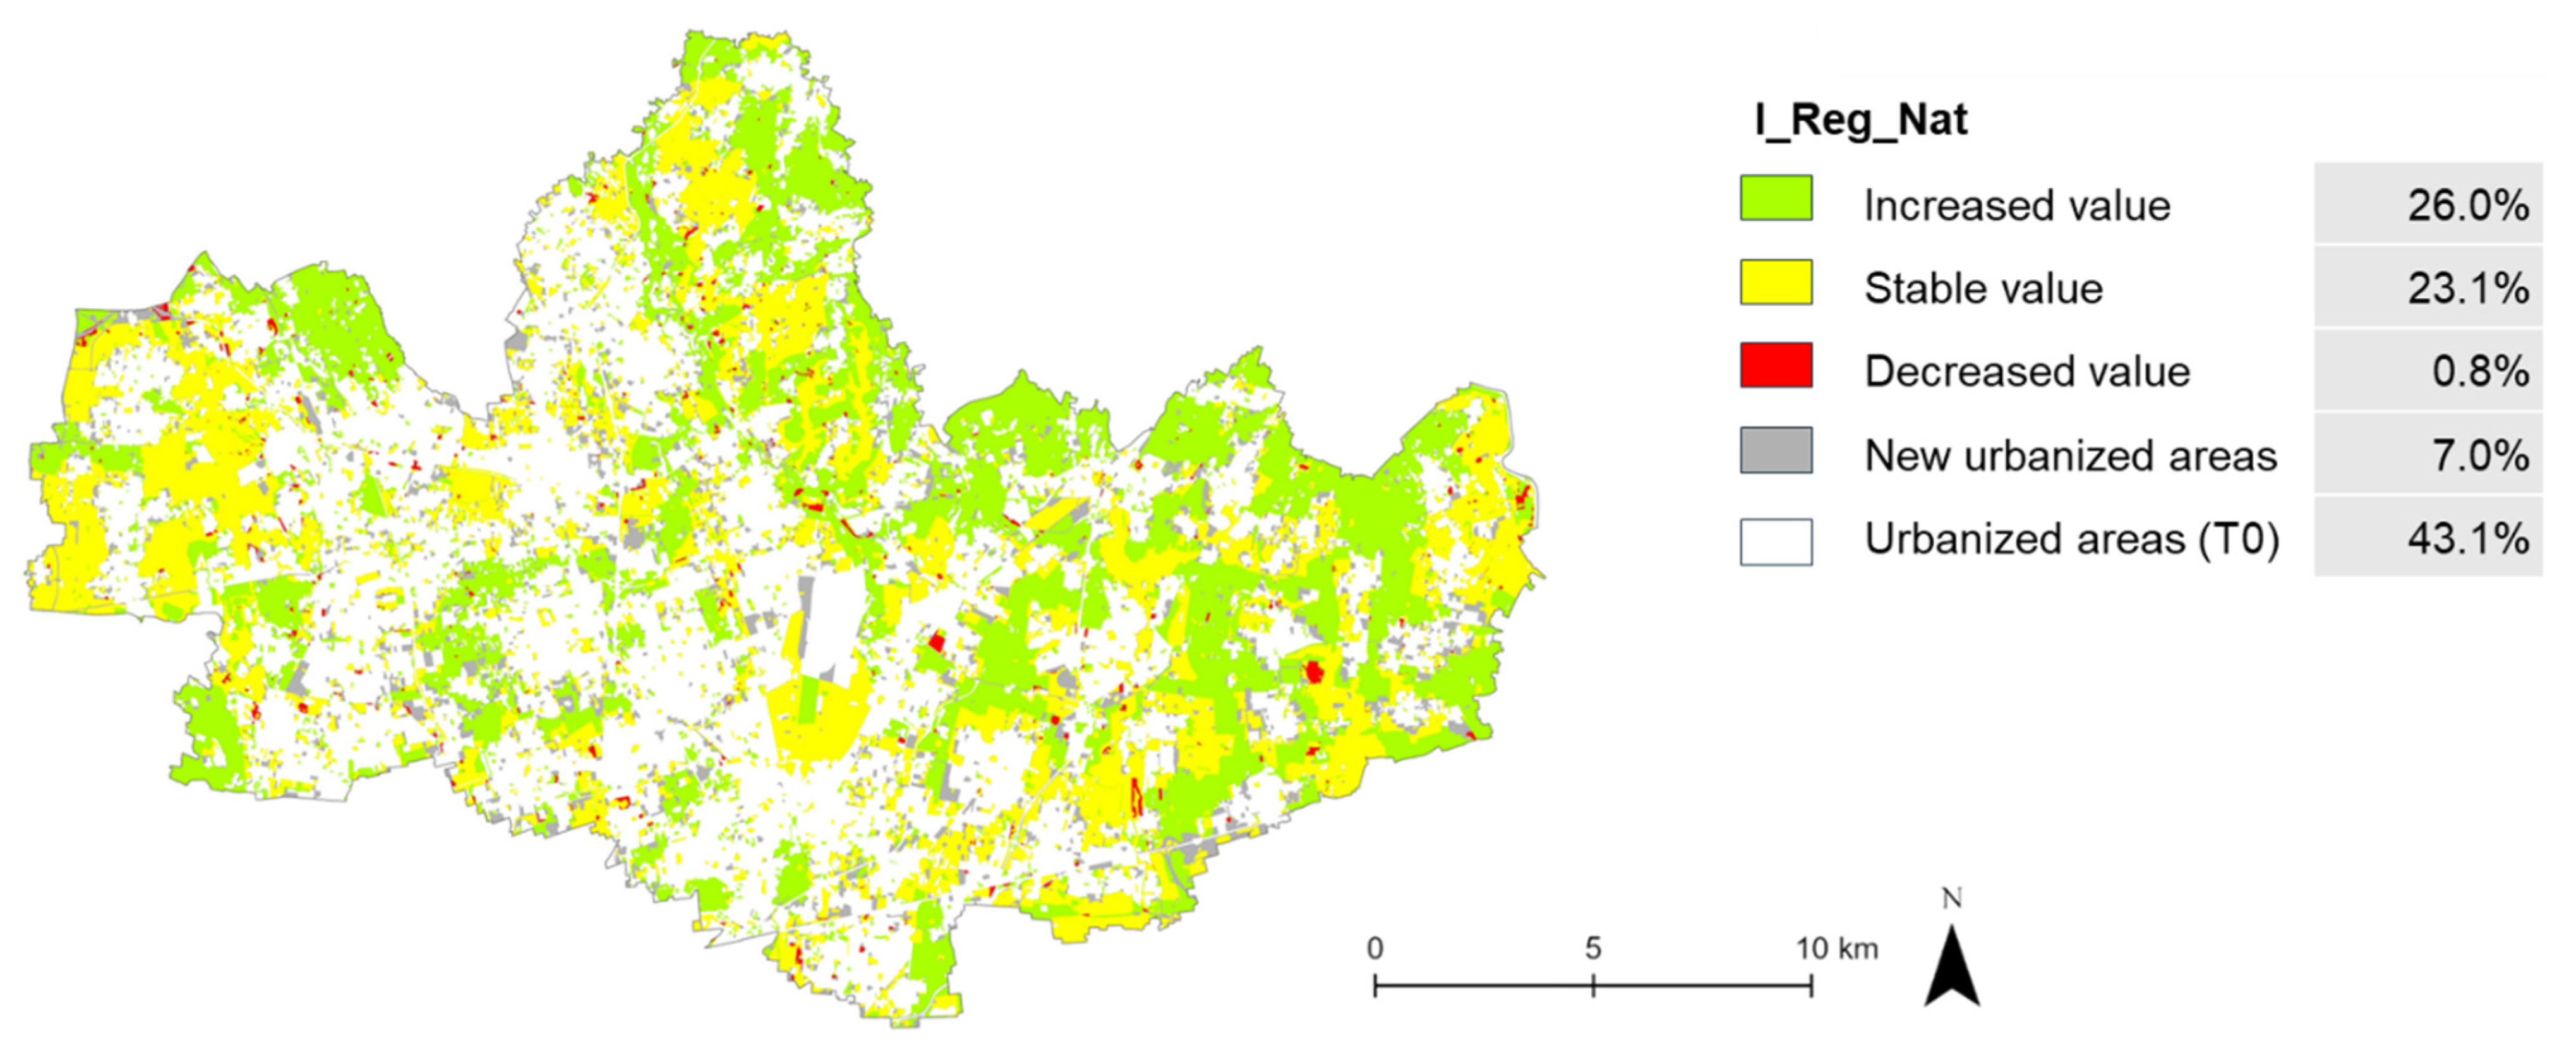
Only 23.1% of the study area (93.8 sq.km) did not record a change in I_Reg_Nat from T0 to T2, while 26.0% (105.2 sq.km) recorded an improvement and only 0.8% recorded a decrease (Figure 12).
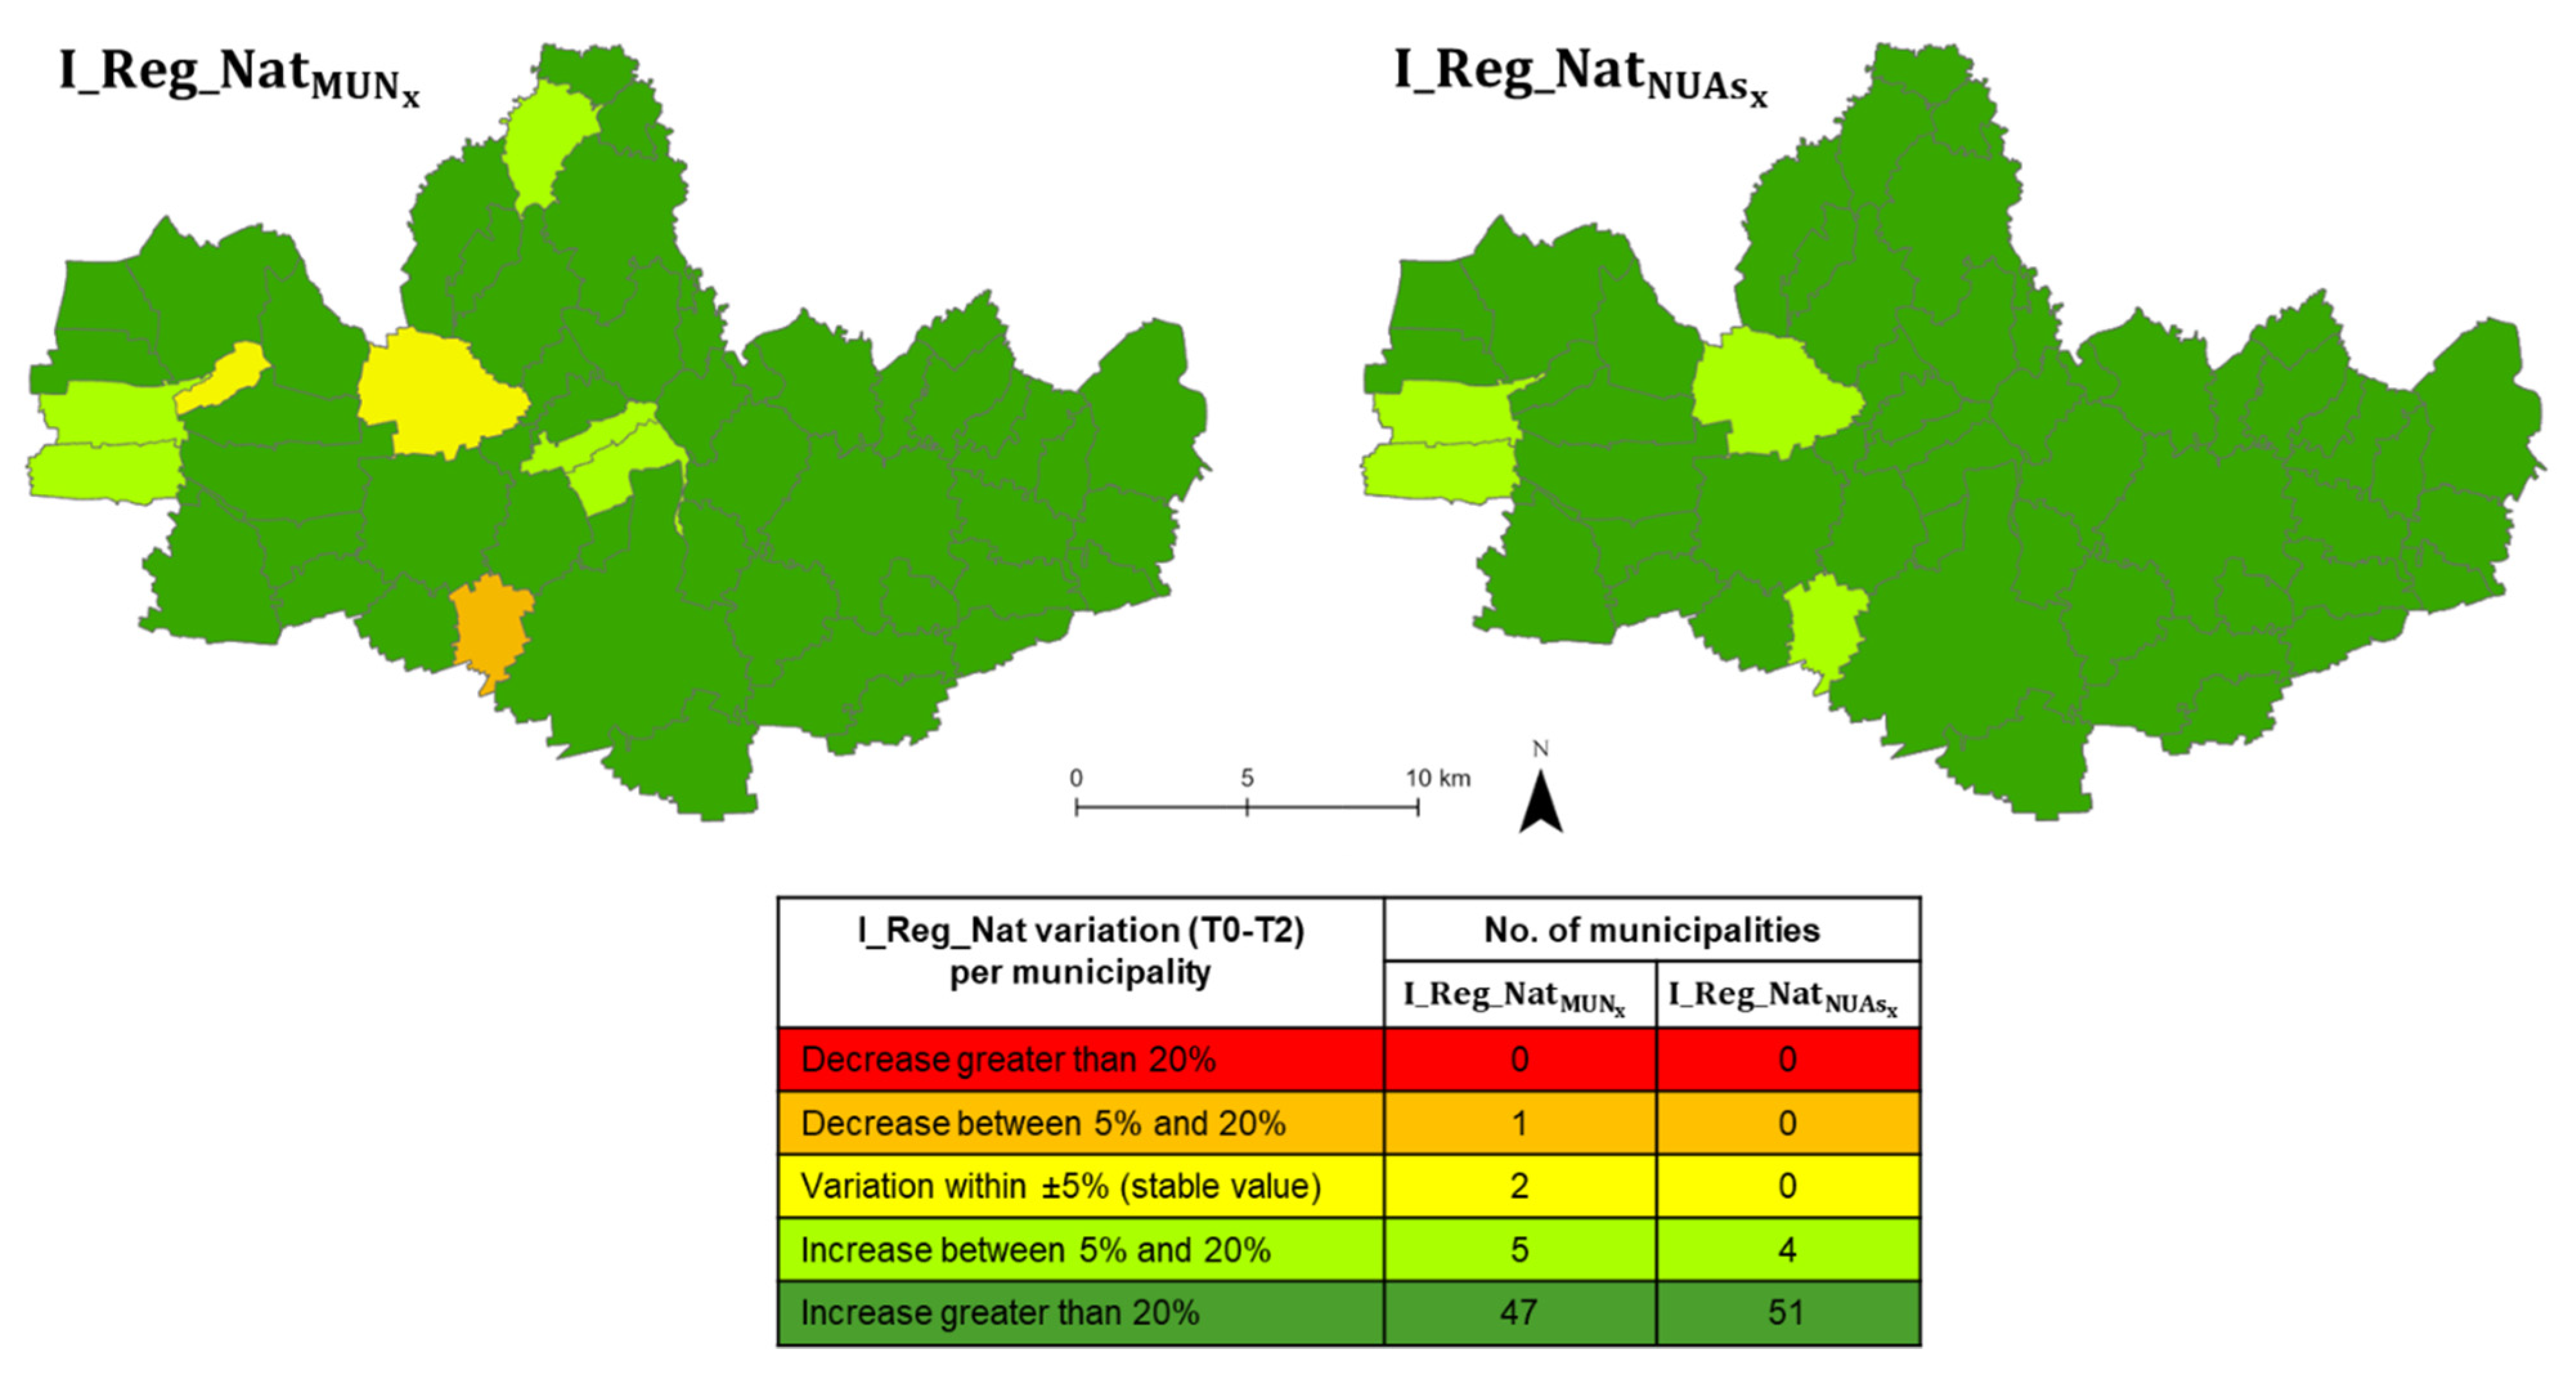
Analyzing the trend of the index at municipal level, both on the entire municipal area (I_Reg_NatPROV) and on only the NUAs (I_Reg_NatNUAs), it can be noted that in all municipalities (for I_Reg_NatNUAs) or almost all (for I_Reg_NatPROV), there has been an improvement, a clear sign that municipal planning has succeeded in safeguarding and improving the ESs provided by natural resources (Figure 13).

3.4. Evolution of the Cultural ESs Provided by Landscape (I_Cult_Land Index)

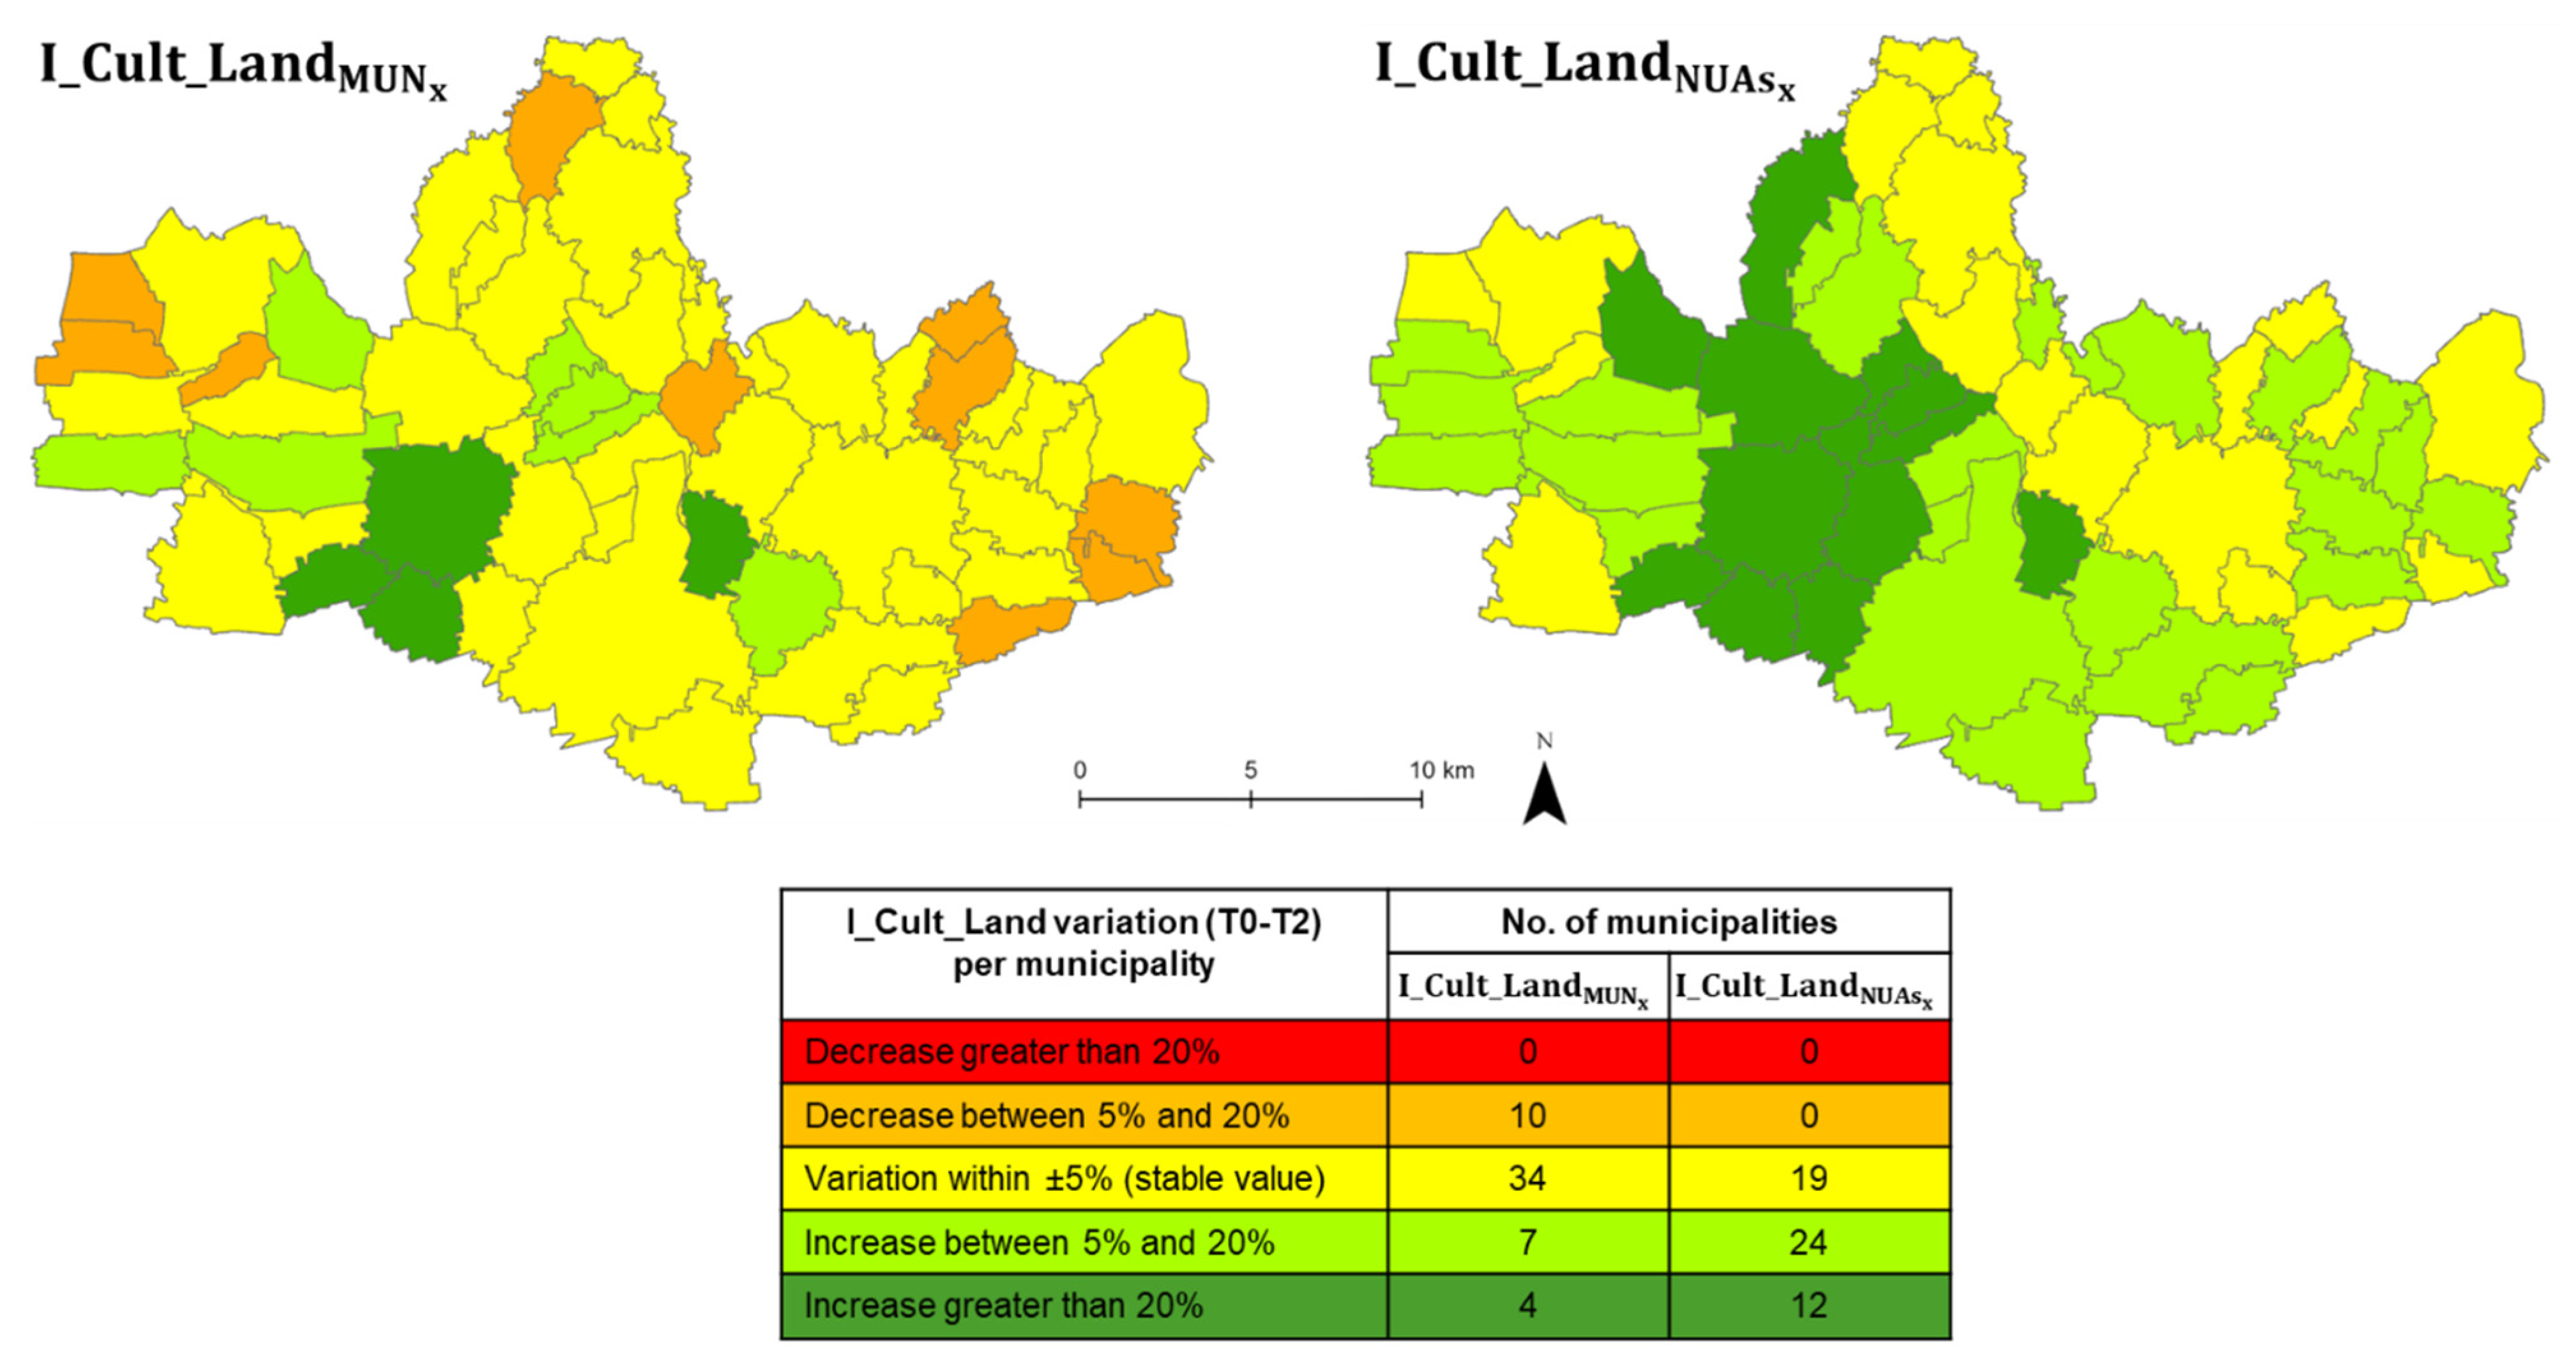
The I_Cult_LandPROV of the study area from T0 to T2 remained almost constant (−0.7%), going from 0.274 (T0) to 0.272 (T2) (Table 9). This trend depends, on the one hand, on the land-take of the last 20 years, which has reduced the green areas capable of providing cultural ESs and, on the other, on the increase in the quality of the remaining part of the green infrastructure, which has allowed the level of ESs provided to be kept almost constant. In fact, although urbanization has caused the loss of 18.3 sq.km of NUAs (−8.3%) (Table 7), the level of cultural ESs provided by the provincial territory has dropped by only 0.7%. Looking at the temporal trend, it can be noted there is a greater decline (−2.6%) from T0 to T1 and a recovery (+1.9%) from T1 to T2, demonstrating a growing awareness of the issue in recent years. The trend of the index referring only to NUAs (I_Cult_LandNUAs) confirms this interpretation, recording an even more pronounced increase (+8.3%), from 0.503 (T0) to 0.545 (T2) (Table 9), although it can be noted that indices calculated only on NUAs may lead to an overestimation of the ESs provided.
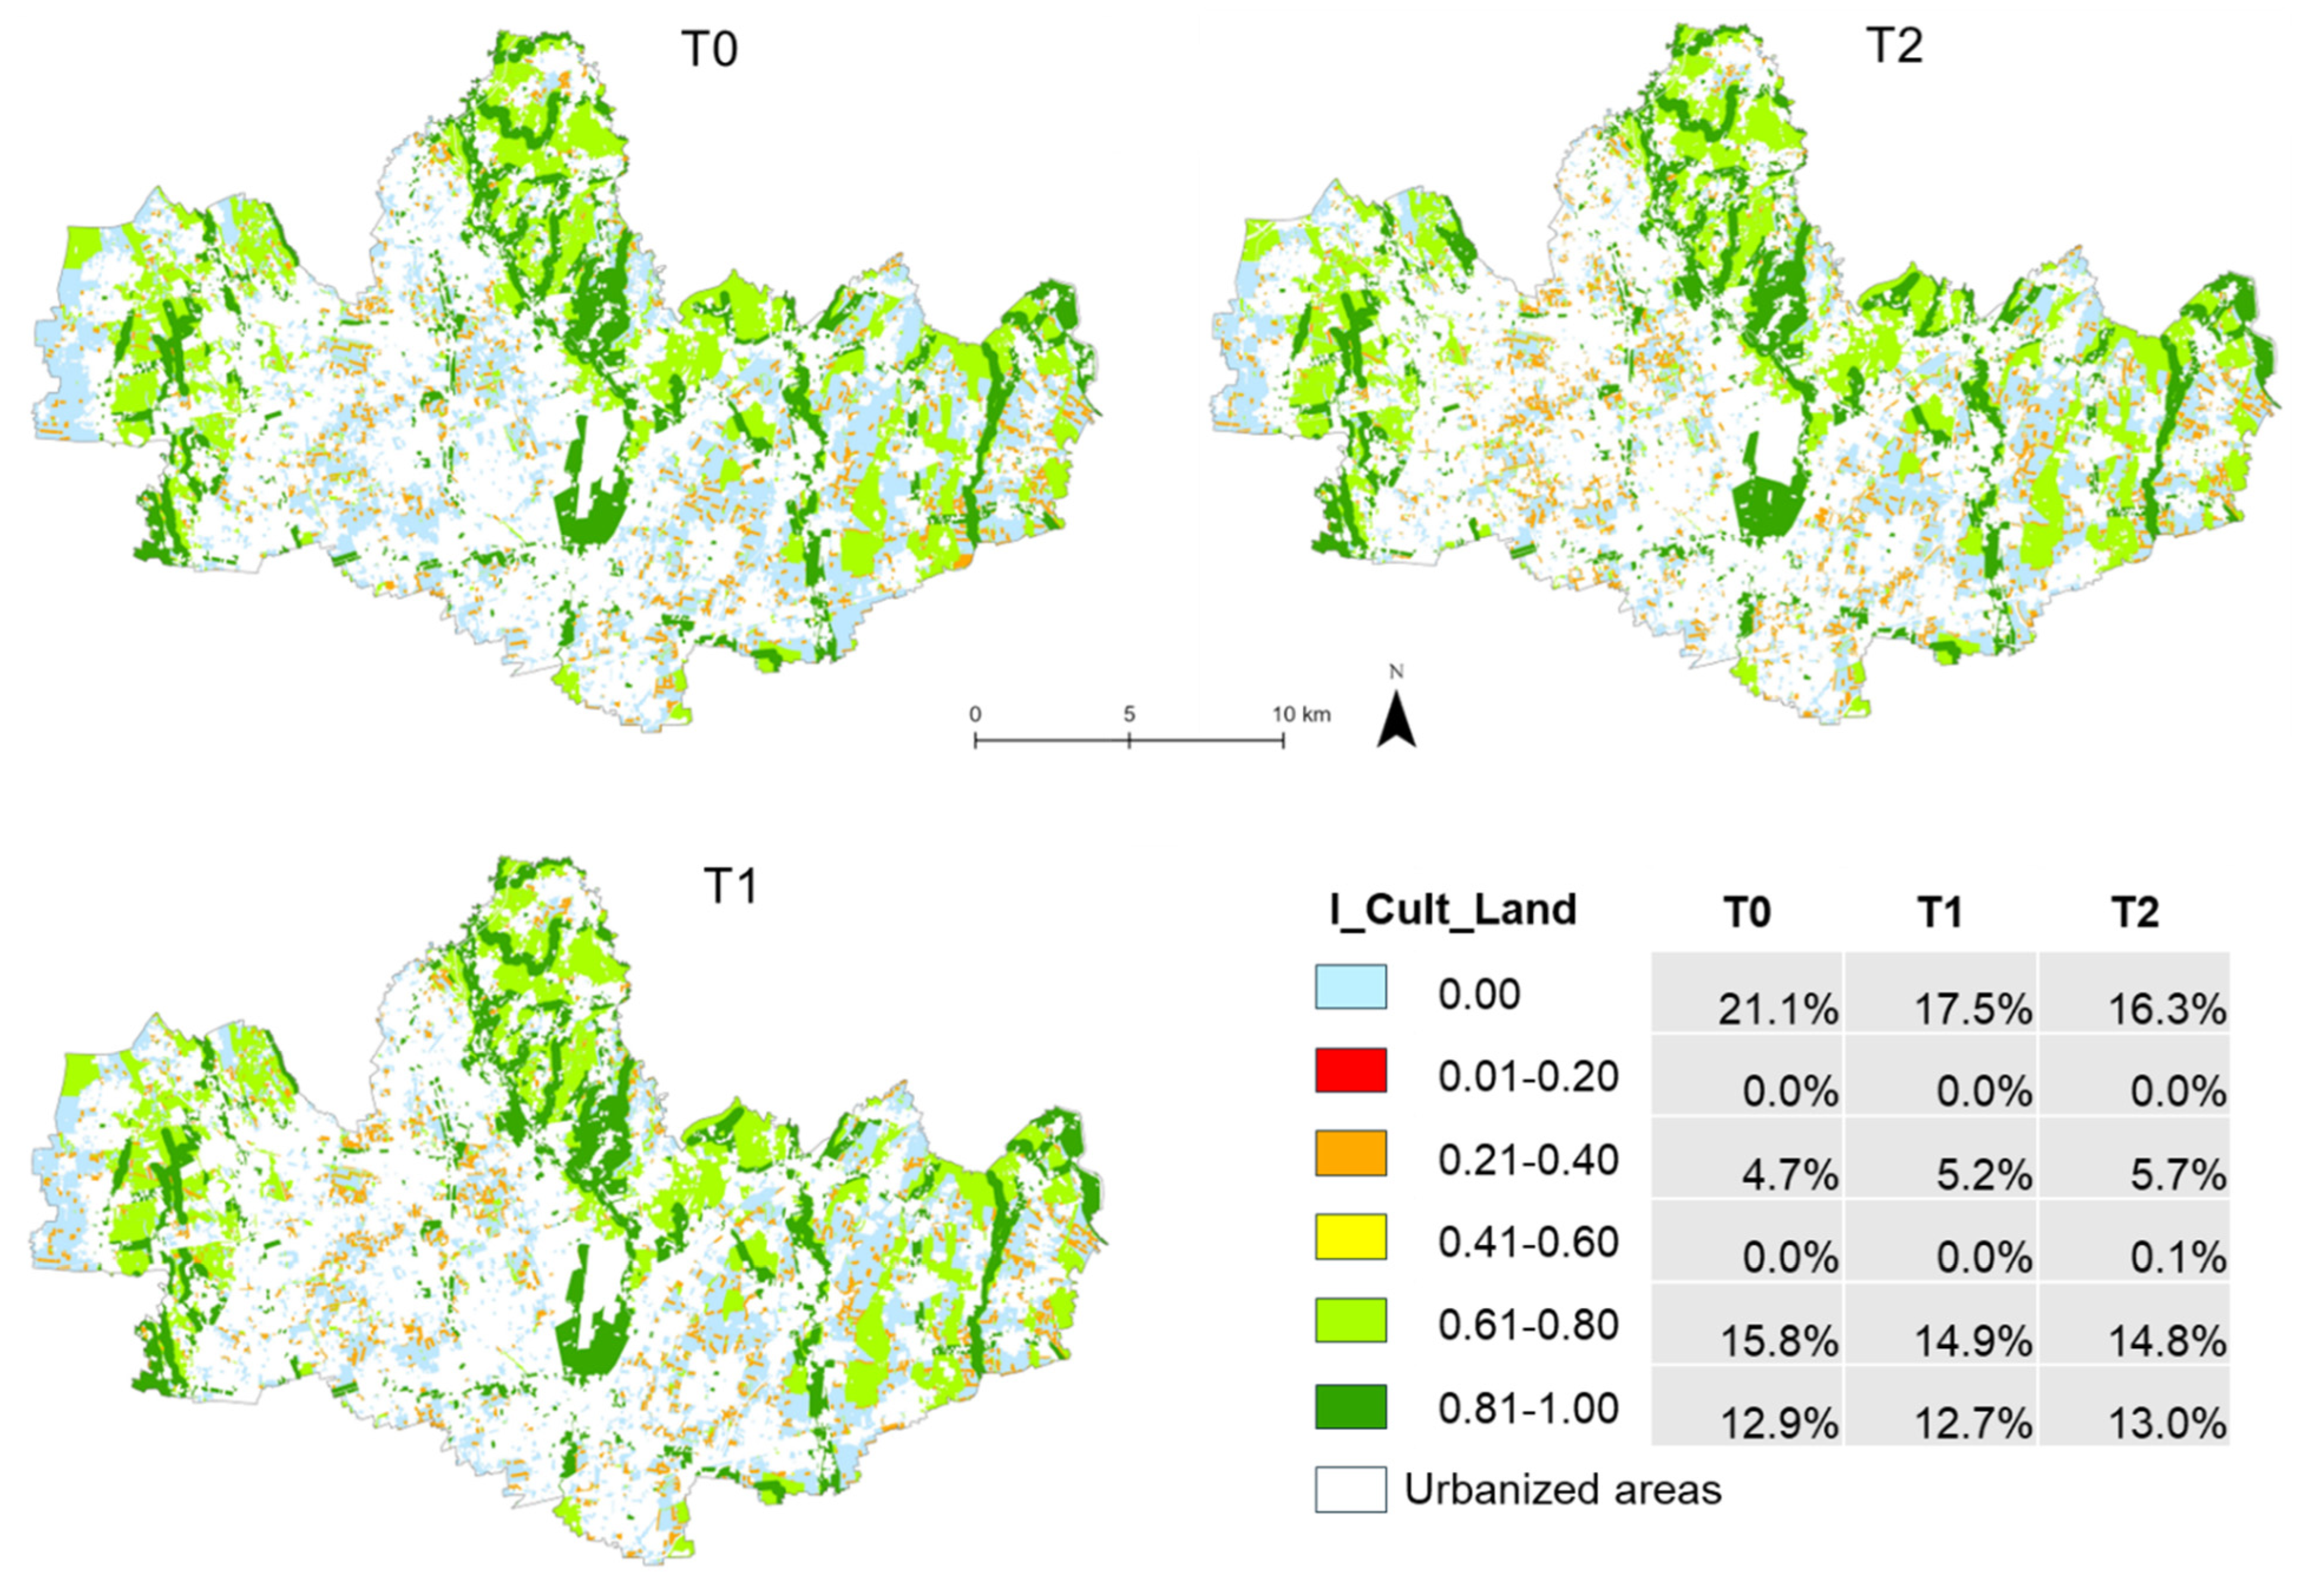
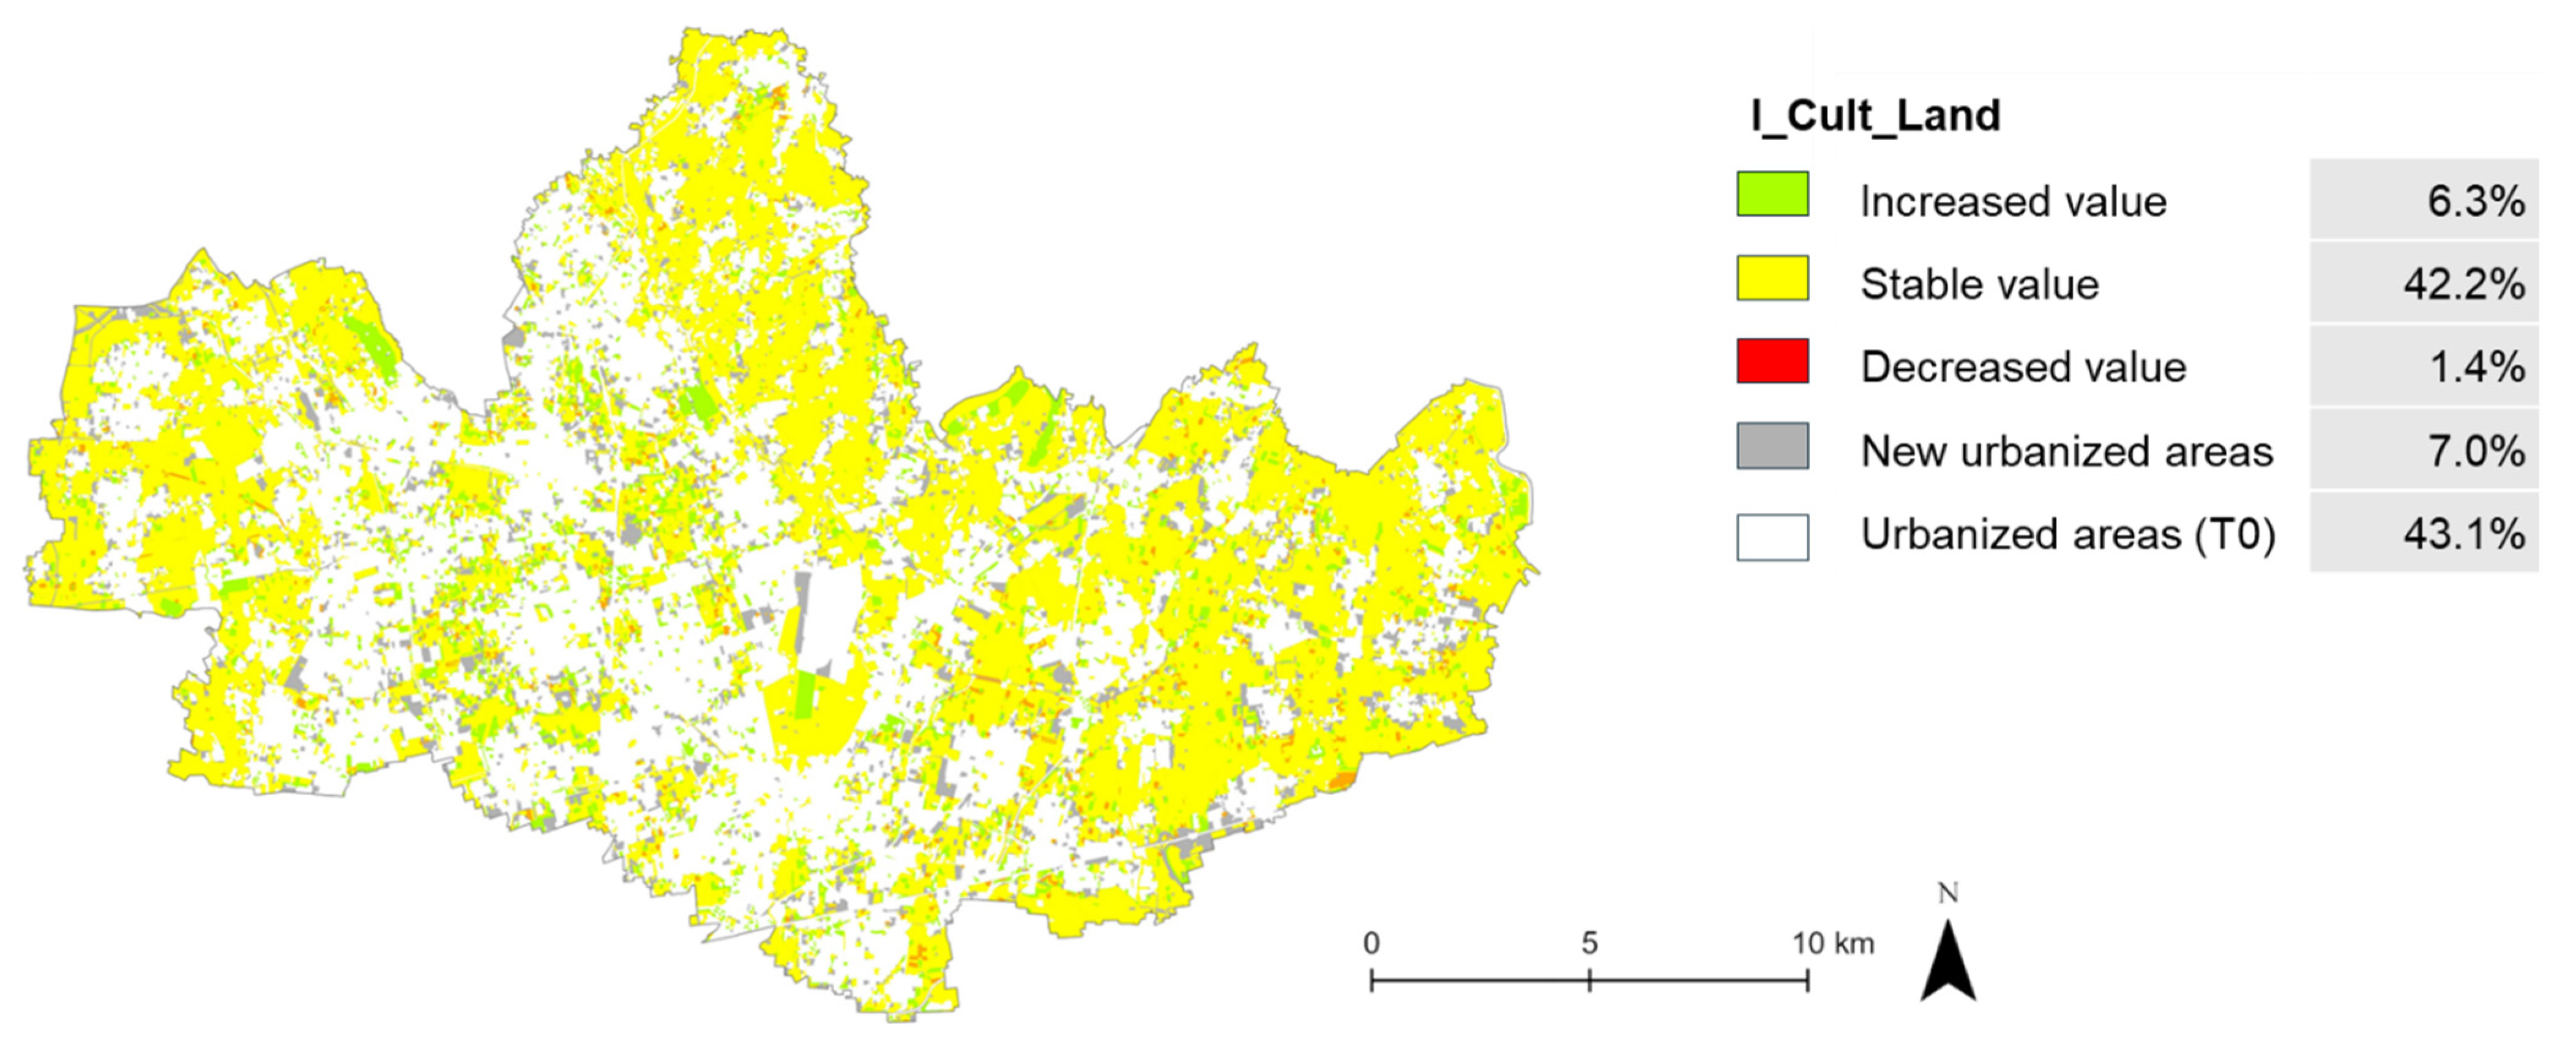
The distribution of the cultural ESs provided by landscape within the study area is not homogeneous, with the areas with the highest index values concentrated in the more peripheral parts of the study area. Between T0 and T2, a decrease in the areas in the lowest class was observed (from 21.1% in T0 to 16.3% in T2) and a slight increase in the areas in the higher classes (Figure 14). In fact, only 6.3% of the study area (25.5 sq.km) recorded an increase in the I_Cult_Land value from T0 to T2, while 42.2% remained essentially stable and only 1.4% showed a decrease (Figure 15).
Analyzing the trend of the index at the municipal level, it can be noted that the index calculated for the entire municipal area (I_Cult_LandPROV) shows an improvement in 11 municipalities but also a deterioration in other 10 municipalities, all located on the periphery of the province. These are municipalities with high values of the index and therefore have suffered the most the decrease in NUAs. However, considering the index calculated only for NUAs (I_Cult_LandNUAs), it can be noted that an improvement was recorded in 36 municipalities, a clear sign that municipal planning has succeeded in safeguarding and enhancing the cultural ESs provided by the landscape (Figure 16).

3.5. Evolution of the Overall ESs Provided by Non-Urbanized Areas (CQI* Index)

For each of the considered periods, the three indices were aggregated to calculate the composite quality index (CQI*), which represents the overall ESs provided by the NUAs, according to the following formula:
C Q I i *   =   I P r o v A g r · W A g r + I R e g N a t ·   W N a t   + I C u l t L a n d · W L a n d
where W A g r , W N a t , and W L a n d (whose sum equals 1) are the weights representing the relative importance given to the three types of ESs (provisioning, regulating, and cultural).
In this study, to assess how any differences in assigning weights between planners and the communities involved could affect the value of the overall index, three hypothetical alternative scenarios were defined using the Analytic Hierarchy Process: (i) scenario 1, in which the three indices have the same importance; (ii) scenario 2, in which the regulating ESs provided by natural resources have greater importance than the others; (iii) scenario 3, in which the cultural ESs provided by landscape have greater importance than the others. (Table 6).
The CQI*PROV of the study area from T0 to T2 remained virtually constant in scenarios 1 (+1.1%) and 3 (+0.1%), while it increased significantly (+25.9%) in scenario 2 (Table 10). This trend is due to the greater weight (0.50) assigned to the I_Reg_Nat index in scenario 2. Conversely, in scenario 3, the greater weight (0.50) assigned to the I_Cult_Land index is not sufficient to increase the CQI value. This situation can be explained by looking at the CQI*PROV values at T0. In scenarios 1 and 3, they are very similar to each other (0.233 in scenario 1 and 0.257 in scenario 3), while it is significantly lower (0.152) in scenario 2. The growing attention over the years for the role of natural resources and the low starting level generate, in scenario 2, a very important % increase.
The land-take of the last 20 years, which has reduced NUAs by 18.3 sq. km (−8.3%) (Table 7), appears to have been barely contained by land-use planning policies (scenarios 1 and 3), and only by emphasizing nature protection policies (scenario 2) can an improvement be observed.
Looking at the index referred only to NUAs (CQI*NUAs), an important increase is observed in all scenarios (Table 10). On the one hand, this demonstrates that, despite a significant loss of green infrastructure due to land-take (−18.3 sq.km of NUAs), it has been possible, so far, to stem the phenomenon thanks to an increasing capacity of the remaining green areas to provide ESs. On the other hand, it is clear that if the land-take policy continues at the current rate, without safeguarding the highest-quality land, the situation will deteriorate very quickly due to the fragmentation and reduced accessibility and connectivity of the ecosystems.
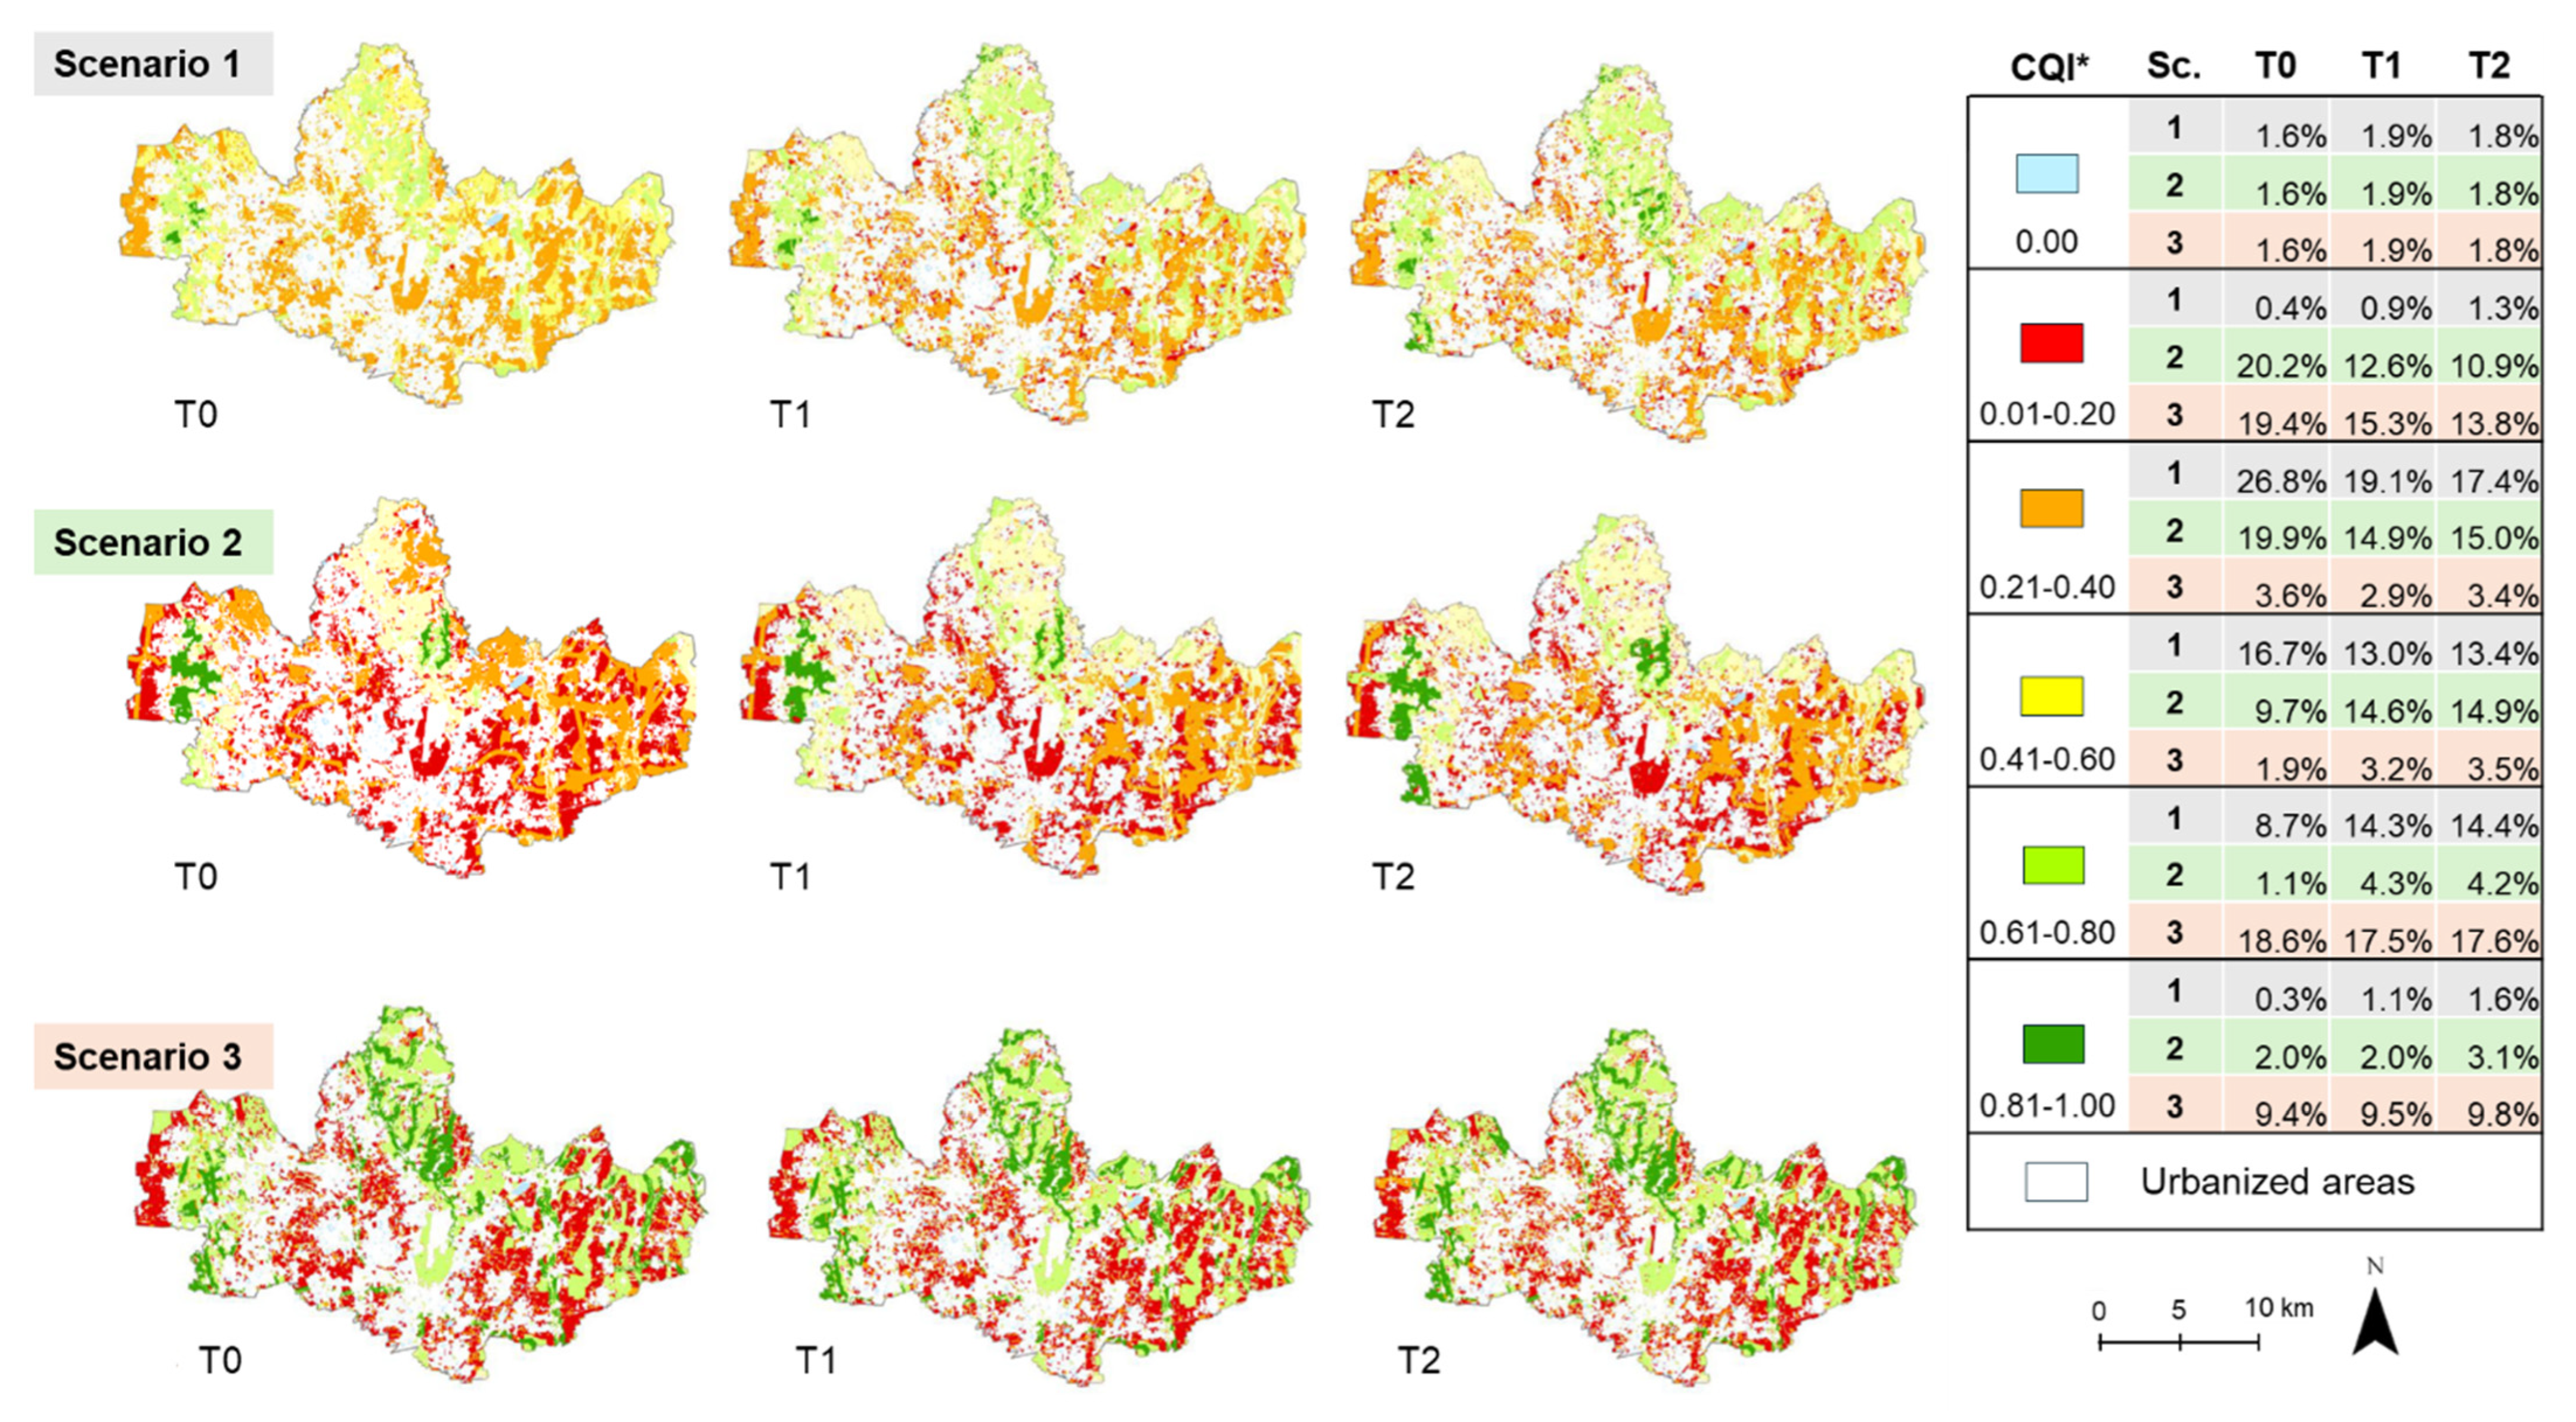
The distribution of the overall ESs provided by non-urbanized areas within the study area is also irregular, reflecting that of the individual indices. The areas with the highest values, regardless of the scenario, are concentrated in the most peripheral parts of the study area (Figure 17). Between T0 and T2, the class with an index value of 0.01–0.20 decreases significantly in scenarios 2 and 3, while remaining almost constant in scenario 1. The next class (0.21–0.40), however, decreases significantly in scenario 1 and much less in scenarios 2 and 3.
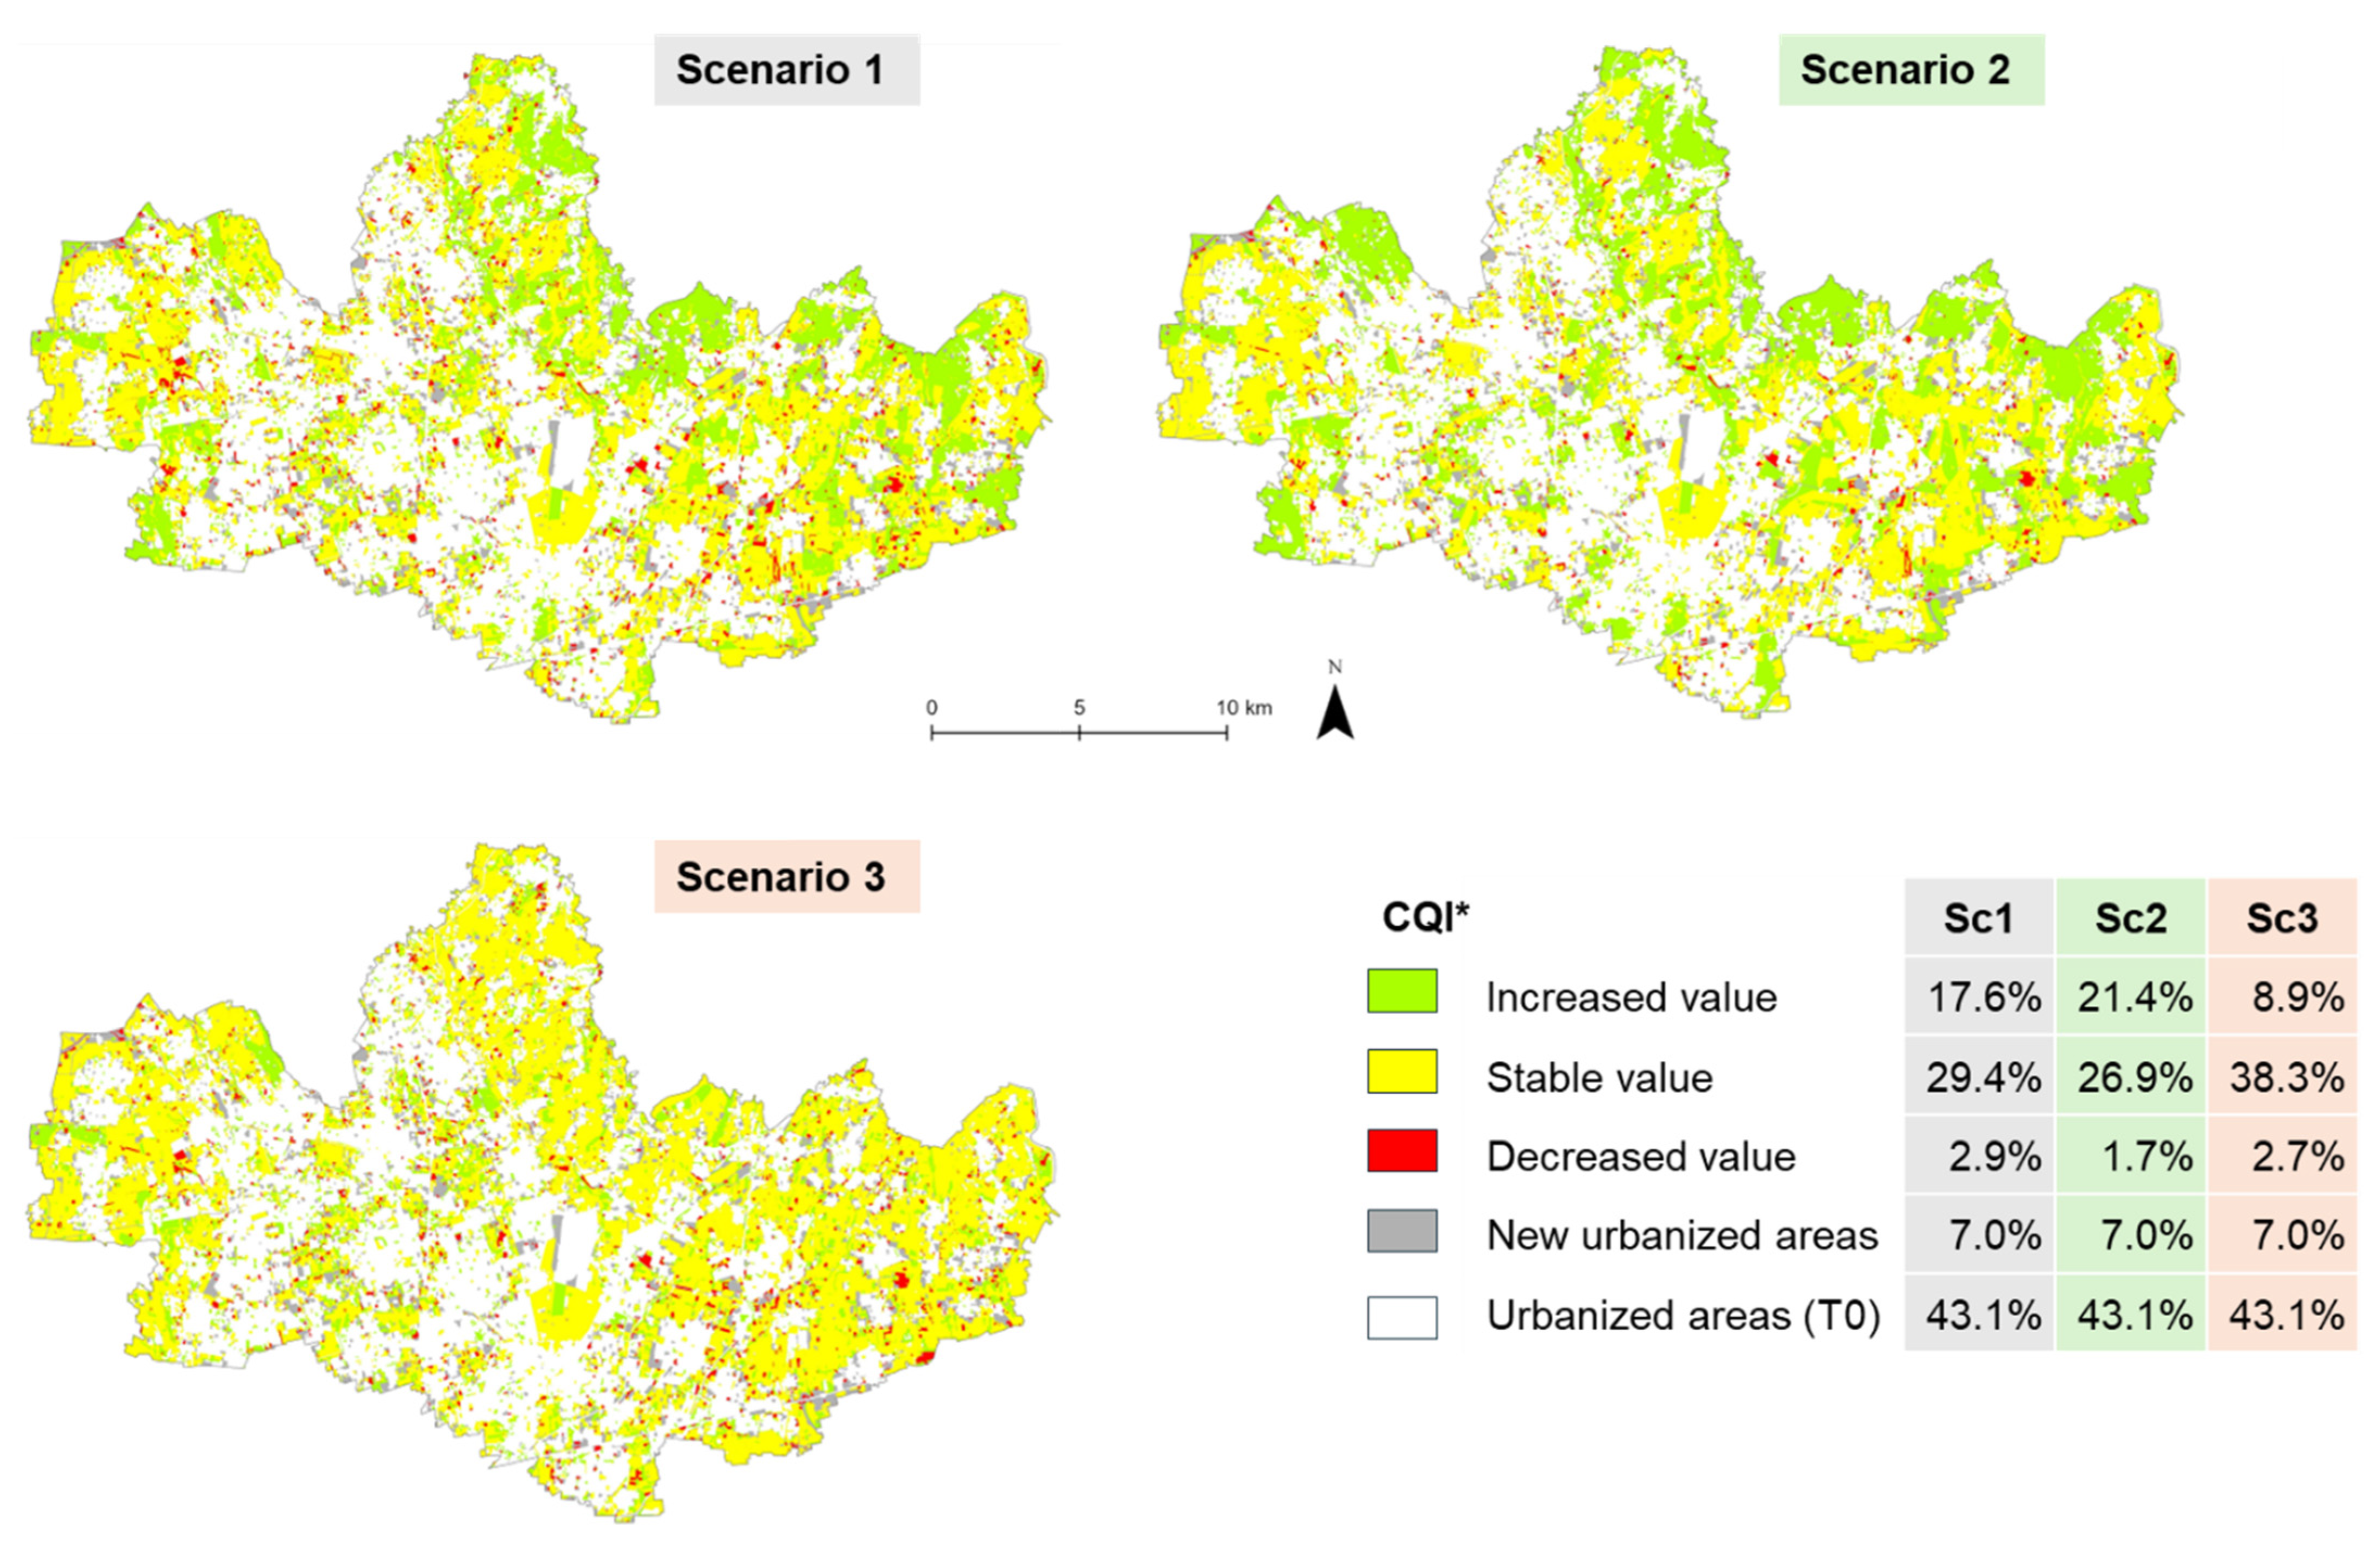
Regarding the higher classes (>0.40), a moderate increase is recorded in scenarios 1 and 2 (from 25.7% to 29.4% and from 12.8% to 22.2%, respectively), while they remain almost constant (from 29.9% to 30.9%) in scenario 3. This indicates a general increase over time in the ESs provided by green areas. This is confirmed by the fact that (Figure 18) 21.4% of NUAs increased their CQI* value in scenario 2, compared to only 8.9% in scenario 3. Scenario 1, naturally more balanced (with equal weights for the three indices), is in the middle, with 17.6% of NUAs increasing their index value.
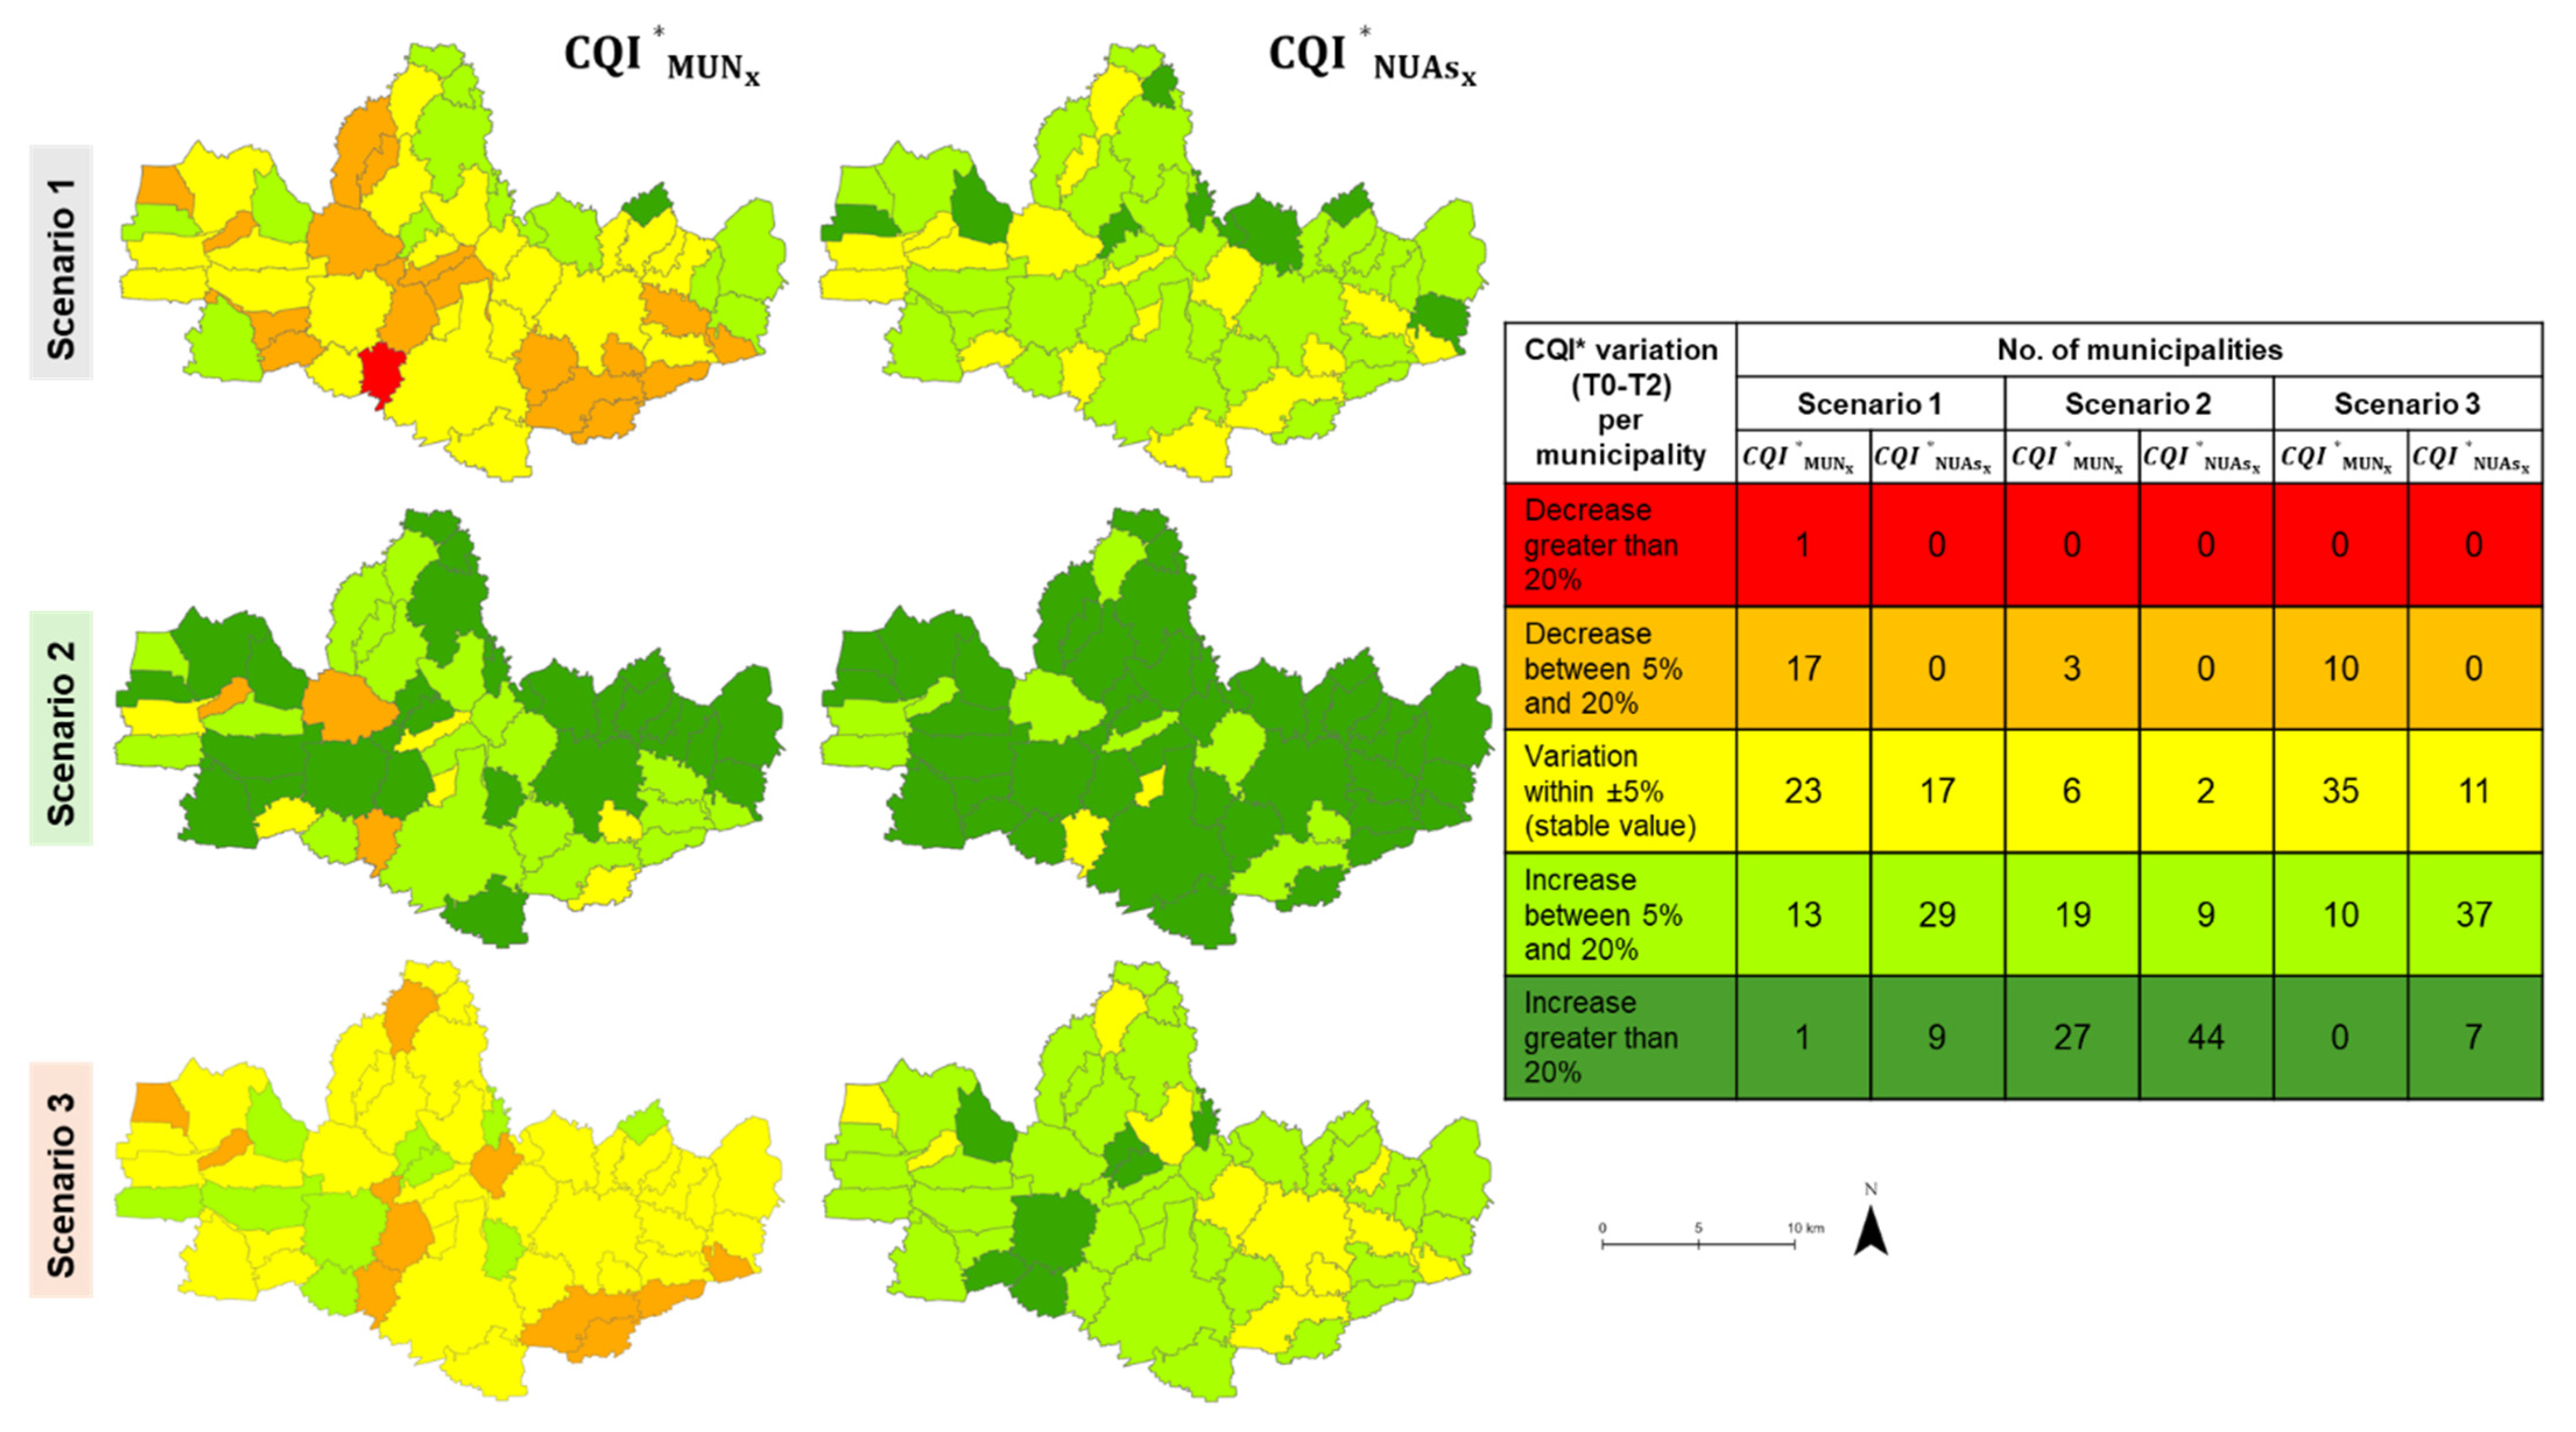
Analyzing the trend of the index at the municipal level from T0 to T2 (Figure 19), it can be noted that the index calculated for the entire municipal area (CQI*PROV) shows a general stability in scenarios 1 (23 municipalities) and 3 (35 municipalities), with a similar number of municipalities recording a decrease (17 in scenario 1 and 10 in scenario 3) and an increase between 5 and 20% (13 in scenario 1 and 10 in scenario 3). Scenario 2, on the other hand, presents a complete different situation, with 46 municipalities showing an increase.
If we consider the index calculated only on NUAs (CQI*NUAs), it can be noted that an improvement was recorded in all scenarios (38 municipalities in scenario 1, 53 in 2, and 44 in 3), confirming what was previously stated regarding the ability to compensate for the loss of green infrastructure by increasing the capacity of the remaining green areas to provide ESs.
It is important to note that calculating indices based only on NUAs may overestimate the contribution of green areas to the provision of ESs. This is because, by not taking into account the distribution and fragmentation of green areas within the urbanized fabric, it does not consider the relationship between ecosystem services and human pressure, a relevant factor for planning purposes.
Although scenario 1 appears to be the most balanced, authors believe that, in a highly urbanized context such as that of the study area, it is plausible that planners and local stakeholders may find it useful to give greater importance to ESs provided by nature and/or the landscape.

4. Conclusions

This study on the Province of Monza–Brianza provided an in-depth characterization of the transformation of the territory between 1999 and 2021. Specifically, an overall loss of green areas equal to 18.4 sq.km (−8.3%) was observed, with a more marked decline in the first period (T0–T1), when 7.7% of non-urbanized areas were lost, compared to the second period (T1–T2), which saw a more modest decline of 0.7%.
Agricultural areas were the most transformed (−36.1 sq.km), both through their conversion into forested, natural, or semi-natural areas (20.4 sq.km), and through their urbanization, especially into industrial, commercial, and sports areas (8.8 sq.km) as well as residential areas (7.5 sq.km). This confirms the severity of the land-take phenomenon in such a densely populated and highly urbanized province. In this context, it would be desirable to increase urban regeneration projects, implementing de-urbanization and de-sealing of urban areas to bring nature into the city, rather than reclaiming agricultural land for the creation of new forestry or natural areas.
The analysis of three specific indices (I_Prov_Agr, I_Reg_Nat, and I_Cult_Land) allowed to assess the evolution of ecosystem services in the province. The I_Prov_Agr index, designed to measure the provisioning ESs coming from agriculture, showed a downward trend, highlighting a progressive erosion of agricultural production capacity due to land-take and land-use planning policies that fail to safeguard and enhance the most valuable agricultural areas. Conversely, the I_Reg_Nat index, designed to measure the regulating ESs provided by natural resources, recorded a significant increase, demonstrating growing attention and effectiveness of natural resource conservation policies. Finally, the I_Cult_Land index, designed to measure cultural ESs provided by landscape, was found to be stable overall, with a trend toward improvement.
Based on these three indicators, the composite index CQI* was calculated, which summarizes in a single value the quality of the territory, as a function of the quantity of ESs provided. The overall assessment of the CQI* trend over time depends on the relative importance (weight) attributed to the different types of ESs (provisioning, regulating, and cultural). The scenario-based approach allowed us to explore different weighting configurations among the three components, which led to different results: overall, scenarios 1 and 3 showed a trend toward stability, while scenario 2 showed a marked improvement. Given the same land-take, the difference between scenario 1 (CQI* + 1.1%), in which the three types of ESs have the same weight, and scenario 3 (CQI* + 0.1%), in which cultural ESs provided by the landscape assume greater importance than the others, lies in the different positive balance of the areas that increased the index value: 14.7% (17.6% − 2.9%) in scenario 1 versus 6.2% (8.9% − 2.7%) in scenario 3, which partially offset the land-take.
Scenario 2, in which regulating ESs provided by natural resources assume greater importance than the others, shows a decidedly positive overall trend in the index: an increase of almost 26% at the provincial level and a positive balance of almost 20% in the areas that increased the index value (21.4% − 1.7%). Undoubtedly, policies to protect natural areas have been effectively implemented over the past 20 years, but the picture portrayed by scenario 2 appears overly optimistic. The study area, already highly urbanized, has continued to erode green infrastructure, and natural resource protection policies alone cannot compensate for the loss of ecosystem services due to land-take over the past 20 years, which has reduced green areas by 18.3 sq.km (−8.3%). It is necessary to implement the green infrastructure development strategy through a diverse set of actions [4,58]: habitat restoration, increased connectivity, and reduced ecosystem fragmentation; land-take, urban sprawl, and soil sealing reduction; promotion of de-sealing and urban regeneration projects using nature-based solutions; implementation of multifunctional rural zones and agroecological farming. If land-take continues at its current rate, we will begin to measure its consequences in the near future.
The objective of the study, to assess the consequences on the provision of ecosystem services resulting from continued land-take in the study area, has been reached through the application, with the necessary adaptations, of the methodology proposed by Senes et al. [54]. Based on official and periodically updated data, the methodology allows for the creation of an ES assessment database capable of monitoring, also in the future, their trends over time and, consequently, guiding land-use policy decisions.
The use of AHP to construct alternative scenarios allows for the involvement of local planners and stakeholders in the assessment process.
The study, however, has some limitations. First, the availability of data in the past becomes increasingly limited the further back you go. Furthermore, the use of data from different periods limits the homogeneity of the information (in terms of resolution, detail, and significance). This aspect highlights the urgent need to improve the collection and preservation of spatial data over time in order to strengthen the monitoring of planning policies.
An additional limitation that emerged concerns the quality and reliability of the DUSAF database data, derived from photointerpretation. Although they represent an official and indispensable basis for reconstructing land uses, over the years they have shown interpretative and classification differences that can cause some uncertainty in temporal comparisons, especially at a local scale.
In the future, it may be useful to further validate the methodology conducting comparative studies on areas with different socioeconomic profiles, in order to verify the generalizability of the methodology, or use different data sources available to evaluate the potential bias of using periods of time rather than specific dates.

Author Contributions

Conceptualization, G.S., G.L. and N.F.; methodology, G.S., G.L., P.S.F., R.R., A.P., D.C. and N.F.; formal analysis, G.L., P.S.F. and R.R.; investigation, G.S., G.L., A.P. and D.C.; data curation, G.L., P.S.F. and R.R.; writing—original draft preparation, G.S. and G.L.; writing—review and editing, A.P., D.C. and N.F.; supervision, G.S. and N.F. All authors have read and agreed to the published version of the manuscript.

Funding

This research received no external funding.

Data Availability Statement

The original contributions presented in the study are included in the article, further inquiries can be directed to the corresponding author.

Acknowledgments

The authors acknowledge Federico Riva for the technical support.

Conflicts of Interest

The authors declare no conflicts of interest.

References

  1. Weber, T.; Sloan, A.; Wolf, J. Maryland’s green infrastructure assessment: Development of a comprehensive approach to land conservation. Landsc. Urban Plan. 2006, 77, 94–110. [Google Scholar] [CrossRef]
  2. Tzoulas, K.; Korpela, K.; Venn, S.; Yli-Pelkonen, V.; Kaźmierczak, A.; Niemela, J.; James, P. Promoting ecosystem and human health in urban areas using green infrastructure: A literature review. Landsc. Urban Plan. 2007, 81, 167–178. [Google Scholar] [CrossRef]
  3. La Rosa, D.; Privitera, R. Characterization of non-urbanized areas for land-use planning of agricultural and green infrastructure in urban contexts. Landsc. Urban Plan. 2013, 109, 94–106. [Google Scholar] [CrossRef]
  4. European Union. Building a Green Infrastructure for Europe; European Union Publications Office: Bruxelles, Belgium, 2014; Available online: https://op.europa.eu/en/publication-detail/-/publication/738d80bb-7d10-47bc-b131-ba8110e7c2d6/language-en (accessed on 5 March 2025).
  5. Fairbrass, A.; Jones, K.; McIntosh, A.; Yao, Z.; Malki-Epshtein, L.; Bell, S. Green Infrastructure for London: A Review of the Evidence. A Report by the Engineering Exchange for just Space and the London Sustainability Exchange. 2018. Available online: https://www.ucl.ac.uk/engineering-exchange/sites/engineering-exchange/files/ucl-green-infrastructure-for-london.pdf (accessed on 5 March 2025).
  6. Millennium Ecosystem Assessment. Ecosystems and Human Well-Being: Synthesis; Island Press: Washington, DC, USA, 2005; Available online: https://www.millenniumassessment.org/documents/document.356.aspx.pdf (accessed on 5 March 2025).
  7. Colsaet, A.; Laurans, Y.; Levrel, H. What drives land take and urban land expansion? A systematic review. Land Use Policy 2018, 79, 339–349. [Google Scholar] [CrossRef]
  8. Arcidiacono, A.; Di Simine, D.; Ronchi, S.; Salata, S. Consumo di Suolo, Servizi Ecosistemici e Green Infrastructures: Caratteri Territoriali, Approcci Disciplinari e Progetti Innovativi; Rapporto 2018; INU Edizioni: Rome, Italy, 2018; Available online: https://hdl.handle.net/11311/1199996 (accessed on 5 March 2025).
  9. SNPA (Sistema Nazionale per la Protezione dell’Ambiente). Consumo di Suolo, Dinamiche Territoriali e Servizi Ecosistemici. Edizione 2024. Report Ambientali SNPA 2024, 43/2004. Available online: https://www.snpambiente.it/temi/suolo/consumo-di-suolo-dinamiche-territoriali-e-servizi-ecosistemici-edizione-2024/ (accessed on 5 March 2025).
  10. Lombardy Region. Legge Regionale 28 Novembre 2014, n. 31. Disposizioni per la Riduzione del Consumo di Suolo e per la riqualificazione del Suolo Degradato; BURL n. 49, suppl. del 1 Dicembre 2014. Available online: https://normelombardia.consiglio.regione.lombardia.it/NormeLombardia/Accessibile/main.aspx?iddoc=lr002014112800031&view=showdoc#n9 (accessed on 5 March 2025).
  11. Senes, G.; Fumagalli, N.; Ferrario, P.S.; Rovelli, R.; Sigon, R. Definition of a land quality index to preserve the best territories from future land take. An application to a study area in Lombardy (Italy). J. Agric. Eng. 2020, 51, 43–55. [Google Scholar] [CrossRef]
  12. Koschke, L.; Furst, C.; Frank, S.; Makeschin, F. A multi-criteria approach for an integrated land-cover-based assessment of ecosystem services provision to support landscape planning. Ecol. Indicat. 2012, 21, 54–66. [Google Scholar] [CrossRef]
  13. Logsdon, R.A.; Chaubey, I. A quantitative approach to evaluating ecosystem services. Ecol. Model. 2013, 257, 57–65. [Google Scholar] [CrossRef]
  14. Albert, C.; Galler, C.; Hermes, J.; Neuendorf, F.; von Haaren, C.; Lovett, A. Applying ecosystem services indicators in landscape planning and management: The ES-in-Planning framework. Ecol. Indic. 2016, 61, 100–113. [Google Scholar] [CrossRef]
  15. De Montis, A.; Serra, V.; Ganciu, A.; Ledda, A. Assessing landscape fragmentation: A composite indicator. Sustainability 2020, 12, 9632. [Google Scholar] [CrossRef]
  16. Ronchi, S.; Salata, S.; Arcidiacono, A.; Piroli, E.; Montanarella, L. Policy instruments for soil protection among the EU member states: A comparative analysis. Land Use Policy 2019, 82, 763–780. [Google Scholar] [CrossRef]
  17. Costanza, R.; d’Arge, R.; De Groot, R.; Farber, S.; Grasso, M.; Hannon, B.; Limburg, K.; Naeem, S.; O’neill, R.V.; Paruelo, J. The value of the world’s ecosystem services and natural capital. Nature 1997, 387, 253–260. [Google Scholar] [CrossRef]
  18. Dai, X.; Johnson, B.A.; Luo, P.; Yang, K.; Dong, L.; Wang, Q.; Liu, C.; Li, N.; Lu, H.; Ma, L.; et al. Estimation of Urban Ecosystem Services Value: A Case Study of Chengdu, Southwestern China. Remote Sens. 2021, 13, 207. [Google Scholar] [CrossRef]
  19. de Groot, R.; Brander, L.; van der Ploeg, S.; Costanza, R.; Bernard, F.; Braat, L.; Christie, M.; Crossman, N.; Ghermandi, A.; Hein, L.; et al. Global estimates of the value of ecosystems and their services in monetary units. Ecosyst. Serv. 2012, 1, 50–61. [Google Scholar] [CrossRef]
  20. Hu, Z.; Wang, S.; Bai, X.; Luo, G.; Li, Q.; Wu, L.; Yang, Y.; Tian, S.; Li, C.; Deng, Y. Changes in ecosystem service values in karst areas of China. Agric. Ecosyst. Environ. 2020, 301, 107026. [Google Scholar] [CrossRef]
  21. Rao, Y.X.; Zhou, M.; Ou, G.L.; Dai, D.Y.; Zhang, L.; Zhang, Z.; Nie, X.; Yang, C. Integrating ecosystem services value for sustainable land-use management in semi-arid region. J. Clean. Prod. 2018, 186, 662–672. [Google Scholar] [CrossRef]
  22. Xie, G.; Zhang, C.; Zhen, L.; Zhang, L. Dynamic changes in the value of China’s ecosystem services. Ecosyst. Serv. 2017, 26, 146–154. [Google Scholar] [CrossRef]
  23. Abulizi, A.; Yang, Y.; Mamat, Z.; Luo, J.; Abdulslam, D.; Xu, Z.; Zayiti, A.; Ahat, A.; Halik, W. Land-Use Change and its Effects in Charchan Oasis, Xinjiang, China. Land Degrad. Dev. 2017, 28, 106–115. [Google Scholar] [CrossRef]
  24. Jiang, W.; Lu, Y.H.; Liu, Y.X.; Gao, W.W. Ecosystem service value of the Qinghai- Tibet Plateau significantly increased during 25 years. Ecosyst. Serv. 2020, 44, 101146. [Google Scholar] [CrossRef]
  25. Liu, M.; Jia, Y.; Zhao, J.; Shen, Y.; Pei, H.; Zhang, H.; Li, Y. Revegetation projects significantly improved ecosystem service values in the agro-pastoral ecotone of northern China in recent 20 years. Sci. Total Environ. 2021, 788, 147756. [Google Scholar] [CrossRef]
  26. Ma, S.; Wang, H.Y.; Wang, L.J.; Jiang, J.; Gong, J.W.; Wu, S.; Luo, G.Y. Evaluation and simulation of landscape evolution and its ecological effects under vegetation restoration in the northern sand prevention belt, China. Catena 2022, 218, 106555. [Google Scholar] [CrossRef]
  27. Cai, Y.; Zhang, P.; Wang, Q.; Wu, Y.; Ding, Y.; Nabi, M.; Fu, C.; Wang, H.; Wang, Q. How does water diversion affect land use change and ecosystem service: A case study of Baiyangdian wetland, China. J. Environ. Manag. 2023, 344, 118558. [Google Scholar] [CrossRef]
  28. Wang, L.; Luo, G.; Ma, S.; Wang, H.; Jiang, J.; Zhang, J. Integrating landscape ecological risk into ecosystem service value assessment: A case study of Nanjing City, China. Ecol. Indic. 2023, 154, 110625. [Google Scholar] [CrossRef]
  29. Chen, W.; Zhao, H.; Li, J.; Zhu, L.; Wang, Z.; Zeng, J. Land use transitions and the associated impacts on ecosystem services in the Middle Reaches of the Yangtze River Economic Belt in China based on the geo-informatic Tupu method. Sci. Total Environ. 2020, 701, 134690. [Google Scholar] [CrossRef]
  30. Li, Z.; Kuang, Y. The Effects of Agricultural land Consolidation on Carbon and Ecosystem Service Value Changes in Jiangxi Province, China. J. Biotech Res. 2023, 14, 95–105. [Google Scholar]
  31. Das, A.; Das, D.; Houqe, R.; Pereira, P. Mapping ecosystem services for ecological planning and management: A case from a tropical planning region, Eastern India. Environ. Sci. Pollut. Res. 2023, 30, 7543–7560. [Google Scholar] [CrossRef] [PubMed]
  32. Tiandraza, F.; Qu, S.; Hu, S.; Mkono, C.N.; Tikhomirova, A.; Randrialahamady, S.N. Response of Ecosystem Services to Land Use Change in Madagascar Island, Africa: A Multi-Scale Perspective. Int. J. Environ. Res. Public Health 2023, 20, 3060. [Google Scholar] [CrossRef] [PubMed]
  33. Ankur, P.; Chatterjee, S.; Gupta, K. Evaluation on the change characteristics of ecosystem service in Dhanbad district of Jharkhand, India based on land use change. GeoJournal 2022, 87, 413–437. [Google Scholar] [CrossRef]
  34. Chen, R.; Huang, C. Landscape Evolution and It’s Impact of Ecosystem Service Value of the Wuhan City, China. Int. J. Environ. Res. Public Health 2021, 18, 13015. [Google Scholar] [CrossRef]
  35. Hasan, S.; Shi, W.; Zhu, X. Impact of land use land cover changes on ecosystem service value—A case study of Guangdong, Hong Kong, and Macao in South China. PLoS ONE 2020, 15, e0231259. [Google Scholar] [CrossRef]
  36. Zhang, J.; Qu, M.; Wang, C.; Zhao, J.; Cao, Y. Quantifying landscape pattern and ecosystem service value changes: A case study at the county level in the Chinese Loess Plateau. Glob. Ecol. Conserv. 2020, 23, e01110. [Google Scholar] [CrossRef]
  37. Li, S.; Yang, H.; Liu, J.; Lei, G. Towards ecological-economic integrity in the Jing-Jin-Ji regional development in China. Water 2018, 10, 1653. [Google Scholar] [CrossRef]
  38. Liu, Y.; Li, J.; Zhang, H. An ecosystem service valuation of land use change in Taiyuan City, China. Ecol. Model. 2012, 225, 127–132. [Google Scholar] [CrossRef]
  39. Erős, T.; Petrovszki, J.; Mórocz, A. Planning for sustainability: Historical data and remote sensing-based analyses aid landscape design in one of the largest remnant European floodplains. Landsc. Urban Plan. 2023, 238, 104837. [Google Scholar] [CrossRef]
  40. Montoya-Tangarife, C.; De La Barrera, F.; Salazar, A.; Inostroza, L. Monitoring the effects of land cover change on the supply of ecosystem services in an urban region: A study of Santiago-Valparaíso, Chile. PLoS ONE 2017, 12, e0188117. [Google Scholar] [CrossRef] [PubMed]
  41. Ramirez-Gomez, S.O.I.; Torres-Vitola, C.A.; Schreckenberg, K.; Honzák, M.; Cruz-Garcia, G.S.; Willcock, S.; Palacios, E.; Pérez-Miñana, E.; Verweij, P.A.; Poppy, G.M. Analysis of ecosystem services provision in the Colombian Amazon using participatory research and mapping techniques. Ecosyst. Serv. 2015, 13, 93–107. [Google Scholar] [CrossRef]
  42. Kopperoinen, L.; Itkonen, P.; Niemelä, J. Using expert knowledge in combining green infrastructure and ecosystem services in land use planning: An insight into a new place-based methodology. Landsc. Ecol. 2014, 29, 1361–1375. [Google Scholar] [CrossRef]
  43. Frank, S.; Fürst, C.; Witt, A.; Koschke, L.; Makeschin, F. Making use of the ecosystem services concept in regional planning—Trade-offs from reducing water erosion. Landsc. Ecol. 2014, 29, 1377–1391. [Google Scholar] [CrossRef]
  44. Deng, J.; Lin, Y.; Zhou, M.; Wu, C.; Chen, B.; Xiao, G.; Cai, J. Ecosystem services dynamics response to tremendous reclamation in a coastal island city. Ecosyst. Health Sustain. 2019, 5, 155–168. [Google Scholar] [CrossRef]
  45. Mengist, W.; Soromessa, T.; Feyisa, G.L. Landscape change effects on habitat quality in a forest biosphere reserve: Implications for the conservation of native habitats. J. Clean. Prod. 2021, 329, 129778. [Google Scholar] [CrossRef]
  46. Yohannes, H.; Soromessa, T.; Argaw, M.; Dewan, A. Spatio-temporal changes in habitat quality and linkage with landscape characteristics in the Beressa watershed, Blue Nile basin of Ethiopian highlands. J. Environ. Manag. 2021, 281, 111885. [Google Scholar] [CrossRef]
  47. Jia, K.; Huang, A.; Yin, X.; Yang, J.; Deng, L.; Lin, Z. Investigating the Impact of Urbanization on Water Ecosystem Services in the Dongjiang River Basin: A Spatial Analysis. Remote Sens. 2023, 15, 2265. [Google Scholar] [CrossRef]
  48. Yohannes, H.; Soromessa, T.; Argaw, M.; Dewan, A. Impact of landscape pattern changes on hydrological ecosystem services in the Beressa watershed of the Blue Nile Basin in Ethiopia. Sci. Total Environ. 2021, 793, 148559. [Google Scholar] [CrossRef]
  49. Zhong, L.; Wang, J.; Zhang, X.; Ying, L. Effects of agricultural land consolidation on ecosystem services: Trade-offs and synergies. J. Clean. Prod. 2020, 264, 121412. [Google Scholar] [CrossRef]
  50. González-García, A.; Palomo, I.; González, J.A.; López, C.A.; Montes, C. Quantifying spatial supply-demand mismatches in ecosystem services provides insights for land-use planning. Land Use Policy 2020, 94, 104493. [Google Scholar] [CrossRef]
  51. Moarrab, Y.; Salehi, E.; Amiri, M.J.; Hovidi, H. Spatial–temporal assessment and modeling of ecological security based on land-use/cover changes (case study: Lavasanat watershed). Int. J. Environ. Sci. Technol. 2022, 19, 3991–4006. [Google Scholar] [CrossRef]
  52. Lyu, R.; Clarke, K.C.; Zhang, J.; Feng, J.; Jia, X.; Li, J. Dynamics of spatial relationships among ecosystem services and their determinants: Implications for land use system reform in Northwestern China. Land Use Policy 2021, 102, 105231. [Google Scholar] [CrossRef]
  53. Fumagalli, N.; Senes, G.; Ferrario, P.S.; Corsini, D.; Brenna, L. Assessing Ecosystem Services Provided by Rural and Urban Green Areas at Territorial Scale, The Case of the Local Park GruBrìa (Monza and Milan Provinces, Italy); Lecture Notes in Civil Engineering; Springer Nature: Berlin/Heidelberg, Germany, 2025; Volume 586. [Google Scholar] [CrossRef]
  54. Senes, G.; Fumagalli, N.; Ferrario, P.S.; Rovelli, R.; Riva, F.; Sacchi, G.; Gamba, P.; Ruffini, G.; Redondi, G. Assessment of the ecosystem services given by rural and urban green areas to preserve high-quality territories from land take: The case of the province of Monza Brianza (Italy). J. Agric. Eng. 2023, 54, 1526. [Google Scholar] [CrossRef]
  55. Haines-Young, R.; Potschin-Young, M. Revision of the common international classification for ecosystem services (CICES V5.1): A policy brief. One Ecosyst. 2018, 3, e27108. [Google Scholar] [CrossRef]
  56. ISTAT (Italian National Institute of Statistics). Popolazione Residente per Sesso, età e Stato Civile al 1° Gennaio 2024. Demografia in Cifre. 2024. Available online: https://demo.istat.it/app/?l=it&a=2024&i=POS (accessed on 5 March 2025).
  57. Saaty, T.L. The Analytic Hierarchy Process; McGraw-Hill: New York, NY, USA, 1980. [Google Scholar] [CrossRef]
  58. Mazaherylaghab, H. Green infrastructure planning and balanced territorial development: Insights from Milan Rural Metropolis. J. Environ. Manag. 2025, 390, 126300. [Google Scholar] [CrossRef]
Figure 1. The study area.
Land 14 01700 g001
Figure 2. Methodological scheme.
Land 14 01700 g002
Figure 3. Ecosystem services considered for the index calculation. CQI, composite quality index. Modified from Senes et al. [54].
Land 14 01700 g003
Figure 4. Land-use maps of the study area in the three reference periods (colored areas represent NUAs).
Land 14 01700 g004
Figure 5. Trend of NUAs and their components over time.
Land 14 01700 g005
Figure 6. How NUAs changed from T0 to T2 (on the left) and what actual UAs were at T0 (on the right).
Land 14 01700 g006
Figure 7. NUAs variation (T0–T2) per municipality.
Land 14 01700 g007
Figure 8. Provisioning ESs coming from agriculture in T0, T1, and T2.
Land 14 01700 g008
Figure 9. Variation (T0–T2) of the provisioning ESs coming from agriculture.
Land 14 01700 g009
Figure 10. Variation (T0–T2) of the provisioning ESs coming from agriculture at the municipal level.
Land 14 01700 g010
Figure 11. Regulating ESs provided by natural resources in T0, T1, and T2.
Land 14 01700 g011
Figure 12. Variation (T0–T2) of the regulating ESs provided by natural resources.
Land 14 01700 g012
Figure 13. Variation (T0–T2) of regulating ESs provided by natural resources at municipal level.
Land 14 01700 g013
Figure 14. Cultural ESs provided by landscape in T0, T1, and T2.
Land 14 01700 g014
Figure 15. Variation (T0–T2) of the cultural ESs provided by landscape.
Land 14 01700 g015
Figure 16. Variation (T0–T2) of cultural ESs provided by landscape at municipal level.
Land 14 01700 g016
Figure 17. Overall ESs provided by non-urbanized areas (CQI* index) in T0, T1, and T2, in different scenarios.
Land 14 01700 g017
Figure 18. Variation (T0–T2) of the overall ESs provided by non-urbanized areas (CQI* index) in different scenarios.
Land 14 01700 g018
Figure 19. Variation (T0–T2) of the overall ESs provided by non-urbanized areas (CQI* index) in different scenarios at municipal level.
Land 14 01700 g019
Table 1. Databases utilized in the study.
IndexDatabases
I_Prov_AgrAgricultural land uses coming from DUSAF
I_Reg_NatNaturalistic value of soils, Parks and protected areas, Priority areas for biodiversity, Provincial ecological network, Regional ecological network, DUSAF
I_Cult_LandLandscape restrictions, Historical and Scenic trails, Landscape Elements from Provincial Plans, DUSAF
Table 6. Weights assigned to the indices in the different scenarios.
IndexScenario 1Scenario 2Scenario 3
I_Prov_Agr0.33…0.250.25
I_Reg_Nat0.33…0.500.25
I_Cult_Land0.33…0.250.50
Sum of the wights1.001.001.00
Table 7. Trend of NUAs over time.
NUAsT0T1Δ T1-T0T2ΔT2-T1Δ T2-T0
Sq.km%Sq.km%Sq.km%Sq.km%Sq.km%Sq.km%
Arable land157.038.8%119.129.4%−37.9−24.1%120.929.8%+1.8+1.5%−36.1−23.0%
FNSNAs *47.111.6%64.716.0%+17.637.4%59.414.7%−5.3−8.2%+12.3+26.1%
Other NUAs **17.54.3%20.85.1%+3.318.9%23.05.7%+2.2+10.6%+5.5+31.4%
Total NUAs221.654.7%204.650.5%−17.0−7.7%203.350.2%−1.3−0.6%−18.3−8.3%
UAs ***183.545.3%200.549.5%+17.0+9.3%201.849.8%+1.3+0.6%+18.3+10.0%
Study area405.1100%405.1100% 405.1100%
* Forests and natural and semi-natural areas. ** Other NUAs: parks, degraded, unused, and unvegetated areas, uncultivated green areas, riverbeds, and water basins. *** UAs: urbanized areas.
Table 8. LULC changes from T0 to T2.
T0T2
Arable
Land
FNSNAs *Other NUAs **Residential AreasIndustrial, Commercial and Sport AreasOther UAs ***Infrastructures
Arable land157.0112.420.44.07.58.81.42.5
FNSNAs *47.14.136.22.21.71.70.60.6
Other NUAs **17.50.81.012.21.11.80.30.3
Residential areas113.82.10.61.8102.93.80.42.2
Industrial, commercial, and sport areas56.90.90.71.72.449.20.51.5
Other UAs ***6.80.50.40.71.10.93.00.2
Infrastructures6.00.00.00.30.00.00.05.7
Total405.1120.859.322.9116.766.26.213.0
* Forests and natural and semi-natural areas. ** Other NUAs: parks, degraded, unused and unvegetated areas, uncultivated green areas, riverbeds, and water basins. *** UAs: urbanized areas.
Table 9. Trend of the calculated indexes over time.
IndexT0T1Δ T1-T0T2Δ T2-T1Δ T2-T0
I_Prov_AgrI_Prov_AgrPROV0.3400.295−0.045−13.2%0.284−0.011−3.7%−0.056−16.5%
I_Prov_AgrNUAs0.6240.588−0.036−5.8%0.569−0.019−3.2%−0.055−8.8%
I_Reg_NatI_Reg_NatPROV0.0910.143+0.052+57.1%0.1570.014+9.8%0.066+72.5%
I_Reg_NatNUAs0.1670.284+0.117+70.1%0.3150.031+10.9%0.148+88.6%
I_Cult_LandI_Cult_LandPROV0.2740.267−0.007−2.6%0.2720.005+1.9%−0.002−0.7%
I_Cult_LandNUAs0.5030.531+0.028+5.6%0.5450.014+2.6%0.042+8.3%
Table 10. Trend of CQI* over time and for different scenarios.
ScenarioIndexT0T1Δ T1-T0T2Δ T2-T1Δ T2-T0
Scenario 1CQI*PROV0.2330.2330.0000.0%0.235+0.003+1.1%+0.003+1.1%
CQI*NUAs0.4270.463+0.036+8.4%0.471+0.009+1.8%+0.044+10.4%
Scenario 2CQI*PROV0.1520.182+0.030+19.7%0.191+0.009+5.1%+0.039+25.9%
CQI*NUAs0.2780.361+0.083+29.7%0.382+0.021+5.9%+0.104+37.4%
Scenario 3CQI*PROV0.2570.254−0.004−1.4%0.258+0.004+1.6%+0.001+0.1%
CQI*NUAs0.4720.504+0.032+6.8%0.516+0.012+2.3%+0.044+9.3%
Disclaimer/Publisher’s Note: The statements, opinions and data contained in all publications are solely those of the individual author(s) and contributor(s) and not of MDPI and/or the editor(s). MDPI and/or the editor(s) disclaim responsibility for any injury to people or property resulting from any ideas, methods, instructions or products referred to in the content.