Abstract
Lebanon’s cereals production holds historical importance in the Bekaa region, which has served as Lebanon’s agricultural heartland for centuries. Today, this vital area for food security faces environmental challenges that threaten the viability of its cereals farming sector. This study examines the current state of agricultural resources and territorial features of cereals through the lens of farmers and the local community using Perception-Based Regional Mapping (PBRM). The resulting maps were digitized and analyzed using QGIS to highlight spatial disparities across the region. The study was conducted during the summer of 2023. A total of 36 maps were developed with local farmers who first identified the areas relevant to cereals cultivation, and then reflected the spatialized perceptions covered 93% of the total study area and delineated it into distinct zones based on eight criteria identified by farmers: water availability, water quality, type of water resources, soil type, soil fertility, agricultural productivity, landform, and size of arable land. The primary cereal crops grown in the region are wheat, barley, and corn, with wheat dominating cultivation. Farmers use both traditional and mechanized methods, apply nitrogen-based fertilizers and herbicides, and rely on rainfall or limited irrigation. The resulting maps highlighted the distinct agricultural zones within the basin, of which 1030 km2 (74%) were identified as appropriate for cereals cultivation. The findings underscore the value of local knowledge in identifying environmentally and economically favorable zones for cereals production, and contribute to the design of targeted, region-specific policies and interventions aimed at enhancing the resilience of cereals farming systems in the Bekaa—especially in light of ongoing socio-environmental pressures.
1. Introduction
In Lebanon, cereal crops, particularly wheat, barley, and corn, form a key component of the agricultural landscape. The country’s cereals cultivation spans approximately 4.5 million dunums (450,000 hectares), accounting for 20% of total cultivated land, with wheat alone representing about 70% of cereals production, followed by barley (25%) and corn (5%) [1]. Despite its historical and strategic significance, local wheat production covers only around 20% of national consumption needs, making Lebanon heavily reliant on imports from countries such as Russia, Ukraine, and Romania [2,3]. Recent geopolitical conflicts, particularly the Russia–Ukraine war, have amplified price volatility and exposed the fragility of Lebanon’s food security [4,5].
Historically, the Bekaa region has been esteemed as the epicenter of Lebanese agriculture and has played a pivotal role as the primary wheat producer [6]. The Bekaa Valley makes up 42% of Lebanon’s total land, with a length of 120 km and a width of 16 km [7]. The Bekaa Valley’s main economic activity is agriculture, including a wide range of crops such as wheat, potatoes, barley, and alfalfa [8]. These crops are grown in fields spanning from 0.1 hectares to more than 20 hectares. A total of 44,924 hectares of cereals were grown in Lebanon in 2010, representing 20% of the total cultivated land. Cereals cultivation is primarily concentrated in the Bekaa Valley, which makes up 65% of Lebanon’s total grain acreage [1]. This region is rich in natural resources that are crucial for sustaining agricultural activities. Groundwater, in particular, plays a vital role in supporting crop production in the Bekaa Valley, supplying approximately 65% of the irrigation water used in the area [9]. Farmers irrigate wheat 2–3 times per season, primarily using groundwater (two-thirds) and surface water (one-third) [9]. Irrigated wheat yields average 5 metric tons per hectare, while rainfed yields slightly exceed 3 metric tons [10]. Soils of this area are mostly shallow and are cultivated with rainfed crops, irrigated fruit trees, cereals, and other field crops [1].
The Lebanese agriculture sector is today facing a compounded crisis: economic collapse, political instability, and climate variability. This area suffers from erratic rainfall, rising temperature, midseason droughts reducing wheat yields, groundwater over-extraction, and infrastructural degradation [11,12]. A 1 °C temperature increase can cause a 13% yield loss, while elevated spring temperatures decrease soil moisture, leading to aridity and reduced productivity [13]. In addition, the recent surge in population driven by the substantial influx of Syrian refugees has increased both population and food demand in Lebanon [14,15,16].
Despite various national and international agricultural development programs implemented in Lebanon, most interventions have addressed broad constraints and strategies. National initiatives such as the Ministry of Agriculture’s strategies [17] have emphasized general goals like improving food security, enhancing productivity, and supporting rural livelihoods. Similarly, international development efforts led by organizations such as the FAO, USAID, and UNDP have introduced projects aimed at modernizing the sector and promoting sustainable agriculture. However, these programs have frequently lacked specificity in addressing the differentiated socio-economic, environmental, and institutional barriers encountered at the community or farm level [18]. There remains a critical need for region-specific analyses that consider the distinct environmental, agricultural, and territorial characteristics of each region. In this regard, integrating the perspectives and knowledge of local communities is essential for designing effective and context-sensitive interventions [19,20,21,22]. Such oversight can undermine the relevance and effectiveness of development strategies [22]. There is therefore a growing need for place-based assessments that incorporate the lived experiences and contextual knowledge of local communities, particularly where cereal systems are embedded in highly diverse socio-environmental settings. Participatory mapping has long been recognized as a powerful tool for democratizing spatial knowledge and amplifying the voices of marginalized groups [23,24]. More recently, scholars have also called for a critical reflection on participatory methods, highlighting the need to interrogate who is empowered, who is excluded, and how knowledge is framed through these tools [25]. In this context, Perception-Based Regional Mapping (PBRM) has emerged as a valuable methodology for capturing localized perspectives through a participatory and spatialized lens. This method collects regional-level perceptions through stakeholders’ statements and invites farmers to map their observations and concerns onto physical maps using tracing overlayers [22]. Unlike conventional GIS approaches that often rely on expert-defined parameters, PBRM emphasizes perception-based data, which some scholars argue can yield richer context-specific insights than standard GIS data alone [26]. Thus, integrating PBRM within broader participatory mapping frameworks allows for the generation of spatial knowledge that is both situated and co-produced with local actors. It integrates various layers of concepts and risks into a single map, making it a fast, cost-effective, and action-oriented method that provides easily understandable and usable data for both communities and development agencies [22]. PBRM extends this by incorporating Geographic Information Systems (GIS) formalism, producing a hierarchized list of spatially discriminated parameters [22,23,24,25,26,27]. It allows access to local information and views on environmental features and resource use. It highlights community concerns and potential impacts, reflecting local practices and collective actions. Previous PBRM applications in countries like Laos, Tunisia, and Niger have revealed critical local insights, such as uneven water access, environmental risks, and overlooked socio-spatial disparities by highlighting critical local determinants often missed by conventional top-down assessments. Findings of these studies highlight PBRM’s strength in integrating local perceptions into spatial planning and regional development strategies [28,29,30]. In Lebanon, applying such an approach offers the opportunity to better understand the spatial heterogeneity of farming systems in the Bekaa and inform more grounded, equitable agricultural interventions, particularly in relation to crucial crops such as cereals.
This study aims to visualize cereal farmers’ perceptions using the PBRM approach. Findings can provide policymakers and agricultural researchers with more specific insights grounded in local realities to design targeted interventions and support more sustainable and resilient farming systems.
2. Materials and Methods
This study on perception mapping and cereals farming in the Bekaa was conducted during the summer of 2023. It adopts PBRM based on the perceptions of 36 community farmers, all males. This social discrepancy is both economic (most women are not involved in agriculture but in other economic activities or housekeeping) and social (it is very difficult to meet women alone, even with female students as interviewers).
2.1. Study Area
The study covers an area of 1500 km2 of the Bekaa Valley, along the Upper Litani Basin, extending from the Northern Bekaa (Baalbek city) to the Qaraoun Reservoir (Figure 1). This region is rich in natural resources crucial for both agricultural and domestic water supply, including the Litani River, Anjar and Chamsine springs, and significant groundwater sources from the Quaternary, Eocene, and Cretaceous aquifers [31]. Cereals cultivation is primarily widespread in the Bekaa Valley, representing 65% of the total cereal-cultivated land in Lebanon. This area is distributed across the valley’s two governorates: the Bekaa Governorate accounts for 35% and Baalbek-Hermel for 30% of national cereal production [1]. Within this context, wheat represents the dominant cereal crop, covering approximately 298,403 dunums, equivalent to two-thirds of the total cereal-cultivated area., Of this, around 58% of wheat cultivation occurs within the two governorates of the Bekaa Valley [1].
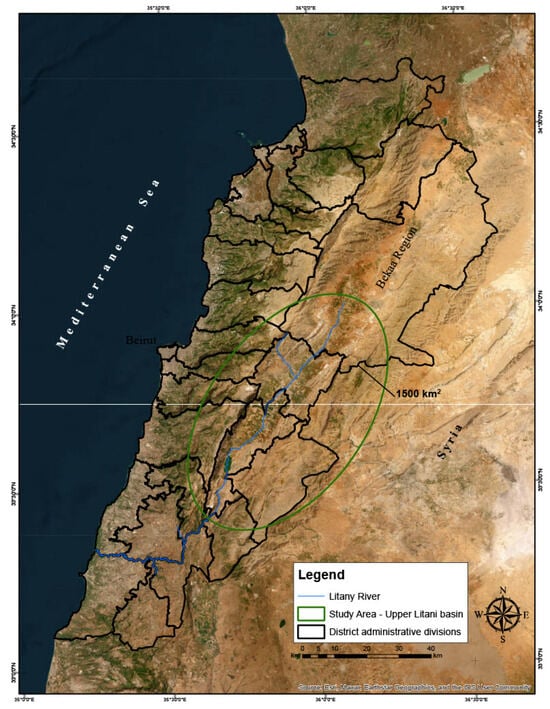
Figure 1.
Map representing the study area.
2.2. Perception-Based Regional Mapping
The sampling technique adopted in this research was a non-probability sampling method with a purposive sampling technique for the selection of farmers. The community members were selected based on their comprehensive knowledge of agriculture in the region, even if they were not directly engaged in farming. The plan intended to obtain good coverage to accurately represent and give results of a good characterization and generalization of the population studied.
A geographical map of A2 size covering the Bekaa valley with all cities and towns, roads, and water bodies was developed using the database of the Environmental Observatory of Lebanon and France (O-Life). Map-making was mainly performed on the site when the interviewees were free from other activities, following the methodology of Saqalli et al. [30,31,32], as summarized in Figure 2.
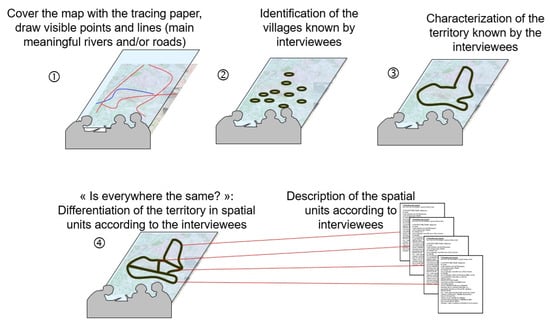
Figure 2.
The different steps of PBRM mapping process [30,31,32].
The process began with the placement of tracing paper on a map, with interviewees tasked with delineating their spatial knowledge by circling familiar villages or areas relevant to their activities. As most farmers lacked mapping experience, the initial focus was on identifying recognized villages extending from the interviewee’s village. This process resulted in a well-defined territory characterized by them. Interviewees were prompted with an open-ended question: “Are the agricultural conditions, resources and practices in the territory you know the same everywhere?” enabling them to establish their own criteria for differentiation. The interviewer noted these criteria, along with discussions and reactions. The interviewee was prompted to spatially delineate the map units within the study area according to crops cultivated, particularly cereals, and various features (criteria) that they well perceived. Mapped units were designated with numbers according to the chronological order of their presentation by the framers. The final step combined the maps obtained, intersecting the polygons and combining the criteria and their declination. Subsequently, the territory was subdivided into homogeneous units based on criteria defined solely by the interviewee, allowing for the incorporation of various villages sharing similar characteristics. At the end, a single map with several hundred polygons was produced, each with information weighted by the number of informants who spoke about it in their respective maps. The data obtained was entered into Excel as per the interviewee’s instructions, maintaining the exact order in which it was provided. This order helps determine the most significant criteria when examining whether territory features, resources, land use, and agriculture are the same everywhere.
2.3. Data Analysis
After completing the hand-drawn maps, the subsequent phase involved digitizing each map using Geographic Information System software (version 3.44.1), specifically QGIS software [22,23,24,25,26,27,28,29,30]. Digitization involves transforming analog maps into digital formats, enabling accurate spatial analysis and data manipulation.
Within QGIS, digitization entailed creating digital vector layers representing the features depicted on the hand-drawn maps using specialized tools within QGIS. Each shapefile was digitized using the gathered data, including essential attributes such as informant names, reference, and zone. The “Create Layer” tool was first used to define new polygon vector layers, followed by the ‘Add Polygon Feature’ tool to manually trace the mapped features. The attribute table was then populated using the “Identify Features” and ‘Field Calculator’ tools to ensure accurate and structured data input. It is important to explicitly state that the shapefiles are polygonal, as this format supports the use of GIS tools that will be applied later—particularly those in the vector overlay family, which require polygon features for spatial analyses such as intersection and union operations.
To integrate these maps into a unified dataset, a unique identifier field called “join” was added to facilitate data integration. Additionally, a 100 m grid was generated across the entire extent of the 36 maps using QGIS tools like Dissolve and Create Fishnet to offer a comprehensive representation of the study area. This grid was then clipped to include only the relevant areas within the study boundary, resulting in the creation of “Grid_total_plg_100m_36_clip.shp”, which contains 140,316 cells/features.
To consolidate the various data layers, the merged shapefile and the clipped grid were combined using QGIS’s Union tool, creating a comprehensive dataset named “Total_Grid_total_plg_100m_36_clip”, comprising 2,366,792 features. The final map provided a multidisciplinary representation of the study area, incorporating criteria from all the interviewees.
After obtaining the perception map, the criteria were ranked according to the number of times they were raised and the order in which they appeared during the interviews. This ranking is considered to reflect the relative importance of each criterion as perceived by the interviewees concerning the local agricultural resources and key issues of the surrounding environment. The weight for each criterion was calculated using the formula:
where Ni is the number of times that criterion X is cited during interviews with order i, with i being the order of appearance of criterion X in an interview. The value of i ranges from 1 to 8, where 1 indicates that the criterion appeared first in the interview and 8 indicates that the criterion appeared after 7 other criteria [22].
A standardized legend was typically applied using a three-tier scale (1 = low, 2 = medium/intermediate, 3 = high). In certain cases, however, participants proposed a four-level scale (1 = low/small, 2 = medium, 3 = high/large, 4 = very high/large) or other customized classifications tailored to the specific nature of the mapped criterion. These classification schemes were not imposed externally but were instead provided directly by the participants, based on their own perceptions and local knowledge. Given that this is a perception-based study, the use of varying scales was intentionally preserved to reflect the diversity of informant input. While such variation may raise concerns regarding potential bias or uneven weighting, the approach prioritizes the authenticity and contextual accuracy of participants’ evaluations over standardization, which might otherwise dilute the richness of the data.
3. Results
3.1. Mapping Participants and Coverage
A total of 36 maps were created, each representing the input of a male framer from the study area, all of whom had an agricultural background from different locations across the study area. These locations (illustrated in Figure 3) represent the field sites visited during the study and collectively contributed to a perception map covering approximately 1395 km2 of the Bekaa Valley, representing 93% of the study area (1500 km2). The participants, averaging 51.5 years in age, were primarily farmers (58.3%), followed by agricultural engineers (19.4%), traders (16.6%), and government workers (5.6%).
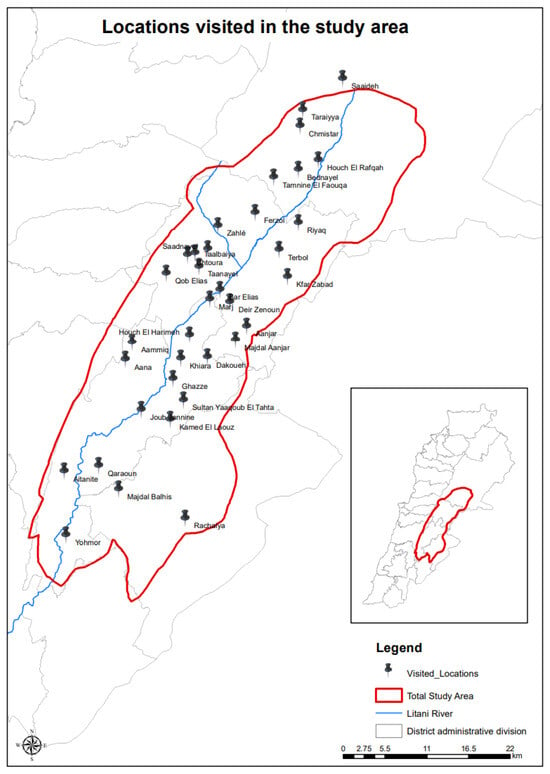
Figure 3.
Locations visited for perception mapping in Bekaa Valley, and area covered by PBRM.
3.2. Cereal Cultivation Practices
Wheat, barley, and corn were identified as the primary cereal crops cultivated in this region, based on interviews with local farmers. Among them, wheat was reported as the most widely cultivated. Farmers indicated that wheat is typically prioritized due to its adaptability to local conditions and market demand. Interviewed farmers described their cereal cultivation practices from sowing to harvesting, highlighting a mix of traditional and mechanized techniques. Most rely on mechanical sowing, although some still spread seeds manually while using a tractor to traverse the fields. Sowing typically starts in late autumn for wheat and barley, while corn is planted later in the season. Fertilizers, particularly nitrogen-based types like urea and ammonium sulfate, are commonly applied throughout the growing period to boost productivity. Pesticide use is also widespread, especially herbicides, which are heavily employed in wheat and barley to control weeds. Irrigation practices vary, with many farmers depending on rainfall and others applying one or two additional irrigation sessions in late spring. The average yields, based on farmer responses, were approximately 0.65 tons per dunum for wheat, 0.5 tons per dunum for barley, and 3 tons per dunum for corn.
3.3. Perception-Based Suitability and Mapping Outputs
These participants contributed to a perception map covering 1395 km2 of the Bekaa Valley, representing 93% of the study area. There were eight criteria identified by farmers: water availability, water quality, type of water resources, soil type, soil fertility, agricultural productivity, landform, and size of arable land. Each of these factors was represented in distinct maps, bordered by a red outline to delineate the total study area. Within this region, approximately 1030 km2 (74% of the area covered by the PBRMs) were identified as suitable for cereals cultivation based on local perceptions presented as hatched regions on the maps (Figure 4, Figure 5, Figure 6, Figure 7, Figure 8, Figure 9, Figure 10 and Figure 11). This area stretches across the northern, central, and southern parts of the Bekaa Valley. It begins in the Baalbek district in the north, extends through Zahle and West Bekaa, and reaches the southern boundaries near Rachaya. This zone follows the main axis of the valley, aligning with the course of the Litani River and encompassing large portions of the valley floor. It is important to note that not all of the identified criteria uniformly cover the entire area perceived as suitable for cereal cultivation.
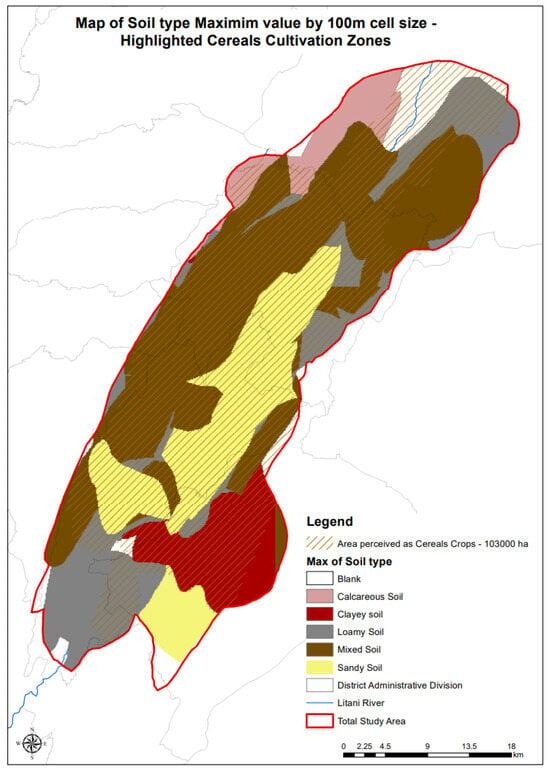
Figure 4.
Map of soil type.
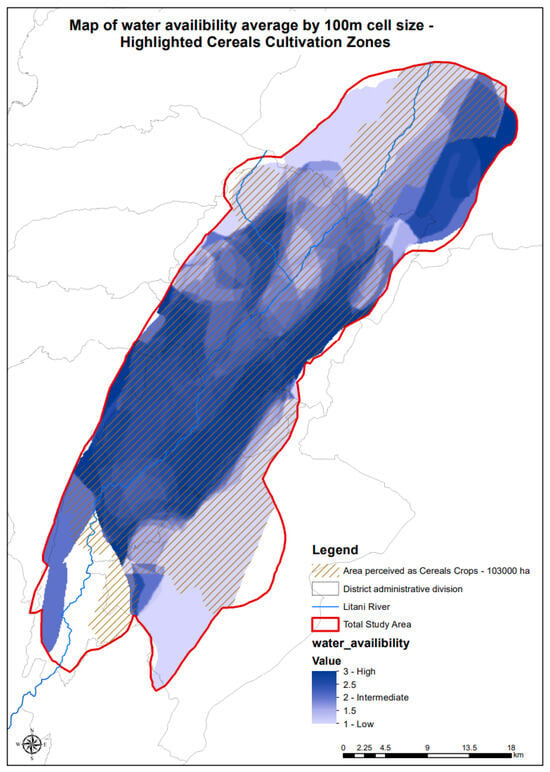
Figure 5.
Map of water availability.
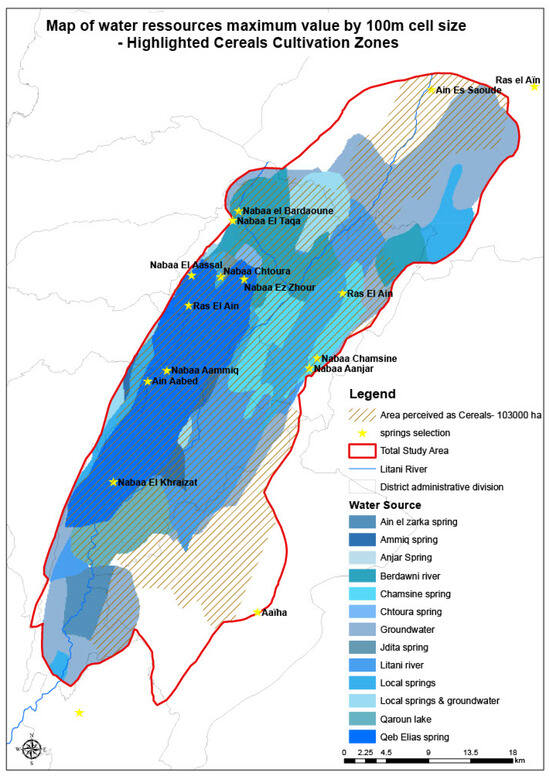
Figure 6.
Map of water sources.
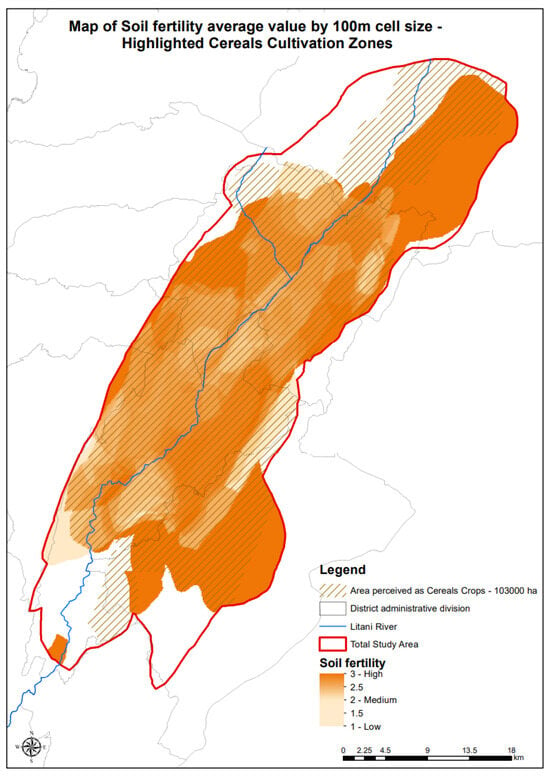
Figure 7.
Map of soil fertility.
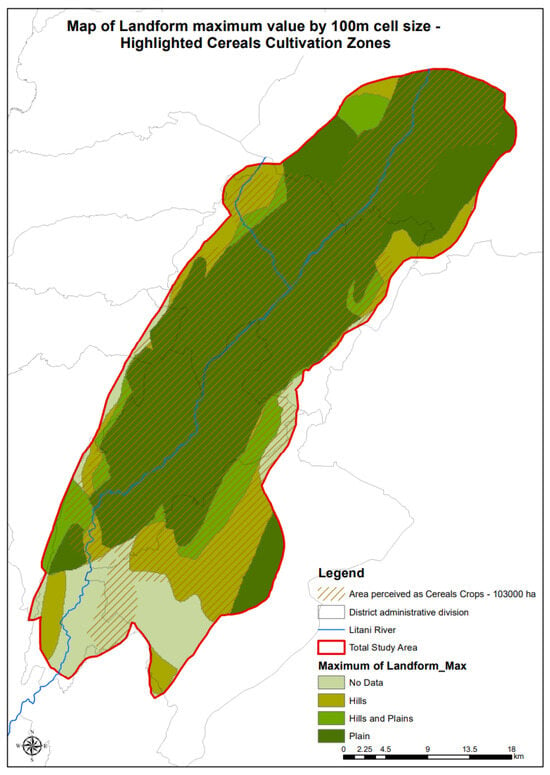
Figure 8.
Map of landform.
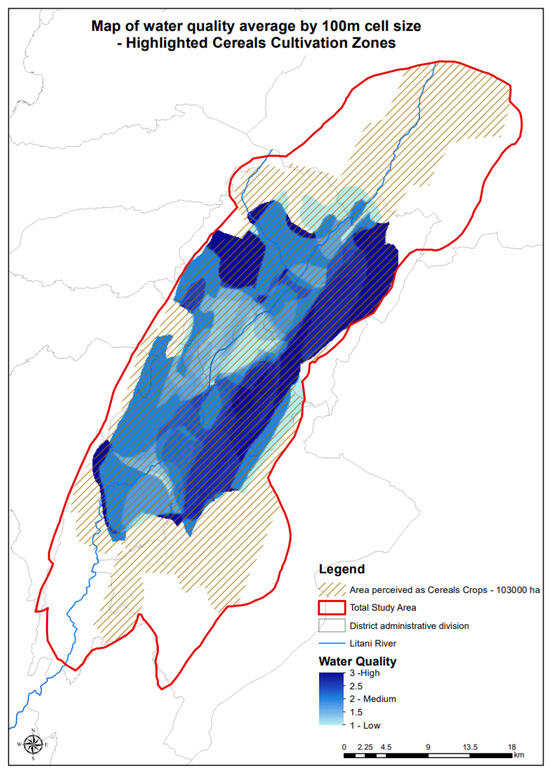
Figure 9.
Map of water quality.
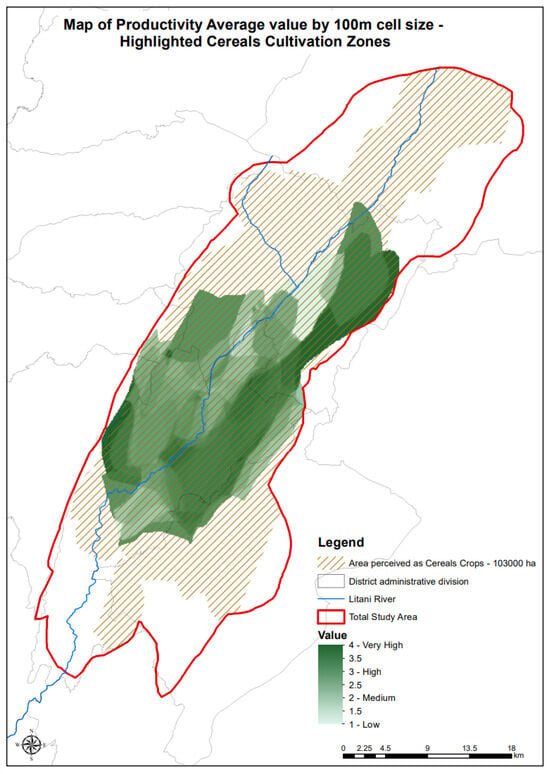
Figure 10.
Map of agricultural productivity.
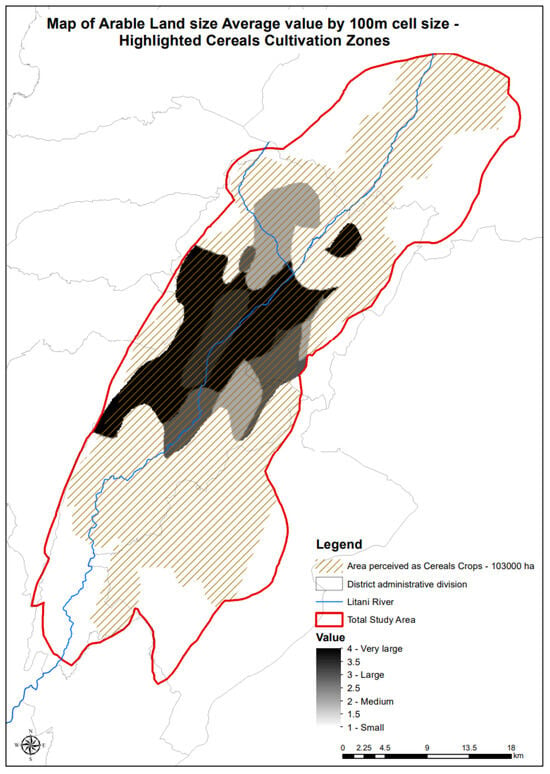
Figure 11.
Map of arable land size.
Soil type was identified as the most important factor influencing agricultural practices, followed by water availability and the type of water resources, soil fertility, landform, water quality, agricultural productivity, and land size in the order shown in Table 1. The resulting maps presented spatial variations in these criteria, offering locally based insights into the region’s agricultural landscape and resource features.

Table 1.
Frequency of appearance and calculated ranks of identified criteria by participants during PBRM Interviews.
The maps in Figure 4, Figure 5, Figure 6, Figure 7, Figure 8, Figure 9, Figure 10 and Figure 11 are presented in order of significance according to the established hierarchy of perceived criteria as identified by farmers.
Figure 4 illustrates the map of soil types within the study area. The mixed soil, represented by dark brown, dominates the central and northern regions, including the Zahlé district (Ferzol, Terbol) and western Bekaa (Aana and Aamiq). Sandy soil, highlighted in yellow, is concentrated in the central and southern regions, as in Marj and Bar Elias. Loamy soils, shown in gray, are scattered throughout the central parts, northeast, and southwest. Given its wide spatial coverage across key cereal-producing areas, mixed soil is the most commonly used type for cereals cultivation in the study area.
Figure 5 illustrates the spatial differentiation in water availability as indicated by community perception. The territory features four levels of water availability, ranging from low to high. Areas with high water availability, shaded in dark blue, are concentrated toward the center of the region, such as parts of Zahlé district, including Ferzol and Terbol, and much of the western Bekaa district, in locations like Joub Janine and Sultan Yaacoub. Intermediate water availability was mostly on the outskirts of the study area, such as Yohmor. Light blue areas in the northwest and southeast of the region mark the lowest water availability. This distribution of water availability significantly impacts cereals farming, as areas with higher water access tend to adopt more stable irrigation systems, leading to improved yield and reduced production risks compared to those relying on rainfed agriculture.
The map providing a detailed view of the different water resources feeding the study area is presented in Figure 6. The detailed labels of water sources provide a clear illustration of where the water is being sourced. Dark blue areas correspond to springs such as Ain El Zebde and Nabaa El Taseh, as well as Qaraoun Lake, which are major water suppliers in the west of the region. Other lighter blue shades indicate a mix of water sources, including various springs (Chamsine spring and local ones), groundwater, and the Litani River, which plays a significant role in almost every region in the study area. These water sources form the backbone of irrigation systems, supporting cereals cultivation in water-scarce zones and contributing to higher productivity in areas close to consistent water flows.
Figure 7 shows the distribution of soil fertility based on community perceptions. Soil fertility is categorized into five levels, from low to high. The dark orange regions indicate areas of high soil fertility, mainly located in the northern and southern parts of the east region. Medium fertility zones, shown in lighter orange, spread throughout the central areas. Areas represented in pale orange, scattered across the study area, have the lowest fertility. Higher soil fertility directly influences cereal crop performance, as more fertile soils contribute to better nutrient availability, thus increasing yields and economic returns.
Figure 8 presents the perceived landform types within cereals cultivation zones. It categorizes the landscape into plains, hills, and a mix of hills and plains. Dark green areas are plains, primarily concentrated in the central portion of the study area. This is surrounded by a lighter green region, presenting the mixed landform, hills and plains, which represents a transitional zone, marking the end of the flat plains and the beginning of increasingly sloped terrain. The olive green areas in the east and west of the map represent the hilly areas, located in the mountainous parts of the study area. Plains offer favorable topography for mechanized cereals cultivation and large-scale production, while hilly zones present physical challenges that may limit machinery use and reduce cultivated area.
Figure 9 illustrates the spatial distribution of water quality across the study area. The areas with the highest water quality are shaded in dark blue. These are predominantly concentrated in the eastern edges of the study area, such as in Anjar, Majdal Anjar, and cover a broad area, mostly spread across the central part of the basin, such as in Aana (Western Bekaa) and Ferzol (Zahlé District). An exception is the core center, which shows a region with the lowest water quality, shown in light blue. There are other areas with the lowest water quality, such as in Marj and Rawda. Water quality is critical in cereals irrigation; poor water quality can harm plant health and soil structure, potentially lowering yields and increasing the cost of maintaining soil productivity.
The map of agricultural productivity (Figure 10) underscores the differences in yield potential across the study area. The shades of green represent various levels of agricultural productivity, ranging from low to very high. The dark green areas, primarily concentrated in the eastern part of the region, represent zones with very high agricultural productivity, such as Terbol. Areas with high productivity, shown in lighter green, are concentrated in the central part, such as in Ghazze and Khiara. Medium productivity zones, marked in an even lighter shade, are scattered across the study area, while the lightest green regions, indicating low productivity, are found mostly along the northern and southern edges of the central zone. These variations in productivity reflect underlying differences in water access, soil fertility, and landform—key factors shaping cereals farming success and regional disparities in yield and profitability.
Figure 11 depicts the size of arable land across the study area, divided into four categories from small to very large. The darkest gray regions in the core of the center represent the large plots of arable land, surrounded by regions of the darkest degree, representing the very large lands. The lighter gray zones, which are spread more toward the eastern and northern edges of the region, indicate smaller land sizes.
4. Discussion
The identification of wheat, barley, and corn as the dominant cereal crops cultivated in the region aligns with broader agricultural trends observed in the Bekaa Valley, where cereal farming plays a central role in local livelihoods and food security [33,34]. Among the three, wheat was consistently reported as the most widely cultivated crop, which can be attributed to its adaptability to both rainfed and irrigated conditions, relatively stable market demand, and cultural importance as a staple food [6]. The higher cultivation of wheat may also reflect policy support or seed availability that favors its production over other cereals.
The PBRM results, spanning 93% of the Bekaa Valley (Figure 3), provide a spatial understanding of key environmental factors and features of agricultural resources influencing cereals farming as perceived by local inhabitants. Within this region, approximately 1030 km2 (74% of the area covered by the PBRMs) were identified as suitable for cereals cultivation based on local perceptions, with indications that the cultivated area could be further extended under improved conditions. The central part, which is the core of the study area, is characterized by high water availability, which is a significant advantage for irrigated cereal production. However, challenges persist related to lower water quality in this region. The river has been recently subjected to several aspects of water quality deterioration, as reported by Haidar et al. [35]. The soil composition is quite diverse, with the predominance of mixed soil, while sandy and loamy soils are also present. These soil types play a vital role in determining which cereal varieties can be cultivated, with mixed soils generally offering better support for wheat and barley, while sandy soils may be less suitable without additional inputs. The region features medium fertility levels, supporting moderate cereal yields. The plains in this area provide ample opportunities for mechanized cereals farming, and the large plots of arable land contribute to the region’s capacity for sustainable cereals output. This is further emphasized by the high agricultural productivity levels in the study area. The northern region, covering the Baalbek district and extending until the national borders, shows strong potential for agriculture, especially due to its high water quality. The soils here are primarily mixed, with generally high fertility levels that promote robust cereal crop growth. Agricultural productivity is favorable, and the land offers a mix of flat plains and smaller arable plots, which are well-suited for diversified cereals cultivation practices, including both mechanized and manual farming. Overall, the northern region provides a good balance of fertile land and sufficient water resources, which together support high cereals output, especially for rainfed wheat and barley. The southern part, extending from Qaraoun town to the southern tip of the red outline (Figure 4), exhibits moderate water availability but benefits from relatively better water quality than the central area. The soils here are predominantly sandy, with scattered loamy soils, and fertility levels are generally high, supporting promising cereals productivity, particularly where water management is well-practiced. The landscape is characterized by plains that are suitable for mechanized cereals farming, and the large arable plots enhance the region’s capacity for cereals cultivation. The potential for high cereal yields is further supported by the productivity levels mapped across this region. The western region, representing the western foothills of the Mount Lebanon range, benefits from relatively high water availability from springs and groundwater sources. The soils in this region are a mix of loamy and other types, with moderate fertility levels that support cereal crops such as barley and durum wheat. Agricultural productivity varies but is generally moderate to high, although the smaller arable plots in this region are the result of the hilly terrain. The eastern region stretches toward the Anti-Lebanon Mountains and, perhaps closer to the Syrian border, is defined by its mix of hills and plains. It stands out for its very high agricultural productivity, supported by good water availability from springs. While water quality is moderate, the fertile mixed soils and productive plains create favorable conditions for cereals farming. Despite some challenges with water quality, the region’s overall agricultural potential is strong, making it an important cereal-growing area in the Bekaa Valley.
The perception of farmers in the study area was based on their knowledge of local conditions. As illustrated by the perception maps of water index (Figure 6, Figure 7, and Figure 10), various water resources were present, and interviews revealed that water quality ranges from medium to poor across most of the study area. However, water availability varies significantly within the Bekaa Valley. This aligns with previous findings, as the Litani River Basin (LRB) faces increasing water scarcity. The annual renewable water resources stand at 606.9 mm3/year, with water availability per capita dropping to around 808 m3/cap/year due to a population surge, particularly following the Syrian refugee crisis. The basin is increasingly stressed by challenges such as climate change, groundwater over-exploitation, and inter-basin transfers [33,34,35,36,37]. These constraints pose serious risks to long-term cereals production, especially for crops highly dependent on irrigation during key growth stages. Improved governance and the implementation of sustainable practices, such as effluent treatment and water-use efficiency in cereals irrigation, are crucial to restoring the water quality and ensuring a continuous supply.
Regarding soil fertility (Figure 8), the region is recognized as highly fertile, as noted by the FAO [38]. National Center for Remote Sensing (CNRS) maps visualizing soil vulnerability to desertification indicate that areas less prone to desertification tend to have higher soil fertility, supporting better vegetation growth. Farmers’ perceptions of soil fertility are consistent with the CNRS soil vulnerability map [39]. For cereals farming, this confirms the regional advantage in maintaining grain output, particularly for land under stress from water scarcity. The land productivity perception map (Figure 11) shows that the region does not exhibit uniformly high productivity, as perceived by participants. This contrasts with the existing literature, which identifies the area as one of the most productive cereal-producing regions in Lebanon [40]. While the region may be highly productive in absolute terms, farmers’ perceptions are shaped by local challenges, such as water scarcity, market access limitations, or increasing input costs. Additionally, perceptions reflect recent lived experiences rather than averaged historical data, capturing nuances that production figures alone might miss. This highlights the value of integrating perception-based mapping in agricultural studies, as it provides a ground-level understanding of productivity that may reveal localized constraints or shifts not yet reflected in official data. Additionally, the landform perception map (Figure 9) aligns with previous studies such as the landform map provided by the National Council for Scientific Research, and CNRS [39], reinforcing the relationship between topography and cereals cultivation. The map of arable land size (Figure 11) shows that most of the land is considered as very large arable land, in agreement with [40]. This supports the region’s capacity for extensive cereals farming systems, especially in the central valley, where mechanization is feasible and economically viable.
The maps generated through the PBRM approach are not merely visual outputs; they serve as critical strategic tools for guiding evidence-based agricultural planning and interventions. For example, if a particular area is mapped as having low soil fertility, this information can inform targeted strategies by local or international agencies to distribute appropriate fertilizers or promote soil restoration practices. Similarly, areas with poor water quality or limited water availability can be prioritized for irrigation infrastructure or the introduction of drought-tolerant cereal varieties. By translating farmer perceptions into actionable maps, the study enhances planning capacity to sustain and improve cereals production in the Bekaa Valley.
5. Conclusions
This study aimed to contribute to a better understanding of the natural sources territory in the Bekaa Valley, an important cereal-producing agricultural area in Lebanon, as perceived by local farmers. The study employed Perception-Based Regional Mapping (PBRM) to document and spatialize community perceptions of natural resource features in the surrounding territory.
This tool, applied herein for the first time in Lebanon, proved particularly useful in highlighting key spatial variations in agricultural and natural resource conditions relevant to cereals production in the Bekaa valley. It allowed the spatial mapping of units displaying local specific description and identification of factors such as soil type, water availability, type of water resources, soil fertility, landform, water quality, agricultural productivity, and area of arable land, all of which were ranked by local farmers as the most crucial in influencing cereals crop performance, particularly wheat and barley.
The results show that the central part of the study area, including Bar Elias, Marj, and adjacent locations, is perceived to have high water availability yet suffers from poor water quality. In contrast, the northern areas around Baalbek and Saideh were identified as zones with fertile soils and better water quality, supporting high productivity. The southern part, stretching from Qaraoun to the study area’s southern boundary, was marked by moderate water availability but relatively better water quality. Meanwhile, the western foothills of Mount Lebanon were seen as moderately productive due to smaller landholdings and hilly terrain, while the eastern areas toward the Anti-Lebanon Mountains stood out for their high agricultural potential, driven by fertile soils and sufficient water resources.
Importantly, these findings reflect the accumulated experience of local communities and emphasize the value of integrating their perceptions into agricultural planning and policy-making. The spatial information generated through the PBRM maps serves as a practical, community-informed tool to identify disparities and target interventions more effectively. These insights are especially relevant to designing tailored and equitable programs that support the diversity of cereals farming systems across the Bekaa.
In parallel, the analysis of farmer-reported data confirmed that wheat, barley, and corn are the main cereal crops cultivated in the region, with wheat being the most dominant. Yield patterns varied significantly, averaging 0.65 tons per dunum for wheat, 0.5 for barley, and 3 for corn. These results reinforce the importance of supporting wheat production while addressing the productivity gaps and economic challenges associated with other cereals.
Given the ongoing challenges and recent conflict in the region, replicating such an assessment in the near future could help capture changes in local perceptions, improve the targeting of recovery strategies, and contribute to more resilient and inclusive agricultural development efforts.
Author Contributions
Conceptualization, S.B., L.C. and M.S.; methodology, S.B., L.C., J.B. and M.S.; investigation, F.M.F. and R.K.; data curation, F.M.F. and R.K.; formal analysis, F.M.F., L.C., M.S. and R.K.; software, M.S.; validation, S.B., L.C. and M.S.; visualization, R.K.; writing—original draft preparation, F.M.F.; writing—review and editing, S.B., L.C. and M.S.; supervision, S.B., L.C. and M.S.; project administration, S.B., L.C. and M.S.; funding acquisition, M.S. All authors have read and agreed to the published version of the manuscript.
Funding
This research was funded by the French CNRS under the call “Frugality–Sobriety” of the CNRS-funded “Mission pour les Initiatives Transverses et Interdisciplinaires” (MITI) through the joint project ALLARMA “Agriculture in the Upper Litani Basin, Lebanon: Addressing the Resilience of the Agricultural World” along with the Lebanese DRI. The APC was funded through the same project.
Data Availability Statement
Anonymized datasets can be made available upon reasonable request from the corresponding author.
Acknowledgments
The authors would like to thank the Head of Agriculture, Beqaa Division, Lebanese Ministry of Agriculture (Khalil Akel), for providing access to the farmers’ database, which was essential for identifying and reaching out to participants. Gratitude is also extended to the Chamber of Commerce, Industry, and Agriculture in Zahlé and the Bekaa—CCIAZ (Eng. Said Gedeon) for facilitating access to farmer contacts. Sincere appreciation is extended to the local municipalities and community-based organizations for their assistance during fieldwork. Special thanks are also extended to the President of the Wheat Farmers’ Union (Najeeb Faress) for his support and guidance in reaching the farming community. We are grateful to the farmers in the Western and Central Bekaa regions for their valuable time and insights during the interviews. We also acknowledge the MITI Program of the French CNRS (Centre National de la Recherche Scientifique) and its call “Frugality & Sobriety” providing the funds for our project ALLARMA (“Agriculture dans le bassin supérieur du Litani, au Liban: Aborder les Résiliences du Monde Agricole”) and the Franco-Lebanese Program O-Life (Observatoire Libano-Français pour l’Environnement) for providing the spatial data that contributed to the development of the maps used in this study. This article is a revised and expanded version of a paper [41], which was presented at at IFSA 06/2024, Trapani, Italy, 30 June–4 July 2024.
Conflicts of Interest
The authors declare no conflicts of interest.
Abbreviations
The following abbreviations are used in this manuscript:
| CNRS | National Center for Remote Sensing |
| FAO | Food and Agriculture Organization |
| IDAL | Investment Development Authority of Lebanon |
| IWMI | International Water Management Institute |
| LARI | Lebanese Agricultural Research Center |
| LRB | Litani River Basin |
| MOA | Ministry of Agriculture |
| MOE | Ministry of Environment |
| PBRM | Perception-Based Regional Mapping |
| QGIS | Quantum Geographic Information System |
| ULB | Upper Litani Basin |
References
- Ministry of Agriculture. General Results of the Comprehensive Agricultural Census 2010; MoA: Beirut, Lebanon, 2010. [Google Scholar]
- Joelle, B. Assessment of the Status of Plant Genetic Resources for Food and Agriculture (PGRFA) in Lebanon; FAO: Rome, Italy, 2013. [Google Scholar]
- Karim, M. Wheat: An Indispensable Lebanese Food Heritage. BerytechBeat. 2022. Available online: https://berytech.org/wheat-an-indispensable-lebanese-food-heritage (accessed on 6 August 2025).
- FAO. FAO Cereal Supply and Demand Brief; Food and Agriculture Organization of the United Nations: Rome, Italy, 2023. [Google Scholar]
- Alfred, K.; Azour, J.; Selassie, A.A.; Goldfajn, I.; Rhee, C.Y. How War in Ukraine Is Reverberating Across World’s Regions; International Monetary Fund: Washington, DC, USA, 2022. [Google Scholar]
- Hussein el Hage, H.; Abdulrahim, I.; Hassan, S.H.; Faour, G. Le blé dans la Plaine de la Bekaa. Analyse Géographique de Cette Culture à L’aide d’un Système d’Information Géographique; Hannon. Revue Libanaise de Géographie XXVI; ⟨hal-02963099⟩; HAL Open Science: Paris, France, 2013; p. 114. [Google Scholar]
- OCHA. Bekaa Governorate Profile; Reliefweb OCHA: Beirut, Lebanon, 2014. [Google Scholar]
- Ali, N.; Baghdadi, N.; Mhawej, M.; Faour, G. A Novel Approach for Mapping Wheat Areas Using High Resolution Sentinel-2 Images. Sensors 2018, 18, 2089. [Google Scholar] [CrossRef] [PubMed]
- LARI. Early Warning System in the Beqaa Valley, Lebanon; Lebanese Agricultural Research Institute (LARI): Tal Amara, Lebanon, 2016. [Google Scholar]
- Riwa, D. The Lebanese Wheat Market: A Lay of the Land; Blominvest Bank: Beirut, Lebanon, 2016. [Google Scholar]
- Fadi, K.; Kabalan, R.; Breidi, J.; Rouphael, Y.; Oweis, T. Yield and Water Production Functions of Two Durum Wheat Cultivars Grown under Different Irrigation and Nitrogen Regimes. Agric. Water Manag. 2009, 96, 603–615. [Google Scholar] [CrossRef]
- Tawk, S.T.; Chedid, M.; Hamadeh, S.; Chalak, A. Challenges and Sustainability of Wheat Production in a Levantine Breadbasket: The Case of the West Bekaa, Lebanon. J. Agric. Food Syst. Community Dev. 2019, 8, 193–209. [Google Scholar] [CrossRef]
- Ministry of Environment (MoE); UNDP. Climate Change Vulnerability and Adaptation. Lebanon’s Second National Communication; MoE/UNDP: Beirut, Lebanon, 2011. [Google Scholar]
- Manzoor, Q.; Sharma, B.; Choukr-Allah, R.; Bruggeman, A. Non-Conventional Water Resources and Opportunities for Water Augmentation to Achieve Food Security in Water Scarce Countries. Agric. Water Manag. 2007, 87, 2–22. [Google Scholar] [CrossRef]
- Ali, N.; Crop Mapping and Yield Estimation of Wheat in the Bekaa Plain of Lebanon. Pastel HAL Sciences. 2019. Available online: https://pastel.hal.science/tel-02520013/ (accessed on 11 August 2025).
- Bank, T.W. Lebanon: Poverty More than Triples over the Last Decade Reaching 44% Under a Protracted Crisis; World Bank Group: Washington, DC, USA, 2022. [Google Scholar]
- Ministry of Agriculture (MoA) and FAO. Ministry of Agriculture Strategy (2015–2019); MoA & FAO: Beirut, Lebanon, 2014. [Google Scholar]
- Ministry of Agriculture (MoA) and FAO. Ministry of Agriculture Strategy (2020–2025); MoA & FAO: Beirut, Lebanon, 2020. [Google Scholar]
- Leeuw, D.; Desiree, E.; Hox, J.; Dillman, D. International Handbook of Survey Methodology. European Association of Methodology; Routledge: Oxfordshire, UK, 2008; Available online: https://api.taylorfrancis.com/content/books/mono/download?identifierName=doi&identifierValue=10.4324/9780203843123&type=googlepdf (accessed on 11 August 2025).
- Jennifer, H.; Rocker, S.; Phillips, H.; Heins, B.; Smith, A.; Delate, K. The Importance of Social Support and Communities of Practice: Farmer Perceptions of the Challenges and Opportunities of Integrated Crop–Livestock Systems on Organically Managed Farms in the Northern U.S. Sustainability 2018, 10, 4606. [Google Scholar] [CrossRef]
- Duong, T.T.; Brewer, T.; Luck, J.; Zander, K. A Global Review of Farmers’ Perceptions of Agricultural Risks and Risk Management Strategies. Agriculture 2019, 9, 10. [Google Scholar] [CrossRef]
- Mehdi, S.; Hamrita, A.; Maestripieri, N.; Boussetta, A.; Rejeb, H.; Olmo, R.M.; Kassouk, Z.; Belem, M.; Saenz, M.; Mouri, H. Not Seen, Not Considered: Mapping Local Perception of Environmental Risks in the Plain of Mornag and Jebel Ressass (Tunisia). Euro-Mediterr. J. Environ. Integr. 2020, 5, 30. [Google Scholar] [CrossRef]
- Robert, C. Participatory Mapping and Geographic Information Systems: Whose Map? Who is Empowered and Who Disempowered? Who Gains and Who Loses? Electron. J. Inf. Syst. Dev. Ctries. 2006, 25, 1–11. [Google Scholar] [CrossRef]
- Logan, C.; Jon, C. Participatory Mapping. In Handbook of Communication for Development and Social Change; Servaes, J., Ed.; Springer: Singapore, 2020; pp. 705–713. [Google Scholar] [CrossRef]
- Melinda, L.; Matthew, L.; Jamie, H.; Allegretti, A.M. Questioning the practice of participation: Critical reflections on participatory mapping as a research tool. Appl. Geogr. 2023, 152, 102900. Available online: https://www.sciencedirect.com/science/article/pii/S0143622823000310 (accessed on 11 August 2025). [CrossRef]
- Moore, L.V.; Roux, A.V.D.; Brines, S. Comparing Perception-Based and Geographic Information System (GIS)-Based Characterizations of the Local Food Environment. J. Urban Health 2008, 85, 206–216. [Google Scholar] [CrossRef] [PubMed]
- McCarthy, N.; Dutilly-Diané, C.; Drabo, B. Cooperation, Collective Action and Natural Resources Management in Burkina Faso. Agric. Syst. 2004, 82, 233–255. [Google Scholar] [CrossRef]
- Saqalli, M.; Gérard, B.; Defourny, P.; Bielders, C. Targeting Rural Development Interventions: Empirical Agent-Based Modeling in Nigerien Villages. Agric. Syst. 2011, 104, 354–364. [Google Scholar] [CrossRef]
- Saqalli, M.; Jourdren, M.; Maestripieri, N.; Guillerme, S.; Maire, E.; Soulileuth, B.; Latsachach, K.; Sounyafong, P.; Tammahuxsa, L.; Sengtaheuanghoung, O.; et al. Backward Waters, Modern Waters: Perception-Based Regional Mapping Territory Uses and Water-Related Sanitary Stakes in Luang Phabang Area (Lao PDR). Appl. Geogr. 2015, 60, 184–193. [Google Scholar] [CrossRef]
- Saqalli, M.; Cifuentes, C.R.; Maire, E.; Alves, M.J.d.S.; Santo, R.C.; Kaced, D.; Gaudou, B.; Fiamor, A.-E. Resource Flows, Uses and Populations Territorial Attachments: The Case of the Oyapock Watershed (French Guiana, Amapá State of Brazil). Land 2023, 12, 991. [Google Scholar] [CrossRef]
- IWMI. Groundwater Governance in Lebanon: The Case of Central Beqaa; International Water Management Institute (IWMI): Colombo, Sri Lanka, 2017. [Google Scholar]
- Saqalli, M.; Caron, P.; Defourny, P.; Issaka, A. The PBRM (Perception-Based Regional Mapping): A Spatial Method to Support Regional Development Initiatives. Appl. Geogr. 2009, 29, 358–370. [Google Scholar] [CrossRef]
- FAO; IHE Delft. Water Accounting in the Litani River Basin–Remote Sensing for Water Productivity; Water Accounting Series; FAO: Rome, Italy, 2019. [Google Scholar]
- Talal, D.; Atallah, T.; Jomaa, I. Sustainable Land and Water Resources Management in the Bekaa Valley; Lebanese Agricultural Research Institute (LARI): Tal Amara, Lebanon, 2021. [Google Scholar]
- Chaden, H. Évaluation de la Qualité de l’Eau du Bassin Supérieur de la Rivière du Litani, Liban: Approche Hydro-Géochimique. Ph.D. Thesis, Université de Lorraine, Nancy, France, 2014. Available online: https://www.academia.edu/download/76255809/document.pdf (accessed on 11 August 2025).
- Nadim, F.; Shaban, A.; Amine, Y. Assessment of the Sustainability of Water Resources in the Litani River Basin. In The Litani River, Lebanon: An Assessment and Current Challenges; Springer: Berlin/Heidelberg, Germany, 2018; pp. 121–145. [Google Scholar] [CrossRef]
- Darwish, T.; Shaban, A.; Masih, I.; Jaafar, H.; Jomaa, I.; Simaika, J.P. Sustaining the Ecological Functions of the Litani River Basin, Lebanon. Int. J. River Basin Manag. 2023, 21, 37–51. [Google Scholar] [CrossRef]
- FAO. Lebanon and FAO; Food and Agriculture Organization of the United Nations: Rome, Italy, 2021. [Google Scholar]
- Talal, D.; Zdruli, P.; Saliba, R.; Awad, M.; Shaban, A.; Faour, G. Vulnerability to Desertification in Lebanon Based on Geo-Information and Socioeconomic Conditions. J. Environ. Sci. Eng. B 2012, 1, 851–864. [Google Scholar]
- Amin, S.; Hamze, M. The Litani River, Lebanon: An Assessment and Current Challenges. In Water Science and Technology Library; Springer: Berlin/Heidelberg, Germany, 2018. [Google Scholar] [CrossRef]
- Baydoun, S.; Fawaz, F.; Khalil, R.; Bechara, J.; Heredia, M.; Bijon, V.; Chalak, L.; Saqalli, M. Mapping and Analysis of Upper-Litani Farmers’ Perception of Challenges and Opportunities: Evidence from Bekaa Valley, Lebanon. In Proceedings of the IFSA 06/2024, IFSA 06/2024, Trapani, Italy, 30 June–4 July 2024. [Google Scholar]
Disclaimer/Publisher’s Note: The statements, opinions and data contained in all publications are solely those of the individual author(s) and contributor(s) and not of MDPI and/or the editor(s). MDPI and/or the editor(s) disclaim responsibility for any injury to people or property resulting from any ideas, methods, instructions or products referred to in the content. |
© 2025 by the authors. Licensee MDPI, Basel, Switzerland. This article is an open access article distributed under the terms and conditions of the Creative Commons Attribution (CC BY) license (https://creativecommons.org/licenses/by/4.0/).