Abstract
The process of regional economic integration and convergence among different regions in Guangdong Province has been implemented for three decades. Whether the difference in regional economy is reduced in Guangdong is a concern. This research adopts the beta-convergence analysis for the border effect to investigate this issue. The analyses are based on NPP-VIIRS nighttime light data in East, West, and North Guangdong and the Pearl River Delta. The results showed that border effects between cities inside East Guangdong and West Guangdong, between West Guangdong and the PRD, and between North Guangdong and the PRD are enlarging. Decreasing regional differences only occur in some city borders inside North Guangdong and between East Guangdong and the PRD. However, for town-level units along city borders, diminishing border effects are found between cities in and around the PRD in these units. Industrial synergy provides partial explanations for the observed trends of economic convergence. These trends hold crucial theoretical and practical significance for discussing strategies to reduce income disparities among different cities and achieve the coordinated development of multiple economic centres within urban agglomerations.
1. Introduction
1.1. Background
The crucial role of urban agglomerations in economic development has been theoretically supported through frameworks on industrial spatial clustering, such as New Economic Geography, Endogenous Growth Theory, and Marshallian Externalities. In recent years, when developing nations establish their industrial structures, they prioritise creating specialised industrial hubs in regions with sufficient resources (e.g., labour force, land, and capital). Then, they leverage these centres to catalyse regional development and ultimately form economic corridors or urban agglomerations. Examples of these regions include the southeastern region around Ho Chi Minh City in Vietnam, the economic zone around Bengaluru in India, and the Java Golden Economic Belt around Jakarta–Bandung–Surabaya in Indonesia. These regions demonstrate urban agglomeration patterns aligned with industrial clustering principles. After establishing such economic cores, the critical policy challenge shifts toward fostering broader regional economic integration, which now becomes a high priority for national development strategies.
China has paid close attention to the economic integration in urban agglomerations and neighbouring regions, with the aim of narrowing the economic gaps among well-developed cities and their neighbours. National and provincial policies include economic convergence as an important part of economic integration. Economic integration often includes economic convergence in Chinese studies. However, the measurement of inter-city economic integration is still debated.
Guangdong Province, as a province with a large economic scale in China, ranked first in GDP among all provincial-level administrative units in 2021. This performance is led by the Pearl River Delta (PRD) urban agglomeration. However, the unbalanced development in East, West, and North Guangdong has attracted extensive attention from the provincial government for a long time. In the last century, the eighth Five-Year Plan for National Economic and Social Development in Guangdong Province announced the policy to develop the three regions. In the 10th Five-Year Plan, the regional coordinated development policy was pronounced, including the transfer of resource-processing industries and labour-intensive industries from the PRD to East, West, and North Guangdong. When the concept of the Pan-Pearl River Delta appears, the regional coordination emphasises the interaction between the PRD and East, West, and North Guangdong and industrial gradient specialisation. Two coastal economic zones in East and West Guangdong and one ecological economic zone in North Guangdong will be developed. The government attempted to avoid an economic structure in which East, West, and North Guangdong solely provide labour force to the PRD and rely on it for economic support. The 13th Five-Year Plan promoted that cities around the PRD, that is, Yangjiang, Yunfu, Qingyuan, Shaoguan, Heyuan, and Shanwei, will be initially economically integrated into the region. Transportation and industry connections will be built between these cities and neighbour PRD cities. The coordinated development for all cities in the province will be advanced sequentially. The policy of regional coordinated development also refers to the infrastructure construction in Hong Kong and Macau [1,2]. Although this policy does not change, the government implements this policy through the construction of local infrastructures and the industry transfer to the city-to-city integration targets for each city around the PRD. The changes in the detailed plans also reflect transitions in development stages over the past three decades.
The discussions regarding the results from regional coordinated development over 30 years usually focus on economic development. The proportion of GDP for each region is listed in Table 1. The increasing proportion of GDP in the PRD has stopped since 2005 and has not reversed to date. The economic scales of East, West, and North Guangdong still apparently fall behind that of the PRD (Figure 1). The proportion of GDP is not the only evidence. Zeng et al. [3] estimated the Theil Index based on GDP per capita in each city. They concluded that the inequality among the four regions contributed the most to the inequality among all cities in Guangdong. Huang and Yang [4] analysed the panel data of 88 county-level cities and municipal districts in the period of 2002–2013. They suggested that the policy of industry transfer has improved the unbalanced development in the regional economy from the perspective of GDP per capita. Bai et al. [5] investigated the spatial correlation in the county-level GDP per capita for all the county units in Guangdong in the period of 1998–2016. They found that the economic growth rate in West and North Guangdong increased relatively, which reduced the gaps among different county units. Although the abovementioned research only considered GDP per capita as the standard, diversified analysis methods and different scales still result in inconsistent opinions on whether the regional coordinated development is achieved in Guangdong.

Table 1.
Proportions in GDP for each region in Guangdong Province. (Source: Guangdong Statistical Yearbook: National Accounts).
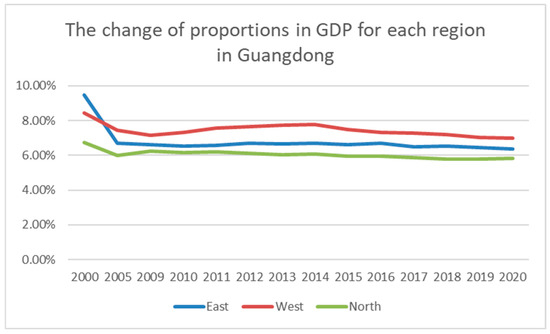
Figure 1.
Temporal change in the proportions of GDP for each region in Guangdong.
This research pays attention to the town-level units, with the nighttime light data in the built-up area in Guangdong being the representative variable for economic development. Then, it focuses on the nighttime light data in East, West, and North Guangdong and estimates the border effect between adjacent prefectural-level cities. This research also estimates the border effect between cities in the PRD and adjacent cities outside it to test whether the surrounding cities have diminished their difference in economic development from adjacent PRD cities. Analyses for the border effect are adopted, including the expansion version for panel data regression.
The following subsection introduces the background and applications of several analysis methods for the border effect. The second section demonstrates the analysis method and research dataset for the nighttime light data used in this research. Detailed analysis results are provided in the third section, with the discussion of border effects within East, West, and North Guangdong and between cities in and outside the PRD. Geographical, transportation, and industrial factors are discussed to explain the border effect in the fourth section, with the description of several metropolitan areas or urban agglomerations in other countries. The methodology and findings in this study are compared with existing studies in those foreign regions, which suggests that this study can be applied to international cases. The conclusion is structured in two subsections: the first subsection summarises whether the regional divergence in Guangdong has improved, with some suggestions for East, West, and North Guangdong; the second subsection addresses the limitations of this study.
1.2. Literature Review
The discussion of urban agglomeration should start from three theories, namely, New Economic Geography, Endogenous Growth Theory, and Marshallian Externalities. Marshallian Externalities [6] posited that firms in related industries can achieve knowledge spillovers through agglomeration. This agglomeration leverages technological diffusion, specialised labour markets, and professionalised services to generate positive externalities for economic agents. This situation reduces costs or enhances efficiency. His theory established a robust theoretical framework for industrial cluster formation and laid the foundation for subsequent developments in New Economic Geography and Endogenous Growth Theory. Krugman’s [7] New Economic Geography framework emphasises how increasing returns to scale and reduced transportation costs trigger inter-regional labour mobility. This situation leads to spatial agglomeration of economic activities, particularly the manufacturing activities, which ultimately shapes a core–periphery spatial-economic configuration. Endogenous Growth Theory [8,9] states that, when propelled by appropriate policy frameworks and social environments, knowledge, innovation, and human capital can serve as endogenous drivers of technological advancement. This process fosters sustained economic growth. When coupled with increasing returns to scale, it also generates persistent and significant interregional growth disparities. In other words, regional economic inequalities do not spontaneously diminish.
The border effect is adopted to investigate the inter-city integration inside or around the urban agglomeration. The measure of the border effect is generally based on three theories. The first is the gravity model, which explains the relationship among the trade volumes, the sizes of economies, and the geographical distances between two economies. The administrative border is treated as an additional virtual distance in this model. A large estimated virtual distance indicates a strong border effect. Tinbergen [10] initially demonstrated that the trade volume between two countries is proportional to their economic size, but it is inversely proportional to their spatial distance. The author then built the gravity model to predict the international trade volume. Based on this theory, McCallum [11] formally started the research on the border effect in international trade and measured the trade border between the U.S. and Canada in 1988. McCallum’s research methodology is extended in the quantitative analyses by other scholars. Wei [12] adopted the production function as the evaluation method when the trade volume data are inadequate. Balistreri et al. [13] further adjusted the trade gravity model based on the analysis of the difference in economic size between two countries and multiple factors hindering the U.S.–Canada trade [14]. Coughlin et al. [15] estimated the border effect among different states in the U.S., which was even greater than the border effect in international trade.
The second theory is from the Law of One Price in economics. When the impact of the exchange rate is already considered, the price difference in a special type of goods in two markets should not exceed the transportation cost between the two locations. If the price difference exceeds the transportation cost, then the border effect is detected between two markets [16]. Engel [17] initially studied the trade border between the U.S. and Canada based on the Consumer Price Index. The author also transferred the border effect as the equivalent geographical distance for transportation. Parsley et al. [18] followed the thought of Engel’s work and estimated the extra transportation distance to hold the Law of One Price, if the trade border did not exist in the trade between the U.S. and Japan. Gorodnichenko et al. [19] not only considered the trade cost within each market and the fixed trade cost for each of the goods but also controlled the heterogeneity in the price distributions between different markets. Thus, these authors provided a more accurate estimation of the border distance between the U.S. and Canada caused by the border effect. Subsequent research highlights that some treatments would incur the overestimation of the border effect. Examples of these treatments include taking the geographical distance between two capitals in two economies as the actual transportation distance, recording the observed price differences as the trade cost, or ignoring the difference in the actual composition of goods in different Consumer Price Indices. These improper treatments would lead to the paradox of the Law of One Price [20,21,22].
The third theory is the convergence analysis theory based on beta-convergence. This theory suggests that any economy has a high-speed developing phase and a stable phase in the development process. For each economy within a specific period, the speed of development is proportional to the distance between the initial status and the stable status. In other words, if Economy A has a lower starting point than Economy B and if they have the same stable status, then A will have a higher speed of development than B. Li and Xu [23] adopted the beta-convergence approach to investigate the province border effect in the urban agglomeration of the Yangtze River Delta during the economic convergence process in the 1990s. The border effects between Shanghai and Jiangsu and between Jiangsu and Zhejiang were found to be decreasing, while the effect between Shanghai and Zhejiang was increasing. Lall and Yilmaz [24] found that, in the process of conditional beta-convergence, if the time effect and the regional effect are defined as dummy variables, then the investment in public capital and human capital would not affect the speed of convergence significantly. However, the spatial lag effect of human capital would influence the convergence process. Yao et al. [25] applied the beta-convergence approach and proved that the high-speed railway network not only promoted the regional economic development in China but also stimulated the economy in the underdeveloped regions. Thus, the high-speed railway can play a positive role in regional integration.
Nighttime light (NTL) data can be used as a proper measurement of the local social and economic activity level. These data are positively correlated with the municipal GDP, population, and size of the urban built-up area [26]. Then, the NTL data can be applied to evaluate the spatial structure and the hierarchical structure of the urban system [27], the urbanisation level of land use [28], and the development level of digital economy [29]. Previous research on the NTL in Guangdong focuses on the PRD region. Zhang et al. [30] discussed the expansion speed of construction land and urbanisation. Li et al. [31] investigated the high-speed development in the border region between the prefectural-level cities in the PRD region. Wang et al. [32] found that the convergence trend of the urbanisation rates in the urban agglomeration of the PRD was stronger than those in the urban agglomerations of the Yangtze River Delta and Jing–Jin–Ji regions. The inflows and outflows of population even enhanced this convergence trend.
For the application of border effects in regional economic integration, Xu et al. [33] summarised four hypotheses causing the regional economic difference in China: production, economic structure, geographical location, and institutional factors [7,34,35]. The discussion of border effects in the regional economy in Guangdong will also be based on these hypotheses, as supported by the following literature. The influence of industrial structure, especially the intercity industrial synergy in adjacent cities, has attracted the attention of several scholars in studies on intercity economic connections [36,37]. The industrial synergy can promote the intercity cooperation in different industries [38], such as the collaboration in production factors [37], the redistribution of scarce resources [39], and the regional integration for job positions in nearby cities [40]. The industrial synergy can realise a win–win situation among cities [39] and promote the process of regional economic convergence [41,42,43].
For the abovementioned studies on border effects or economic integration in urban agglomerations based on NTL, most of them focus on either macroscopic description across large regions [26,27,29] or the spillover effects of monocentric urban agglomerations on surrounding areas [30,31,32]. At present, many countries plan to establish multiple new secondary centres around existing monocentric urban agglomerations and form broader economic zones. Research on this area is relatively scarce. Guangdong Province, which has already established the PRD urban agglomeration, continuously strives to build new development centres in East, West, and North Guangdong. The government tends to form a large integrated economic zone surrounding the PRD. This study helps expand the research perspectives on how urban agglomerations can further expand using NTL data and considering border effects.
2. Materials and Methods
The beta-convergence analysis is adopted in this study. Beta-convergence describes a phenomenon in which the economic growth speed of an economy is proportional to the difference between the initial status and the future stable status. If all the economies in a region are assumed to have a similar stable status, then they will converge to this stable status at different speeds, which realises the regional economic convergence. This case is called the absolute beta-convergence. If several stable statuses are observed, which depend on the industry structures and other economic conditions, then the economies will converge to different stable levels. This case is called the conditional beta-convergence. Beta-convergence is the classical framework in the convergence analysis [44]. The Barro regression equation is usually adopted to measure conditional beta-convergence [45,46], which is expressed as follows:
gi,t,t+T is the average growth rate of a certain indicator for the target economy i in the period of [t, t + T]. This indicator can be the GDP level or the NTL level in this research. If the NTL level is adopted as the indicator, then yi,t becomes the initial NTL level at time t. αi is the constant term. εi is the error term.
Xu and Li [47] validated that the prefectural-level cities in China have absolute beta-convergence in GDP per capita. In general cases, βi < 0 holds. This research also assumes that the average growth rate of the NTL in different economies is inversely proportional to the initial status. Here, all the economies are assumed to have similar economic conditions in the studied region and thus have similar stable statuses.
The abovementioned Barro regression model can be extended to two versions. The first version is for the comparison between every two economies. All the economies are assumed to have the same stable status, that is, absolute beta-convergence, or conditional beta-convergence in cases where the studied region is small and all economies have the same conditions. For any economy A and B in this region, we have
A dummy variable BORDER is introduced to represent the border effect between two different areas. In this study, each investigated economy is a town or a street district. A town in a county-level city and a street district in a prefectural-level city are at the same administrative level. In the following text, they will be called towns or town-level units. The border effect is from two different prefectural-level cities. If two towns are located in the same prefectural-level city, then BORDER = 0; otherwise, BORDER = 1. The abovementioned model then becomes
The second version takes the growth rate in each year as a panel data. Dummy variables standing for the regions, years, and cities are included. Here, the variables for years and cities are fixed effect terms. This formula can analyse the regional difference among several regions or cities. The Barro regression model then becomes
REGION, YEAR, and CITY are dummy variables. When a town locates in the mth region, REGIONm = 1; otherwise, REGIONm = 0. INDUSTRY contains two variables: the share of secondary industry in GDP and the share of tertiary industry in GDP. The two variables illustrate the basic industrial structure in each administrative district. For all towns in the same administrative district, the values of INDUSTRY are the same.
The NTL data are based on the NPP-VIIRS monthly NTL data from the website of Earth Observation Group. These NTL data are clipped in ArcGIS 10.6 based on the administrative borders of the towns in 21 prefectural-level cities in Guangdong Province (Figure 2). Then, the NTL raster data in each town are generated. The built-up area NTL data are from the intersection of the town-level NTL raster data and the raster data of the impermeable layer. Inappropriate town-level administrative units, such as forest farms, reservoirs, and jails, are removed. Missing values and irregular values are cleaned. Lastly, the monthly NTL data in the period of 2013–2020 are summarised into the annual data for town-level units. This research focuses on the NTL data in 12 prefectural-level cities outside the PRD.
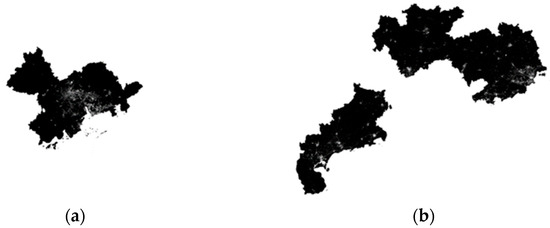
Figure 2.
NPP-VIIRS NTL sample data in Guangdong Province (monthly data in January 2020). (a) Pearl River Delta. (b) Regions outside the PRD.
The average NTL values for each town-level unit are derived from the total NTL values in each town and the size of built-up areas. Here, the size of built-up areas is measured by the number of raster units. Then, these average NTL values are the indicators of the development level in each town. The average NTL value of each prefectural-level city is defined as the arithmetic average of the average NTL values for all towns in this prefectural-level city. Table 2 provides the rankings of the prefectural-level cities based on their average NTL values with their located regions.
Table 2.
Rankings of prefectural-level cities in terms of average NTL values.
In 2020, the prefectural-level cities outside the PRD have been divided into three different layers in development levels according to the average NTL values. The highest layer (over 100) includes four prefectural-level cities in East Guangdong. The lowest layer (0–50) includes five prefectural-level cities in North Guangdong. The three cities in West Guangdong are all in the middle layer (50–100). For cities with lower average NTL values in 2013, only Meizhou and Heyuan have a higher growth rate during the period of 2013–2020 than Shantou, which ranked first in 2013. The growth rate of Meizhou ranked second in Table 2, and Heyuan ranked fifth. The growth rates of the four cities in the highest layer ranked sixth, fourth, third, and first.
The prefectural-level cities in East Guangdong have launched economic cooperation with different cities in two paths: with other cities in East Guangdong and with cities in the PRD near East Guangdong. The first path tends to promote economic integration in East Guangdong. The second path tends to extend the PRD urban agglomeration itself by integrating with nearby cities in East Guangdong. Similar cooperation is launched in West and North Guangdong. However, Table 2 shows that the NTL values in the three regions do not converge in the period of 2013–2020. Only three distinctly different layers are detected. The economic integration in Guangdong Province has not happened. Cities within East, West, and North Guangdong may be integrated. This integration needs to be verified by border effect analysis and the Theil Index among cities. In addition, similar analyses are required to confirm whether the East, West, and North Guangdong areas are integrated with the PRD urban agglomeration.
3. Results
3.1. Border Effects Within East, West, and North Guangdong
For the 12 prefectural-level cities located outside the PRD in Guangdong, 15 city borders are all included in the border effect analysis. Table 3 shows the Barro regression results based on Equation (3). All beta coefficients are negative and significant. This result indicates that, for every two nearby cities outside the PRD, the town-level units comply with beta-convergence. Here, Equation (3) has considered all the pairs of towns, the pairs located in the same city, and the pairs across two cities. For the city borders inside East, West, and North Guangdong, beta-convergence suggests that the NTL values are integrated within these regions. However, as Zhaoqing City in the PRD blocks the geographical connection between Yunfu City and Qingyuan City, the prefectural-level cities outside the PRD are not completely connected. Thus, although beta-convergence is found in all 15 pairs of cities, it does not support this for all cities outside the PRD, where the NTL level is converging.
Table 3.
Barro regression results for border effects within East, West, and North Guangdong.
Meanwhile, the dummy variables standing for the border effect between every two adjacent cities are mostly positive and significant. Nine pairs of cities have significantly positive coefficients of dummy variables, one pair has insignificantly positive coefficients, four pairs have significantly negative coefficients, and one pair has insignificantly negative coefficients. Significantly negative coefficients are found in the pairs of Maoming–Yangjiang inside West Guangdong, Qingyuan–Shaoguan inside North Guangdong, Jieyang–Shanwei inside East Guangdong, and Maoming–Yunfu across West and North Guangdong. Significantly positive coefficients appear in three pairs of cities inside East Guangdong (Chaozhou–Shantou, Chaozhou–Jieyang, and Jieyang–Shantou), four pairs across North and East Guangdong (Heyuan–Shanwei, Meizhou–Chaozhou, Meizhou–Jieyang, and Meizhou–Shanwei), one pair across North and West Guangdong (Yangjiang–Yunfu), and one pair inside West Guangdong (Zhanjiang–Maoming). In these significantly positive city pairs, the differences in NTL levels are enlarging across city borders, although this trend does not exceed the converging trend observed within cities.
Four conclusions can be deducted from the abovementioned phenomena.
- The border effect across city borders in the regions outside the PRD is enlarging in general, especially across North and East Guangdong. This trend is consistent with the city ranking of average NTL values in Table 2;
- The border effect inside East Guangdong is mainly enlarging. However, this trend does not interrupt all the cities in East Guangdong from entering the highest layer simultaneously in Table 2;
- The border effect across North and West Guangdong is inconsistent. The NTL difference is increasing between Yangjiang and Yunfu but it is decreasing between Maoming and Yunfu. This inconsistent phenomenon also occurs inside West Guangdong. The NTL difference is increasing between Zhangjiang and Maoming but it is decreasing between Maoming and Yangjiang;
- No significant changes are observed in the border effect inside North Guangdong, except for the decreasing trend between Qingyuan and Shaoguan. Given that no geographical border exists between West and East Guangdong, the border effect between the two regions is not available.
3.2. Border Effects Between Cities in the PRD and Cities Outside It
The estimation of the border effects between cities in the PRD and cities outside it can test whether the cities in the PRD show diffusion impacts on the surrounding cities to achieve economic integration. Table 4 demonstrates the coefficients of beta and dummy variables for border effects. The NTL values of all the town-level units inside and across cities have a converging trend in the period of 2013–2020. Similar to the cases in Table 3, the towns with lower initial NTL values have a higher growth rate. However, the beta-convergence only provides a general view for all towns in each city pair. Only the coefficient of the border effect can explain whether the NTL difference between two cities enlarges or decreases.
Table 4.
Barro regression results for border effects between cities in the PRD and cities outside it.
Unfortunately, most of the coefficients of dummy variables are positive. Only the gap between Shanwei and Huizhou becomes significantly narrower. Other border effects are all positive or insignificant. This result can be explained by the geographical location of the PRD urban agglomeration. Most of the city borders around the PRD are the borders along North Guangdong. The difference between the PRD and North Guangdong is also larger than that between the PRD and East and West Guangdong. For the border between the PRD and East Guangdong, the border effect is decreasing between Shanwei and Huizhou. For the border between the PRD and West Guangdong, the border effect is insignificantly increasing between Yangjiang and Jiangmen (Figure 3).
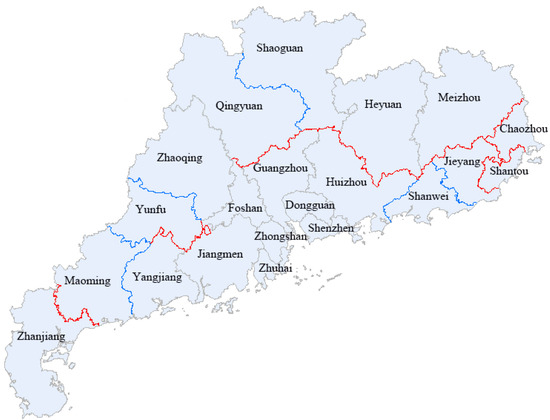
Figure 3.
Changes in the border effect between cities. Note: Red lines indicate that the border effect between two cities is significantly enlarging. Blue lines indicate that the border effect between two cities is significantly decreasing. The rest are insignificant changes. p values are smaller than 0.05, except between Yunfu and Zhaoqing, for which they are smaller than 0.1.
3.3. Panel Data Regression Between the PRD and East, West, and North Guangdong
To test the border effect between the PRD and East, West, and North Guangdong, this research has constructed a panel dataset for each town-level unit. The dataset contains the region (PRD/East/West/North), the prefectural-level city, the administrative district, the log value of the average NTL value by size every year, and the annual growth rate of this log value. According to Equation (4), the annual growth rate is taken as the dependent variable, and others are regarded as independent variables. Panel data regression is conducted to detect the influential factors on the growth rate of NTL values in this region. Here, each sample is from the annual change. The time effects are recorded as 2014/2013, 2015/2014, and 2020/2019.
Coordinated development in the PRD and East, West, and North Guangdong is a long-term regional development policy announced by the Central and Guangdong governments. During the entire research period, the Guangdong government has promoted multiple policies to reduce the gap in the development level inside and outside the PRD. In 2016, the State Council announced Guidelines for Deepening the Regional Cooperation in the Pan-Pearl River Delta. This policy suggested that, in the regional economic development landscape, the large cities should take the leading position. They should rely on small and medium-sized cities for support, with important node cities and towns playing a supporting role. The goal is to promote production-city integration and urban–rural coordinated development. Thereafter, the Guangdong government announced Implementation Guidelines for Deepening the Regional Cooperation in the Pan-Pearl River Delta by Guangdong Province at the beginning of 2017. This policy proposed the cooperation between the entire Guangdong Province and nearby provinces, and the regional integration inside and outside the PRD, such as the Pearl River and West River Economic Belt. Thus, a new policy background is provided in the period of 2016–2017. A policy factor has been introduced into the panel data since 2017. Adopting this factor can compare the growth rate of cities inside and outside the PRD before and after the new guidelines. However, this research does not contain a control group in other provinces, and the coefficient of the policy factor does not suggest a causal relationship.
This study introduces 20 dummy variables representing urban individual effects to account for differences in fixed effects across cities. Excluding the dummy variable for Guangzhou, the regression coefficients for other cities can be explained as the relative growth of NTL values compared with Guangzhou. If the coefficient of the dummy variable for a specific city is positive, then this city has a higher growth rate than Guangzhou in the research period. A negative coefficient indicates lower growth than Guangzhou. As the initial NTL levels for cities in East, West, and North Guangdong were lower than those for Guangzhou, higher growth rates for these cities will reduce the gap in NTL levels between them and Guangzhou.
Substantial disparities exist in economic structures across cities within Guangdong Province. These differences may affect the estimation of regression coefficients. Thus, this study incorporates the 2013 economic structures of administrative districts within each prefecture-level city as control variables, which include the share of secondary industry in GDP and the share of tertiary industry in GDP.
Prior to the formal discussion of regression coefficients, this study employs the Hausman test to compare fixed- and random-effects models in the dimensions of year and city. The results indicate that, when year dummies are included, other coefficients show no significant differences between city fixed- and random-effects models. Regardless of whether the city fixed effects are incorporated, other coefficients demonstrate no significant differences between year random- and fixed-effects models. Furthermore, after adding year dummies as control variables, the improvement in R-squared is significantly greater than that achieved by including city dummies. Following the comparison between year-pooled and random-effects models, the random-effects model with year dummies as control variables is selected. Consequently, for the regression model in Guangdong, two specifications are retained: a random-effects model excluding year and city fixed effects and a random-effects model incorporating year dummies as control variables.
The analysis reveals that, in both models (Table 5), North Guangdong exhibited a slower average development speed than the PRD. East Guangdong demonstrated a faster average development speed than the PRD. West Guangdong showed no statistically significant conclusion. At the regional level, East Guangdong narrowed its developmental gap with the entire PRD. This effect aligns with the reduced border effects between Shanwei and Huizhou in Figure 3. Conversely, North Guangdong widened its gap with the PRD, which is consistent with the expanded border effects for Yunfu, Qingyuan, Shaoguan, and Heyuan relative to neighbouring PRD cities in Figure 3. Given the insignificant trend in West Guangdong, Yangjiang exhibits different border effects with two adjacent PRD cities. The abovementioned outcomes further substantiate the border effect conclusions across regions presented in Section 4.2.
Table 5.
Panel data regression results in Guangdong Province, including North, East, and West Guangdong. (a) Panel data regression in Guangdong Province (No. of samples = 11,417, Baseline city = Guangzhou). In Models (2) and (3), the year dummies are included as control variables. (b) Panel data regression in North Guangdong (No. of samples = 3304, Baseline city = Qingyuan). The year dummies are included as control variables. (c) Panel data regression in East Guangdong (No. of samples = 1876, Baseline city = Shantou). The year dummies are included as control variables. (d) Panel data regression in West Guangdong (No. of samples = 1995, Baseline city = Zhanjiang). The year dummies are included as control variables.
If the interaction terms between regions and policies are incorporated, then the model reveals that North and East Guangdong exhibited deceleration in development trends after 2017 compared with the pre-2017 period, although the directions did not reverse. The policies did not achieve the goal of narrowing the developmental disparities between the PRD and other regions.
Similarly, for the internal analyses of East, West, and North Guangdong, regressions with either random or fixed effects with dummy variables were conducted. Within each sub-region, regional dummies were excluded from the regression, while city dummies were included. Only the choice among year fixed-, random-, and pooled-effects models is needed. By similar procedures, namely Hausman testing, R-squared comparison, and the evaluation between the pooled- and random-effects models, each sub-region retained a random-effects model with city and year dummies as control variables.
The analyses reveal that, controlling for industrial structure, policies, and year effects, East Guangdong showed internal divergence. Compared with Shantou, the originally fastest-developing city, only Shanwei narrowed its developmental gap, while Jieyang and Chaozhou widened theirs. As Shanwei and Shantou are geographically non-adjacent, this effect corresponds to expanded internal border effects in East Guangdong in Figure 3 and Section 3.1.
Similarly, under controls for industrial structure, policies, and year effects, West Guangdong also demonstrates internal divergence. Compared with Zhanjiang, the originally fastest-developing city, Maoming showed no clear trend, while Yangjiang widened its development gap. This outcome exhibits some discrepancy with Figure 3 and Section 3.1. Therefore, the regression model here provides more accurate border effect findings after controlling for industrial, policy, and year impacts.
Under controls for industrial structure, policies, and year effects, North Guangdong demonstrates internal convergence. Compared with Qingyuan, the originally fastest-developing city, Yunfu, Meizhou, and Heyuan all narrowed their development gaps, while Shaoguan showed no statistically significant trend. Given the lower geographical contiguity among Northern Guangdong cities, this discrepancy with Figure 3 can be attributed to that this regression model has more accurate border effect findings after controlling for industrial, policy, and year impacts.
Therefore, the analyses have the following findings:
- At the inter-regional scale, only East Guangdong narrowed its development gap with the PRD region on average. West and North Guangdong widened their development gaps with the PRD on average. The policy interventions have not changed these trends;
- At the intra-regional scale, East and West Guangdong exhibited internal divergence. North Guangdong demonstrated convergence among its cities.
3.4. Trends of Integration in the Border Regions of Cities
In the abovementioned discussions, the comparison between pairs of towns in every two neighbouring cities is conducted to investigate whether the division of city borders would enlarge the trends of border effects. In this part, the pairs of towns located along the city borders would also be compared to test whether the border regions are emerging. The Barro regression model is revised as
When the towns A and B are located in two different cities, BORDER = 1; otherwise, BORDER = 0. When towns A and B are both located along the city borders and in two different cities, MARGIN = 1; otherwise, MARGIN = 0. Based on these definitions, when MARGIN equals to 1, BORDER must be equal to 1. This model further distinguishes the NTL changes between two cities and the NTL changes between border regions in two cities.
Comparing Table 6 with Table 3 shows that, in the 15 city borders within East, West, and North Guangdong, the coefficients of β and BORDER and their significances are consistent regardless of whether the term of MARGIN is included. The introduction of this factor does not change the general conclusion. Meanwhile, significant coefficients of MARGIN are only detected in three city borders: Maoming–Yangjiang, Qingyuan–Shaoguan, and Jieyang-Shanwei. The border region in Maoming–Yangjiang is integrated. The difference in NTL values is enlarging in border regions in Qingyuan–Shaoguan and Jieyang–Shanwei.
Table 6.
Barro regression results for border effects within East, West, and North Guangdong, considering the border regions along city borders.
Comparing Table 7 with Table 4 shows that in the 11 city borders between PRD cities and East, West, and North Guangdong, most coefficients of β and BORDER and their significances are consistent regardless of whether the term of MARGIN is included. The only exception is that the coefficient of BORDER between Yunfu and Zhaoqing changes from insignificantly negative (p value = 0.052) to significantly negative. The introduction of this factor seldom changes the general conclusion. Significant coefficients of MARGIN are detected in four city borders at the 0.05 level, namely Qingyuan–Guangzhou, Qingyuan–Zhaoqing, Yunfu–Foshan, and Yunfu-Zhaoqing. The difference in NTL values is increasing in the border region between Yunfu and Zhaoqing. The three remaining city border regions are emerging in terms of NTL values. In addition, border regions in Heyuan–Huizhou and Qingyuan–Foshan are emerging at the 0.1 level.
Table 7.
Barro regression results for border effects between cities in the PRD and cities outside it, considering the border regions along city borders.
The trend that the difference in NTL values decreases in the five abovementioned city border regions is opposite to the trend that border effects of the five pairs of cities are enlarging (Figure 4). This interesting phenomenon indicates that the integration around the PRD only occurs in some towns along the city borders. For the whole cities, the difference is enlarging in Heyuan–Huizhou, Qingyuan–Foshan, Qingyuan–Guangzhou, Qingyuan–Zhaoqing, and Yunfu–Foshan. However, the difference in NTL values is decreasing in the towns along the city borders. This finding supports the observation that the integration between PRD cities and cities around them only makes progress in some towns along city borders. Unfortunately, this integration does not appear in the scale of cities. At present, insufficient evidence is provided to determine whether the policies in regional integration around the PRD are successful or not.
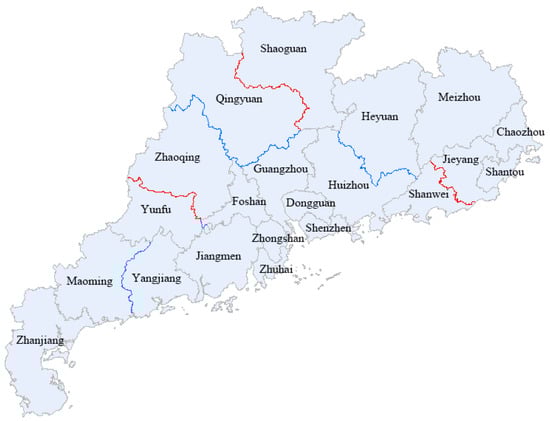
Figure 4.
Changes in the border effect between border regions in adjacent cities. Note: Red lines indicate that the border effect between border regions in two adjacent cities is significantly enlarging. Blue lines indicate that the border effect between border regions in two adjacent cities is significantly decreasing. The rest are insignificant changes. p values are smaller than 0.05, except those between Heyuan and Huizhou and between Qingyuan and Foshan, which are smaller than 0.1.
The phenomenon in which the trend of NTL values between two cities is not consistent with the trend between towns along the border of the two cities is not only found around the PRD; Qingyuan–Shaoguan in North Guangdong and Jieyang–Shanwei in East Guangdong also have the same phenomenon. For Maoming–Yangjiang in West Guangdong, integration trends are found at the city scale and in the border regions. For other border regions in cities outside the PRD, no significant integration or separation trend is detected.
4. Discussion
4.1. Major Reasons for Unsuccessful Economic Integration Between East, West, and North Guangdong and the PRD
4.1.1. Transportation Factors
Table 8 records the changes in the registered population of four regions in Guangdong during the period of 2013–2020. In the eight years, net outflow occurred in East, West, and North Guangdong, and these populations generally flowed into the PRD. This net outflow trend has been more apparent in East Guangdong since 2016 and in West and North Guangdong since 2017. This situation may be attributed to the circumstance that the inter-city transportation network has become more convenient. The population in the less developed regions is attracted to the highly developed region, that is, the PRD. For the high-speed railway and inter-city railway, the Xiamen–Shenzhen Railway between the PRD and East Guangdong started to operate since December 2013, the Beijing–Guangzhou Railway (the part of Wuhan-Guangzhou) between the PRD and North Guangdong started in December 2009, and the Maoming–Zhanjiang Railway between the PRD and West Guangdong started in June 2018. These railways all belong to the major high-speed railway network in China. Until December 2021, Guangdong Province had become the province with the longest distance from high-speed and inter-city railways. In the same month, all 21 prefectural-level cities were connected to the high-speed railway network.
Table 8.
Net population inflow intra- and inter-province in each region. (Source: Guangdong Statistical Yearbook: Population).
However, the transportation convenience from high-speed railway promotes the flow of production factors among cities along the railway [48,49,50]. However, the high-speed railway does not stimulate the local economy of these cities. Previous research suggests that a high-speed railway can draw the concentration of investment activity in the first- and second-tier cities [51], the concentration of knowledge intensity industries [52], and the concentration of tertiary industry in large cities [53]. At least in Guangdong, the high-speed network attracts a more registered population to the well-developed PRD. This situation leads to the concentration of labour force and capital in the PRD, which disturbs the economic growth in the less developed regions.
Except from the high-speed and inter-city railway, Guangdong also has an excellent highway network, which is over 10,000 km at the end of 2020. This length is the highest level in China. All the town-level administrative districts are connected to the highway network. The highway network has connected the PRD and East, West, and North Guangdong before 2005. In the following years, the highways continue to extend to each town and enlarge the polarisation effect of the transportation network.
4.1.2. Industry Factors
In another study analysing border effects within the PRD region using NTL data [54], industrial synergy has demonstrated a significant impact on regional economic convergence. Therefore, this research also attempts to discuss the issue from the same analytical perspective. Compared with transportation factors, the industrial synergy has indeed shown more a prominent impact on regional economic convergence. Figure 4 demonstrates the proportion of individual industry based on the gross industry output value in the prefectural-level yearbook in 2021. The industry added value is adopted in Jiayang as the gross industry output value is not available. Six industries with the highest proportions are shown in each prefectural-level city. In most cities, the six industries account for 60–70% of the gross industry output value. Figure 5 shows that most cities in East, West, and North Guangdong still take the upstream industry as the major industries, such as the Manufacture of Metal Products/Non-metallic Mineral Products, Smelting and Pressing of Ferrous Metals/Non-ferrous Metals, Processing of Food from Agricultural Products, and Manufacture of Textile. They may also take some traditional low value-added industries. The Manufacture of Computers, Communication, and Other Electronic Equipment, as a typical high value-added industry, has contributed to over 10% of gross industry output value in only Shanwei, Meizhou, and Heyuan, around 8% in Yunfu, and approximately 6% in Qingyuan. In other cities, the manufacture of machinery, equipment, and automobiles does not contribute to over 5% as one or two major industries. Most of the 12 cities still tend to promote the processing of raw materials and other low value-added industries.
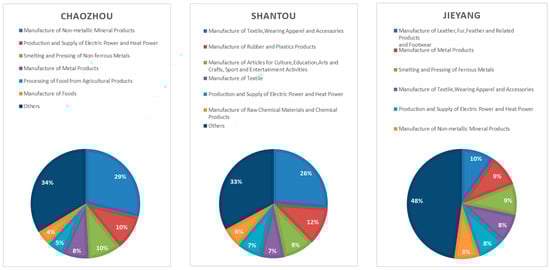
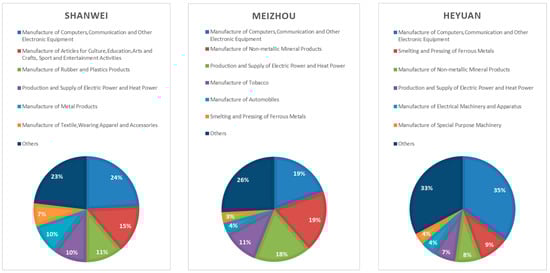
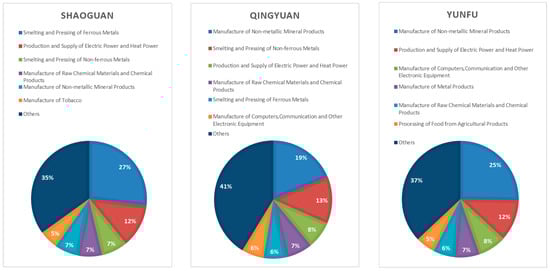
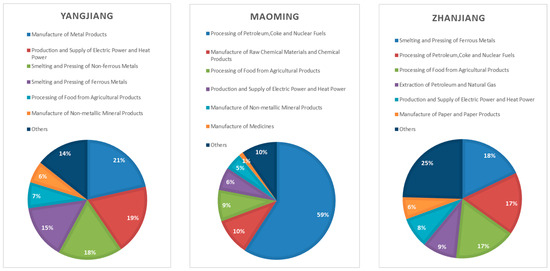
Figure 5.
Major industries in each prefectural-level city based on the proportion in the gross industry output value (the industry added value in Jieyang). (Source: Statistical Yearbooks for each prefectural-level city).
In addition, cities in East, West, and North Guangdong do not form a regional industry structure to enhance inter-city industry cooperation. Within each region, the largest industries (with the highest gross industry output value) in each pair of two adjacent cities are inconsistent, except for the pair of Meizhou and Heyuan. For cities in the leading position in each region, only Meizhou has 19% of the gross industry output value in the Manufacture of Computers, Communication, and Other Electronic Equipment. This high concentration is also the reason why the average NTL values in Meizhou increases from fourth to first in North Guangdong. However, the gaps among the top three industries in Meizhou are quite small. The first industry only has a weak leading position. However, Shantou and Zhanjiang do not build up an industry structure with a high value-added industry as a pillar industry. They cannot become the leading city in the development of East and West Guangdong. Compared with 2013, the prominent growth in Shanwei, Meizhou, and Heyuan can be explained by their high-value added pillar industries. However, they were not the economic centres in respective regions and do not have close industry connections with nearby cities. Whether the three cities will become the growth poles to promote the regional development is unclear. Compared with the three cities, Qingyuan and Yunfu also have high value-added industries, but the proportion of these industries is lower than 10% in the gross industry output value. The two cities have lower ranks in terms of average NTL values compared with 2013.
Notably, Heyuan exhibits a dramatic growth based on high value-added industries. However, the growth rate cannot catch up with Huizhou in the PRD during the research period. Huizhou has a 51% growth in the NTL levels according to the same standard in Table 2, which is higher than most cities in East, West, and North Guangdong. Only Shanwei, with the highest growth in East Guangdong, can reduce the border effect with Huizhou. Other cities adjacent to the PRD do not have strong industries to decrease the border effect between them and PRD cities. Only Yunfu (20%) and Shaoguan (22%) have higher growth rates than Guangzhou (15%), which already ranks second in the PRD. However, they have no evident advantages compared with Foshan (19%), Zhaoqing (30%), and Jiangmen (55%) or other nearby PRD cities. Thus, other border effects between PRD cities and cities outside the PRD do not contract.
Figure 6 shows the industrial structure of the nine PRD cities in the same period based on relative yearbooks to compare the industry structure between cities in East, West, and North Guangdong and cities in the PRD.
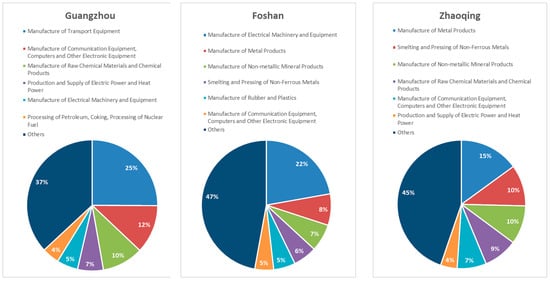
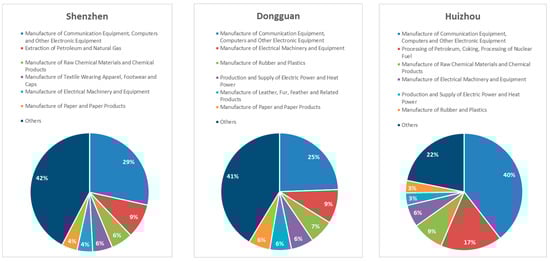
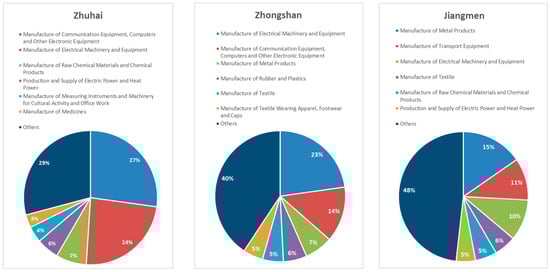
Figure 6.
Major industries in each prefectural-level city based on the proportion in the gross industry output value (the industry added value in Dongguan). (Source: Statistical Yearbooks for each prefectural-level city).
For Shanwei–Huizhou and Yunfu–Zhaoqing, which have the same largest industry, the border effects across the urban agglomeration boundary have narrowed. Shaoguan–Guangzhou, Shaoguan–Huizhou, Qingyuan–Guangzhou, Qingyuan–Foshan, Yunfu–Foshan, and Yunfu–Jiangmen all have significantly increased border effects due to the difference in their major industries. The exceptions are the Meizhou–Huizhou, Yangjiang–Jiangmen, and Qingyuan–Zhaoqing. The border effect is still increasing in the case of Meizhou–Huizhou with the same first-order industry. In addition, Yangjiang–Jiangmen and Qingyuan–Zhaoqing have not narrowed or widened their economic gaps despite having the same first-order industry. This situation may be explained by the limited advantages of the first-order industries in Jiangmen, Zhaoqing, and Meizhou. The gap between the first- and second-order industries in these cities is either very small (≤0.5%) or their own share is very low (≤15%). Moreover, the economic level of Jiangmen and Zhaoqing themselves is relatively backward in the Pearl River Delta region. They lack sufficient economic strength to narrow the economic gap with cities outside the urban agglomeration by industrial synergy. The gap among the first- and third-order industries in Meizhou is small, and the second- and third-order industries do not overlap with those in Huizhou. Thus, the impact of industrial synergy is insufficiently strong.
In general, neither East nor West Guangdong had established industrial synergy, which is consistent with their internal divergence. While North Guangdong as a whole showed insignificant industrial synergy, industrial synergy has emerged between Heyuan and Meizhou, which partially explains the internal convergence in the region. However, compared with the PRD, the impact of industrial synergy is significantly smaller.
At the inter-regional scale between the PRD and East, West, and North Guangdong, economic integration cannot be simply explained by industrial synergy levels. The reason is that excessive similarity in pillar industries among many adjacent cities may trigger excessive competition and resource misallocation, which potentially fails to enhance overall industrial efficiency in the urban agglomeration. The PRD and East, West, and North Guangdong should be viewed as at least four economic zones. In establishing economic linkages across multiple zones, achieving inter-economic-zone integration through strategic industrial complementarity requires further exploration.
4.2. Potential Applications in International Cases
Although this study focuses on Guangdong Province in China, its research framework and findings do not explicitly incorporate cultural or institutional factors, which enables meaningful comparisons with major urban agglomerations in other developing nations. These areas include the regions undergoing development or transformation centred on emerging industries, such as electronics manufacturing, new energy, digital economy, and green economy sectors. The centres of these regions may drive local economic growth and regional integration, which leads to the formation of new metropolitan areas, economic corridors, and urban agglomerations.
Bengaluru, which is renowned as the ‘Silicon Valley of India’, possesses advanced semiconductor manufacturing and IT industries. It serves as the economic core of Karnataka State and India’s technology and innovation hub. As the new economic engine in southern India, Bengaluru has undergone significant territorial expansion [55]. Its urban built-up area has substantially sprawled, with growing influence on surrounding regions [56,57]. The Indian government aims to establish a new economic zone centred on Bengaluru. Currently, successful economic spillover has reached the southeastern satellite city of Hosur, which hosts mature industrial clusters in electronics and high-end manufacturing, new energy, and automation. In the future, India seeks to achieve industrial upgrading in Mysuru, which is a historic industrial city in the vicinity, and establish the ‘Bengaluru-Mysuru Technology Corridor’. Establishing a new urban agglomeration based on Bengaluru is still a lengthy endeavour.
Ho Chi Minh City is the economic growth hub in Vietnam. It contains green industries, electronics, and high-end manufacturing, with a strong emphasis on innovation and ESG principles. It has initiated the development of digital economy sectors such as data centres and AI, which fosters a high-density CBD in the city by knowledge spillovers [58]. Currently, Ho Chi Minh City ranks among the fastest-growing regions in Vietnam. It also attracts the highest foreign direct investment [59]. Its economic influence extends to five neighbouring provinces [60]. However, no prominent native secondary cities exist in the southeastern region [61]. This situation introduces greater challenges for establishing an urban agglomeration compared with Bengaluru, India. In July 2025, Ho Chi Minh City formally merged with adjacent Binh Duong Province and Ba Ria-Vung Tau Province under a unified urban governance framework to construct a polycentric megacity. This urban development plan will still address the critical task of establishing functional secondary centres.
The Jakarta–Bandung–Surabaya corridor in Indonesia, which is also known as the Java Economic Golden Belt, accounts for 57% of Indonesia’s GDP. It is a popular large economic zone in Southeast Asia and is composed of the Jakarta–Bandung industrial belt, Central Java industrial belt (e.g., Batang special economic zone), and Surabaya industrial belt. In the future, it will be integrated through an east–west high-speed railway line. Jakarta–Bandung is a high-tech industrial zone for electronics and new energy. Central Java focuses on labour-intensive industries and is beginning to transition to green energy. Surabaya serves as a base for heavy industry and chemical production. Currently, the industrial concentration effects, particularly the talent concentration, have shown a positive impact on economic growth [62]. At present, Jakarta–Bandung and Surabaya–Malang metropolitan areas on Java Island are integrating with surrounding regions [63]. Beyond metropolitan areas, built-up areas in non-metropolitan regions are also expanding rapidly [64]. At this stage, establishing an island-wide integrated mega-economic zone has strong potential. The major constraint for further expanding the economic influence range is the geographical coastline.
Research on the application of NTL data in these regions has primarily focused on patterns of built-up area expansion, changes in population density, and intra-urban development disparities [65,66,67,68,69,70], with limited exploration of inter-city integration and economic convergence phenomena. By integrating NTL data with spatial impervious surface data, based on economic models on spatial relationships, such as New Economic Geography, Endogenous Growth Theory, and border effects, NTL evolution trends can be analysed across different periods. This analysis could further investigate how economic integration occurs among cities within emerging economic zones of different nations. This exploration holds significant theoretical and practical implications for addressing inter-city income disparities and achieving coordinated polycentric development in urban agglomerations.
5. Conclusions
5.1. Major Findings and Suggestions
This study has examined an issue of concern to developing countries: the regional integration between an existing urban agglomeration and its surrounding regions. This adopts the NTL data by NP-VIIRS as the representative of the local economic development level. The analysis of the border effect is conducted for 12 cities outside the PRD during the period of 2013–2020. Panel data regression is also used to verify the results.
The comparison within East, West, and North Guangdong and the comparison between these regions and nearby PRD cities indicate that economic integration does not occur within East and West Guangdong. Only a few cities close to the PRD reduce the NTL difference between them and adjacent PRD cities. The detailed findings are obtained as follows:
- At the inter-regional scale, only East Guangdong narrowed its development gap with the PRD region on average. West and North Guangdong widened their development gaps with the PRD on average. The policy interventions have not changed these trends;
- At the intra-regional scale, East Guangdong consistently showed internal divergence with and without the control for policy, industry structure, and year effects. West Guangdong exhibited internal divergence under controls for policy, industrial structure, and year effects, but the internal trend differs from scenarios without these controls. North Guangdong demonstrated convergence among its cities under controls for policy, industrial structure, and year effects, with small variations compared with scenarios without these controls;
- For the town-level units along city borders, five pairs of cities have a decreasing gap in the border regions between PRD cities and cities around the PRD. These pairs of cities include Heyuan–Huizhou, Qingyuan–Foshan, Qingyuan–Guangzhou, Qingyuan–Zhaoqing, and Yunfu–Foshan. This diminishing border effect only occurs in border regions. In the scale of cities, the border effect is still enlarging.
By comparing the top six industries in each city, industrial synergy can be used to explain the increasing gap among some cities. Cities in East, West, and North Guangdong do not have similar industrial structures. As a result, they do not have an internal integration and convergence process similar to the Shenzhen–Dongguan–Huizhou metropolitan area. As for the comparison of cities within and outside the PRD region, most of the widening or narrowing economic gaps can be explained by industrial synergy. Only a few cases are inconsistent with the trend of industrial synergy due to the inconspicuous advantages of the first-order industries in these cities.
Two suggestions can be provided for East, West, and North Guangdong based on the findings of the border effect. First, for cities around the PRD, the policy of integration in border regions should be continuously promoted. The cities around the PRD can be developed as a live circle, which may drive the tertiary industry in these cities. Second, the regional industry network with high-value-added industries should be enhanced as pillar industries, especially in West Guangdong. The upgrade of industry structure is the major path to improving the local economy. In the long term, an industry structure having complementary connections with the PRD should be determined, and the local advantages should be considered to develop regional economic centres.
5.2. Limitations
Owing to the scope constraints of this study and the disciplinary focus of the authors, the analyses of economic integration and border effects across the PRD and East, West, and North Guangdong regions concentrate primarily on economic concepts such as industrial structure. Insufficient attention is devoted to comparative perspectives, including geography, land administration, household registration system (Hukou), cultural dynamics, disparities in municipal-level governance, and urban planning and design. These areas can also show potential influences on regional economic convergence. Some reasons are provided as follows:
Firstly, Guangdong Province stands among China’s earliest provinces in achieving the goal of ‘high-speed rail access to each prefecture-level city and highway access to every county’. Such transportation investments substantially mitigate the negative impact of the hilly terrain on economic integration. Crucially, terrain constraints historically affected primarily North Guangdong. Economic exchanges within East and West Guangdong and between these regions and the PRD were not severely constrained. Given that this study focuses on post-2013 economic integration, current evidence is insufficient to support significant ongoing geographical influences.
Secondly, although Guangdong Province encompasses several distinct sub-cultural groups, all of them fundamentally belong to the Lingnan cultural sphere. Whether intra-provincial cultural variations significantly influence inter-city economic integration remains unverified. The authors fail to identify appropriate quantifiable measures within their disciplinary expertise. This gap requires supplementary research in future studies.
Thirdly, considering the disparities in statistical methodologies and institutional frameworks, this study excludes Hong Kong and Macau Special Administrative Regions from the Greater Bay Area analysis. These cities connect via land borders exclusively to one PRD city each, that is, Hong Kong to Shenzhen and Macau to Zhuhai. The terrain in the boundary belongs to alluvial plains. Divergent governance systems constitute the primary barrier to economic integration. Future research should pay close attention to the detailed analysis of Guangdong–Hong Kong–Macau policy differences to advance this critical dimension. The cross-border connectivity in transportation infrastructure based on the experiences in Hong Kong and Macau should also be considered.
Apart from the abovementioned research perspectives, discussions on integration between the PRD region and surrounding areas must further quantify the ‘agglomeration advantages’ of the core region based on New Economic Geography and Endogenous Growth Theory. Crucially, future research should investigate how emerging regional centres can achieve the thresholds of scale economies and establish industrial complementarity with existing cores to develop a polycentric and multi-tiered extended economic zone. New frameworks on the evolutionary mechanisms underlying this extension process should also be constructed.
Author Contributions
Conceptualisation, X.L.; methodology, X.L. and J.Z.; software, J.Z.; validation, X.L. and J.Z.; formal analysis, J.Z.; investigation, J.Z.; resources, J.Z.; data curation, J.Z.; writing—original draft preparation, J.Z.; writing—review and editing, J.Z.; visualisation, J.Z.; supervision, X.L.; project administration, X.L.; funding acquisition, J.Z. All authors have read and agreed to the published version of the manuscript.
Funding
This research was funded by grants from the National Natural Science Foundation of China—Youth Programme (No. 42001177) and General Programme (No. 42371206).
Data Availability Statement
The NTL data are derived from the NPP-VIIRS monthly nighttime light dataset from the website of the Earth Observation Group (EOG): https://eogdata.mines.edu/products/vnl/ (accessed on 20 July 2025) Statistical yearbooks for Guangdong Province and its prefecture-level cities can be found in the CNKI China Economic and Social Statistics Database: https://cnki.istiz.org.cn/CSYDMirror/Home/Index (accessed on 20 July 2025).
Conflicts of Interest
The authors declare no conflicts of interest. The funders had no role in the design of the study; in the collection, analyses, or interpretation of the data; in the writing of the manuscript; or in the decision to publish the results.
Abbreviations
The following abbreviations are used in this manuscript:
| PRD | Pearl River Delta |
| NTL | Nighttime light |
References
- Hamer, A.M. Planning urban development with a change of sovereignty in mind: A Hong Kong case study. Cities 1997, 14, 287–294. [Google Scholar] [CrossRef]
- Balsas, C.J.L. Developing a transport infrastructure in a context of political change: The example of Macau. Third World Plan. Rev. 2000, 22, 261. [Google Scholar] [CrossRef]
- Zeng, C.; Zhang, S.; Li, H. The change in the difference in regional economy in Guangdong Province and the decomposition of the difference. Soc. Sci. 2017, 4, 38–40. (In Chinese) [Google Scholar]
- Huang, X.; Yang, D. Dose industrial transfer policy contribute to the convergence between regions: An analysis based on the regression discontinuity of county data from Guangdong. Int. Econ. Trade Res. 2017, 33, 101–112. (In Chinese) [Google Scholar]
- Bai, X.; Du, B.; Jiang, Y. Spatial disparities of economy and its evolvement at county level in Guangdong Province. Res. Soil Water Conserv. 2019, 26, 296–303. (In Chinese) [Google Scholar]
- Marshall, A. “Some aspects of competition.” The address of the president of section F—Economic Science and Statistics—Of the British Association, at the Sixtiet Meeting, held at Leeds, in September, 1890. J. R. Stat. Soc. 1890, 53, 612–643. [Google Scholar] [CrossRef]
- Krugman, P. Increasing returns and economic geography. J. Polit. Econ. 1991, 99, 483–499. [Google Scholar] [CrossRef]
- Romer, P.M. Increasing returns and long-run growth. J. Polit. Econ. 1986, 94, 1002–1037. [Google Scholar] [CrossRef]
- Lucas, R.E., Jr. On the mechanics of economic development. J. Monet. Econ. 1988, 22, 3–42. [Google Scholar] [CrossRef]
- Tinbergen, J. Shaping the World Economy, Suggestions for an International Economic Policy; Twentieth Century Fund: New York, NY, USA, 1962. [Google Scholar]
- McCallum, J. National borders matter: Canada-US regional trade patterns. Am. Econ. Rev. 1995, 85, 615–623. [Google Scholar]
- Wei, S.J. Intra-National Versus International Trade: How Stubborn Are Nations in Global Integration; National Bureau of Economic Research: Cambridge, MA, USA, 1996; Available online: https://www.nber.org/papers/w5531 (accessed on 20 July 2025).
- Balistreri, E.J.; Hillberry, R.H. Structural estimation and the border puzzle. J. Int. Econ. 2007, 72, 451–463. [Google Scholar] [CrossRef]
- Anderson, J.E.; Van Wincoop, E. Gravity with gravitas: A solution to the border puzzle. Am. Econ. Rev. 2003, 93, 170–192. [Google Scholar] [CrossRef]
- Coughlin, C.C.; Novy, D. Is the international border effect larger than the domestic border effect? Evidence from US trade. CESifo Econ. Stud. 2013, 59, 249–276. [Google Scholar] [CrossRef]
- Samuelson, P.A. Theoretical notes on trade problems. Rev. Econ. Stat. 1964, 46, 145–154. [Google Scholar] [CrossRef]
- Engel, C.; Rogers, J.H. How wide is the border? Am. Econ. Rev. 1996, 86, 1112–1125. [Google Scholar]
- Parsley, D.C.; Wei, S.J. Explaining the border effect: The role of exchange rate variability, shipping costs, and geography. J. Int. Econ. 2001, 55, 87–105. [Google Scholar] [CrossRef]
- Gorodnichenko, Y.; Tesar, L.L. Border effect or country effect? Seattle may not be so far from Vancouver after all. Am. Econ. J. Macroecon. 2009, 1, 219–241. [Google Scholar] [CrossRef]
- Head, K.; Mayer, T. Illusory Border Effects: Distance Mismeasurement Inflates Estimates of Home Bias in Trade; CEPII: Paris, France, 2002; Volume 1, Available online: https://cepii.fr/PDF_PUB/wp/2002/wp2002-01.pdf (accessed on 20 July 2025).
- Evans, C.L. The economic significance of national border effects. Am. Econ. Rev. 2003, 93, 1291–1312. [Google Scholar] [CrossRef]
- Huang, X.; Li, T.; Chen, S. The paradox of “The Law of One Price” in the city border effect in China: The evidences from Yangtze River Delta. J. World Econ. 2014, 37, 100–118. (In Chinese) [Google Scholar]
- Li, X.; Xu, X. On the temporo-spatial variations of the border effects: Approach and empirics. Geogr. Res. 2006, 5, 792–802. (In Chinese) [Google Scholar]
- Lall, S.V.; Yilmaz, S. Regional economic convergence: Do policy instruments make a difference? Ann. Reg. Sci. 2001, 35, 153–166. [Google Scholar] [CrossRef]
- Yao, S.; Zhang, F.; Wang, F.; Ou, J. Regional economic growth and the role of high-speed rail in China. Appl. Econ. 2019, 51, 3465–3479. [Google Scholar] [CrossRef]
- Levin, N.; Zhang, Q. A global analysis of factors controlling VIIRS nighttime light levels from densely populated areas. Remote Sens. Environ. 2017, 190, 366–382. [Google Scholar] [CrossRef]
- Wu, J.; He, S.; Peng, J.; Huang, X.; Zhang, L. Research on spatial characteristics of urban development based on DMSP-OLS data. Geogr. Geo-Inf. Sci. 2014, 30, 20–25. (In Chinese) [Google Scholar]
- Yang, Y.; Huang, Q.; Zhang, L. The spatial-temporal measurement on the land urbanization level using DMSP/OLS nighttime light data- A case study of Bohai Rim. Econ. Geogr. 2015, 35, 141–148. (In Chinese) [Google Scholar]
- Chen, Z.; Wei, Y.; Shi, K.; Zhao, Z.; Wang, C.; Wu, B.; Qiu, B.; Yu, B. The potential of nighttime light remote sensing data to evaluate the development of digital economy: A case study of China at the city level. Comput. Environ. Urban Syst. 2022, 92, 101749. [Google Scholar] [CrossRef]
- Zhang, X.; Guo, S.; Guan, Y.; Cai, D.; Zhang, C.; Fraedrich, K.; Xiao, H.; Tian, Z. Urbanization and spillover effect for three megaregions in China: Evidence from DMSP/OLS nighttime lights. Remote Sens. 2018, 10, 1888. [Google Scholar] [CrossRef]
- Li, M.; Chen, H.; Huang, Y.; Huang, M. The Rise of Border Areas in an Integrated Region of China. Sustainability 2019, 11, 5692. [Google Scholar] [CrossRef]
- Wang, F.; Fan, W.; Lin, X.; Liu, J.; Ye, X. Does population mobility contribute to urbanization convergence? Empirical evidence from three major urban agglomerations in China. Sustainability 2020, 12, 458. [Google Scholar] [CrossRef]
- Xu, X.; Wang, X.; Gao, Y. The political economics in regional development in China. World Econ. Pap. 2011, 3, 26–58. (In Chinese) [Google Scholar]
- Acemoglu, D.; Johnson, S.; Robinson, J.A. Institutions as a fundamental cause of long-run growth. Handb. Econ. Growth 2005, 1, 385–472. [Google Scholar]
- Xu, C. The fundamental institutions of China’s reforms and development. J. Econ. Lit. 2011, 49, 1076–1151. [Google Scholar] [CrossRef]
- Timberlake, M. Review of world city network: A global urban analysis. J. World-Syst. Res. 2018, 24, 230–235. [Google Scholar] [CrossRef]
- Watson, A.; Beaverstock, J.V. World City Network Research at a Theoretical Impasse: On the Need to Re-Establish Qualitative Approaches to Understanding Agency in World City Networks. Tijdschr. Voor Econ. en Soc. Geogr. 2014, 105, 412–426. [Google Scholar] [CrossRef]
- Fomina, A.V.; Berduygina, O.N.; Shatsky, A.A. Industrial cooperation and its influence on sustainable economic growth. Entrep. Sustain. Issues 2018, 5, 467–479. [Google Scholar] [CrossRef]
- Gomes-Casseres, B.; Hagedoorn, J.; Jaffe, A.B. Do alliances promote knowledge flows? J. Finan. Econ. 2006, 80, 5–33. [Google Scholar] [CrossRef]
- de Abreu, M.C.S.; de Andrade, R.D.J.C. Dealing with wicked problems in socio-ecological systems affected by industrial disasters: A framework for collaborative and adaptive governance. Sci. Total Environ. 2019, 694, 133700. [Google Scholar] [CrossRef]
- Chen, Y.; Nie, H.; Chen, J.; Peng, L. Regional industrial synergy: Potential and path crossing the “environmental mountain”. Sci. Total Environ. 2021, 765, 142714. [Google Scholar] [CrossRef]
- Yang, Z.L.; Tang, C.L.; Zhou, G.H.; Wu, J.M.; Chen, W.Y. Coordinated development evaluation of urban agglomeration–development zones–industrial cluster—A case of Changsha–Zhuzhou–Xiangtan Urban Agglomeration. Econ. Geogr. 2018, 38, 78–84. [Google Scholar]
- Wang, C.; Meng, Q. Research on the sustainable synergetic development of Chinese urban economies in the context of a study of industrial agglomeration. Sustainability 2020, 12, 1122. [Google Scholar] [CrossRef]
- Sala-i-Martin, X.X. The classical approach to convergence analysis. Econ. J. 1996, 106, 1019–1036. [Google Scholar] [CrossRef]
- Barro, R.J.; Sala-i-Martin, X. Convergence. J. Polit. Econ. 1992, 100, 223–251. [Google Scholar] [CrossRef]
- Barro, R.J. Convergence and modernisation. Econ. J. 2015, 125, 911–942. [Google Scholar] [CrossRef]
- Xu, X.; Li, X. Convergence in Chinese cities. Econ. Res. J. 2004, 39, 40–48. (In Chinese) [Google Scholar]
- Amano, K.; Nakagawa, D. Study on urbanization impacts by new stations of High Speed Railway. In Proceedings of the Korean Transportation Association, Dejeon City, Republic of Korea, August 1990; Volume 1, pp. 124–135. [Google Scholar]
- Kim, J.; Zhang, M. Determining transit’s impact on Seoul commercial land values: An application of spatial econometrics. Int. Real Estate Rev. 2005, 8, 1–26. [Google Scholar] [CrossRef]
- Li, Y. Impacts of High Speed Railway Station on Non-Metropolitan Cities in China: A Case Study of Wuhan-Guangzhou Line. Ph.D. Dissertation, Columbia University, New York, NY, USA, 2015. [Google Scholar]
- Li, X.; Huang, B.; Li, R.; Zhang, Y. Exploring the impact of high speed railways on the spatial redistribution of economic activities -Yangtze River Delta urban agglomeration as a case study. J. Transp. Geogr. 2016, 57, 194–206. (In Chinese) [Google Scholar] [CrossRef]
- Murakami, J.; Cervero, R. High-Speed Rail and Economic Development: Business Agglomerations and Policy Implications; University of California Transportation Center: Berkeley, CA, USA, 2012. [Google Scholar]
- Shao, S.; Tian, Z.; Yang, L. High speed rail and urban service industry agglomeration: Evidence from China’s Yangtze River Delta region. J. Transp. Geogr. 2017, 64, 174–183. [Google Scholar] [CrossRef]
- Zhong, J.; Mai, X.; Li, X. Differences in intercity economic convergence in the Pearl River Delta based on nighttime light data and its interpretation. Cities 2024, 151, 105136. [Google Scholar] [CrossRef]
- Sandeep, P.; Saju, H.; Kumar, K.C.A. Estimation of spatiotemporal dynamics of urban sprawl in Bengaluru Urban agglomeration using earth observation datasets. Arab. J. Geosci. 2024, 17, 270. [Google Scholar] [CrossRef]
- Verma, S.; Chatterjee, A.; Mandal, N.R. Analysing Urban Sprawl and Shifting of Urban Growth Centre of Bengaluru City, India Using Shannon’s Entropy Method. J. Settl. Spat. Plan. 2017, 8, 89–98. [Google Scholar] [CrossRef]
- Biswas, V.; Tripathi, D.K.; Kumar, M. Impact of sprawl on development pattern of Bengaluru City. In Remote Sensing and Geographic Information Systems for Policy Decision Support; Springer Nature: Singapore, 2022; pp. 403–419. [Google Scholar]
- Huynh, D.T. The effects of clustering on office rents: Empirical evidence from the rental office market in Ho Chi Minh City. Theor. Empir. Res. Urban Manag. 2014, 9, 5–26. [Google Scholar]
- Kim, H.M. Foreign direct investment and urban growth in Vietnam: Spatial, economic, and demographic perspectives. Asian Geogr. 2024, 41, 167–184. [Google Scholar] [CrossRef]
- Nguyen, H.M.; Tran, K.T. Monocentric Growth and Productivity Spillovers in Vietnam: A Spatial Regression Approach. Indian J. Finan. 2022, 16, 64–75. [Google Scholar] [CrossRef]
- Harms, E. Megalopolitan megalomania: Ho Chi Minh City, Vietnam’s Southeastern region and the speculative growth machine. Int. Plan. Stud. 2019, 24, 53–67. [Google Scholar] [CrossRef]
- Warsito, T. Analysis of the Impact of Agglomeration on Regional Economic Growth on Java Island. Riwayat Educ. J. Hist. Humanit. 2023, 6, 3190–3197. [Google Scholar]
- Khasanah, N. Analyzing Urban Agglomeration Pattern of Java Island in Indonesia. Ph.D. Dissertation, Graduate School of Seoul National University, Seoul, Republic of Korea, 2024. [Google Scholar]
- Pravitasari, A.E.; Indraprahasta, G.S.; Rustiadi, E.; Rosandi, V.B.; Stanny, Y.A.; Wulandari, S.; Priatama, R.A.; Murtadho, A. Dynamics and predictions of urban expansion in Java, Indonesia: Continuity and change in mega-urbanization. ISPRS-Int. J. Geo-Inf. 2024, 13, 102. [Google Scholar] [CrossRef]
- Putri, A.; Mukhtar, M.K.; Widyastuti, R.; Manessa, M.D.M. The relationship between night time light and population in 2000 and 2015 in The Java Island. In IOP Conference Series: Earth and Environmental Science; IOP Publishing: Bristol, UK, 2020; Volume 500, p. 12068. [Google Scholar]
- Kamarajugedda, S.A.; Mandapaka, P.V.; Lo, E.Y. Assessing urban growth dynamics of major Southeast Asian cities using night-time light data. In Remote Sensing of Night-time Light; Routledge: London, UK, 2021; pp. 219–239. [Google Scholar]
- Nurhadi, M.D.H.; Cahyono, A. Estimating population of Java Island based on nighttime lights data. In Seventh Geoinformation Science Symposium 2021; SPIE: Yogyakarta, Indonesia, 2021; Volume 12082, pp. 212–220. [Google Scholar]
- Bharadwaj, V.; Gupta, P.K.; Siddiqui, A. Measuring and analysing urban growth pattern using spatial metrics in Bengaluru, India. Geocarto Int. 2022, 37, 15714–15735. [Google Scholar] [CrossRef]
- Zhou, K.; Liang, Y.; Zhong, C.; Zeng, J.; Zhou, Z. Spatial features of urban expansion in Vietnam based on long-term nighttime lights data. Land 2022, 11, 601. [Google Scholar] [CrossRef]
- Yu, J.; Liu, L.; Ban, Y.; Zhang, Q. Evaluating urban development and socio-economic disparity in India through nighttime light data. J. Geogr. Sci. 2024, 34, 2440–2456. [Google Scholar] [CrossRef]
Disclaimer/Publisher’s Note: The statements, opinions and data contained in all publications are solely those of the individual author(s) and contributor(s) and not of MDPI and/or the editor(s). MDPI and/or the editor(s) disclaim responsibility for any injury to people or property resulting from any ideas, methods, instructions or products referred to in the content. |
© 2025 by the authors. Licensee MDPI, Basel, Switzerland. This article is an open access article distributed under the terms and conditions of the Creative Commons Attribution (CC BY) license (https://creativecommons.org/licenses/by/4.0/).