Article

Spatial Mapping of Thermal Anomalies and Change Detection in the Sierra Madre Occidental, Mexico, from 2000 to 2024

by
Sandoval Sarahi
1 and
Escobar-Flores Jonathan Gabriel
2,*
1
SECIHTI, Instituto Politécnico Nacional, Durango 34220, DG, Mexico
2
CIIDIR Durango, Instituto Politécnico Nacional, Durango 34220, DG, Mexico
*
Author to whom correspondence should be addressed.
Land 2025, 14(8), 1635; https://doi.org/10.3390/land14081635
Submission received: 3 July 2025 / Revised: 9 August 2025 / Accepted: 12 August 2025 / Published: 13 August 2025
(This article belongs to the Section Land – Observation and Monitoring)

Abstract

We quantified monthly changes in land surface temperature (LST) over the Sierra Madre Occidental (SMO) in Mexico from 2000 to 2024 using MODIS satellite imagery (MOD11B3). The SMO is the longest continuous mountain complex in Mexico, covering an area of 251,648 km2. It is an area of great importance for biodiversity conservation, as it is home to numerous endemic flora and fauna species. The Intergovernmental Panel on Climate Change (IPCC) has stated that high mountain areas are among the regions most affected by climate change and are a key element of the water cycle. We calculated an anomaly index by vegetation type in the SMO and applied change detection to spatially identify where changes in LST had taken place. The lowest LST values were in December and January (20 to 25 °C), and the highest LST values occurred in April, May, and June (>40 °C). Change detection applied to the time series showed that the months with the highest positive LST changes were May to July, and that November was notable for increases of up to 5.86 °C. The time series that showed the greatest changes compared to 2000 was the series for 2024, where LST increases were found in all months of the year. The maximun average increase was 6.98 °C from 2000 to June 2005. In general, LST anomalies show a pattern of occurrence in the months of March through July for the three vegetation types distributed in the Sierra Madre Occidental. In the case of the pine forest, which is distributed at 2000 m above sea level, and higher, it was expected that there would be no LST anomalies; however, anomalies were present in all time series for the spring and early summer months. The LST values were validated with in situ data from weather stations using linear regression models. It was found that almost all the values were related, with R2 > 0.60 (p < 0.001). In conclusion, the constant increases in LST throughout the SMO are probably related to the loss of 34% of forest cover due to forest fires, logging, land use changes, and increased forest plantations.

1. Introduction

Land surface temperature (LST) is a key variable in climate, hydrological, ecological, biophysical, and biogeochemical studies [1,2,3]. At the global scale, LST estimates from thermal infrared sensors are a popular choice due to their high accuracy and spatial resolution, particularly in remote and inaccessible areas, where they provide a useful alternative to in situ observations [4,5] and can provide repeated measurements if needed [6] thus enabling effective monitoring of climate-driven changes in multi-temporal studies.
According to the IPCC, high mountain zones are among the regions most affected by climate change [7,8]. Mountains are an important element of the climate system and a key element of the water cycle; changes in climate regimes would have a strong impact on river systems. Some of the key climate variables that put stress on forest ecosystems are changes in precipitation, temperature, and evapotranspiration, and increased frequency of fires and storms [1,8,9,10].
For Mexico, the prediction models of [11] estimate that the ecosystems most susceptible to reduction in their distribution areas due to global warming are temperate forests. Given the relatively rapid rate of climate change and the slowness with which vegetation is able to adapt, there is a large potential for major disturbance of the forest [12]. According to the results obtained from general circulation models (GCMs), outputs corresponding to current climate conditions as well as climate change scenarios, 13% of Mexico’s cold temperate and warm temperate forests would disappear. In contrast, tropical thorn forests, dry and very dry forests with temperatures above 24 °C would tend to increase [13,14].
In Mexico, oak and pine forests are found mainly in mountainous regions with temperate and semi-humid climates [15]. These temperate forests cover 21% of the country. Unfortunately, 25% of the original temperate forest has been converted to agricultural uses, either for crops or for livestock [16].
A mountain range in Mexico that houses temperate and semi-cold, semi-arid and warm-dry ecosystems is the Sierra Madre Occidental (SMO), which is the longest continuous mountain complex in Mexico. Located where the Nearctic and Neotropical ecoregions meet, it extends from near the US border to northern Jalisco state, covering an area of 251,648 km2. Field observations in the Sierra Madre Occidental seem to indicate that the distribution areas of some tree species are indeed being reduced in response to droughts, which directly wipe out peripheral populations or bring them to a state of stress that makes them more susceptible to massive attacks by pests and diseases [16,17].
The aim of this study was to quantify monthly changes in LST of the SMO from 2000 to 2024. We calculated the anomalies by vegetation cover, since this would help us identify broader warming or cooling trends. Following this, we carried out a change detection procedure to spatially identify where the changes in the LST are in the different time series generated for the study period.

2. Materials and Methods

2.1. Study Site

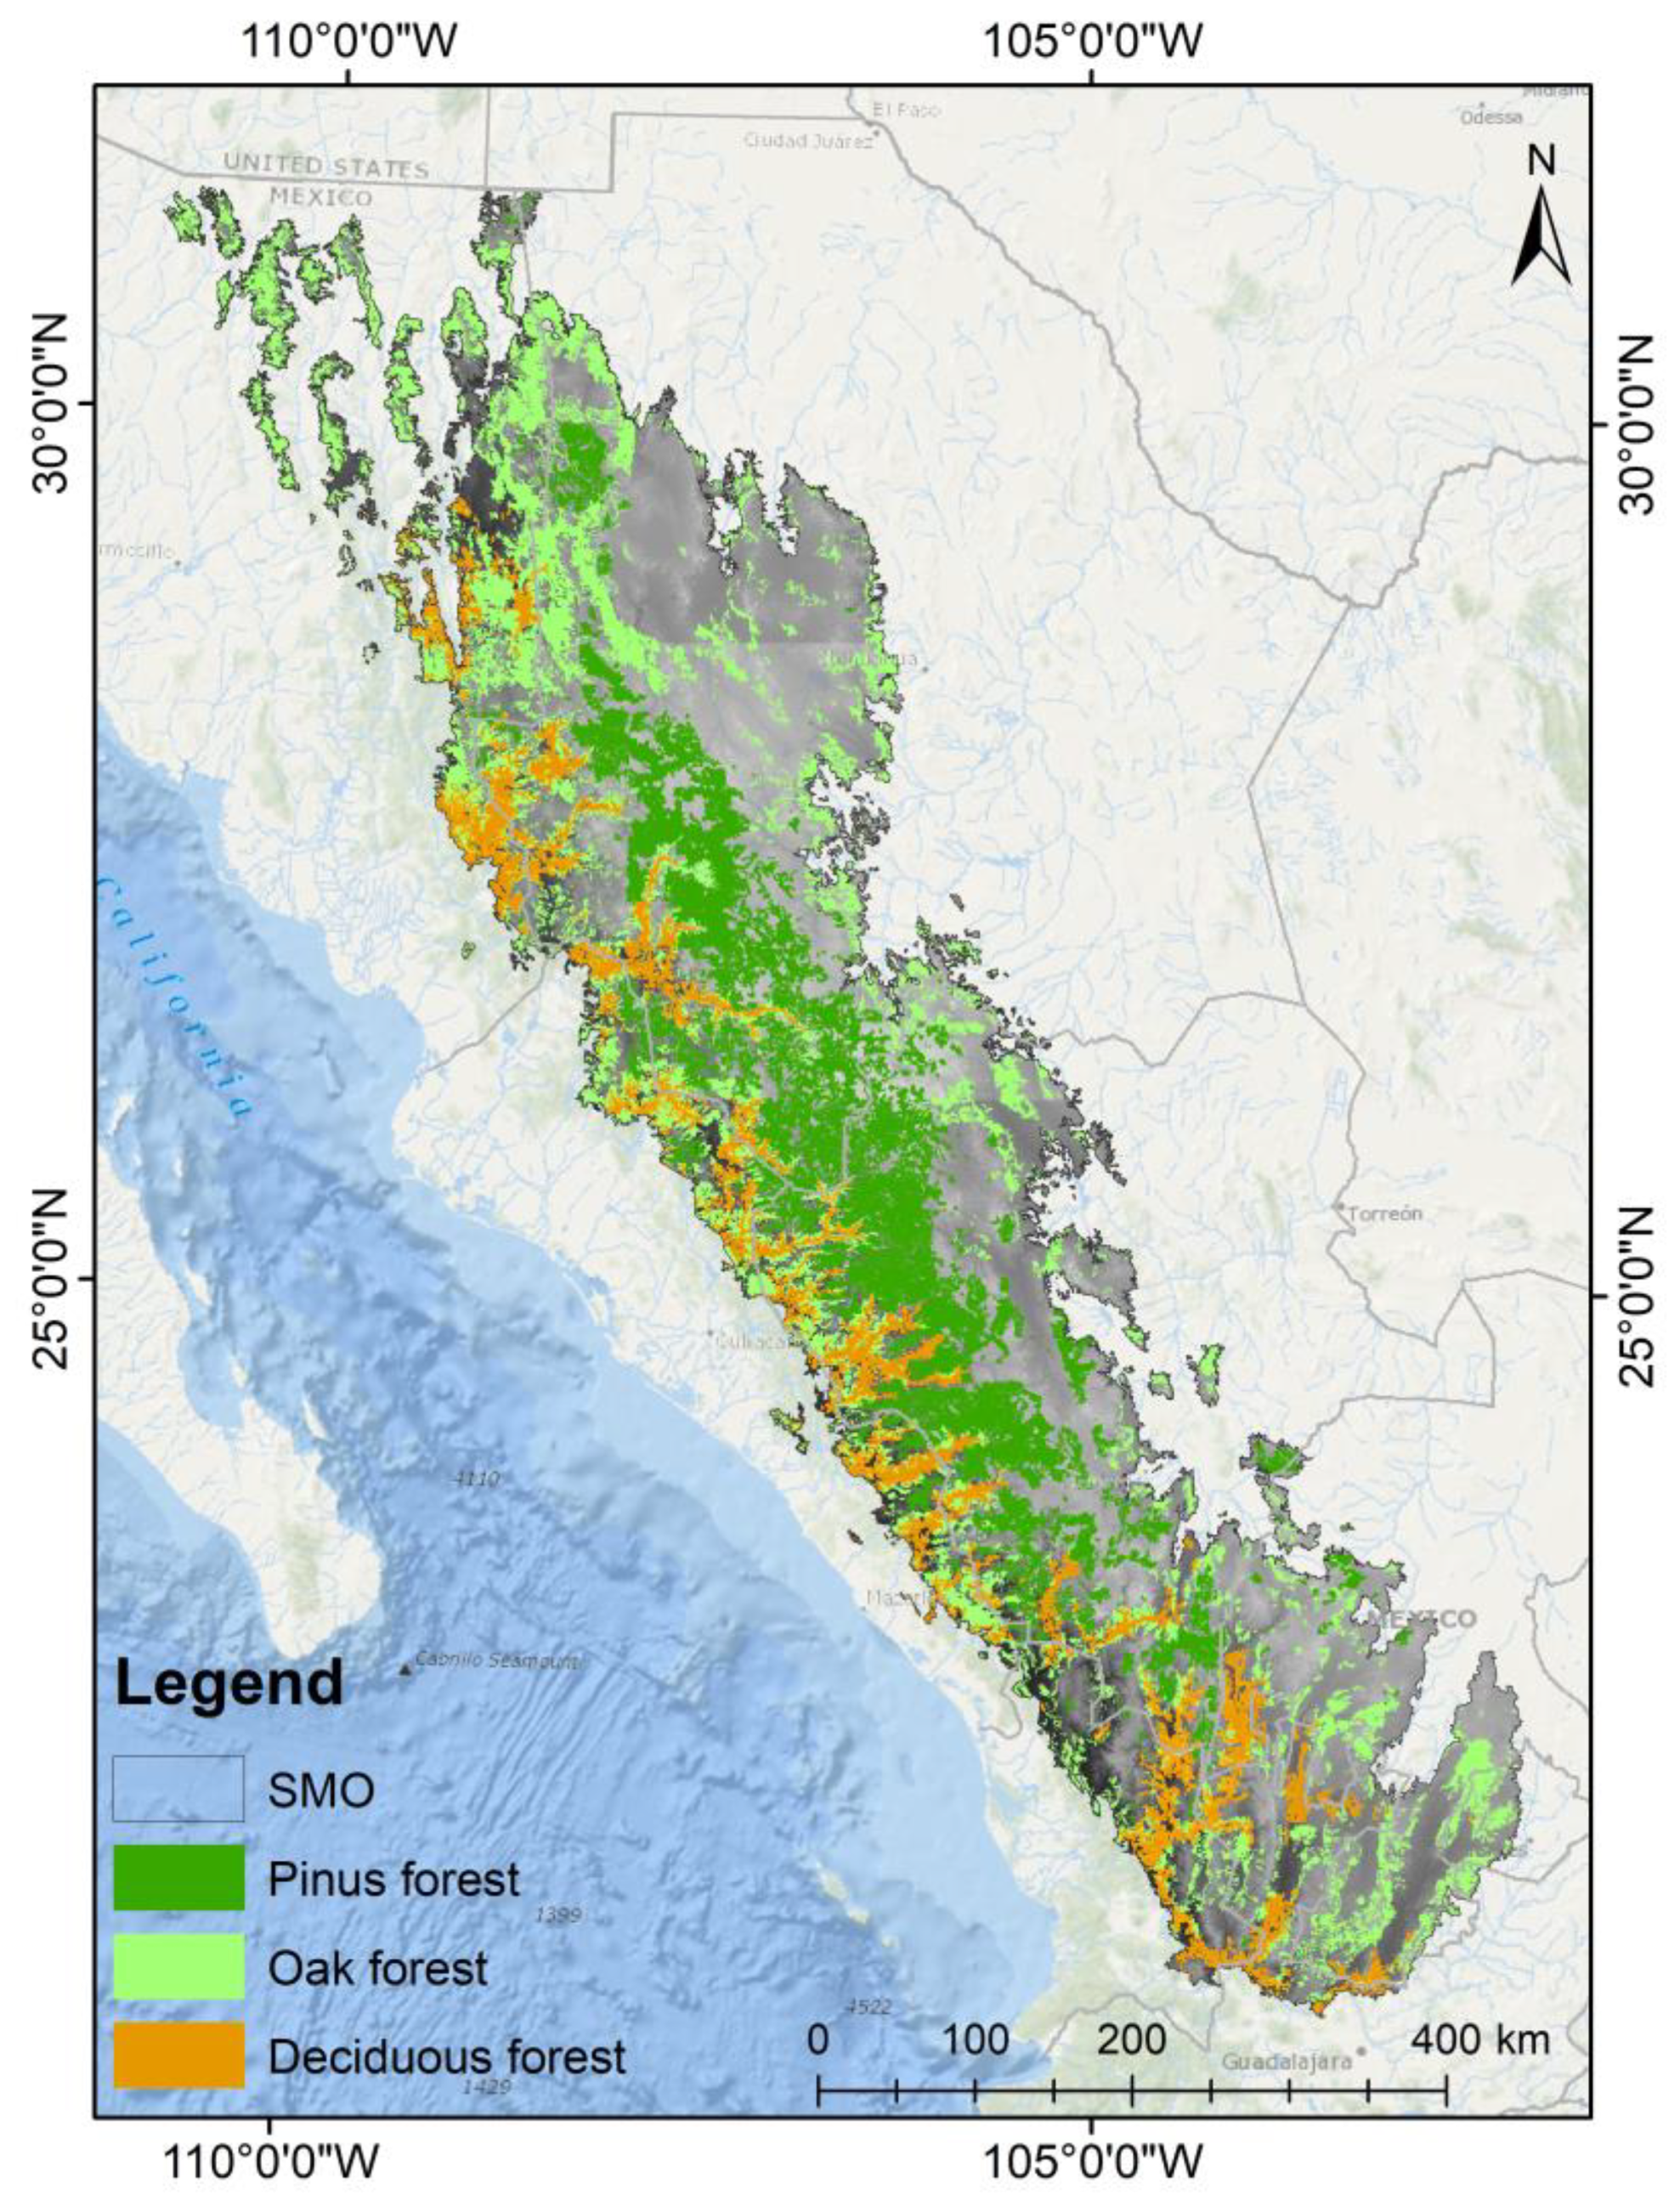
The Sierra Madre Occidental (SMO) is the longest continuous mountain complex in Mexico, covering ~300,000 km2 [17,18] (Figure 1). The elevations of this mountain range vary from 500 m to 3300 m above sea level. Its orography is rugged, with summer rainfall, and temperate climates at elevations above 2000 m. The high vegetative diversity of the SMO is exemplified by the three genera which are physiognomically dominant in the vegetation: 24 species of Pinus (46% of the total number of species of this genus in Mexico), 54 of Quercus (34%) and 7 of Arbutus (100%) [16,17]. Currently, the SMO is of national interest as it is considered the main water reservoir in the north of Mexico; some areas of the Pacific-facing slopes can receive up to 1500 mm of precipitation annually [19].

2.2. Land Surface Temperature (LST) Dataset

Images from the MODIS satellite sensor Terra Moderate Resolution Imaging Spectroradiometer (MODIS) Land Surface Temperature/Emissivity Monthly (MOD11B3) Version 6.1 [20] were used. Each LST&E pixel value in the MOD11B3 is a simple average of all the corresponding values from the MOD11B1 collected during the month. Unique to the MOD11B products are additional day and night LST layers corresponding to the 1 km MOD11_L2 swath product aggregated to the 6 km grid.
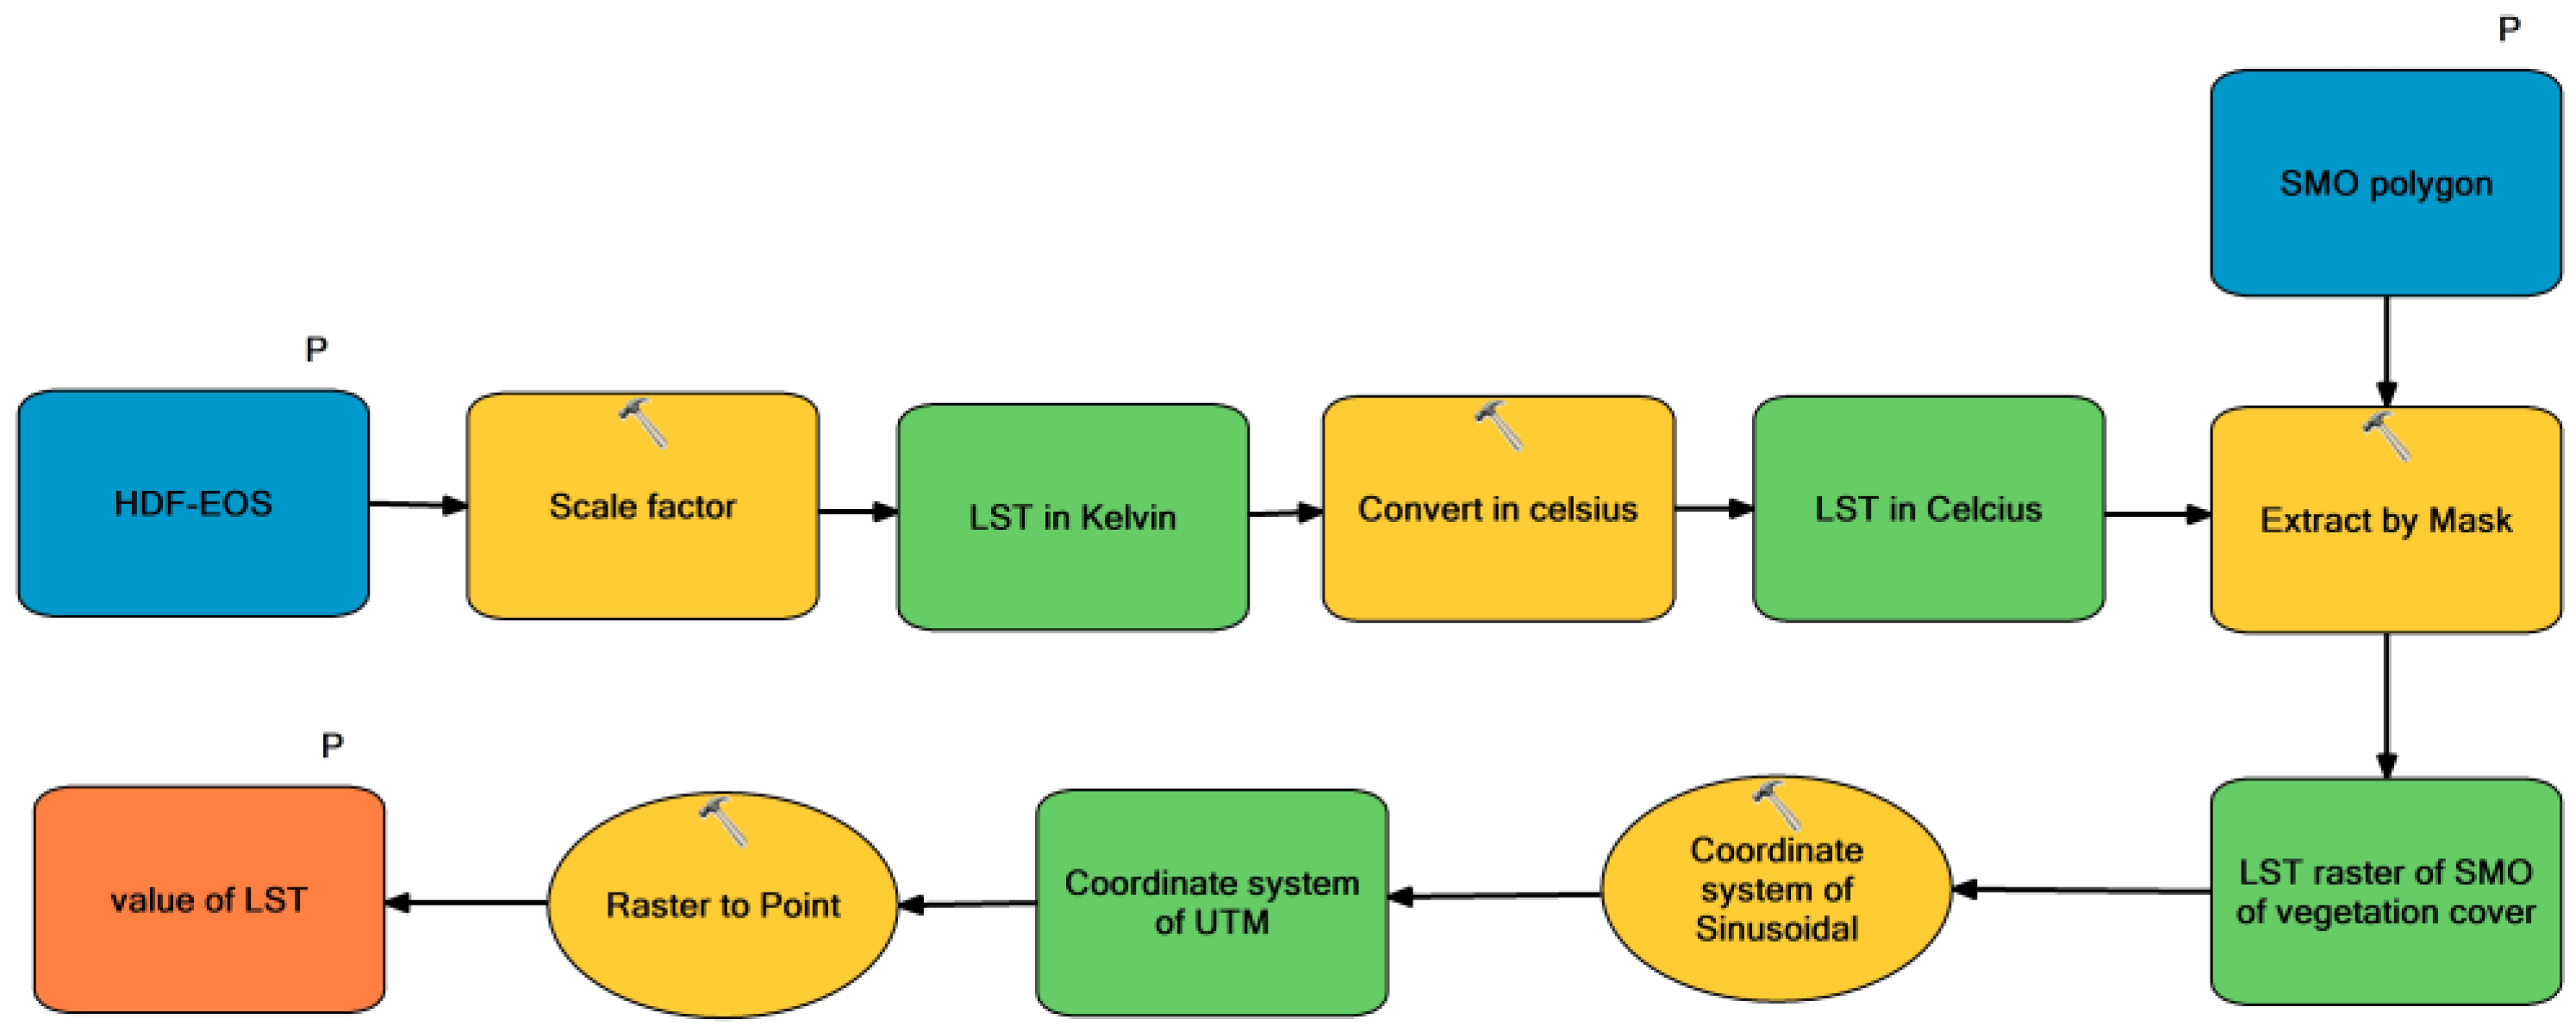
LST values were obtained for the twelve months of the year at five-year intervals from 2000 to 2024, giving a total of 72 MOD11B3 Version 6 images. Before the LST values for the SMO were obtained, a toolbox was designed in ArcGIS 10.8.1 so that four important aspects could be automated by means of the iterators: (1) For each HDF file, the scale factor was multiplied to obtain the raster in K, (2) converted from K to C (Equation (1)), (3) the raster was cropped to the area of interest (SMO) with the Extract by Mask function, and (4) the LST values corresponding to each pixel were obtained with the Raster to Point function (Figure 2):
L S T   i n   C e l s i u s = r a s t e r   o f   L S T   ×   0.02       273.15

2.3. LST Validation

To validate the LST data obtained with the Terra sensor, we followed the analysis of [21], which showed that the in situ temperature observations were consistent with those obtained by MODIS. In this study, maximum monthly average temperature records were obtained for eight weather stations from the official website of the National Weather Service [22]. The criteria for choosing these eight stations were that they were at least 10 km apart and had complete data series available for the study years (2000–2004).
MODIS LST data (acquired between 13h30 and 14h00 for the SMO) were extracted for the coordinates of each weather station using the ArcGIS 10.8.1 multiple point extraction function, producing a table of LST values which were then crosstabulated with the weather station database in order to compare them. To determine whether there was a relationship between the LST obtained via MODIS and the temperatures recorded at the weather stations, linear regressions were fitted separately for each time series. The regressions were evaluated by calculating adjusted R2 and mean squared errors (RMSE), which is a useful error measure for comparing a predicted value with an observed value. The significance of each model was calculated with a value of p < 0.001.

2.4. LST Anomalies

LST anomaly analyses are useful for determining global and regional warming trends, and also for identifying areas affected by heat waves or droughts. A useful method for analyzing variations over time is to determine the deviations of a pixel’s value for a given period and the average of the historical series for the same pixel. The following equation was used to detect anomalies independently for the years 2000, 2005, 2010, 2015, 2020 and 2024:
L S T i =   L S T i   L S T   · 100
where LSTi indicates the index value corresponding to period i and LST is the average value for that period [23,24,25]. The estimate is multiplied by 100 to give the percentage deviation of each pixel from the annual average; pixel values greater than 100 are considered anomalous LST values [25]. This procedure was carried out using the raster calculator function in ArcGIS. With the calculated LST anomalies, rasters were analyzed in the three types of vegetation cover that predominate in the SMO and represent different environmental gradients. Data are freely provided by the land use series VII map at [26]. The first was the pine forest, which is distributed at elevations above 2000 m [17] where the lowest temperatures in the SMO occur. The mean annual temperature is 9–12 °C, and the temperature of the coldest month is 3.8–7.3 °C [27]. The second vegetation cover was oak forest, which is distributed in low hills from 340 m up to 2900 m. The climates where this type of vegetation predominates are very diverse, from temperate sub-humid, semi-warm sub-humid to semi-dry temperate, with average annual temperatures of 12 to more than 18 °C. The third cover is low deciduous forest, which is distributed in low-lying areas, ravines, and gullies in the west of the SMO, at elevations from 200 to 2000 m. The predominant climates are warm climates, although there are also semi-dry climates, with an average annual temperature >20 °C [17]. The results were exported as a database to create box-and-whisker plots that compare variations in LST by vegetation type. This analysis was carried out in the MATLAB 2024a platform.

2.5. Change Detection of LST in the SMO

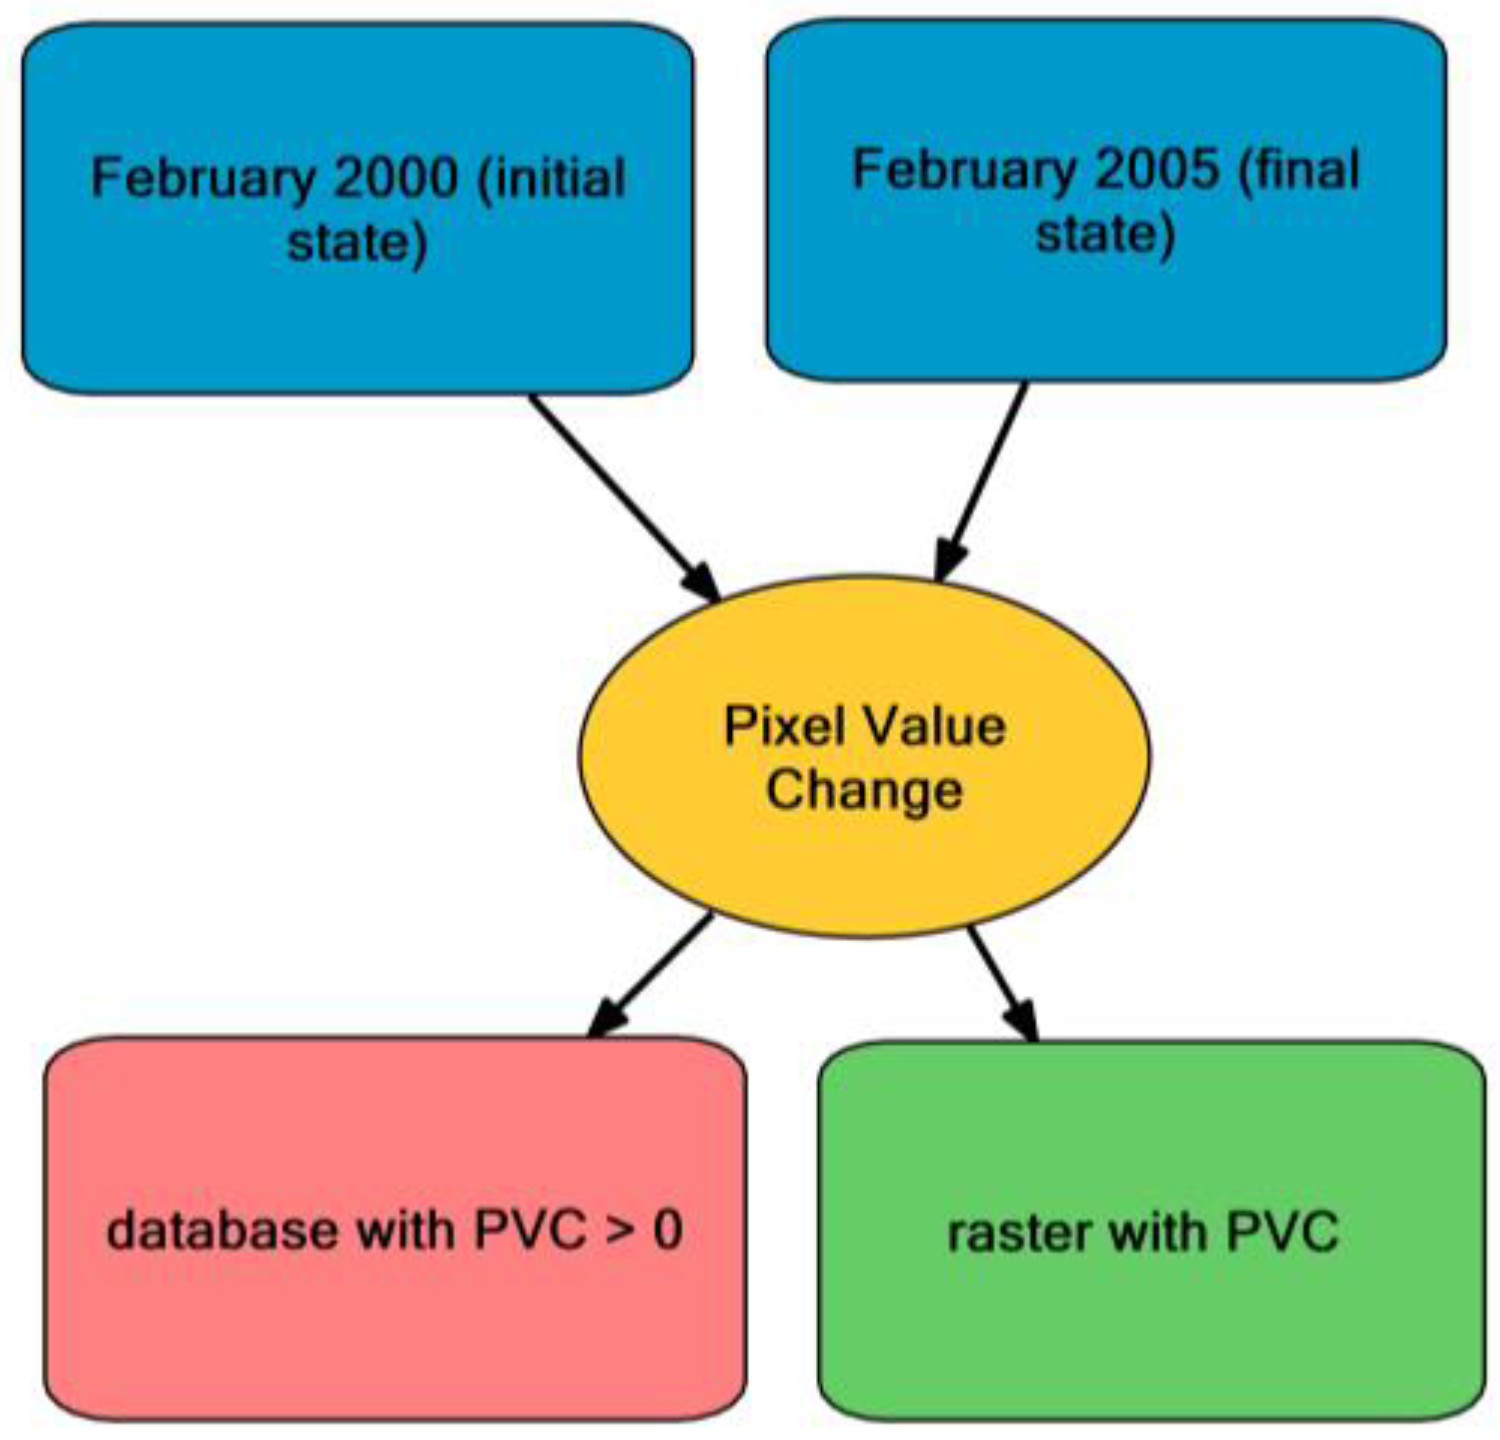
To identify increases in LST values in the different time series, the pixel value change (PVC) method was employed, using the change detection wizard in ArcGIS Pro 3.3.4. To begin this process, the images of the initial state were first designated (Figure 3). These were the images from every month of 2000, except the January series. Since there were no January images available for 2000, the images from January 2005 were used as the initial images for that month. We then analyzed each month separately across the study years; that is, the February 2000 LST raster versus February 2005, 2010, 2015, 2020, 2024. This process was repeated for each of the 12 months. The PVC tool used Equation (3), where Dx (k, i, j) is the resulting difference; X (k, i, j, T1) is the pixel value in row i, column j, and band k at time T1; X (k, i, j, T2) is the value of the same pixel at time T2. If the difference is 0, it indicates that there has been no change, while if the difference is positive, a change has occurred [28]:
D x k   i j   =   X i j   k   T 2   X i j   k   T 1
In order to determine whether the change patterns are correlated, a Pearson correlation matrix analysis was carried out. This analyzes all the rasters as a data matrix with the ArcGIS SDMtoolbox, which is based on Python 2.7.18 [29] and calculates matrix correlations within a time series; for example, all the January data from 2000 to 2004.

3. Results

3.1. LST

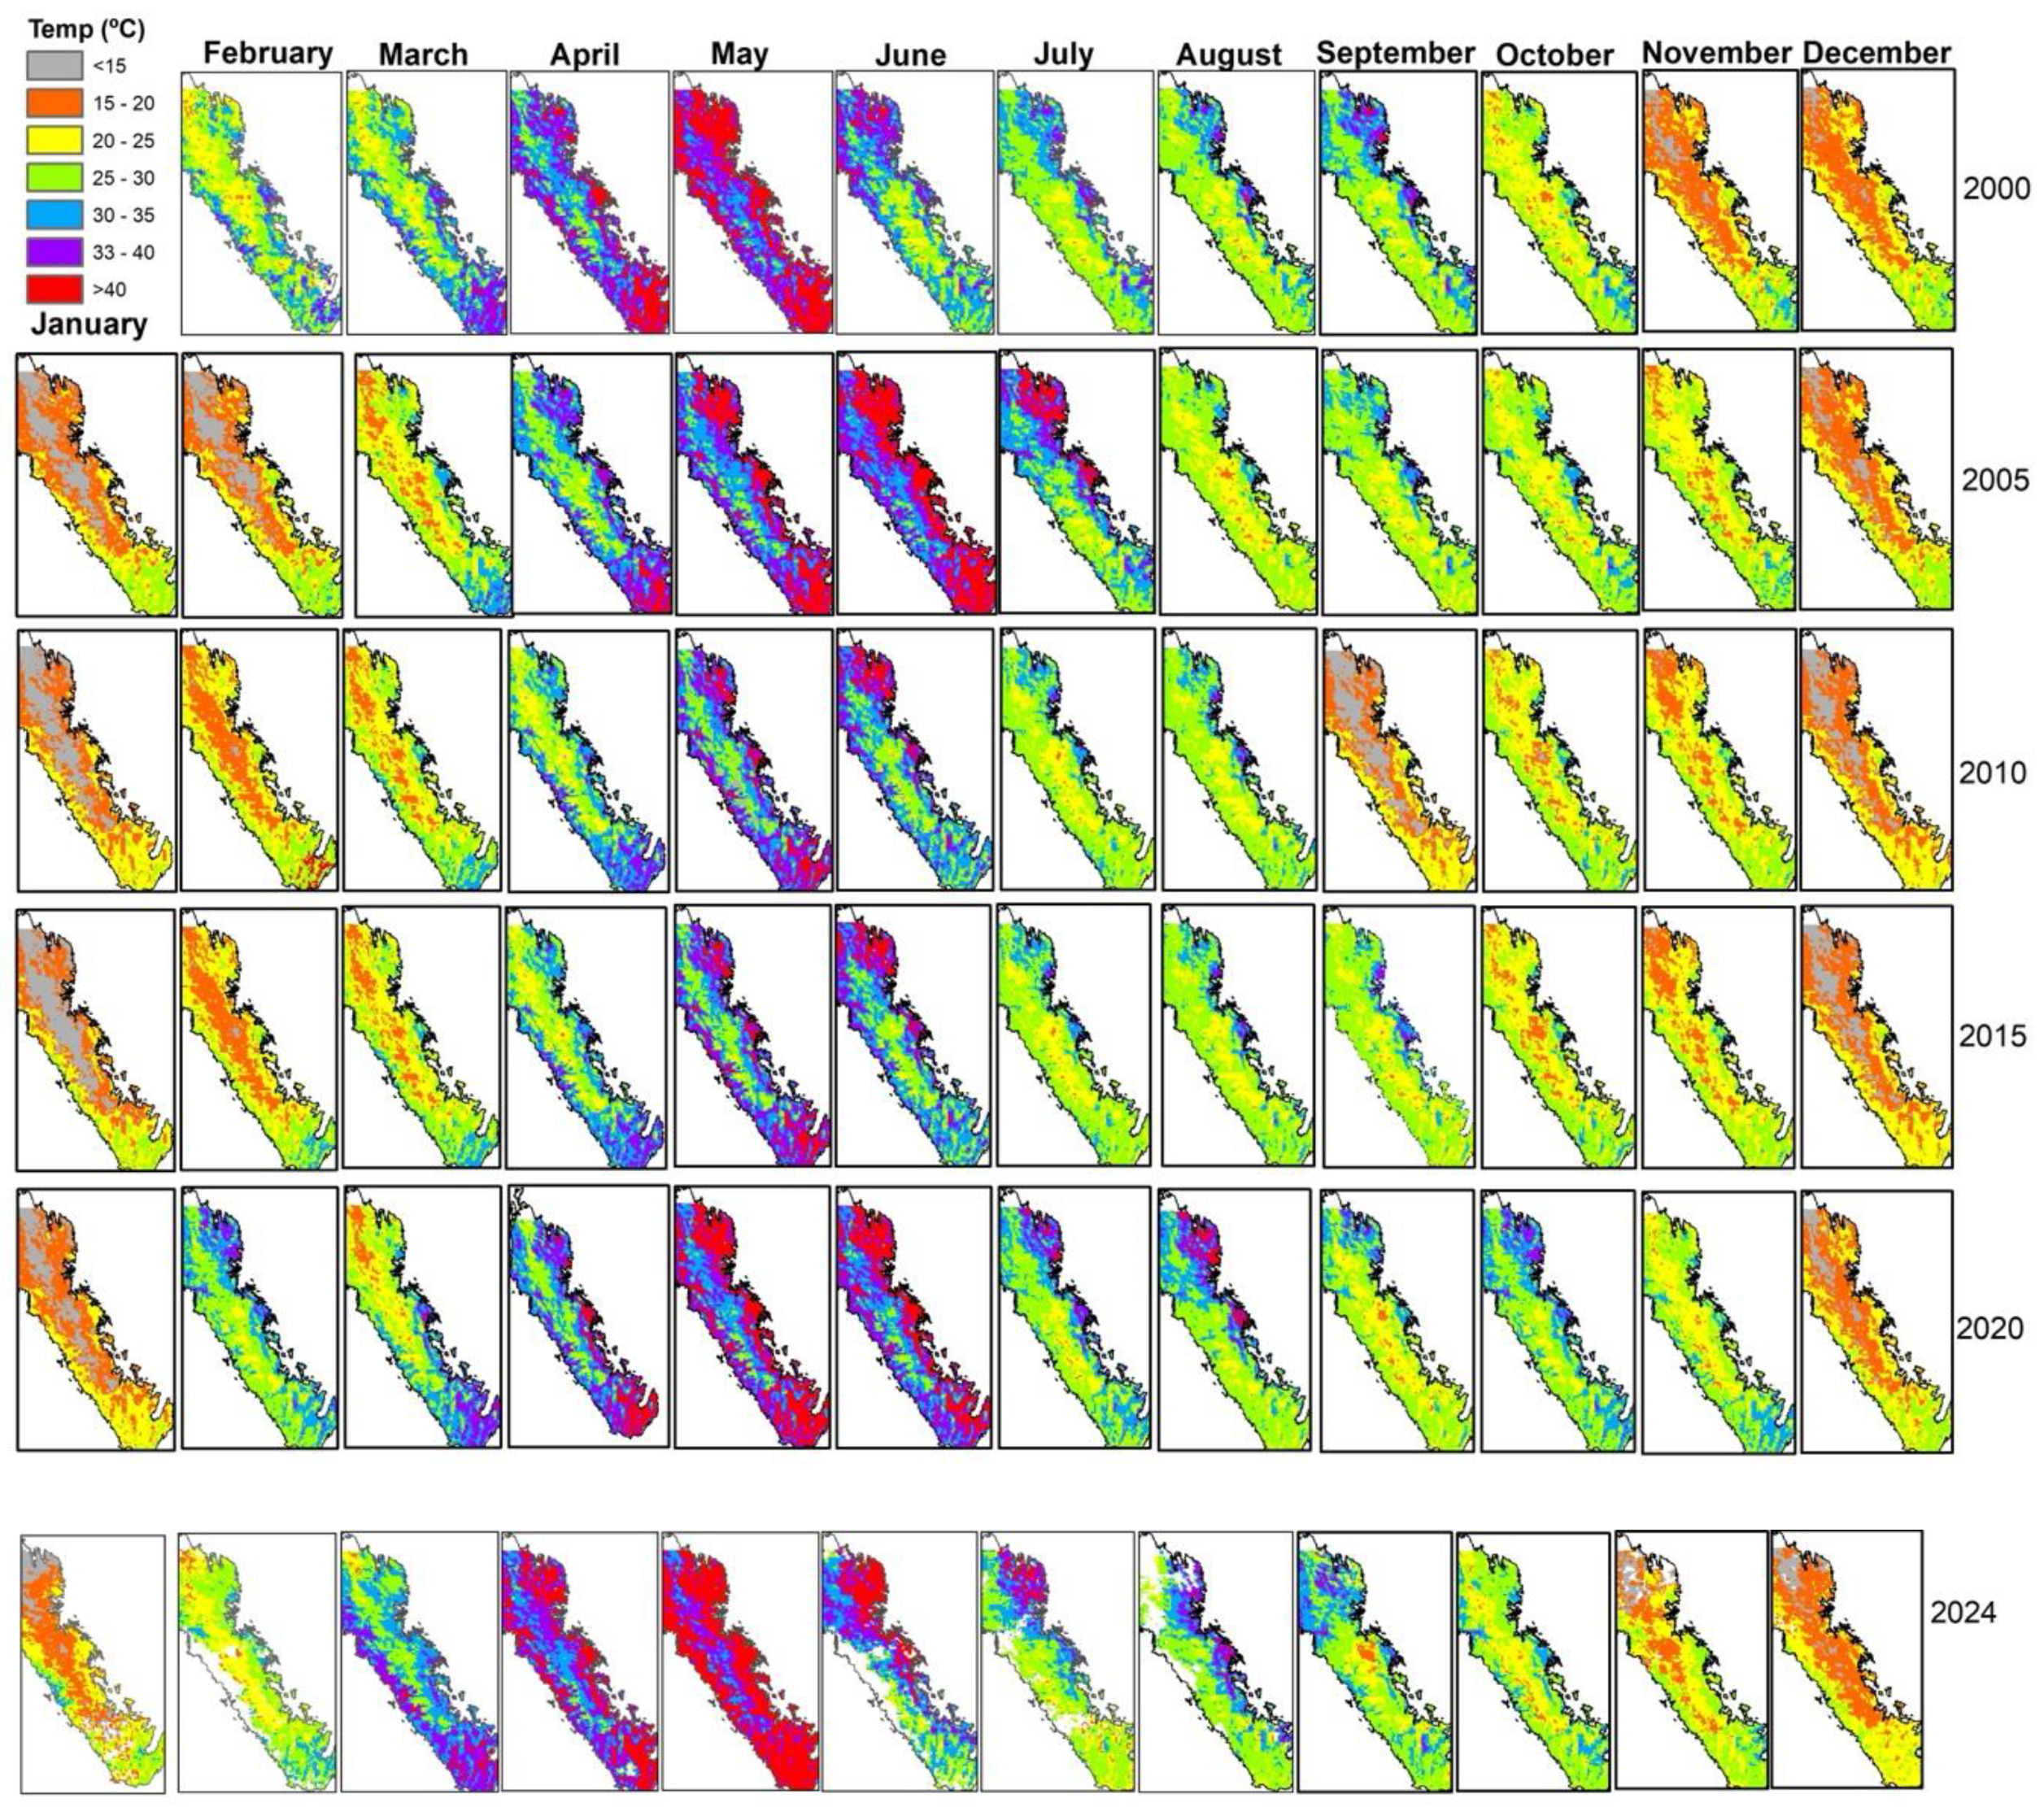
The lowest LST values occurred in the months of December and January (between 20 and 25 °C), while values < 30 °C occurred in January to March for the series of all years. The highest LST values (>40 °C) occurred in the driest months in the SMO, which are April, May, and June. May 2024 was the single month whose pixels had the highest LST values, reaching 52 °C. Compared to the same month in 2000 (maximum LST = 49.93 °C), this gave an increase of 2.46 °C in LST. In general, the areas of the SMO with elevations below 2000 m above sea level show more changes in LST across the study years (Figure 4 and Figure 5).
It was found that the months with the highest temperatures were mainly May, June, and July. The coldest months were December and January, with temperatures below 30 °C, except for 2024. It was found that between 60 and 93% of pixels had temperatures above 35 °C during April, May, and June; in April 2020, 13% of pixels had temperatures above 40 °C, but by 2024, 37% of pixels had temperatures above this point. In May 2020, 42% of the pixels were above 40 °C, but by 2024, 71% of pixels had temperatures above this point (Figure 4 and Figure 5).

3.2. LST vs. In Situ Temperature

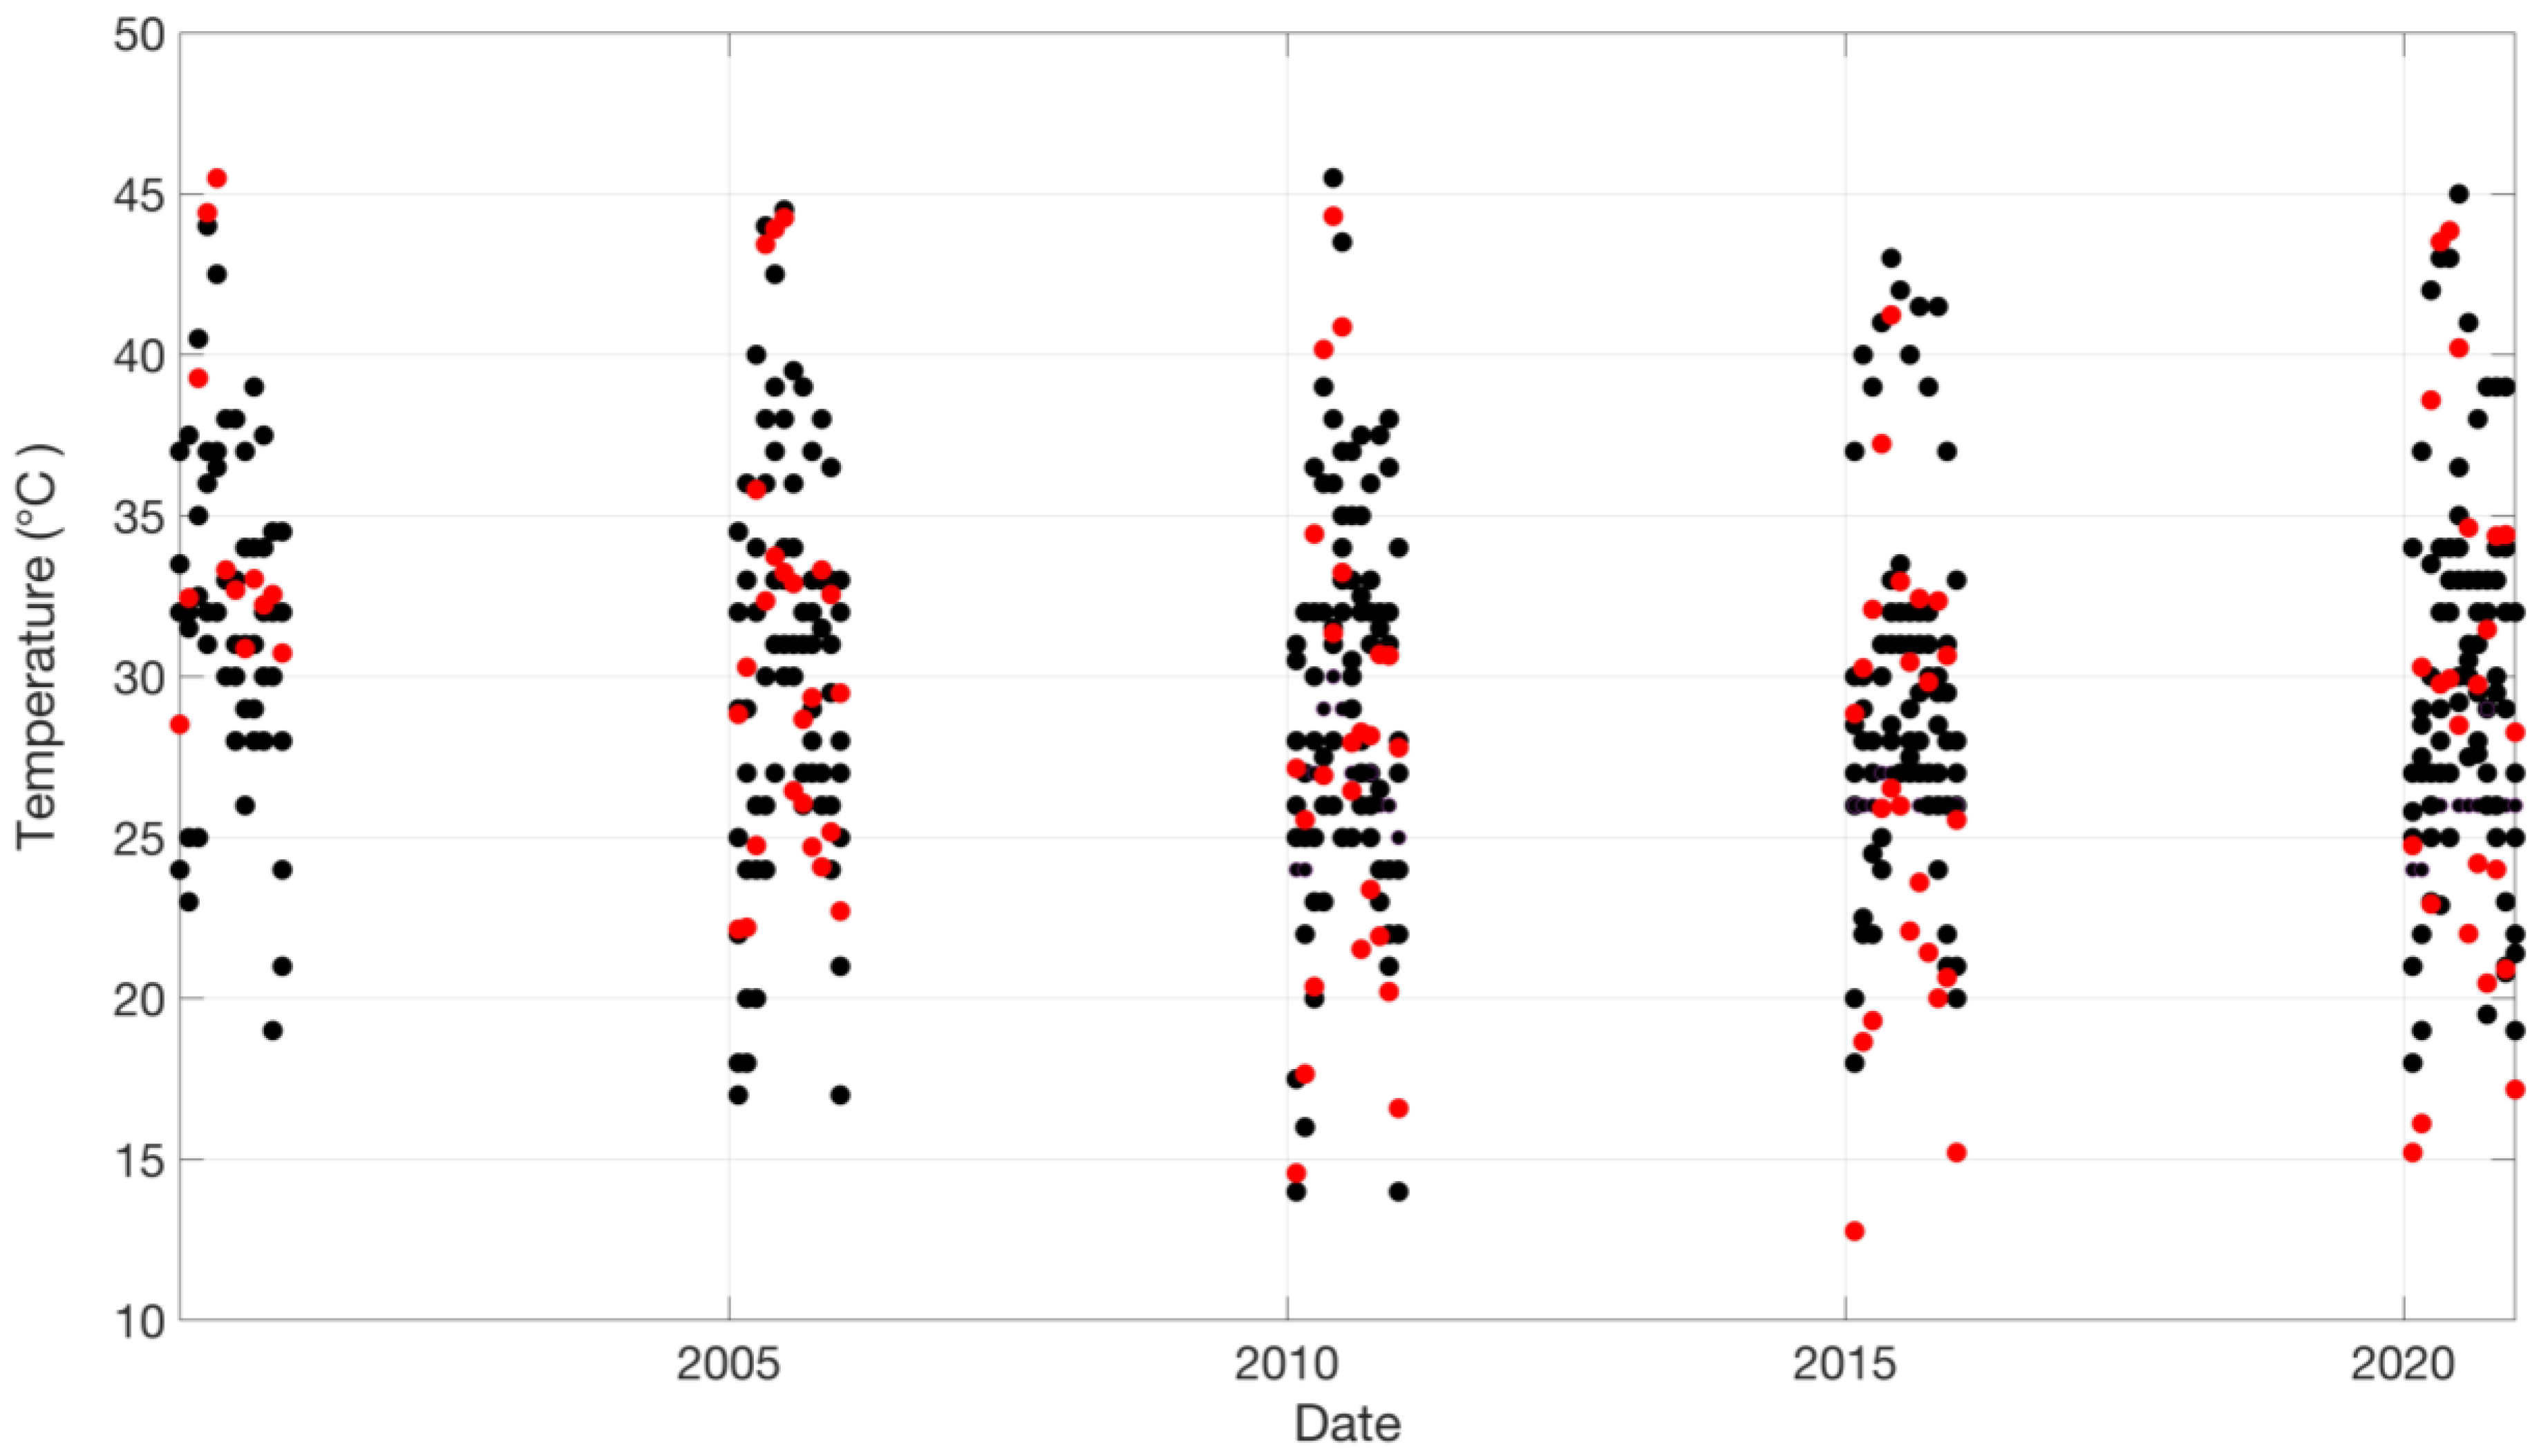
Thirty-seven linear regression models were obtained, of which 31 were significant, with R2 values greater than 0.6; that is, for the majority of cases, a positive relationship was found between LST and the weather stations for all time series (Figure 6, Table 1). Figure 6 shows that for 2010, some weather stations reported a higher temperature (>45 °C) than the LST, which remained below 45 °C. For 2015 and 2020, the lowest temperature values were reported for LST, with values below 16 degrees, while the temperature recorded by the weather stations was 3 degrees higher than the LST. The RMSE values for the significant regressions were the lowest, indicating that these models had a better fit, while the R2 values for the non-significant regressions were all negative (Table 1).

3.3. Anomalies by Vegetation Coverage

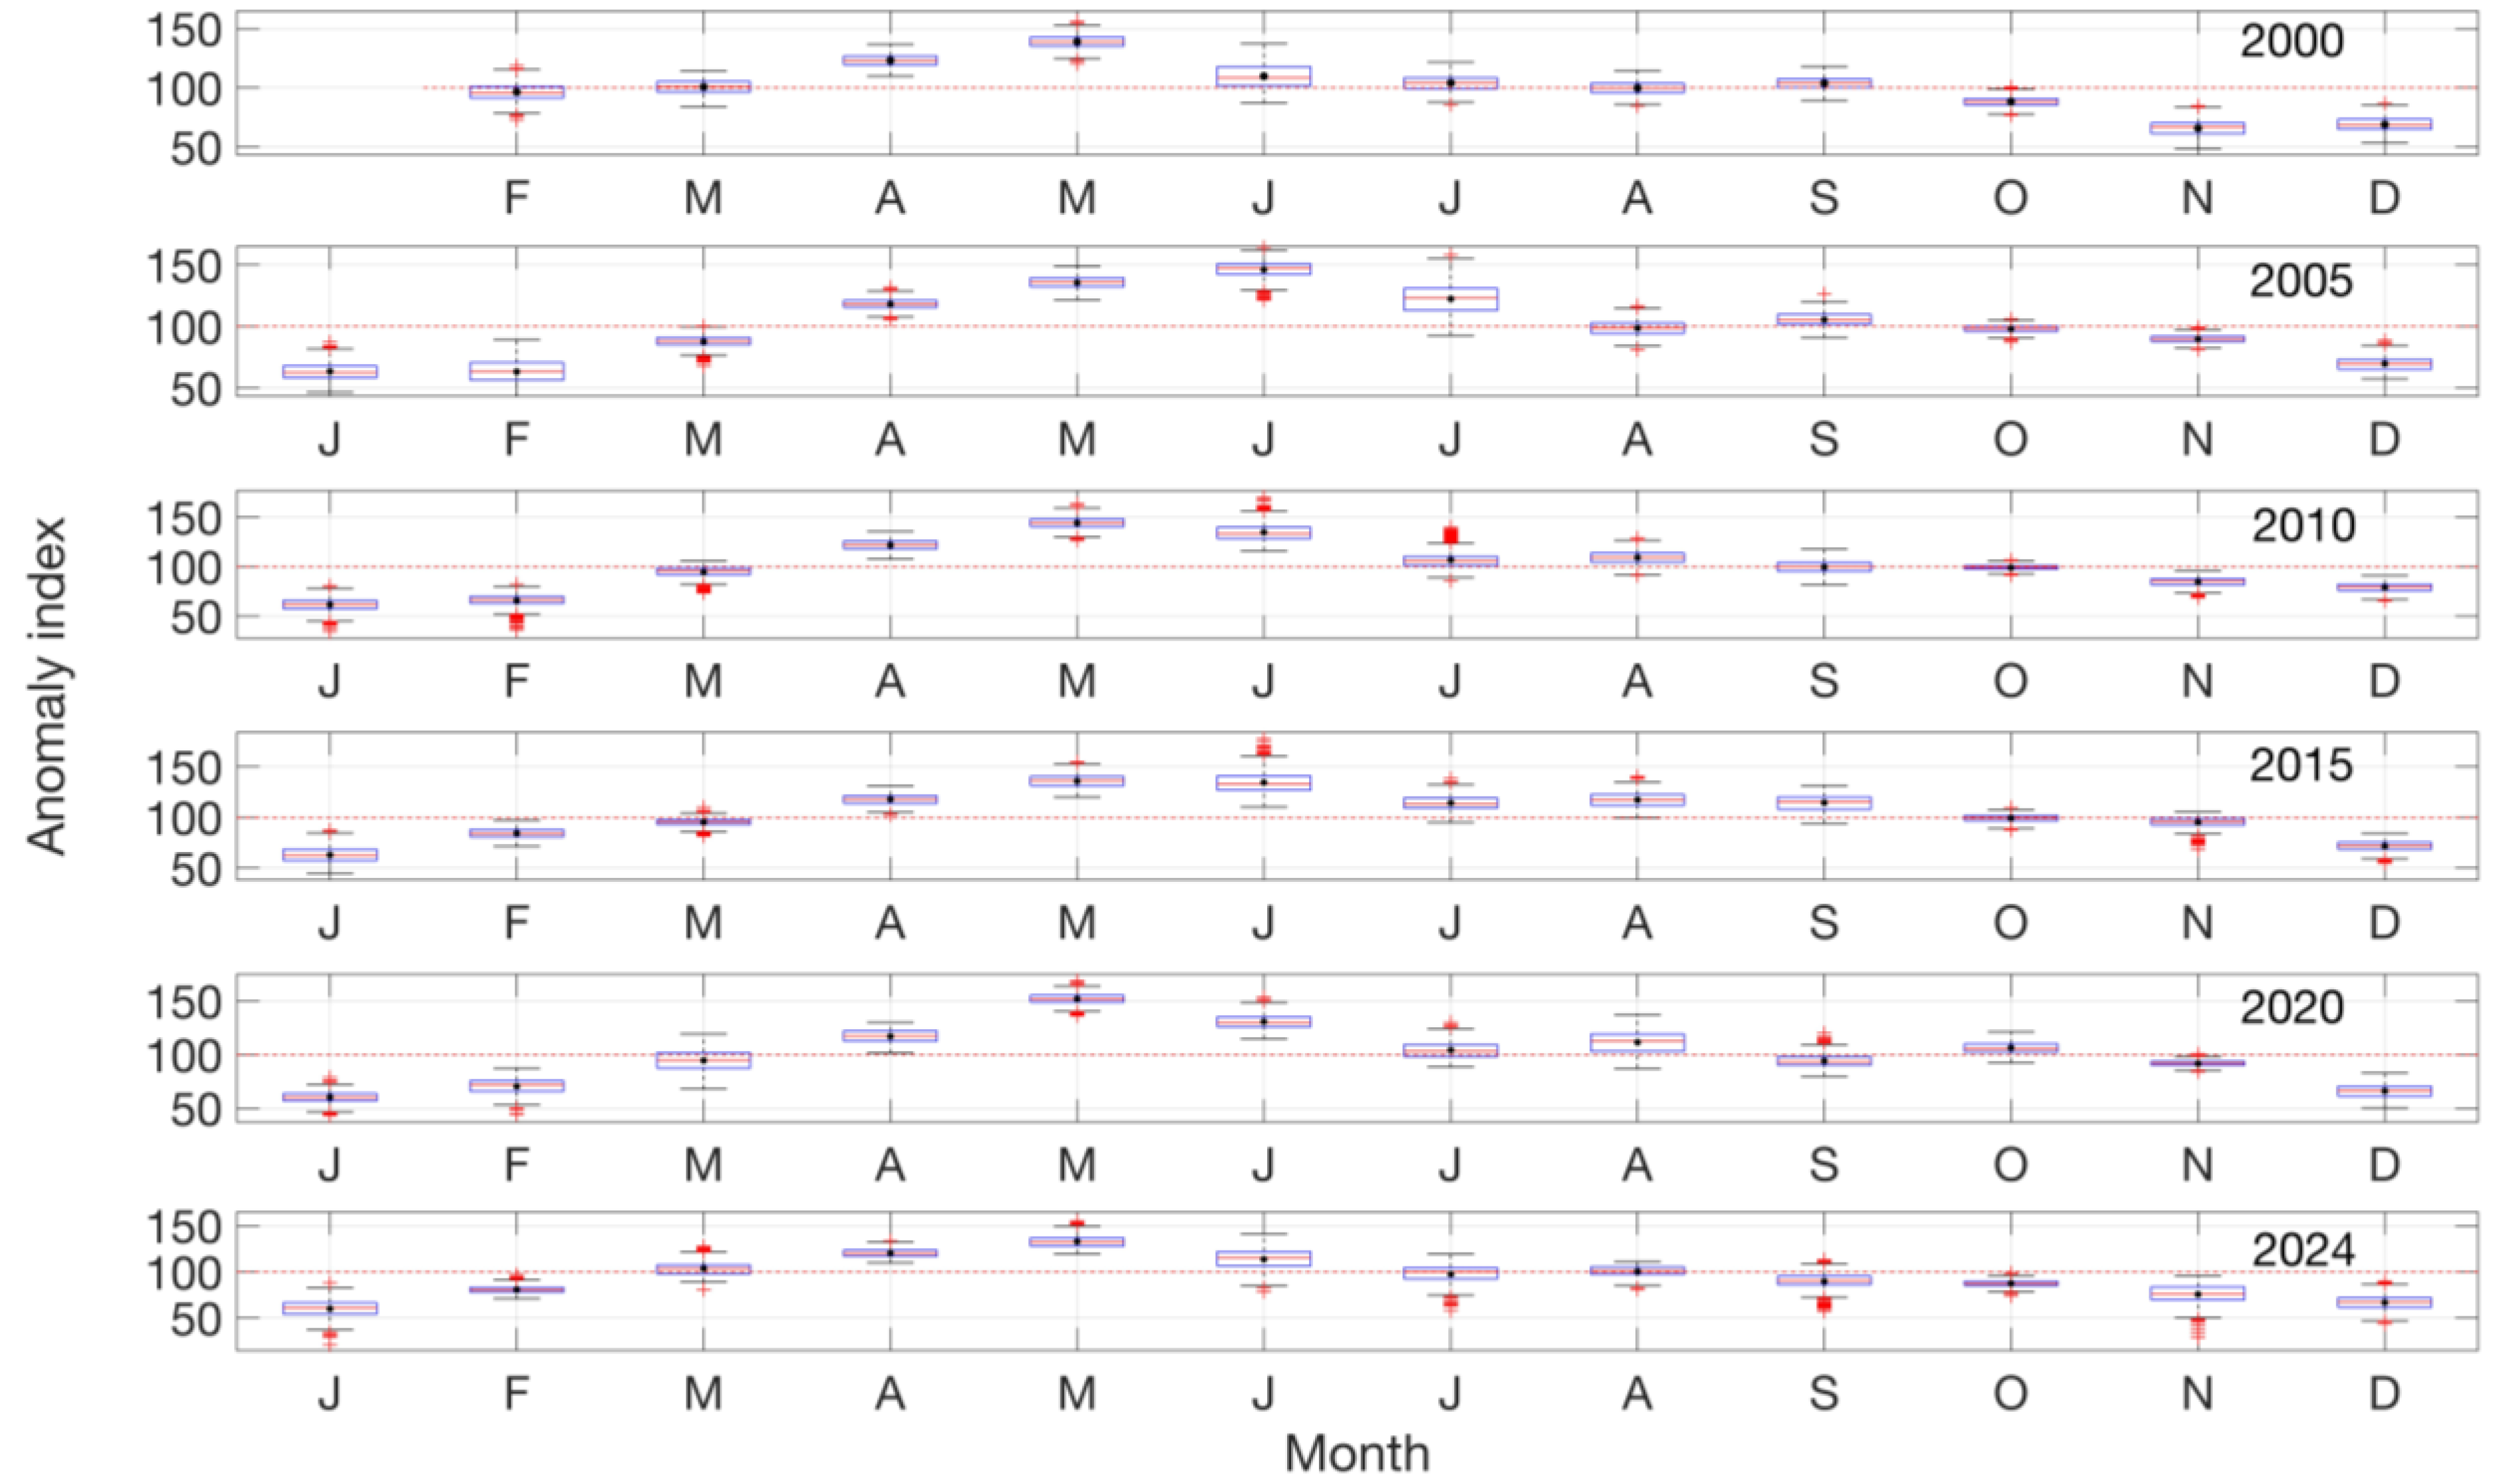
In the pine forest (Figure 7), which is located above 2000 m, the months with LST anomalies were essentially from March to October, the largest anomalies being in April and May with values of L S T > 130, and the month with the highest anomaly value was July 2015 L S T = 177.21), with maximum temperatures of 32 °C (Figure 8).
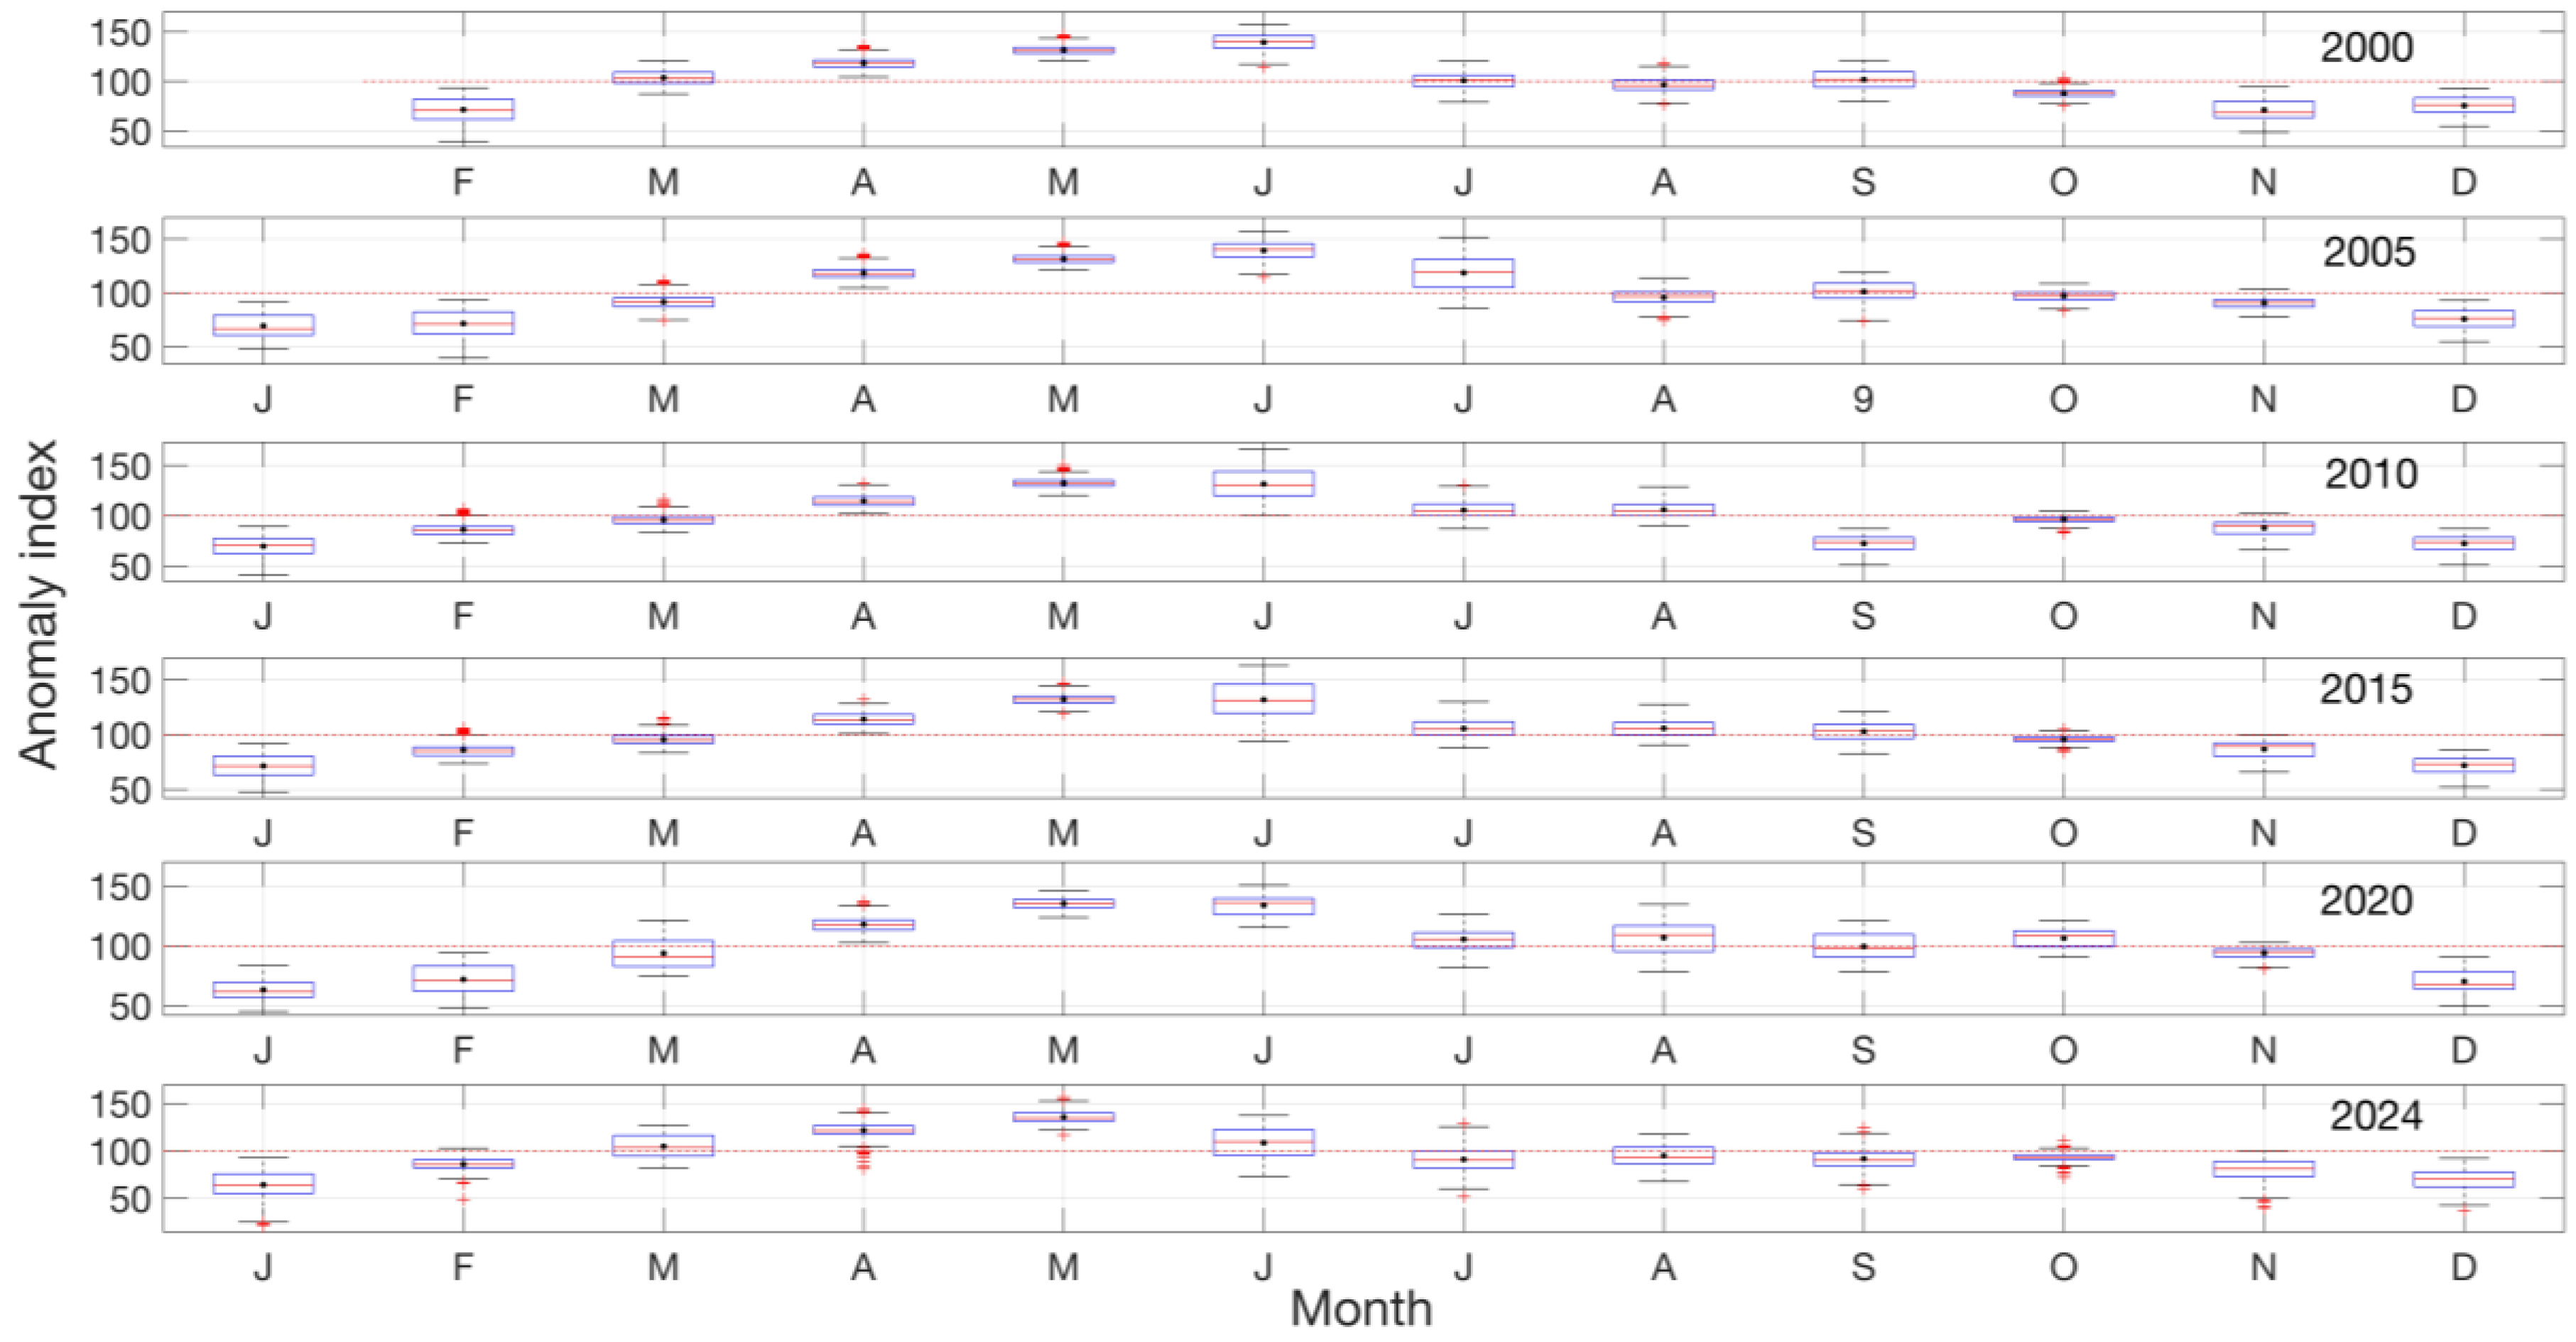
In the oak forest (Figure 7), the months with LST anomalies for all series begin in March and continue up to July, with maximum values of L S T up to 150, which was observed with maximum temperatures as high as 35 °C (Figure 6). small value of L S T (100) that barely indicates the presence of any LST anomalies (Figure 9).
The pattern of anomalies detected in pine and oak forests also occurred in deciduous forests (Figure 7), where the maximum anomalies begin in March and continue to increase until May, and it is not until June that LST anomalies decrease, with the exception of the 2024 series where there are practically no anomalies in June. A phenomenon of anomalies with small L S T   values of 110 to 120 occurred in the months of September and October for the series from 2005 onward (Figure 10).

3.4. Change Detection

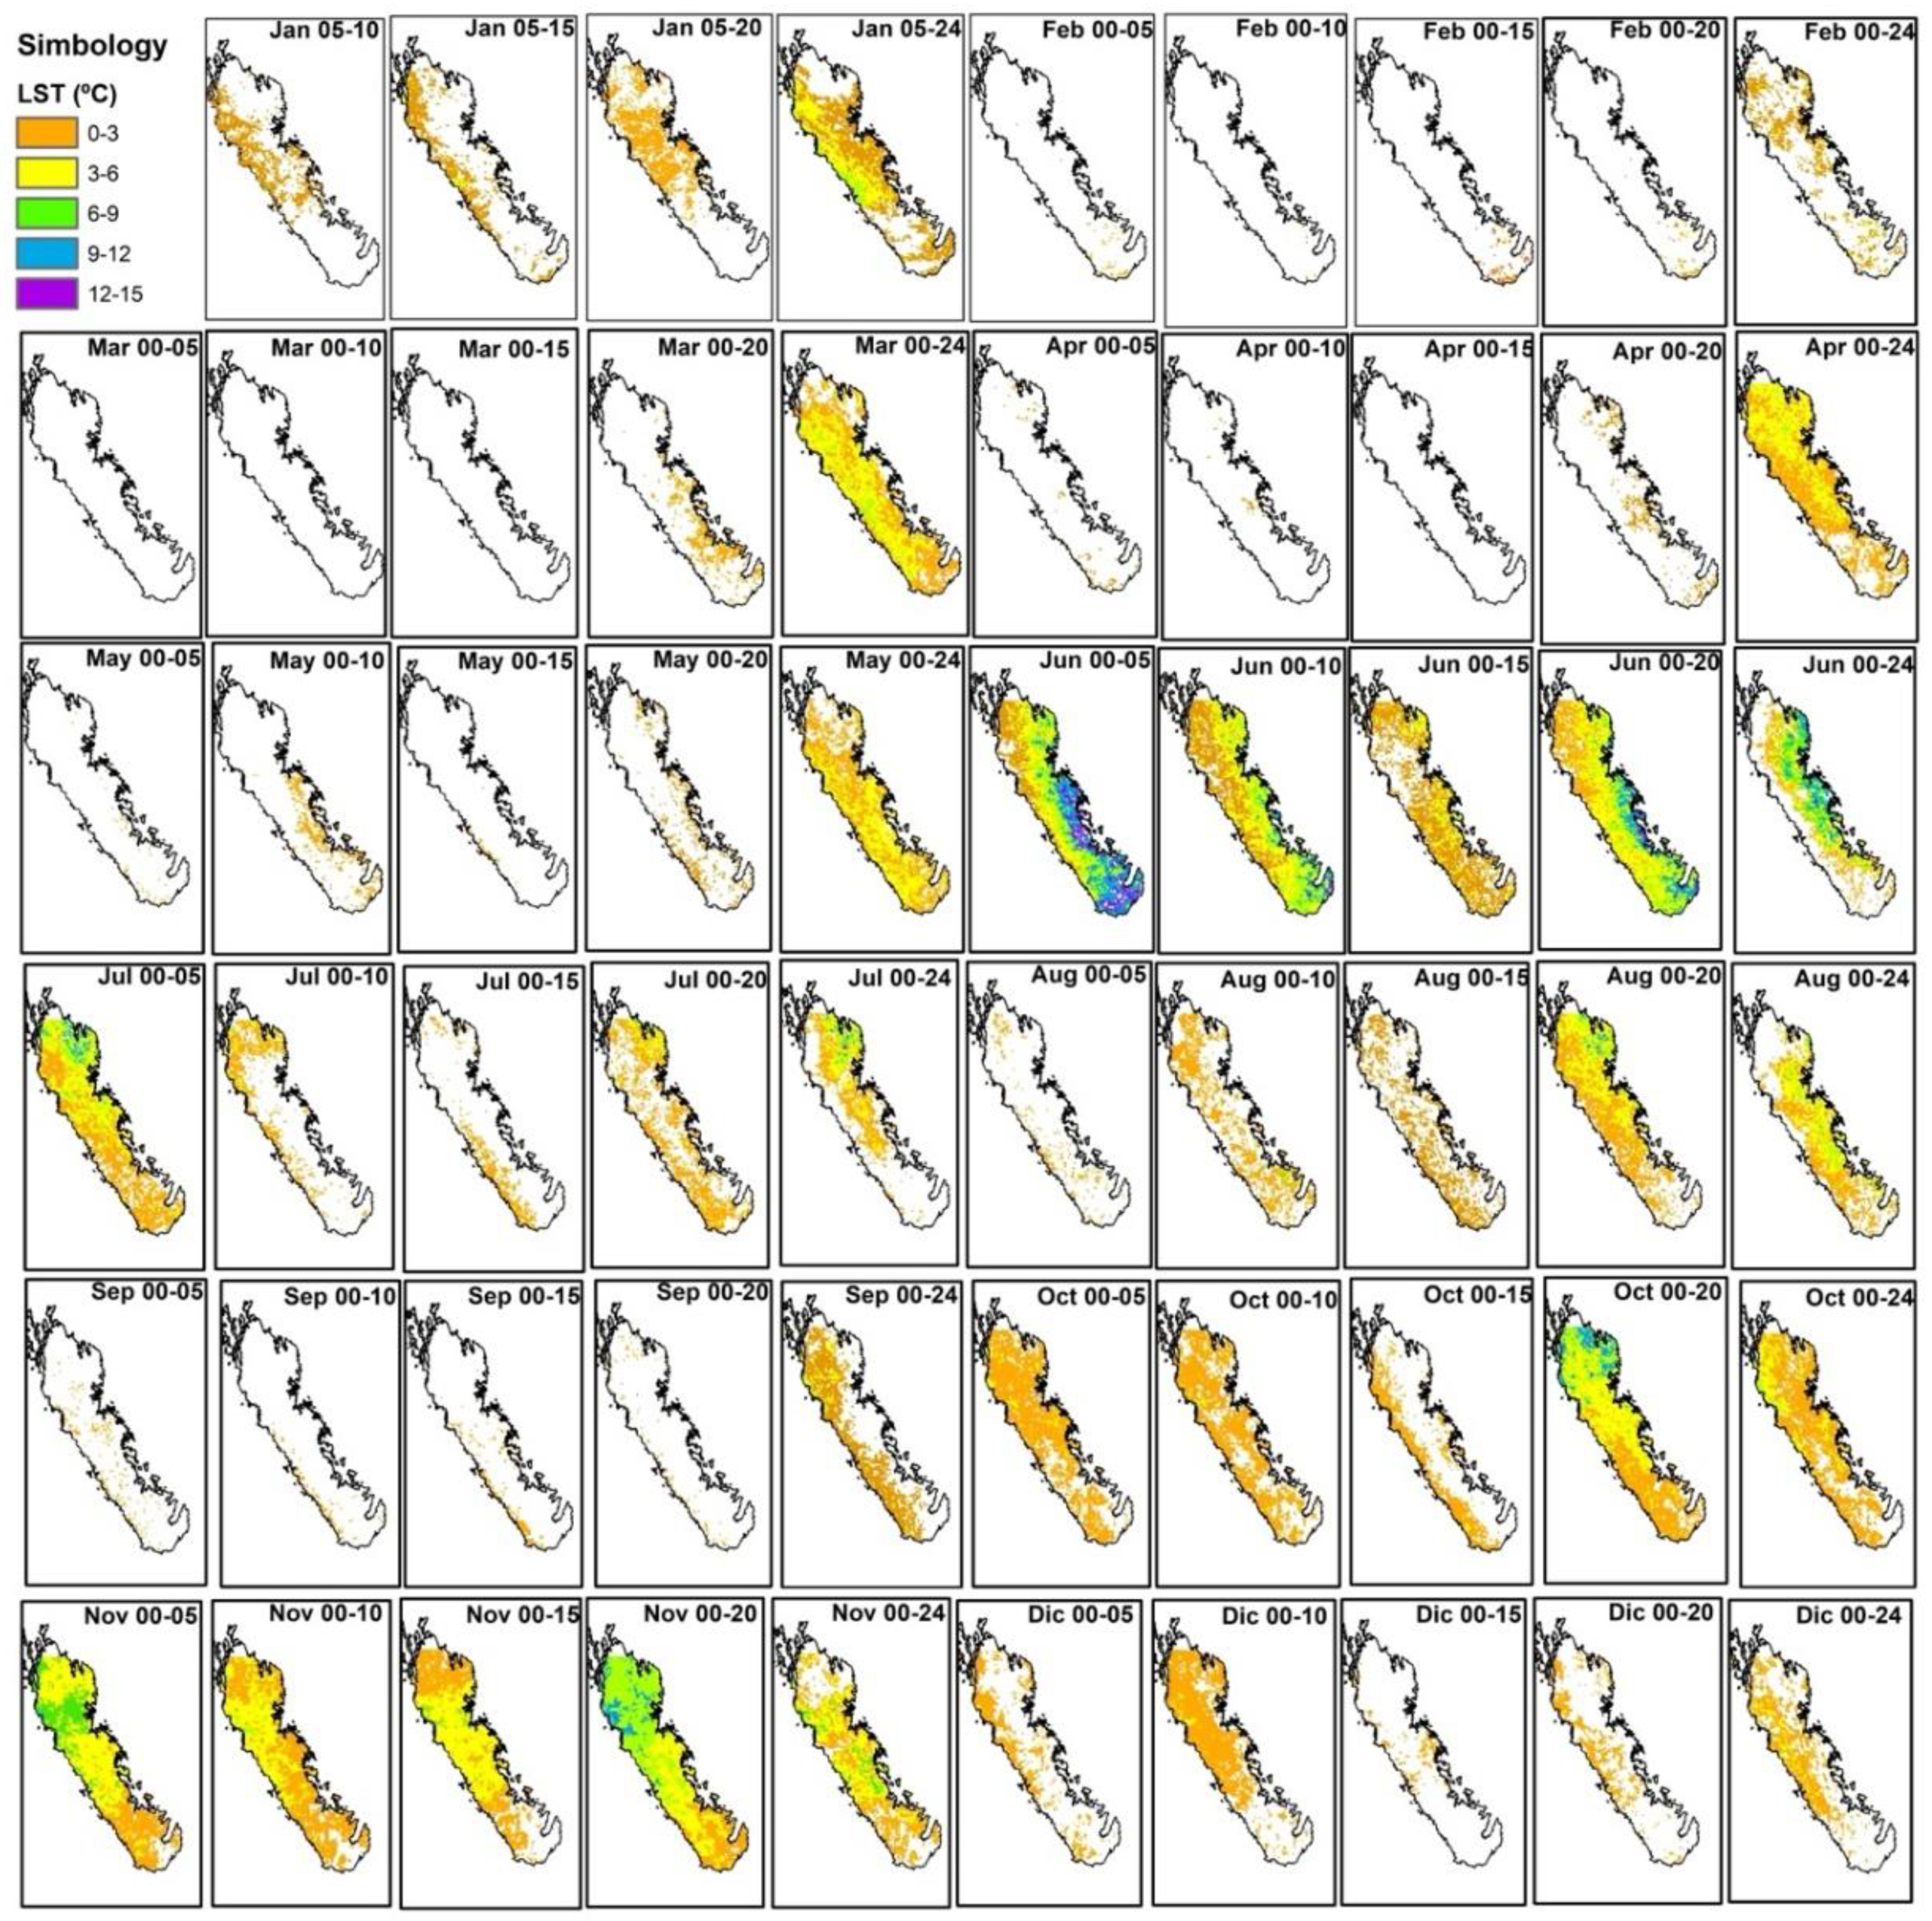
Average temperature increases in January from 2005 to 2020 did not exceed 2 °C of LST. It was not until January 2024 that LST exceeded 2 °C on average, which occurred on the western slope of the LST, where low deciduous forest is distributed. Some pixels had up to 6 °C of LST increase. In February, for practically all series, few pixels (<100) showed LST increases, and the average increase was less than 2 °C. However, in the February 2024 series, increases in LST values were detected in 1110 pixels. The average increase was 1.50 °C. For March 2000 to 2015, no increase in LST was detected throughout the SMO, but for March 2020 and 2024, increases in LST averaging 1.03 °C to 3.25 °C were identified. For March 2024, temperatures increased in nearly all pixels in the SMO (Figure 11, Table 1).
In March and April, LST values barely changed in the 2005, 2010 and 2015 series; however, in the 2020 and 2024 series, the LST values increased on average from 0.59 °C to as high as 3.25 °C in the March 2024 series. Starting in May, LST increases occurred steadily; for example, in the 2005 series, the average LST increase was 0.16 °C and by 2024, it had reached 2.81 °C. The month with the most marked increases in LST was June. At the beginning of the series (2005), June had the highest LST values with an average of 6.98 °C, which then decreased to an average of 2.2 °C for the 2005 series, and increased again to an average of 5.12 °C in 2024 (Figure 8; Table 1).
From September onward, the increases for all series were very low compared to the previous months; the average increase in LST did not exceed 2 °C, except for October, when the average LST was 4.41 °C. Although the LST increases were smaller, they were detected for nearly the entire SMO, and the month of November stood out with an LST change that varied among series by up to 2 °C; in fact, the 2020 series had one of the highest averages of all months and series, with an average LST of 5.86, which also remained high for December 2020, where an average of 5.48 °C was detected (Figure 11, Table 2).

4. Discussion

It is vital to identify LST anomalies because this enables the prediction of extreme events such as droughts, fires, and heat waves [30]. In mountainous regions of North America such as the Sierra Madre Occidental, increases in LST have been linked to climate events such as El Niño, La Niña, and the North Atlantic climate oscillation, which have been reflected in an LST increase of 0.02 °C year between 2002 and 2018, and even with extreme variations of up to 6 degrees in the western and cold regions [31]. In mountainous regions, the heterogeneity of LST values has been related to elevation gradients, topography, and vegetation types, the main agents that influence LST, either positively or negatively. For example, ref. [32] reported a thermal gradient that can exceed 16 degrees on sun-facing slopes in the mountainous Changbai region of China. A similar pattern was found for the SMO in the June 2000 time series compared to June 2005 for all eastern slopes of the mountain range, where LST increased by 12 to 15 °C (Figure 11).
It is possible that one of the main factors that produce LST anomalies in the SMO is climate events such as La Niña (dry winters), which can cause longer fire seasons, producing LST anomalies that occur during as many as eight consecutive months (March to October). This was recorded by [22] where all the months of the years 2020 and 2024 were abnormal droughts to severe droughts for the months of October–November, and in December, extreme and exceptional droughts were reported for the entire SMO, as can be seen in Figure 8 up to an increase of 3 °C for the all SMO.
The SMO [33] reported that the effect of the ENSO (El Niño–Southern Oscillation) affects winter temperature and precipitation, where the months of January and February show LST anomalies. LST anomalies are frequent in arid ecosystems, where positive anomalies indicate warming [34]. In the case of the Sierra Madre Occidental (SMO), a pattern was found of LST anomalies occurring from March to July for the three vegetation types distributed in the Sierra Madre Occidental (pine forest, oak forest, and deciduous forest). In the particular case of the pine forest, which is distributed from 2000 to 3000 m, it was expected that there would be no LST anomalies; however, anomalies were present in all time series (2020–2024) for the spring and early summer months (Figure 8 and Figure 9). These LST anomalies in the pine forest are related to the loss of forest cover; for example, ref. [35] reported a 34% loss of pine forest in the SMO in the period 1986–2012. The main causes of these losses are forest fires, logging, changes in land use, and increases in forest plantations and secondary vegetation [36].
The LST anomalies during the last 25 years in the SMO point to two important aspects: the first is that the LST increases are occurring throughout the elevation gradient (500 m to 3000 m) from March to August, affecting the main types of vegetation cover, namely pine forest, oak forest, and low deciduous forest. The second aspect that was observed in the change detection analyses is temperature increases in practically all months of each series, being more accentuated in the spring and summer (Figure 11), with the exception of January 2024, when all ravines located on the west side of the SMO increased by up to 6 °C. These results are similar to those reported by [23] in a mountainous forested region in the Téran region, where they also found significant LST anomalies and increases in both winter and summer. The constant warming that we report for the Sierra Madre Occidental makes it extremely vulnerable to prolonged droughts, floods, and wildfires.
Change detection analyses also revealed positive effects of climate events in the SMO; for example, the effects of Category 5 Hurricane Patricia, which followed a path from the ocean to the SMO in October 2015 [37]. A large amount of rainfall was recorded (150 mm; information available at NASA Giovanni [38] causing flooding but at the same time reducing LST values for 2015, giving it the lowest LST of all the analyzed time series. This weather phenomenon particularly helped (Figure 8) the upper part of the SMO (>2000 m), where the pine forest is distributed. Here, LST values did not increase, and no anomaly occurred (Figure 8, Figure 9 and Figure 10) [39]. He suggested that hurricanes act as powerful ecological agents, increasing landscape heterogeneity and influencing species composition and diversity. In the southern region of the SMO, positive effects of LST decrease and precipitation from Hurricane Patricia are also reported [40]. It was found that the density and abundance of herbivorous insect species increased in the months following the hurricane. These authors conclude that the positive effect is the result of increased availability of new shoots and foliar meristems after the natural pruning caused by the hurricane.
Several authors have stated that the MODIS LST product is suitable for analyzing global surface temperature trends, due to the sparse distribution of ground observation stations. For example, ref. [41] found a correlation between LST and air temperature. They present a new long-term spatially and temporally continuous MODIS LST dataset for China from 2003 to 2017 that filters out invalid pixels (missing data influenced by cloud and rainfall) and reconstructs them based on multisource data. Their validation indicates that the new LST dataset is highly consistent with in situ observations; the Pearson coefficient (R2) ranges from 0.93 to 0.99. In another study [42], global lake surface water temperature data from selected lakes on the Qinghai–Tibet, were used for comparative validation with MODIS data. The MODIS-derived temperature values were then compared with field observations to assess the accuracy of the remote sensing data. The results show an R2 of 0.87. We also found a positive relationship in more than 90% of the linear regression models (Table 1) between LST and the temperature data taken from the in situ weather stations. Although various authors have stated that there is a correlation between LST and air temperature, it is possible that atmospheric conditions and local geography may modify this relationship, so it is recommended not to depend exclusively on satellite data [43].
On the other hand, in the multitemporal changes, the effect of extreme droughts reported for some states located in the SMO can also be observed. For example, in Figure 11, more marked LST increases can be observed in the June 2000 series compared to June 2005. These increases are consistent with those reported by [44] in their study of droughts in Durango using the Radionov method, which is based on precipitation and evapotranspiration data obtained from weather stations. The multiple correlation analysis shows a positive correlation between all the months of each year (Supplementary Material Table S1), which suggests that both climate and anthropogenic events are continuously propelling LST increases.
It was found that in general, MODIS LST values are related to temperatures recorded from the weather stations [41,45]. We found that more than 90% of the regressions were significant (Table 1) and indicate a relationship between maximum average temperature and LST. Nevertheless, the MODIS LST products have several limitations; (1) spatial resolution is quite coarse for mountain regions with high topographic heterogeneity such as the SMO, which contains microclimates whose temperature can be generalized [41,46]; (2) cloud cover affects LST values, resulting in pixels with missing or imprecise data [47]; and (3) spatial representativity, which refers to the degree to which observations on the ground are related to LST values. In the case of the SMO, there were only eight weather stations with complete data for the analyzed years and months. It is suggested that LST measurements be taken in the field to validate the data, as proposed by [45], to improve the validation process.

5. Conclusions

Unlike other mountain ranges in the world, where LST increases are related to changes in elevation and vegetation [48,49,50], we found, using the change detection technique, that LST increases occur practically throughout the SMO. In general, pixels above 35 °C were found from February to October and above 40 °C from March to September. The maximum average increase was 6.98 °C from 2000 to June 2005. In general, LST anomalies show a pattern of occurrence in the months of March through July for the three vegetation types distributed in the Sierra. Pinus vegetation, despite being distributed above 2000 m, showed anomalies from February to November in all time series, while months with anomalies above 150 were recorded from May to July. The change detection showed an average increase of more than 2 °C for more than 50% of the total pixels for the entire SMO in the months of June and November in all time series. The time series with the highest contrast was 2000 vs. 2024, for which LST anomalies occurred from January to November.
The implications of the continual increase in LST in the SMO in the present day are related to the increase in forest fires. According to the National Forest Commission’s (Conafor) Fire Management Program, forest fires are one of the main causes of environmental deterioration in Mexico. Another factor is urbanization, which is known to lead to heat islands [51]; however, this topic has not yet been investigated in the SMO. Given the growth of cities located in these mountains, this is an untapped research opportunity. Another area for future research concerns species in danger of extinction in various natural protected areas in the SMO. An example is Picea mexicana, which only has two populations in these mountains. It is known that spruces are a living example of the southward migration of boreal flora, which occurred during the glacial periods. In the case of P. mexicana, the species requires colder temperatures to flourish and is not tolerant of heat. The persistence of LST increases might therefore compromise the permanence of this species and possibly of the temperate forest [52].
Monitoring LST anomalies is key not only to studying forest fires and heat islands, but has also been used for earthquake detection [53] and identifying geothermal resources. Studies have linked temperature anomalies with fault structures and geothermal activity [54]. Again, these have not been explored in the SMO to date.

Supplementary Materials

The following supporting information can be downloaded at: https://www.mdpi.com/article/10.3390/land14081635/s1, Figure S1: Temperature of pine forest in the SMO 2000–2024. Table S1: Results of the multiple correlation matrices for the 2020–2024 time series.

Author Contributions

Conceptualization, S.S. and E.-F.J.G.; methodology, S.S. and E.-F.J.G.; process analysis, S.S. and E.-F.J.G.; resources, S.S. and E.-F.J.G.; writing—original draft preparation, S.S. and E.-F.J.G.; writing—review and editing, S.S. and E.-F.J.G. All authors have read and agreed to the published version of the manuscript.

Funding

This research received no external funding.

Data Availability Statement

The datasets presented in this article are not readily available because the data are part of an ongoing study or due to technical or time constraints. Requests for access to the datasets should be directed to Sarahi Sandoval (ssandoval@secihti.mx).

Conflicts of Interest

The authors declare no conflicts of interest.

References

  1. Hansen, J.M.; Sato, M.; Ruedy, K.; Lo, K.; Lea, D.W.; Medina-Elizade, M. Global temperature change. Proc. Natl. Acad. Sci. USA 2006, 103, 288–293. [Google Scholar] [CrossRef]
  2. Schmugge, T.J.; Becker, F. Remote sensing observations for the monitoring of land-surface fluxes and water budgets. In Land Surface Evaporation: Measurements and Parameterization; Schmugge, T.J., Andre, J.C., Eds.; Springer: New York, NY, USA, 1991; Volume 20, pp. 337–347. [Google Scholar]
  3. Running, S.W.; Nemani, R.R.; Heinsch, F.A.; Zhao, M.; Reeves, M.; Hashimoto, H. A continuous satellite-derived measure of global terrestrial primary production. BioScience 2004, 54, 547–560. [Google Scholar] [CrossRef]
  4. Ackerman, S.A.; Strabala, K.I.; Menzel, W.P.; Frey, R.A.; Moeller, C.C.; Gumley, L.E. Discriminating clear sky from clouds with MODIS. J. Geophys. Res. Atmos. 1998, 103, 32141–32157. [Google Scholar] [CrossRef]
  5. Wright, R.; Carn, S.A.; Flynn, L.P. A satellite chronology of the May–June 2003 eruption of Anatahan volcano. J. Volcanol. Geotherm. Res. 2005, 146, 102–116. [Google Scholar] [CrossRef]
  6. White, J.C.; Coops, N.C.; Wulder, M.A.; Vastaranta, M.; Hilker, T.; Tompalski, P. Remote Sensing Technologies for Enhancing Forest Inventories: A Review. Can. J. Remote Sens. 2016, 42, 619–641. [Google Scholar] [CrossRef]
  7. Beniston, M. Climatic change in mountain regions: A review of possible impacts. Clim. Change 2003, 59, 5–31. [Google Scholar] [CrossRef]
  8. Adler, C.; Wester, P.; Bhatt, I.; Huggel, C.; Insarov, G.; Morecroft, M.; Muccione, V.; Prakash, A.; Alcantara-Ayala, I.; Allen, S.K.; et al. Mountains. In Climate Change 2022: Impacts, Adaptation and Vulnerability Working Group II Contribution to the Sixth Assessment Report of the Intergovernmental Panel on Climate Change; Cambridge University Press: Cambridge, UK, 2022; pp. 2273–2318. [Google Scholar]
  9. Iverson, L.R.; Prasad, A.M. Predicting abundance of 80 tree species following climate change in the Eastern United States. Ecol. Monogr. 1998, 68, 465–485. [Google Scholar] [CrossRef]
  10. Ohlemüller, R.; Gritti, E.S.; Sykes, M.T.; Thomas, C.D. Quantifying components of risk for european woody species under climate change. Glob. Change Biol. 2006, 12, 1788–1799. [Google Scholar] [CrossRef]
  11. Villers-Ruíz, L.; Trejo-Vázquez, I. Climate change on mexican forest and natural áreas. Glob. Environ. Change 1998, 8, 141–157. [Google Scholar] [CrossRef]
  12. Watson, R.T.; Zinyowera, M.C.; Moss, R.H. Climate Change 1995: Impacts, Adaptations and Mitigation of Climate Change, Scientific-Technical Analyses. In Contribution of Working Group II to the Second Assessment of the Intergovernmental Panel on Climate Change; Cambridge University Press: Cambridge, UK, 1996; p. 577. [Google Scholar]
  13. Moreno-Sanchez, R.; Buxton-Torres, T.; Sinbernagel, K.; Moreno-Sanchez, F. Fragmentation of the forests in Mexico: National level assessments for 1993, 2002 and 2008. Rev. Int. Estadística Geogr. 2014, 5, 4–18. [Google Scholar]
  14. Altamirano del Carmen, M.A.; Gay-García, E.C. A new method for assessing the performance of general circulation models based on their ability to simulate the response to observed forcing. J. Clim. 2021, 34, 5385–5402. [Google Scholar] [CrossRef]
  15. Rzedowski, J. Reflexiones y experiencias sobre el trabajo florístico en México. In Entre las Plantas y la Historia; Universidad Michoacana de San Nicolás de Hidalgo, Instituto de Investigaciones Históricas; Zamudio, G., Sánchez, D., Eds.; UNAM., Facultad de Ciencias, Universidad Nacional Autónoma de México y Sociedad Botánica de México: México, DF, Mexico, 1998; pp. 182–195. [Google Scholar]
  16. Mas, J.F. Assessing protected area effectiveness using surrounding (buffer) areas environmentally similar to the target area. Environ. Monit. Assess. 2005, 105, 69–80. [Google Scholar] [CrossRef]
  17. González-Elizondo, M. Indicadores de Cambio Climatico en Algunas Especies de Pinaceas de la Sierra Madre Occidental Mexico. Ph.D. Thesis, Universidad autonoma de Nuevo Leon, Nuevo Leon, Mexico, 2003; p. 193. [Google Scholar]
  18. González-Elizondo, M.S.; González-Elizondo, M.; Tena-Flores, J.A.; Ruacho-González, L.; López-Enríquez, I.L. Vegetación de la Sierra Madre Occidental, México: Una síntesis. Acta Botánica Mex. 2012, 100, 351–403. [Google Scholar] [CrossRef]
  19. Ferrari, L.; Valencia-Moreno, M.; Scott, B. Magmatismo y tectónica en la Sierra Madre Occidental y su relación con la evolución de la margen occidental de norteamérica. Bol. Soc. Geol. Mex. 2005, 57, 343–378. [Google Scholar] [CrossRef]
  20. Wan, Z.; Li, Z.L. Un algoritmo basado en la física para recuperar la emisividad y la temperatura de la superficie terrestre a partir de datos EOS/MODIS. IEEE Trans. Geosci. Remote Sens. 1997, 35, 980–996. [Google Scholar]
  21. Wan, Z.; Zhang, Y.; Zhang, Q.; Li, Z.-L. Quality assessment and validation of the MODIS global land surface temperature. Int. J. Remote Sens. 2004, 25, 261–274. [Google Scholar] [CrossRef]
  22. Servicio Meteorologico Nacional. Available online: https://smn.conagua.gob.mx/es/8-smn-general (accessed on 28 July 2025).
  23. Gonzalez-Alonso, F.; Cuevas, J.M.; Calle, A.; Casanova, J.L.; Romo, A. Spanish vegetation monitoring during the period 1987–2001 using NOAA-AVHRR images. Int. J. Remote Sens. 2004, 25, 3–6. [Google Scholar] [CrossRef]
  24. Jamali, A.A.; Kalkhajeh, R.G.; Randhir, T.O.; He, R.S. Modeling relationship between land surface temperature anomaly and environmental factors using GEE and Giovanni. J. Environ. Manag. 2022, 302, 113970. [Google Scholar] [CrossRef]
  25. Beck, R.N.; Gessler, P.E. Technical Note: Development of a Landsat Time Series for Application in Forest Status Assessment in the Inland Northwest United States. West. J. Appl. 2008, 23, 53–62. [Google Scholar] [CrossRef]
  26. Geoportal del Sistema Nacional de Informacion Sobr Biodiversidad (SNIB). Available online: http://geoportal.conabio.gob.mx/ (accessed on 5 November 2024).
  27. Aguilar-Soto, V.; Melgoza-Castillo, A.; Villarreal-Guerrero, F.; Wehenkel, C.; Pinedo-Alvarez, C. Modeling the Potential Distribution of Picea chihuahuana Martínez, an Endangered Species at the Sierra Madre Occidental, Mexico. Forests 2015, 6, 692–707. [Google Scholar] [CrossRef]
  28. Morton, J.C. Image Analysis, Classification and Change Detection in Remote Sensing, 4th ed.; CRC Press; Taylor and Francis: Boca Raton, FL, USA, 2019; pp. 375–397. [Google Scholar]
  29. SDMToolbox. Available online: http://www.sdmtoolbox.org/ (accessed on 30 July 2025).
  30. Mildrexler, D.J.; Zhao, M.; Cohen, W.B.; Running, S.W.; Song, X.; Jones, M.O. Thermal anomalies detect critical global land surface changes. J. Appl. Meteorol. Climatol. 2018, 57, 391–397. [Google Scholar] [CrossRef]
  31. Yang, C.; Yan, F.; Zhang, S. Comparison of land surface and air temperatures for quantifying summer and winter urban heat island in a snow climate city. J. Environ. Manag. 2020, 265, 110563. [Google Scholar] [CrossRef]
  32. He, J.; Zhao, W.; Li, A.; Wen, F.; Yu, D. The impact of the terrain effect on land surface temperature variation based on Landsat-8 observations in mountainous areas. Int. J. Remote Sens. 2019, 40, 1808–1827. [Google Scholar] [CrossRef]
  33. Heyerdahl, E.K.; Alvarado, E. Influence of climate and land use on historical surface fires in pine-oak forests, Sierra Madre Occidental, Mexico. In Fire and Climatic Change in Temperate Ecosystems of the Western Americas; Thomas, T., Veblen, W.L., Baker, G.M., Thomas, W.S., Eds.; Springer: New York, NY, USA, 2003; Volume 7, pp. 196–217. [Google Scholar]
  34. Roy, A.; Rajasekaran, E.; Harod, R.; Gnanappazham, L. Land surface temperature anomalies as indicators of urban land cover change—A study of two Indian cities. Earth Sci. Syst. Soc. 2024, 4, 10096. [Google Scholar] [CrossRef]
  35. Novo-Fernández, A.; Franks, S.; Wehenkel, C.; López-Serrano, P.M.; Molinier, M.; López-Sánchez, C.A. Landsat time series analysis for temperate forest cover change detection in the Sierra Madre Occidental, Durango, Mexico. Int. J. Appl. Earth Obs. Geoinf. 2018, 73, 230–244. [Google Scholar] [CrossRef]
  36. Rosete-Vergés, F.A.; Pérez-Damián, J.L.; Villalobos-Delgado, M.; Navarro-Salas, E.N.; Salinas-Chávez, E.; Remond-Noa, R. El avance de la deforestación en México 1976–2007. Madera Y Bosques 2014, 20, 21–35. [Google Scholar] [CrossRef]
  37. National Hurricane Center. Available online: www.nhc.noaa.gov (accessed on 5 November 2024).
  38. Giovanni NASA Earth Data. Available online: www.earthdata.nasa.gov/data/tools/giovanni (accessed on 5 November 2024).
  39. Lugo, A.E. Visible and invisible effects of hurricanes on forest ecosystems: An international review. Austral Ecol. 2008, 33, 368–398. [Google Scholar] [CrossRef]
  40. Novais, S.; Macedo-Reis, L.E.; Cristobal-Peréz, E.J.; Sánchez-Montoya, G.; Janda, M.; Neves, F.; Quesada, M. Positive effects of the catastrophic Hurricane Patricia on insect communities. Sci. Rep. 2018, 8, 15042. [Google Scholar] [CrossRef]
  41. Zhao, B.; Mao, K.; Cai, Y.; Shi, J.; Li, Z.; Qin, Z.; Meng, X.; Shen, X.; Guo, Z. A combined Terra and Aqua MODIS land surface temperature and meteorological station data product for China from 2003 to 2017. Earth Syst. Sci. Data. 2020, 12, 2555–2577. [Google Scholar] [CrossRef]
  42. Zhao, B.; Sun, Z.; Wang, M.; Du, J.; Song, K. Tracking global large lake surface temperature variation from space using MODIS land surface temperature product. Ecol. Inform. 2025, 89, 103184. [Google Scholar] [CrossRef]
  43. Rocca, M.T.; Franzini, M.; Casella, V.M. Calibration and Validation of MODIS-Derived Ground-Level Air Temperature Models by Means of Ground Measurements. Appl. Sci. 2025, 15, 184. [Google Scholar] [CrossRef]
  44. Cortez-Villa, J.; Quevedo-Nolasco, A.; Arteaga-Ramírez, R.; Carrillo-Flores, G. Tendencia de la sequía meteorológica en el estado de Durango, México, por el método de Rodionov. Tecnol. Cienc. Agua. 2020, 11, 85–131. [Google Scholar] [CrossRef]
  45. Yu, W.; Ma, M.; Li, Z.; Tan, J.; Wu, A. New Scheme for validating remote-sensing land surface temperature products with station observations. Remote Sens. 2017, 9, 1210. [Google Scholar] [CrossRef]
  46. Sandoval, S.; López-González, C.; Escobar-Flores, J.G.; Martínez-Rincón, R.O. Effect of spatial resolution, algorithm and variable set on the estimated distribution of a mammal of concern: The squirrel Sciurus aberti. Écoscience 2020, 27, 195–207. [Google Scholar] [CrossRef]
  47. Bird, D.N.; Banzhaf, E.; Knopp, J.; Wu, W.; Jones, L. Combining. Spatial and Temporal Data to Createa Fine-Resolution Daily Urban Air Temperature Product from Remote Sensing Land Surface Temperature (LST) Data. Atmosphere 2022, 13, 1152. [Google Scholar] [CrossRef]
  48. Kio, P.R.O.; Ofosu-Asiedu, A.; Dykstra, D.P.; Kowero, G. Foreword to the second volume of the special issue containing refereed papers presented at thematic workshops during the CIFOR/UNEP project on sustainable forest management in Anglophone West Africa. Ghana J. For. 1997, 4, 1. [Google Scholar]
  49. Bindajam, A.A.; Mallick, J.; Mahato, S.; Talukdar, S.; Alquiadhi, S. Assessing landscape fragmentation effects on ecosystem services in a semi-arid mountainous environment: A case study on Abha watershed, Saudi Arabia. Appl. Ecol. Environ. Res. 2021, 19, 2519–2539. [Google Scholar] [CrossRef]
  50. Rani, S.; Mal, S. Trends in land surface temperature and its drivers over the High Mountain Asia. Egypt. J. Remote Sens. Space Sci. 2022, 25, 717–729. [Google Scholar] [CrossRef]
  51. Halefom, A.; He, Y.; Nemoto, T.; Feng, L.; Li, R.; Raghavan, V.; Duan, Z. The Impact of Urbanization-Induced Land Use Change on Land Surface Temperature. Remote Sens. 2024, 16, 4502. [Google Scholar] [CrossRef]
  52. González-Elizondo, M.S.; Wehenkel, C. Las Piceas (Picea, Pinaceae) de México. Comisión Nacional Forestal: México, Mexico, 2022; pp. 1–60. [Google Scholar]
  53. Bhardwaj, A.; Singh, S.; Sam, L.; Joshi, P.; Bhardwaj, A.; Martín-Torres, F.J.; Kumar, R. A review on remotely sensed land surface temperature anomaly as an earthquake precursor. Int. J. Appl. Earth Obs. Geoinf. 2017, 63, 158–166. [Google Scholar] [CrossRef]
  54. Bian, Y.; Ni, Y.; Guo, Y.; Wen, J.; Chen, J.; Chen, L.; Yang, Y. Urban Geothermal Resource Potential Mapping Using Data-Driven Models—A Case Study of Zhuhai City. Sustainability 2024, 16, 7501. [Google Scholar] [CrossRef]
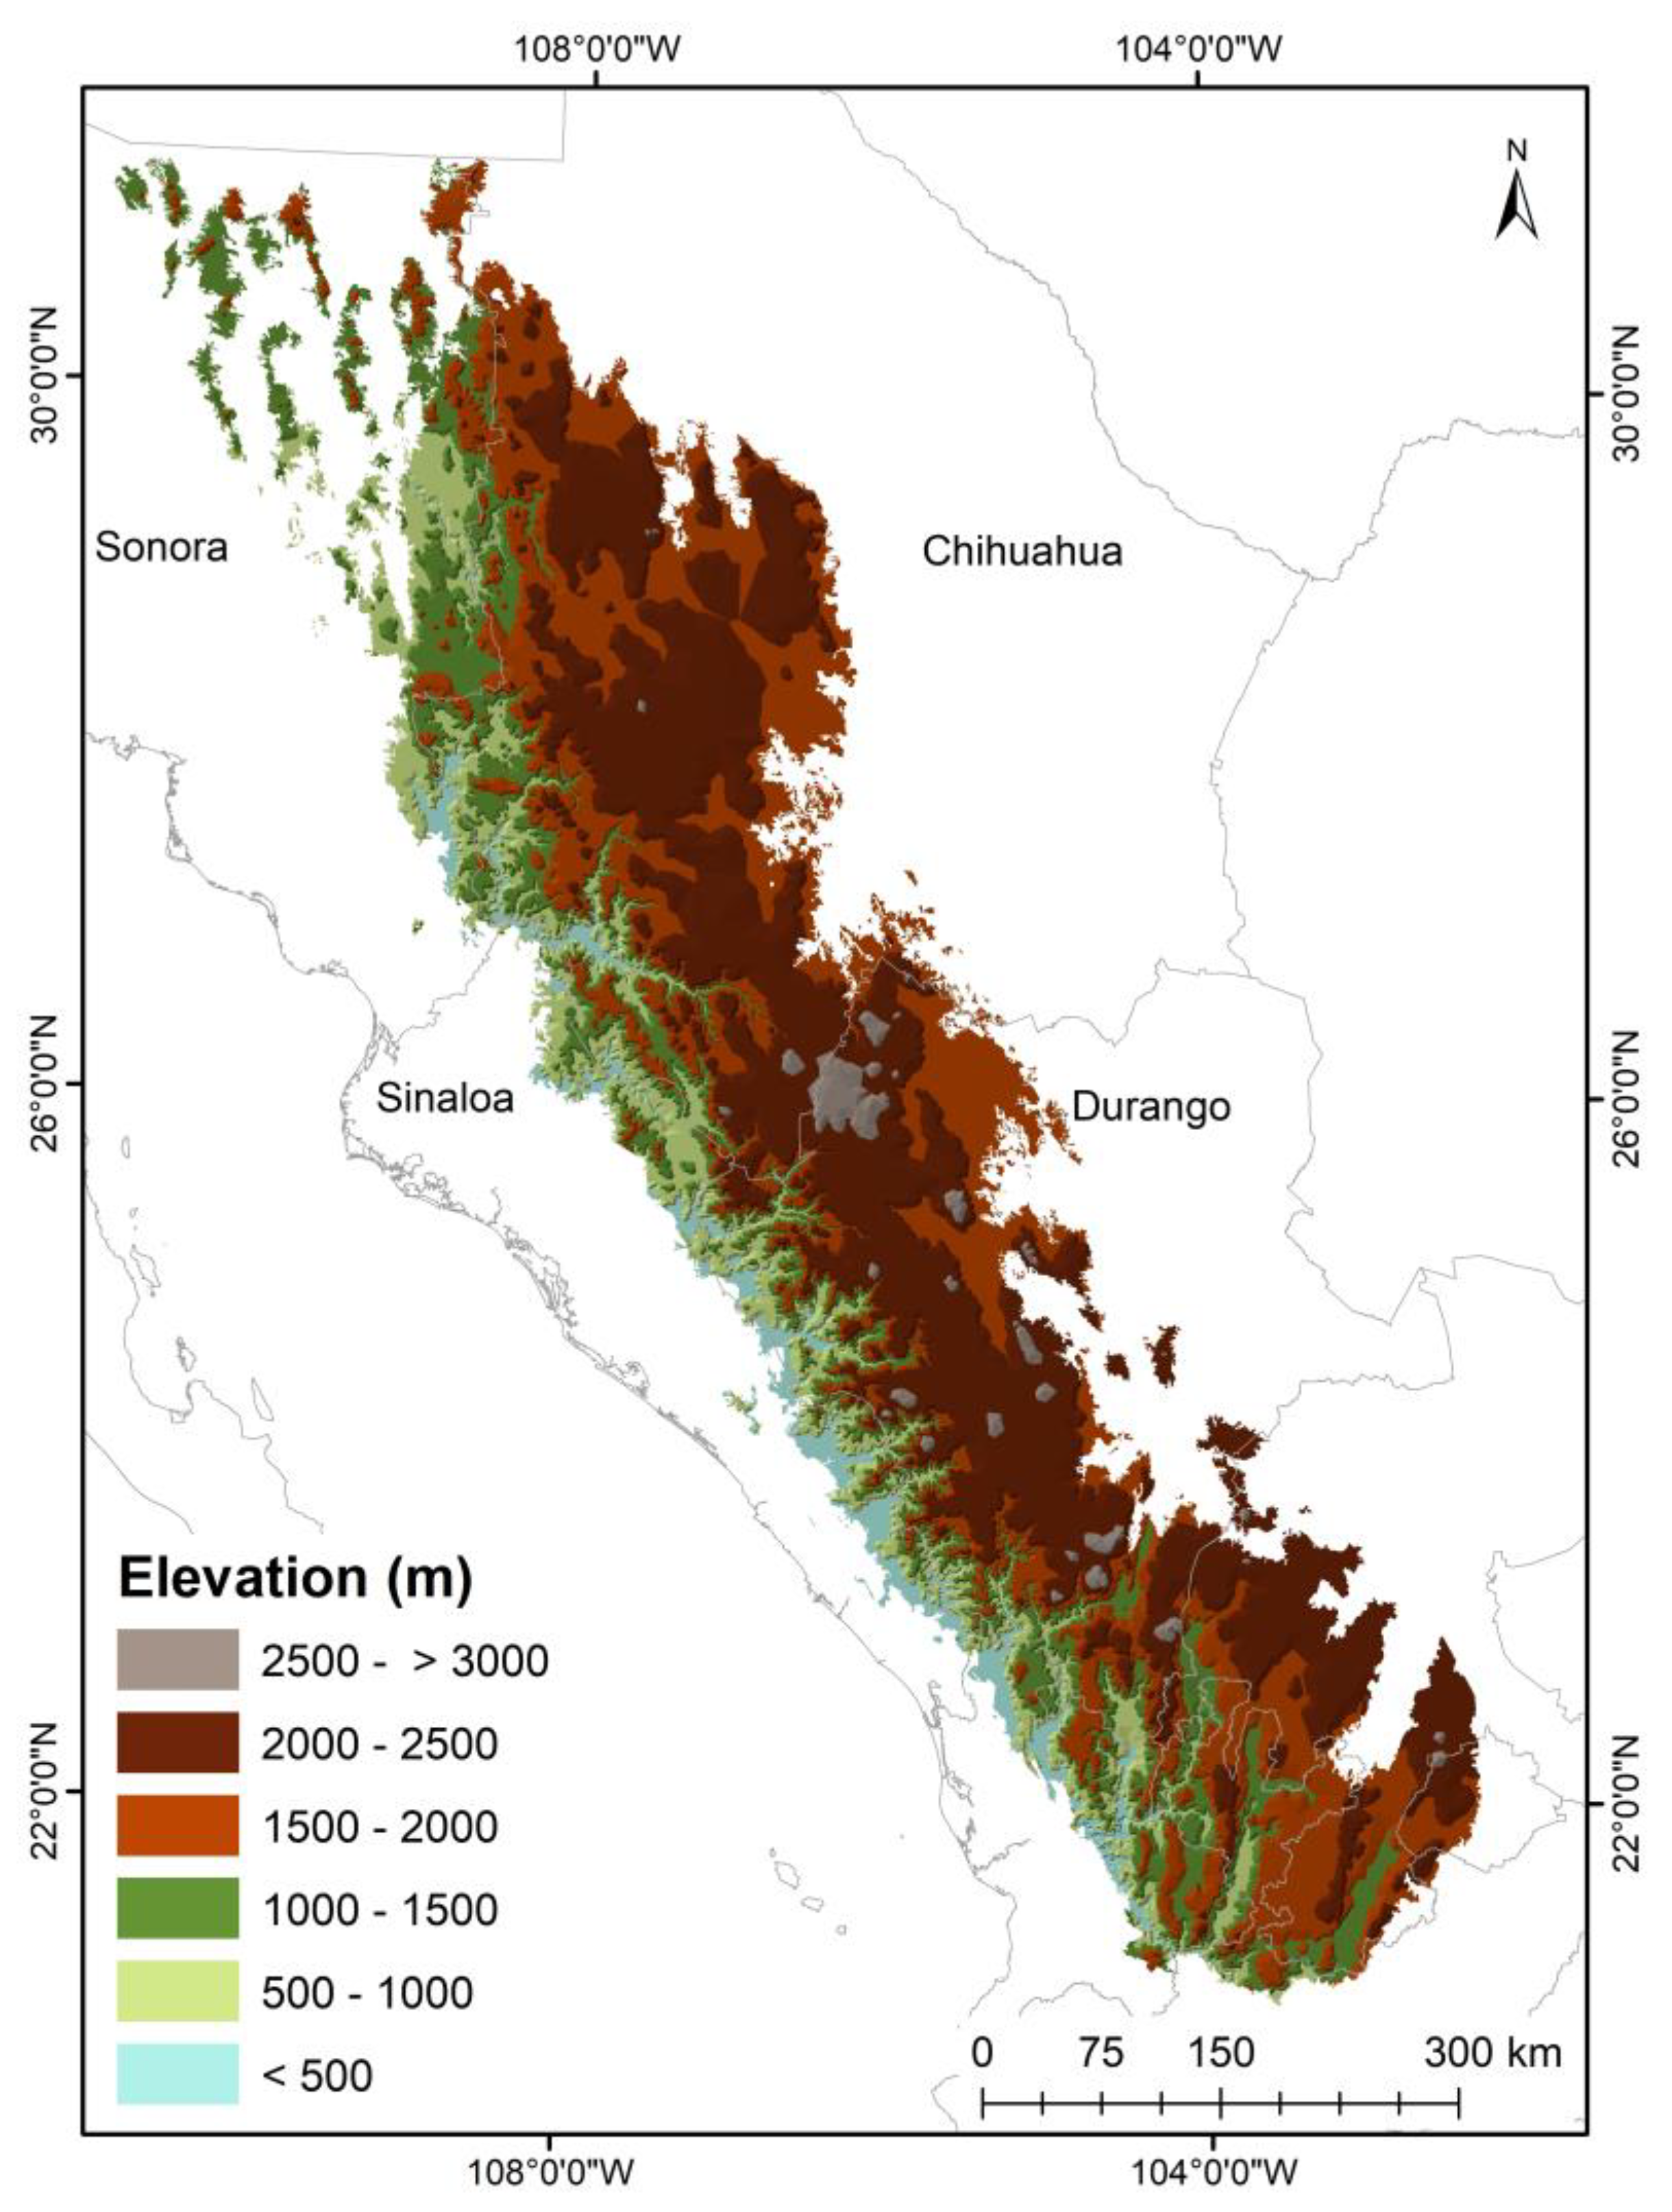
Figure 1. Study site. Sierra Madre Occidental, Mexico.
Land 14 01635 g001
Figure 2. Diagram of geoprocessing for scaling, obtaining LST in degrees Celsius for the SMO. The superscript p indicates the input parameters (HDF file and SMO polygon) and the output file (LST values).
Land 14 01635 g002
Figure 3. ModelBuilder in ArcGIS 10.8.1 for the analysis of change detection. The blue squares indicate the LST input rasters for each pair of time series from the same month. The yellow oval is a function of PVC (raster subtraction). The green square is the result of the PVC, and the red square is a database with the PVC values > 0.
Land 14 01635 g003
Figure 4. Land surface temperature (LST) obtained from MODIS for the years 2000 to 2024. It can be seen that the maximum temperatures (purple and red) are located in deciduous forests with temperatures above 33 °C.
Land 14 01635 g004
Figure 5. Number of pixels by temperature interval during study years. The graph shows that the pixels corresponding to May 2024 had LST values greater than 40 °C.
Land 14 01635 g005
Figure 6. Comparison between average maximum temperatures (black circles) from weather stations and LST values (red circles) for the same geographic positions and time series.
Land 14 01635 g006
Figure 7. Vegetation types obtained from CONABIO Series VII land use and vegetation type map.
Land 14 01635 g007
Figure 8. Anomaly index in pine forest. The dotted red line indicates values above 100 that are LST anomalies. These were constant for all months from March to September for all time series.
Land 14 01635 g008
Figure 9. Anomaly index in the oak forest. The dotted red line indicates values above 100 that were LST anomalies. These were constant for all months from March to July.
Land 14 01635 g009
Figure 10. Anomaly index in deciduous forest. The dotted red line indicates values above 100 that were LST anomalies. These were constant for all months from March to May, while anomalies were not present from September to December.
Land 14 01635 g010
Figure 11. LST Change Detection in the SMO.
Land 14 01635 g011
Table 1. Linear regressions between LST values and average maximum temperatures for the same geographic positions, months, and years.
Station NumberYearValue of R2(RMSE)Value of p
10,160
Lat 24.44°
Lon −105.78°
20050.383.880.018
2010−0.035.810.438
20150.72.31<0.001
20200.134.670.129
20050.383.880.018
18,013
Lat 21.68°
Lon −104.31°
20000.287.850.04
20050.842.46<0.001
20100.44.050.015
2015−0.073.710.640
2020−0.045.080.474
25,093
Lat 25.80°
Lon −107.56°
20050.822.09<0.001
20100.124.380.140
20150.432.890.011
20200.732.34<0.001
20050.822.09<0.001
8219
Lat 29.25°
Lon −108.09°
20000.744.13<0.001
20050.893.22<0.001
20100.875.15<0.001
20150.950.87<0.001
20200.804.73<0.001
8215
Lat 28.71°
Lon −107.24°
20000.49.60.030
20050.893.13<0.001
20100.725.79<0.001
20150.832.07<0.001
20200.863.4<0.001
8352
Lat 28.18°
Lon −108.21°
20100.788.22<0.001
20150.1823.450.156
20200.2831.150.07
14,023
Lat 21.82°
Lon −103.78°
20000.815.95<0.001
20050.798.9<0.001
20100.7610.17<0.001
20150.626.6640.002
20200.88.01<0.001
14,053
Lat 22.60°
Lon −103.94°
20000.6411.320.003
20050.788.85<0.001
20100.5718.240.004
20150.577.570.004
20200.82996.82<0.001
Table 2. Results of change detection of LST in the SMO, Mexico, where µ is the mean, σ is the standard deviation, n is the total number of pixels, and max is the maximum LST change.
Change (°C)
Month2000–20052000–20102000–20152000–20202000–2024
January µ = 0.78µ = 1.38µ = 0.78µ = 2.73
No dataσ = 0.63σ = 1.11σ = 0.60σ = 1.90
n = 1036n = 1170n = 1554n = 2743
max = 3.87max = 5.41max = 3.86max = 9.8
Februaryµ = 1.63µ = 1.24µ = 1.87µ = 1.70µ = 1.50
σ = 1.37σ = 1.35σ = 1.70σ = 1.73σ = 1.32
n = 69n = 9n = 114n = 88n = 1110
max = 5.55max = 3.77max = 7max = 7.04max = 9.35
Marchµ = 1.71µ = 0µ = 0µ = 1.03µ = 3.35
σ = 1.32σ = 0σ = 0σ = 0.85σ = 1.76
n = 4n = 1n = 0n = 649n = 3482
max = 2.63max = 0.02max = 0max = 4.77max = 7.77
Aprilµ = 0.16µ = 0.73µ = 0µ = 0.59µ = 2.75
σ = 0.09σ = 0.53σ = 0σ = 0.38σ = 1.54
n = 41n = 39n = 0n = 397n = 3475
max = 0.33max = 2.4max = 0max = 1.37max = 8.55
Mayµ = 0.16µ = 0.76µ = 0.77µ = 0.47µ = 2.81
σ = 0.07σ = 0.57σ = 0.54σ = 0.32σ = 1.47
n = 60n = 487n = 48n = 623n = 3485
max = 0.27max = 3.03max = 2.57max = 1.19max = 6.39
Juneµ = 6.98µ = 4.57µ = 2.21µ = 5.43µ = 5.12
σ = 3.71σ = 2.75σ = 1.59σ = 2.99σ = 2.21
n = 4125n = 4101n = 3093n = 4144n = 2249
max = 13.95max = 14.33max = 9.50max = 15.27max = 13.72
Julyµ = 3.67µ = 1.79µ = 0.88µ = 1.69µ = 3.14
σ = 2.32σ = 1.37σ = 0.82σ = 1.55σ = 2.40
n = 3806n = 1197n = 576n = 2201n = 1729
max = 14.98max = 7.39max = 5.42max = 10.45max = 13.80
Augustµ = 0.55µ = 1.05µ = 0.87µ = 3.07µ = 3.16
σ = 0.53σ = 0.9σ = 0.74σ = 2.18σ = 2.07
n = 335n = 1664n = 1577n = 3289n = 2412
max = 3.46max = 6.89max = 5.51max = 12.85max = 9.48
Septemberµ = 0.55µ = 0.51µ = 0.71µ = 0.34µ = 1.8
σ = 0.49σ = 0.49σ = 0.56σ = 1.14σ = 1.34
n = 397n = 134n = 293n = 345n = 2037
max = 3.10max = 2.19max = 3.58max = 0.55max = 8.95
Octoberµ = 1.57µ = 1.18µ = 1.11µ = 4.31µ = 2.17
σ = 1.08σ = 0.84σ = 0.81σ = 2.36σ = 1.50
n = 3126n = 2805n = 1421n = 4093n = 3202
max = 6.72max = 5.85max = 5.72max = 14.70max = 9.08
Novemberµ = 4.37µ = 2.86µ = 3.29µ = 5.89µ = 3.19
σ = 2.08σ = 1.42σ = 1.69σ = 2.47σ = 1.85
n = 4080n = 3919n = 3534n = 4224n = 2981
max = 10.23max = 8.91max = 8.58max = 12.92max = 9
Decemberµ = 1.00µ = 1.29µ = 2.26µ = 5.48µ = 1.79
σ = 0.83σ = 0.92σ = 0.45σ = 0.71σ = 1.12
n = 1236n = 2612n = 303n = 937n = 1667
max = 4.32max = 5.06max = 2.26max = 5.48max = 6.57
Disclaimer/Publisher’s Note: The statements, opinions and data contained in all publications are solely those of the individual author(s) and contributor(s) and not of MDPI and/or the editor(s). MDPI and/or the editor(s) disclaim responsibility for any injury to people or property resulting from any ideas, methods, instructions or products referred to in the content.