Abstract
As the texture skeleton of the traditional village, the street space is the main area for tourists to visit in traditional villages; it is regarded as the spatial conversion place of human flow and the space frequently visited by tourists. Accumulating evidence shows that the visual quality of street spaces has an effect on pedestrians’ walking behaviors in urban areas, but this effect in traditional villages needs to be further explored. This paper takes Huangcun Village, Yixian County, Huangshan City, as the research area to explore the influence of the objective visual factors of street spaces on tourists’ subjective stay willingness. First, an evaluation system of the visual quality of street spaces was developed. With the assistance of computer vision and deep learning technologies, semantic segmentation of Huangcun Village street view images was performed to obtain a visual quality index and then calculate the descriptive index of Huangcun Village’s street space. Then, combining the data of tourists’ stay willingness with the visual quality of the street space, the overall evaluation results and space distribution of tourists’ stay willingness in Huangcun Village were predicted using the Trueskill algorithm and machine learning prediction model. Finally, the influence of the objective visual quality of the street space on tourist subjective stay willingness was analyzed by correlation analysis. This research could provide some useful information for street space design and tourism planning in traditional villages.
1. Introduction
The development of tourism has become an important way to promote the conservation and enhance the endogenous development momentum of traditional villages. In traditional villages that develop tourism, streets are not only important components of the spatial texture of the village but also play a vital role in supporting the integrity of the village pattern and serving as the public space for tourists to walk, go sightseeing, play, and communicate. Previous studies have introduced the concept of tourists’ stay willingness, which refers to the extent to which tourists are willing to visit or stay in a space or location [1]. Previous studies have shown that the key elements of the visual quality of street space (vQoSS) include green visibility, enclosure, sky visibility index, walkability, cross-sectional proportions, etc., which could affect pedestrians’ walking behaviors and stay willingness [2,3,4,5]. Streets are the space most frequently visited by tourists in traditional villages, and the visual quality of street spaces could affect tourists’ perceptions and then affect tourists’ walking behaviors and stay willingness. In other words, a street with a high number of tourists willing to walk and stay there indicates a lively street space of optimal visual quality.
Pursuant to the goals of building modernized people-centric cities and creating high-quality living spaces, China has introduced a series of policies at the national level to enhance urban walkability, promote pedestrian-friendly streets, and develop tourism and leisure districts. As outlined in the “Outline of the 14th Five-Year Plan for National Economic and Social Development and the Long-Range Objectives Through the Year 2035,” there is a proposal to construct slow-traffic networks, including bicycle lanes and pedestrian walkways. Local governments in cities such as Shanghai, Guangzhou, and Beijing have also supported the enhancement of pedestrian environments and the development of slow-traffic systems through urban planning and policy measures [6,7,8,9]. Although large-scale evaluation efforts and improvement practices have been conducted regarding the walking environment, walkability, and walk-friendliness of streets in China’s major cities and their vibrant centers, research on street space quality in specific areas (small and medium-sized cities, tourist villages, traditional villages, etc.), at the micro-scale (neighborhoods, villages, etc.), for specific groups (such as tourists, children), and for specific categories (such as visual quality) remains lacking. To our knowledge, there is currently no research exploring the enhancement of the visual quality of street spaces in traditional villages that are dominated by the tourism industry, including the evaluation of the visual quality of street spaces and how the visual quality of street spaces affects tourists’ walking behaviors.
Accordingly, by taking Huangcun Village, Yixian County, as an example, this study aims to develop an evaluation system of the visual quality of street spaces and uses computer vision deep learning to perform semantic segmentation on street view images of Huangcun Village, obtaining the visual index of spatial elements. Descriptive indices of Huangcun Village’s street space are also calculated. In terms of subjective aspects, the Trueskill algorithm is used to quantitatively evaluate tourist stay willingness based on image evaluation ranking systems. Meanwhile, the spatial descriptive index of the street was taken as the independent variable, the prediction result of the perceived tourist stay willingness was taken as the dependent variable, and a least squares linear regression analysis was carried out. The innovation of this study lies in two key aspects: First, it uses street view imagery and machine learning methods to evaluate the visual quality of street space and tourist stay willingness in a traditional village. Second, it reveals the influencing mechanisms by which the visual quality of the street space affects people’s desire to linger. These contributions can provide a reference for the street space design and tourism planning of traditional villages and promote the proposal of targeted interventions to optimize the public walking environment.
2. Literature Review
2.1. The Evaluation of the Visual Quality of Street Space (vQoSS)
Under the trend of people-centered ideology, research on street quality evaluation from the perspective of human perceptions has gradually been gaining attention. This research is primarily divided into the auditory quality [10,11,12] and visual quality [1,13,14,15,16] of street spaces, with the latter being the key focus of this paper. The visual quality of street space (vQoSS) is the comprehensive environmental condition and users’ physical reflections of the static image of the space [1]. In terms of research perspectives, the vQoSS is generally divided into two dimensions: the objective and the subjective. In the objective dimension, the vQoSS primarily focuses on the visual elements of a streetscape, including greenery, buildings, roads, sky, vehicles, fences, street furniture, and so on [3,4,17]. In the subjective dimension, the vQoSS relies on pedestrians’ stay willingness in the space [1].
In terms of evaluation indicators, the green view index, street enclosure index, sky visibility index, walkability, and cross-sectional proportion are regarded as the key and over-discussed evaluation indicators among all the variables that contribute to the vQoSS. Greenness elements, such as trees, palms, grass, flowers, and other forms of plant life, can improve the attractiveness and visual experience of streets. The green view index refers to the percentage of greenery visible that reflects the degree of greening from a human perspective. Studies have shown that green visibility has a positive impact on the pleasure of walking [5,18,19,20,21]. The street is enclosed by buildings, fences, trees, signs, and column elements on both sides of the street. The street enclosure index refers to the percentage of vertical elements (sky excluded) in street view images that reflects the degree of street space congestion [18,22,23]. The sky visibility index is the proportion of sky elements within a street view image, which could reflect the openness of a space [5,19,24]. The surrounding visual elements of the street have positive or negative impacts on a pedestrian’s walking experience, such as their sense of comfort, pleasure, or insecurity. Walkability represents the degree of freedom of choice that pedestrians have during their walking, with higher values proving that the street is of higher quality [3,18,23]. The cross-sectional proportion is the ratio of building height to width across the street between building façades. A large cross-sectional proportion means that the street has narrow streetscapes enclosed by relatively tall buildings, while a small cross-sectional proportion represents that the street has wide streetscapes lined by relatively short buildings [2,15].
In terms of data analysis and evaluation technology, the emerging street view image, computer vision, and machine learning techniques have recently proven to be of considerable assistance in investigating street spaces, extracting visual elements, and quantifying the visual quality of street spaces [3,25]. For instance, semantic segmentation has been used to identify visual parameters through a large number of street view images in urban areas from multiple years of Google Street View, Baidu Street View, Tecent Street View, and visual field photos captured by pedestrians [5,26,27]. Since it is easier to obtain large amounts of street view image data in urban built-up areas, existing research areas have focused on urban areas, such as New York, Beijing, Shanghai, etc.; related research on rural areas and traditional villages is relatively lacking.
Meanwhile, traditional quantitative research methods, typically based on surveys, questionnaires, and interviews, are inefficient and make it difficult to objectively and comprehensively grasp the overall visual elements and physical characteristics of street space in large-scale data [22,28]. The rapid development of Machine Deep Learning technologies, such as SegNet, Deeplab, ANNs, and random forests, has introduced new possibilities for the study of the visual quality of street space, which could avoid the shortcomings of traditional evaluation methods, such as their low accuracy and the slow updating rates of the satellite remote sensing and street maps [3,27]. Machine learning algorithms, such as SegNet and Deeplab, which use deep convolutional neural network architecture, can accurately process street view image information, effectively identifying various elements in images, such as sky, sidewalks, walls, buildings, and greenery. This allows for scientific and effective quantitative research on spatial quality based on visual cognition [21,29]. Some research analyzes the influence and mechanism of objective visual elements on subjective human perception and behavior [4,18]. However, the feedback of visual and psychological perceptions brought by the vQoSS is an important reason for whether people visit or stay in the space. The vQoSS research that combines objective visual parameter evaluation and the subjective evaluation of people’s perceptions and behaviors in rural areas is still lacking.
2.2. The Relationship Between the vQoSS and Walking Behavior
Existing research has repeatedly proven that the vQoSS is closely related to pedestrians’ walking behaviors. However, regarding how the vQoSS affects pedestrians’ walking behaviors and stay willingness, due to differences in case locations, methodologies, and indicator selections, scholars have yet to reach a definitive conclusion. Several studies have proven that street greenery was positively associated with the odds, time, and distance of walking for various people, resulting in eliciting the sense of security, wellbeing, and happiness [30,31,32,33]. With the assistance of machine learning and computer vision technologies in analyzing diverse data, including street view images, diverse open data, and massive questionnaires from Shenzhen in China, Xuan He has proven that walkability exerts a strong positive role on seniors’ walking trips in the inner suburbs [34]. According to the findings of some studies, the visual elements of street spaces, such as enclosure, sky visibility, building height, street width, etc., have different effects on pedestrians’ walking behaviors in different areas. For instance, the street enclosure index does not play a significant role in walkability in the city of Dallas [35]. However, sky visibility was found to be correlated with pedestrian volume and Walk Score [36]. Meanwhile, street quality factors, such as the building-to-street ratio, greenness, and the sidewalk-to-street proportion, have a greater association with walking mode choice in Atlanta, Georgia, USA [37]. Also, the street width shows strong negative correlations with stationary activities, including cultural activities, commercial activities, sitting at cafes, standing, etc. [38,39,40].
3. Study Area and Data Sources
3.1. Study Area
This paper selects Huangcun Village in Yixian County, Huangshan City, which was included in the second batch of traditional village lists in China, as the research area. Huangcun Village is located 8 km from the ancient Yixian County seat, in the southwest of Biyang Town, and was historically known as “West City”. The village was established during the Song Dynasty and was originally inhabited by the Huang family. The village was named after the family surname. During the Ming and Qing Dynasties, the village’s economy and culture were particularly developed, earning it the reputation of “Golden Huangcun Village”. Huangcun Village has well preserved its original historical form, with the old street of Huangcun Village as the main spatial artery, connecting about 15 small alleys and forming a vein-like street pattern. The traditional buildings on both sides of the main streets, including the Huang Shiling Memorial Hall and West City Academy, have become the core tourist routes of Huangcun Village [41]. This paper selects its research scope based on the actual area of the village for street view data collection, with a research area of about 15.42 hectares (Figure 1).
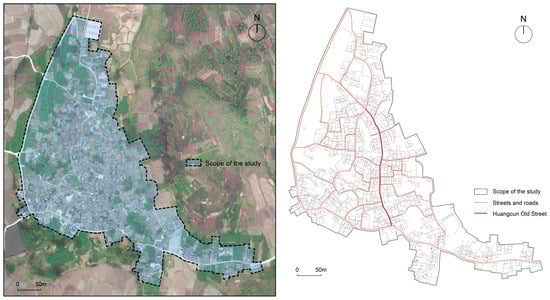
Figure 1.
Study area and route.
3.2. Street View Image Data Collection and Screening
In traditional villages, tourists mostly walk as their main way of sightseeing, and their visual perception of the street space is also obtained by slowly moving within the streets [42]. To obtain street view images that are as close as possible to the real spatial view, this study uses manual street view image collection. Cameras mounted on stabilizers are used to record the entire route while walking along predetermined paths, adjusting the camera height to about 1.5 m from the ground and maintaining a horizontal direction without pitch angles to simulate a normal walking perspective (Figure 2). The collection of street view images was carried out on sunny days, and a total of 2500 street view images were collected. After clarifying the street network in the research area, sampling points were set every 8 m (Figure 3), resulting in 433 screened street view images. Examples of the collected and screened street view images are displayed (Figure 4).
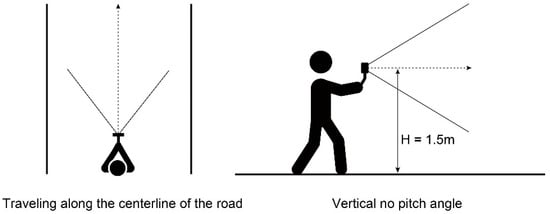
Figure 2.
Schematic of pedestrian simulation acquisition image.
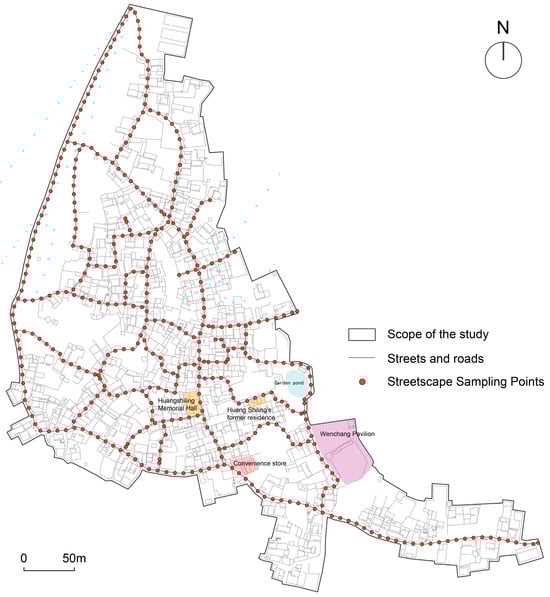
Figure 3.
Street view image sampling point distribution.
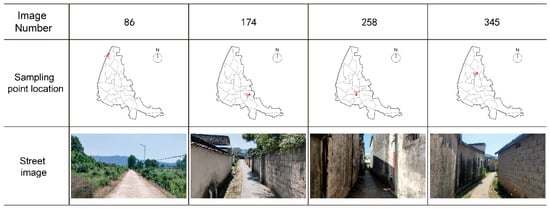
Figure 4.
Example of street view image sampling.
4. Research Methods
4.1. Research Framework
With the research goal of determining the effect of the vQoSS on tourists’ stay willingness in a traditional village, this study combines computer vision, visual perception, and machine learning methods. The technical route is divided into three parts: obtaining spatial descriptive indicators, subjective evaluation and prediction, and analyzing the correlation between human perception and spatial–visual characteristics (Figure 5). Based on the semantic segmentation of computer vision, spatial–visual elements in images are obtained, and spatial descriptive indicators are calculated. Then, subjective evaluation results are obtained using the Trueskill algorithm, combined with machine learning prediction to obtain the overall evaluation value and spatial distribution of tourists’ stay willingness. Finally, in the correlation analysis stage, the relationship between objective visual spatial factors and tourists’ subjective stay willingness is analyzed, thereby identifying the impact of various spatial descriptive indicators.
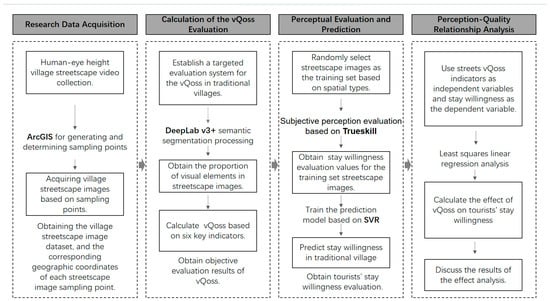
Figure 5.
Research path and methodology.
4.2. Construction of Objective Evaluation Index System
The spatial–visual factors and scale of the streets of traditional villages in Southern Anhui have characteristics such as narrow streets, fewer streets with long access distances and high accessibility, harder access for motorized vehicles and cycling vehicles, and tourists walking as their main way of touring. Therefore, this paper focuses on the walking scale and visual parameters of tourists and determines the relevant evaluation indices from three aspects: the street space, street and building transition space, and building façade. The space dimension of streets includes the cross-section proportion of streets, walkability, and sky openness. In terms of the spatial dimension of street and building transitions, the enclosure of various elements of the streets and the proportion of green elements in the visual field can affect the richness of the village streets and tourist stay willingness to a certain extent. In terms of the architectural façade dimension, as an important part of the traditional village in Southern Anhui, the characteristic Huizhou-style building façade accounts for a relatively large part of a tourist’s visual field. The sense of architectural enclosure and the expression of Huizhou-style architecture can be perceived to a greater extent, so the perception of the façade focuses on the level of architectural scale and the existence of historical architectural style. So, the value of the traditional village tour is selected as an evaluation index. To summarize, this paper develops an evaluation system for tourists’ willingness to stay in the street spaces of traditional villages in Southern Anhui with the indicators of the green view index, street enclosure index, sky visibility index, walkability, cross-sectional proportion, and traditional architectural tour value and the related visual elements and calculation formulas (Table 1).

Table 1.
Indicators for evaluating the vQoSS of a traditional village.
4.3. Tourists’ Subjective Stay Willingness Evaluation Based on Trueskill Algorithm
In order to capture tourists’ subjective stay willingness, this study employed an image evaluation ranking method. After categorizing the street visual features, street view images were randomly selected to form a training set, which served as the subject for the human perception evaluation. These images cover various categories of street visual characteristics in a traditional village. The respondents of the study included experts and scholars in the fields of architecture and urban planning, as well as general tourists. During the testing process, respondents were shown two different street view images simultaneously and were asked to select the image representing the space where they would prefer to stay, based on their perception of the street space. Each respondent was required to complete 50 to 100 test pairs to reduce any errors caused by incidental biases in individual tests.
5. Empirical Study
5.1. Acquisition of Spatial Descriptive Indicators
5.1.1. Segmentation and Extraction of Image Features
The proportion of physical features in street view images represents the visual element perception of pedestrians to some extent. To efficiently extract the visual index of each spatial element from street view images, this study uses the DeepLab v3 algorithm based on the GluonCV computer vision deep learning tool from the MXNet deep learning library to segment and extract the physical features of street view images (Figure 6). The semantic segmentation model trained with the ADE20K dataset is selected, which can effectively handle the segmentation task of complex spatial environments in traditional villages. Examples of randomly selected Huangcun Village street space images and their semantic segmentation results are shown in Figure 7.
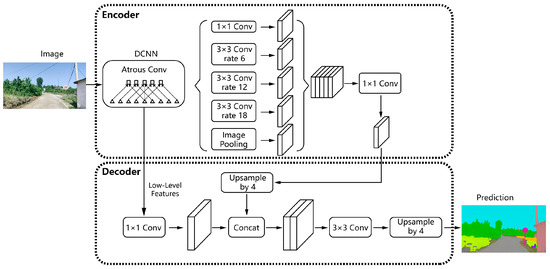
Figure 6.
DeepLab v3 algorithmic network architecture.
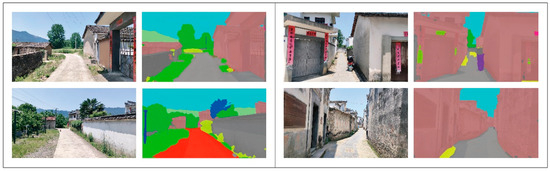
Figure 7.
Example of semantic segmentation results.
5.1.2. Calculation of Visual Quality Evaluation Indicators
After the semantic segmentation of 433 street view images using the DeepLab v3 algorithm, each street view image is ultimately segmented into color groups based on the physical features it contains. The results of physical feature extraction are used to calculate the green view index, sky visibility index, street enclosure index, and walkability. Meanwhile, the touring value of traditional buildings is statistically evaluated based on manual auditing methods, and some results are displayed in Table 2.
Table 2.
Spatial–visual quality indicator data at sampling sites (partial).
Additionally, the cross-sectional proportion (street width-to-building height ratio) of each sampling point is calculated using ArcGIS geographical measurement. The street width value is the distance from the road centerline to the buildings on both sides at any sampling point. If there are no buildings on either side of the road or only on one side, the distance from the road centerline to the roadside is used as the corresponding street width value. The building height value is the height of the buildings on both sides of the road. If the buildings are of equal height, the corresponding height is taken; if the buildings are of unequal height, the average height is taken; if there is no building on one side, half the height of the building on the other side is taken; if there are no buildings on either side, the value is considered to be approximately infinite. When there are only walls on both sides of the road instead of actual buildings, the height of the walls is calculated based on their actual existence.
5.2. Subjective Evaluation and Prediction of Tourists’ Stay Willingness
5.2.1. Subjective Perception Evaluation of Images Based on the Trueskill Algorithm
Converting subjective human perception into quantifiable evaluation results is a key point in image perception studies. This study uses the Trueskill algorithm to convert test subjects’ preferences of stay willingness for each street view image into quantifiable scores. This algorithm uses a Bayesian model to score competing objects.
In this study, an online questionnaire system was designed based on the Trueskill algorithm. When an image is selected in a test, it is considered the winner of that competition. Each image’s score is initially modeled as a random variable and updated after each test. When an image wins a competition, its variable increases accordingly. For example, in a competition between images x and y, if x wins, the results are as follows:
where and are the true evaluations of images x and y, respectively. The constant β represents the variance in each competition, ε is the estimated probability of a tie based on experience, and functions f(θ) = N(θ)/Φ(θ) and are defined using the normal probability density function and the normal cumulative density function Φ(θ) [43]. As the testing progresses, higher-scoring images are more likely to be matched with other high-scoring images, resulting in more realistic evaluation outcomes.
In preliminary testing, when each image is selected an average of 12–36 times, its score tends to stabilize. To ensure reliable experimental results, each image is set to be matched 32 times, ideally being selected 16 times, thereby ensuring relatively stable willingness-to-stay scores and rankings.
5.2.2. Prediction of Tourists’ Stay Willingness Evaluation
To explore the feasibility of machine learning prediction methods in the quantitative research direction of the vQoSS in traditional villages and the possibility of large-scale perception evaluation, we conducted an artificial perception evaluation on 221 images. Using the evaluation results as labels, we trained a machine learning model to predict the stay willingness scores for the entire Huangcun Village street space based on visual indices and traditional architectural element evaluations.
The 221 samples were randomly divided into 70% for model training and 30% for testing. We tested machine learning models commonly used for predicting categories and continuous labels, such as Lasso Regression, Extreme Gradient Boosting (XGB), K-Nearest Neighbors (KNN), Random Forest (RF), and Support Vector Machine (SVR) (Table 3). By comparing the R-squared values (r2 score) and mean squared errors (MSE) of these models, the best-performing prediction model was selected. The SVR-based model performed best, with an R-squared value of 0.314 and a mean squared error of 302. Therefore, the SVR algorithm was chosen as the model for predicting willingness to stay (Figure 8).
Table 3.
Comparison of machine learning algorithm performance.
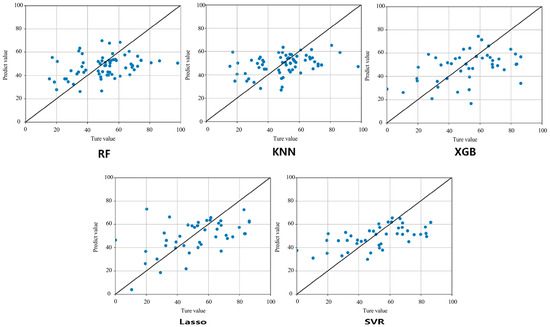
Figure 8.
Predictive model scatterplot.
The subjective inclination towards tourists’ stay willingness is not only related to objective visual elements such as the buildings, greenery, and sky visible to the eye, but it is also influenced by the respondent’s personality, personal preferences, mood, past experiences, and other factors. Given that human behavior and complex social phenomena are influenced by numerous factors, explaining the evaluation of human behavior from a single perspective is inherently limited. Therefore, the tourist stay willingness prediction model, trained on visual elements from street view images, can explain part of the results. It is reliable and acceptable within a certain range.
6. Experimental Results and Analysis
6.1. Analysis of Visual Quality of Street Space
Using ArcGIS for geographic processing of the above indicator parameters, each sampling point is assigned parameter proportion attributes and visualized (Figure 9). The quantitative results of these six evaluation indicators show significant spatial differences. The spatial variations are most noticeable between the western external space and the central street and alley spaces, specifically. ① Green view index: The average green view index is 0.182, indicating that the overall coverage of green plants in the street spaces of the traditional village is low and is observed by tourists to a lesser extent. Spatially, the rural roads on the west side of Huang Village have a higher green view index due to the extensive green vegetation along both sides, primarily comprising farmland. Similarly, the green view index around the Huang Shiling residence on the east side is higher. Areas with a low green view index are concentrated in the old streets of Huang Village and the western street and alley spaces, characterized by dense building distribution and minimal green plants. ② Sky visibility index: The average sky visibility index is 0.141. The proportion of sky elements is lower in the internal street and alley spaces of the village and relatively higher in the peripheral areas, exhibiting a “high peripheral, low central” pattern. The street spaces with a high sky visibility index in the central traditional streets are scattered and uniformly distributed, reflecting the features and appearance of the traditional village layout in Southern Anhui. ③ Street enclosure index: The average street enclosure index is 0.485, suggesting a strong sense of enclosure in the street and alley spaces of Huang Village, with many buildings or walls on both sides and low interface permeability. Higher street enclosure indices are centrally clustered around the main streets. Older buildings tend to have larger volumes and interfaces, leading to a higher street enclosure index. ④ Walkability: The average walkability is 0.144, with minimal overall variation. High-walkability spaces are few, aligning with the narrow street characteristics of traditional village spaces. ⑤ Cross-sectional proportion: The average street cross-sectional proportion is 1.307, with a width-to-height ratio between 1 and 2, allowing tourists to observe the overall and detailed architectural effects. Higher width-to-height ratios are primarily in newly built residential areas, where buildings are relatively shorter and constructed on open, flat areas away from the old streets. ⑥ Tour value of traditional buildings: The average tour value of traditional buildings is 1.079, indicating that most buildings in Huang Village are modern. The tour value gradually decreases outward from Huang Shiling Memorial Hall, showing a ring-layered phenomenon due to the higher tour value of ancient dwellings or ancestral halls along the old streets.
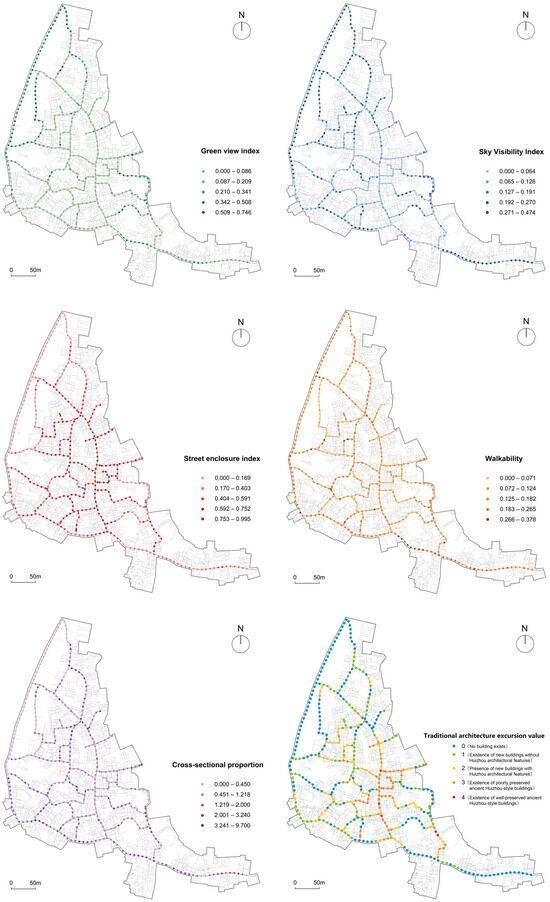
Figure 9.
Distribution of street visual quality sampling point data.
These results reflect the average values and spatial differences of six indicators in Huangcun Village, showing a “central traditional old street–peripheral new area” pattern. The central old street areas have fewer green plants, a dense building distribution, higher building protection and heights, and narrow roads, while the peripheral areas are the opposite. These characteristics align with the overall impression and features of traditional villages in Southern Anhui, indicating that Huangcun Village retains the spatial texture and architectural style of traditional villages well.
6.2. Analysis of Tourists’ Subjective Stay Willingness in Streets
All subjective and predicted willingness-to-stay scores were normalized using the standard deviation normalization formula:
where ai represents the tourists’ stay willingness score of a certain sampling point, and Zi represents the normalized final tourists’ stay willingness score.
ArcGIS was used to visually express the final tourist stay willingness scores (Figure 10). The key to the tourist stay willingness scores comes from the comparison results of each street view image tested. Relatively speaking, the street spaces in traditional villages with higher preservation values and better appearances, as well as identifiable, symbolic, and indicative spaces, are more likely to exhibit unique traditional village styles and attract tourists’ favor.
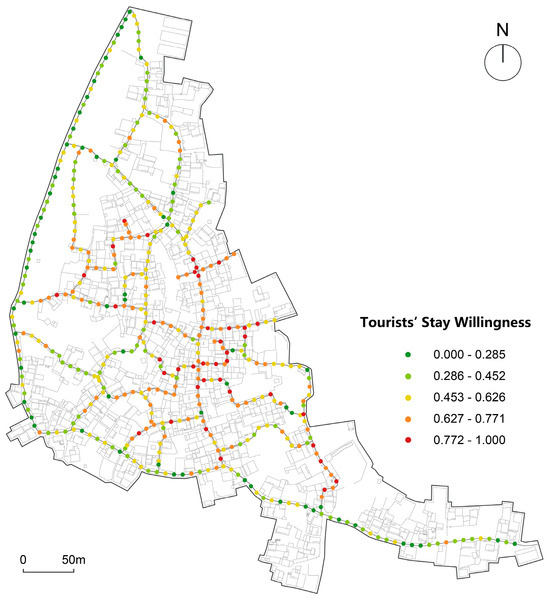
Figure 10.
Distribution of intention-to-stay score data.
The average tourist stay willingness score is 0.537, with approximately 14% of the sampling points scoring above 0.77, mainly concentrated in Huangcun Village Old Street and its adjacent streets, as well as near Wenchang Pavilion, with the Huang Shiling Memorial sampling point scoring particularly high. The scores decrease towards the outer areas of the village, showing a clear “center–periphery” difference. It can be seen that tourists are more willing to stay or visit spaces with historical preservation value, while their stay willingness in areas with a higher green view index on the periphery is lower. However, in places like Wenchang Pavilion, which has both a large amount of greenery and traditional buildings, the tourist stay willingness score is higher. This indicates that in traditional villages, traditional buildings and structures are more likely to be the spaces where tourists prefer to visit and stay.
This result further verifies the spatial distribution results of various descriptive indicators calculated through computer vision analysis. However, there is still a certain difference between the calculation results based on objective visual elements and those based on subjective human perception. The main reason for this difference is the preference of human environmental perception and some uncalculated indicators related to human activities, such as the cleanliness, dilapidation, and orderliness of the streets, which are very important for subjective human perception but are difficult to quantify and calculate in computer vision analysis and prediction.
In summary, the evaluation system of visual quality of street space in traditional villages established in this research can relatively accurately reflect the actual conditions of Huang Village and is applicable for assessing the visual quality of streets in traditional villages in Southern Anhui. Other rural areas can adjust characteristic indicators on this basis to derive a more targeted and feasible evaluation system. For example, in the study of water villages, indicators such as the continuity or visibility of water bodies can be incorporated into the evaluation system.
6.3. Discussion on Influence Mechanisms
Compared with previous studies on the relationship between street spatial quality evaluation and pedestrian walking behavior, the analytical framework established in this research for the effect of visual quality of street space on tourists’ willingness to stay in traditional village streets achieves theoretical expansion in specific region (traditional villages), certain aspect (visual perception), and a particular type of pedestrian walking behavior (standard activities). Using the spatial descriptive indicators as independent variables and tourist’ stay willingness prediction results as the dependent variable, a least squares linear regression analysis was conducted. The standardized coefficient Beta and the adjusted R2 value of the regression fit were used to compare the impact of each feature on friendliness (Table 4). In the diagnostic analysis of the regression, we examined the issue of multicollinearity. By calculating the variance inflation factor (VIF), we found that the VIF values of all independent variables did not exceed 10, indicating that there are no severe multicollinearity problems in the regression model. Moreover, all regression coefficients had p-values that reached statistical significance, with p-values below 0.05 (see Table 4). These results suggest that the effects of the regression coefficients are significant and that each independent variable has a statistically significant impact on tourists’ stay willingness.
Table 4.
Results of regression analysis of spatial characteristics of walking.
In the spatial descriptive indicators of traditional villages, the street enclosure index can reflect the proportion of traditional buildings and interfaces in the field of vision in Southern Anhui traditional villages: the larger the enclosure, the greater the proportion of traditional buildings and interfaces in the field of vision, and the higher the tourists’ stay willingness. The higher the sky visibility index—that is, the higher the proportion of the sky area in the field of vision—the lower the tourists’ stay willingness.
Walkability reflects the degree to which tourists can access street space. The lower the ratio of walkable area to total area, the lower the walkability, the narrower the road width, and the closer the road location is to the village center and historical building concentration area, the higher the tourists’ stay willingness. This indicates that tourists do not forgo entering streets because the streets are too narrow. At the same time, narrower streets tend to have fewer interface disruptions and are more dominated by pure horse-head wall interfaces, which are more attractive to tourists.
The appearance of buildings, as an embodiment of the historical and cultural characteristics of traditional villages in Southern Anhui, has a certain impact on tourists’ willingness to stay due to differences in architectural style expressions and preservation conditions. Tourists have a higher stay willingness around traditional Huizhou-style buildings, and as the construction age increases and preservation conditions improve, the tourists’ stay willingness scores increase accordingly. This indicates that improvements in building appearance make the distinctive spatial image of traditional villages in Southern Anhui more prominent, making them more attractive to tourists.
The green vision index in villages generally increases from the village center to the periphery. The closer to the periphery, the fewer the elements associated with traditional Huizhou-style buildings and the higher the green vision index, which may lead to some obstruction of building interfaces, resulting in a decreased tourists’ stay willingness.
The cross-sectional proportion is one way to reflect the sense of enclosure of village streets. The larger the ratio of street width to the height of buildings along the street, the lower the sense of enclosure and the lower the tourists’ stay willingness. The cross-sectional width-to-height ratio and enclosure are negatively correlated with tourists’ stay willingness, but the regression fit street enclosure index is higher. This indicates that although the cross-sectional width-to-height ratio can accurately reflect the physical form of the streets, it still has some deviation from subjective perception in reflecting comprehensive visual quality.
This indicates that there are some differences in evaluation results of the vQoSS between the traditional villages in Southern Anhui and urban areas. Tourists tend to prefer narrow streets with traditional Huizhou architectural features when choosing walking routes, and their focus is primarily on traditional buildings and structures. In contrast, there is less attention paid to natural landscapes in villages, which are typically considered to attract tourists. This analysis result differs somewhat from the common factors influencing tourists’ stay willingness in general tourist attractions.
This difference in tourists’ stay willingness is consistent with the spatial characteristics of traditional villages in Southern Anhui. Huangcun Village, as a cluster-shaped settlement in the hilly region, has a compact layout with a grid-like street network that forms the framework of the settlement. In traditional villages in Southern Anhui, the street spaces are among the most distinctive spatial elements. Apart from commercial streets, most village streets are narrow, and in ancient times, gates were set up in narrow streets to ensure the safety of villagers [44]. Specifically, in the case of Huangcun Village, which has undergone development and changes, there is a clear distinction between the “central traditional old street” and the “peripheral new construction area.” The central area of Huangcun Village, including the old streets, is characterized by sparse greenery, dense building distribution, high building heights, and narrow roads. The high enclosure of the space is largely due to the tall building façades that create narrow streets. Tall façades are a typical feature of traditional Huizhou dwellings, and these high, enclosed walls create a strong sense of closure for the courtyards. The courtyards are illuminated and ventilated through skylights, and rainwater is guided away, reflecting the life philosophy of merchants and scholars in ancient Huizhou [45]. Therefore, the higher the street enclosure index of street and alley spaces within a certain range, the more characteristic and charming the streets are in the style of ancient Huizhou.
6.4. Limitations of the Study
This study uses Huangcun Village as the research area. As a representative traditional Huizhou-style village, Huangcun Village possesses the typical spatial characteristics of general Huizhou-style villages. Therefore, the conclusions derived from the research and the perceptual prediction model based on Huangcun Village can be extended to other traditional villages in the ancient Huizhou region. However, due to Huangcun Village’s relatively small size, lack of sufficient green space, and limited commercial development, the findings may have certain particularities. The generalizability of specific conclusions requires careful analysis, particularly considering the differences between traditional villages of varying sizes, stages of preservation, and commercial development models.
There are also certain limitations in the methodology of this study. Firstly, the study used manually recorded video screenshots by the researchers to replace on-site audits, which may introduce recording biases due to variations in viewing angles and walking speeds. This could result in incomplete representations of the street landscapes in the screenshots. To address this, future studies could incorporate drone footage or real-world scanning to supplement scene data collection. Additionally, the study was conducted on a spring weekday afternoon, and the limited number of tourists observed in the captured images introduces a deviation from the characteristics of tourism-oriented villages. Further data collection should be conducted during peak tourist seasons, such as summer and autumn, while also considering different weather conditions to reduce error.
Moreover, in the selection of vQoSS evaluation indicators for traditional villages, this study primarily focused on indicators that could be derived from street view images. Future research could expand the selection of indicators to include dimensions such as street cleanliness, spatial order, commercial vitality, and crowd activity, enriching the reliability of the study. Furthermore, the sample size in this study is limited due to the scale of the village, resulting in a relatively small number of samples for learning and prediction, which leaves room for further refinement of tourists’ stay willingness predictions. In future research, to enhance the objectivity of audits, fine-grained street view images from multiple locations and villages will be incorporated to assess the overall spatial condition, thus making the research conclusions more applicable for broader generalization.
7. Conclusions
The study confirmed the effect of the vQoSS measured by street view images on tourist stay willingness in the traditional village of Huangcun Village. The findings from our study indicate that the role of street visual elements, such as enclosure and buildings, positively influences individual stay willingness in a traditional village. The findings also provide evidence that street visual elements, such as sky visibility, walkability, greenness, building height, and street width, have negative effects on tourists’ willingness to stay in a traditional village. It can be observed that there are significant differences between urban areas and traditional villages in research findings regarding the impacts of the vQoSS on pedestrians’ walking behaviors. The speculated reason is that the compact street layout and distinctive architectural features of traditional villages in southern Anhui serve as the most appealing characteristics for tourists’ walking experiences. Under this situation, street spaces in traditional villages with high enclosure and low sky visibility have become the most preferred spaces for tourists during walks and stationary activities.
From a traditional village planner’s perspective, striving towards a walking tourism-friendly village design remains an important challenge, including the decision to build new modern architectures and open spaces in synergy with protecting pre-existing traditional architectures and street layouts. This study suggests that government and urban planners need to develop street design strategies in traditional villages from pedestrian and tourist perspectives. For instance, when creating experiential spaces in traditional village streets, this should include choosing spaces with a certain sense of enclosure rather than open spaces. In spaces where tourists are willing to stay in streets, traditional cultural experiences and tourism service facilities should be added for visitor use.
The research on the visual quality of traditional village streets, considering China’s rural development stage, cultural and social background, and morphological characteristics, remains insufficient. Future research should incorporate more variables to accurately measure street visual quality with the assistance of artificial intelligence technology while objectively quantifying street visual quality. Meanwhile, it is essential to further explore the street quality elements that influence tourists’ walking behaviors and to analyze the related effect mechanisms to collect information for subsequent street design.
Author Contributions
Conceptualization, L.T. and X.J.; methodology, L.T. and X.J.; software, X.J.; validation, X.J., Y.G., and Q.Q.; formal analysis, X.J.; investigation, X.J., Y.G., and Q.Q.; resources, X.J., Y.G., and Q.Q.; data curation, L.T. and X.J.; writing—original draft preparation, L.T. and X.J.; writing—review and editing, L.T. and X.J.; visualization, X.J.; supervision, L.T.; project administration, L.T.; funding acquisition, L.T. All authors have read and agreed to the published version of the manuscript.
Funding
This research was funded by the Anhui Provincial Project for Youth Researchers in Philosophy and Social Sciences, grant number AHSKQ2022D174.
Data Availability Statement
The original contributions presented in the study are included in the article, further inquiries can be directed to the corresponding author.
Conflicts of Interest
The authors declare no conflicts of interest.
References
- Tang, J.; Long, Y. Measuring visual quality of street space and its temporal variation: Methodology and its application in the Hutong area in Beijing. Landsc. Urban Plan. 2019, 191, 103436. [Google Scholar] [CrossRef]
- Harvey, C.; Aultman-Hall, L.; Hurley, S.E.; Troy, A. Effects of skeletal streetscape design on perceived safety. Landsc. Urban Plan. 2015, 142, 18–28. [Google Scholar] [CrossRef]
- Xu, X.; Qiu, W.; Li, W.; Liu, X.; Zhang, Z.; Li, X.; Luo, D. Associations between Street-View Perceptions and Housing Prices:Subjective vs. Objective Measures Using Computer Vision and Machine Learning Techniques. Remote Sens. 2022, 14, 891. [Google Scholar] [CrossRef]
- Ma, S.; Wang, B.; Liu, W.; Zhou, H.; Wang, Y.; Li, S. Assessment of street space quality and subjective well-being mismatch and its impact, using multi-source big data. Cities 2024, 147, 104797. [Google Scholar] [CrossRef]
- Zhu, X.; Bai, M.; Bai, Y. Evaluation of Street Space Renovation in Historic Areas Using Deep Learning Based on Street View Imagery in the Human Visual Field. China City Plan. Review. 2024, 33, 25–34. [Google Scholar]
- Natural Resource Defense Council. Evaluation of Walkability in Chinese Cities (Periodic Reports). 2014. Available online: http://www.nrdc.cn/Public/uploads/2016-12-02/58416c0a65c05.pdf (accessed on 1 June 2025).
- Natural Resource Defense Council. Evaluation of Walkability in Chinese Cities:Research on Promoting Walking Based on Street Functions. 2017. Available online: http://www.nrdc.cn/Public/uploads/2017-12-15/5a336e65f0aba.pdf (accessed on 1 June 2025).
- Natural Resource Defense Council. Evaluation of Walkability in Chinese Cities:Research on the Walkability of Urban Vitality Centers. 2019. Available online: http://www.nrdc.cn/Public/uploads/2019-10-23/5db00acc2661c.pdf (accessed on 1 June 2025).
- Natural Resource Defense Council. Evaluation of Walkability in Chinese Cities: A Study on the Improvement Status of Sidewalk Facilities. 2021. Available online: http://www.nrdc.cn/Public/uploads/2021-09-22/614aae8cc54f7.pdf (accessed on 1 June 2025).
- Easteal, M.; Bannister, S.; Kang, J.; Aletta, F.; Lavia, L.R.; Witchel, H.J. Urban sound planning in Brighton and Hove. In Proceedings of the Forum Acusticum, Krakow, Poland, 7–12 September 2014. [Google Scholar]
- Aletta, F.; Lepore, F.; Kostara-Konstantinou, E.; Kang, J.; Astolfi, A. An Experimental Study on the Influence of Soundscapes on People’s Behaviour in an Open Public Space. Appl. Sci. 2016, 6, 276. [Google Scholar] [CrossRef]
- Aiello, L.M.; Schifanella, R.; Quercia, D.; Aletta, F. Chatty maps: Constructing sound maps of urban areas from social media data. R. Soc. Open Sci. 2016, 3, 150690. [Google Scholar] [CrossRef]
- Zhang, F.; Zhou, B.; Liu, L.; Liu, Y.; Fung, H.H.; Lin, H.; Ratti, C. Measuring human perceptions of a large-scale urban region using machine learning. Landsc. Urban Plan. 2018, 180, 148–160. [Google Scholar] [CrossRef]
- Yao, Y.; Wang, J.; Hong, Y.; Qian, C.; Guan, Q.; Liang, X.; Dai, L.; Zhang, J. Discovering the homogeneous geographic domain of human perceptions from street view images. Landsc. Urban Plan. 2021, 212, 104125. [Google Scholar] [CrossRef]
- Ma, X.; Ma, C.; Wu, C.; Xi, Y.; Yang, R.; Peng, N.; Zhang, C.; Ren, F. Measuring human perceptions of streetscapes to better inform urban renewal: A perspective of scene semantic parsing. Cities 2021, 110, 103086. [Google Scholar] [CrossRef]
- Wei, J.; Yue, W.; Li, M.; Gao, J. Mapping human perception of urban landscape from street-view images: A deep-learning approach. Int. J. Appiled Earth Obs. Geoinf. 2022, 112, 102886. [Google Scholar] [CrossRef]
- Rui, Q.; Cheng, H. Quantifying the spatial quality of urban streets with open street view images: A case study of the main urban area of Fuzhou. Ecol. Indic. 2023, 156, 11. [Google Scholar] [CrossRef]
- Rui, J. Measuring streetscape perceptions from driveways and sidewalks to inform pedestrian-oriented street renewal in Düsseldorf. Cities 2023, 141, 104472. [Google Scholar] [CrossRef]
- Li, K. Research on the Factors Influencing the Spatial Quality of High-Density Urban Streets: A Framework Using Deep Learning, Street Scene Images, and Principal Component Analysis. Land 2024, 13, 1161. [Google Scholar] [CrossRef]
- Li, T.; Xu, H.; Sun, H. Spatial Patterns and Multi-Dimensional Impact Analysis of Urban Street Quality Perception under Multi-Source Data: A Case Study of Wuchang District in Wuhan, China. Appl. Sci. 2023, 13, 11740. [Google Scholar] [CrossRef]
- Li, P.; Xu, Y.; Liu, Z.; Jiang, H.; Liu, A. Evaluation and Optimization of Urban Street Spatial Quality Based on Street View Images and Machine Learning: A Case Study of the Jinan Old City. Buildings 2025, 15, 1408. [Google Scholar] [CrossRef]
- Wang, J.; Hu, Y.; Duolihong, W. Diagnosis and Planning Strategies for Quality of Urban Street Space Based on Street View Images. ISPRS Int. J. Geo-Inf. 2023, 12, 15. [Google Scholar] [CrossRef]
- Li, X.; Pang, C. A Spatial Visual Quality Evaluation Method for an Urban Commercial Pedestrian Street Based on Streetscape Images—Taking Tianjin Binjiang Road as an Example. Sustainability 2024, 16, 1139. [Google Scholar] [CrossRef]
- Duan, J.; Liao, J.; Liu, J.; Gao, X.; Shang, A.; Huang, Z. Evaluating the Spatial Quality of Urban Living Streets: A Case Study of Hengyang City in Central South China. Sustainability 2023, 15, 10623. [Google Scholar] [CrossRef]
- Liang, H.; Zhang, J.; Li, Y.; Wang, B.; Huang, J. Automatic Estimation for Visual Quality Changes of Street Space via Street-View Images and Multimodal Large Language Models. IEEE Access 2024, 12, 87713–87727. [Google Scholar] [CrossRef]
- Li, X.J.; Zhang, C.; Li, W. Does the Visibility of Greenery Increase Perceived Safety in Urban Areas? Evidence from the Place Pulse 1.0 Dataset. ISPRS Int. J. Geo-Inf. 2015, 4, 1166–1183. [Google Scholar] [CrossRef]
- Zhang, J.; Hu, A. Analyzing green view index and green view index best path using Google street view and deep learning. J. Comput. Des. Eng. 2022, 9, 2010–2023. [Google Scholar] [CrossRef]
- Wang, R.; Huang, C.; Ye, Y. Measuring Street Quality: A Human-Centered Exploration Based on Multi-Sourced Data and Classical Urban Design Theories. Buildings 2024, 14, 3332. [Google Scholar] [CrossRef]
- Yao, T.; Xu, Y.; Sun, L.; Liao, P.; Wang, J. Application of Machine Learning and Multi-Dimensional Perception in Urban Spatial Quality Evaluation: A Case Study of Shanghai Underground Pedestrian Street. Land 2024, 13, 1354. [Google Scholar] [CrossRef]
- Sarkar, C.; Webster, C.; Pryor, M.; Tang, D.; Melbourne, S.; Zhang, X.; Jianzheng, L. Exploring associations between urban green, street design and walking: Results from the Greater London boroughs. Landsc. Urban Plan. 2015, 143, 112–125. [Google Scholar] [CrossRef]
- Lu, Y.; Sarkar, C.; Xiao, Y. The effect of street-level greenery on walking behavior: Evidence from Hong Kong. Soc. Sci. Med. 2018, 208, 41–49. [Google Scholar] [CrossRef]
- Yang, Y.; He, D.; Gou, Z.; Wang, R.; Liu, Y.; Lu, Y. Association between Street Greenery and Walking Behavior in Older Adults in Hong Kong. Sustain. Cities Soc. 2019, 51, 101747. [Google Scholar] [CrossRef]
- Li, Y.; Wang, Y.; Du, Y.; Yang, M.; Zhang, N. Study on the Evaluation of Security Perception in Tourist Street Space and its Influencing Factors Based on Machine Learning: Taking Gulangyu Island in Xiamen as an Example. China Anc. City 2025, 39, 78–88. [Google Scholar] [CrossRef]
- He, X.; He, S.Y. Decoding the spatial effects of walkability on walking behavior among older adults by integrating big data and small data. Cities 2025, 156, 105537. [Google Scholar] [CrossRef]
- Hamidi, S.; Moazzeni, S. Moazzeni. Examining the Relationship between Urban Design Qualities and Walking Behavior: Empirical Evidence from Dallas, TX. Sustainability 2019, 11, 2720. [Google Scholar] [CrossRef]
- Yin, L.; Wang, Z. Measuring visual enclosure for street walkability: Using machine learning algorithms and Google Street View imagery. Appl. Geogr. 2016, 76, 147–153. [Google Scholar] [CrossRef]
- Koo, B.W.; Guhathakurta, S.; Botchwey, N. How are Neighborhood and Street-Level Walkability Factors Associated with Walking Behaviors? A Big Data Approach Using Street View Images. Environ. Behav. 2022, 54, 211–241. [Google Scholar] [CrossRef]
- Xu, L.; Kang, Q. The Relationship between Pedestrian Behaviors and the Spatial Features along the Ground-floor Commercial Street: The case of West Nanjing Road in Shanghai. Urban Plan. Forum 2014, 3, 8. [Google Scholar]
- Herrmann-Lunecke, M.G.; Mora, R.; Vejares, P. Perception of the built environment and walking in pericentral neighbourhoods in Santiago, Chile. Travel Behav. Soc. 2021, 23, 192–206. [Google Scholar] [CrossRef]
- Istrate, A.-L. Street Vitality: What Predicts Pedestrian Flows and Stationary Activities on Predominantly Residential Chinese Streets, at the Mesoscale? J. Plan. Educ. Res. 2025, 45, 66–80. [Google Scholar] [CrossRef]
- Conservation and Utilization Plan for the Historic Village of Huang, Yi County; People’s Government of Biyang Town: Huangshan, China, 2011.
- Ye, Y.; Zeng, W.; Shen, Q.; Zhang, X.; Lu, Y. The visual quality of streets: A human-centred continuous measurement based on machine learning algorithms and street view images. Environ. Plan. B Urban Anal. City Sci. 2019, 46, 1439–1457. [Google Scholar] [CrossRef]
- Herbrich, R.; Minka, T.; Graepel, Y. Trueskill: A bayesian skill rating system. In Advances in Neural Information Processing Systems; Curran Associates: New York, NY, USA, 2006; pp. 569–576. [Google Scholar]
- Wang, Y. Spatial Structure Characteristics of Huizhou Ancient Villages from the Perspective of Crime Prevention. Urban Plan. 2020, 44, 87–94. [Google Scholar]
- Lu, L.; Lin, S.; Jiao, H.; Wang, L. A Study on the Landscape Characteristics and Mechanism of Ancient Villages in Huizhou. Sci. Geogr. Sin. 2004, 24, 660–665. [Google Scholar]


Disclaimer/Publisher’s Note: The statements, opinions and data contained in all publications are solely those of the individual author(s) and contributor(s) and not of MDPI and/or the editor(s). MDPI and/or the editor(s) disclaim responsibility for any injury to people or property resulting from any ideas, methods, instructions or products referred to in the content. |
© 2025 by the authors. Licensee MDPI, Basel, Switzerland. This article is an open access article distributed under the terms and conditions of the Creative Commons Attribution (CC BY) license (https://creativecommons.org/licenses/by/4.0/).