Article

Redefining Urban Boundaries for Health Planning Through an Equity Lens: A Socio-Demographic Spatial Analysis Model in the City of Rome

by
Elena Mazzalai
1,
Susanna Caminada
1,
Lorenzo Paglione
2,* and
Livia Maria Salvatori
1
1
Health District III, ASL Roma 1, 00193 Rome, Italy
2
Department of Prevention, ASL Roma 1, 00193 Rome, Italy
*
Author to whom correspondence should be addressed.
Land 2025, 14(8), 1574; https://doi.org/10.3390/land14081574
Submission received: 20 June 2025 / Revised: 28 July 2025 / Accepted: 30 July 2025 / Published: 31 July 2025

Abstract

Urban health planning requires a multi-scalar understanding of the territory, capable of capturing socio-economic inequalities and health needs at the local level. In the case of Rome, current administrative subdivisions—Urban Zones (Zone Urbanistiche)—are too large and internally heterogeneous to serve as effective units for equitable health planning. This study presents a methodology for the territorial redefinition of Rome’s Municipality III, aimed at supporting healthcare planning through an integrated analysis of census sections. These were grouped using a combination of census-based socio-demographic indicators (educational attainment, employment status, single-person households) and real estate values (OMI data), alongside administrative and road network data. The resulting territorial units—21 newly defined Mesoareas—are smaller than Urban Zones but larger than individual census sections and correspond to socio-territorially homogeneous neighborhoods; this structure enables a more nuanced spatial understanding of health-related inequalities. The proposed model is replicable, adaptable to other urban contexts, and offers a solid analytical basis for more equitable and targeted health planning, as well as for broader urban policy interventions aimed at promoting spatial justice.

1. Introduction

Social inequalities in health constitute a quantifiable issue with a profound impact on population health. Traditionally, such inequalities have been examined—within the framework of social epidemiology—as disparities in exposure, and thus in disease incidence, as well as in outcomes [1]. A substantial body of the literature addresses these phenomena. Concerning inequalities in outcomes, attention has focused particularly on factors related to healthcare facility accessibility [2], as well as on the pathways of diagnostic and clinical appropriateness—elements investigated under the auspices of evaluative epidemiology [3]. With respect to inequalities in exposure, since the initial definition and systematization of the social determinants of health [4,5], research has concentrated on individual-level variables such as educational attainment [6] and employment status [7], as well as on collective exposure metrics, including pollution [8] and other forms of environmental stressors [9].
There is growing interest in the literature in studying collective variables as well; whereas individual factors generally concern the characteristics of the person (the so-called “who you are” [10]), additional dimensions are now emerging forcefully in the scientific debate, within conceptual frameworks such as Urban Health and One Health [11,12]. These area-level variables pertain to the “where you live” and include material anthropic factors—such as the quality of the built environment, both indoor [13] and outdoor [14]; the interaction between the built environment and its surroundings, for example with respect to climate change–related phenomena [15]—as well as immaterial aspects linked, for instance, to walkability [16], characteristics of public space [17], and the presence of facilities in terms of services and functions [2].
In this sense, at the intersection of these two dimensions—particularly in urban contexts—the housing market plays a central role as a filter, mediating individuals’ economic ability to choose where to live [18,19]. Despite its relevance, this factor remains largely underexplored in the biomedical literature as an indicator of social inequality.
Social inequalities in health therefore affect disease occurrence and pose a significant challenge for health service planning. In Italy, following the reform enacted by Law 833/1978 [20], a process of managerialization was introduced with the establishment of Local Health Units (LHUs, from Azienda Sanitaria Locale in Italian) and a new organizational structure divided into Hospital, District, and Prevention levels [21]. Although the debate on issues related to managerialization falls outside the scope of this study, it is important to highlight that, to date, the existence of the so-called “territory”—namely the Health Districts and the Department of Prevention—has become central to assessing the health needs of the reference population. In this regard, these two structures now require—especially in light of the recent additional reform introduced by Ministerial Decree 77/2022 (DM 77/2022) [22], which endows LHUs with competencies in “epidemiological intelligence”—to understand, study, and act based on needs-driven planning rather than demand-driven approaches, thereby operating proactively to promote health equity by countering social inequalities in health [23].
The Italian Ministerial Decree 77/2022 further elaborates on the concept of so-called “catchment areas”, which are intended as planning tools for the structuring of healthcare services financed through the Next Generation EU framework, rather than instruments for assessing existing accessibility conditions. In this context, catchment areas are defined primarily based on population thresholds, thus delineating residential territories according to the minimum set of services to be provided to a given population.
Within the broader reorganization of territorial healthcare outlined by DM 77/2022, the catchment areas established for general practitioners (Medici di Medicina Generale, approximately 1500 residents per physician) and family counseling centers (Consultori Familiari, up to 20,000 residents) represent the elementary building blocks of the system. These thresholds form the foundational units upon which broader and more complex organizational levels—such as the Case della Comunità (Community Health Centers), serving catchment areas of approximately 40,000 inhabitants—are structured. Ensuring coherence across these different levels requires a territorial reading capable of aggregating urban areas that are homogeneous in socio-demographic and functional terms. This is essential to support a more targeted and equitable healthcare planning approach. Complex urban contexts thus pose a significant challenge for LHUs, particularly given the difficulties in studying and delineating territories due to existing administrative overlaps in their very definition [24]. The context of the Municipality of Rome (hereafter, Rome) represents an additional layer of complexity, both because of its extensive area (over 1200 km2) and the social and urban stratification present across its neighborhoods [25]. Although targeted health-promotion interventions—leveraging urban studies that integrate GIS tools, surveys, administrative data, and qualitative territorial knowledge—have yielded promising methodological advancements [26], substantial work remains to harmonize the frameworks for identifying, studying, and intervening within the territory, especially in the context of Rome.
Rome indeed exhibits numerous territorial, administrative, historical, and statistical subdivisions: the city is partitioned into 15 Municipalities (Municipi in Italian), with populations ranging from 128,048 in Municipio VIII (47.1 km2) to 313,164 in Municipio VII (47.6 km2) [27]. An additional administrative layer comprises the 155 Urban Zones (UZs) [28], which are essential for a more nuanced understanding of the city’s urban fabric [29]. This schema, devised by the Statistical Office of the Municipality of Rome Capital, was introduced in 1977 for purposes of statistical analysis, urban planning, and territorial management. The delineation of these zones is grounded in criteria of urban homogeneity and follows the principal discontinuities within the built environment. Further historical subdivisions include the so-called “Rioni” in the Historic Centre [30] and the “Quartieri” in the Historic Periphery [31].
The UZs of the Municipality of Rome Capital are, in turn, uniquely divisible into census sections, which correspond approximately to individual blocks in the consolidated urban fabric and to settlement clusters in the dispersed Urban–Rural Fringe/Rurban Landscape (or città-campagna in Italian) fabric [32]. These census sections are likewise delineated based on the principal discontinuities of the urban structure. They serve as the geographic unit through which the Italian National Institute of Statistics (ISTAT) disseminates data from the Permanent Population and Housing Census, and since the 2011 Census, Rome has comprised 13,506 such sections [24].
Recently, thanks to a renewed drive by the Municipality of Rome to implement the so-called 15-Minute City [33], the subdivision of UZ has been called into question, as it now functions more as a historical partition that, in certain contexts marked by social and urban dynamism, poorly mirrors the true differentiation between neighborhoods.
In this regard, it is worth noting that a more detailed territorial subdivision than the one currently in use enables a greater capacity to analyze the socio-economic and urban fabric in terms of inequalities. Assessments in this direction have highlighted virtuous examples, such as the so-called “Microareas of Trieste” [34], although such an approach remains difficult to implement in a complex and metropolitan urban context like that of Rome.
The debate remains ongoing, but the Administration’s objective is to equip itself with an effective tool for territorial governance grounded in a deep understanding of the area.

The III Municipality of Roma Capitale

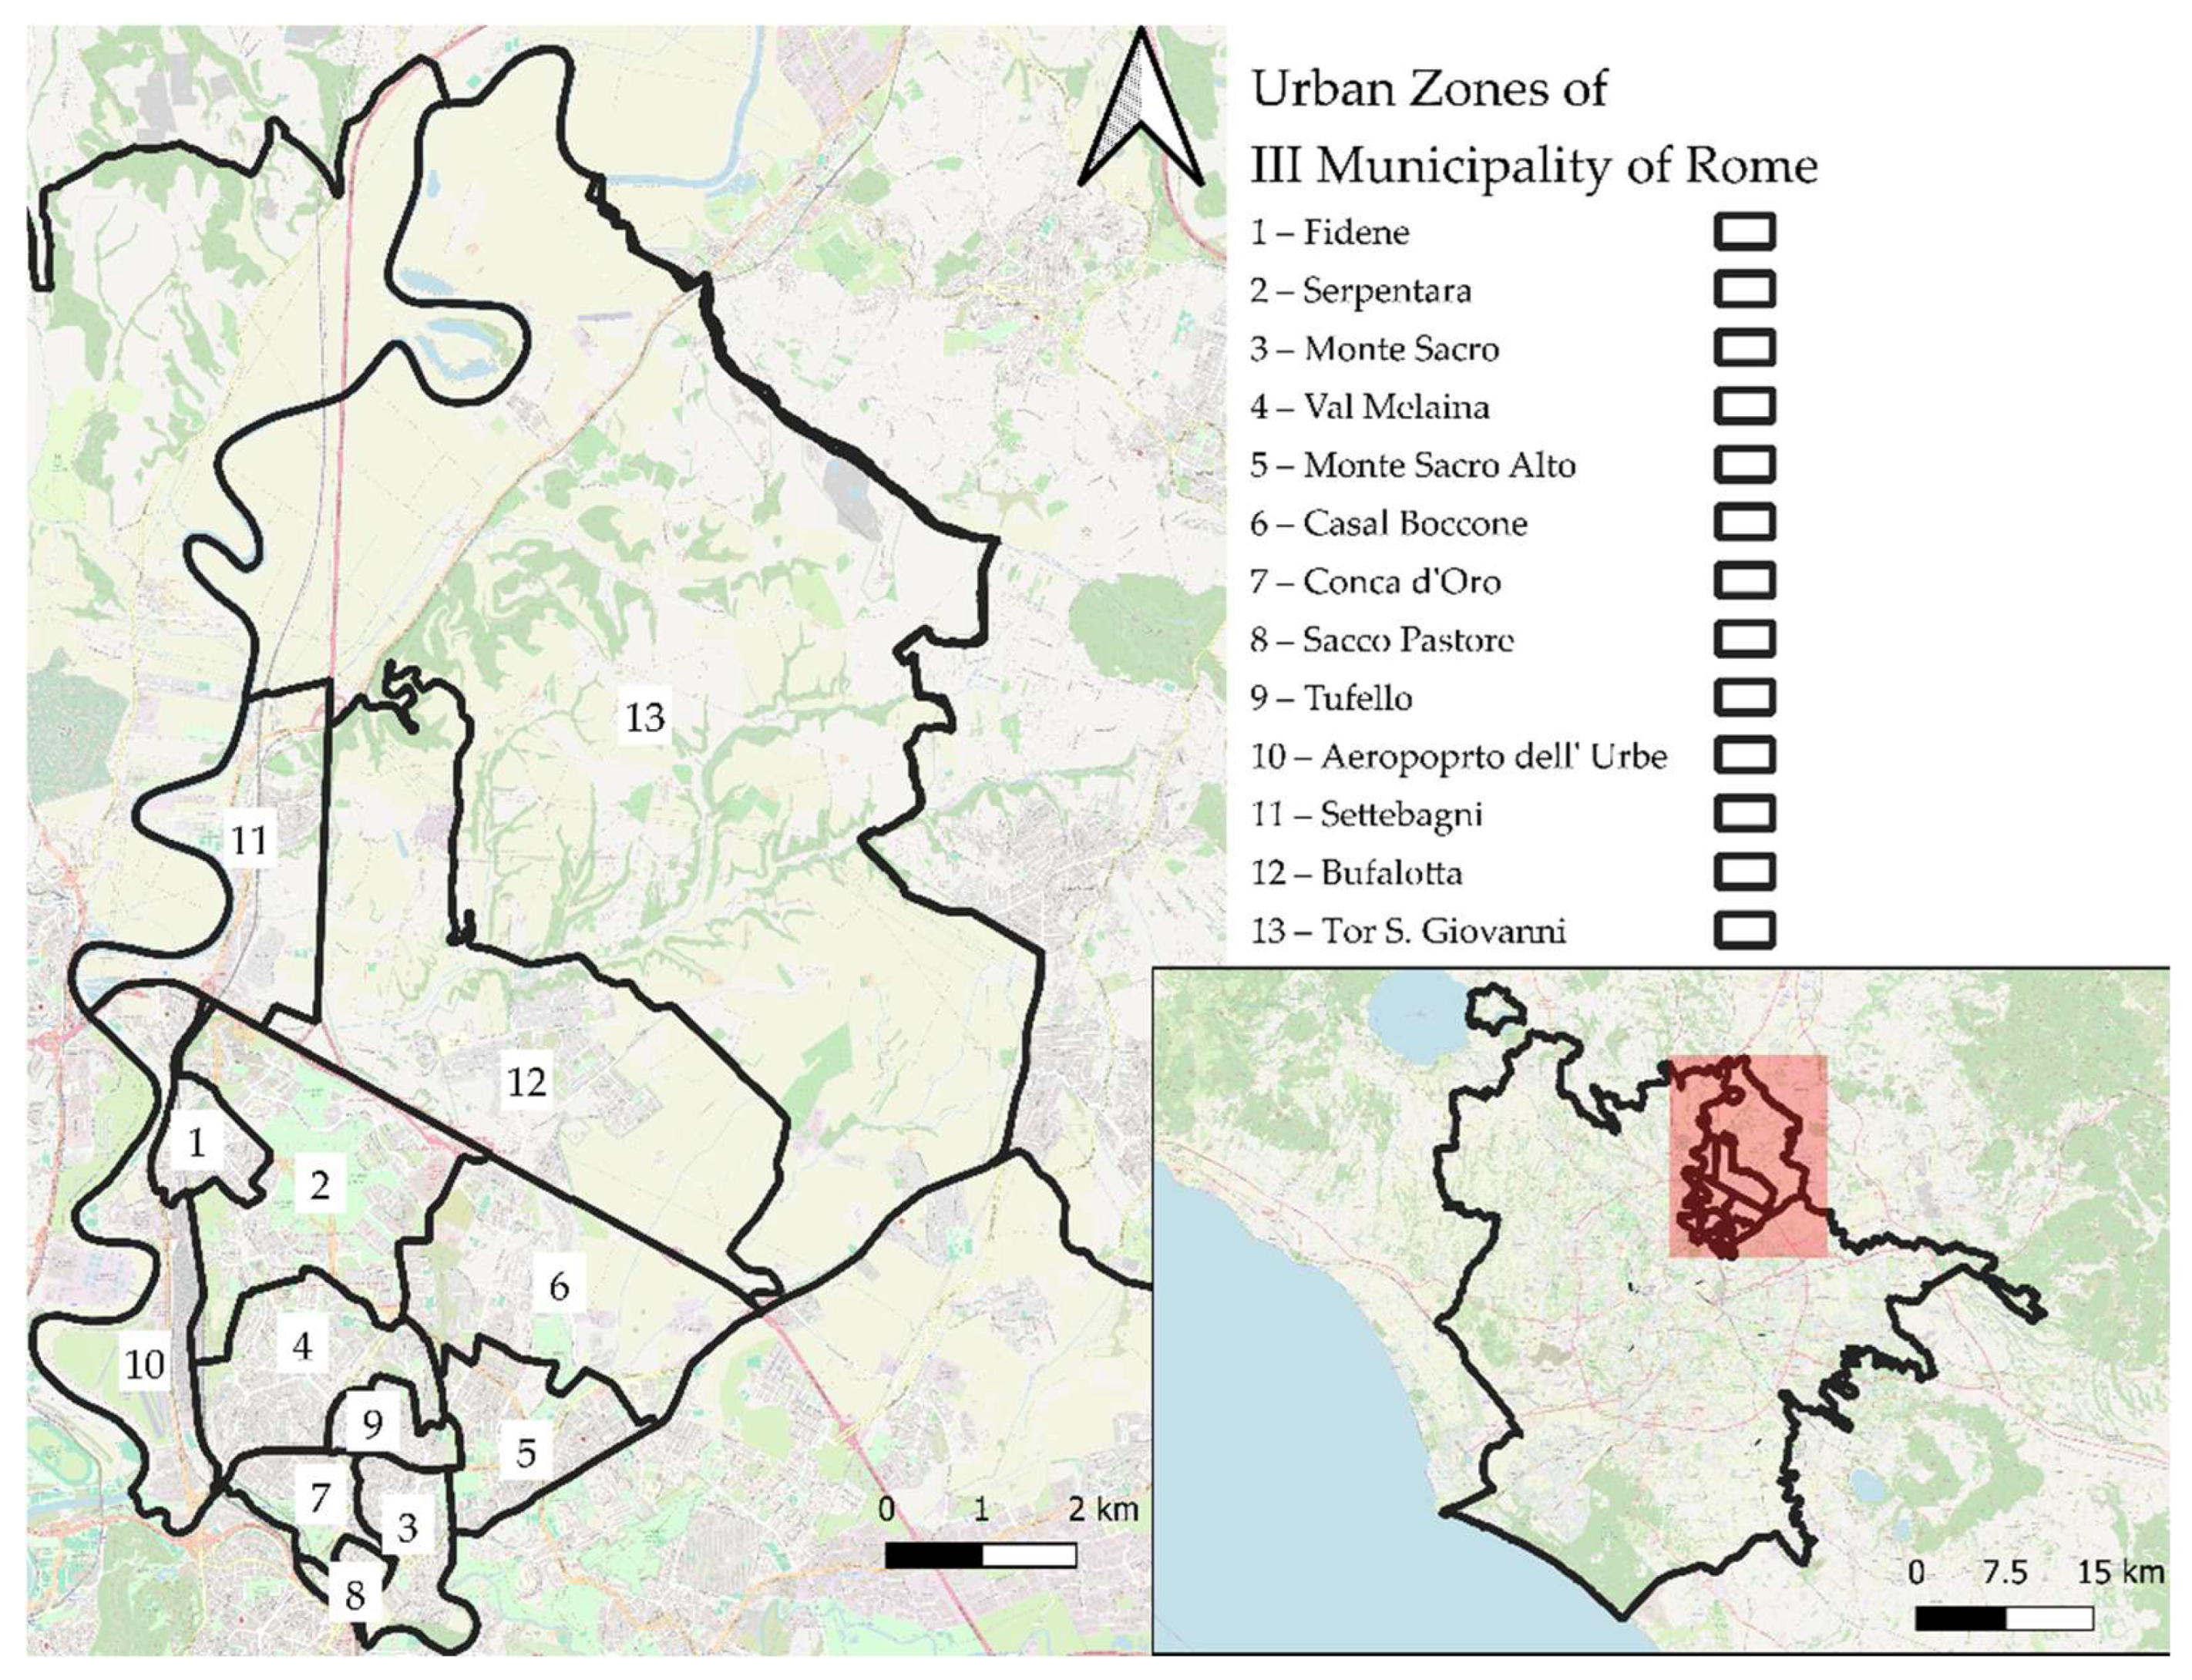
The present study thus aligns with this research strand, enabled by the “epidemiological intelligence” initiative developed by LHU Roma 1 under the mandate of Ministerial Decree 77/2022. Accordingly, the research was conducted in a pilot district of LHU Roma 1—Municipio III Montesacro (hereafter, III Municipality)—which nonetheless effectively encapsulates the complexity of Rome’s broader territory. Covering nearly 100 km2, Rome’s III Municipality is divided into 13 Urban Zones and has a resident population of 203,396 (2023 data) (Figure 1) [27]. It occupies the north-western sector of Rome, bounded by the banks of the River Aniene and the municipalities of Guidonia, Mentana, and Monterotondo. Its characteristic wedge-shaped form—common to many of Rome’s Municipalities—reflects a spectrum of urban and natural environments, as follows:
  • Central consolidated fabric: Densely built and populated neighbourhoods typical of the historic inner-ring periphery (Conca D’Oro, Montesacro, Tufello) [32].
  • Mid-density “palazzine” sectors: Residential blocks, often grouped into complexes (Talenti, Nuovo Salario) [32].
  • Post-war public housing estates: Large residential developments from the 1950s to 1960s (Vigne Nuove, Serpentara, Colle Salario) [32].
  • Recent expansion zones: Neighbourhoods developed since the 1990s (Casale Nei, Bufalotta).
  • Peripheral “borgate” and new gated communities: Formerly informal settlements outside the Grande Raccordo Anulare, the motorway ring that surrounds the inner city of Rome [35], now subject to major urban interventions (Castel Giubileo, Fidene, Settebagni, Cinquina) [32].
Except along the Via Salaria corridor—where the mixed industrial and residential settlement of Settebagni lies—the outermost areas of III Municipality encompass a vast green reserve, featuring scattered hamlets and largely unspoiled tracts of the classic “Campagna Romana” landscape within the Marcigliana Reserve [36].
The III Municipality experienced several distinct phases of urban development during the 20th century, beginning with the original settlement of Montesacro/Garden City, situated adjacent to the site of the plebeian secession in Republican Rome (494 BC) and later the location of Simón Bolívar’s oath (1805) [37,38] before he embarked on his South American political career. Subsequent growth saw the establishment of the “historic borgata” at Tufello, followed by the construction of the densely built Conca D’Oro neighborhood during the post-war building boom [32]. Early public housing projects and later urbanization initiatives [32], as well as further developments along the Motorway Ring (Grande Raccordo AnulareGRA, in Italian), largely mirrored broader patterns across Rome—alternating between planned, state-led interventions and speculative construction—underscoring the considerable social and spatial complexity of the territory itself [39,40].
The study and classification of areas—aimed at responding to the LHU’s strategic planning requirements—therefore constitute a primary necessity to ensure that service levels are appropriately aligned with needs, within an equity framework [41].
The aim of this study was to develop a subdivision of the territory of Rome Capital’s Municipality III, starting from the existing Urban Zones, by identifying areas (Mesoareas) with a population ranging between 1500 and 20,000 inhabitants, that are as homogeneous as possible in terms of socioeconomic status.

2. Materials and Methods

The software tools used for this study were QGIS Desktop 3.16.3 (QGIS Project, open-source, International), Microsoft Excel 2016 (Microsoft Corporation, Redmond, Washington, USA) (step 1–5) and STATA MP 13, (StataCorp LLC, 4905 Lakeway Drive, College Station, 322 Texas, USA (step 6). The following layers were imported into the QGIS project (Table 1):
  • A vector layer containing the 2021 census section boundaries of the Municipalities of Rome (geographical data), provided by ISTAT in the WGS 84/UTM Zone 32N projection, available both as point and polygon geometries. This layer was joined with the database containing data from the 2021 ISTAT Census, the most recent census available.
  • A vector layer of the administrative subdivisions (Municipalities), created and made available by IPTSAT S.r.l. through the DatiOpen.it platform [42].
  • A vector layer representing the Urban Zones of the Municipalities of Rome, in the WGS 84 geographic coordinate system [43].
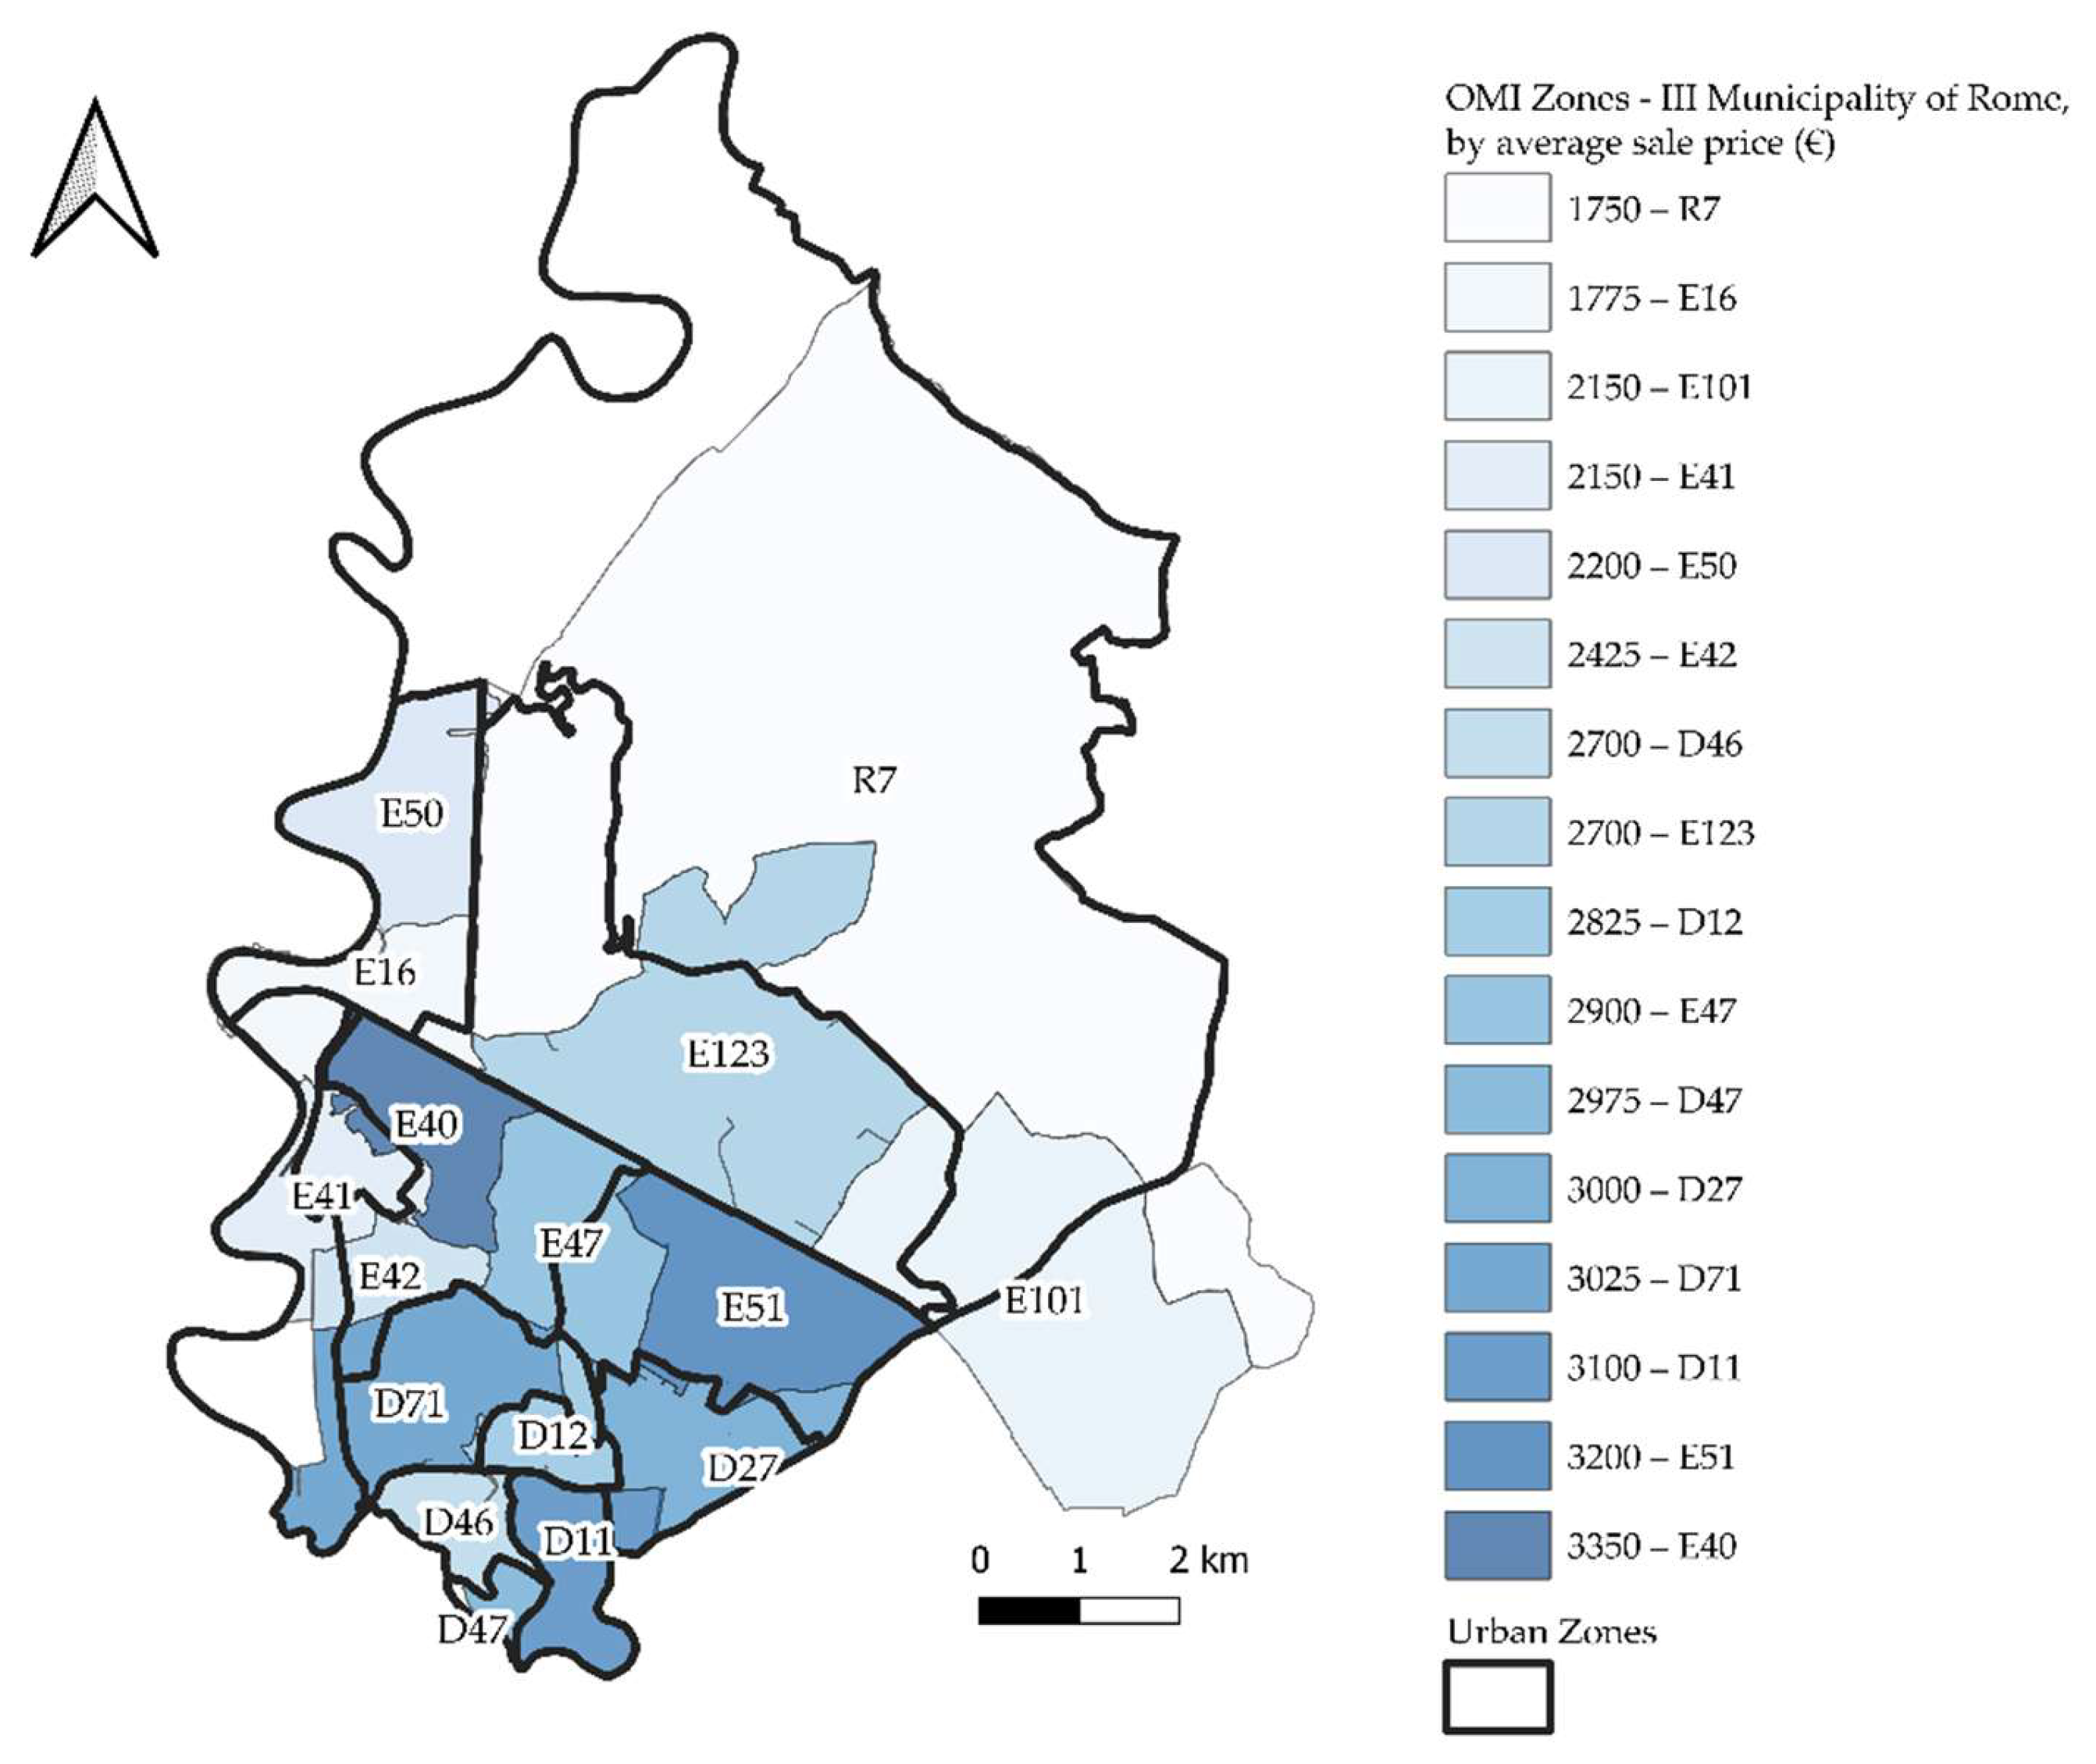
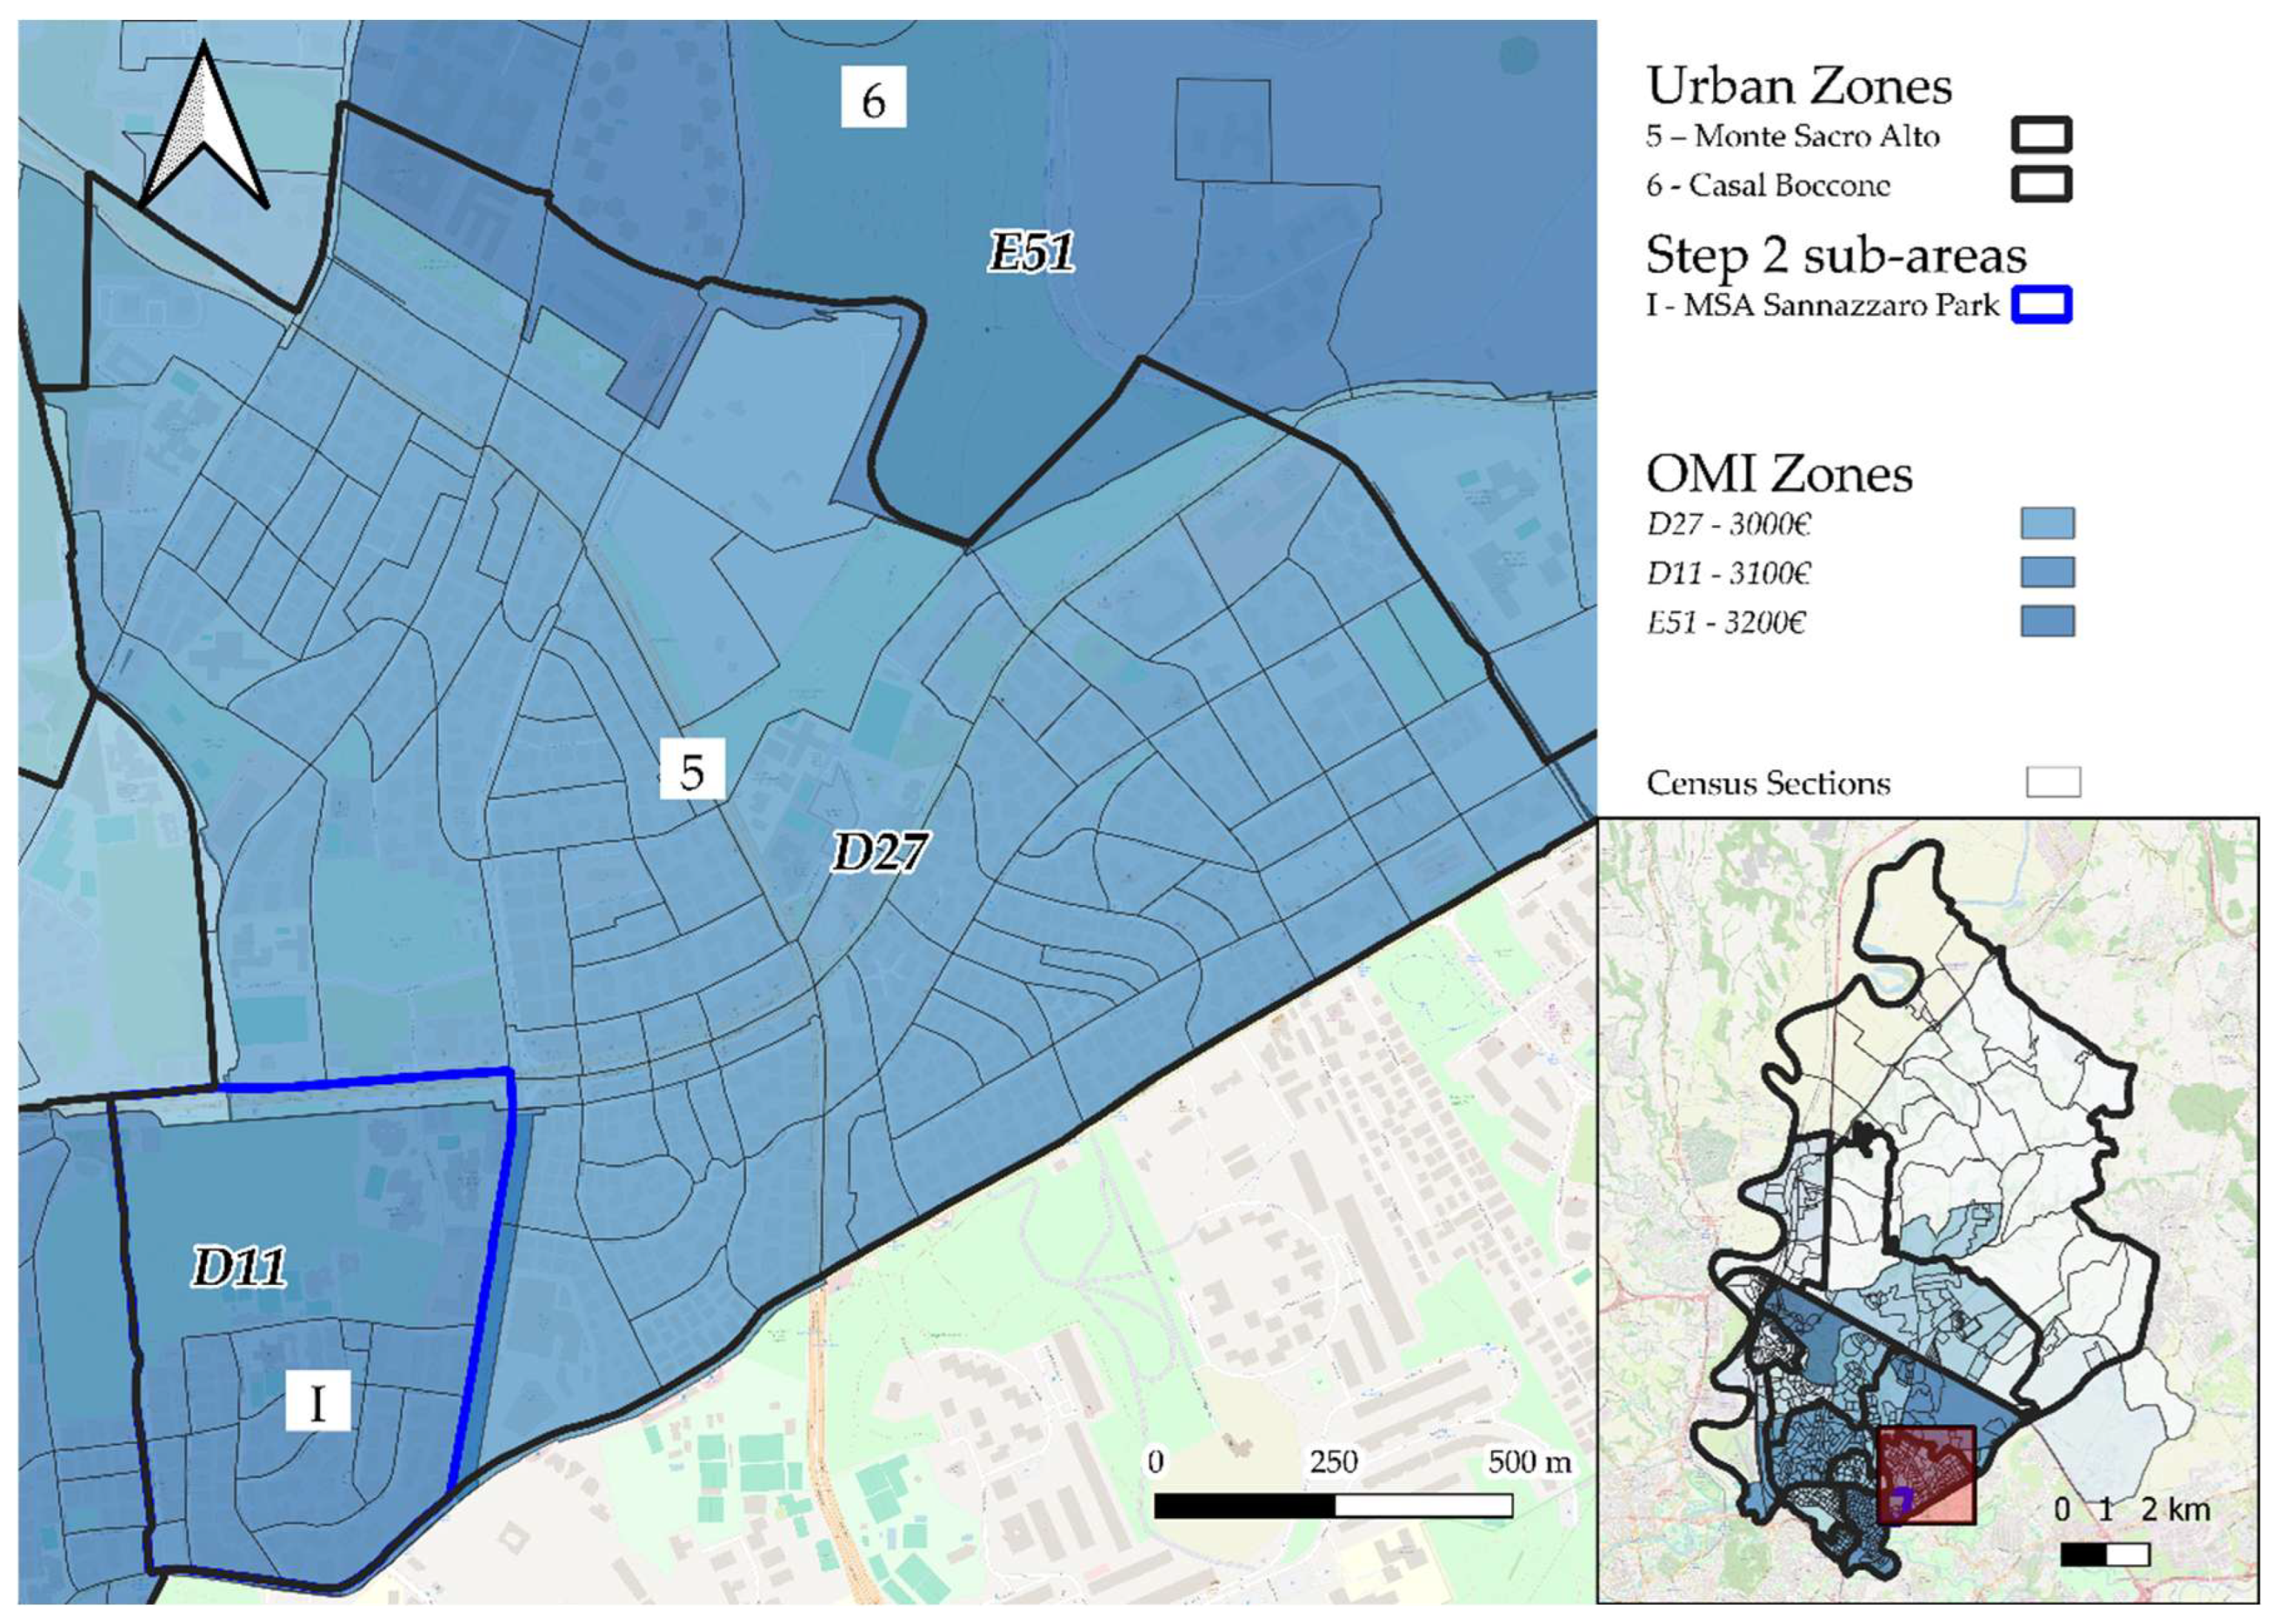
  • A vector layer delineating the boundaries of the Osservatorio del Mercato Immobiliare (OMI—Real Estate Market Observatory) zones for the year 2021, provided by the Italian Agenzia delle Entrate. The OMI zones are defined as territorially homogeneous areas for which annual real estate valuations are available. These valuations provide, for each OMI zone, a minimum and maximum price range per square meter in euros, for both market value and rental value, differentiated by property type [44]. For this study, the average sale price of residential properties intended for civilian use was calculated and assigned to each OMI zone in the corresponding vector layer. Figure 5 shows the OMI zones covering the area of Municipality III, along with the corresponding average sale prices of residential properties.
  • Linear vector road network provided by Anas S.p.A., the national agency responsible for managing Italy’s road infrastructure [45].
Figure 2 illustrates the methodological process flowchart.

2.1. Step 1—Preparation of Cartographic Data: Generation of a Vector Layer of Census Sections with Linked Attributes from the 2011 Census and Urban Zones

As a first step, to associate each census section (CS) with its corresponding Municipality, the intersection function was used, with the point vector layer of the census geographic data as the input layer, and the vector layer of the Municipalities of Rome as the output layer. Therefore, only the CSs belonging to III Municipality were selected and exported. Through a table join tool, it was also possible to isolate the CSs of III Municipality within the polygonal census geographical data layer.
Subsequently, to associate each CS from the previously generated layer with its corresponding UZ, the intersection function was again applied, this time with an arbitrary buffer of −5 m. The output layer in this case was the vector layer of Rome’s Urban Zones.
From the resulting polygon vector layer of the CSs for III Municipality of Roma Capitale, now enriched with both 2021 census information and UZs identifiers, a series of operations was carried out with the goal of identifying UZs that had a very large population, or a high degree of heterogeneity in terms of average real estate sale prices. The subdivision of UZs was carried out using the polygon vector layer of census sections as the base spatial unit within QGIS. CSs were aggregated into new groupings to define sub-areas based on spatial criteria aimed at maximizing internal socio-demographic homogeneity and adhering to a population range between 1500 and 20,000 residents, in line with the territorial guidelines for the primary healthcare catchment areas outlined in Ministerial Decree 77 [22]. The choice of CSs as the base unit was supported by two factors: (1) each CS is entirely contained within a single UZ, avoiding overlap, and (2) in most urban contexts, CS boundaries align with road infrastructure. This spatial correspondence enabled the use of major road axes and arterial streets as effective criteria for delineating Mesoarea boundaries within each UZ, as described in Steps 3–4.

2.2. Step 2—Subdivision of UZ Based on Heterogeneity in Property Prices (OMI Areas)

The identification of Urban Zones intersected by multiple OMI areas was carried out through the application of the spatial intersection function between the point vector layer representing the centroids of the census sections and the polygon vector layer of the OMI areas. This procedure allowed us to determine which Urban Zones are affected by more than one OMI area, based on the spatial location of CS centroids falling within different OMI boundaries.
Census sections belonging to the same Urban Zone and intersecting different OMI areas were aggregated to define sub-areas, conditional on a combined population size greater than 1500 residents. This subdivision aimed to capture intra-ZU socioeconomic heterogeneity based on real estate values.

2.3. Step 3—Subdivision Based on Major Roads and Inter-Neighborhood Arterial Roads

Subsequently, the Urban Zones (or sub-areas resulting from Step 1) were further subdivided based on the main road axes. The ‘General Urban Traffic Plan’ (Piano Generale del Traffico Urbano—PGTU) of Roma Capitale, approved by City Council Resolution No. 70/2014, and specifically its annex ‘Road Regulation and Functional Classification’, classifies the city’s roads into five categories: A (motorways), S (high-speed roads), IQ (inter-neighborhood roads), IZ (inter-zonal roads), and Q (neighborhood roads). Roads within Municipality III falling under categories A, S, and IQ were identified: the first two correspond to high-speed roads, while the third refers to roads connecting different neighborhoods and characterized by specific urban planning functions.
Using the ANAS (the Italian national authority on road administration, see above) road network graph, the aforementioned road axes were identified. Among these, those already delineating the boundaries of pre-existing urban zones or of the sub-areas derived from Step 1 were excluded. The remaining axes, which largely coincide with the boundaries of census tracts, were used to separate census tracts belonging to the same urban zone into distinct sub-areas.

2.4. Step 4—Subdivision of UZs > 20,000 Inhabitants Based on Inter-Zonal Roads

Step 4 aimed to further subdivide only those urban zones or sub-areas (identified in the previous steps) that still had a resident population exceeding 20,000 inhabitants. To this end, road axes classified as ‘interzonal’ (IZ) in the aforementioned General Urban Traffic Plan (PGTU) of Roma Capitale were considered. According to the document, interzonal roads represent the classification level immediately below ‘inter-neighborhood’ roads and are defined as axes connecting areas of the city that, although belonging to the same neighborhood, represent distinct urban areas.
Accordingly, interzonal road axes were identified within the areas resulting from the earlier subdivisions, in which the resident population remained above 20,000 inhabitants even after the adjustments made in Steps 2 and 3.

2.5. Step 5—Statistical Assessment of SES Differences (Education Level) Between Sub-Areas of the Same UZ

To assess whether socioeconomic differences exist among the zones subdivided based on real estate sale prices or population size, chi-square (χ2) tests were conducted using data from the 2021 census. Specifically, the percentage of individuals with a university degree among the population aged over 25 years was compared across Mesoareas within the same UZs.
For UZs that were divided into more than two Mesoareas, Bonferroni correction was applied.

2.6. Step 6—Merging of Non-Significantly Different Areas

Sub-areas resulting from the previous steps that, at Step 5, did not exhibit statistically significant differences in educational level were merged, provided they were adjacent. Conversely, where significant differences were observed, the corresponding areas were classified as Mesoareas.

2.7. Step 4bs—Subdivision of UZs > 20,000 Inhabitants Based on Inter-Zonal Roads

Where the merging process described in the previous step resulted in areas with a population exceeding 20,000 inhabitants, the methodology detailed in Step 4—Subdivision of UZs > 20,000 Inhabitants Based on Inter-Zonal Roads—was reapplied.

2.8. Step 5b—Statistical Assessment of SES Differences (Education Level) Between Sub-Areas of the Same UZ

Subsequently, a Statistical Assessment of SES Differences (Education Level) Between Sub-Areas of the Same UZ, as described in Step 5, was conducted for the subdivisions resulting from Steps 6 and 4b. Where statistically significant differences were identified, the corresponding areas were classified as Mesoareas.

2.9. Step 6—Final Statistical Assessment

For each meso-area and Urban Zone, descriptive statistics for the education level indicator were computed, including the mean, median, interquartile range (IQR), and variance. The distributions of the proportion of university graduates within Mesoareas and Urban Zones were visualized using box-and-whisker plots, highlighting the median and IQR to summarize central tendency and variability.
Subsequently, the distribution of the aforementioned variables was assessed using the Shapiro–Wilk test. Differences in the percentage of university graduates among Meso-areas within each Urban Zone were examined using the Kruskal–Wallis test. In total, five separate tests were conducted (one for each Urban Zone subdivided into Mesoareas). Upon obtaining a significant Kruskal–Wallis result, pairwise comparisons between subgroups were performed using Dunn’s test with Bonferroni correction to control for Type I error associated with multiple comparisons.
For each classification level (Urban Zones and Mesoareas), the average within-group variance was also calculated to explore the degree of internal heterogeneity within each grouping level.
Socioeconomic differences among the Mesoareas resulting from the previous steps were further tested using additional proxy indicators of socioeconomic status. Due to the unavailability of a validated composite deprivation index based on the 2021 Italian census data, the dimensions considered in the deprivation index by Rosano et al. [46] were analyzed separately. Specifically, using the chi-square test on 2021 census data, the following variables were examined within Mesoareas belonging to the same UZ:
  • Percentage of individuals aged over 25 with a university degree;
  • Percentage of employed individuals aged 15–65;
  • Percentage of single-person households out of the total number of families.
Population density, included in the Rosano et al. [46] index, was not tested because ISTAT had not yet released the necessary data to calculate this dimension at the census tract level.

3. Results

3.1. Step 1—Preparation of Cartographic Data

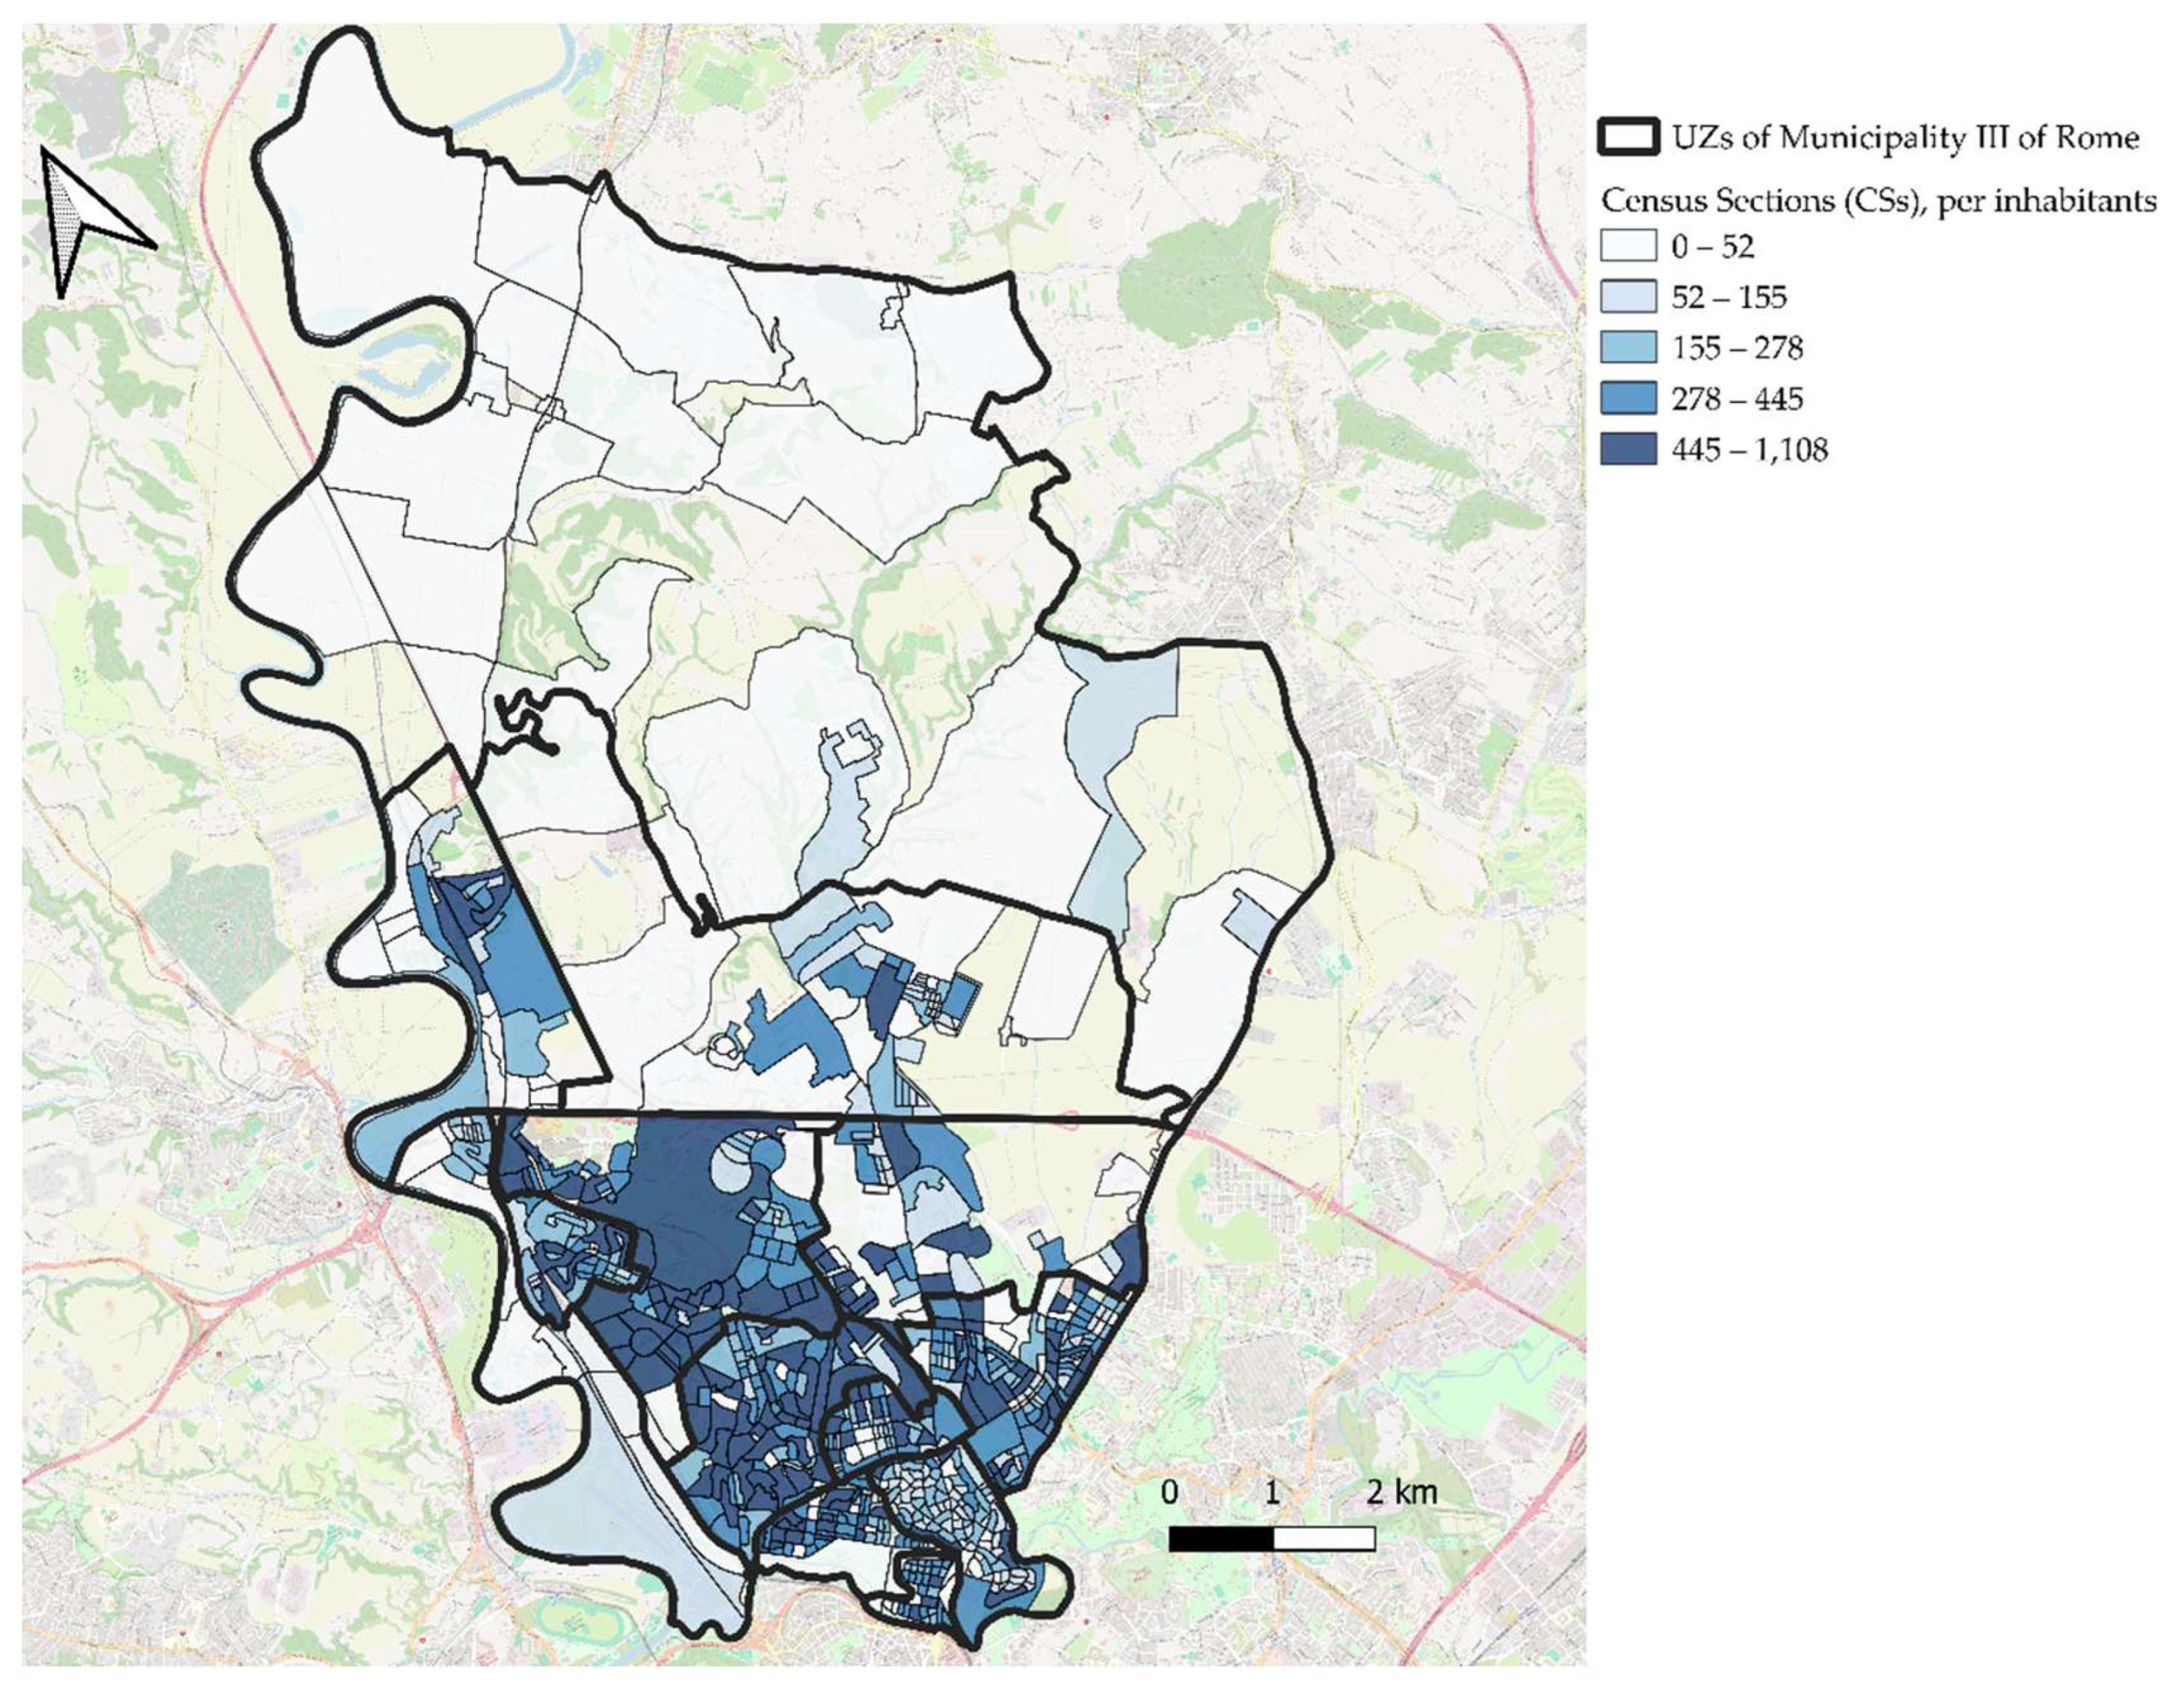
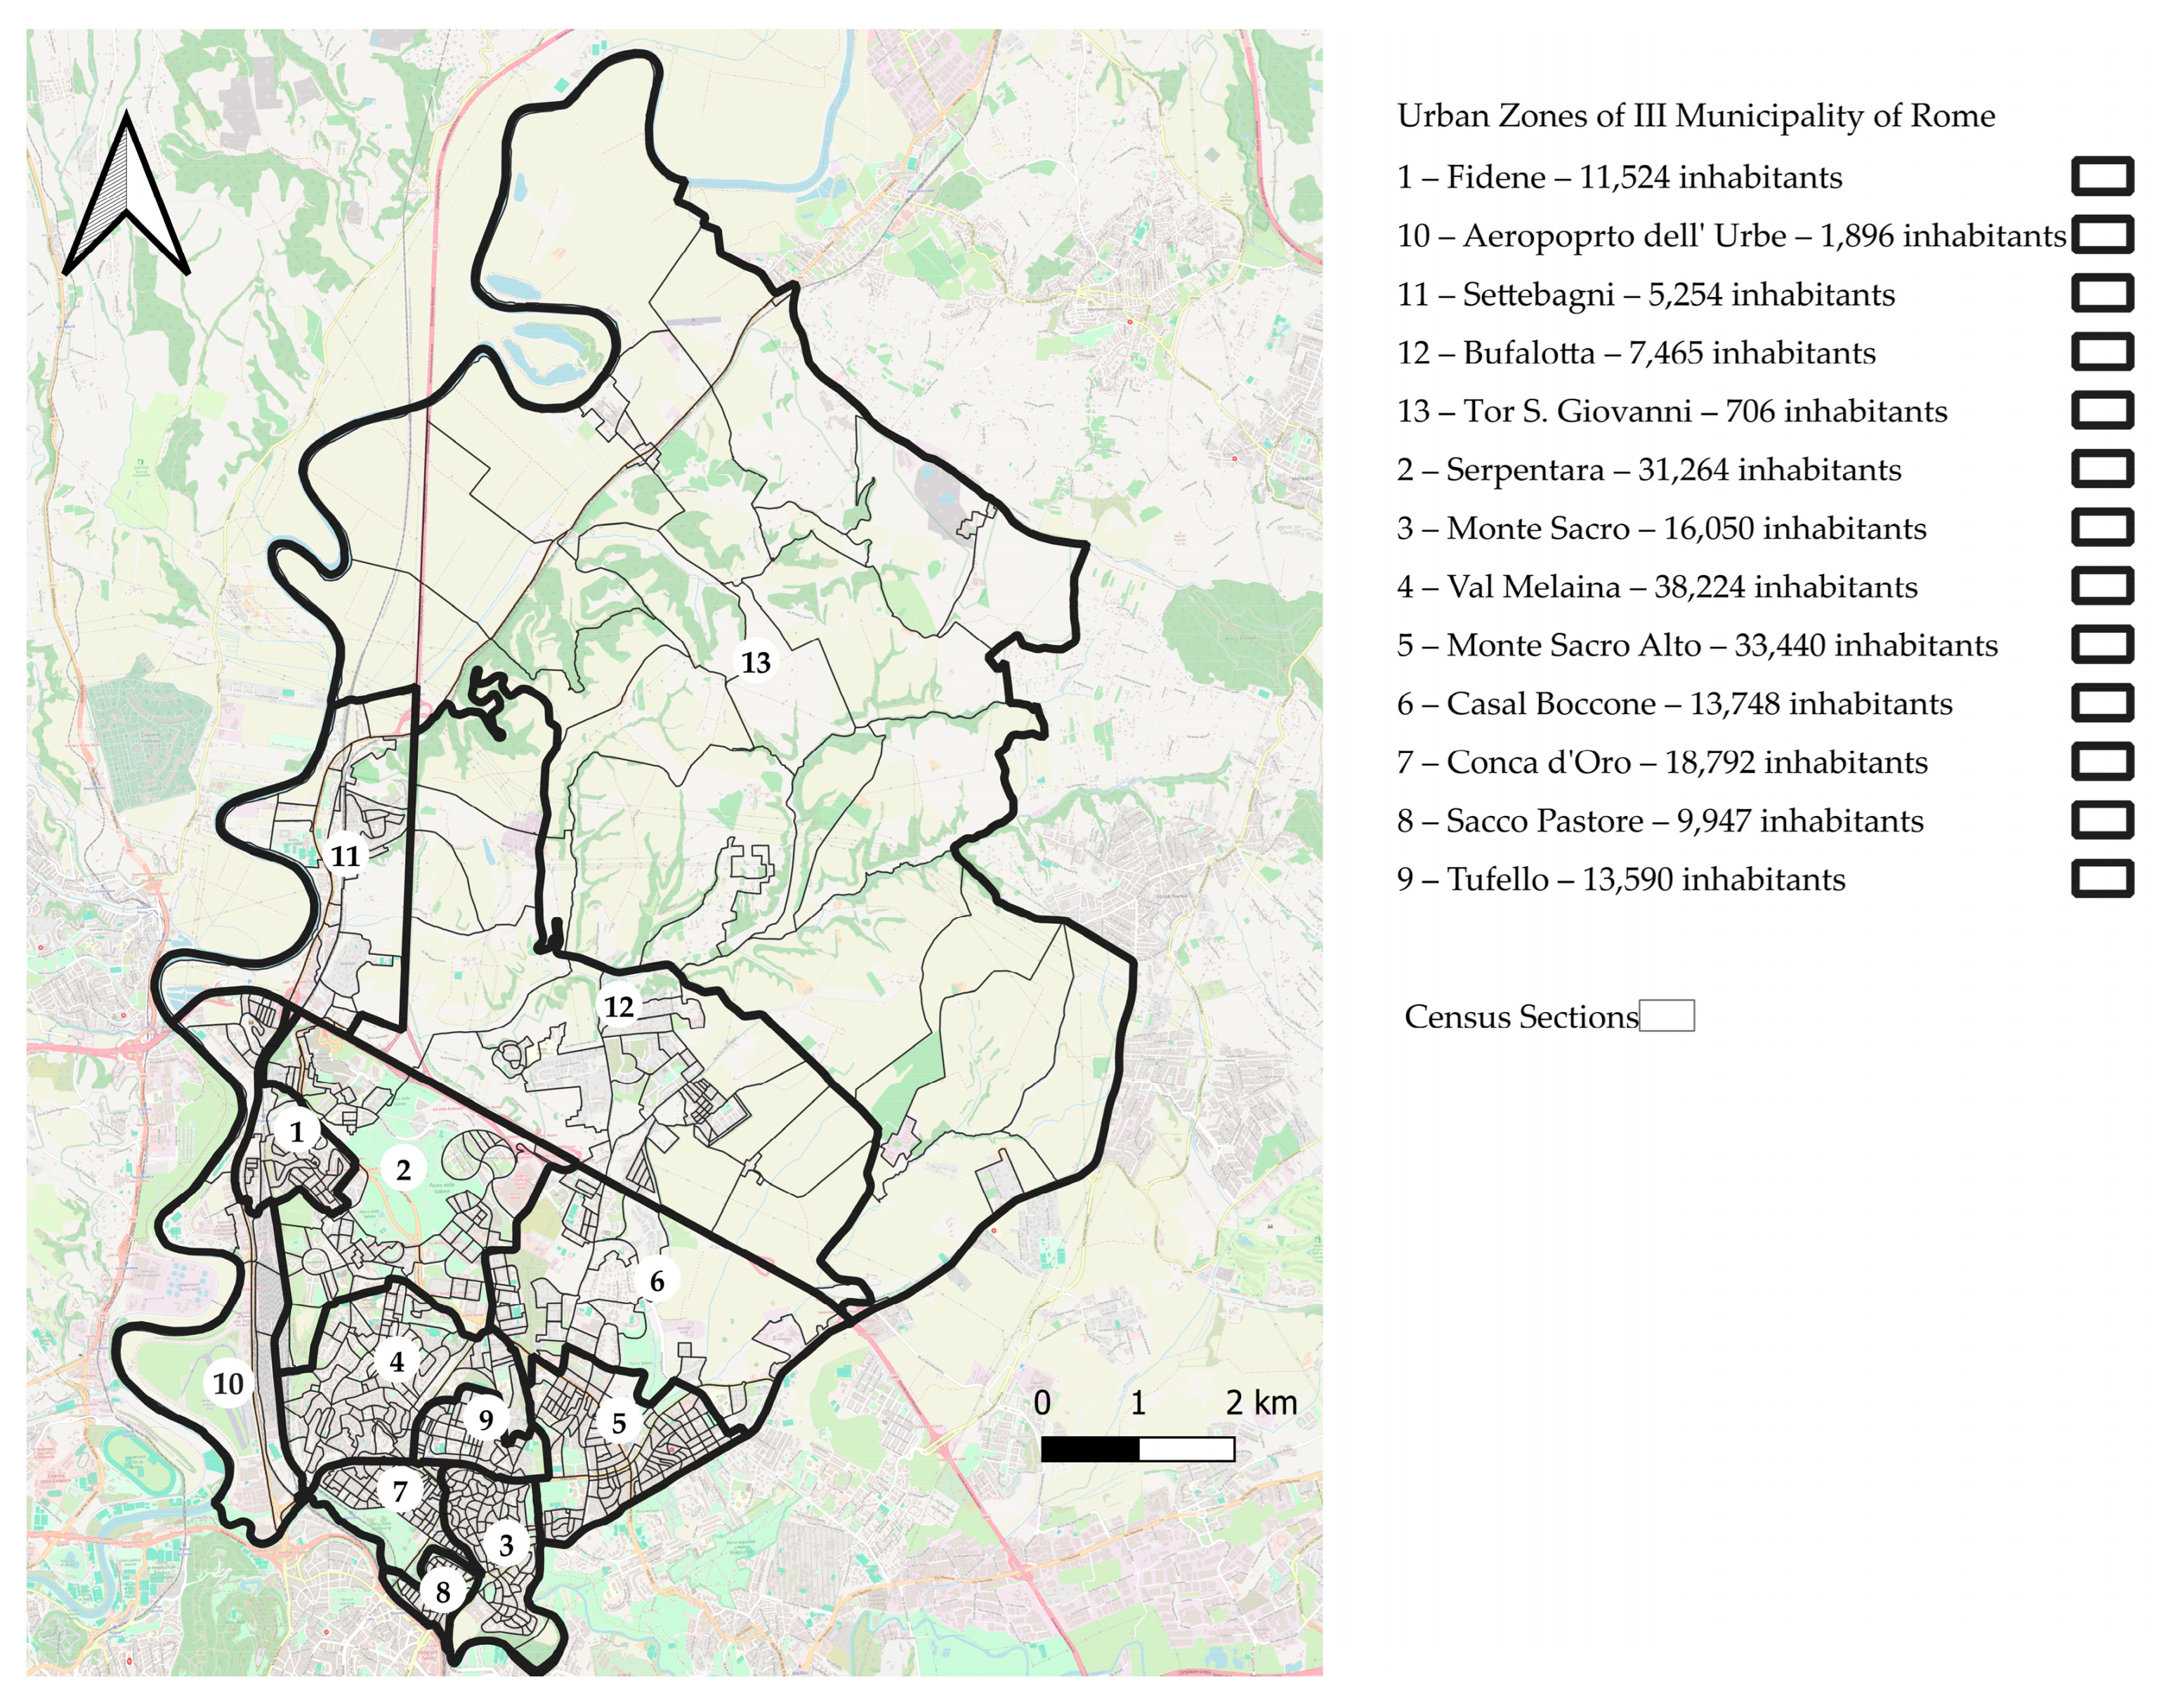
From the first step, 791 CSs were associated with Municipality III. The total population in 2021 was 201,900 individuals. Seventy-three CSs from the ISTAT shapefile did not match the census information database. A visual inspection of their locations suggests these are uninhabited areas, such as squares, parks, or natural zones. It was assumed that these CSs have a population of 0 (Figure A1). Each census section was assigned to one of the 13 Urban Zones within Municipality III. Based on this association, the distribution of the 201,900 residents, as shown in Table 2 and Figure 3, was obtained.
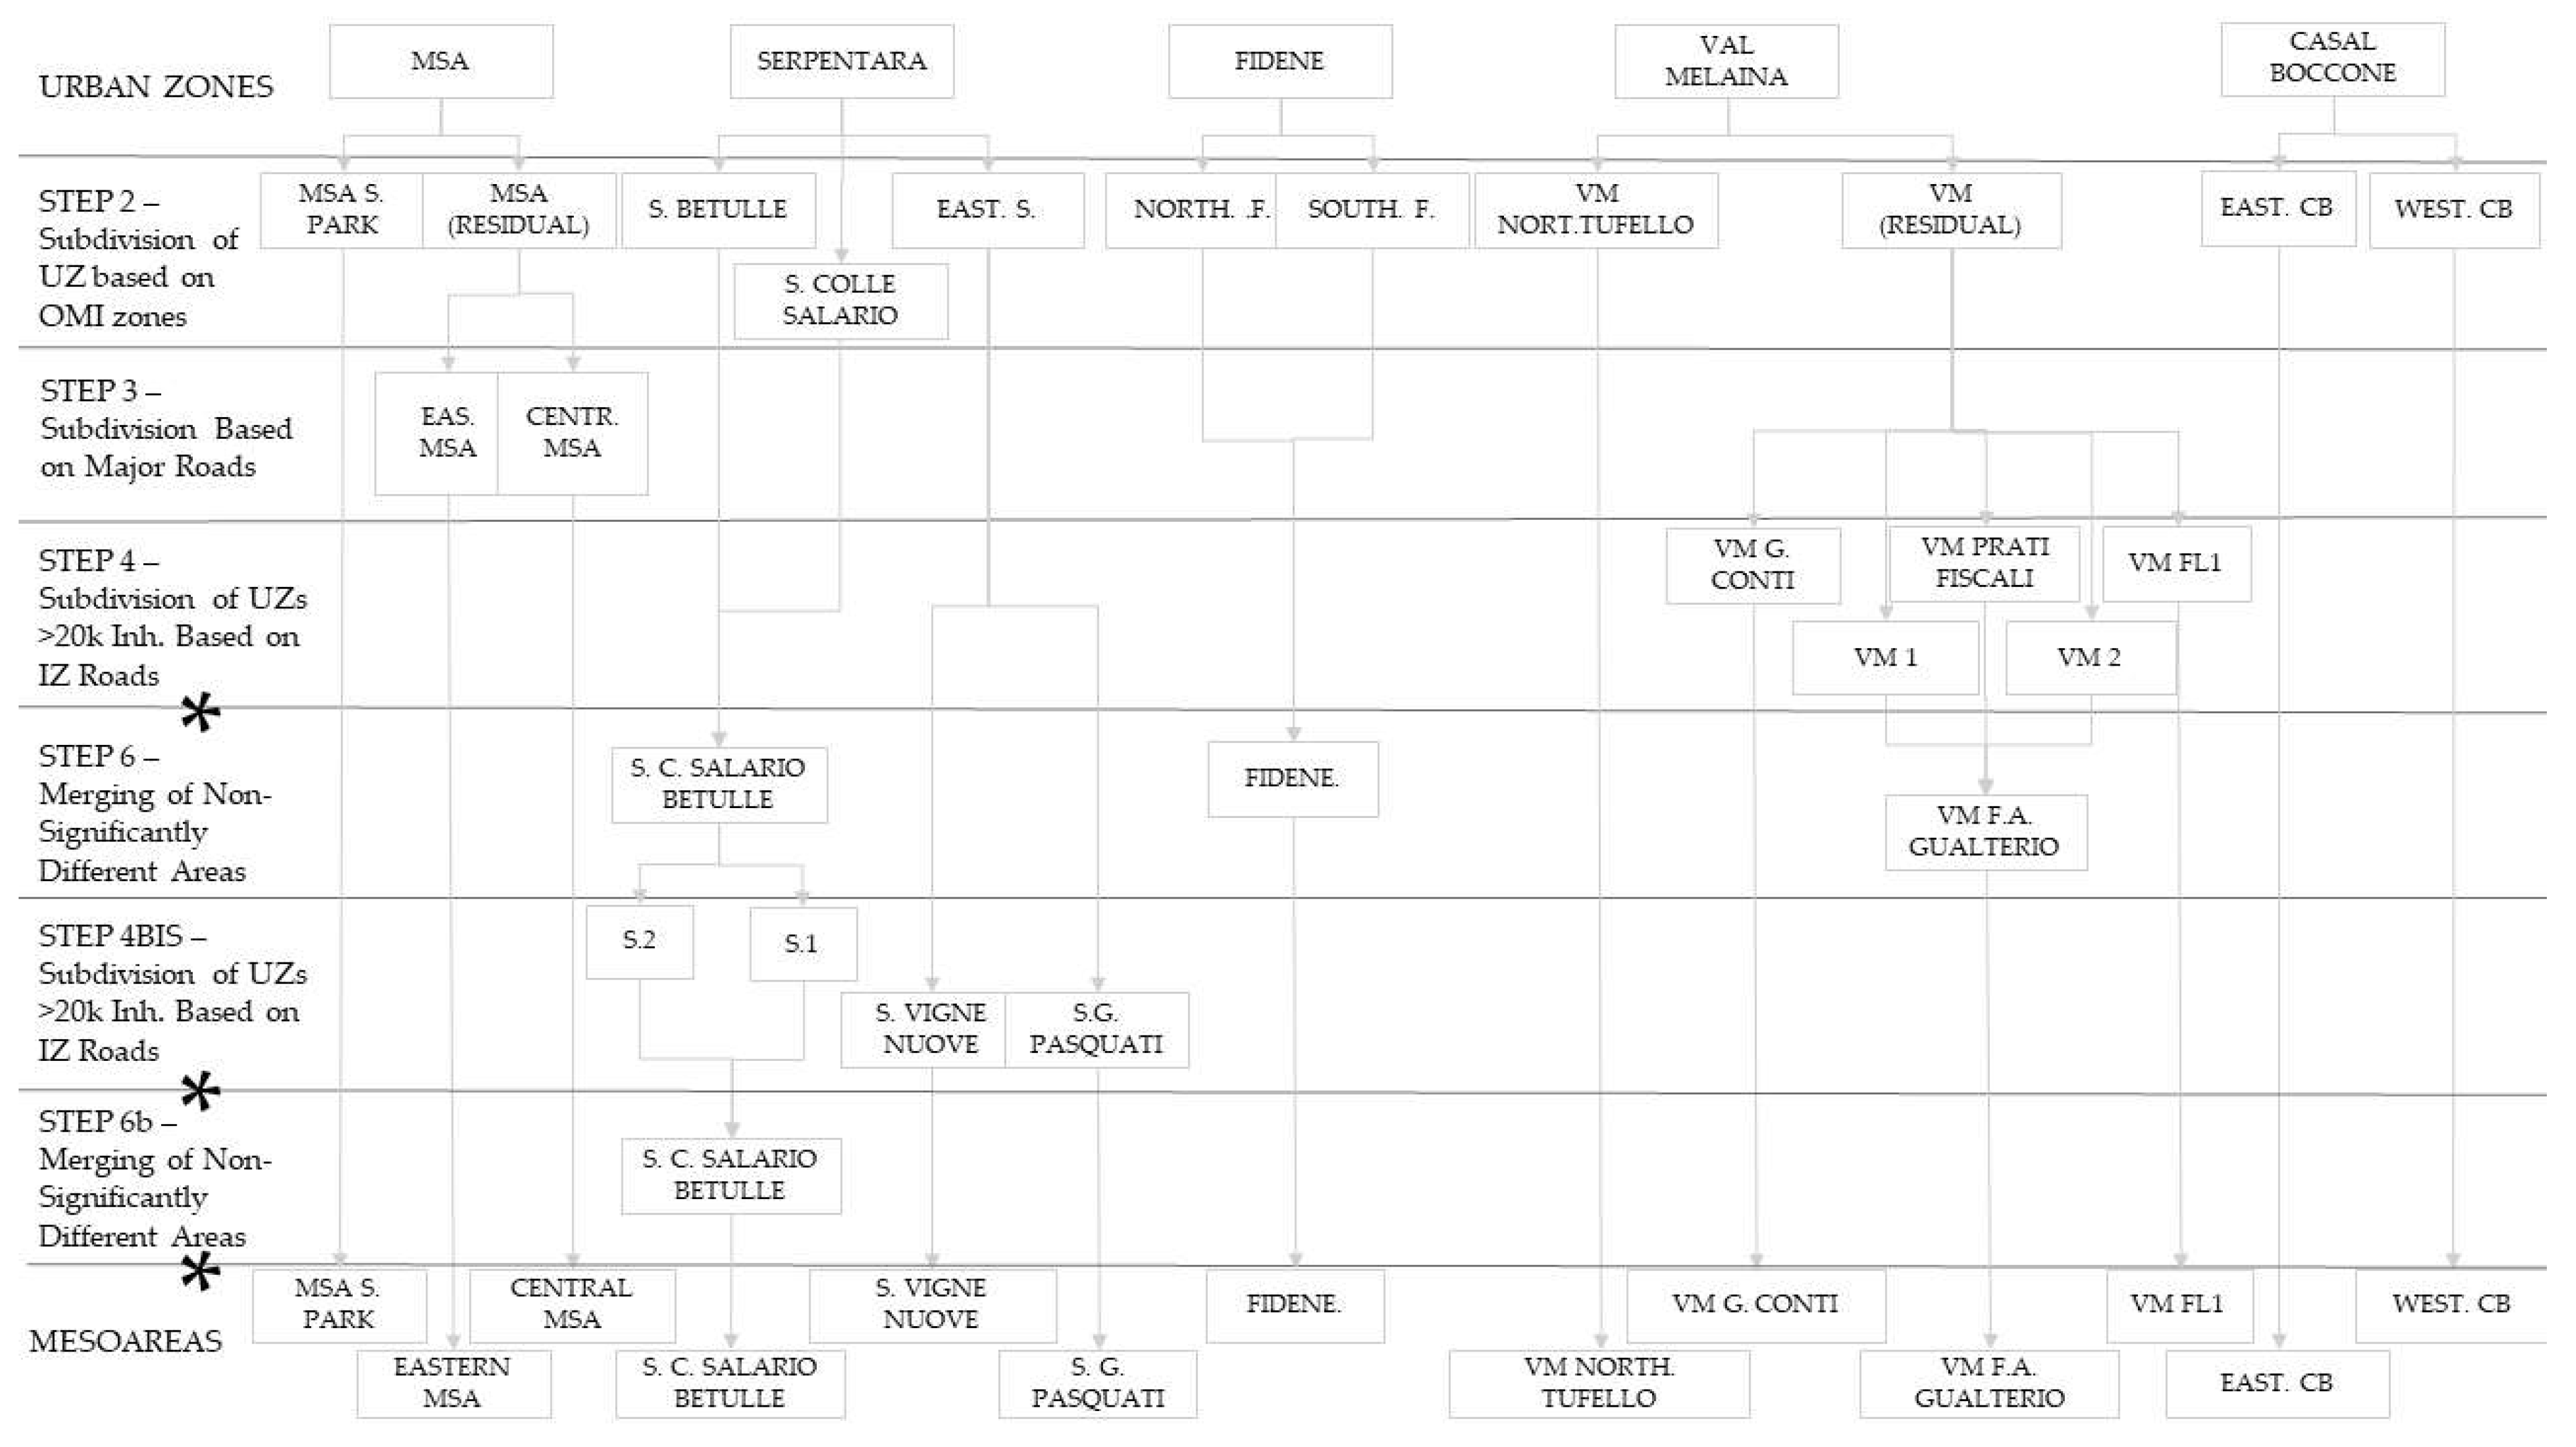
The outcomes of the sub-area splitting and merging process, carried out from the initial Urban Zones to the final Mesoareas, as detailed in Steps 2 to 6, are summarized in Figure 4.

3.2. Step 2—Subdivision of UZ Based on Heterogeneity in Property Prices

As illustrated in Table 3 and Figure 5, 12 Urban Zones (UZs) contain census sections that fall within different OMI zones. However, in only five UZs, these divisions can be used to identify sub-areas with populations exceeding 1500 inhabitants, in line with the objectives of this study: Casal Boccone, Fidene, Monte Sacro Alto, Val Melaina, and Serpentara, as detailed below.
Figure 5. The map shows, in shades of blue, the OMI zones covering the area of Municipality III. The bold black boundaries represent the subdivision into Urban Zones.
Land 14 01574 g005
The Fidene UZ, located adjacent to the GRA, in the western part of III Municipality, includes a north-eastern section where real estate prices are higher, suggesting different socio-economic characteristics compared to the rest of the UZ. For this reason, the Fidene Urban Zone was subdivided into two sub-areas: Fidene North and Fidene South (Figure 6).
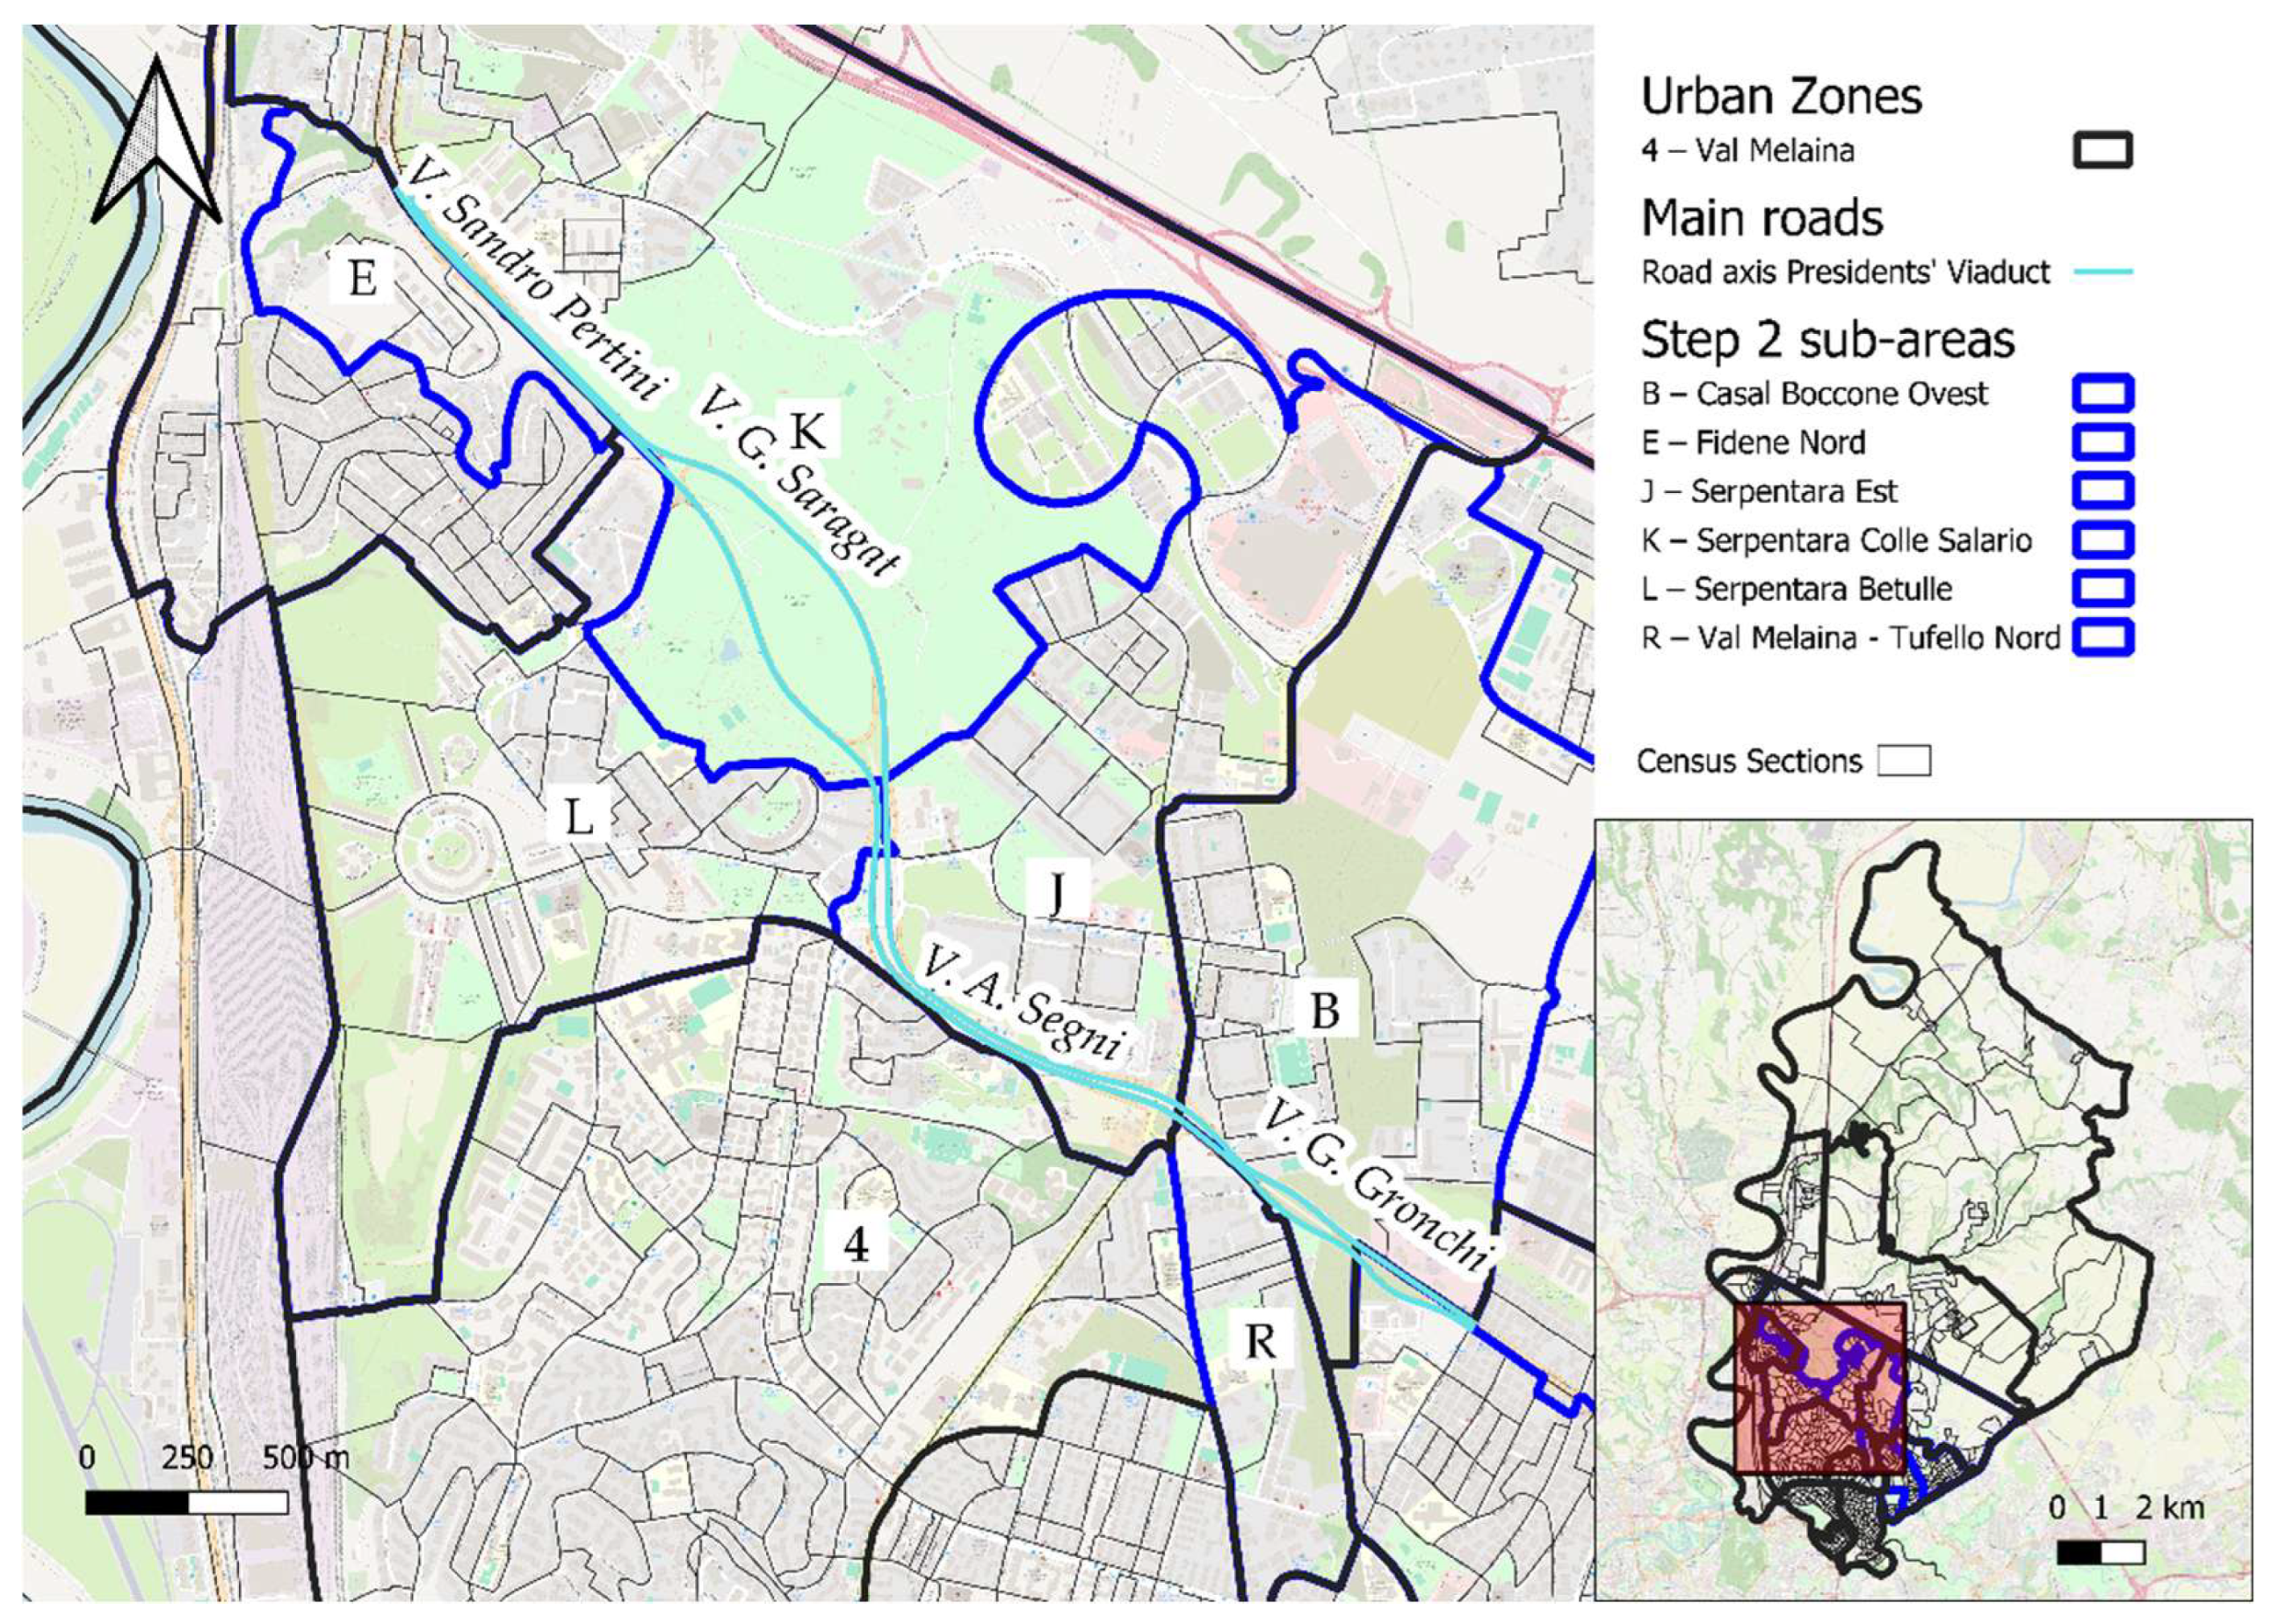
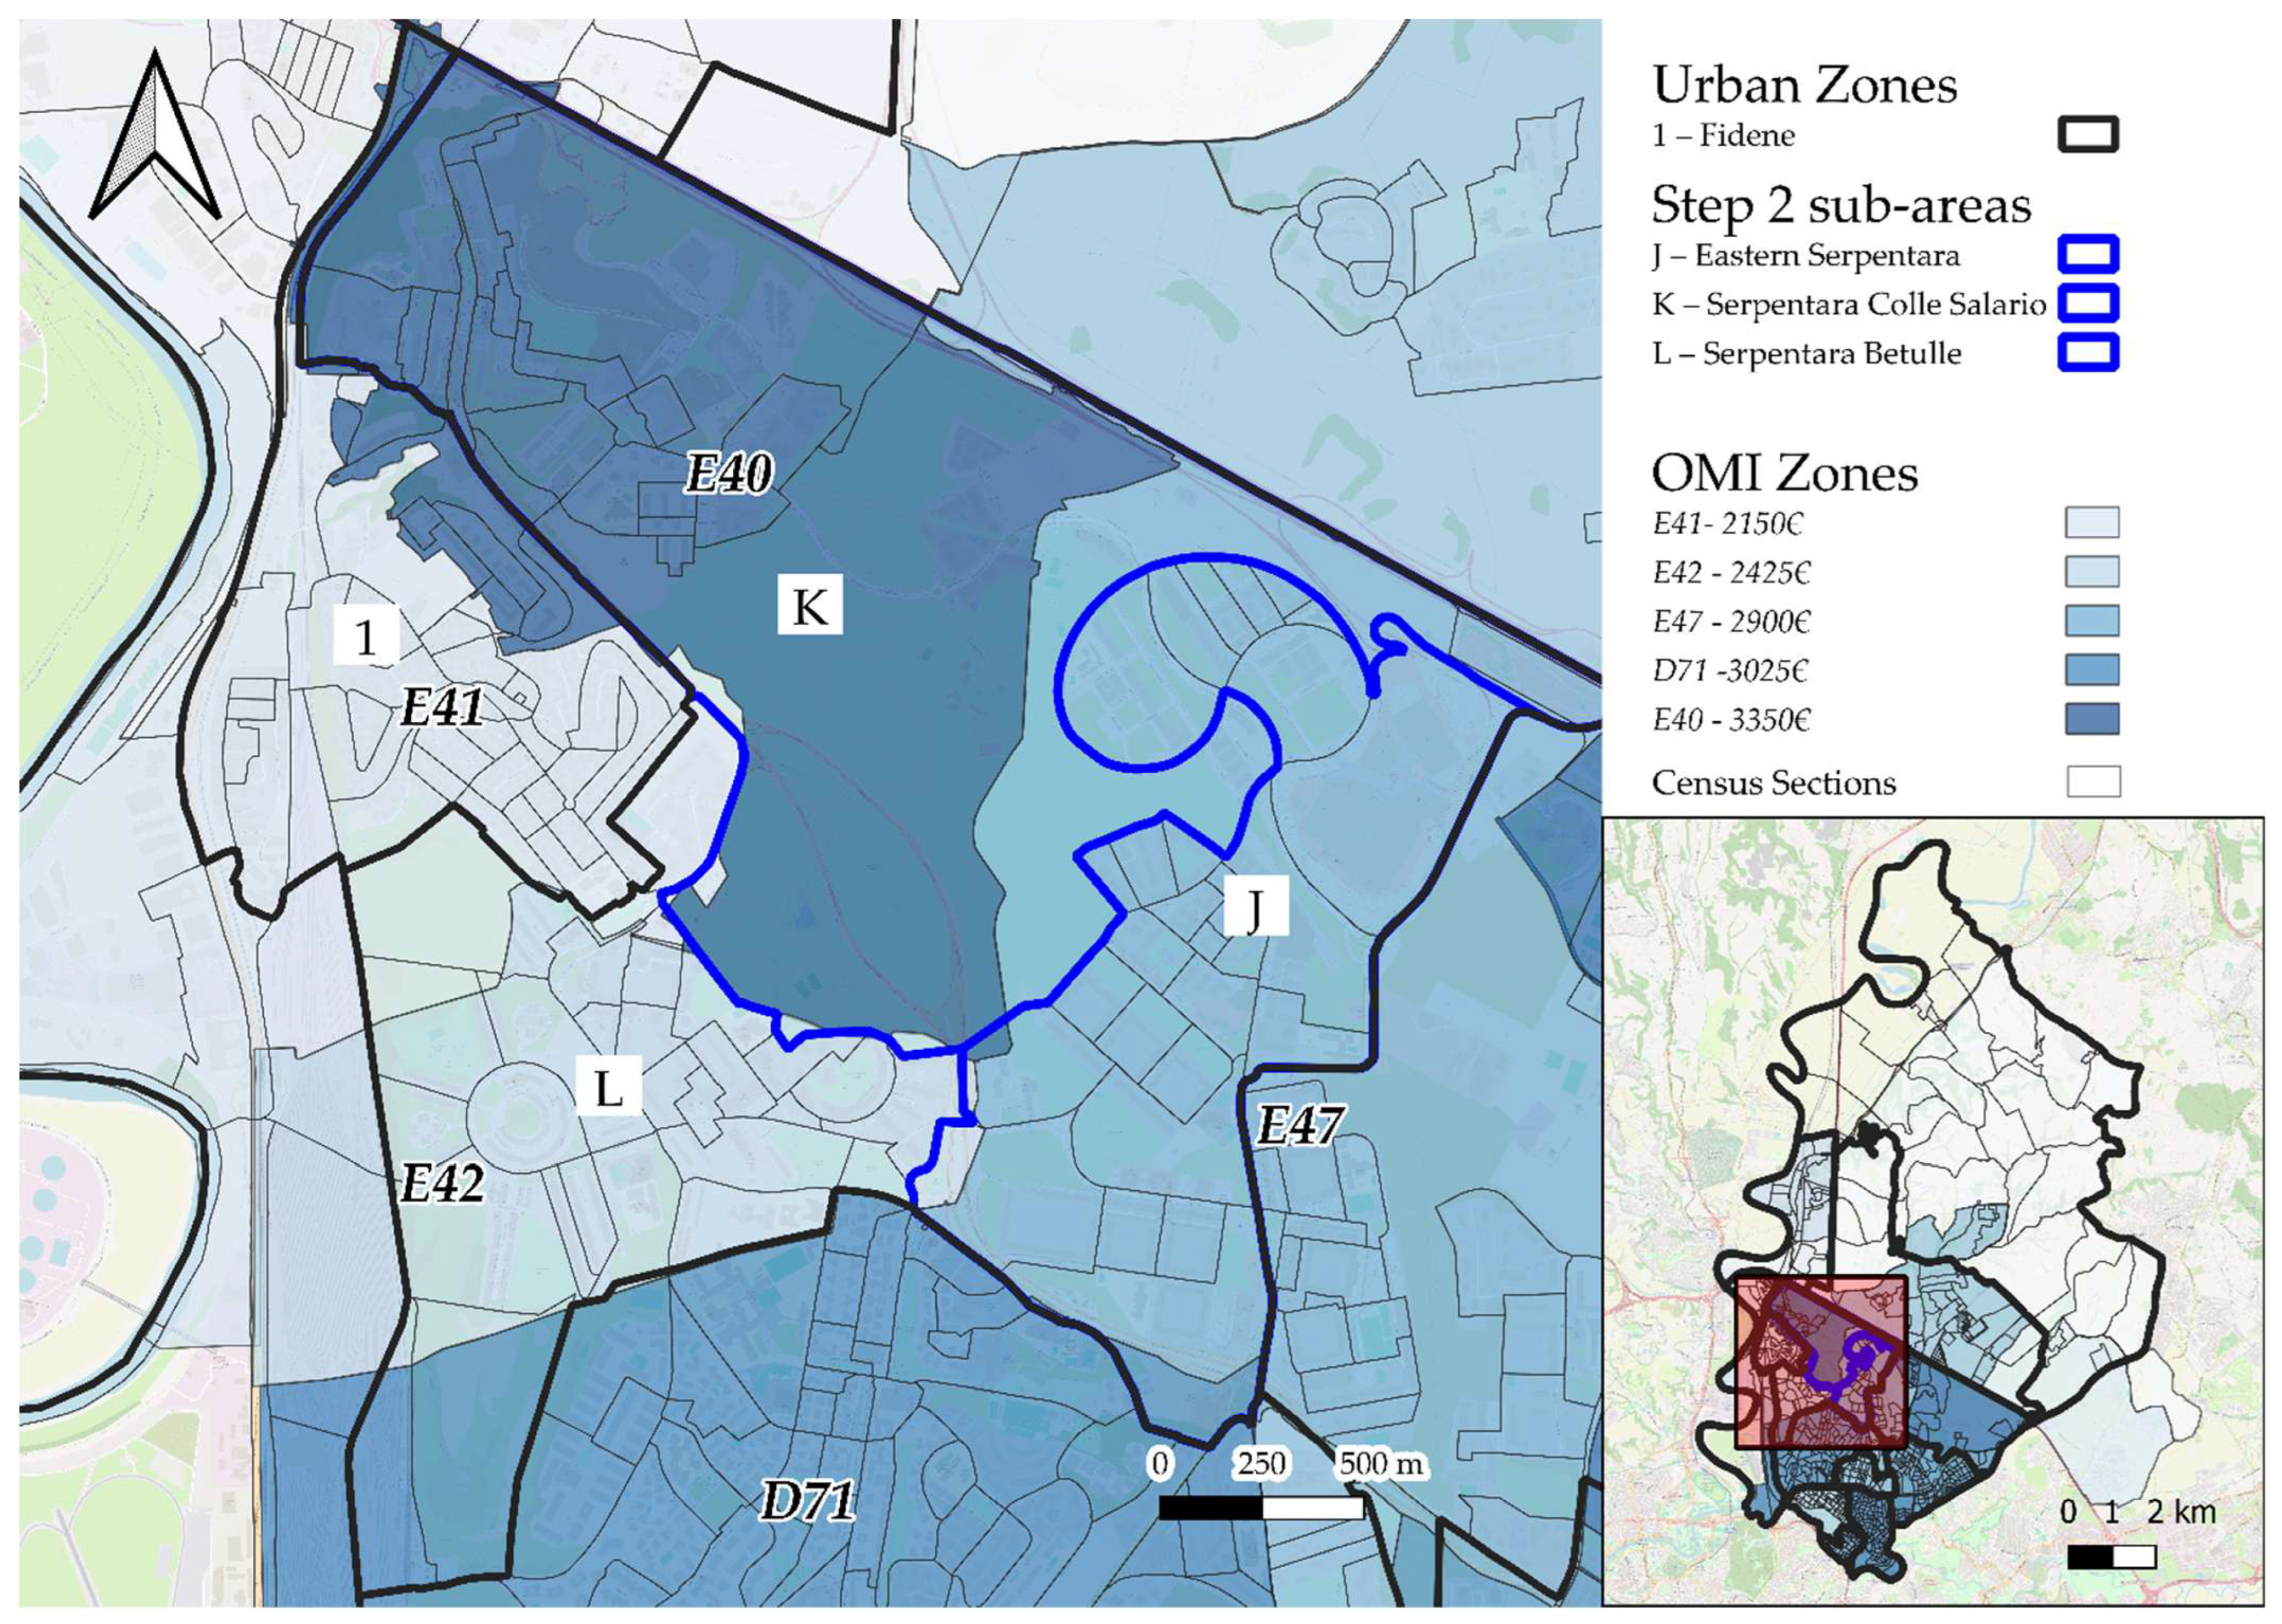
The Serpentara UZ, which surrounds the Fidene UZ on its eastern border, displays internal heterogeneity in terms of average property sale prices. Broadly speaking, its territory can be divided into three areas characterized by distinct average sale prices, as shown in Figure 7. As indicated in Step 2 of the Methods Section, CSs were used to delineate three separate Mesoareas: Serpentara Colle Salario (the area with the highest average price), Eastern Serpentara, and Serpentara Betulle (the area with the lowest average price). As shown in Figure 7 and Table 3, near the borders of the UZ, there are areas that fall within different OMI zones. However, since these zones include populations of fewer than 1500 inhabitants, they were not classified as separate sub-areas and were instead assimilated into the surrounding areas. Specifically, the southernmost area falling within OMI zone D71 has no residents, while the central-western area located in OMI zone E41, with a population of 1351 inhabitants, was incorporated into the Serpentara Betulle sub-area.
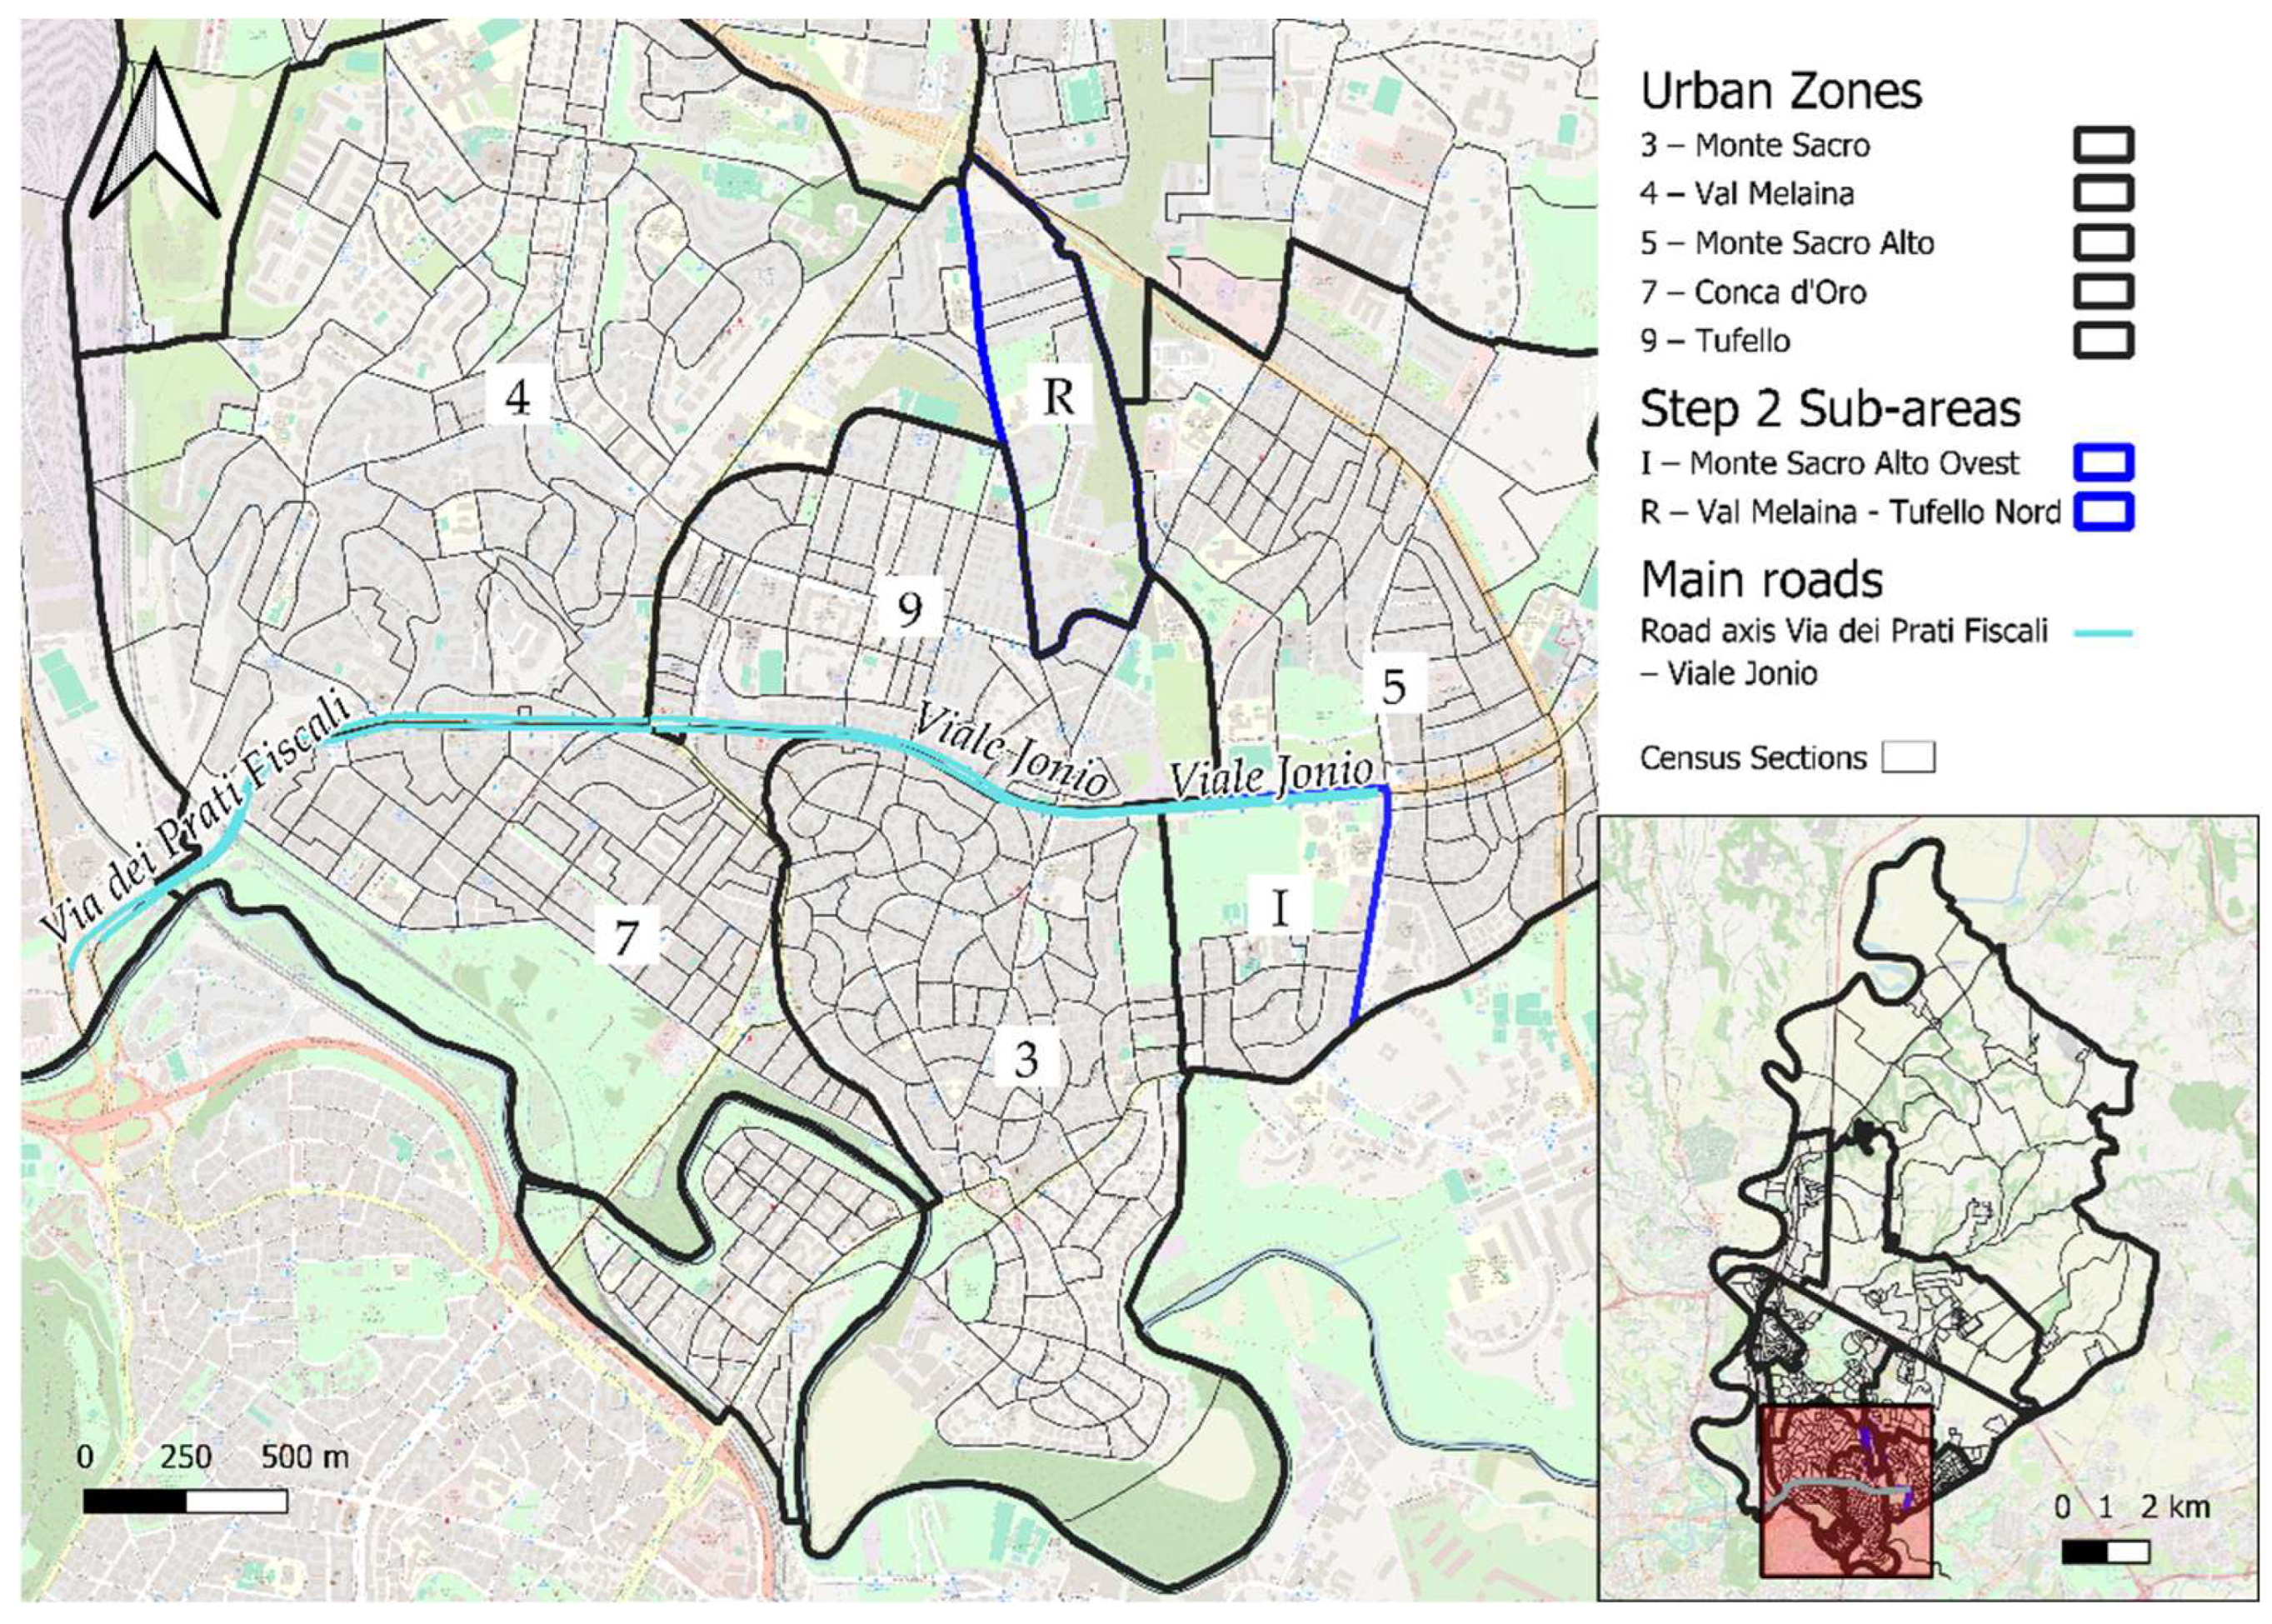
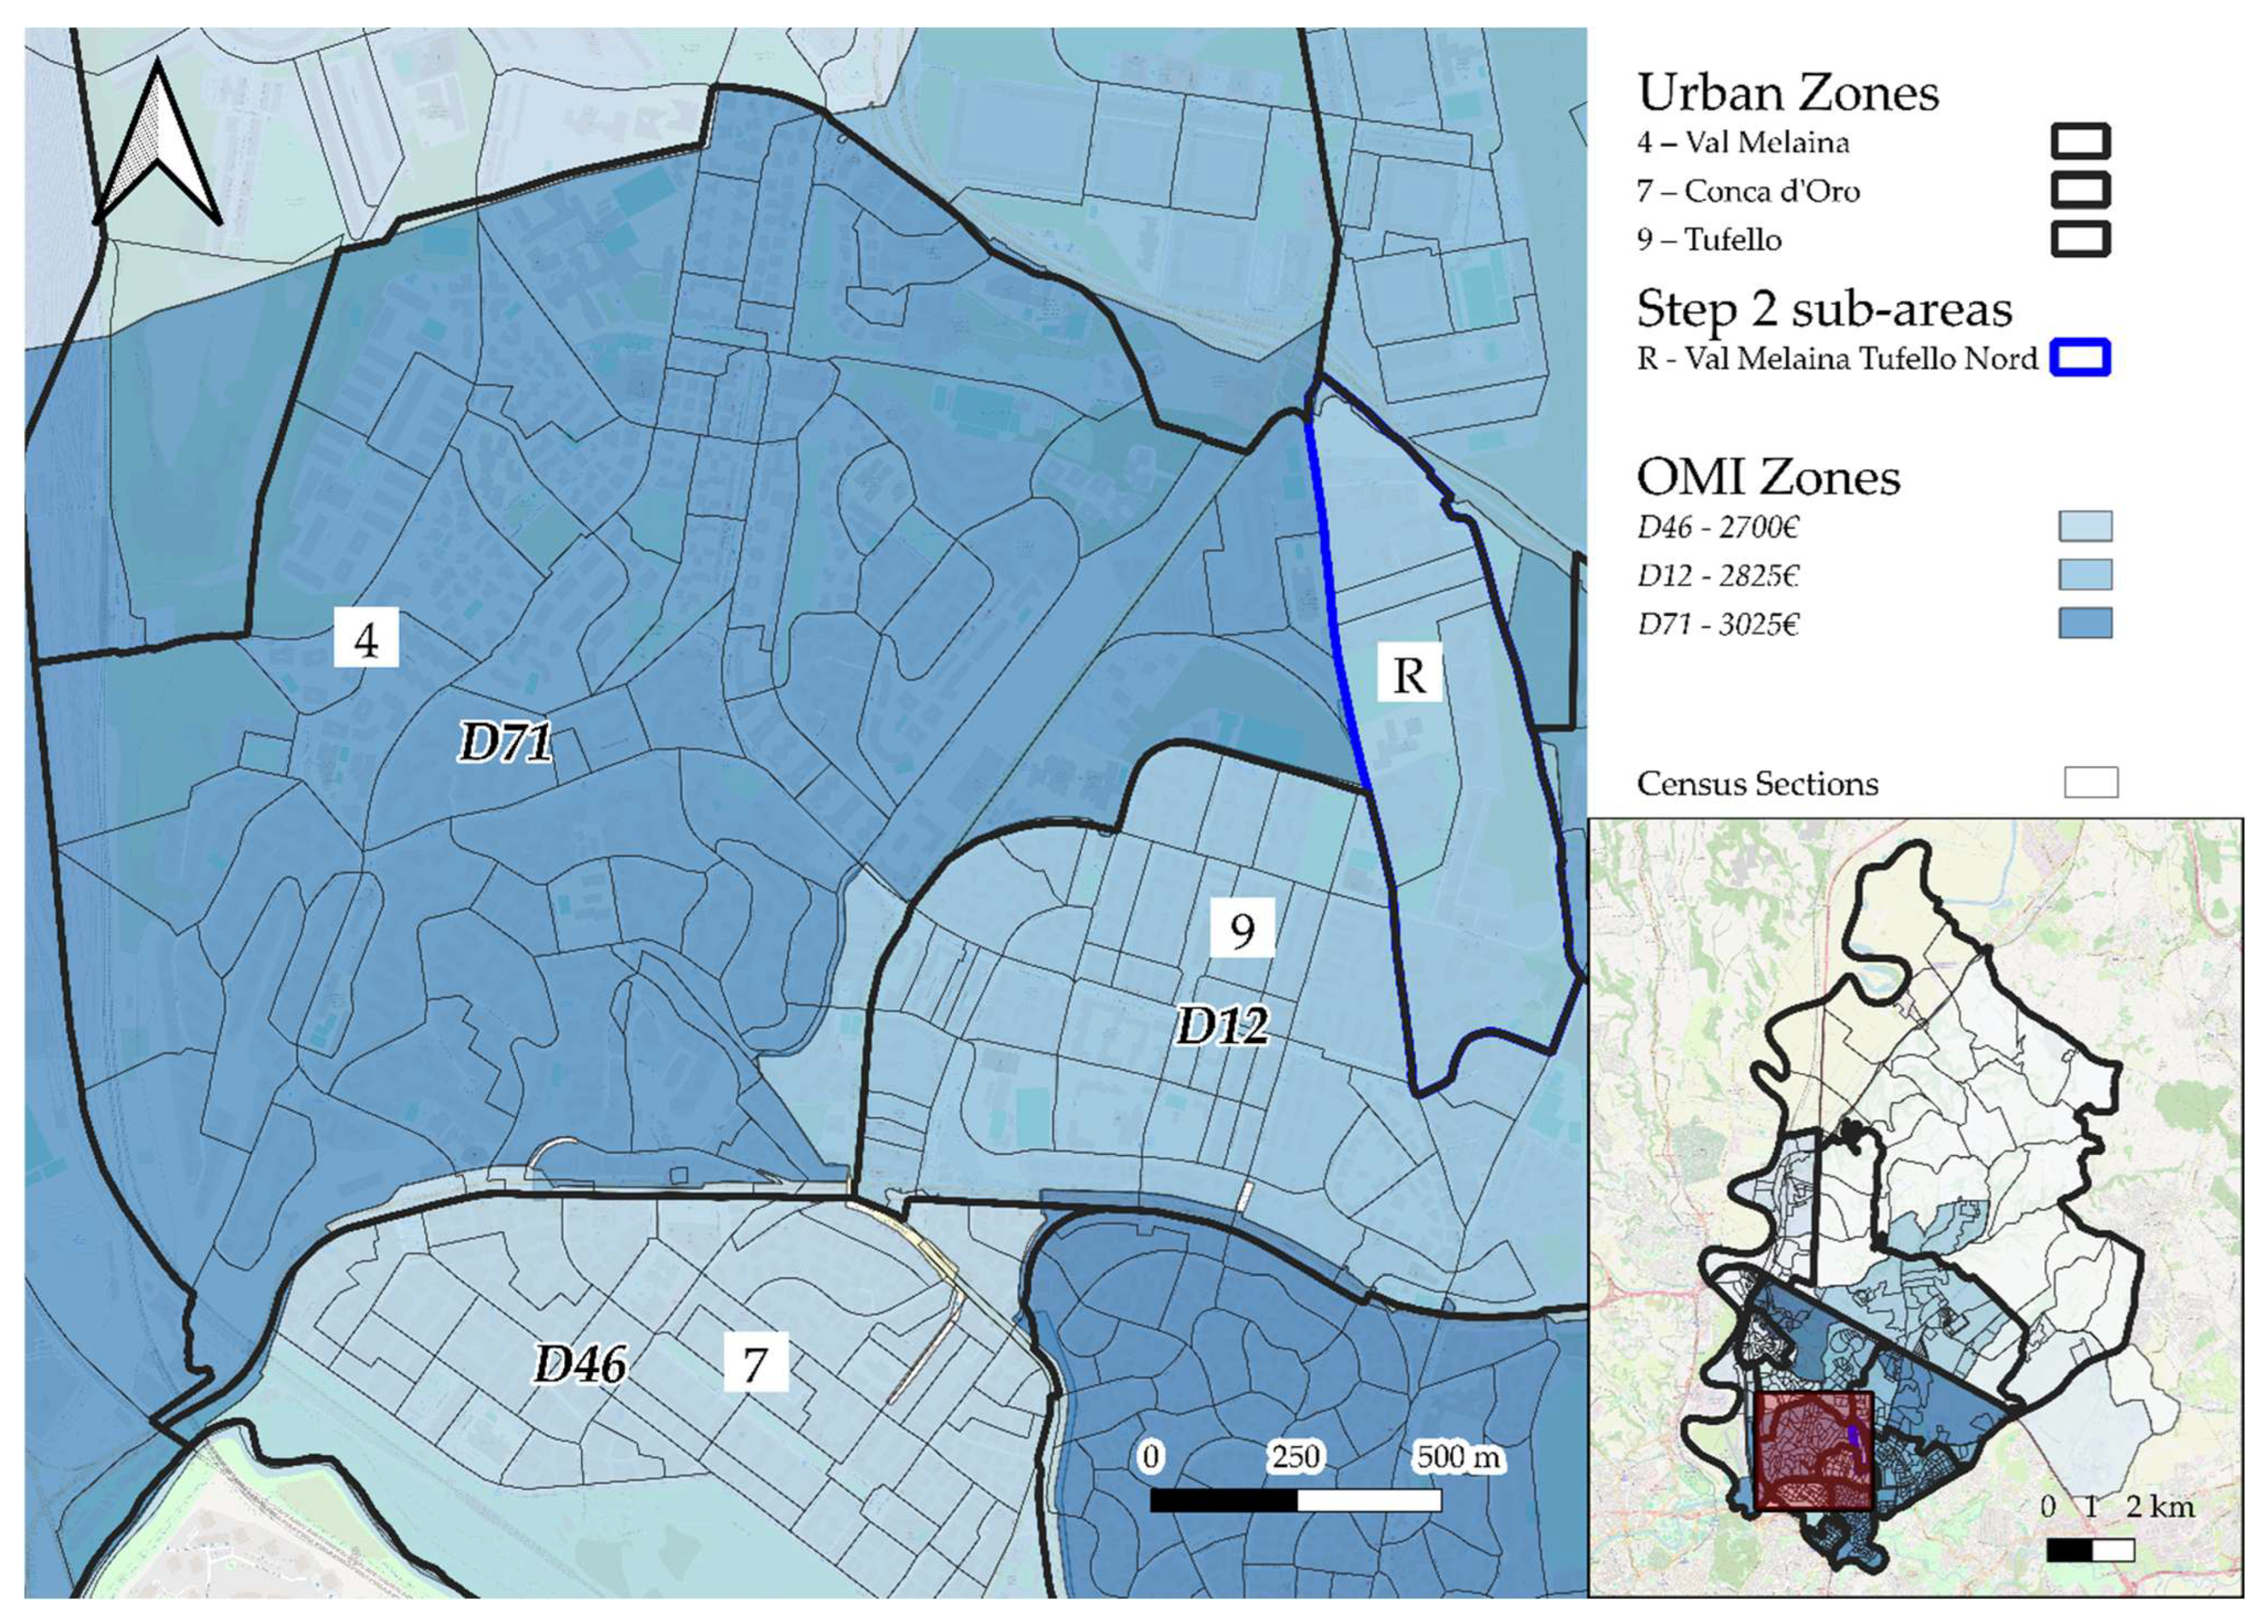
The Val Melaina UZ is largely homogeneous in terms of the average sale price, except for an eastern area that falls within an OMI zone characterized by a lower price. Therefore, CSs were used to separate this area from the rest of the UZ. This Mesoarea has thus been renamed “Northern Tufello” due to its urban continuity with the Tufello UZ, with which it shares a similar average real estate sale price (Figure 8). Similarly, in the area bordering the Tufello Urban Zone (UZ), some census sections fall within OMI zone D12, with a combined population of 1239 inhabitants; however, these sections were not considered for further subdivision (Figure 8 and Table 3).
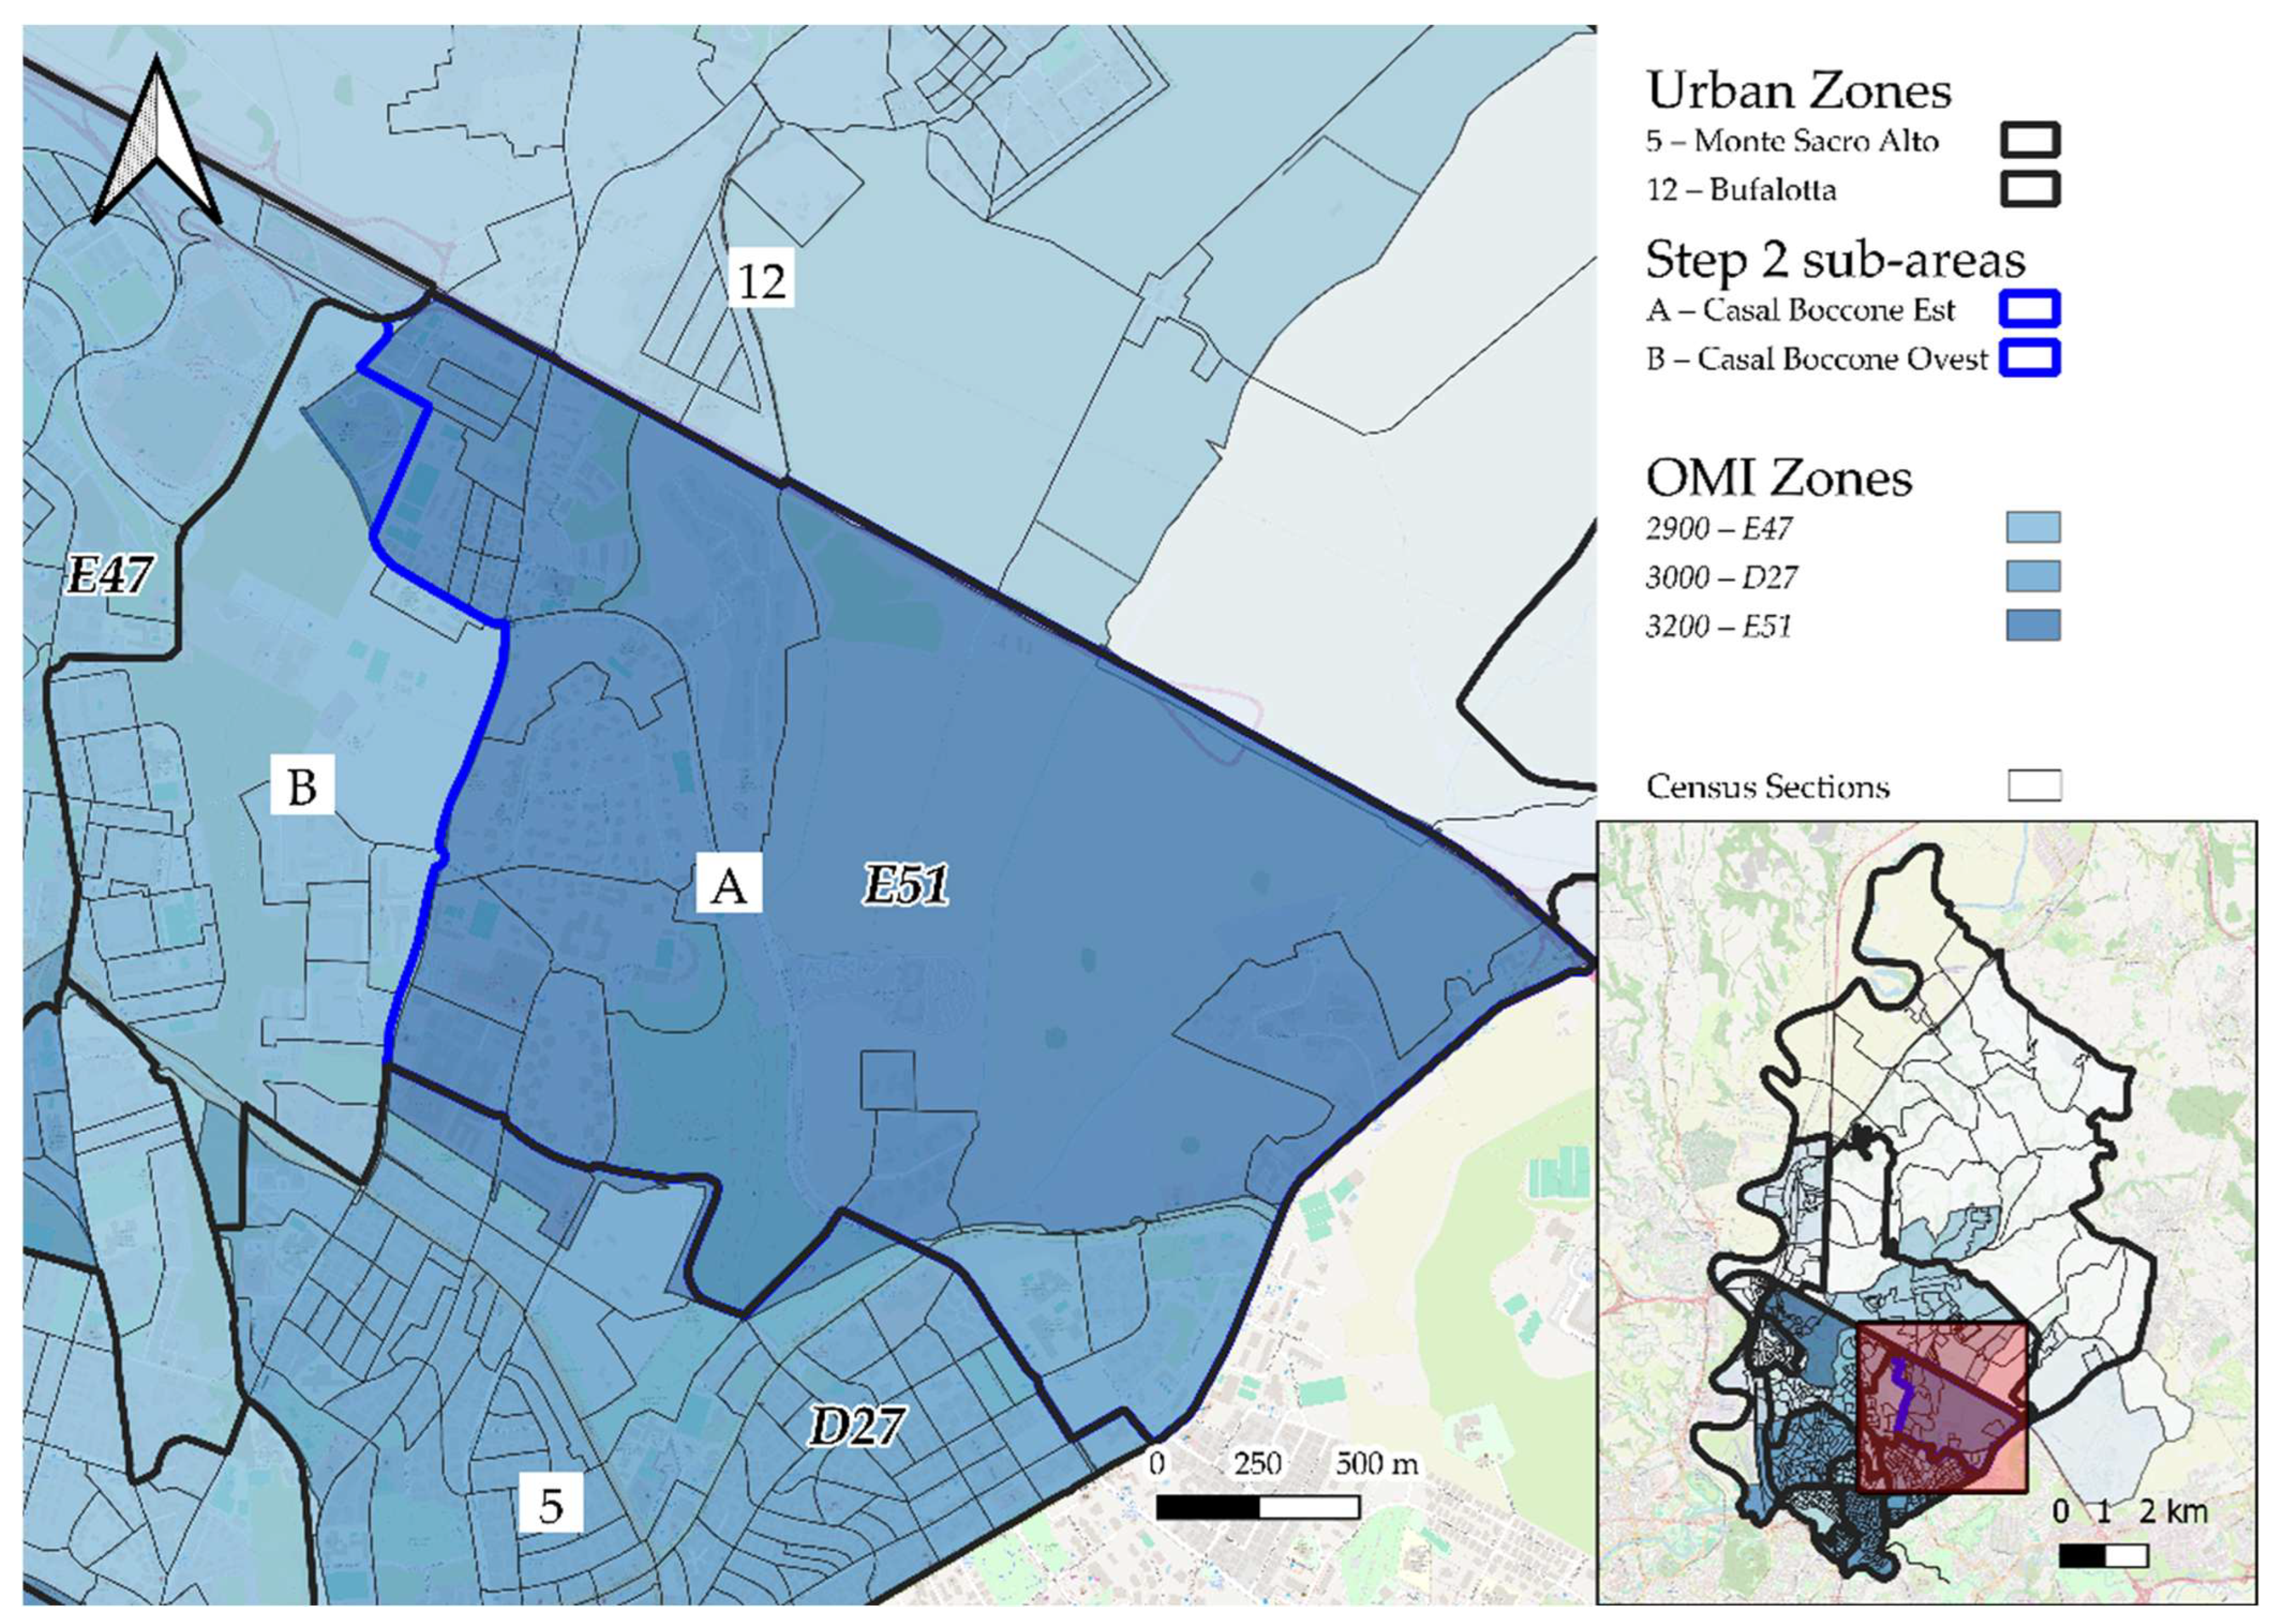
Most of the CSs within the Casal Boccone UZ fall into two different OMI areas: a smaller western portion with lower average prices, consistent with the adjacent Serpentara–Vigne Nuove area (E47), and a larger eastern portion with higher prices (E51). Consequently, the Casal Boccone UZ was subdivided into two Mesoareas: Eastern Casal Boccone and Western Casal Boccone (Figure 9). Additionally, the Casal Boccone UZ includes a small southwestern area falling within a different OMI zone (D27); this area, with a population of 536 inhabitants, was incorporated into the Casal Boccone East sub-area (Figure 9 and Table 3).
The Monte Sacro Alto UZ includes a relatively small area in the southwest characterized by a slightly higher average sale price compared to the rest of the UZ. Census sections were used to isolate this area, which has been renamed ‘Monte Sacro Alto Sannazzaro Park’, due to the presence of a green space that occupies nearly half of its surface (Figure 10). Additionally, some small areas in the northern part, near the border with the Casal Boccone UZ, fall within an OMI zone with a different average sale price (E51); however, since the population in this portion is fewer than 1500 inhabitants (960), no separate Mesoarea was defined based on this criterion (Figure 10 and Table 3).

3.3. Step 3—Subdivision Based on Major Roads and Inter-Neighborhood Arterial Roads

Roads within Municipality III corresponding to the A (motorways), S (high-speed roads), and IQ (inter-neighborhood roads) classifications were identified on the ANAS road network graph. These include the following:
  • Via Fucini Renato;
  • Via Graf Antonio;
  • Viale Jonio;
  • Via Nomentana Nuova (Nomentana—Sempione);
  • Via dei Prati Fiscali;
  • Viadotto Gronchi;
  • Viadotto Sandro Pertini;
  • Viadotto Saragat;
  • Viadotto Segni.
Among these, three road axes already serve as boundaries between previously identified Urban Zones (UZs) or sub-areas, as follows:
  • The road axis formed by Viale dei Prati Fiscali and Viale Jonio separates the Urban Zones (UZs) of Conca d’Oro and Monte Sacro to the south from those of Val Melaina and Conca d’Oro. In its easternmost section, it delineates the boundary between the Monte Sacro Alto UZ and its sub-area ‘Monte Sacro Alto Sannazzaro’, which was defined during Step 2 (Figure A2).
  • The high-speed road axis composed of roads no. 6–9 constitutes the so-called ‘Viadotto dei Presidenti’ (Presidents’ Viaduct) and separates the Fidene UZ from the Serpentara UZ to the northeast. As it continues, it crosses census sections (CSs) with low population density within the Serpentara UZ, which form the boundary between sub-areas identified in Step 1—specifically, between Serpentara Colle Salario and Serpentara Betulle along the Viadotto Giuseppe Saragat. Further along, it crosses the boundary CSs between the sub-area Serpentara Vigne Nuove and the Val Melaina UZ, in the section corresponding to Viadotto Antonio Segni. In its final section, named Viadotto Giovanni Gronchi, it traverses the boundary CSs between the Casal Boccone Est sub-area (outlined in Step 1) and the Monte Sacro Alto UZ (Figure A3).
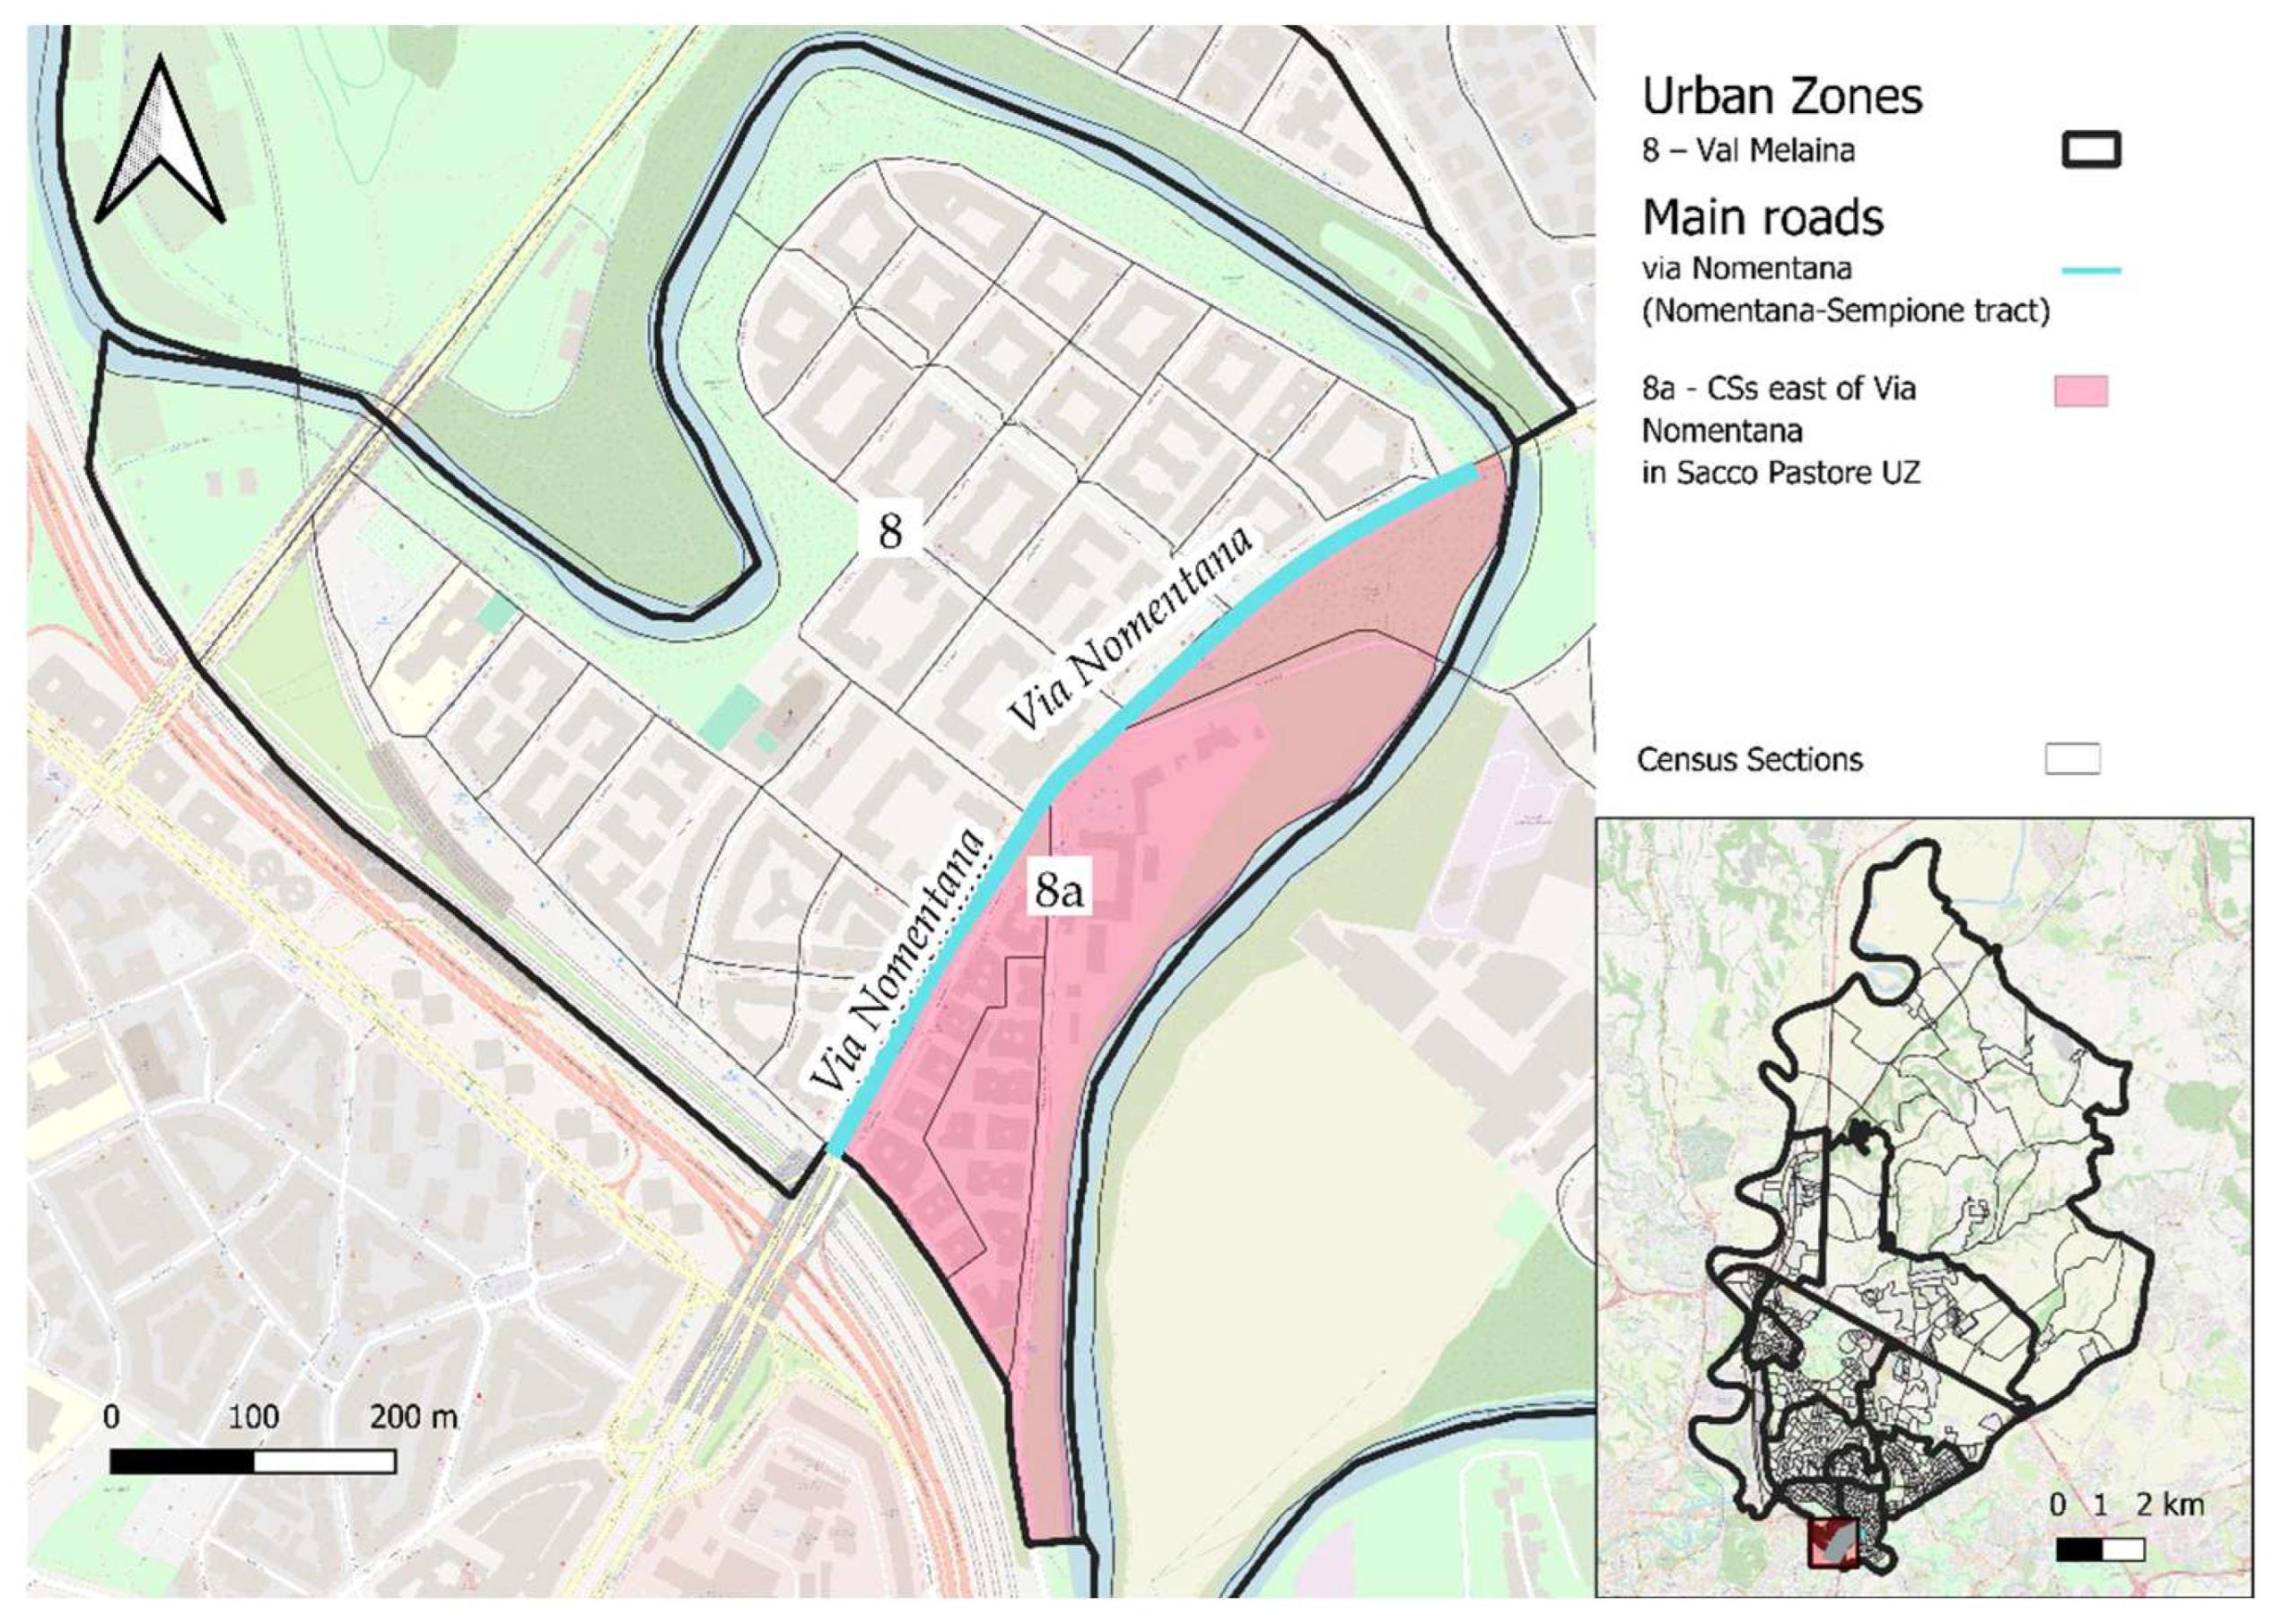
  • Via Nomentana, located within the ‘Nomentana–Sempione’ section— the only portion of Via Nomentana within Municipality III classified as an inter-neighborhood road by the General Urban Traffic Plan of Roma Capitale— constitutes a short segment of the larger consular road, Via Nomentana. It runs through the Sacco Pastore Urban Zone (UZ), effectively dividing it into eastern and western sectors. The eastern sector, situated along the banks of the Aniene River, counts 859 inhabitants and was therefore not identified as a distinct sub-area (Figure A4).
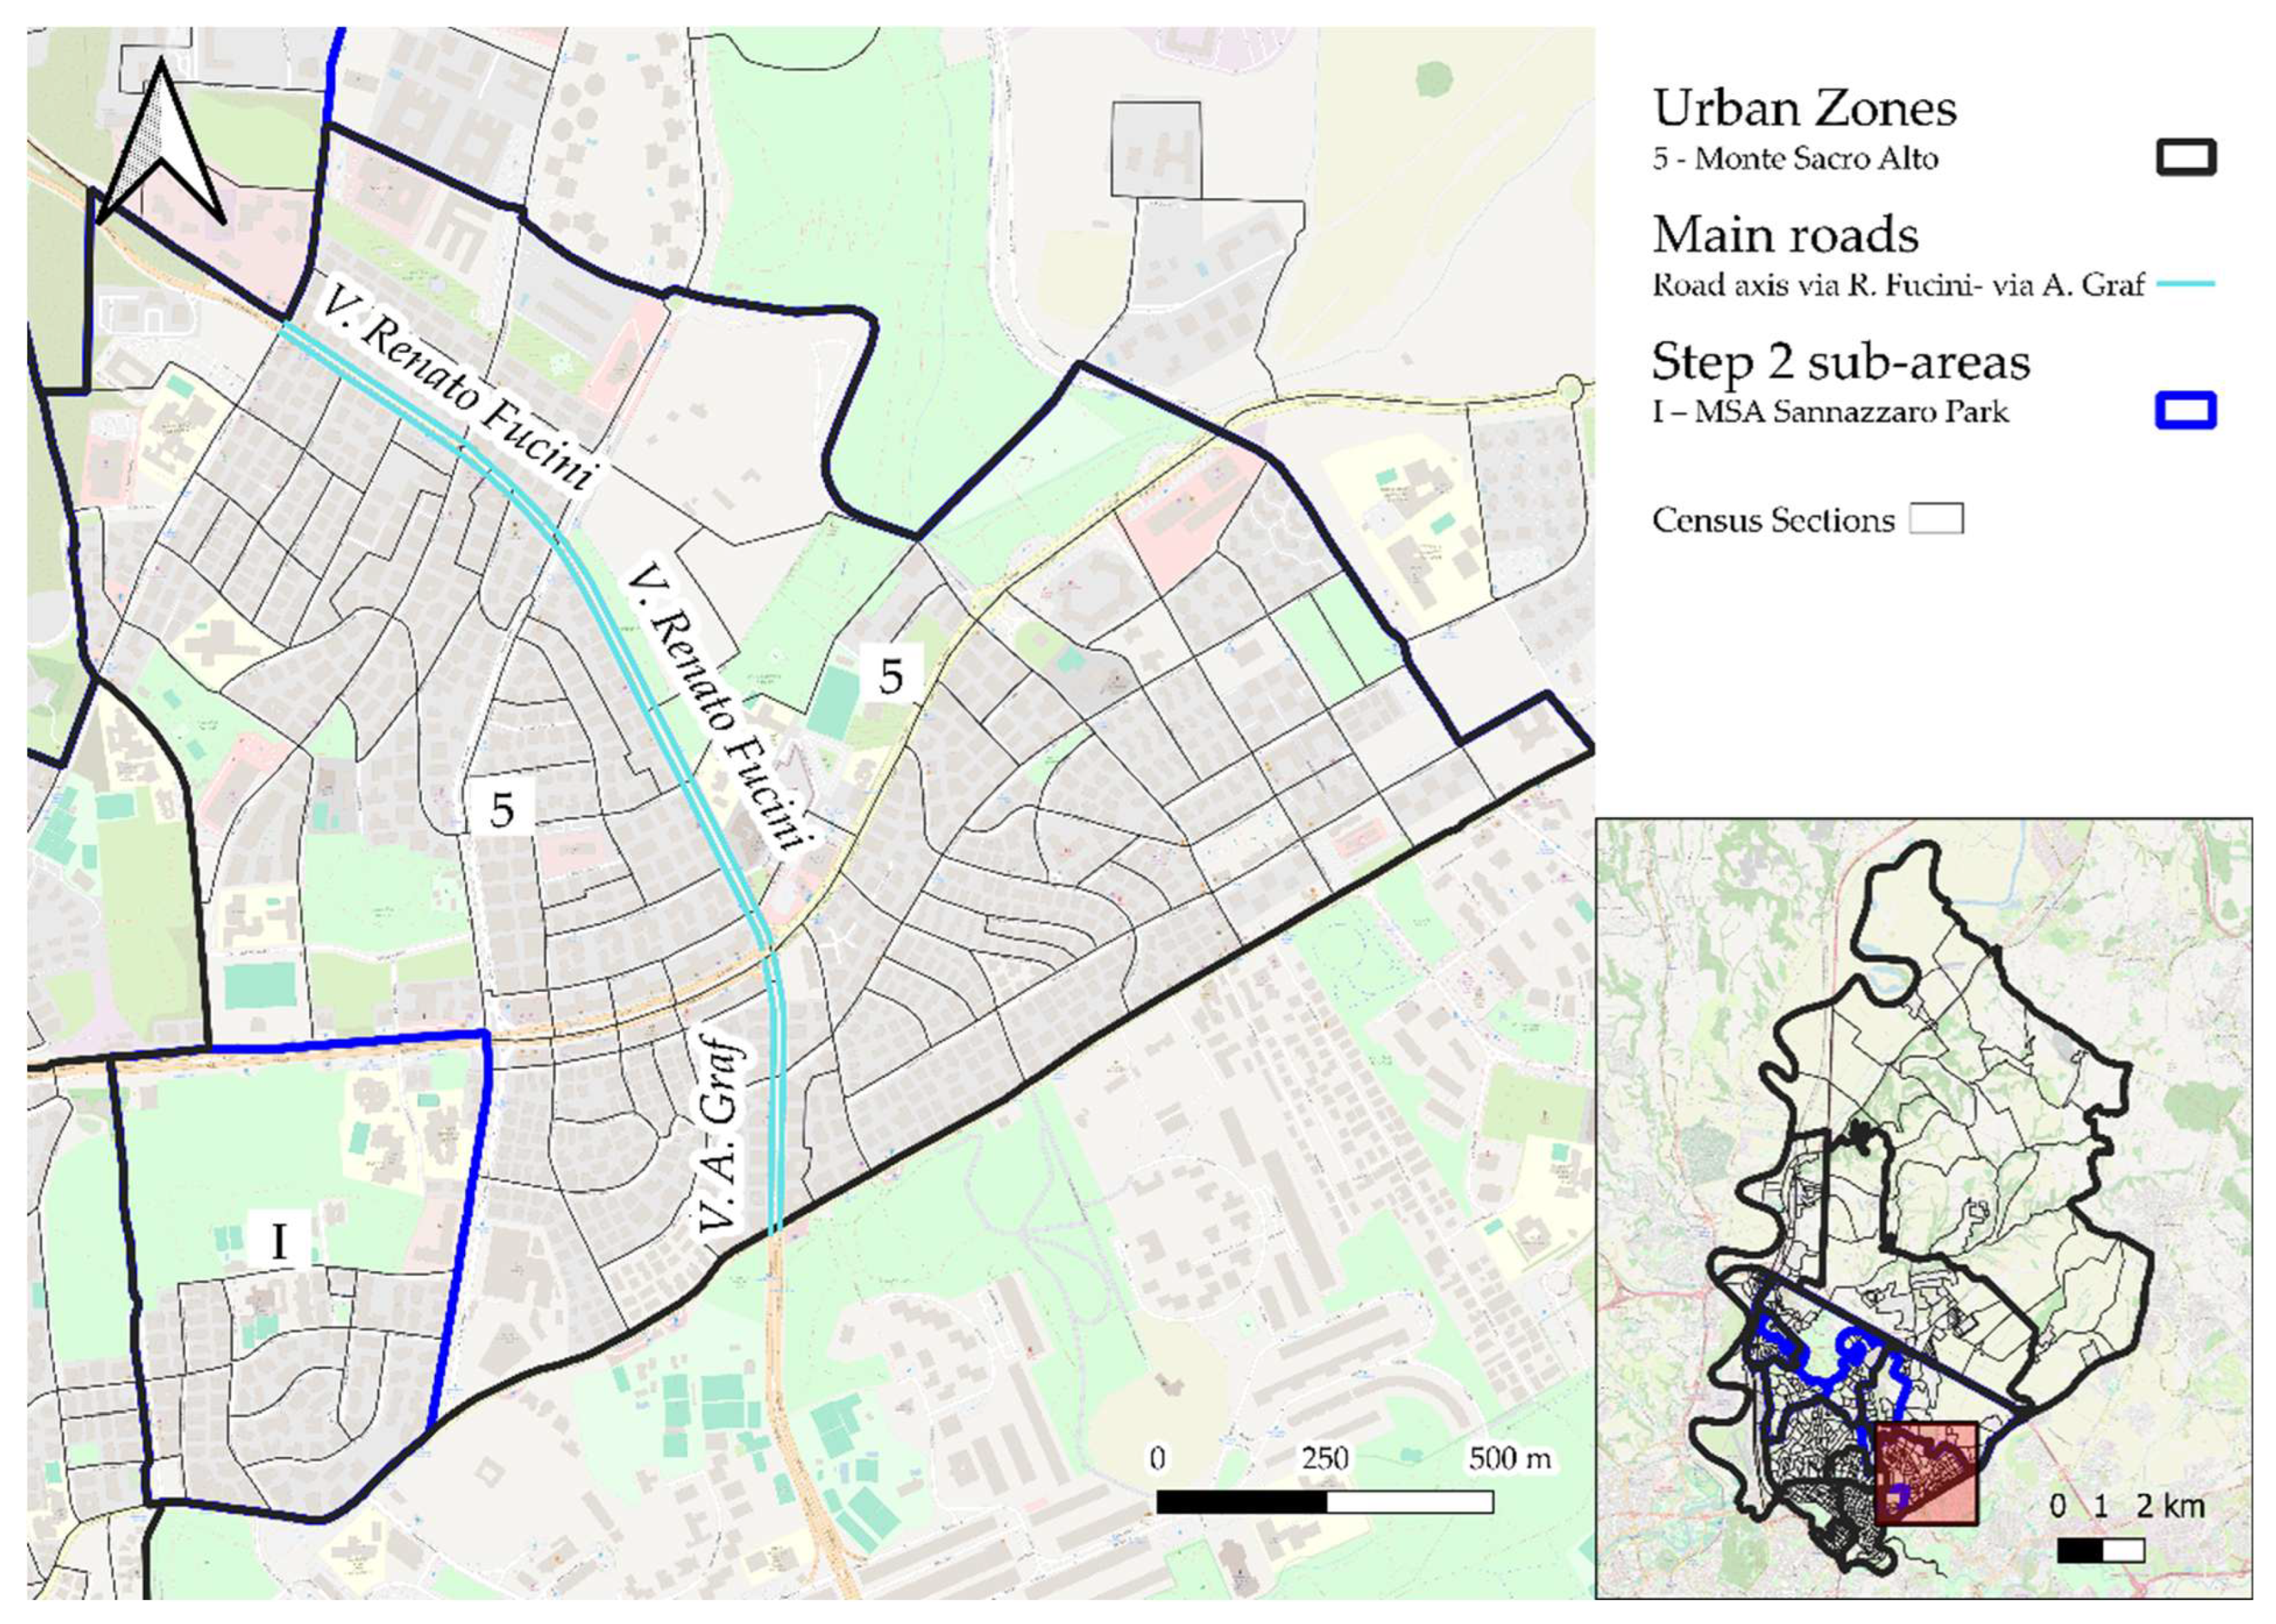
The remaining road axis, Via Renato Fucini–Via Arturo Graf, was instead used to further subdivide the Monte Sacro Alto UZ. Consequently, two additional sub-areas were identified: Central Monte Sacro Alto Centro and Eastern Monte Sacro Alto. Overall, the Monte Sacro Alto UZ was divided into three sub-areas: Central Monte Sacro Alto (16,334 inhabitants), Eastern Monte Sacro Alto (14,433 inhabitants), and Monte Sacro Alto Sannazzaro Park (2673 inhabitants) (Figure 11).
The subdivision using the indicated methods resulted in 20 sub-areas. (Table 4).

3.4. Step 4—Subdivision of UZs > 20,000 Inhabitants Based on Inter-Zonal Roads

Among the sub-areas delineated in the previous steps, the only sub-area with a population exceeding 20,000 inhabitants is Val Melaina, with 36,060 inhabitants (in Step 2, the Northern Tufello sub-area, with 2164 inhabitants, was separated from the Val Melaina UZ).
To identify the road axes along which further subdivisions of this area could be performed, roads classified as ‘inter-zonal’ by Roma Capitale were identified on the road network graph, as follows:
  • Via Cavriglia;
  • Via Vaglia;
  • Via Filippo Antonio Gualterio;
  • Piazza Minucciano;
  • Via Molazzana;
  • Via Seggiano;
  • Via Comano;
  • Piazza della Filattiera;
  • Via Pian di Sco;
  • Via Monte Cervialto.
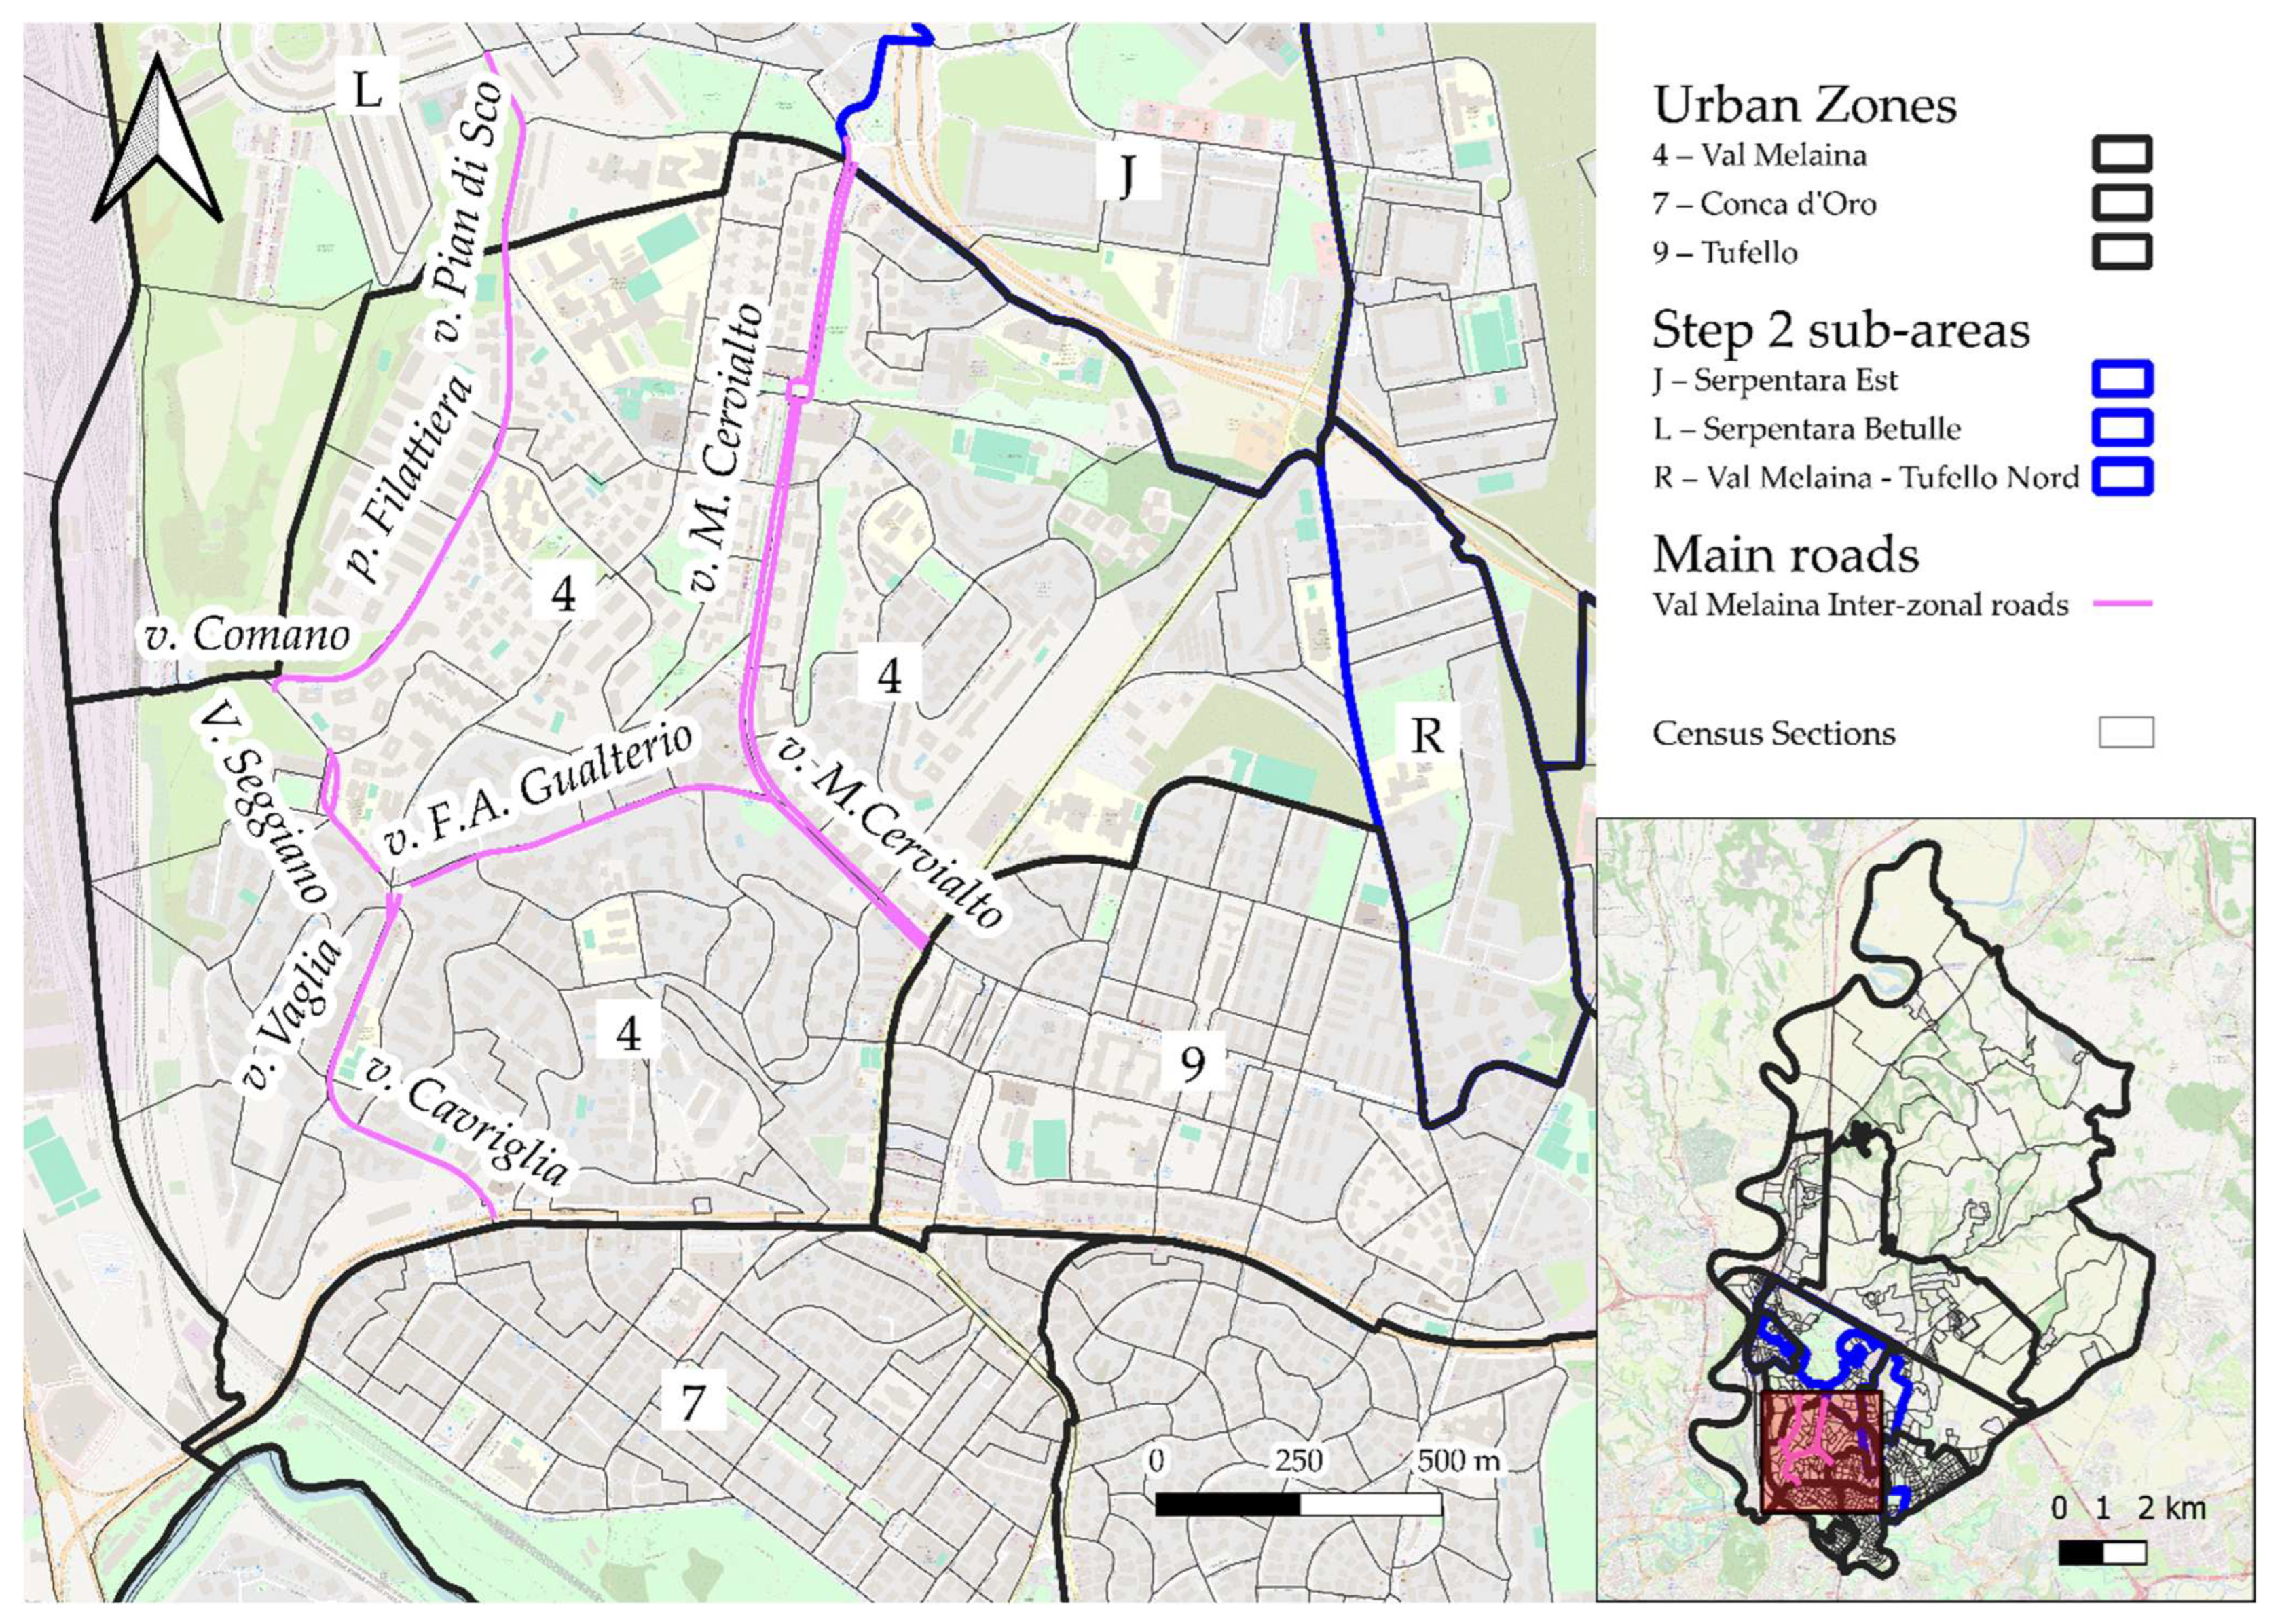
These roads enable the subdivision of the Val Melaina area along four axes (Figure 12), as follows:
  • The first, located furthest north, follows Piazza della Filattiera, Via Pian di Sco, and Via Comano.
  • The second runs along Piazza Minucciano, Via Cavriglia, Via Molazzano, Via Seggiano, and Via Vaglia.
  • The third follows Via Filippo Antonio Gualterio.
  • The fourth follows Via Monte Cervialto.
Through this step, the Val Melaina Urban Zone (UZ) was further subdivided into five sub-areas: Val Melaina 1 (1883 inhabitants), Val Melaina Giovanni Conti (9927 inhabitants), Val Melaina 2 (8602 inhabitants), Val Melaina FL1 (3905 inhabitants), and Val Melaina Prati Fiscali (11,743 inhabitants). Therefore, by including the previously identified Mesoarea of Northern Tufello (2164 inhabitants), Val Melaina was ultimately divided into six sub-areas (Figure 4).
The subdivision derived from Step 2–Sept 4 thus resulted in 24 sub-areas, with a resident population below 20,000 inhabitants each (Table 5).

3.5. Step 5—Statistical Assessment of SES Differences (Education Level) Between Sub-Areas of the Same UZ

Almost all Mesoareas within the same UZ—obtained either by OMI index or road axis subdivision—show statistically significant differences in the percentage of university graduates, used as a proxy for socio-economic status (SES) (Table 6).
No statistically significant differences were found between Northern/Southern Fidene, between Val Melaina Prati Fiscali/Val Melaina NorthernTufello, Val Melaina Prati Fiscali/Val Melaina2, Val Melaina1/Val Melaina2, Val Melaina Prati Fiscali/Val Melaina1, Val Melaina Northern Tufello/Val Melaina2, and between sub-areas derived from Serpentara UZ.

3.6. Step 6—Merging of Non-Significantly Different Areas

Due to the lack of statistical significance in the analysis, the following areas were merged:
  • Fidene Nord/Sud = Fidene;
  • Val Melaina 1/Val Melaina 2/Val Melaina Prati Fiscali = Val Melaina F.A. Gualterio;
  • Serpentara Betulle/Serpentara Colle Salario = Serpentara Colle Salario Betulle.
After this step, a total of 20 sub-areas were identified, as reported in Table 7.

3.7. Step 4b—Subdivision of UZs > 20,000 Inhabitants Based on Inter-Zonal Roads

Among the sub-areas delineated in the previous steps, two sub-areas still had a population exceeding 20,000 inhabitants: Val Melaina F.A. Gualterio and Serpentara Colle Salario Betulle.
Since the Urban Zone (UZ) of Val Melaina had already been subdivided based on inter-zonal road axes, no further subdivisions were carried out in this area. Instead, the inter-zonal roads classified by Roma Capitale within the UZ of Serpentara were identified on the street network graph, including the following:
  • Via Amalia Bettini;
  • Viale Gino Cervi;
  • Via Pian di Sco;
  • Via Titina de Filippo.
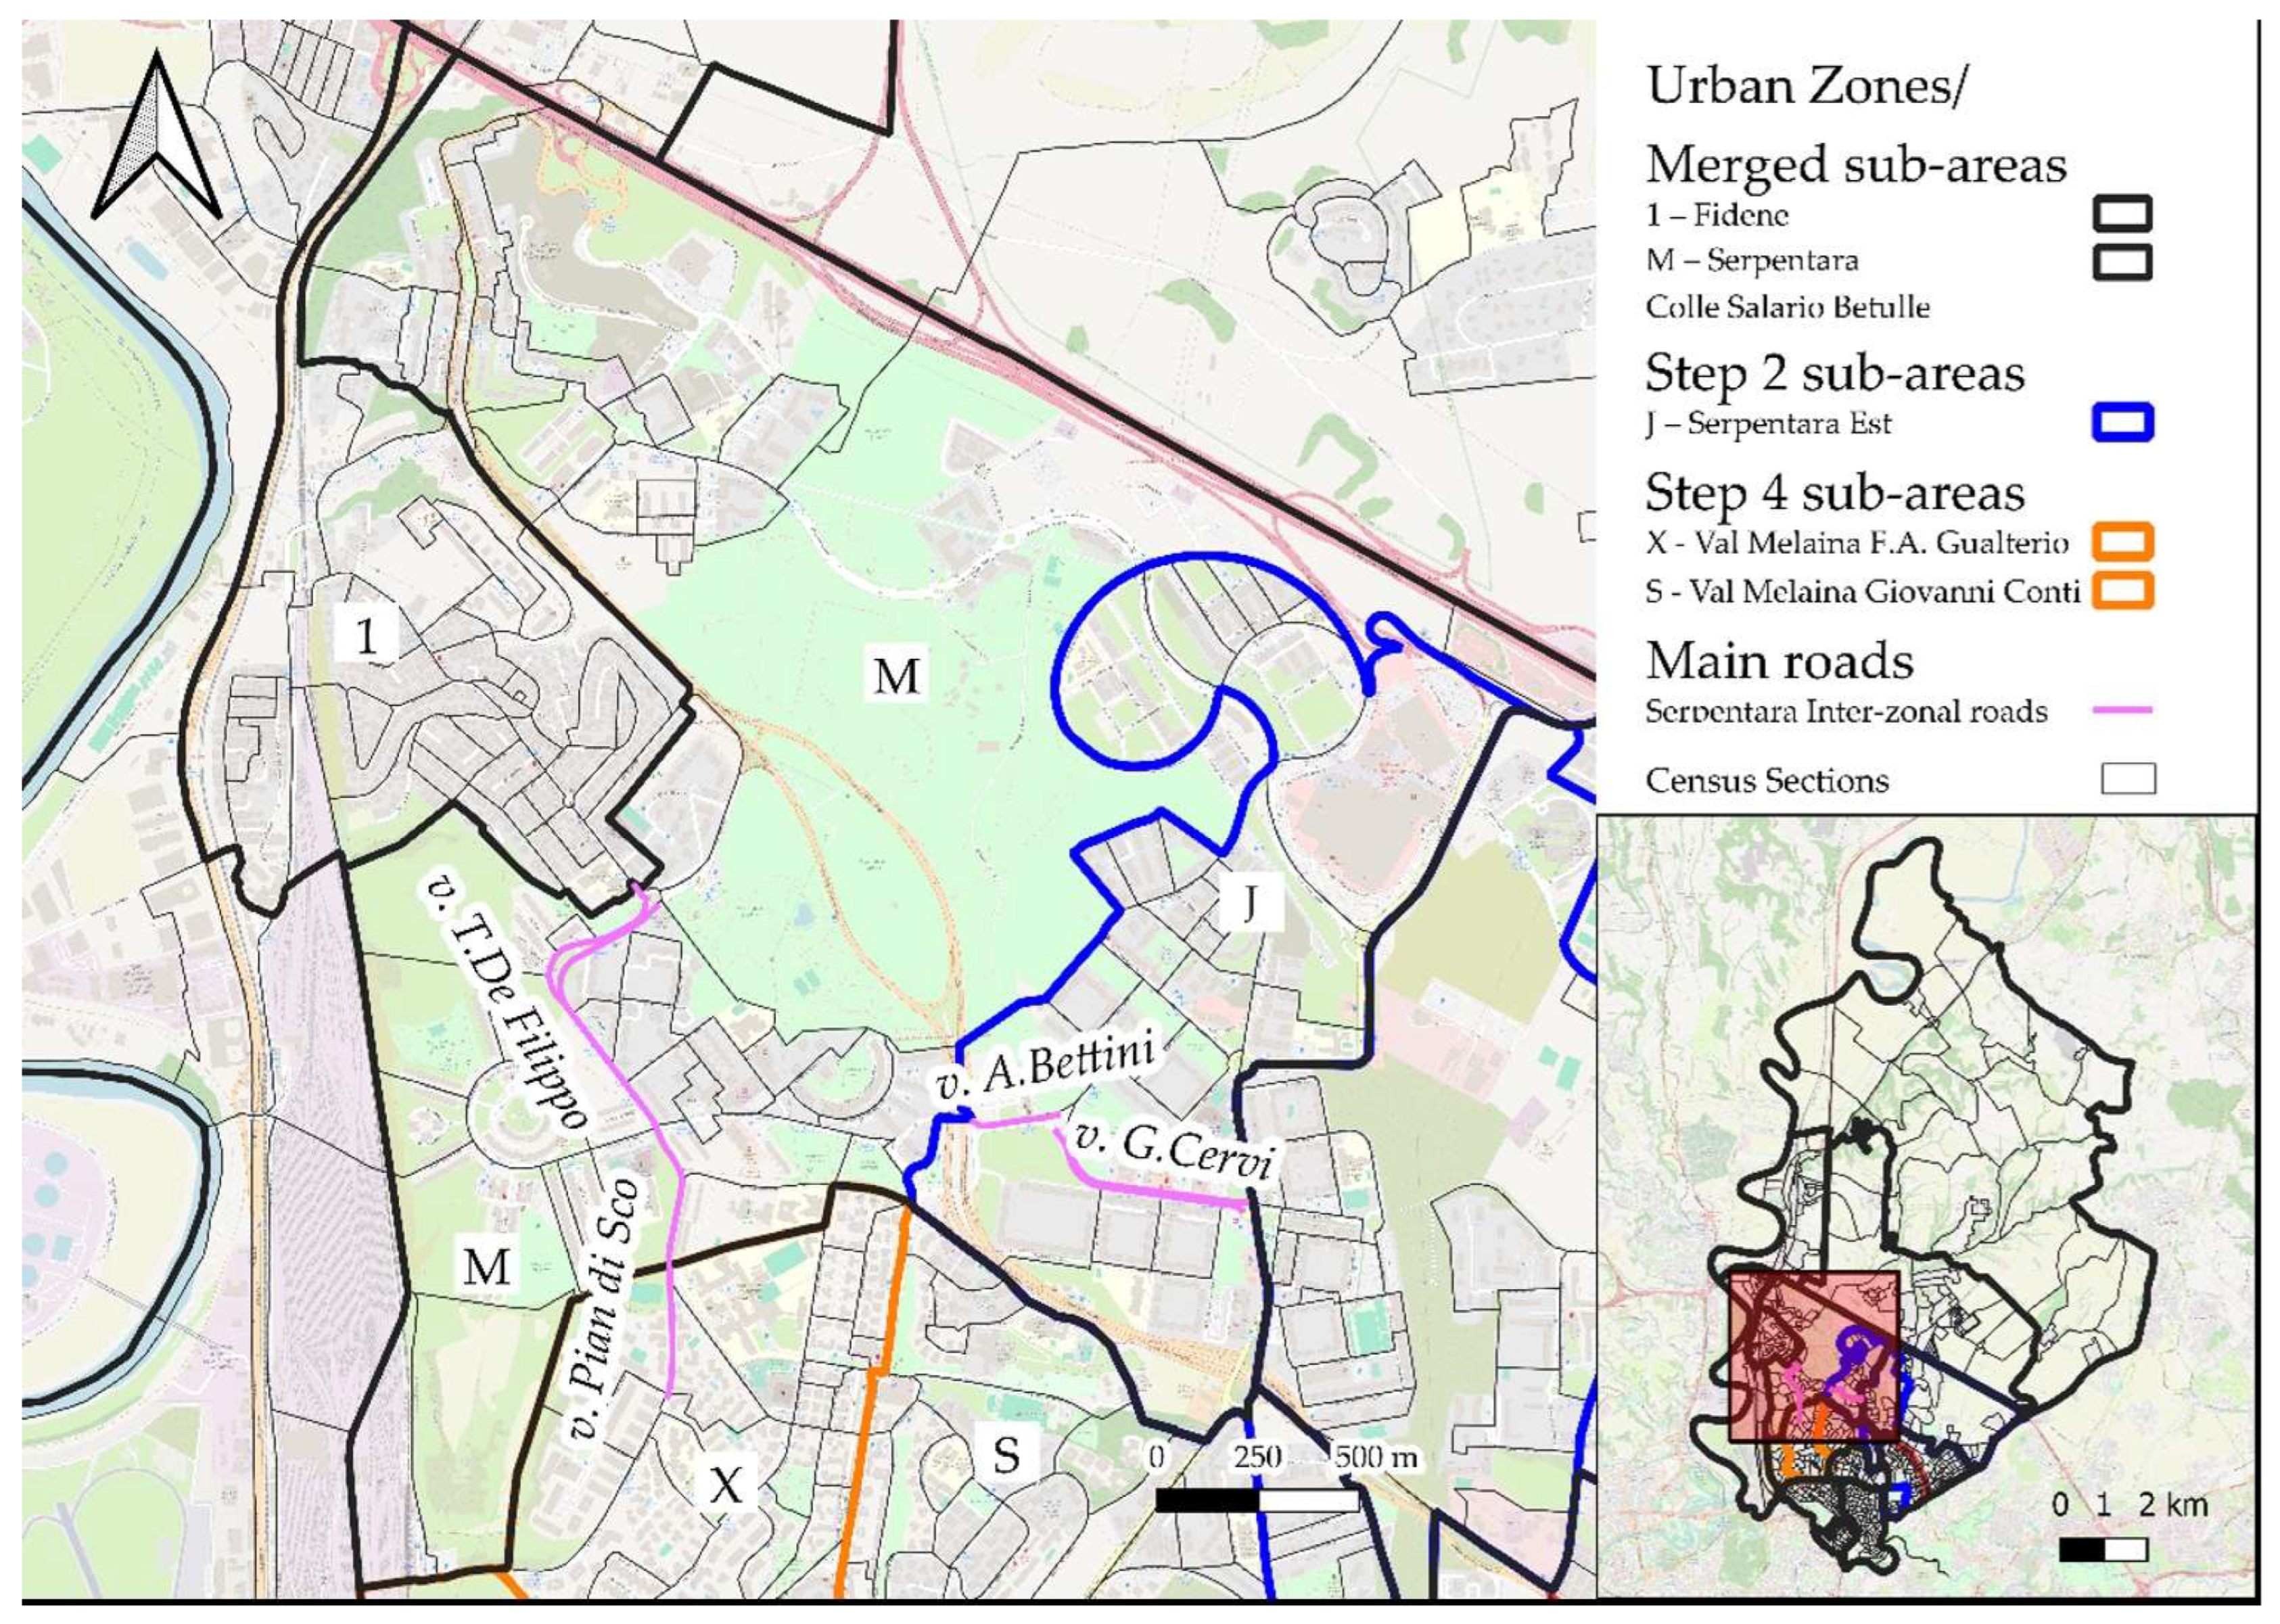
These roads enable a further subdivision of the Serpentara area along two axes: the first, in the southwest, follows via Pian di Sco and via Titina de Filippo; the second, in the southeast, follows via Amalia Bettini and Viale Gino Cervi (Figure 13).
At the conclusion of this step, the Serpentara Urban Zone is divided into four sub-areas: Serpentara Giulio Pasquati, Serpentara Vigne Nuove, Serpentara 2, and Serpentara 3 (Figure 4).

3.8. Step 5b—Statistical Assessment of SES Differences (Education Level) Between Sub-Areas of the Same UZ

Table 8 reports the results of the chi-squared test carried out to assess differences in educational attainment across the Serpentara sub-areas identified in the previous steps.

3.9. Step 6b—Merging of Non-Significantly Different Areas

Given the lack of statistically significant differences between the two adjacent sub-areas Serpentara 2 and Serpentara 3, they were merged again into a single sub-area named Serpentara Colle Salario Betulle (referred to as Serpentara CS Betulle in the tables). In contrast, the sub-areas Serpentara Giulio Pasquati and Serpentara Vigne Nuove were retained (Figure 4).

3.10. Step 5c—Statistical Assessment of SES Differences (Education Level) Between Sub-Areas of the Same UZ

Table 9 presents the results of the chi-squared test performed to evaluate statistically significant differences in educational attainment across the Serpentara sub-areas delineated in the preceding methodological steps.

3.11. Statistical Assessment of Differences Between Mesoareas

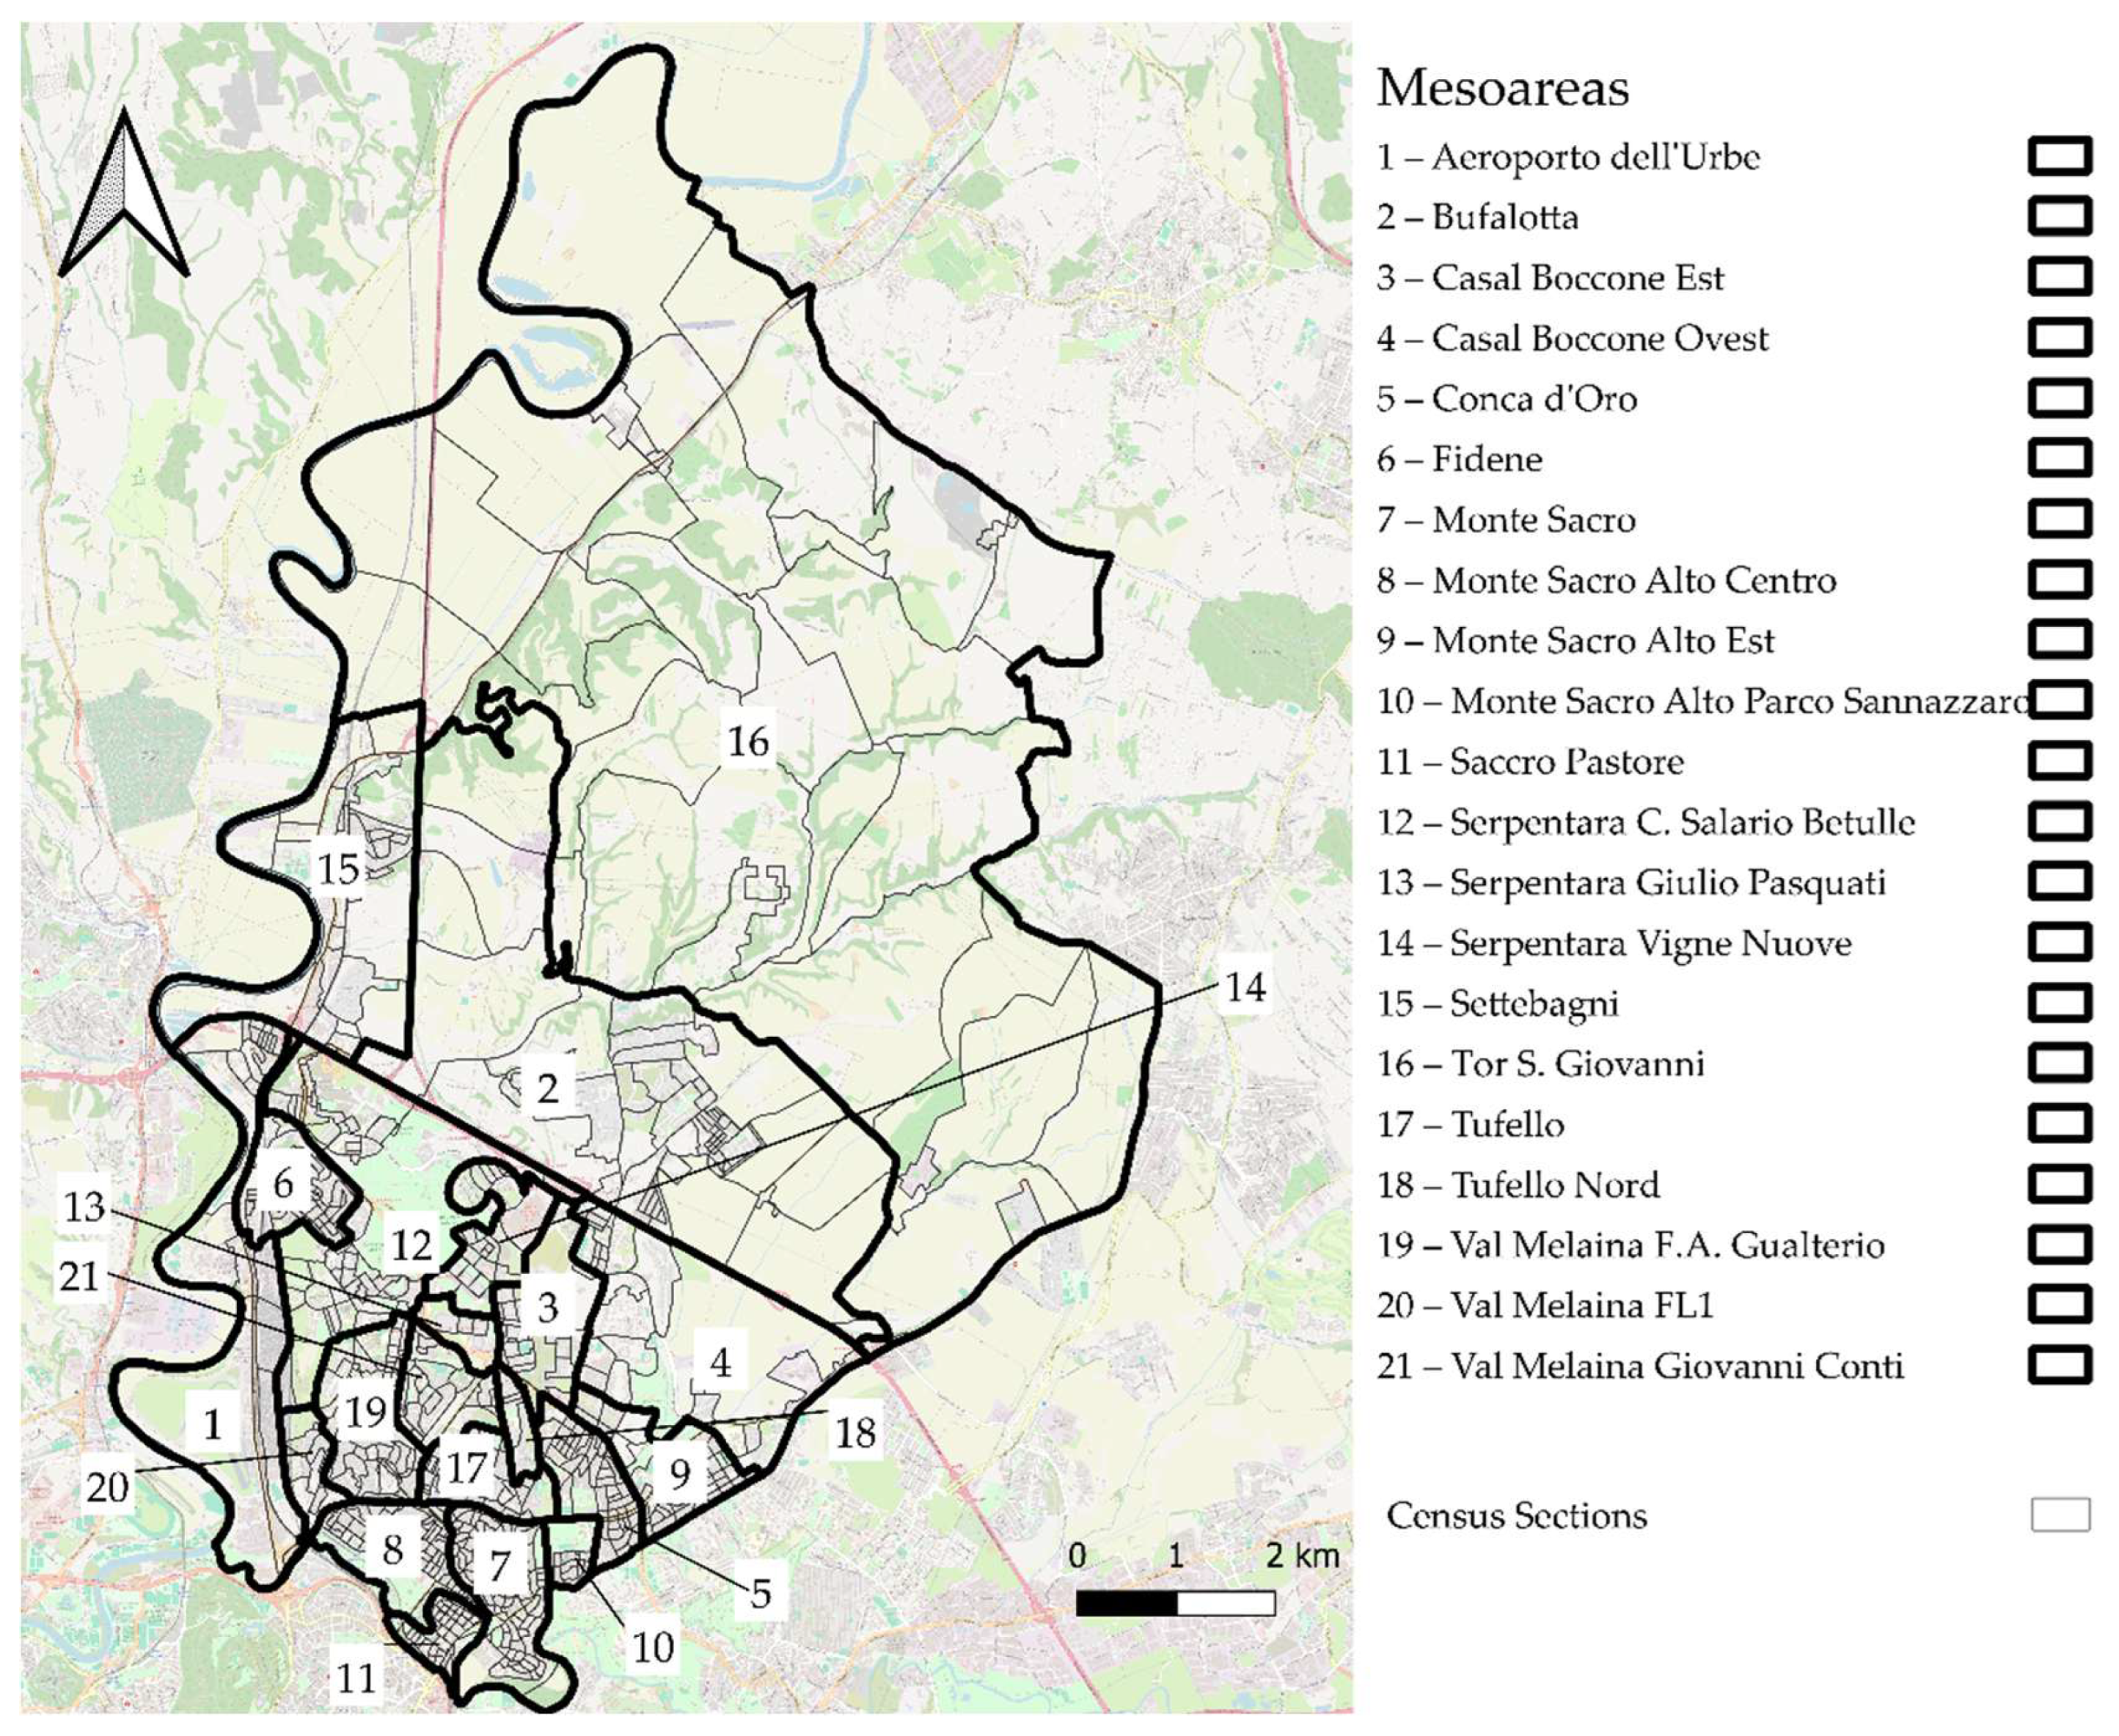
As a result of the previous steps, a total of 21 Mesoareas were identified (see Table 10, Figure 14 and Figure 15). The adopted methodology allowed the delineation of Mesoareas with population sizes ranging from 706 inhabitants (Tor San Giovanni) to 22,228 inhabitants (Val Melaina F.A. Gualterio). Two Mesoareas—Val Melaina F.A. Gualterio (22,228 inhabitants) and Serpentara Colle Salario Betulle (21,278 inhabitants)—exceed the 20,000-resident threshold. Considering the lack of statistically significant differences within their internal census sections and the impossibility of applying further subdivisions based on the road network structure, no additional splitting was performed.

3.12. Summary Measures of Educational Attainment by Urban Classification

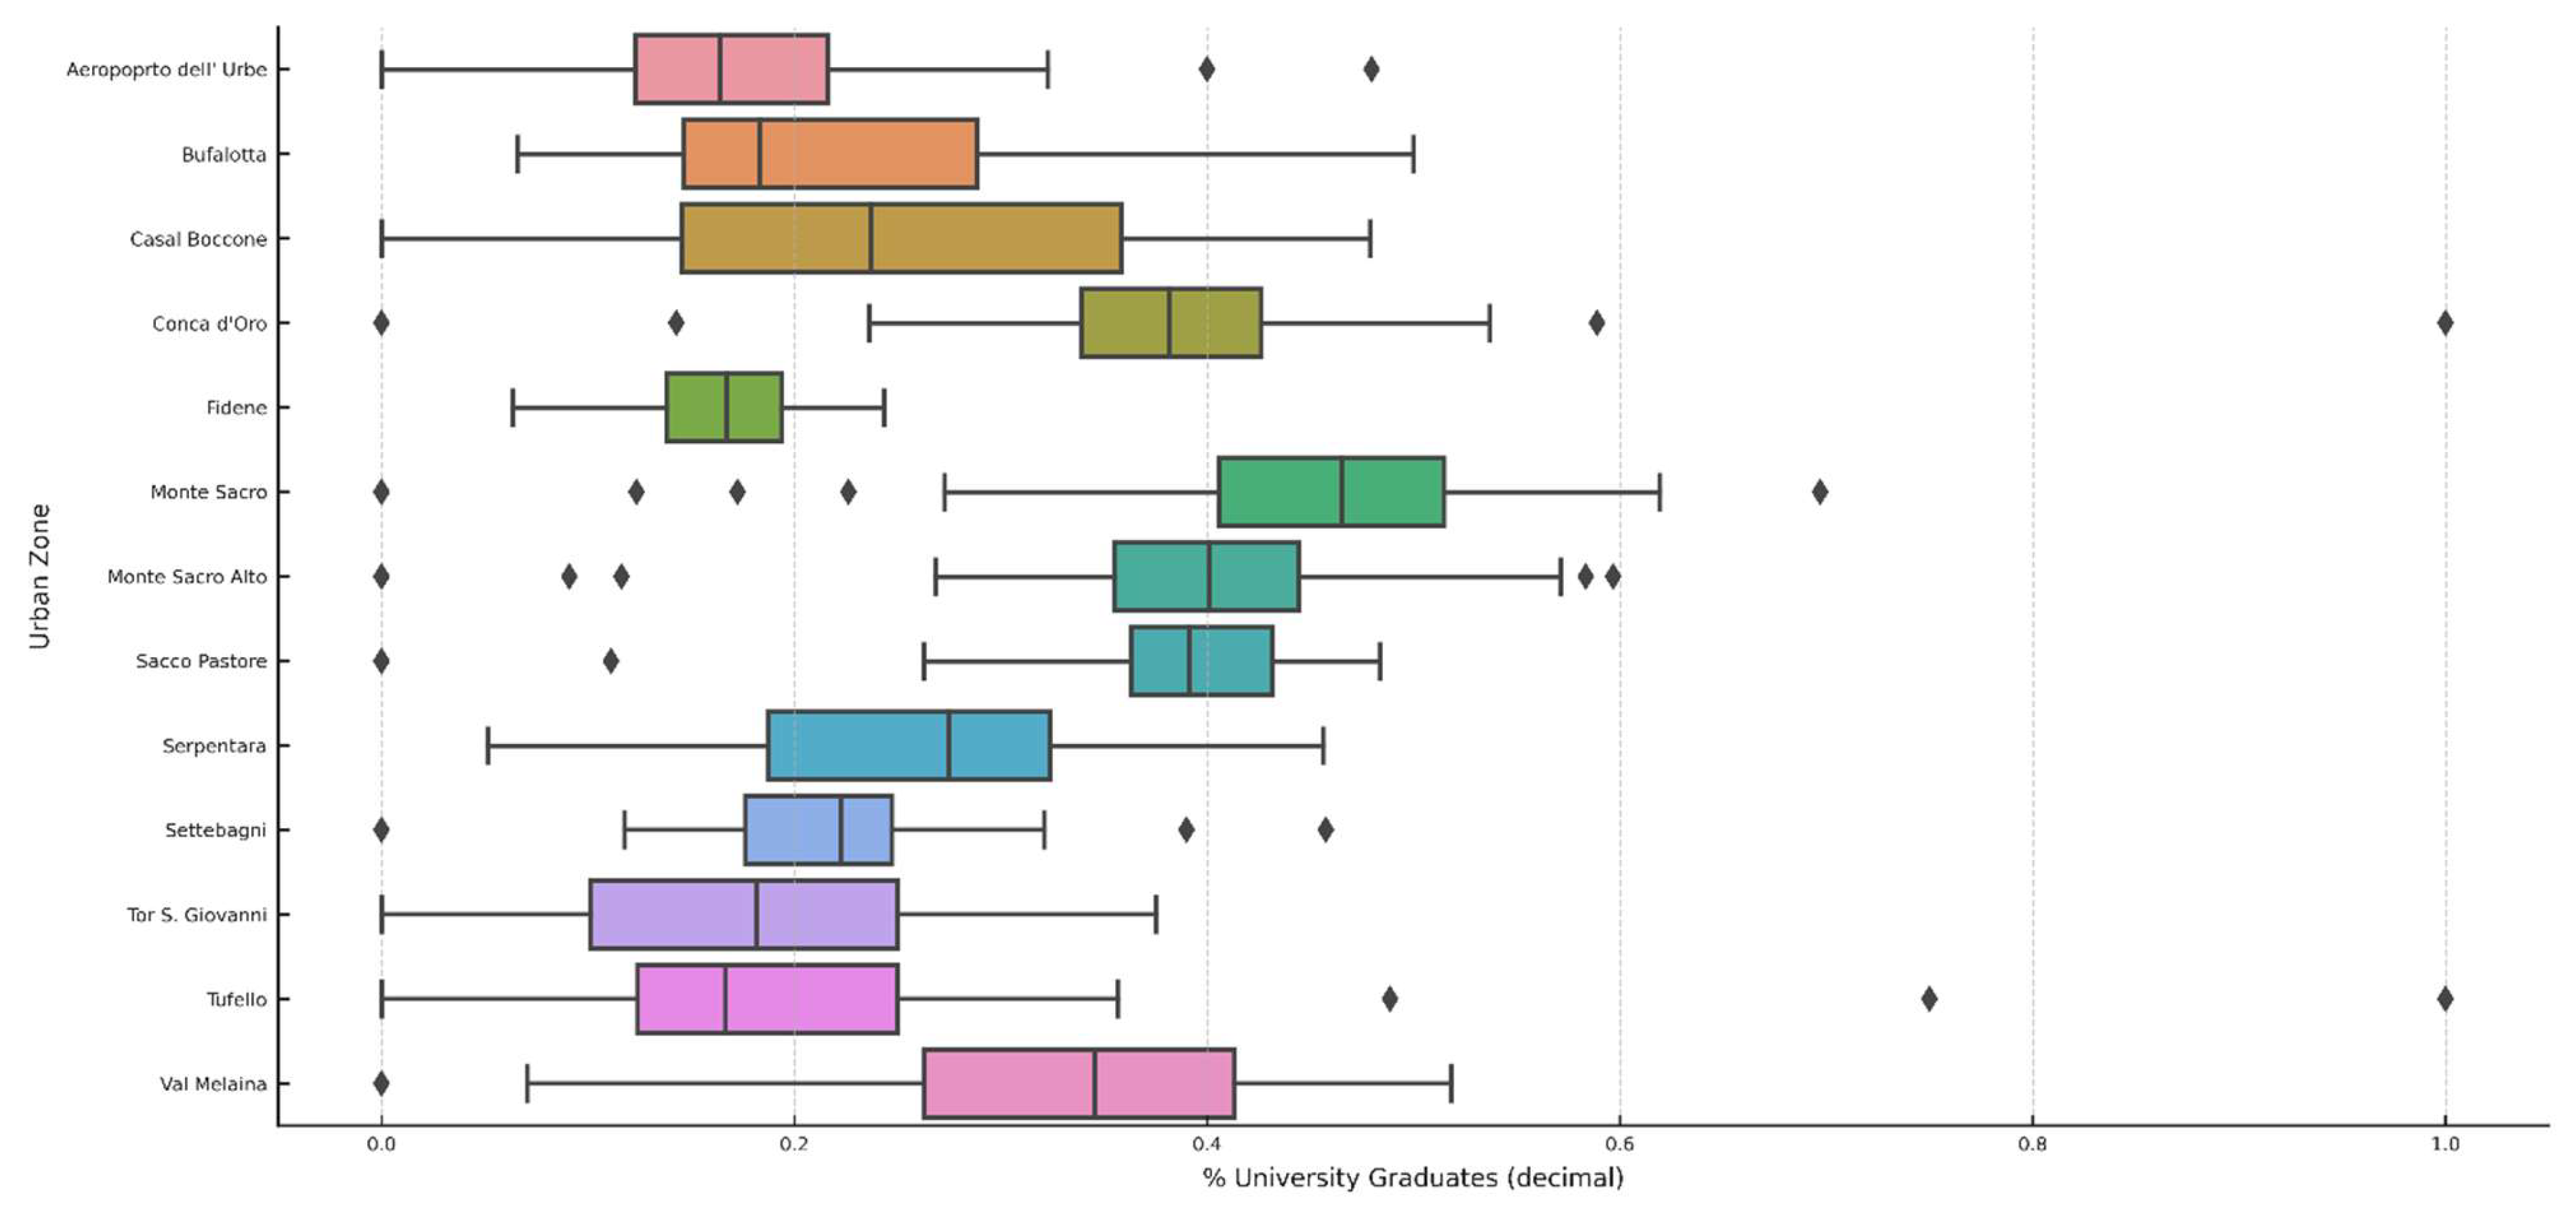
Table 11 summarizes the mean, median, interquartile range, and variance of the percentage of university graduates within the Urban Zones. Figure A5 and Figure A6 show the box-and-whisker plots of the distribution of the percentage of university graduates across Urban Zones and Mesoareas, respectively.
Table 12 presents the same set of statistics for the the Mesoareas defined in the previous sections.
Regarding Urban Zones, the mean percentage of graduates varies notably across UZs, ranging from 16.5% in Fidene to 45.4% in Monte Sacro. Similarly, the median values confirm this trend, with Monte Sacro (46.5%), Monte Sacro Alto (40.1%), and Sacco Pastore (39.1%) showing the highest concentrations of university-educated residents. In contrast, the lowest median percentages are found in Fidene (16.7%) and Tufello (16.7%). Variance remains relatively low across zones (0.002–0.015), indicating limited internal dispersion. However, IQR values—ranging from 0.059 in Fidene to 0.216 in Casal Boccone—suggest that in some zones, particularly Casal Boccone and Tor S. Giovanni (IQR = 0.173), there is considerable heterogeneity in educational attainment levels across Mesoareas. Overall, these results underscore the spatial variability in the distribution of university graduates within the studied urban zones.
The results confirm and expand the variability already observed at the Urban Zone level. The mean percentage of university graduates ranges from a minimum of 14.0% in Serpentara Giulio Pasquati to a maximum of 49.3% in Monte Sacro Alto Sannazzaro Park. The median values follow a similar pattern, with the lowest value found again in Serpentara Giulio Pasquati (12.3%) and the highest in Monte Sacro Alto Sannazzaro Park (48.2%).
The IQR, which captures the spread of the middle 50% of observations, highlights considerable internal heterogeneity in some Mesoareas, particularly in Casal Boccone West (0.248) and Casal Boccone East (0.232). By contrast, Mesoareas such as Monte Sacro Alto Sannazzaro Park (0.074) and Val Melaina FL1 (0.074) show more homogeneous distributions. The variance values remain generally low, yet slightly higher in areas such as Casal Boccone West (0.016) and Val Melaina Giovanni Conti (0.015), indicating greater dispersion in those territories.
Overall, the Mesoarea-level data underline pronounced socio-spatial disparities in educational attainment, with certain Mesoareas—especially those in the Monte Sacro Alto and Val Melaina clusters—exhibiting notably higher and more homogeneous percentages of university graduates, while others reflect both lower levels and greater internal variability.
The average variance of the percentage of university graduates is 0.009 across Urban Zones and 0.008 across Mesoareas. This slight difference may reflect the smaller spatial scale of Mesoareas, although the variation between the two levels remains limited.

3.13. Non-Parametric Analysis of Educational Differences Among Mesoareas Within Urban Zones

Differences in the percentage of university graduates among Mesoareas within each Urban Zone (UZ) were assessed using Kruskal–Wallis tests, due to the non-normal distribution of the variable (Shapiro–Wilk p < 0.05). The analysis was conducted on the five UZs that were subdivided into Mesoareas; among these, four showed statistically significant differences between Mesoareas (p < 0.05) (Table 13).
Specifically, in the UZ Monte Sacro Alto, differences among Mesoareas were statistically significant (χ2 = 117.493, df = 2, p = 0.0002). Post hoc Dunn tests with Bonferroni correction revealed significant differences between Monte Sacro Alto Sannazzaro Park and Monte Sacro Alto Central (p = 0.0012), and between Monte Sacro Alto Sannazzaro Park and Monte Sacro Alto East (p < 0.001); no significant difference emerged between Monte Sacro Alto Central and Monte Sacro Alto East.
Similarly, in Serpentara (χ2 = 15.674, df = 2, p = 0.0004), the Mesoarea Serpentara Vigne Nuove showed significant differences when compared to both Serpentara Colle Salario Betulle (p = 0.0018) and Serpentara Giulio Pasquati (p = 0.0023).
In Val Melaina, the Kruskal–Wallis test was also significant (χ2 = 13.848, df = 3, p = 0.0031). The Val Melaina Giovanni Conti Mesoarea differed significantly from both Val Melaina F.A. Gualterio (p = 0.02) and Val Melaina FL1 (p = 0.0032).
In Casal Boccone, no statistically significant difference was found between the two Mesoareas (χ2 = 2.364, df = 1, p = 0.1242).

3.14. Results of Chi-Square Analyses on Educational Attainment, Employment Status, and Single-Person Households

Table 14 reports the results of the chi-squared tests comparing employment status variables across Mesoareas belonging to the same Urban Zones.
In the majority of pairwise comparisons, Mesoareas with a higher percentage of graduates also exhibited a higher employment rate. An exception is observed in the comparison between Casal Boccone East and Casal Boccone West, where, despite a significantly higher proportion of graduates in Casal Boccone East, Casal Boccone West shows a significantly higher employment rate (39% vs. 32%). Similarly, within all comparisons among the Mesoareas of Monte Sacro Alto, the employment rate distribution is inverted, with none of the differences in employment rates reaching statistical significance. A comparable pattern is also evident within the Val Melaina Urban Zone, specifically the following:
  • The Northern Tufello Mesoarea shows a significantly higher employment rate compared to Val Melaina F.A. Gualterio (68% vs. 61%), despite Val Melaina F.A. Gualterio having a higher percentage of graduates (20% vs. 18% in Northern Tufello).
  • The Northern Tufello Mesoarea exhibits a higher employment rate compared to Val Melaina FL1 (68% vs. 67%), while Val Melaina FL1 shows a higher percentage of graduates (24% vs. 18% in Northern Tufello). However, the difference in employment status is not statistically significant.
  • The Val Melaina Giovanni Conti Mesoarea shows a higher employment rate compared to Val Melaina F.A. Gualterio (62% vs. 61%), while Val Melaina F.A. Gualterio has a higher percentage of graduates (20% vs. 15% in Giovanni Conti). However, the difference in employment status is not statistically significant.
Most of the tested differences in employment status are statistically significant, except for the previously mentioned comparisons within the Monte Sacro Alto Mesoarea, as well as those between Northern Tufello and Val Melaina FL1, and between Val Melaina Giovanni Conti and Val Melaina FL1.
Table 15 reports the results of the chi-square test on the variable “percentage of single-person households” across Mesoareas within the same Urban Zones.
For this variable, a distribution differing from that of educational attainment emerges in only two cases: the comparison between the Monte Sacro Alto Central and MSA Sannazzaro Park Mesoareas, where the former shows a higher percentage of single-person households (45% Monte Sacro Alto Central vs. 43% MSA Sannazzaro Park), although not statistically significant, unlike the pattern observed for educational attainment (40% Monte Sacro Alto Central vs. 48% MSA Sannazzaro Park). The second case involves the Northern Tufello and Val Melaina FL1 Mesoareas (single-person households: 49% Northern Tufello vs. 42% Val Melaina FL1; percentage of graduates: 18% Northern Tufello vs. 24% Val Melaina FL1), where the difference in the distribution of single-person households is statistically significant.
Most differences in the distribution of single-person households tested are significant, except for those within Monte Sacro Alto Mesoareas and those between Northern Tufello/Val Melaina F.A. Gualterio and Val Melaina Giovanni Conti/Val Melaina F.A. Gualterio Mesoareas.

4. Discussion

4.1. Subdivision of Urban Zones into Mesoareas Based on OMI Zones and Road Axes, and Chi-Square Tests on Educational Attainment

The methodology developed in this study enabled a redefinition of the boundaries within III Municipality, dividing the existing UZs into 21 Mesoareas, with population sizes ranging from 706 (Tor San Giovanni) to 22,228 (Val Melaina F.A. Gualterio). Two Mesoareas—Val Melaina F.A. Gualterio and Serpentara Colle Salario Betulle—exceed the target population threshold of 20,000 residents, which had been established based on the catchment areas for healthcare services outlined in the Introduction. The adopted method, which involved splitting densely populated areas based on major interzonal roadways or previously identified heterogeneity in real estate markets, was not sufficient to isolate sub-areas within these larger Mesoareas that showed statistically significant differences in the distribution of university-level educational attainment. Further work will therefore be necessary to develop a more refined methodology capable of identifying potential internal subdivisions characterized by socioeconomic differentiation.
As part of the methodological process, five UZs were initially subdivided into sub-areas based on heterogeneity in the real estate market. In four of these UZs, such subdivisions were retained due to the statistically significant differences observed in the distribution of educational attainment between the resulting Mesoareas:
-
In Val Melaina, the Mesoarea Northern Tufello was delineated from the rest of the territory. The percentage of university graduates in this Mesoarea is significantly higher than in the adjacent one, Val Melaina Giovanni Conti, yet lower than in the other two Mesoareas derived from the same UZ, Val Melaina F.A. Gualterio and Val Melaina FL1.
-
In Monte Sacro Alto, the Mesoarea Monte Sacro Alto Sannazzaro Park—bordering the UZ with the highest percentage of graduates, Monte Sacro—was separated based on a significantly higher proportion of university graduates compared to the rest of Monte Sacro Alto. Notably, this newly defined Mesoarea displays the highest share of graduates among all Mesoareas within III Municipality.
-
Casal Boccone UZ was split into two Mesoareas that show a statistically significant difference in the distribution of university-level education: Casal Boccone East (36%) and Casal Boccone West (20%). Within these Mesoareas, the population distribution is highly uneven, with residents in Casal Boccone West concentrated in the westernmost section, contiguous with the Serpentara Mesoareas, with which it seems to share similar socioeconomic characteristics. Conversely, the population of Casal Boccone East is concentrated in the southern portion of the Mesoarea, adjacent to Monte Sacro Alto East, and appears to reflect similar socioeconomic patterns.
By contrast, two proposed subdivisions of UZ based on differences in the real estate market were discarded, as the subsequent statistical tests did not reveal significant differences in the socioeconomic level between the resulting sub-areas.
In the case of Fidene, the absence of statistically significant differences between the two Mesoareas—defined based on the presence of two distinct OMI zones (Colle Salario E40 and Fidene E41)—may be attributable to the asymmetric distribution of property transaction prices within the higher-value zone, Colle Salario E40 (minimum: €2800/m2; maximum: €3900/m2) (Table A1). This asymmetry may have led to an upward distortion of the average price, potentially influenced by a limited number of high-end properties [47], without necessarily indicating a true socioeconomic distinction between the populations of the two areas. In this context, the use of average property values may overestimate SES differences due to the particular dynamics of the local real estate market. It is also important to note that the Italian Revenue Agency (Agenzia delle Entrate) does not publish median property values, making it impossible to assess the internal distribution of prices within each OMI zone. Furthermore, in this case, the spatial intersection between census section centroids and OMI zones did not allow for a clean delineation of sub-area boundaries that precisely matched OMI borders. It is worth noting, however, that the area bordering the two sub-areas (Northern and Southern Fidene) is characterized by relatively low residential density (Figure A1), primarily due to the presence of green spaces. The misalignment between census section boundaries and OMI zones resulted in Northern Fidene also encompassing parts of the Fidene OMI zone (E41). This, combined with the relatively small population size of Northern Fidene (2288 residents) compared to the remaining area of Fidene (9236 residents), may have limited the ability to detect significant SES differences between the two groups.
Similarly, no statistically significant differences in the average level of education were found among the three Mesoareas derived from the Serpentara UZ, which had been delineated based on average property prices. The Mesoarea Serpentara Colle Salario was defined according to the boundaries of the OMI zone Colle Salario E40—the same real estate zone that includes Northern Fidene. As such, the considerations discussed above regarding the specific real estate dynamics of this area may also be relevant here. The other two Mesoareas—Serpentara Vigne Nuove and Serpentara Betulle—were delineated according to the internal boundaries of the Serpentara UZ, corresponding to the OMI zones Vigne Nuove E47 and Serpentara E42, respectively. These OMI zones also exhibit a wide range in property transaction prices, with differences of €1000 for E47 and €850 for E42 (Table A1), suggesting potential price variability that may not be fully captured by average values alone. Moreover, it is important to note that the two indicators used in this analysis—property prices and educational attainment—may reflect distinct dimensions of socioeconomic status and may not always align spatially or conceptually.
The literature shows that education level is independently associated with mortality and is minimally affected by other socioeconomic position (SEP) indicators, while property prices are also associated with mortality independently of individual educational level [48,49]. Residential area and real estate market values can be considered as synthetic indicators of socioeconomic position, urban quality, and area-level deprivation [50,51], encompassing both material and immaterial factors (e.g., functions, safety, services), particularly in the absence of individual-level data [52]. This rationale may also explain the opposite scenario—i.e., significant differences in educational levels among Mesoareas that are homogeneous in terms of OMI indicators—as observed between Central Monte Sacro Alto and Eastern Monte Sacro Alto, or between some of the Mesoareas within Val Melaina and Serpentara.
In the territories of Monte Sacro Alto, Val Melaina, and Serpentara, the subdivision based on main road axes made it possible to reveal differences in the distribution of educational attainment that would not have been identified through real estate market data alone. Within the Monte Sacro Alto UZ, for instance, the Mesoareas of MSA Central and MSA East were delineated from a territorially homogeneous area in terms of average property values. Nonetheless, these Mesoareas exhibit a statistically significant, albeit slight, difference in the proportion of university degree holders (40% in MSA Central vs. 38% in MSA East), suggesting the presence of a possible center–periphery gradient in educational attainment.
In the Val Melaina UZ, the subdivision based on major road axes enabled the identification of three Mesoareas: Val Melaina Giovanni Conti, Val Melaina FL1, and Val Melaina F.A. Gualterio. The Mesoarea of Giovanni Conti shows a significantly lower percentage of university degree holders (26%) compared to the other two Mesoareas (40% in FL1 and 36% in F.A. Gualterio). The area of Val Melaina Giovanni Conti, which appears to concentrate a population with more disadvantaged SES indicators, could not have been distinguished based solely on real estate market data. This may be explained not only by the different SES dimensions captured by property values and education level, but also by the potential exclusion of specific housing types—such as public housing—from the real estate market. This observation points to the possible need for integrating additional sources of information, such as expert knowledge, qualitative assessments of the built environment, or data from urban development plans, to achieve a finer-grained territorial segmentation.
In the western part of Serpentara UZ, even the subdivision based on interzone road axes did not reveal significant differences in the distribution of educational attainment across areas. In contrast, in the eastern sector of Serpentara UZ, this same method enabled the identification of the Serpentara Giulio Pasquati Mesoarea, which shows a significantly lower percentage of university graduates compared to the rest of the Urban Zone—and indeed the lowest percentage among all Mesoareas considered. As observed in the case of Val Melaina Giovanni Conti, the real estate market alone would not have captured this area’s more disadvantaged profile in terms of educational attainment. A potential explanation for this may again lie in the exclusion of certain housing types—such as public housing—from the real estate market, which could obscure underlying socioeconomic differences when relying exclusively on market data.
Finally, it is worth noting that, where statistically significant differences were observed, Mesoareas derived from OMI zones with higher average property sale prices within the same UZ tended to exhibit a higher proportion of residents with a university degree—an association consistent with the existing literature on the relationship between real estate value and SES. This finding supports the idea that property sale prices can serve as a proxy for the SES of the resident population [53]. Property value has been used in the United States as a proxy for SES to investigate the distribution of chronic conditions such as obesity, where low-SES areas report higher obesity rates [54], even after adjusting for age, race/ethnicity, household size, employment status, and home ownership [55].

4.2. Intra-Mesoareas Variability in Educational Attainment: Descriptive Patterns and Statistical Testing

Descriptive statistics computed for each Mesoarea and UZ further illustrate the internal variability of educational attainment within and among areas. While the overall distribution of university degree attainment tends to increase from some peripheral areas (e.g., Serpentara Giulio Pasquati, Fidene) toward more central or affluent zones (e.g., MSA, Conca d’Oro), the spread of values within areas remains heterogeneous. The interquartile range (IQR) and variance, in particular, offer insight into internal disparities.
Notably, nearly all UZ that were subdivided into Mesoareas—such as Casal Boccone, Serpentara, Val Melaina, and Tufello—show some of the highest variances, suggesting that the decision to further disaggregate these areas was empirically well grounded. At the Mesoarea level, high-variance areas like Casal Boccone West and Val Melaina Giovanni Conti may benefit from more refined analytical methodologies capable of identifying finer-grained spatial heterogeneity. The Mesoarea-based breakdown also allowed for the identification of the areas with the lowest (Serpentara Giulio Pasquati) and highest (MSA Sannazzaro Park) proportions of university graduates across the entire municipality. Interestingly, the two areas with the lowest population density in the district—Aeroporto dell’Urbe and Tor San Giovanni—exhibit among the highest variance values, further suggesting that heterogeneity may persist even in sparsely populated zones and highlighting the importance of localized analysis.
At the UZ level, measures of dispersion such as variance appear slightly higher overall than in Mesoareas, consistent with the notion that Mesoareas may capture more internally homogeneous subunits. However, differences in variance values between levels remain modest, warranting cautious interpretation.
To further investigate the differences in the percentage of university graduates across Mesoareas, Kruskal–Wallis tests were conducted within selected UZ. These analyses, consistent with the chi-square test results, confirmed the presence of statistically significant variation in several cases. In Monte Sacro Alto (χ2 = 17.493, df = 2, p = 0.0002), pairwise post-hoc comparisons using Dunn’s test with Bonferroni correction identified significant differences between Sannazzaro Park and both the Central (p = 0.0012) and Eastern (p < 0.001) Mesoareas, indicating clear internal educational disparities within the zone. Similarly, in Serpentara (χ2 = 15.674, df = 2, p = 0.0004), Vigne Nuove differed significantly from both Colle Salario Betulle (p = 0.0018) and Giulio Pasquati (p = 0.0023), suggesting a gradient in educational attainment across the Mesoareas. In Val Melaina (χ2 = 13.848, df = 3, p = 0.0031), significant differences were found between Giovanni Conti and both F.A. Gualterio (p = 0.02) and FL1 (p = 0.0032).
In contrast, no statistically significant differences were observed in Casal Boccone (χ2 = 2.364, df = 1, p = 0.1242), despite the chi-square test having indicated significant differences in the distribution of education levels between its two Mesoareas. This discrepancy may reflect the different nature of the tests; while the chi-square test captures overall distributional differences, the Kruskal–Wallis test focuses on differences in central tendency and ranking. These results reinforce the presence of intra-zone heterogeneity in educational attainment and underscore the usefulness of combining multiple statistical approaches to capture different aspects of variability.

4.3. Educational, Occupational, and Household Structure Differences Across Mesoareas

The chi-square tests performed to assess differences between Mesoareas within the same UZ revealed several statistically significant differences in the distribution of university degree attainment, employment status, and single-person households. These dimensions were selected because they are included in the deprivation index developed by Rosano et al. [46], which was originally calculated using 2011 census data. However, the complete deprivation index was not applied in this analysis, as it has not been validated for use with the 2021 census data. Moreover, housing density—another component of the Rosano index—was excluded from the present analysis due to the unavailability of corresponding 2021 data from ISTAT. As such, the focus was limited to educational attainment, employment status, and household composition, which were deemed the most robust and interpretable indicators available for assessing socio-economic differences at the Mesoarea level.
All chi-square tests for differences in educational attainment between Mesoareas yielded statistically significant results, indicating consistent intra-UZ variation in the proportion of university graduates. This different distribution of educational attainment is often accompanied by significant differences in employment levels and, in some cases, household composition.
Particularly noticeable are the results in Serpentara, where all three dimensions—education, employment, and household structure—show highly significant and concordant differences among the three Mesoareas. For example, Serpentara Giulio Pasquati, which exhibits the lowest percentage of university graduates (14%), also shows the lowest employment rate (57%) and the highest proportion of single-person households (67%), in contrast with neighboring Mesoareas such as Vigne Nuove and Colle Salario Betulle. This alignment of disadvantage across multiple indicators suggests consistent socio-spatial disparities within the same UZ.
A similar pattern is observed in the Val Melaina group. Val Melaina Giovanni Conti, characterized by a relatively low percentage of graduates (15%) and moderate employment levels (62%), differs significantly from Val Melaina FL1, which records higher educational attainment (24%) and a more favorable employment profile (67%). In this case, both the chi-square tests on education and employment are statistically significant (p < 0.001), reinforcing the interpretation of unequal conditions across Mesoareas.
In contrast, some UZs, such as Monte Sacro Alto, show significant differences in educational attainment (e.g., between Sannazzaro Park and other Mesoareas) without corresponding differences in employment status or household composition. This may indicate that not all dimensions of socio-demographic differentiation necessarily co-occur, or that the variables considered may not fully capture socio-economic disparities between the Mesoareas in question.
In certain comparisons, particularly within the UZ of Val Melaina, the distribution of single-person households does not align with the patterns observed in educational attainment or, when significant, in employment status. For instance, Val Melaina Giovanni Conti, despite having the lowest percentage of university graduates (15%) and a relatively low employment rate (62%), shows a smaller proportion of single-person households (39%) compared to Val Melaina F.A. Gualterio (52%), which has higher levels of both education (20%) and employment (61%). Similarly, Val Melaina FL1, with the highest percentage of graduates in the group (24%) and a higher employment rate (67%), has a lower share of single-person households (42%) than Gualterio. These inconsistencies suggest that the presence of single-person households may not directly reflect socio-economic disadvantage in the same way as educational or occupational variables. Rather, household composition may be shaped by additional demographic or cultural factors not captured by the indicators used in this analysis. It is important to note that the 2021 census data do not include specific information on single-parent households. As a result, the analysis was limited to considering the percentage of single-person households, regardless of the presence of dependent children. This constraint may affect the interpretation of household composition indicators, as single-person households represent only one aspect of potentially vulnerable family structures.
Overall, these results highlight substantial heterogeneity within UZ, with some Mesoareas consistently exhibiting more disadvantaged profiles across multiple indicators. The convergence of significant differences in both education and employment in several cases reinforces the relevance of Mesoarea-level analysis for identifying localized patterns of socio-economic inequality.

4.4. Interpretation of Findings in Light of Policy Frameworks and the Scientific Literature

This study demonstrates the feasibility of reconstructing new forms of territorial analysis starting from socioeconomic statistical indicators, which can be classified as social determinants of health, for the purpose of health planning. This territorial subdivision was also informed by the planning requirements set forth in the reform of territorial healthcare introduced by Ministerial Decree 77/2022 [22], particularly regarding the definition of minimum catchment areas for structuring family counseling services and general medical practice. These two services represent the most elementary units within the organizational framework outlined by the decree, with catchment thresholds of approximately 20,000 and 1500 residents, respectively. Understanding the catchment areas of general practitioners can help identify which segments of the population remain isolated or underserved and enable more informed planning of practice openings or the reprogramming of healthcare services provision in particularly disadvantaged areas. On the other hand, identifying a more homogeneous territorial subdivision in terms of population size and socio-economic conditions provides a more informative picture of the territory. Indeed, since that the epidemiology of several illnesses is strictly influenced by SES [4], knowing in advance the characteristics of an area can help to better anticipate potential health demands, as well as prevent or respond more promptly to the needs of its inhabitants, knowing.
More specifically, the subdivision of the territory of III Municipality proposed in this study—providing a finer level of spatial granularity than the official Urban Zones—could support relevant institutions in more effectively identifying the catchment areas of health and social services that, according to the territorial reorganization outlined in Ministerial Decree 77/2022, operate on smaller population thresholds. These include services such as the community nurse (infermiere di comunità, 1 per 3000 inhabitants) or Family Counseling Centers (Consultori Familiari, 1 per 20,000 inhabitants). As a result, this Mesoarea-based territorialization may facilitate the identification of underserved areas according to current service planning and established standards. Furthermore, it may help to pinpoint areas that, while technically covered by existing service catchments, exhibit socioeconomically disadvantaged profiles that could translate into more complex and specific health needs—calling for better-prepared and more responsive services. For instance, the planned Community Health Center (Casa della Comunità) on Via Dina Galli, located in the southeastern portion of the Val Melaina Giovanni Conti mesoarea, could be envisioned as serving a cluster of surrounding mesoareas including Val Melaina Giovanni Conti, Northern Tufello, Tufello, and Serpentara Giulio Pasquati—areas where indicators of socioeconomic vulnerability are most concentrated. By contrast, the other two planned Community Health Centers are located in the more central and eastern areas of III Municipality, where the population displays generally more favorable characteristics: the center on Via Lampedusa is situated in Monte Sacro, adjacent to the Mesoareas of Conca d’Oro, Sacco Pastore, and MSA Sannazzaro Park, while the center on Via Paolo Monelli is located in Eastern Casal Boccone and may serve surrounding areas including Casal Boccone and Central and Eastern MSA. This distribution of facilities could pose challenges—such as an unequal distribution of catchment complexity and service burden—but it also presents opportunities. In particular, it enables institutions to strategically concentrate proactive public health interventions and community initiatives in the specific sections of the territory that demonstrate the greatest need. Using the methodology presented, a new territorial subdivision can be developed—one that more closely reflects the socioeconomic characteristics and population density, not only for the III Municipality, but for the whole area of Rome Capital. The innovative contribution of this study lies in the integration of multiple layers of analysis: tools traditionally associated with economic valuation—such as the OMI zoning—elements of territorial and administrative planning—such as the General Urban Traffic Plan (PGTU) and Urban Zones—and more structured instruments for interpreting social health inequalities, such as individual-level socioeconomic determinants.
Regarding real estate values, which have already been tested as a proxy in the Roman context [50], these can be interpreted not only as immobilized capital, but also, in a broader sense, as potential capital—particularly in a context like Rome, where a high rate of residential homeownership prevails [56]. In this sense, dwellings function as dormant patrimonial assets: they may not generate immediate income, yet they embody a mobilizable market value and can therefore be considered part of a household’s wealth and socioeconomic position [56]. Due to the high number of residential property owners—driven more by clientelist and family-oriented political strategies that promote a family-centered welfare model than by market forces or globalization—spatial segregation has been shown to be reduced [57], compared to the US, where Black and White residentially are clearly separated [58]. On the other hand, since public housing is poor and mainly for natives, immigrants often turn to the private rented sector, ending up in overcrowded apartments in middle and upper-middle class areas [57].
While the use of urban, architectural, and real estate characteristics to assess socioeconomic vulnerability is not new within the Italian literature [59], the present study represents the first attempt to systematically integrate these dimensions into a coherent framework for sociosanitary needs planning, with the aim of supporting health policy strategies grounded in equity.
The analysis shows that in areas with higher OMI index values, the resident population exhibits higher levels of educational attainment, suggesting a potential association between property prices and socioeconomic status. This finding highlights the internal heterogeneity within the current UZs and supports the conclusion that the existing subdivision—established in 1977 [43]—is outdated and no longer adequate for understanding local dynamics. It underscores the need for a more detailed territorial breakdown to better capture the reality of the district.
Nonetheless, the UZ classification remains the most used territorial framework in the Municipality of Rome for providing and describing population characteristics [60,61]. Therefore, a finer-grained subdivision that can still be linked to the existing UZ would allow for improved territorial analysis while maintaining comparability with previously available or officially published data. In this regard, both national and international experiences have employed small-area approaches for territorial analysis—comparable to the census sections used as foundational units in the present study. However, such approaches cannot be directly applied to the complexity of the Roman context, which requires scalable tools capable of capturing territorial dynamics at an intermediate level—between the small-area scale and the Municipio, which currently represents the core unit of territorial governance and sociosanitary planning in Rome. While these tools are widely used globally to assess service accessibility, they generally serve a retrospective function, addressing outcomes ex post [62], or are used as foundational units for the construction of deprivation indices or exposure models [63], in a manner that is conceptually analogous to the Italian context [46].
Identifying homogeneous areas is crucial for effective healthcare planning based on the actual needs of the population. The implementation of an efficient territorial analysis tool is especially timely given the ongoing reform of territorial healthcare in Italy, initiated with the drafting of the National Recovery and Resilience Plan (Piano Nazionale Ripresa e Resilienza, PNRR) and its operational articulation (Ministerial Decree 77/2022) [22], which re-establishes the centrality of territorial healthcare, primary health care, proactive medicine, and health promotion and prevention. Effective planning cannot disregard a precise understanding of the territory [64,65].
In particular, with the implementation of the Casa della Comunità (Community Health Center, CdC) model, the integrated analysis of patients’ health and social healthcare needs becomes central to the stratification of the population for service planning purposes [66]. This stratification must necessarily consider indicators of socioeconomic status. Furthermore, in defining the catchment areas of CdCs, disparities between different territories and contexts must be considered [67].
A revision of the territorial subdivisions of the Health District could integrate additional layers of complexity through variables that describe other dimensions of territorial deprivation—such as the availability of health and social-health services and facilities [68,69,70,71,72], elements evaluating the quality of the urban environment [73], environmental vulnerability [9] (e.g., the presence of urban green spaces in their various forms [74,75,76], average temperature levels [77], or even factors influencing health-related choices, such as the presence of so-called “food deserts” [78]. All of this contributes to a multidimensional assessment of socioeconomic vulnerability through the lens of intersectionality [79,80,81].
As of now, the idea of redrawing the Urban Zones of Rome Capital has not yet been considered by political decision-makers and those involved in the governance of territorial healthcare. Other Italian initiatives have adopted a proximity-based approach, such as the experience of the ‘Habitat Microareas’ project, implemented in the city of Trieste. This initiative aimed to strengthen experimental interventions promoting well-being and social cohesion in areas with a significant presence of public housing. Initially targeting the tenants of a few buildings in the city, the project was later extended to include families living in neighborhoods surrounding the public housing complexes, through collaboration with various local stakeholders [82]. The project yielded positive results in terms of population inclusion and enabled the testing of empowerment models for the individuals involved [83]. Other examples from the cities of Turin [84], Bologna [85], and Milan [86] showed how a more detailed and context-specific subdivision of the territory can reveal health inequalities that would otherwise remain hidden, thereby enabling the development of more effective health planning to address such conditions.
The analytical process proposed in this study is inherently scalable and could be extended to the entire territory of Rome, given the availability of the same data sources used herein. At the same time, the framework would benefit from the integration of more refined tools, such as the deprivation indices already developed for the Italian context, although these have not yet been validated using the data employed in the present study—particularly those from the 2021 census.
In this sense, our work aims to develop and introduce a new methodology to update UZ boundaries and constitutes an initial step toward the effective multidimensional integration of parameters, with the aim of developing a more reliable tool for the planning of healthcare needs. Through the proposed methodology, we seek to contribute to the ongoing scientific debate on how to integrate diverse types of information—each in some way related to the domain of health needs—into coherent planning frameworks. This aligns with recent efforts in the city of Rome to define forms of “double vulnerability”, encompassing both environmental and social dimensions [9], and more broadly with the advancement of an intersectional approach to health. Such an approach would enhance the capacity of healthcare systems to perform multidimensional assessments of sociosanitary vulnerability at the population level.

5. Limitations and Conclusions

This work represents one of the first attempts at the national level in Italy, and the first in the city of Rome, to define or revise the administrative territorial divisions from the perspective of healthcare planning. It proposes a method based on open-access data available to all Health Districts, making it potentially replicable in other contexts. Moreover, it allows to overcome the obstacle of population stratification without using individual-level data, which is problematic due to privacy concerns. However, to date, no pilot actions or projects have been proposed or discussed with policy makers, even though the current methodology to reshape UZs has been presented and integrated into the Local Healthcare Unit Roma 1 Corporate Organizational Act as a possible adoptable future strategy to rethink the territorial subdivisions. This work it to be intended as an exploratory methodological framework that could inform future planning processes.
Despite offering a pragmatic basis for the initial subdivision of Urban Zones, the use of real estate market heterogeneity—specifically OMI data—presents several limitations when aiming to delineate sub-areas that meaningfully reflect differences in SES. First, real estate markets are influenced by a range of factors beyond SES, such as urban development trends, planning regulations, and neighborhood amenities. While the study area does not include territories subject to significant housing market distortions, such as university campuses or tourist districts, other localized influences may still affect property values. Second, the structure of OMI data itself poses methodological challenges: values are provided only as minimum and maximum transaction prices within each zone, without details on the volume or distribution of sales at different price points. This means that averages can be skewed by outliers—e.g., exceptionally high- or low-priced transactions—making them a potentially unreliable proxy for the actual distribution of property values. Furthermore, the absence of median values limits the ability to assess internal price symmetry. Lastly, the spatial boundaries of OMI zones do not always align with census tract boundaries, the administrative units used in this study to reconstruct the Mesoarea subdivisions. This misalignment can lead to inconsistencies in how demographic and real estate data overlap, reducing the precision of any SES inferences drawn from real estate heterogeneity alone.
Finally, using the education level alone as a proxy for SES—although it is the most representative factor and most strongly associated with health outcomes [87,88]—may in some cases be limiting or insufficiently informative, and could underlie the lack of statistical significance. The decision to rely on educational level was primarily driven by the unavailability of publicly accessible data on other individual-level socio-economic variables, largely due to privacy concerns or adequate spatial resolution. For instance, it was not possible to collect the data required to compute the deprivation index proposed by Rosano et al. [46] for the Italian context, as such information was not available, and the development and validation of a new deprivation index was beyond the scope of this study. While we consider educational level to be an adequate proxy—based on the arguments previously outlined—for conducting a preliminary analysis aimed at redefining Urban Zones (UZs), we also recognize that a more comprehensive socio-economic status (SES) indicator could be highly valuable for the identification of Mesoareas.
The forthcoming update of the socioeconomic deprivation index [46], calibrated on the 2021 census data, will—once available—provide a further advancement in the development of a multidimensional and integrated model for health planning. This update, previously validated using 2011 data within the Italian context, is expected to enhance the accuracy and applicability of territorial vulnerability assessments, as anticipated. A subsequent phase of analysis will certainly address the evaluation of accessibility, once the specific socio-healthcare facilities to be included in the territorial planning framework have been identified. The high variance observed in some Mesoareas—including those that were delineated through the methodological subdivision of the Urban Zones proposed in this study—suggests the need to complement quantitative data with qualitative assessments. Where intra-area heterogeneity remains high despite efforts to achieve greater internal homogeneity, additional methodologies may be required to refine territorial segmentation. These could include expert-based approaches, such as structured elicitation of local knowledge from professionals working in urban planning, public health, or social services. Moreover, visual surveys of the built environment and housing stock, or the analysis of planning documents such as the General Regulatory Plan (Piano Regolatore Generale) of the Municipality of Rome, may provide further insights into socio-spatial dynamics that are not fully captured by census or real estate data. Integrating these sources can support a more nuanced and context-sensitive identification of sub-areas, particularly where standard indicators fall short in representing the lived reality of urban populations.
The aim of the study was to present a potential model for redefining administrative boundaries within the territory of Rome, while simultaneously improving understanding of the area, its urban and social dynamics, and consequently the health needs of the population from an equity perspective. In this sense, these Mesoareas represent a possible methodological advancement, especially in light of the current discussions taking place within the Municipality of Rome.

Author Contributions

Conceptualization, methodology, validation, E.M., S.C., L.P. and L.M.S.; formal analysis, E.M., S.C. and L.M.S.; investigation, E.M., S.C., L.P. and L.M.S.; resources, E.M. and L.M.S.; data curation, E.M., S.C., L.P. and L.M.S.; writing—original draft preparation, E.M., S.C., L.P. and L.M.S.; writing—review and editing, E.M., S.C., L.P. and L.M.S.; visualization, E.M., S.C., L.P. and L.M.S.; supervision, L.M.S.; project administration, L.M.S. All authors have read and agreed to the published version of the manuscript.

Funding

This research received no external funding.

Data Availability Statement

All data presented in this study are available on request from the corresponding author.

Conflicts of Interest

The authors declare no conflicts of interest.

Appendix A

Table A1. OMI Zones in III Municipality and surroundings. Sale price of residential properties intended for civilian, year 2021. Agenzia delle Entrate.
OMI ZoneZone CodeMin Sale Price (€)Max Sale Price (€)Average Sale Price (€)
‘Riserva Della Marcigliana (Via Di Santa Colomba)’R7140021001750
‘Castel Giubileo-Bel Poggio (Via Castorano)’E16150020501775
‘Fidene-Villa Spada (Via Radicofani)’E41175025502150
‘Casal Monastero (Via Belmonte In Sabina)’E101180025002150
‘Fidene-Villa Spada (Via Radicofani)’E41175025502150
‘Serpentara (Viale Lina Cavalieri)’E42200028502425
‘Conca D’Oro (Via Val Di Lanzo)’D46220032002700
‘La Cinquina-Bufalotta (Via Feo Belcari)’E123220032002700
‘Valmelaina-Tufello (Via Delle Isole Curzolane)’D12235033002825
‘Vigne Nuove-Porta Di Roma (Via Delle Vigne Nuove)’E47240034002900
‘Sacco Pastore (Via Val Trompia)’D47245035002975
‘Talenti (Via Ugo Ojetti)’D27250035003000
‘Nuovo Salario-Prati Fiscali (Via Monte Cervialto)’D71245036003025
‘Montesacro (Viale Adriatico)’D11260036003100
‘Casal Boccone Bufalotta (Via Paolo Monelli)’E51270037003200
‘Colle Salario (Via Monte Giberto)’E40280039003350
Figure A1. The map shows the subdivision of Rome’s III Municipality into census sections, shaded according to population density. The bold black boundaries represent the Urban Zones (UZs). Census sections in the western portion of the area within the GRA (Grande Raccordo Anulare) show higher population density. In contrast, sparsely populated areas are located in the northern periphery—mainly within the Riserva Naturale della Marcigliana—and in the southwestern sector beyond Via Salaria, along the left bank of the Tiber River.
Land 14 01574 g0a1
Figure A2. The image shows the road axis formed by Via dei Prati Fiscali (to the west) and Viale Jonio (to the east). This road axis already serves as the boundary between several Urban Zones (UZs) within Municipality III, and in its easternmost segment, it separates the UZs of Tufello (9) and Monte Sacro Alto (5) from the sub-area Monte Sacro Alto—Parco Sannazzaro, as defined in Step 2. The red box in the overview map corresponds to the geographical extent displayed in the main map.
Land 14 01574 g0a2
Figure A3. The image shows the road axis known as the Viadotto dei Presidenti. This road crosses the boundary census sections between the sub-areas created in Step 2 from the following Urban Zones: Fidene (E), Serpentara (J, K, L), Val Melaina (4, R), and Casal Boccone (B). The red box in the overview map corresponds to the geographical extent displayed in the main map.
Land 14 01574 g0a3
Figure A4. The image shows the section of Via Nomentana between Via Nomentana Nuova and Piazza Sempione (Ponte Tazio), the only segment designated as an ‘interquartiere’ road by the General Urban Traffic Plan of Roma Capitale. This road crosses the Urban Zone of Sacco Pastore, dividing it into a larger northwestern area and a smaller southeastern portion along the banks of the Aniene River. Due to its low population (859 residents), the latter area was not defined as a separate sub-area. The red box in the overview map corresponds to the geographical extent displayed in the main map.
Land 14 01574 g0a4
Figure A5. Box plots showing the distribution of selected variables across the Urban Zones within Municipality III. The plots illustrate the median, interquartile range (IQR), and potential outliers.
Land 14 01574 g0a5
Figure A6. Box plots showing the distribution of selected variables across the Mesoareas identified within Municipality III. The plots illustrate the median, interquartile range (IQR), and potential outliers, highlighting the variability and skewness of socio-demographic and territorial indicators within and between Mesoareas.
Land 14 01574 g0a6

References

  1. Diderichsen, F.; Hallqvist, J.; Whitehead, M. Differential vulnerability and susceptibility. In Challenging Inequities in Health: From Ethics to Action; Evans, T., Whitehead, M., Diderichsen, F., Bhuiya, A., Eds.; Oxford University Press: New York, NY, USA, 2001; pp. 58–71. [Google Scholar] [CrossRef]
  2. Calandrini, E.; Paglione, L.; Bargagli, A.M.; Agabiti, N.; Battisti, A.; Salvatori, L.M.; Marceca, M.; Brandimarte, M.A.; Di Rosa, E.; Iorio, S.; et al. Does Urbanization Correlate with Health Service Assistance? An Observational Study in Rome, Italy. In Equity in Health; Green Energy and Technology; Springer: New York, NY, USA, 2023; pp. 95–111. ISBN 978-3-031-16181-0. [Google Scholar] [CrossRef]
  3. Ventura, M.; Fusco, D.; Bontempi, K.; Colais, P.; Davoli, M. Regional Outcome Evaluation Program (P.Re.Val.E.): Reduction of inequality in access to effective health care in the Lazio region of Italy (2012–2015). PLoS ONE 2018, 13, e0194972. [Google Scholar] [CrossRef] [PubMed]
  4. Marmot, M. Social determinants of health inequalities. Lancet 2005, 365, 1099–1104. [Google Scholar] [CrossRef] [PubMed]
  5. Dahlgren, G.; Whitehead, M. Policies and Strategies to Promote Social Equity in Health; Institute for Futures Studies: Stockholm, Sweden, 1991. [Google Scholar]
  6. Cacciani, L.; Bargagli, A.M.; Cesaroni, G.; Forastiere, F.; Agabiti, N.; Davoli, M. Education and Mortality in the Rome Longitudinal Study. PLoS ONE 2015, 10, e0137576. [Google Scholar] [CrossRef] [PubMed]
  7. Nardi, A.; Dei Bardi, L.; Davoli, M.; Agabiti, N.; Cesaroni, G. Differences in mortality between temporary and permanent workers: Results from the Rome Longitudinal Study. BMJ Open 2022, 12, e058594. [Google Scholar] [CrossRef]
  8. Bauleo, L.; Giannini, S.; Ranzi, A.; Nobile, F.; Stafoggia, M.; Ancona, C.; Iavarone, I.; the EpiCovAir Study Group. A Methodological Approach to Use Contextual Factors for Epidemiological Studies on Chronic Exposure to Air Pollution and COVID-19 in Italy. Int. J. Environ. Res. Public Health 2022, 19, 2859. [Google Scholar] [CrossRef]
  9. Badaloni, C.; De Sario, M.; Caranci, N.; De’ Donato, F.; Bolignano, A.; Davoli, M.; Leccese, L.; Michelozzi, P.; Leone, M. A spatial indicator of environmental and climatic vulnerability in Rome. Environ. Int. 2023, 176, 107970. [Google Scholar] [CrossRef]
  10. Costa, G.; Caiazzo, A.; Marinacci, C.; Spadea, T. Individual and Contextual Determinants of Inequalities in Health: The Italian Case. In The Political and Social Contexts of Health; Routledge: Abingdon, UK, 2020; pp. 115–146. [Google Scholar] [CrossRef]
  11. D’Alessandro, D. Urban public health: A multidisciplinary approach. In Urban Public Health: A Multidisciplinary Approach; Springer Nature: Cham, Switzerland, 2020; pp. 1–8. [Google Scholar] [CrossRef]
  12. Brown, H.L.; Pursley, I.G.; Horton, D.L.; La Ragione, R.M. One health: A structured review and commentary on trends and themes. One Health Outlook 2024, 6, 17. [Google Scholar] [CrossRef]
  13. Settimo, G.; Gola, M.; Capolongo, S. The Relevance of Indoor Air Quality in Hospital Settings: From an Exclusively Biological Issue to a Global Approach in the Italian Context. Atmosphere 2020, 11, 361. [Google Scholar] [CrossRef]
  14. D’Alessandro, D.; Appolloni, L. Housing and Health: Here We Go Again. Int. J. Environ. Res. Public Health 2021, 18, 12060. [Google Scholar] [CrossRef]
  15. Cofone, L.; Sabato, M.; Di Paolo, C.; Di Giovanni, S.; Donato, M.A.; Paglione, L. Urban, Architectural, and Socioeconomic Factors Contributing to the Concentration of Potential Arbovirus Vectors and Arbovirosis in Urban Environments from a One Health Perspective: A Systematic Review. Sustainability 2025, 17, 4077. [Google Scholar] [CrossRef]
  16. Paglione, L.; Donato, M.A.; Cofone, L.; Sabato, M.; Appolloni, L.; D’Alessandro, D. The Healthy City Reimagined: Walkability, Active Mobility, and the Challenges of Measurement and Evaluation. Urban Sci. 2024, 8, 157. [Google Scholar] [CrossRef]
  17. Cornu, T.; Marchal, B.; Renmans, D. How do urban green spaces influence heat-related mortality in elderly? A realist synthesis. BMC Public Health 2024, 24, 457. [Google Scholar] [CrossRef] [PubMed]
  18. Smith, N. Gentrification and the rent-gap. Ann. Assoc. Am. Geogr. 1987, 77, 462–465. [Google Scholar] [CrossRef]
  19. Bier, T.; Moving Up, Filtering Down: Metropolitan Housing Dynamics and Public Policy. Discussion Paper Prepared for the Brookings Institution Center on Urban and Metropolitan Policy. 2001. Available online: https://www.brookings.edu/wp-content/uploads/2016/06/bier.pdf (accessed on 15 June 2025).
  20. Italian Republic. Law 23 December 1978, n. 833, Istituzione Del Servizio Sanitario Nazionale; Gazzetta Ufficiale Della Repubblica Italiana, Serie Generale, n. 360, 28 December 1978; Suppl. Ordinario. Available online: https://www.gazzettaufficiale.it/eli/id/1978/12/28/078U0833/sg (accessed on 10 June 2025).
  21. Italian Republic. Law 8 November 1992, n. 502, Riordino Della Disciplina in Materia Sanitaria E Istituzione Del Servizio Sanitario Nazionale; Gazzetta Ufficiale della Repubblica Italiana, Serie Generale, n. 303, 30 December 1992; Suppl. Ordinario. Available online: https://www.gazzettaufficiale.it/eli/id/1992/12/30/092G0502/sg (accessed on 10 June 2025).
  22. Italian Republic. Ministero della Salute. Decreto 23 Maggio 2022, n. 77. Regolamento Recante La Definizione Di Modelli E Standard per Lo Sviluppo Dell’assistenza Territoriale Nel Servizio Sanitario Nazionale. Gazzetta Ufficiale Della Repubblica Italiana, Serie Generale, n. 144, 22 June 2022; Entrata in Vigore 07 July 2022. Available online: https://www.gazzettaufficiale.it/eli/id/2022/06/22/22G00085/SG (accessed on 10 June 2025).
  23. He, Z.; Pfaff, E.; Guo, S.J.; Guo, Y.; Wu, Y.; Tao, C.; Stiglic, G.; Bian, J. Enriching Real-world Data with Social Determinants of Health for Health Outcomes and Health Equity: Successes, Challenges, and Opportunities. Yearb. Med. Inform. 2023, 32, 253–263. [Google Scholar] [CrossRef] [PubMed]
  24. Italian National Institute of Statistics (ISTAT). Le Sezioni Di Censimento: Definizione, Metodologia E Utilizzo; Atti-CIS; Fascicolo 5; ISTAT: Rome, Italy, 2016; Available online: https://www.istat.it/it/files/2016/02/Atti-CIS_Fascicolo_5.pdf (accessed on 11 June 2025).
  25. Lelo, K.; Monni, S.; Tomassi, F. Socio-spatial inequalities and urban transformation. The case of Rome districts. Socio-Econ. Plan. Sci. 2019, 68, 66–78. [Google Scholar] [CrossRef]
  26. Salvatori, L.M.; Marceca, M.; Paglione, L.; Angelozzi, A.; Caminada, S.; Errigo, M.; Greco, A.D.; Iorio, S. Methodological Comparison of Different Projects. In Green Energy and Technology; Springer: Cham, Switzerland, 2020; pp. 225–260. [Google Scholar] [CrossRef]
  27. Comune di Roma Capitale. Annuario Statistico Di Roma Capitale 2023—Capitolo 2: Popolazione E Territorio; Roma Capitale: Rome, Italy, 2023; pp. 12–15. Available online: https://www.comune.roma.it/web-resources/cms/documents/02_Popolazione_Annuario_2023_def.pdf (accessed on 11 June 2025).
  28. Comune di Roma Capitale. Ufficio Statistico. Zone Urbanistiche Di Roma Capitale: Istituzione, Aggiornamenti E Criteri Di Delimitazione; Roma Capitale: Ufficio Statistico, 1977. Available online: https://www.comune.roma.it/web-resources/cms/documents/ElencoZ_Urbanistiche_rg_A.pdf (accessed on 15 June 2025).
  29. Lelo, K.; Monni, S.; Reynaud, C.; Tomassi, F. Demographic Trends in the Rome Censuses 1981–2021: The 155 Urban Zones. Econ. Politica 2024, (Oct–Nov), 1–18. Available online: https://www.economiaepolitica.it/lavoro-e-diritti/i-cambiamenti-demografici-nei-censimenti-dal-1981-al-2021-le-155-zone-urbanistiche-di-roma/ (accessed on 11 June 2025).
  30. Comune di Roma Capitale. Ufficio Toponomastica. I Rioni Di Roma: Suddivisioni Storiche E Amministrative; Roma Capitale: Ufficio Toponomastica, 2021. Available online: https://www.comune.roma.it/web-resources/cms/documents/01_Territorio_Annuario_2021_agg30062022.pdf (accessed on 11 June 2025).
  31. Comune di Roma Capitale. Ufficio Statistico. I Quartieri Di Roma: Definizione, Origine E Sviluppo; Roma Capitale: Ufficio Statistico, 2022. Available online: https://www.comune.roma.it/web-resources/cms/documents/Annuario_2022_completo.pdf (accessed on 11 June 2025).
  32. Insolera, I. Modern Rome: From Napoleon to the Twenty-First Century; Cambridge Scholars Publishing: Newcastle-upon-Tyne, UK, 2018; xxvii+479p, ISBN 978-1-5275-1664-9. [Google Scholar]
  33. Lelo, K.; Chiaradia, F.; Monni, S.; Tomassi, F. The 15-Minute City: An Attempt to Measure Proximity to Urban Services in Rome. Sustainability 2024, 16, 9432. [Google Scholar] [CrossRef]
  34. Paoletti, F.; Greco, A.D. Participatory Local Welfare in Trieste: A Laboratory for Local Welfare Activities. In Urban Health; Battisti, A., Marceca, M., Iorio, S., Eds.; AIMETA 2019. Green Energy and Technology; Springer: Cham, Switzerland, 2020. [Google Scholar] [CrossRef]
  35. Tocci, W. Avanti C’è Posto. Storie E Progetti Del Trasporto Pubblico a Roma; Donzelli Editore: Roma, Italy, 2008; pp. 1–288. ISBN 978-88-6036-276-6. [Google Scholar]
  36. Celesti Grapow, L.; Fanelli, G. The Vanishing Landscape of the Campagna Romana. Landsc. Urban Plan. 1993, 24, 69–76. [Google Scholar] [CrossRef]
  37. Bradley, G. Mobility and Secession in the Early Roman Republic. Antichthon 2017, 51, 149–171. [Google Scholar] [CrossRef]
  38. Cattarulla, C. “Luoghi di Memoria Ispanoamericani a Roma (Simón Bolívar e il Giuramento sul Monte Sacro).” 1. MARINELLA ROCCA LONGO, MADDALENA PENNACCHIA (a cura di), Turismo Creativo e Identità Culturale, 2015: 107. Available online: https://romatrepress.uniroma3.it/wp-content/uploads/2024/12/6.-Camilla-Cattarulla.pdf (accessed on 15 June 2025).
  39. Angelidou, M.; Kanellopoulos, I. Peripheral development and deregulated urban growth in Rome: Regional competitiveness and urban planning challenges. Land Use Policy 2015, 48, 167–175. [Google Scholar] [CrossRef]
  40. Mannucci, S.; Kwakkel, J.H.; Morganti, M.; Ferrero, M. Exploring potential futures: Evaluating the influence of deep uncertainties in urban planning through scenario planning—A case study in Rome, Italy. Futures 2023, 154, 103265. [Google Scholar] [CrossRef]
  41. Glorioso, V.; Subramanian, S.V. Equity in access to health care services in Italy. Health Serv. Res. 2014, 49, 950–970. [Google Scholar] [CrossRef] [PubMed] [PubMed Central]
  42. Comune di Roma Capitale. Portale Open Data—Roma Capitale. Available online: http://www.datiopen.it/it/catalogo-opendata/daticomuneromait (accessed on 11 June 2025).
  43. Comune di Roma Capitale. Delibera Consiliare n. 2983 Del 29–30 Luglio 1977: Istituzione Delle Zone Urbanistiche; Roma Capitale: Rome, Italy. Available online: https://it.wikipedia.org/wiki/Zone_urbanistiche_di_Roma (accessed on 11 June 2025).
  44. Agenzia delle Entrate. OMI—Osservatorio Del Mercato Immobiliare. Consultazione Zone E Valori Immobiliari; Agenzia Delle Entrate: Rome, Italy. Available online: https://www1.agenziaentrate.gov.it/servizi/geopoi_omi/index.php (accessed on 11 June 2025).
  45. Italian Ministry of Infrastructure and Transport. OpenData: ANAS Road Network Graph. Available online: https://dati.mit.gov.it/catalog/dataset/grafo-stradale-anas (accessed on 19 July 2025).
  46. Rosano, A.; Pacelli, B.; Zengarini, N.; Costa, G.; Cislaghi, C.; Caranci, N. Aggiornamento e revisione dell’indice di deprivazione italiano 2011 a livello di sezione di censimento [Update and review of the 2011 Italian deprivation index calculated at the census section level]. Epidemiol Prev. 2020, 44, 162–170. [Google Scholar] [CrossRef] [PubMed]
  47. Open House Roma. Complesso Residenziale Monti Della Breccia. Available online: https://www.openhouseroma.org/sito/complesso-residenziale-monti-della-breccia (accessed on 11 June 2025).
  48. Cesaroni, G.; Venturini, G.; Paglione, L.; Angelici, L.; Sorge, C.; Marino, C.; Davoli, M.; Agabiti, N. Differenziali di mortalità a Roma: Il ruolo dell’istruzione e dei prezzi immobiliari del quartiere di residenza [Mortality inequalities in Rome: The role of individual education and neighbourhood real estate market]. Epidemiol Prev. 2020, 44 (Suppl. 1), 31–37. [Google Scholar] [CrossRef] [PubMed]
  49. Coffee, N.T.; Lockwood, T.; Hugo, G.; Paquet, C.; Howard, N.J.; Daniel, M. Relative residential property value as a socio-economic status indicator for health research. Int. J. Health Geogr. 2013, 12, 22. [Google Scholar] [CrossRef] [PubMed]
  50. Moudon, A.V.; Cook, A.J.; Ulmer, J.; Hurvitz, P.M.; Drewnowski, A. A neighborhood wealth metric for use in health studies. Am. J. Prev. Med. 2011, 41, 88–97. [Google Scholar] [CrossRef]
  51. Lockwood, T.; Coffee, N.T.; Rossini, P.; Niyonsenga, T.; McGreal, S. Does where you live influence your socio-economic status? Land Use Policy 2018, 72, 152–160. [Google Scholar] [CrossRef]
  52. Juhn, Y.J.; Beebe, T.J.; Finnie, D.M.; Sloan, J.; Wheeler, P.H.; Yawn, B.; Williams, A.R. Development and Initial Testing of a New Socioeconomic Status Measure Based on Housing Data. J. Urban Health 2011, 88, 933–944. [Google Scholar] [CrossRef]
  53. Galobardes, B.; Shaw, M.; Lawlor, D.A.; Lynch, J.W.; Smith, G.D. Indicators of socioeconomic position (part 1). J. Epidemiol. Community Health 2006, 60, 7–12. [Google Scholar] [CrossRef]
  54. Drewnowski, A.; Aggarwal, A.; Tang, W.; Moudon, A.V. Residential property values predict prevalent obesity but do not predict 1-year weight change. Obesity 2015, 23, 671–676. [Google Scholar] [CrossRef]
  55. Rehm, C.D.; Moudon, A.V.; Hurvitz, P.M.; Drewnowski, A. Residential property values are associated with obesity among women in King County, WA, USA. Soc. Sci. Med. 2012, 75, 491–495. [Google Scholar] [CrossRef]
  56. Tulumello, S.; Dagkouli-Kyriakoglou, M. Financialization of Housing in Southern Europe: Policy Analysis and Recommendations; European Parliament: 2021. Available online: https://www.researchgate.net/profile/Simone-Tulumello-2/publication/349436154_Financialization_of_housing_in_Southern_Europe_Policy_analysis_and_recommendations_Final_report_-_submitted_28012021/links/602fb529a6fdcc37a8381322/Financialization-of-housing-in-Southern-Europe-Policy-analysis-and-recommendations-Final-report-submitted-28-01-2021.pdf (accessed on 11 June 2025).
  57. Fujita, K. Introduction: Residential segregation in context. In Residential Segregation in Comparative Perspective; Maloutas, T., Ed.; Routledge: Farnham, UK, 2012; pp. 1–36. [Google Scholar]
  58. Logan, J.R.; Martinez, M. The Spatial Scale and Spatial Configuration of Residential Settlement: Measuring Segregation in the Postbellum South. Am. J. Sociol. 2018, 123, 1161–1203. [Google Scholar] [CrossRef] [PubMed] [PubMed Central]
  59. Barreca, A.; Curto, R.; Rolando, D. Housing vulnerability and property prices: Spatial analyses in the Turin real estate market. Sustainability 2018, 10, 3068. [Google Scholar] [CrossRef]
  60. Comune di Roma Capitale. Bollettino Statistico. Popolazione Residente Nei Municipi E Nelle Zone Urbanistiche Di Roma Capitale—Giugno 2023; Roma Capitale: Rome, Italy, 2023; Available online: https://www.comune.roma.it/web-resources/cms/documents/Bollettino_statistico_giugno_2023_def.pdf (accessed on 11 June 2025).
  61. Monni, S.; Lelo, K.; Tomassi, F. Roma, tra centro e periferie: Come incidono le dinamiche urbanistiche sulle disuguaglianze socio-economiche. Roma Mod. E Contemp. 2017, 25, 131–146. [Google Scholar] [CrossRef]
  62. Temam, S.; Varraso, R.; Pornet, C.; Sanchez, M.; Affret, A.; Jacquemin, B.; Clavel-Chapelon, F.; Rey, G.; Rican, S.; Le Moual, N. Ability of ecological deprivation indices to measure social inequalities in a French cohort. BMC Public Health 2017, 17, 956. [Google Scholar] [CrossRef] [PubMed]
  63. Mohammed, S.; Bailey, G.A.; Farr, I.W.; Jones, C.; Rawlings, A.; Rees, S.; Scully, S.; Wang, T.; Evans, H.T. Using the Welsh Index of Multiple Deprivation in research: Estimating the effect of excluding domains on a routine health data study. BMC Public Health 2025, 25, 1178. [Google Scholar] [CrossRef] [PubMed]
  64. Lelo, K.; Monni, S.; Tomassi, F. Le Sette Rome, 1st ed.; Donzelli Editore: Roma, Italy, 2021; p. 37. [Google Scholar]
  65. Khashoggi, B.F.; Murad, A. Issues of Healthcare Planning and GIS: A Review. ISPRS Int. J. Geo-Inf. 2020, 9, 352. [Google Scholar] [CrossRef]
  66. Biu, P.W.; Nwasike, C.N.; Nwaobia, N.K.; Ezeigweneme, C.A.; Gidiagba, J.O. GIS in Healthcare Facility Planning and Management: A Review. World J. Adv. Res. Rev. 2024, 21, 12–19. [Google Scholar] [CrossRef]
  67. Ministero della Salute. Piano Nazionale Della Cronicità; Ministero della Salute: Rome, Italy, 2016; Available online: https://osservatoriocronicita.it/images/PDF/Piano_Nazionale_cronicit.pdf (accessed on 11 June 2025).
  68. Regione Lazio. La Salute È Equità: Piano Regionale Della Prevenzione 2020–2025. Documento Tecnico; Regione Lazio: Rome, Italy, 2021; ISBN 978-88-490-0751-0. Available online: https://www.deplazio.net/images/stories/files/Salute-equita.pdf (accessed on 11 June 2025).
  69. Whitehead, J.; Pearson, A.L.; Lawrenson, R.; Atatoa-Carr, P. Spatial equity and realised access to healthcare—A geospatial analysis of general practitioner enrolments in Waikato, New Zealand. Rural. Remote Health 2019, 19, 5349. [Google Scholar] [CrossRef]
  70. Higgs, G. The role of GIS for health utilization studies: Literature review. Health Serv. Outcomes Res. Methodol. 2009, 9, 84–99. [Google Scholar] [CrossRef]
  71. Turnbull, J.; Martin, D.; Lattimer, V.; Pope, C.; Culliford, D. Does distance matter? Geographical variation in GP out-of-hours service use: An observational study. Br. J. Gen. Pract. 2008, 58, 471. [Google Scholar] [CrossRef]
  72. Freeman, R.E.; Boggs, K.M.; Sullivan, A.F.; Faridi, M.K.; Freid, R.D.; Camargo, C.A., Jr. Distance From Freestanding Emergency Departments to Nearby Emergency Care. Ann. Emerg. Med. 2021, 77, 48–56. [Google Scholar] [CrossRef] [PubMed]
  73. Oppio, A.; Bottero, M.; Giordano, G.; Arcidiacono, A. A multi-methodological evaluation approach for assessing the impact of neighbourhood quality on public health. Epidemiol. Prev. 2016, 40, 249–256. [Google Scholar] [CrossRef] [PubMed]
  74. World Health Organization Regional Office for Europe. Healthy, Prosperous Lives for All: The European Health Equity Status Report; WHO Regional Office for Europe: Copenhagen, Denmark, 2019; Available online: https://iris.who.int/bitstream/handle/10665/344116/9789289052498-eng.pdf?sequence=1 (accessed on 13 May 2025).
  75. Beute, F.; Davies, Z.G.; De Bell, S.; Houlden, V.; White, M.P.; O’Brien, L.; Lomas, T.; Mavoa, S.; Badal, K.; Thompson, C.W. Types and Characteristics of Urban and Peri-Urban Green Spaces Having an Impact on Human Mental Health and Wellbeing: A Systematic Review; An EKLIPSE Expert Working Group Report; EKLIPSE: Wallingford, UK, 2020; Available online: https://iris.uniroma1.it/bitstream/11573/1535901/1/Beute_Types_2020.pdf (accessed on 11 June 2025).
  76. LaReaux, J.; Watkins, D. Geospatial analysis for promoting urban green space equity: Case study of Detroit, Michigan, USA. Urban For. Urban Green. 2025, 105, 128716. [Google Scholar] [CrossRef]
  77. Zeynali, R.; Mandanici, E.; Sohrabi, A.H.; Trevisiol, F.; Bitelli, G. GIS-Based Urban Heat Island Mapping and Analysis: Experiences in the City of Bologna. In Proceedings of the 2024 IEEE International Workshop on Metrology for Living Environment (MetroLivEnv), Chania, Greece, 12–14 June 2024; pp. 230–234. [Google Scholar] [CrossRef]
  78. National Research Council (US). Chapter 2: Determining the Extent of Food Deserts. The Public Health Effects of Food Deserts: Workshop Summary; National Academies Press: Washington, DC, USA, 2009. Available online: https://www.ncbi.nlm.nih.gov/books/NBK208011/ (accessed on 11 June 2025).
  79. Smooth, W.G. Intersectionality from Theoretical Framework to Policy Intervention. In The Politics of Intersectionality; Wilson, A.R., Ed.; Situating Intersectionality. Palgrave Macmillan: New York, NY, USA, 2013. [Google Scholar] [CrossRef]
  80. Bauer, G.R.; Churchill, S.M.; Mahendran, M.; Walwyn, C.; Lizotte, D.; Villa-Rueda, A.A. Intersectionality in quantitative research: A systematic review of its emergence and applications of theory and methods. SSM—Popul. Health 2021, 14, 100798. [Google Scholar] [CrossRef]
  81. Bauer, G.R. Incorporating intersectionality theory into population health research methodology: Challenges and the potential to advance health equity. Soc. Sci. Med. 2014, 110, 10–17. [Google Scholar] [CrossRef]
  82. Bono, M.; Lapierre, J.; Morin, P. Caring for People and Territories: Brief Historical Review of the Intersectoral Social Innovation Experience of Trieste and Its Habitat Micro-Area Program. Can. J. Nonprofit Soc. Econ. Res. 2024, 15, 46–58. [Google Scholar] [CrossRef]
  83. De Vidovich, L. Urban Regeneration through the Territorialisation of Social Policies: Findings from the Microareas Programme in Trieste, Italy. J. Urban Regen. Renew. 2020, 13, 406–421. [Google Scholar] [CrossRef]
  84. Costa, G.; Stroscia, M.; Zengarini, N.; Demaria, M. 40 Anni Di Salute a Torino: Spunti per Leggere i Bisogni E I Risultati Delle Politiche; Inferenze: Milano, Italy, 2017; ISBN 978-88-942239-0-3. [Google Scholar]
  85. Gentilini, V.; Bodini, C.; Di Girolamo, C.; Campione, I.; Cavazza, G.; Marzaroli, P.; Musti, M.A.; Perlangeli, V.; Pandolfi, P.; Pizzi, L.; et al. An ecological study on health inequalities in the city of Bologna (Emilia-Romagna Region, Northern Italy): Bridging knowledge and action. Epidemiol. E Prev. 2020, 44 (Suppl. 1), 45–53. [Google Scholar] [CrossRef]
  86. Consolazio, D.; AlSayed, A.; Serini, M.; Benassi, D.; Sarti, S.; Terraneo, M.; Celata, C.; Russo, A.G. Social inequalities in health within the City of Milan (Lombardy Region, Northern Italy): An ecological assessment. Epidemiol. E Prev. 2024, 48, 298–308. [Google Scholar] [CrossRef]
  87. Lindberg, M.H.; Chen, G.; Olsen, J.A.; Abelsen, B. Combining education and income into a socioeconomic position score for use in studies of health inequalities. BMC Public Health 2022, 22, 969. [Google Scholar] [CrossRef]
  88. Moss, J.L.; Johnson, N.J.; Yu, M.; Altekruse, S.F.; Cronin, K.A. Comparisons of individual- and area-level socioeconomic status as proxies for individual-level measures: Evidence from the Mortality Disparities in American Communities study. Popul. Health Metr. 2021, 19, 1. [Google Scholar] [CrossRef]
Figure 1. Urban zones of III Municipality of Rome. The red box in the overview map corresponds to the geographical extent displayed in the main map.
Land 14 01574 g001
Figure 2. Methodological process for the subdivision of Urban Zones (UZs) and identification of Mesoareas. The flowchart illustrates the sequential steps based on property market heterogeneity, major road networks, population thresholds, and statistical comparisons to define meaningful intra-urban sub-areas.
Land 14 01574 g002
Figure 3. Urban Zones (UZs) of Municipality III subdivided by census sections (CSs). The association between CSs and UZs was established using the methods described in Step 1 of the methodological process.
Land 14 01574 g003
Figure 4. Results of the subdivision of Urban Zones (UZs) based on real estate market heterogeneity and road axes. Asterisks (*) indicate the steps at which statistical analyses were conducted to assess differences in the percentage of university graduates across Mesoareas within the same UZ. Abbreviations: S = Serpentara; VM = Val Melaina; CB = Casal Boccone; MSA = Monte Sacro Alto; F = Fidene. Tufello, Aeroporto dell’Urbe, Tor San Giovanni, Bufalotta, Monte Sacro, Settebagni and Conca d’Oro UZs were not subject to further subdivision.
Land 14 01574 g004
Figure 6. The image illustrates the Step 2 subdivision process of the Fidene (UZ). In the Urban Zone of Fidene, two OMI zones are present: E40, with higher average property sale prices, and E41. The census sections (CSs) whose centroids fall within OMI zone E40 were grouped to form the sub-area Fidene North (E), while those falling within OMI zone E41 constitute the sub-area Fidene South (F). The red box in the overview map corresponds to the geographical extent displayed in the main map.
Land 14 01574 g006
Figure 7. The image illustrates the Step 2 subdivision process of the Serpentara Urban Zone (UZ). Three OMI zones fall within this UZ: E40, with the highest average property sale price; E47, with an intermediate value; and E42, with the lowest value. Census sections (CSs) whose centroids fall within OMI zone E40 were grouped into the sub-area Serpentara Colle Salario (K); those falling in E47 formed Serpentara Est (J); and those in E42 formed Serpentara Betulle (L). In the northern part of Serpentara, bordering the Fidene UZ (1), some CSs fall into OMI zone E41. These CSs, comprising 1351 inhabitants, were included in Serpentara Betulle. CSs located in the southernmost portion of the UZ, falling within OMI zone D71 and containing zero inhabitants, were also assigned to Serpentara Betulle. The red box in the overview map corresponds to the geographical extent displayed in the main map.
Land 14 01574 g007
Figure 8. The image shows the subdivision process of the Val Melaina Urban Zone (UZ) based on Step 2. Two OMI zones intersect this UZ: D71, with a higher average residential property sale price, and D12. The census sections (CSs) whose centroids fall within OMI zone D12 were grouped into the sub-area Northern Tufello (E). Some CSs along the border with the adjacent Tufello UZ also fall within D12; as these CSs account for fewer than 1500 residents, they were included in the portion of Val Melaina that was not subdivided, further designated as the Val Melaina Residual Area. The red box in the overview map corresponds to the geographical extent displayed in the main map.
Land 14 01574 g008
Figure 9. The figure shows the subdivision process of the Casal Boccone Urban Zone (UZ) based on Step 2. Two main OMI zones intersect this UZ: E51, with the highest average residential property sale price, and E47, with a lower price. The census sections (CSs) whose centroids fall within OMI zone E51 were grouped into the sub-area Casal Boccone East (A), while those falling within OMI zone E47 formed the sub-area Casal Boccone West (B). In the northern portion of Casal Boccone, at the border with Monte Sacro Alto UZ (5), some CSs fall within OMI zone D27; these CSs, with a total population of 536 inhabitants, were included in the Serpentara Betulle area. The southernmost CSs, falling within OMI zone D71 and containing no inhabitants, were also considered part of Casal Boccone East. The red box in the overview map corresponds to the geographical extent displayed in the main map.
Land 14 01574 g009
Figure 10. The image illustrates the subdivision process of the Monte Sacro Alto (MSA) Urban Zone (UZ) based on Step 2. Two main OMI zones intersect this UZ: D11, with the highest average residential property sale price, and D27, with the lowest. The census sections (CSs) whose centroids fall within OMI zone D11 were grouped into the sub-area MSA Sannazzaro Park (I). In the southern part of MSA, near the border with Casal Boccone UZ (6), some CSs fall within OMI zone E51. These CSs, with a combined population of 960 inhabitants, were included in the portion of MSA that was not further subdivided, designated as the MSA Residual Area. The red box in the overview map corresponds to the geographical extent displayed in the main map.
Land 14 01574 g010
Figure 11. The image shows the road axis formed by Via Renato Fucini (to the north) and Via Arturo Graf (to the south). This road axis crosses the residual area of Monte Sacro Alto (MSA) that remained after the subdivision carried out in Step 2. It was used as a reference to further divide the census sections of MSA into two sub-areas: one located east of the axis, named MSA Est (14,433 inhabitants), and one to the west, between the road axis and MSA Sannazzaro Park, named MSA Centrale (16,334 inhabitants). The red box in the overview map corresponds to the geographical extent displayed in the main map.
Land 14 01574 g011
Figure 12. The image illustrates the inter-zonal roads within the Urban Zone (UZ) of Val Melaina. These road axes were used to delineate five additional sub-areas within Val Melaina: one to the west of the Seggiano–Vaglia–Cavriglia axis, named ‘Val Melaina FL1’; one to the northwest of the Comano–Filattiera–Pian di Sco axis, named ‘Val Melaina 1’; one southeast of this axis and bounded by Via Seggiano, Via Gualterio, Via Monte Cervialto, and the border with the sub-areas of Serpentara (L, J), named ‘Val Melaina 2’; one east of Via Monte Cervialto, named ‘Val Melaina Giovanni Conti’; and one bordered to the northeast by Via Cavriglia, Via Vaglia, Via Gualterio, and Via Monte Cervialto, and to the southwest by the boundaries with Conca d’Oro (7) and Tufello (9), named ‘Val Melaina Prati Fiscali’. The red box in the overview map corresponds to the geographical extent displayed in the main map.
Land 14 01574 g012
Figure 13. The image displays the inter-zonal roads within the Urban Zone of Serpentara. The road axis formed by Via Titina De Filippo and Via Pian di Sco allows for the subdivision of the broader Serpentara Colle Salario Betulle area—created through the merging operations in Step 6—into two sub-areas: one to the east of the axis, named Serpentara 2, and one to the west, named Serpentara 3. Additionally, the road axis composed of Via Amalia Bettini and Viale Gino Cervi enables the subdivision of the Serpentara Est area into two further sub-areas: a smaller southern portion called Serpentara Giulio Pasquati, and a larger northern portion referred to as Serpentara Vigne Nuove. The red box in the overview map corresponds to the geographical extent displayed in the main map.
Land 14 01574 g013
Figure 14. This figure illustrates the Mesoareas derived from the subdivision of Urban Zones (UZs), produced and retained following the sequence of methodological steps outlined earlier.
Land 14 01574 g014
Figure 15. Mesoareas of the III Municipality of Rome.
Land 14 01574 g015
Table 1. Overview of the main data sources used for the delineation of Mesoareas and the analysis of socioeconomic indicators within the Urban Zones of Municipality III. For each dataset, the type of data and the corresponding source are reported.
Dataset DescriptionYearSource
Vector layer of 2021 census sections of the Municipality of Rome, including both point and polygon geometries.2021ISTAT (Istituto Nazionale di Statistica)
Database containing demographic and socioeconomic data from the 2021 ISTAT Census, joined to the spatial layer of census sections.2021ISTAT (Istituto Nazionale di Statistica)
Vector layer of administrative subdivisions (Municipalities).Accessed May 2025IPTSAT s.r.l., via DatiOpen.it platform
Vector layer of Urban Zones (Zone Urbanistiche) of the Municipality of Rome in WGS 84 coordinate system.Accessed May 2025Roma Capitale/Geoportale
Vector layer of OMI (Osservatorio del Mercato Immobiliare) Zones, with minimum and maximum property sale and rental prices per square meter. Used to calculate average residential sale prices.2021Agenzia delle Entrate—OMI
Linear vector layer of the national road network.Accessed May 2025ANAS S.p.A. (Azienda Nazionale Autonoma delle Strade)
Table 2. This table reports the description of the Urban Zones within III Municipality, including their area and 2021 ISTAT population, as derived from the procedures described above.
Urban ZoneArea (km2)Inhabitants (ISTAT 2021)
Aeroporto dell’ Urbe4.41896
Bufalotta13.97465
Casal Boccone5.713,748
Conca d’Oro1.218,792
Fidene1.111,524
Monte Sacro1.716,050
Monte Sacro Alto2.633,440
Sacco Pastore0.59947
Serpentara5.931,264
Settebagni4.85254
Tor S. Giovanni51.9706
Tufello0.913,590
Val Melaina3.238,224
III Municipality of Rome97.9201,900
Table 3. The table presents the OMI zones falling within each Urban Zone (UZ), identified through the intersection between the centroid layer of the 2021 census sections within each UZ and the polygon vector layer of the OMI zones, as described in Step 2. The table also reports the corresponding population figures based on the 2021 census data.
Urban ZonesOMI ZonesInhabitantsActions
Aeroporto dell’UrbeD71178None
E161589None
E41129None
E42 None
BufalottaE1015None
E1237425None
R735None
Casal BocconeD27536Considered part of Casal Boccone
E476192Led to the definition of Western Casal Boccone
E517020Led to the definition of Eastern Casal Boccone
Conca d’OroD4618,784None
D478None
D110None
FideneE402288Led to the definition of Northern Fidene
E419236Led to the definition of Southern Fidene
Monte SacroD1115,462None
D46588None
d470None
Monte Sacro AltoD112673Led to the definition of Monte Sacro Alto Sannazzaro Park
D2729,807Led to the definition of Monte Sacro Alto (Residual Area)
E51960Considered part of Monte Sacro Alto (Residual Area)
Sacco PastoreD462None
D479945None
D110None
SettebagniE16590None
E504664None
SerpentaraE409681Led to the definition of Serpentara Colle Salario
E411351Considered part of Serpentara Betulle
E4210,346Led to the definition of Serpentara Betulle
E479886Led to the definition of Eastern Serpentara
D710Led to the definition of Serpentara Colle Salario
Tor S. GiovanniE101146None
E123180None
R7380None
Val MelainaD12 (eastern area)2164Led to the definition of Northern Tufello
D12 (central-southern area)1239Considered part of Val Melaina (Residual Area)
D7134,821Led to the definition of Residual Val Melaina
TufelloD1213,590None
None
Table 4. Sub-areas resulting from the subdivisions due to heterogeneity in average real estate sale prices or main road axis.
MesoareasInhabitants (ISTAT 2021)
Aeroporto dell’Urbe1896
Bufalotta7465
Eastern Casal Boccone7556
Western Casal Boccone6192
Conca d’Oro18,792
Northern Fidene2288
Southern Fidene9236
Monte Sacro16,050
Central Monte Sacro Alto16,334
Monte Sacro Alto Sannazzaro Park2673
Eastern Montesacro Alto14,433
Saccro Pastore9947
Serpentara Vigne Nuove9886
Serpentara Colle Salario9681
Serpentara Betulle11,697
Settebagni5254
Northern Tor S. Giovanni299
Southern S. Giovanni407
Tufello13,590
Northern Tufello2164
Val Melaina (residual)36,060
III Municipality201,900
Table 5. Sub-areas resulting from the Step 2–4 subdivisions.
MesoareasInhabitants (ISTAT 2021)
Aeroporto dell’Urbe1896
Bufalotta7465
Eastern Casal Boccone7556
Western Casal Boccone6192
Conca d’Oro18,792
Northern Fidene2288
Southern Fidene9236
Monte Sacro16,050
Central Monte Sacro Alto16,334
Monte Sacro Alto Sannazzaro Park2673
Eastern Montesacro Alto14,433
Saccro Pastore9947
Serpentara Est9886
Serpentara Colle Salario9681
Serpentara Betulle11,697
Settebagni5254
Tor S. Giovanni706
Tufello13,590
Val Melaina Northern Tufello2164
Val Melaina Giovanni Conti9927
Val Melaina Prati Fiscali11,743
Val Melaina11883
Val Melaina28602
Val Melaina FL13905
III Municipality201,900
Table 6. Results from the chi2 analysis of differences in educational level per sub-area defined during Steps 2–4. Statistically significant results (p < 0.05) are shown in bold.
UZUniversity Degree or More
N (%)
Lower than University Degree
N(%)
p
Casal Bocconeeastern2119 (35.8)3796 (64)<0.001
western1069 (20.4)4165 (89.6)
Fidenenorthern310 (16.4)1584 (83.6)0.267
southern1316 (17.4)6228 (82.6)
Monte Sacro AltoCentral5320 (39.5)8139 (60.5)<0.001
Sannazzaro Park1057 (48.0)1144 (52.0)
Monte Sacro AltoCentral5320 (39.5)8139 (60.5)0.010
Eastern4507 (37.9)7373 (62.1)
Monte Sacro AltoSannazzaro Park1057 (48.0)1144 (52.0)<0.001
Eastern4107 (32.5)8514 (67.5)
SerpentaraEastern2149 (26.8)5859 (73.2)0.253
Colle Salario2076 (26.0)5897 (74.0)
SerpentaraEastern2149 (26.8)5859 (73.2)0.024
Betulle2553 (25.4)7515 (74.6)
SerpentaraColle Salario2076 (26.0)5897 (74.0)0.300
Betulle2553 (25.4)7515 (74.6)
Val MelainaNorthern Tufello583 (32.5)1212 (67.5)<0.001
Giovanni Conti2117 (25.7)6111 (74.3)
Val MelainaNorthern Tufello583 (32.5)1212 (67.5)0.029
Prati Fiscali3388 (35.2)6248 (64.8)
Val MelainaNorthern Tufello583 (32.5)1212 (67.5)<0.001
1575 (38.3)926 (61.7)
Val MelainaNorthern Tufello583 (32.5)1212 (67.5)0.015
22559 (35.6)4639 (64.4)
Val MelainaGiovanni Conti2117 (25.7)6111 (74.3)<0.001
Prati Fiscali3388 (35.2)6248 (64.8)
Val MelainaGiovanni Conti2117 (25.7)6111 (74.3)<0.001
1575 (38.3)926 (61.7)
Val MelainaGiovanni Conti2117 (25.7)6111 (74.3)<0.001
22559 (35.6)4639 (64.4)
Val MelainaPrati Fiscali3388 (35.2)6248 (64.8)0.018
1575 (38.3)926 (61.7)
Val MelainaPrati Fiscali3388 (35.2)6248 (64.8)0.599
22559 (35.6)4639 (64.4)
Val Melaina1575 (38.3)926 (61.7)0.043
22559 (35.6)4639 (64.4)
Val MelainaFL11317 (40.5)1938 (59.5)<0.001
Northern Tufello583 (18.1)2630 (81.9)
Val MelainaFL11317 (40.5)1938 (59.5)<0.001
Giovanni Conti2117 (25.7)6111 (74.3)
Val MelainaFL11317 (40.5)1938 (59.5)<0.001
Prati Fiscali3388 (35.2)6248 (64.8)
Val MelainaFL11317 (40.5)1938 (59.5)<0.001
1575 (22.4)1995 (77.6)
Val MelainaFL11317 (40.5)1938 (59.5)<0.001
22559 (35.6)4639 (64.4)
Table 7. Mesoareas resulting from the subdivisions due to extensive dimensions, heterogeneity in average real estate sale prices or main road axis, or large number of inhabitants.
MesoareasInhabitants (ISTAT 2021)
Aeroporto dell’Urbe1896
Bufalotta7465
Eastern Casal Boccone7556
Western Casal Boccone6192
Conca d’Oro18,792
Fidene11,524
Monte Sacro16,050
Central Monte Sacro Alto16,334
Monte Sacro Alto Sannazzaro Park2673
Eastern Montesacro Alto14,433
Saccro Pastore9947
Serpentara Est9886
Serpentara Colle Salario Betulle21,378
Settebagni5254
Tor S. Giovanni706
Tufello13,590
Val Melaina Northern Tufello2164
Val Melaina Giovanni Conti9927
Val Melaina F.A. Gualterio22,228
Val Melaina FL13905
III Municipality201,900
Table 8. The table shows the results of the Chi-squared tests conducted between the sub-areas derived from the Serpentara Urban Zone through the subdivisions carried out in Step 4b. Statistically significant results (p < 0.05) are shown in bold.
UZ University Degree or More n (%)Lower than University Degree n (%)p
Serpentara 33462 (25.5)10,116 (74.5)0.387
21167 (26,1)4463 (73,9)
Serpentara33462 (25.5)10,116 (74.5)<0.001
Giulio Pasquati339 (14)2082 (86)
Serpentara21167 (26.1)1167 (26,1)<0.001
Giulio Pasquati339 (14)2082 (86%)
Serpentara Vigne Nuove1810 (32,4)3777 (67.6)<0.001
21167 (26,1)4463 (73.9)
SerpentaraVigne Nuove1810 (32,4)3777 (67.6)<0.001
Giulio Pasquati339 (14)2082 (86%)
Serpentara 33462 (25.5)10,116 (74.5)<0.001
Vigne Nuove1810 (32.4)3777 (67.6)
Table 9. The table shows the results of the Chi-squared tests conducted between the sub-areas derived from the Serpentara Urban Zone through the merging of sub-areas carried out in Step 6b. Statistically significant results (p < 0.05) are shown in bold.
UZ University Degree or More n (%)Lower than University Degree n (%)p
SerpentaraCS Betulle4629 (25.7)13,412 (74.3)<0.001
Giulio Pasquati339 (14)2082 (86)
SerpentaraVigne Nuove1810 (32,4)3777 (67.6)<0.001
CS Betulle4629 (25.7)13,412 (74.3)
SerpentaraVigne Nuove1810 (32,4)3777 (67.6)<0.001
Giulio Pasquati339 (14)2082 (86%)
Table 10. III Municipality of Rome, Mesoareas.
MesoareasInhabitants (ISTAT 2021)
Aeroporto dell’Urbe1896
Bufalotta7465
Eastern Casal Boccone7556
Western Casal Boccone6192
Conca d’Oro18,792
Fidene11,524
Monte Sacro16,050
Central Monte Sacro Alto 16,334
Monte Sacro Alto Sannazzaro Park2673
Eastern Montesacro Alto14,433
Saccro Pastore9947
Serpentara Vigne Nuove7092
Serpentara Colle Salario Betulle21,378
Serpentara Giulio Pasquati2794
Settebagni5254
Tor S. Giovanni706
Tufello13,590
Northern Tufello2164
Val Melaina Giovanni Conti9927
Val Melaina FL13905
Val Melaina F.A. Gualterio22,228
III Municipality201,900
Table 11. Descriptive statistics (mean, variance, median, and interquartile range) for educational attainment across all Urban Zones within Municipality III.
Urban ZonesMeanVarianceMedianIQR
Fidene0.1650.0020.1670.059
Sacco Pastore0.3890.0050.3910.075
Conca d’Oro0.3820.0060.3810.087
Monte Sacro Alto0.4000.0070.4010.089
Settebagni0.2370.0080.2220.076
Monte Sacro0.4540.0090.4650.11
Bufalotta0.2120.0090.1830.151
Tufello0.1870.0090.1670.13
Tor S. Giovanni0.1830.0100.1820.173
Val Melaina0.3350.0110.3450.157
Serpentara0.2610.0110.2750.137
Aeroporto dell’ Urbe0.1880.0130.1640.098
Table 12. Descriptive statistics (mean, variance, median, and interquartile range) for educational attainment across all Mesoareas within Municipality III.
Urban ZonesMeanVarianceMedianIQR
Fidene0.1650.0020.1670.059
Monte Sacro Alto Sannazzaro Park0.4930.0030.4820.074
Val Melaina FL10.4080.0040.4250.074
Serpentara Giulio Pasquati0.1400.0040.1230.08
Monte Sacro Alto East0.3860.0050.3710.108
Saccro Pastore0.3890.0050.3910.075
Conca d’Oro0.3820.0060.3810.087
Northern Tufello0.2860.0070.2950.138
Serpentara Vigne Nuove0.3260.0070.3140.106
Monte Sacro Alto Central0.3950.0070.4050.07
Settebagni0.2370.0080.2220.076
Val Melaina F.A. Gualterio0.3540.0080.350.134
Monte Sacro0.4540.0090.4650.11
Bufalotta0.2120.0090.1830.151
Tufello0.1870.0090.1670.13
Serpentara Colle Salario Betulle0.2380.0100.2570.145
Tor S. Giovanni0.1830.0100.1820.173
Aeroporto dell’Urbe0.1880.0130.1640.098
Casal Boccone East0.2960.0130.2780.232
Val Melaina Giovanni Conti0.2720.0150.2560.184
Casal Boccone West0.2330.0160.2210.248
Table 13. Results of Kruskal–Wallis tests performed on the percentage of university graduates across subdivided Mesoareas within Urban Zones. Where three or more groups were compared, post-hoc pairwise comparisons using Dunn’s test with Bonferroni correction are presented. Statistically significant differences (p < 0.05) between specific Mesoareas are highlighted, illustrating localized variations in educational attainment. Statistically significant results (p < 0.05) are shown in bold.
Urban ZoneNo. of MesoareasKruskal–Wallis Test (χ2, df)Global p-ValueSignificant Pairwise Comparisons (Dunn–Bonferroni)Adjusted p-Value
Casal Boccone22.364
with 1 d.f.
0.1242
MSA317.493 with 2 d.f.0.0002MSA Sannazzaro Park vs. Central MSA0.0012
MSA Sannazzaro Park vs. Eastern MSA<0.001
Serpentara315.674 with 2 d.f.0.0004Serpentara Vigne Nuove vs. Serpentara CS Betulle0.0018
Serpentara Vigne Nuove vs. Serpentara Giulio Pasquati0.0023
Val Melaina413.848 with 3 d.f.0.0031VM Giovanni Conti vs. VM F.A. Gualterio0.02
VM Giovanni Conti vs. VM FL10.0032
Table 14. Results from the chi2 analysis of differences in occupational status. Statistically significant results (p < 0.05) are shown in bold.
UZEmployed (%)Unemployed (%)p
Casal Bocconeeastern3495 (67.8)1658 (32.2)<0.001
western2435 (61.5)1525 (38.5)
Monte Sacro AltoCentral6433 (65.4)3409 (34.6)0.872
Sannazzaro Park1081 (65.2)578 (34.8)
Monte Sacro AltoCentral6433 (65.4)3409 (34.6)0045
Eastern6037 (66.7)3008 (33.3)
Monte Sacro AltoSannazzaro Park1081 (65.2)578 (34.8)0.209
Eastern6037 (66.7)3008 (33.3)
SerpentaraVigne Nuove3515 (71.4)1406 (28.6)<0.001
CS Betulle8612 (64.9)4649 (35.1)
SerpentaraVigne Nuove3515 (71.4)1406 (28.6)<0.001
Giulio Pasquati925 (56.8)704 (43.2)
SerpentaraCS Betulle8612 (64.9)4649 (35.1)<0.001
Giulio Pasquati2553 (25.4)7515 (74.6)
Val MelainaGiovanni Conti3550 (62)2176 (38)<0.001
Northern Tufello961 (67.8)457 (32.2)
Val MelainaF.A. Gualterio8263 (60.8)5331 (39.2)<0.001
Northern Tufello961 (67.8)457 (32.2)
Val MelainaNorthern Tufello961 (67.8)457 (32.2)0.427
FL11465 (66.5)738 (33.5)
Val MelainaGiovanni Conti3550 (62)2176 (38)0.114
F.A. Gualterio8263 (60.8)5331 (39.2)
Val MelainaGiovanni Conti3550 (62)2176 (38)<0.001
FL11465 (66.5)738 (33.5)
Val MelainaF.A. Gualterio8263 (60.8)5331 (39.2)<0.001
FL11465 (66.5)738 (33.5)
Table 15. Results from the chi2 analysis of differences in single-person households. Statistically significant results (p < 0.05) are shown in bold.
UZSingle-Person Households (%)Not-Single-Person Households (%)p
Casal Bocconeeastern1528 (43,2)2007 (56.8)<0.001
western1069 (37.1)1810 (62.9)
Monte Sacro AltoCentral3615 (45%)4425 (55)0.299
Sannazzaro Park549 (43,4)716 (56.6)
Monte Sacro AltoCentral3615 (45%)4425 (55)0.556
Eastern3130 (44.5)3906 (55.5)
Monte Sacro AltoSannazzaro Park549 (43,4)716 (56.6)0.474
Eastern3130 (44.5)3906 (55.5)
SerpentaraVigne Nuove1672 (47.1%)1879 (52.9)<0.001
CS Betulle3995 (39.3)6159 (60.7)
SerpentaraVigne Nuove1672 (47.1%)1879 (52.9)<0.001
Giulio Pasquati417 (33.1)841 (66.9)
SerpentaraCS Betulle3995 (39.3)6159 (60.7)<0.001
Giulio Pasquati417 (33.1)841 (66.9)
Val MelainaGiovanni Conti1760 (38.9)2765 (61.1)<0.001
Northern Tufello544 (49.3)559 (50.7)
Val MelainaF.A. Gualterio6044 (52.2)5544 (47.8)0.071
Northern Tufello544 (49.3)559 (50.7)
Val MelainaNorthern Tufello544 (49.3)559 (50.7)<0.001
FL1807 (42.3)1099 (57.7)
Val MelainaGiovanni Conti1760 (38.9)2765 (61.1)<0.001
F.A. Gualterio6044 (52.2)5544 (47.8)
Val MelainaGiovanni Conti1760 (38.9)2765 (61.1)0.01
FL1807 (42.3)1099 (57.7)
Val MelainaF.A. Gualterio6044 (52.2)5544 (47.8)<0.001
FL1807 (42.3)1099 (57.7)
Disclaimer/Publisher’s Note: The statements, opinions and data contained in all publications are solely those of the individual author(s) and contributor(s) and not of MDPI and/or the editor(s). MDPI and/or the editor(s) disclaim responsibility for any injury to people or property resulting from any ideas, methods, instructions or products referred to in the content.