Article

Scenario-Based Assessment of Urbanization-Induced Land-Use Changes and Regional Habitat Quality Dynamics in Chengdu (1990–2030): Insights from FLUS-InVEST Modeling

1
Key Laboratory of Land Resources Evaluation and Monitoring in Southwest China, Ministry of Education, Sichuan Normal University, Chengdu 610068, China
2
College of Geography and Resources Science, Sichuan Normal University, Chengdu 610068, China
*
Author to whom correspondence should be addressed.
Land 2025, 14(8), 1568; https://doi.org/10.3390/land14081568
Submission received: 26 June 2025 / Revised: 21 July 2025 / Accepted: 22 July 2025 / Published: 31 July 2025

Abstract

Against the backdrop of rapid urbanization in western China, which has triggered remarkable land-use changes and habitat degradation, Chengdu, as a developed city in China, plays a demonstrative and leading role in the economic and social development of China during the transition period. Therefore, integrated modeling approaches are required to balance development and conservation. This study responds to this need by conducting a scenario-based assessment of urbanization-induced land-use changes and regional habitat quality dynamics in Chengdu (1990–2030), using the FLUS-InVEST model. By integrating remote sensing-derived land-use data from 1990, 1995, 2000, 2005, 2010, 2015, and 2020, we simulate future regional habitat quality under three policy scenarios: natural development, ecological priority, and cropland protection. Key findings include the following: (1) From 1990 to 2020, cropland decreased by 1917.78 km2, while forestland and built-up areas increased by 509.91 km2 and 1436.52 km2, respectively. Under the 2030 natural development scenario, built-up expansion and cropland reduction are projected. Ecological priority policies would enhance forestland (+4.2%) but slightly reduce cropland. (2) Regional habitat quality declined overall (1990–2020), with the sharpest drop (ΔHQ = −0.063) occurring between 2000 and 2010 due to accelerated urbanization. (3) Scenario analysis reveals that the ecological priority strategy yields the highest regional habitat quality (HQmean = 0.499), while natural development results in the lowest (HQmean = 0.444). This study demonstrates how the FLUS-InVEST model can quantify the trade-offs between urbanization and regional habitat quality, offering a scientific framework for balancing development and ecological conservation in rapidly urbanizing regions. The findings highlight the effectiveness of ecological priority policies in mitigating habitat degradation, with implications for similar cities seeking sustainable land-use strategies that integrate farmland protection and forest restoration.

1. Introduction

Land Use and Cover Change (LUCC) significantly alters ecosystem structures and functions, playing a critical role in maintaining ecosystem service capacities [1,2,3,4,5]. In this study, “urbanization” is defined as the process of population and economic activity concentration in urban areas, with core characteristics including built-up land expansion, transformation of rural landscapes into urban land-use types, and socioeconomic restructuring [6]. In the context of Chengdu, urbanization is reflected through three dimensions of land-use change: (1) conversion of cropland and forestland to built-up land (e.g., rapid expansion of construction land), (2) intensification of urban development spatial patterns (e.g., agglomerated development in central urban areas and radial sprawl in suburbs), and (3) reallocation of land-use functions from agricultural production to urban services (e.g., expansion of industrial land and reduction in ecological land). Through the FLUS-InVEST framework, we quantified these urbanization-driven land-use changes and their impacts on regional habitat quality, echoing global definitions of urbanization as a driver of ecosystem transformation [7]. Regional habitat quality is defined as the landscape-level capacity to sustain biodiversity under human-induced threats, integrating multiple ecosystem types and land-use dynamics [8]. Regional habitat quality, as operationalized in the InVEST model, quantifies the capacity of an ecosystem to support species survival through habitat suitability and threat levels (Equation (2)) [9,10,11,12,13,14,15]. As a major central city in western China, Chengdu has undergone rapid urban expansion and industrial restructuring over the past three decades [16]. This economic-driven transformation has reduced cropland and forestland areas while expanding built-up regions, subjecting the regional ecosystems to challenges like habitat fragmentation and biodiversity loss. Unlike eastern coastal cities such as Guangzhou, whose urbanization focused on industrialization and port expansion, Chengdu’s “Park City” initiative emphasizes integrating urban development with ecological conservation [17].
Simulating future land-use dynamics is essential for regional planning decisions. Commonly applied models include Markov chain [18,19,20], CA-Markov [21,22,23,24], CLUE-S [25,26,27], and PLUS [28,29,30]. In this study, we employ the FLUS (Future Land Use Simulation) model developed by Professor Xiaoping Liu, which integrates Artificial Neural Networks (ANNs), cellular automata, and Markov chain methods to simulate multi-scenario land-use changes in Chengdu by coupling human activities with natural processes [31]. Compared to traditional models like CA-Markov or CLUE-S, the InVEST model offers the following advantages:
(1) Dynamic Adaptability: It quantifies the cumulative effects of threats (e.g., urban expansion, agricultural development) to simulate nonlinear impacts of land-use changes on regional habitat quality.
(2) Cross-Regional Comparability: Its standardized parameter system supports horizontal comparisons across regions, particularly for multi-scenario policy simulations.
(3) Data Compatibility: The InVEST model seamlessly integrates with land-use simulation tools like FLUS, enabling a closed-loop analysis of “prediction–assessment–decision”.
Concurrently, scholars have increasingly combined the InVEST model with FLUS to achieve multi-objective, multi-scenario assessments of regional habitat quality [32,33,34,35]. Globally, InVEST-based regional habitat quality evaluation methods have been widely applied across scales. It is important to note, however, that this module does not explicitly capture habitat heterogeneity at the species-specific level [8], but rather estimates relative habitat suitability across regions based on aggregated threat sources and land-use type sensitivity. For instance, For instance, in mountainous areas, Xiang et al. (2023) used the InVEST model to assess the topographic effect on habitat quality [36]. Similarly, Limin et al. (2019) analyzed the influence of urbanization on regional habitat quality, with Changchun City as a case study [37]. Additionally, Cao et al. (2023) investigated the spatiotemporal evolution and driving forces of habitat quality in the Yangtze River basin of Anhui Province based on the InVEST model [38].
As Chengdu enters an accelerated urbanization phase, investigating the impacts of land-use changes on regional habitat quality holds practical significance for enhancing regional ecosystem functions. This study combines FLUS and InVEST models to analyze Chengdu’s land-use evolution from 1990 to 2020 and predict future scenarios for 2030, aiming to inform land-use planning and ecological conservation. Our key contributions are as follows:
(1) We construct a four-in-one analytical framework of “pattern–process–mechanism–scenario” by integrating InVEST, land-use transfer matrices, and FLUS scenario simulations. This staged, regional, nested analysis overcomes the limitations of traditional single-temporal or static spatial comparisons.
(2) We quantify the differential impacts of land-use transitions on regional habitat quality using a land-use change contribution matrix.
(3) Our multi-scenario simulations highlight decision-support value: the ecological priority scenario boosts regional habitat quality by 6.0%, with a spatial optimization path that increases high-grade habitats (>0.8) in the western Longmen Mountain Range by 328.3 km2, forming a regional ecological barrier. This scenario has been incorporated into the Chengdu Territorial Spatial Ecological Restoration Plan (2021–2035).

2. Materials and Methods

2.1. Overview of the Study Area

Chengdu City, also known as “Rong,” serves as the provincial capital of Sichuan Province and a national central city in China. Located between 102°54′–104°53′ E and 30°05′–31°26′ N in southwestern China, its terrain gradually flattens from northwest to southeast. The elevation ranges from 387 m in the eastern plain (Jinjiang District) to 5364 m at Mount Siguniang in the western Longmen Mountains, forming a vertical zonation of “plain-hill-mountain” landforms. The region is characterized by diverse landforms, with plains dominating (4572 km2, 40.3% of the total area), followed by mountainous zones (3981 km2, 35.1%). Chengdu has a subtropical monsoon humid climate, with an annual mean temperature of 16.2 °C (ranging from 5.6 °C in January to 25.9 °C in July) and annual precipitation of 945.6 mm (70% concentrated in June–September). The frost-free period exceeds 300 days/year, supporting intensive agricultural activities. These climatic conditions, combined with fertile alluvial soils, underpin its status as a major grain production base in southwestern China. The geographical location map of Chengdu is shown in Figure 1.

2.2. Data Sources and Processing

The data used in this study are as follows:
① Land-Use Data: The China 30 m precision land-cover data product CLCD, released by the Institute of Remote Sensing Information Processing of Wuhan University, has an overall accuracy of 80%, meeting the accuracy requirements of this study. Seven phases of remote sensing interpretation data on land use in Chengdu for the years 1990, 1995, 2000, 2005, 2010, 2015, and 2020 were selected. These data were reclassified into six categories according to GB/T 21010–2017 Classification of Current Land Use, Beijing: China Standard Press [39]: cropland, forest, grassland, built-up, water, and barren.
② Driving Factor Data: Based on previous studies by scholars [30,35,40], driving factors were categorized into four categories. These included physical factors (natural environmental factors, transportation location factors, and ecological policy factors) and socioeconomic factors (Table 1). Socioeconomic factors (GDP and population density) at 1 km resolution were converted to 30 m resolution using a “reclassification-aggregation” method (via the Zonal Statistics tool in ArcGIS) to align with land-use data [17]. The Global Moran’s I tool in ArcGIS was applied to assess the spatial autocorrelation of driving factors (p < 0.05 indicates significant spatial autocorrelation). The results showed that population density and GDP exhibited significant positive spatial autocorrelation (I = 0.62, p < 0.01). For natural environmental factors, DEM data (30 m) and transportation factors (vector data) were processed into raster layers using Euclidean distance calculations to ensure spatial alignment, while annual temperature and precipitation data were resampled to 30 m resolution. Ecological policy factors were vectorized and overlaid with land-use data for analysis.

2.3. Research Methods

2.3.1. Land-Use Transition Matrix

The land-use transition matrix originates from the quantitative description of system states and transitions [41]. It systematically arranges the areas of land category conversions into a matrix format, visually illustrating the transformation of areas between different land categories [42,43]. This method enables the analysis of land-use function transitions under different scenarios.
The expression is
A i j = A 11 A 12 A 1 n A 21 A 22 A 2 n A n 1 A n 2 A n n
where Aij represents the area transitioned from land category i to j, and n is the number of land-use types in the region.

2.3.2. Land-Use Change Simulation and Scenario Design Based on FLUS Model

The FLUS (Future Land Use Simulation) model, developed by Xiaoping Liu et al. [31] is an advanced tool that enhances understanding of regional land-use evolution patterns and provides theoretical support for territorial resource management decisions.
Scenario Design Logic
Following methodologies from related studies [44,45], this research establishes three scenarios to predict Chengdu’s 2030 spatial land-use patterns(Specific information is shown in Table 2, Table 3 and Table 4):
Relevant Formulae:
(1) Transition Probability Calculation Formula of Markov Chain Transition Matrix:
P i j   =   C i j j   =   1 n C i j
where P i j represents the probability of land-use type i converting to type j, C i j denotes the conversion area (km2) from land-use type i to j, and n is the total number of land-use types (in this study, n = 6).
(2) The neighborhood impact factor reflects the interactions between different land-use types [49], and the formula is as follows:
Ω p , k t = N × N c o n c p t 1 = k N × N 1 × ω k
where Ω p , k t represents the neighborhood factor of cell p at time t, N × N c o n c p t 1   =   k is the total number of cells of land-use type k within the N × N neighborhood window at the last iteration t − 1 (in this study, N is set to 3), and ω k denotes the neighborhood factor parameter of land-use type k.
Neighborhood factor parameters were set according to the degree of human activity’s impact on each land-use type (Table 5). A parameter closer to 1 indicates a greater expansion potential for the corresponding land-use type.
(3) The adaptive inertia coefficient is dynamically adjusted during iterations, based on the difference between the current quantity of each land-use type and its target scale, as described by the following formula:
I n t e r t i a k t   =   I n t e r t i a k t 1 , D k t 1 D k t 2 I n t e r t i a k t 1 × D k t 2 D k t 1 , D k t 1 < D k t 2 < 0 I n t e r t i a k t 1 × D k t 1 D k t 2 , 0 < D k t 2 < D k t 1
where I n t e r t i a k t is the adaptive inertia coefficient of land-use type k at iteration time t, while D k t 1 and D k t 2 represent the differences between the current area and target area of land-use type k at times t − 1 and t − 2, respectively.
(4) Combining the above results, the overall conversion probability of cells occupied by specific land-use types is calculated using the following formula:
T P p , k t = P p , k × I n t e r t i a k t × Ω p , k t × 1 s c c k
where T P p , k t represents the overall conversion probability that cell p transforms into land-use type k at time t; P p , k , Ω p , k t , and I n t e r t i a k t denote the suitability probability, neighborhood impact factor, and adaptive inertia coefficient, respectively; and s c c k is the conversion cost from land-use type c to k.
Model Accuracy Validation:
To ensure the scientific validity and reliability of the FLUS model simulations under different scenarios, the confusion matrix and kappa coefficient were used for accuracy verification. The actual land-use data in 2020 were adopted as the validation benchmark, compared with the simulated results for 2030 (Table 6).

2.3.3. Regional Habitat Quality Assessment Using the InVEST Model

The InVEST model, widely used in urban ecological research, has proven effective in various contexts. Terrado et al. (2016) developed a model for assessing terrestrial and aquatic habitat quality in conservation planning [50]. In China, Chen et al. (2023) analyzed the spatial and temporal changes of habitat quality using the InVEST model [51], and Zhu et al. (2018) explored the dynamic changes of habitats in typical nature reserves [52]. However, Chengdu’s focus on western mountainous ecosystems and cropland-to-forest transitions adds a unique dimension to existing research. By examining Chengdu’s urbanization trajectory from 1990 to 2030 under different policy scenarios, this study offers insights into balancing urban expansion with biodiversity conservation in ecologically sensitive regions. Integrating the FLUS and InVEST models, it provides a scalable framework for other western Chinese cities, such as Chongqing and Xi’an, facing similar urbanization and ecological challenges.
The regional habitat quality module in the InVEST (Integrated Valuation of Ecosystem Services and Trade-offs) model integrates LULC data and biodiversity threat factors to generate regional habitat quality maps. The calculations are as follows [53]:
Q x j   =   H j 1 D x j z D x j z + k z
D x j = r = 1 R y = 1 Y r w r r = 1 R w r r y i r x y β x S j r
i r x y = 1 d x y d r m a x ( Linear attenuation )
i r x y = e x p 2.99 d x y d r m a x ( Exponential decay )
where Qxj: regional habitat quality of land-use type j at grid x; Hj: habitat suitability of land category j; Dxj: total threat level at grid x for habitat j; z: scaling constant (default z = 2.5); kz: half-saturation constant; R: number of threat factors; r: specific threat factor; Yr: number of raster cells for threat factor r; ry: the stress value of the threat factor; wr: weight of threat factor r (range: 0–1); irxy: the impact of threat factor r on each grid of the habitat; Sjr: sensitivity of habitat j to threat factor r; βx: the habitat’s resistance to interference; dxy: distance between raster cells x and y.
This was based on the actual situation of the study area and research results from similar regions [54,55,56,57,58], which have applied similar threat factors in different land-use types and provided detailed parameter calibration methods. For example, Seto et al. (2012) [7] used comparable threat factors in global urban expansion predictions and validated their effectiveness. Sharp et al. (2015) [33] provided a detailed description of threat factor selection and calibration processes within the InVEST model, serving as a crucial reference for our study. In this study, cropland, built-up area (both highly disturbed by human activities), and barren land (abandoned due to harsh environmental conditions or human destruction) were identified as threat factors. The maximum stress distance refers to the maximum distance within which each threat source can affect the study area. The weight represents the impact weight of the selected threat on habitat integrity, expressed as a relative value compared to other threat sources. The spatial decay type indicates the type of degradation caused by the threat source, determined by judging whether its impact changes linearly or exponentially with increasing distance (Table 7). The InVEST HQ module evaluates relative habitat quality at the landscape scale by integrating the habitat suitability of land-cover types and their sensitivity to anthropogenic threats. This approach aligns with broad-scale InVEST applications in China [12,38]. Following regional-scale applications, we assigned habitat suitability values (Table 8, Column 1) based on the general capacity of each land-use type to support biodiversity in Chengdu’s ecosystems, rather than species-specific habitats, as follows: Forest (1.0): Primary habitat for native forest-specialist species (e.g., giant panda, takin) in western mountains, providing optimal cover and connectivity [59]. Grassland (0.7): Key habitat for grassland birds and small mammals, though lower than forest due to fragmentation [13,55]. Water (0.6): Critical for aquatic biodiversity (fish, amphibians) and as movement corridors; lower than terrestrial habitats due to limited area [55,60]. Cropland (0.5): Provides resources for generalist species (e.g., pollinators, rodents), but unsuitable for specialists [7,40]. Built-up/Barren (0): Non-habitat areas with minimal biodiversity value [33]. The habitat quality module links land-use types with threat sources to assess regional habitat quality, with scores ranging from 0 to 1. Higher scores (closer to 1) indicate better habitat quality and more stable ecological structures [59,60].

2.3.4. Model Coupling Method

This study integrates the FLUS model with the InVEST model to establish a holistic framework for simulating land-use changes and assessing regional habitat quality dynamics under different policy scenarios in Chengdu. Specifically, the FLUS model first generates future land-use patterns for 2030 by analyzing historical land-use data (1990–2020) and multi-scenario drivers (e.g., GDP, population density, topography, ecological policies). The outputs of FLUS, such as built-up expansion, cropland reduction, and forest restoration, are then used as threat factors in the InVEST model to quantify the cumulative impacts of human activities on regional habitat quality.
The FLUS model integrates Artificial Neural Networks (ANNs), cellular automata (CA), and Markov chain methods to simulate land-use dynamics under three scenarios: natural development, ecological priority, and cropland protection. For example, in the ecological priority scenario, conversion to built-up land from cropland or forest is prohibited (conversion cost = 0), while the adaptive inertia coefficients (e.g., forest = 0.6) and neighborhood weights (e.g., water = 0.76) are adjusted to enhance the spatial aggregation of ecological land. The comprehensive stress of each threat factor on habitats was calculated using the InVEST model formulae (Equations (6)–(9)), and spatial distribution maps of regional habitat quality under different scenarios for 2030 were generated. This coupling framework enables a closed-loop analysis from land-use prediction to ecological effect assessment: the output of FLUS directly drives the input of InVEST, ensuring consistency between land-use dynamics and ecological impact assessment. This coupling approach not only overcomes the limitation of traditional single models that cannot simultaneously quantify land-use changes and ecological responses, it also provides a scientific basis for sustainable land-use planning in rapidly urbanizing regions.

3. Results and Analysis

3.1. Land-Use Transfer Matrix Analysis

According to Table 9, Chengdu’s cropland area underwent significant changes over the past 30 years, with frequent conversions between land-use types, driven by economic development and policy adjustments. Notably, forest and water contributed the largest inflows into cropland, at 305.78 km2 and 54.23 km2, respectively. Conversely, cropland losses primarily occurred through conversions to built-up area (1442.51 km2) and forest (765.56 km2).
From 1990 to 2000 (Table 10), cropland’s total outflow reached 775.09 km2, with 64.06% converted to forest (496.54 km2) and the remainder mainly to built-up area (262.35 km2) and water (13.21 km2). This trend aligns with China’s deepened reform and opening-up in the 1990s and the launch of the Western Development Strategy. As a pilot city for inland opening, Chengdu experienced accelerated industrialization and infrastructure development, leading to extensive cropland conversion. Inflows into forest increased by 556.81 km2, reflecting the initial impact of the Grain for Green Policy (e.g., the Regulations on Returning Farmland to Forest in 1999), although policy effects remained partial, with ecological land growth lagging behind urban expansion.
Between 2000 and 2010 (Table 11), cropland’s outflow further increased to 797.57 km2, while the inflow increased significantly (871.11 km2), primarily from forest conversion. The Policy of Returning Farmland to Forest showed significant effectiveness. The built-up inflow reached 602.64 km2, with a slower growth rate than the previous decade, indicating stricter land approval after the 2004 revision of the Land Administration Law. The forest inflow rose to 141.09 km2, directly linked to the 2003 Natural Forest Protection Program and post-2008 Wenchuan Earthquake ecological restoration projects. Reduced inflows into grassland (18.51 km2) and water (66.02 km2) reflected a shift from single-focused farmland-to-forest policies to comprehensive ecological governance, although land-use inefficiencies issues persisted locally.
From 2010 to 2020 (Table 12), cropland’s outflow surged to 1631.47 km2, with only 173.28 km2 inflow, exacerbating the net loss. The built-up inflow decreased to 598.45 km2, with further slowed growth. The forest inflow rose sharply to 1018.56 km2, consistent with the national strategy of Ecological Civilization Construction (2012) and Chengdu’s “Park City” initiative (proposed in 2018). The water body inflow increased to 29.32 km2, likely associated with sponge city construction and river/lake ecological restoration projects. The barren outflow dropped to 3.75 km2, indicating initial success of land reclamation and intensive use policies.

3.2. Spatiotemporal Analysis of Land Use in Chengdu

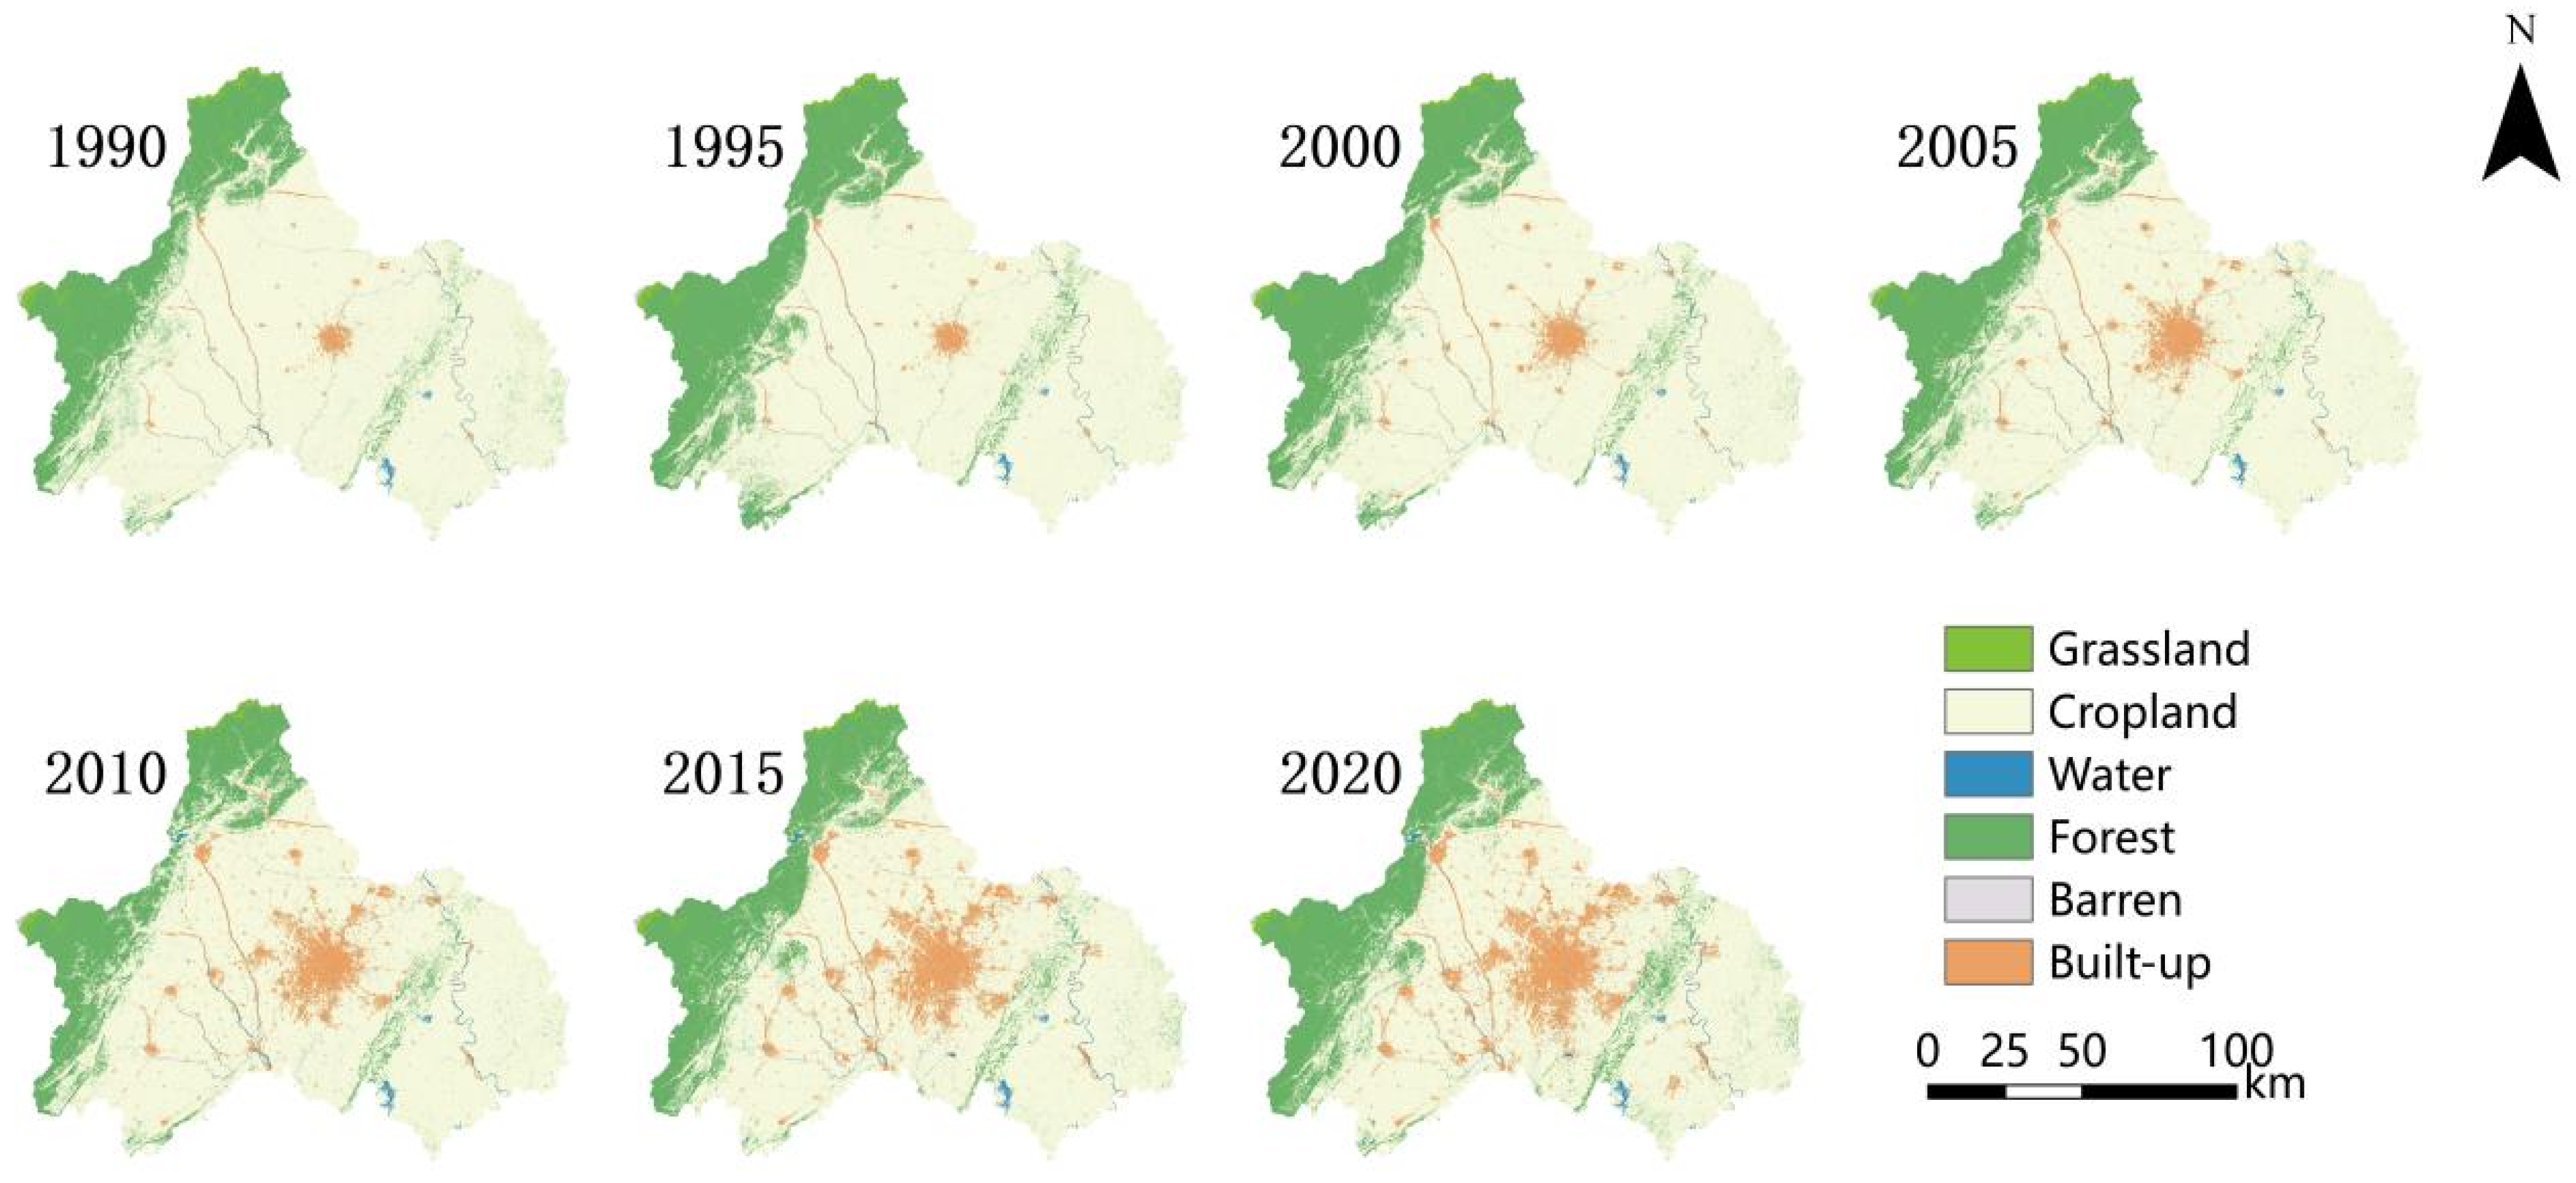
Based on the current land-use map of Chengdu (Figure 2), from 1990 to 2020, the built-up area expanded continuously, increasing from approximately 271.32 km2 in 1990 to 1460.79 km2 in 2020, with an average annual growth rate of 6.4%. It is primarily concentrated in central Chengdu, including the Jinniu, Wuhou, Jinjiang, Chenghua, and Qingyang districts, forming large, densely packed clusters. Cropland decreased significantly, with a net loss of 2268.81 km2, mainly in sub-urban plains areas such as Longquanyi and Shuangliu. Forest showed a dynamic change pattern of increase–decrease–increase over 30 years. From 1990 to 2000, benefiting from the construction of the western Sichuan shelterbelt system during the Eighth Five-Year Plan, the forest area increased by approximately 348.81 km2. Between 2000 and 2010, due to the national policy of abolishing agricultural tax, which boosted farmers’ enthusiasm for opening up wasteland for cropland, the forest area decreased by 718.61 km2 during this period. After 2010, driven by policy interventions, the forestland area recovered to 3746.53 km2 by 2020, concentrated in the western and northern regions (Pengzhou, Dujiangyan, Dayi, and Chongzhou), with scattered patches in Qionglai and Longquanyi. Water and grassland showed fluctuating changes: the water area increased slightly due to water conservancy projects and sponge city construction, extending along the Dujiangyan irrigation system and forming important networks via the Min and Tuojiang rivers through the urban area; grassland recovered locally due to farmland-to-grassland and ecological restoration policies, mainly in Dayi, Pengzhou, and Dujiangyan. Barren land gradually shrank from 7.37 km2 in 1990 to 4.89 km2 in 2020, reflecting the effectiveness of land reclamation and intensive use policies.
(1) 1990–2000: Initial Urbanization and Land-Use Transformation Stage
In 1990, Chengdu had limited built-up area, concentrated in the city center, with a narrow urban radiation range. Cropland dominated the surrounding areas, forming the primary land-use type. Grassland and forest were concentrated in the north, maintaining a natural ecological pattern, while water was sporadically distributed and barren land was minimal. By 2000, the built-up area expanded noticeably, indicating initial urbanization. Cropland decreased due to urban expansion, marking the beginning of non-agricultural conversion, although the landscape remained an agricultural–urban mix, with natural ecological lands (grassland, forest) largely intact. Water and barren land changed modestly.
(2) 2000–2010: Rapid Urbanization Driven by Economic Growth
After 2000, Chengdu’s economy accelerated, leading to a surge in built-up area by 2010, which spread outward and expanded the urban space significantly. Cropland continued to decline, as it was heavily converted to urban use, with peri-urban farmland rapidly transforming into built-up areas. Grassland and forest retained their scale in the north but faced indirect impacts from urban expansion at their margins. Water underwent local adjustments due to urban construction, and barren land further decreased, with land use tilting toward intensive urban development. This period was critical for urbanization reshaping the land-use structure, highlighting the primacy of urban construction needs in human–land relationships.
(3) 2010–2020: Deepened Urbanization and Land-Use Optimization
By 2020, the built-up area continued to expand, but at a slowing rate, as urban development shifted from “incremental expansion” to “stock optimization.” The pressure on cropland protection persisted, with surrounding farmland experiencing fragmented loss. Grasslands and forests in the northern region remained critical ecological barriers, maintaining relatively stable areas that reflected improved awareness of ecological conservation. Water was likely to gain increased attention in urban planning, serving dual functions of ecology and landscape. Barren land had nearly vanished, indicating more efficient utilization of land resources. At this stage, land use prioritized urban–rural coordination: while accommodating urban development, efforts were made to balance ecological protection—for example, the preservation of forests and grasslands provides an ecological foundation for sustainable urban growth.
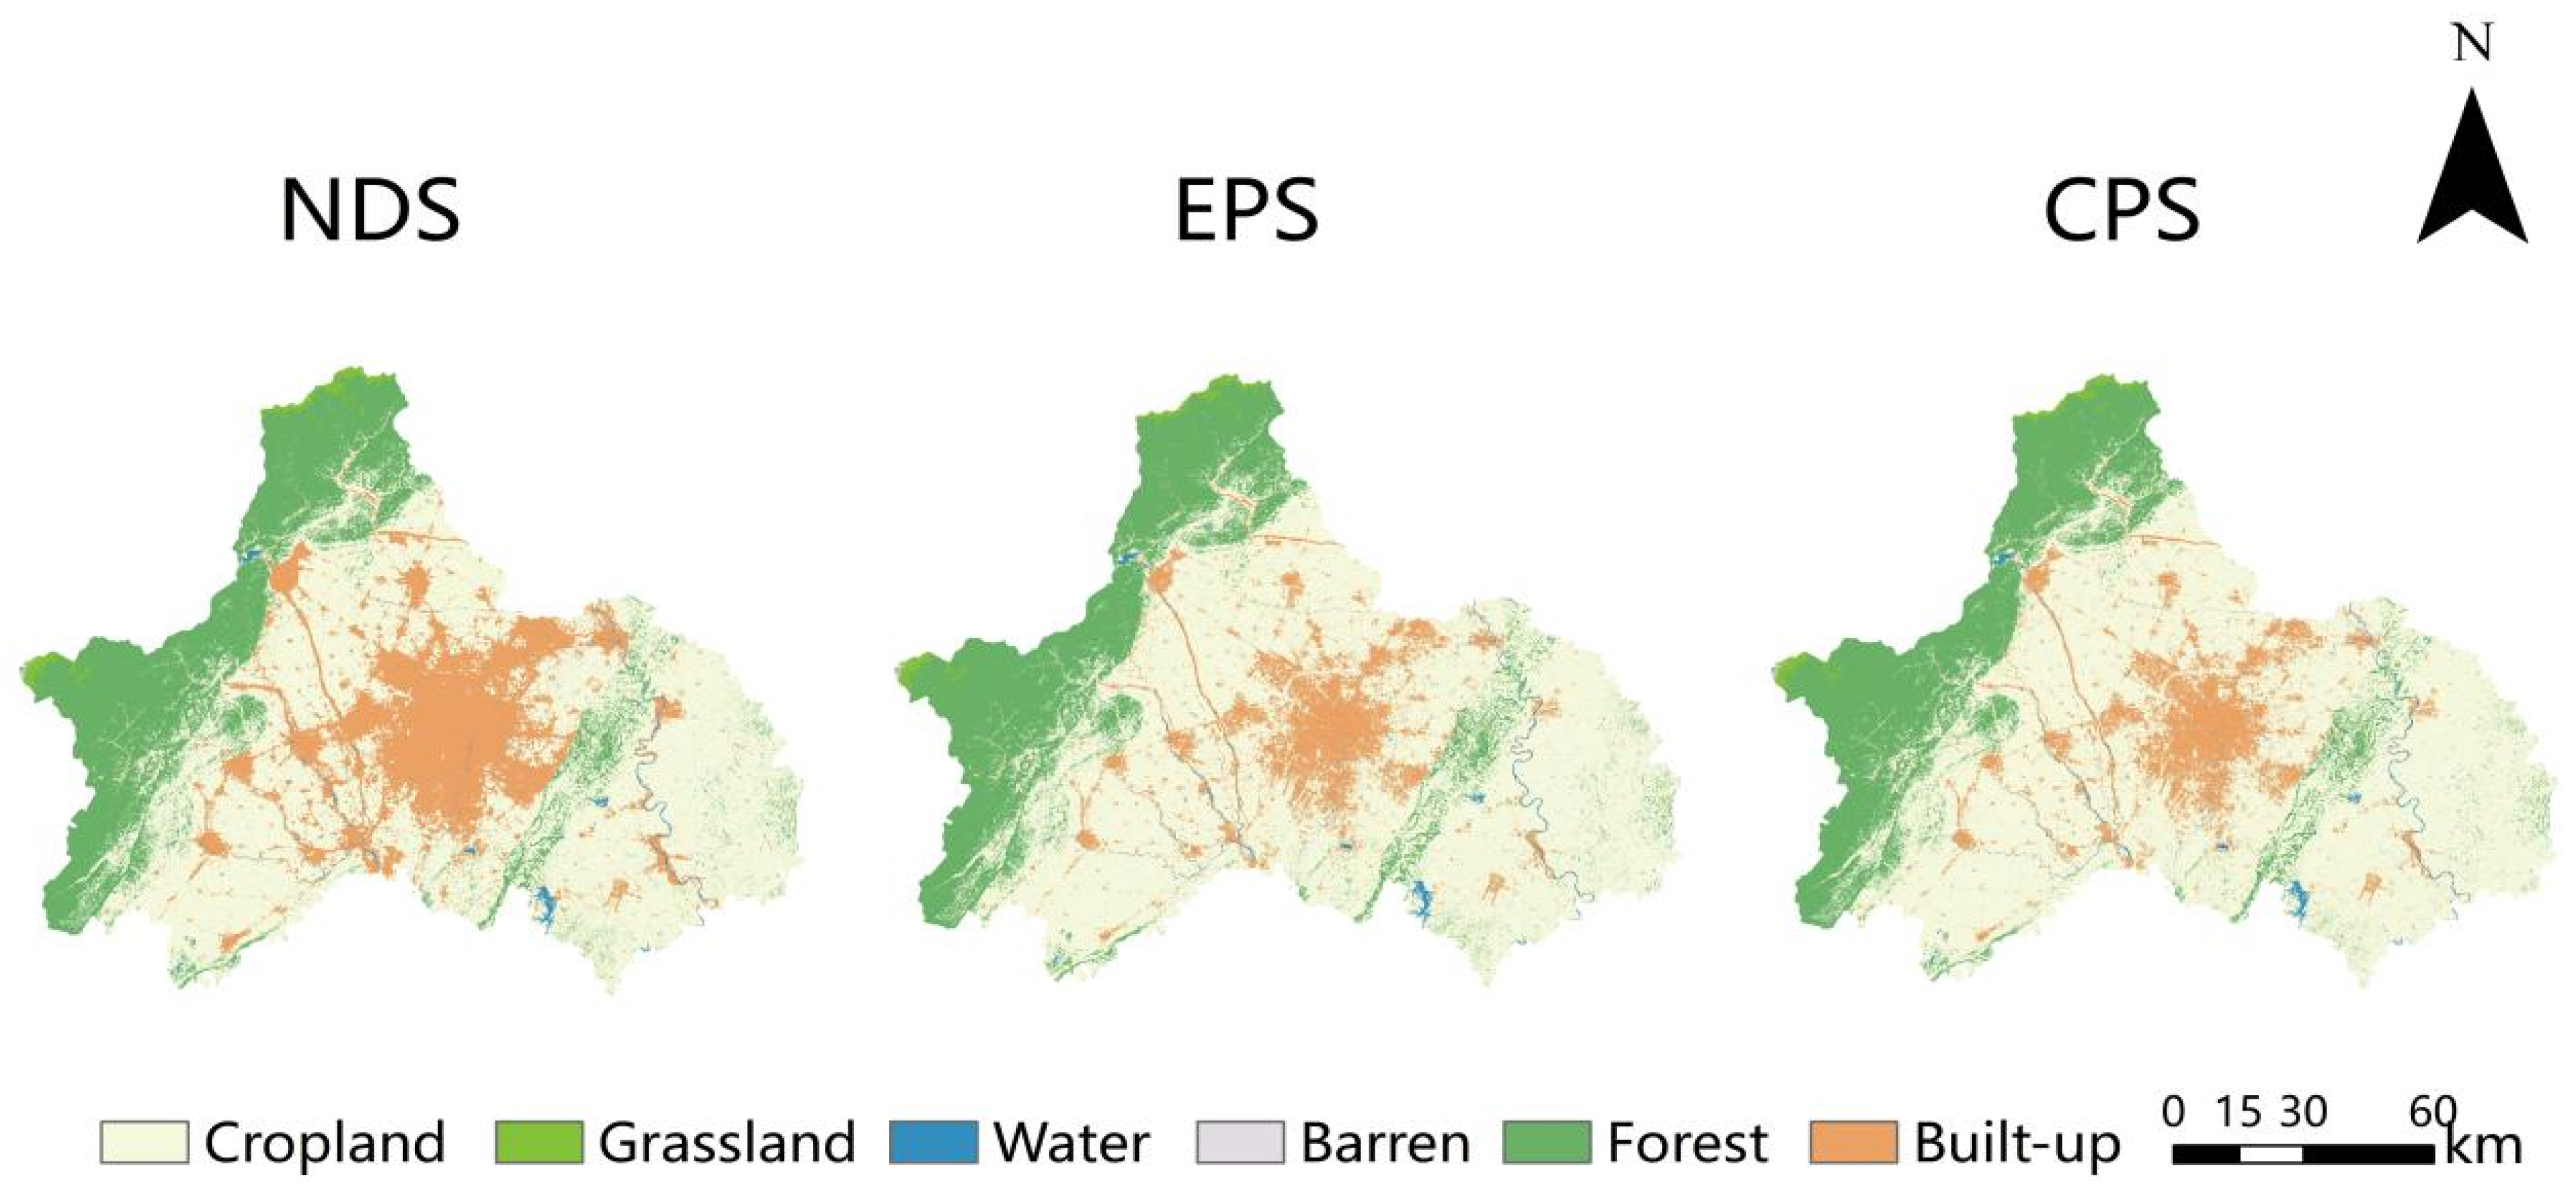
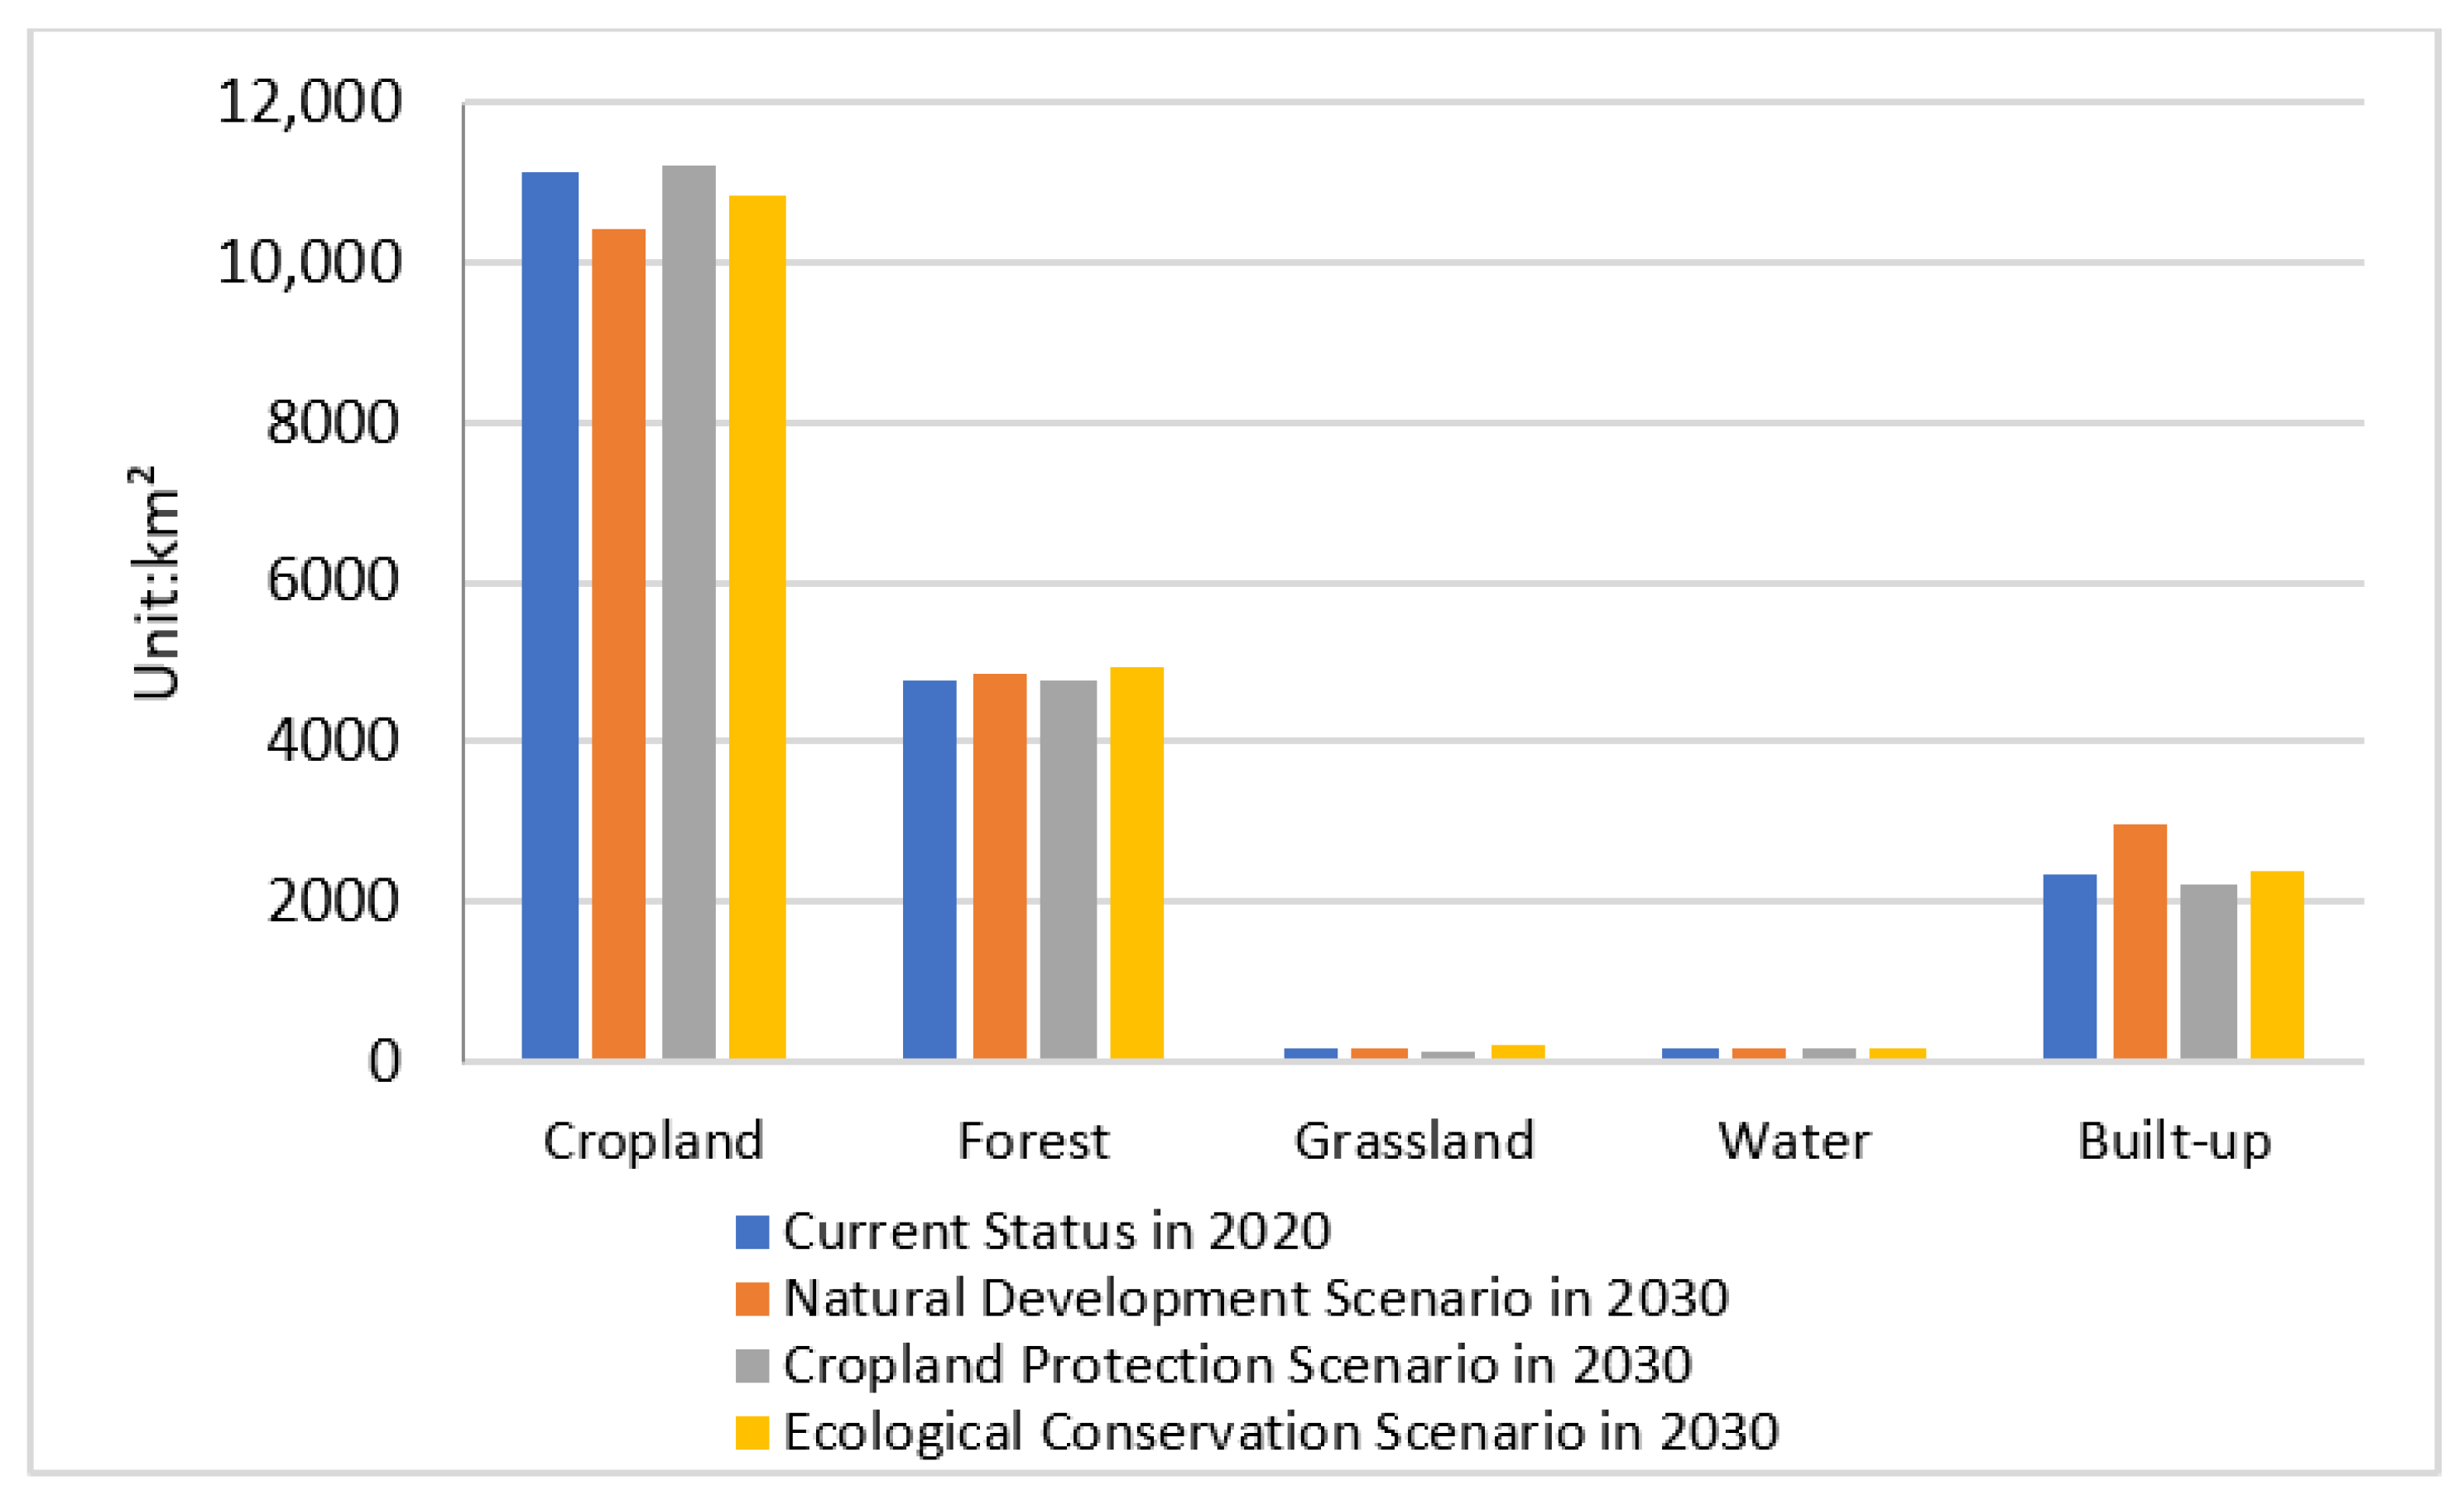
According to the scenario simulation results in Figure 3 and Figure 4, the cropland trends vary significantly across scenarios: (1) Natural Development Scenario: Cropland decreases sharply by 712.37 km2. (2) Ecological Priority Scenario: Cropland remains essentially stable, with minimal change. (3) Cropland Protection Scenario: Cropland increases by 106.62 km2. Grassland, water, and barren land show limited fluctuations, with no drastic changes. Built-up area in the natural development scenario expands radially from settlements, increasing by 637.27 km2. Overall, Chengdu’s land-use patterns exhibit distinct dynamics under different scenarios: the cropland protection and ecological priority policies have significant positive effects on farmland conservation, while natural urban expansion drives rapid built-up growth.

3.3. Analysis of Regional Habitat Quality Changes in Chengdu

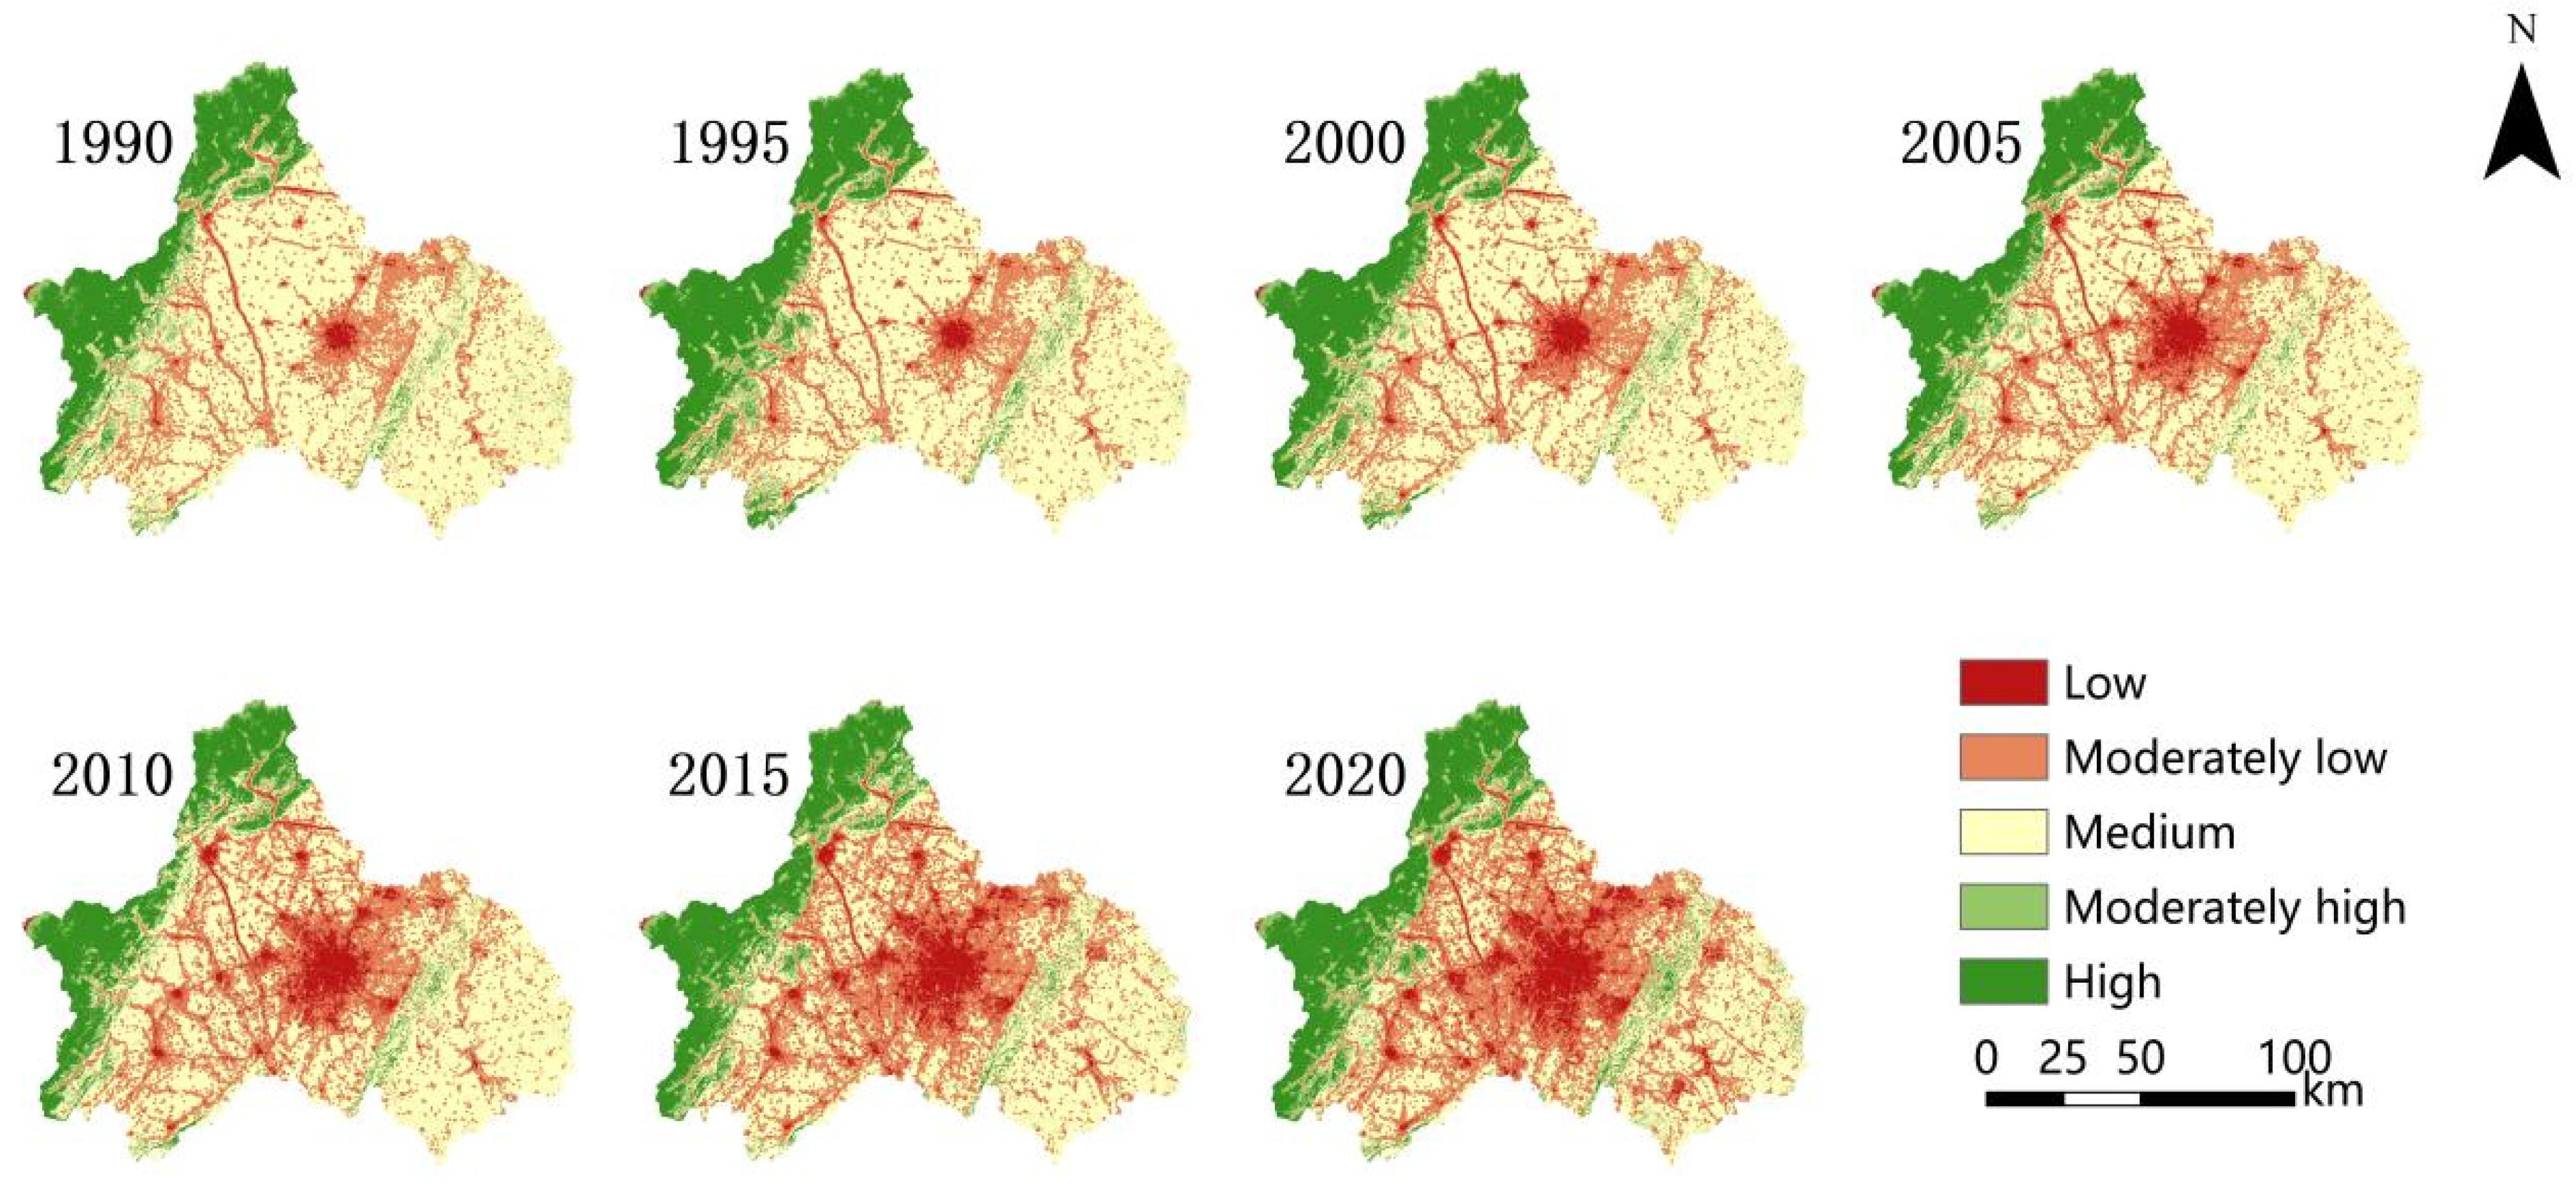
Using the regional habitat quality module in InVEST and Chengdu’s 1990–2020 land-use data, we classified regional habitat quality into five classes using the equal-interval method: low (0–0.2), moderately low (0.2–0.4), medium (0.4–0.6), moderately high (0.6–0.8), and high (0.8–1). As shown in 
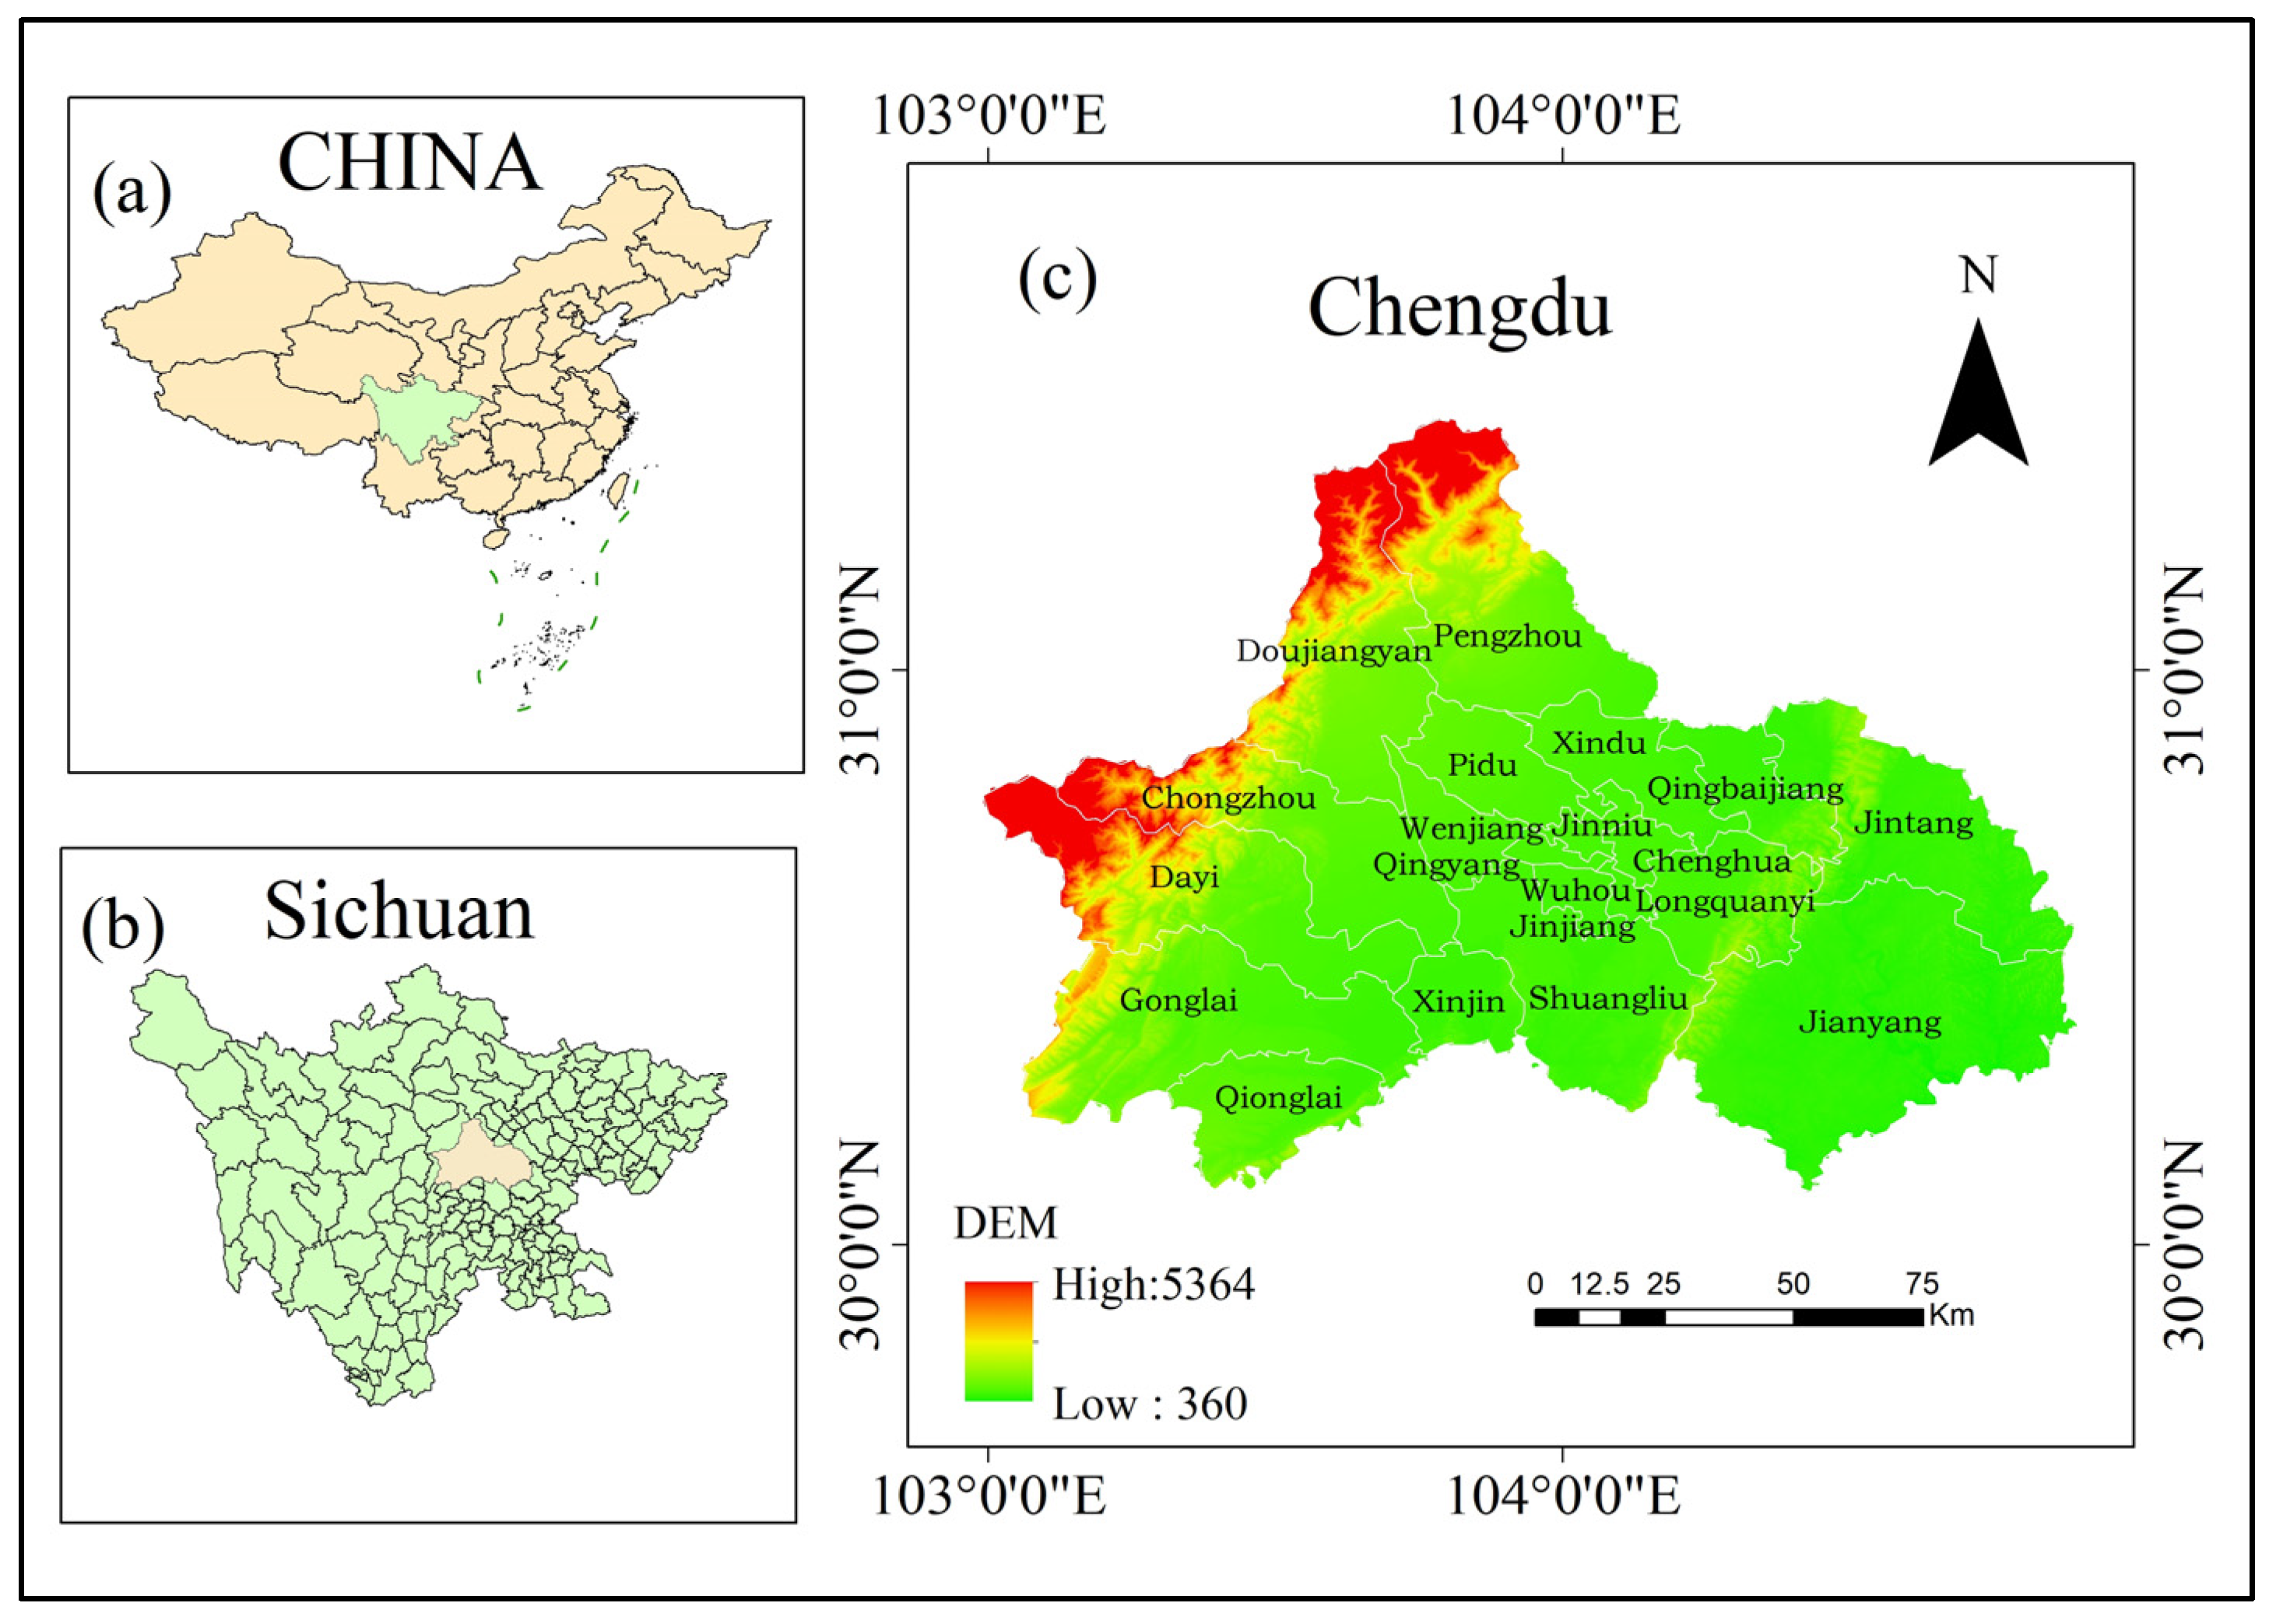
Figure 5, the spatial pattern of regional habitat quality in Chengdu exhibits a pronounced west-to-east gradient of “superior in the west, inferior in the east,” closely linked to the coupling of regional topography, land-use types, and human activity intensity. The western Longmen Mountain Range and hilly areas (Chongzhou, Dayi, Qionglai, Pengzhou, Dujiangyan)—serving as ecological barriers for the Chengdu Plain—are dominated by forest (38.7%) and grassland (12.5%), forming complex mountain ecosystems with high landscape connectivity and biodiversity support. For example, the Longxi–Hongkou Nature Reserve in Dujiangyan, a core giant panda habitat, has 23.6% of its area in high-quality habitat (0.8–1), demonstrating the direct role of natural vegetation in sustaining regional habitat quality. In stark contrast, the central–eastern plains (urban districts like Jinniu, Qingyang, Wuhou, and Jinjiang) have a built-up coverage of 65.2%, with the regional habitat quality generally below 0.4, confirming the stress of artificial landscapes on natural habitats.
From 1990 to 2020, the mean regional habitat quality indices were 0.5242, 0.5406, 0.5215, 0.5044, 0.4778, 0.4720, and 0.4708, showing an overall downward trend—a result of land-use transformation and ecosystem service trade-offs. Table 13 shows the following:
1990–1995 Brief Improvement Period: The index rose from 0.5242 to 0.5406, driven by the construction of the western Sichuan shelter forest system during the “Eighth Five-Year Plan,” which increased the forest area by 348.81 km2. Notably, the initial restoration of the Longquan Mountain Ecological Belt led to a 29.3% increase in moderately high-quality habitats (0.6–0.8), illustrating that regional ecological projects can improve local regional habitat quality in the short term.
1995–2010 Rapid Degradation Period: With the Western Development Strategy, Chengdu’s GDP grew at 15.3% annually, and its built-up area expanded by 53.43 km2/year, primarily converting cropland (68%) and forest (22%). The Tianfu New Area exemplifies this: between 2005 and 2010, the built-up area there increased by 300%, coinciding with a 37% drop in the regional habitat quality index.
2010–2020 Slowing Adjustment Period: Under the “Ecological City” strategy, Chengdu delineated 13 ecological redlines, increased green coverage in built-up areas from 38% to 45%, and restored 11,600 hectares of wetlands in the urban ring ecological zone, significantly improving local habitats.
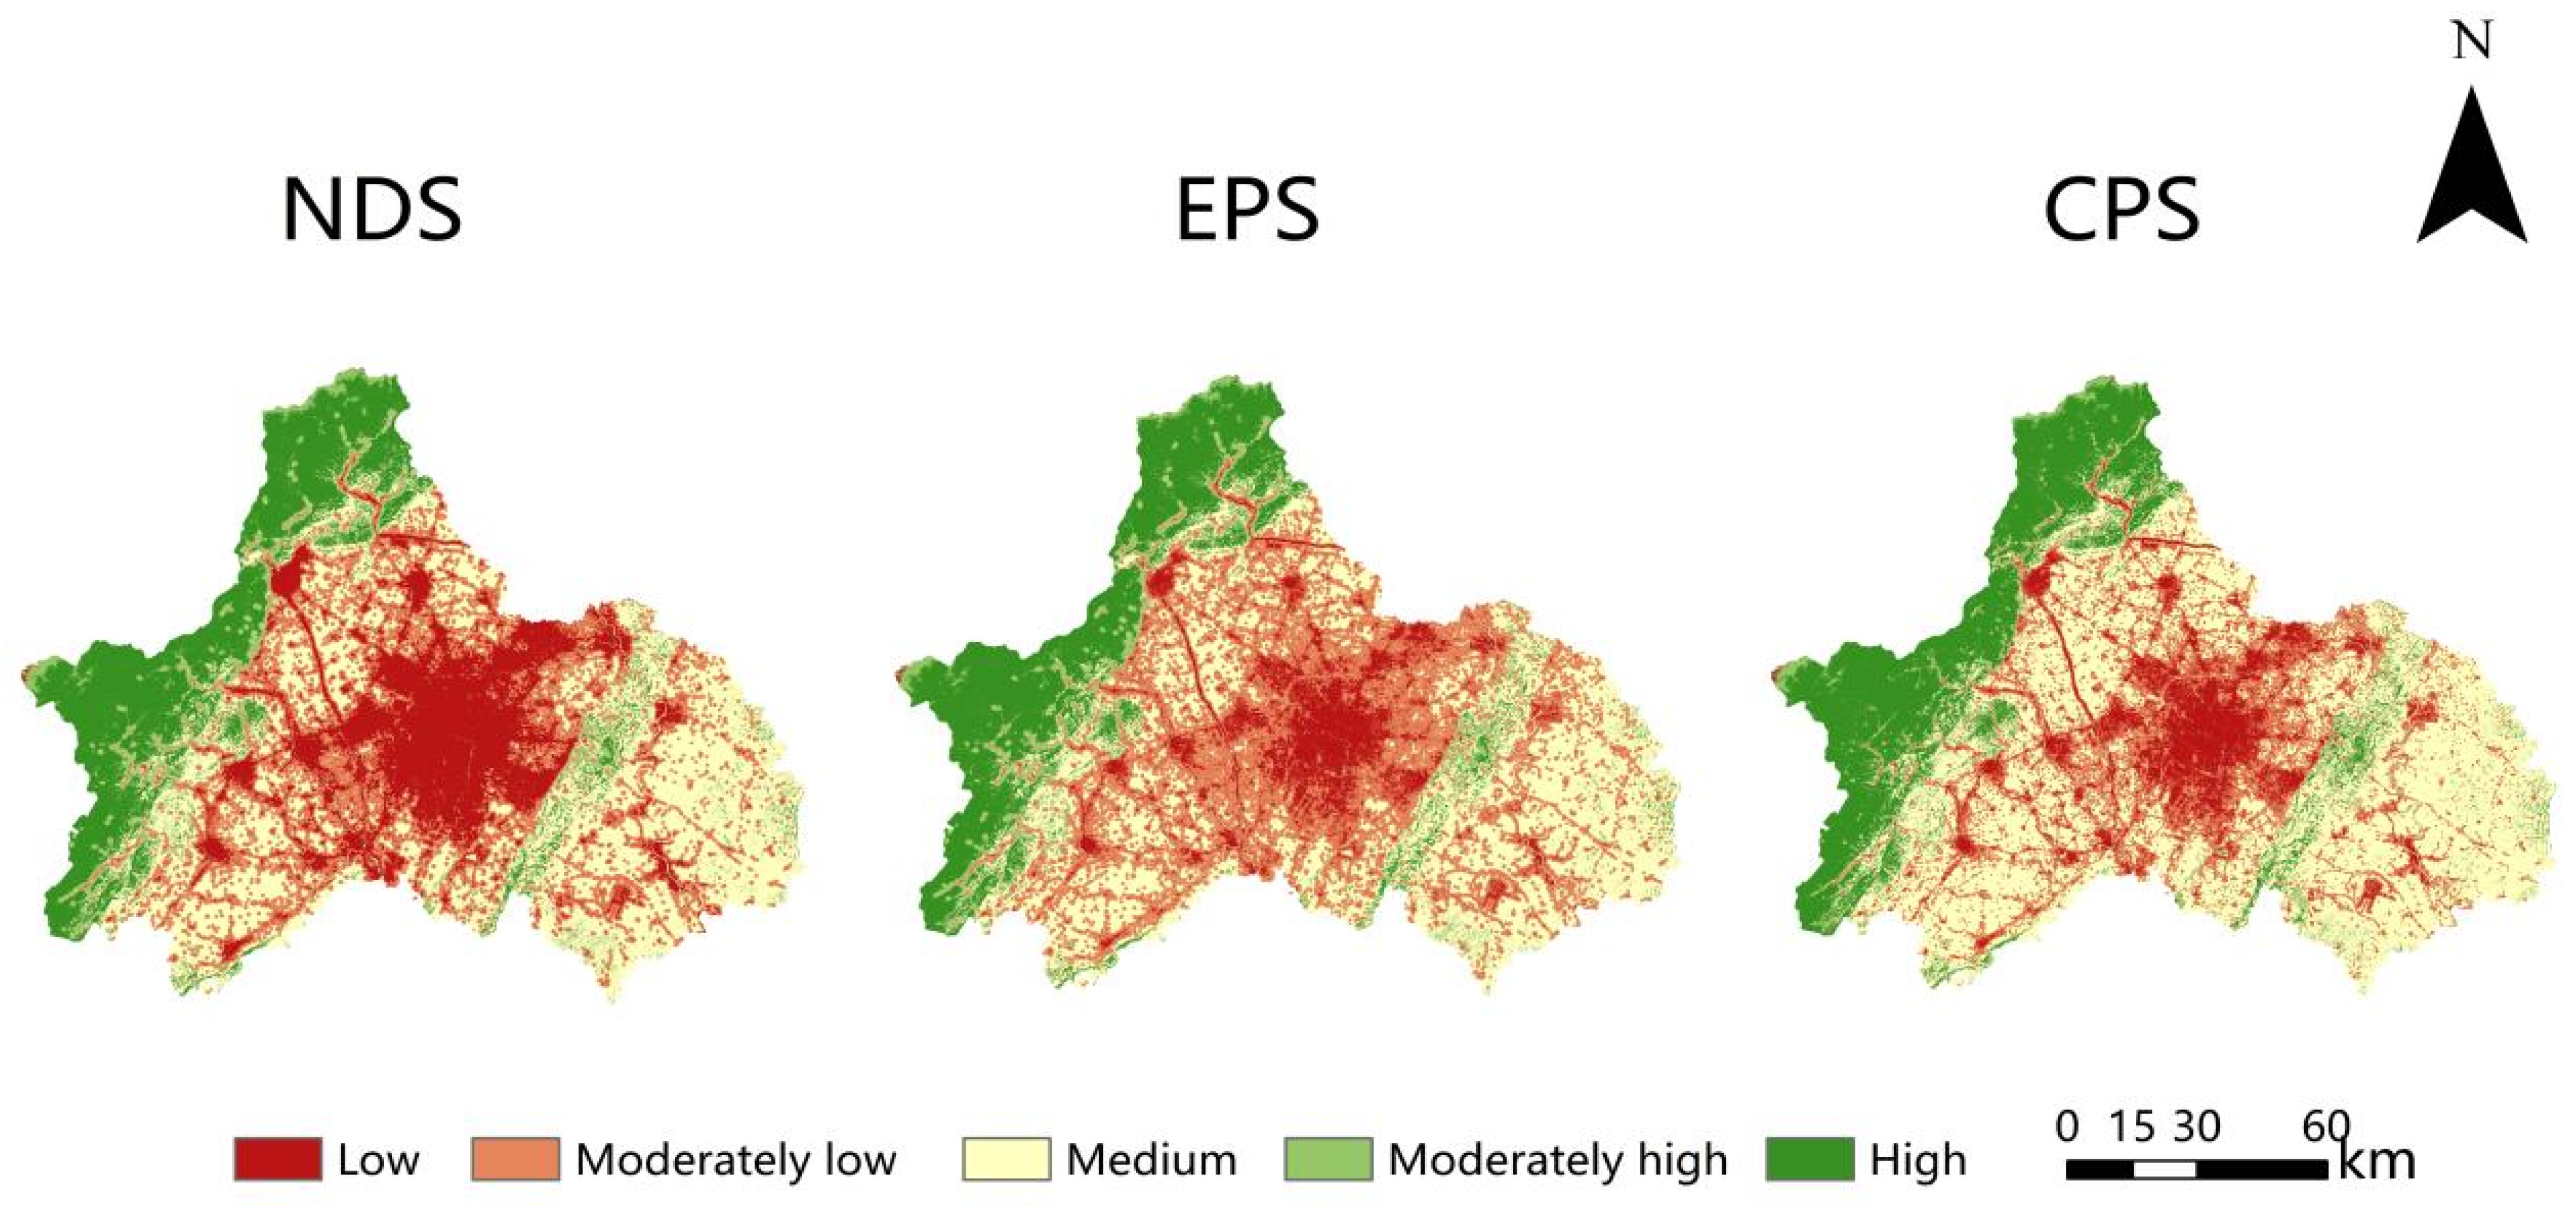
Under the natural development, ecological priority, and cropland protection scenarios, the mean regional habitat quality indices for 2030 are 0.4442, 0.4990, and 0.4712, respectively (Figure 6, Table 14). The ecological priority scenario yields the highest quality, with increases compared to 2020 driven by reductions in moderately high-quality habitats (−347.73 km2) and increases in high-quality habitats (+382.84 km2). Continuous improvements occur in the Xiling Snow Mountain–Qingcheng Mountain Ecological Belt and Longquan Mountain Forest Belt, forming a “ecological core” in western Chengdu that diffuses eastward via river corridors (Min and Tuojiang rivers), increasing moderately high-quality habitats (0.6–0.8) in the central city by 12% and alleviating the urban heat island effect.
In the natural development scenario, the lowest mean index is driven by a 1404.31 km2 increase in low-quality habitats, which expand “branch-like” along metro lines and highways (e.g., within 5 km of the Chengdu–Dujiangyan and Chengdu–Wenjiang–Qionglai routes, low-quality habitats grew by 45% compared to 2020), forming typical “transport corridor stress zones.”
The cropland protection scenario shows a slight index increase, with reductions in moderately low-quality habitats (−2024.52 km2) and increases in medium-quality habitats (+2022.87 km2). The regional habitat quality changes minimally in the core urban area inside the ring expressway, but medium-quality habitats rise significantly in peripheral cropland zones (e.g., Dayi Plain, Xinjin farmland), forming a three-tier gradient of “urban–farmland–mountain” habitats—evidence of positive agricultural ecosystem intervention through cropland protection policies.

3.4. Response of Regional Habitat Quality to Land-Use Changes in Chengdu
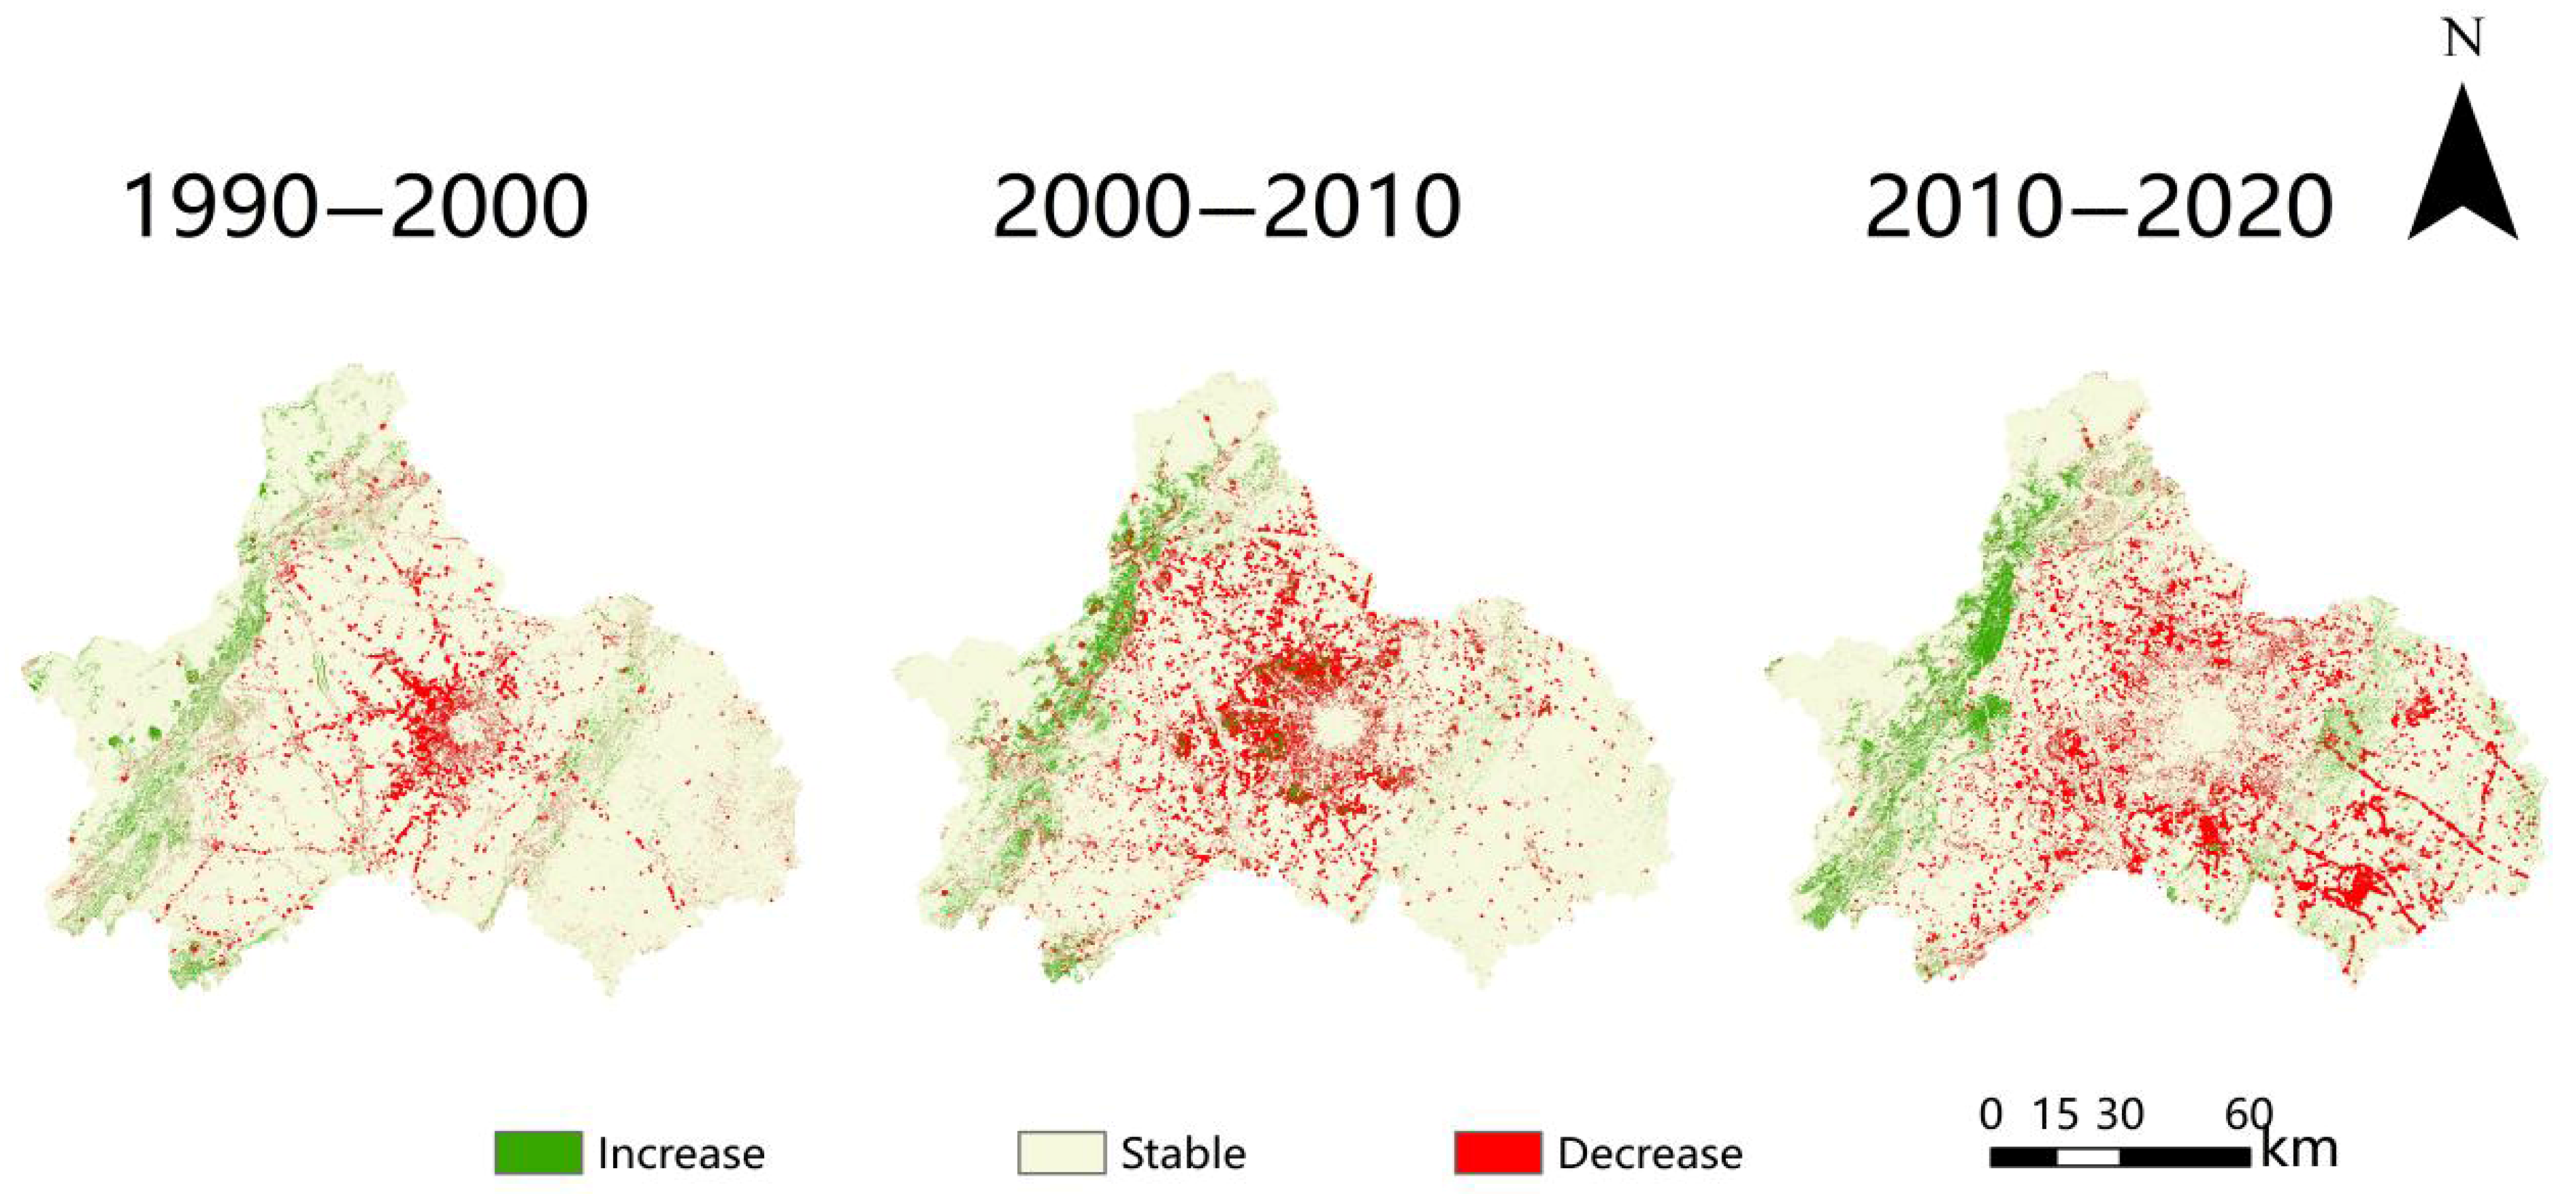
As shown in Figure 7, from 1990 to 2000, land use in Chengdu was dominated by built-up expansion in the central urban area. Core districts like Jinniu and Wuhou saw significant regional habitat quality declines due to increased industrial and residential land demands. Conversely, western undeveloped areas (e.g., southern Pujiang County) experienced localized improvements from natural expansion of forest and grassland. Between 2000 and 2010, driven by the Western Development Strategy and agricultural tax relief, Chengdu’s economy grew at 12.4% annually, with urbanization rates rising from 34.8% to 52.6%. This period witnessed city-wide development, with 68.7% of the area showing declining regional habitat quality. From 2010 to 2020, following the implementation of the Chengdu Ecological Civilization Construction Plan, land-use strategies shifted to “western conservation–eastern intensification”: western regions like Dujiangyan and Pengzhou added 879.71 km2 of forest through park city initiatives and farmland-to-forest projects, while eastern Jianyang saw localized habitat degradation due to Tianfu International Airport’s construction.
Table 15 shows that positive contribution rates indicate land-use changes detrimental to regional habitat quality, while negative rates signal beneficial effects, revealing the ecological impact mechanisms of different land conversions:
(1) Positive Ecological Effects:
Cropland-to-forest conversion (contribution rate −7.67%) was the most significant ecological gain factor, directly linked to three rounds of the “Grain for Green and Grassland Program” (1999–2003 pilot, 2007 consolidation, and 2014 expansion). Although barren-to-forest conversion had a small absolute contribution (−0.0041%), it effectively curbed desertification in ecologically fragile areas like the Longmen Mountain Fault Zone, providing marginal ecological benefits.
(2) Negative Ecological Effects:
Cropland loss itself (18.68%) and conversion to built-up area (12.59%) were the primary drivers of habitat degradation. The former reflects trade-offs between food security and ecological protection: a net loss of 1458.18 km2 of cropland from 2010 to 2020, with 40% converted to construction, caused annual losses of CNY 1.27 billion in farmland ecosystem service values (carbon sequestration, biological control, etc.). The high contribution rate of cropland-to-built-up conversion (12.59%) highlights the structural damage of urbanization to ecosystems.
(3) Marginal Effect Disparities in Land Conversions:
Grassland–cropland conversions exhibited “asymmetric ecological impacts”: conversion of cropland to grassland contributed only 0.0235% to degradation, while conversion of grassland to cropland brought a 0.0059% improvement. This reflects that grasslands in the Chengdu Plain are mostly low-coverage secondary meadows with lower ecological value than cultivated farmland. The “bidirectional negative effects” of water body conversions are concerning—both water body–built-up (0.1945%) and water body–cropland (0.1578%) conversions led to habitat degradation, indicating the irreversibility of water ecosystem damage and the need to strengthen protection redlines for rivers like the Min and Tuojiang.

4. Discussion

This study employs Chengdu as a case study to systematically uncover the complex relationships between land-use changes and regional habitat quality dynamics in the context of rapid urbanization. First, this study advances the integration of the FLUS and InVEST models, offering a robust framework for simulating land-use changes and quantifying regional habitat quality dynamics under policy scenarios. The following highlights the core innovations and their practical implications:
(1)
Enhanced Model Coupling for Policy-Driven Simulations
The FLUS-InVEST coupling explicitly links land-use projections with regional habitat quality assessments, enabling scenario-based policy analysis. Unlike traditional single-model approaches, this framework allows for the following: Threat factors in the InVEST module (e.g., urban expansion, cropland conversion) are derived from FLUS simulations, ensuring consistency between land-use dynamics and ecological impacts. This approach is particularly valuable for regions like Chengdu, where rapid urbanization and ecological protection require data-driven policy tools. The model’s ability to simulate trade-offs between urban development and habitat conservation aligns with the Chengdu Ecological Restoration Plan (2021–2035) [47].
(2)
Policy Relevance: From Simulation to Implementation
This study’s findings directly inform ecological governance: We found a 6.0% increase in regional habitat quality (HQI) and expansion of high-grade habitats (HQI > 0.8) in the western Longmen Mountain Range by 328.3 km2, forming a critical regional ecological barrier. Cropland stability was maintained while balancing urban expansion, demonstrating the feasibility of sustainable development in peri-urban zones. These scenarios have been integrated into Chengdu’s territorial space planning, illustrating how the FLUS-InVEST framework can translate scientific insights into actionable policies. Similar applications are feasible in other rapidly urbanizing regions, such as the Pearl River Delta [12] or the Basin along the Yangtze River in Anhui Province [38].
However, limitations exist. First, in this study, due to limitations in data availability, the land-use types could not be further subdivided, failing to reflect ecosystem heterogeneity. Instead, this study focuses on the assessment of regional habitat quality at the regional scale and is insufficient for addressing species-specific responses. Although the InVEST regional habitat quality module is widely used, its general threat source parameters cannot capture species-specific responses to land-use changes. The current analysis lacks explicit species- or ecosystem-specific parameters for habitat suitability, as emphasized by Quinn et al. [40]. For instance, cropland is modeled as a potential habitat for pollinators like Apis and Bombus based on regional ecological data [40], but its suitability for forest obligates remains low due to its limited ecological value compared to natural ecosystems. Our assessment used generalized habitat suitability values due to regional-scale data constraints. Future work should implement the following: (1) Integration of High-Resolution Ecological Covariates: Leverage 10–30 m resolution remote sensing (e.g., Sentinel-2, Landsat 9) to differentiate habitat subtypes (e.g., primary vs. secondary forests, natural riparian vs. constructed wetlands). Coupling these with field-validated species distribution models (SDMs) would refine threat impact quantifications. (2) Species-Specific Parameterization of Habitat Requirements: Calibrate habitat suitability and threat sensitivity coefficients for indicator taxa (e.g., forest-dependent Ailuropoda melanoleuca [giant panda], wetland-foraging waterfowl) using empirical data from Chengdu’s biodiversity monitoring programs. Implementing a multi-taxon framework (e.g., mammals, avifauna, amphibians) would capture taxon-specific responses to anthropogenic stressors. (3) Dynamic Policy–Scenario Modeling: Develop adaptive governance simulations using agent-based models (ABMs) to test real-time ecological redline adjustments based on habitat degradation triggers. Quantify ecosystem service trade-offs (e.g., cropland conservation subsidies vs. forest restoration costs) through integrated InVEST modules.

5. Conclusions

This study takes Chengdu as the case study area, employing the FLUS (Future Land Use Simulation) model to simulate urban land use under three future scenarios and integrating it with the InVEST model to quantitatively assess trends in regional habitat quality changes in Chengdu under these scenarios. The results show the following:
First, from 1990 to 2020, the cropland area exhibited an overall downward trend, with the steepest decline occurring between 2010 and 2020. Built-up area expanded significantly during 2010–2020, while forest increased in 1990–2000 and 2010–2020, following a brief reduction in 2000–2010. In contrast, grassland, water, and barren land showed relatively stable changes. Land-use dynamics varied notably across scenarios: under the business-as-usual scenario, cropland continued to decrease, while forest remained largely stable; the ecological priority scenario saw no net change in cropland but an increase in forest; and the cropland protection scenario successfully maintained the cropland quantity.
Second, different land-use transitions influenced regional habitat quality differently across periods. Overall, Chengdu’s regional habitat quality declined from 1990 to 2020, albeit with temporal variations: regional habitat quality degradation from 1990 to 2000 was concentrated in the Jinniu, Wuhou, Qingyang, Chenghua, and Jinjiang districts; from 2000 to 2010, most areas except for Jianyang City and Jintang County in the east experienced declines; however, from 2010 to 2020, the rate of degradation slowed due to park city initiatives and enhanced ecological protection, with improvements observed in western regions such as Chongzhou, Dayi, Qionglai, Pengzhou, and Dujiangyan.
Additionally, the response of regional habitat quality to land-use transitions revealed that cropland-to-forest conversion made the highest positive contribution to improving Chengdu’s regional habitat quality between 1990 and 2020, while cropland loss and cropland-to-construction conversion were the primary drivers of degradation. Transitions from all land uses to forest were conducive to regional habitat quality improvement. These findings highlight the need to rationally plan ecological redlines and adhere to ecological development principles in future urban planning.

Author Contributions

Conceptualization, Z.L. and C.Y.; methodology, Z.L. and Y.L.; software, Y.Y.; validation, Z.L., C.Y. and Y.Y.; formal analysis, Y.S.; investigation, Y.Q.; resources, Y.L.; data curation, Z.L.; writing—original draft preparation, Z.L.; writing—review and editing, Z.L. and C.Y.; visualization, Z.L. All authors have read and agreed to the published version of the manuscript.

Funding

This research was funded by the Key R&D Project of Sichuan Provincial Department of Science and Technology (2020YFG0146). The fund is from the Sichuan Provincial Department of Science and Technology, and the funded project is the 2020 Key Research and Development Project in the High-Tech Field entitled “Research on Key Technologies for Dynamic Detection of National Land Feature Status Based on Remote Sensing Images”. The undertaking unit of the funded project is the Key Laboratory of Southwest Land Resource Evaluation and Monitoring, Ministry of Education, Sichuan Normal University.

Data Availability Statement

All data used in this study are publicly available from the cited sources, and further inquiries can be directly directed to the corresponding author.

Acknowledgments

The authors acknowledge the data support from the “National Earth System Science Data Center, National Science & Technology Infrastructure of China (http://www.geodata.cnaccessed on 18 April 2025).” We are greatly grateful for the support of the funds and projects. We are also grateful for the anonymous reviewers and their insights and critical review of the manuscript.

Conflicts of Interest

The authors declare no conflicts of interest.

References

  1. Yang, R.; Wu, Q.; Yang, Z.; Yang, S. Study on Spatio-Temporal Changes of Land Use Sustainability in Southwestern Border Mountainous Provinces in Recent 20 Years Based on Remote Sensing Interpretation: A Case Study in Yunnan Province, China. Land 2022, 11, 1957. [Google Scholar] [CrossRef]
  2. Lv, C.; Lian, A.; Wang, Z.; Jia, T.; Sun, X.; Dong, R. A Spatiotemporal Pattern Analysis of High-Frequency Land-Use Changes in the Guangdong–Hong Kong–Macao Greater Bay Area, from 1990 to 2018. Land 2023, 12, 102. [Google Scholar] [CrossRef]
  3. Tavares, A.O.; Pato, R.L.; Magalhães, M.C. Spatial and temporal land use change and occupation over the last half century in a peri-urban area. Appl. Geogr. 2012, 34, 432–444. [Google Scholar] [CrossRef]
  4. Dewan, A.M.; Yamaguchi, Y.; Rahman, M.Z. Dynamics of land use/cover changes and the Analysis of Landscape fragmentation in Dhaka Metropolitan, Bangladesh. GeoJournal 2012, 77, 315–330. [Google Scholar] [CrossRef]
  5. Yang, C.; Zhao, Z.; Ren, X.; Ni, J.; Wang, Q. The analysis of the green vegetation cover change in western Sichuan based on GIS and remote sensing. Shengtai Xuebao/Acta Ecol. Sin. 2012, 32, 632–640. [Google Scholar] [CrossRef]
  6. Chen, S.; Huang, Q.; Muttarak, R.; Fang, J.; Liu, T.; He, C.; Liu, Z.; Zhu, L. Updating global urbanization projections under the Shared Socioeconomic Pathways. Sci. Data 2022, 9, 137. [Google Scholar] [CrossRef] [PubMed]
  7. Seto, K.C.; Güneralp, B.; Hutyra, L.R. Global forecasts of urban expansion to 2030 and direct impacts on biodiversity and carbon storage. Proc. Natl. Acad. Sci. USA 2012, 109, 16083–16088. [Google Scholar] [CrossRef]
  8. Johnson, M.D.; Arcata, C. Habitat quality: A brief review for wildlife biologists. Trans.-West. Sect. Wildl. Soc. 2005, 41, 31. [Google Scholar]
  9. Hack, J.; Molewijk, D.; Beißler, M.R. A Conceptual Approach to Modeling the Geospatial Impact of Typical Urban Threats on the Habitat Quality of River Corridors. Remote Sens. 2020, 12, 1345. [Google Scholar] [CrossRef]
  10. Newbold, T.; Hudson, L.N.; Hill, S.L.L.; Contu, S.; Lysenko, I.; Senior, R.A.; Börger, L.; Bennett, D.J.; Choimes, A.; Collen, B.; et al. Global effects of land use on local terrestrial biodiversity. Nature 2015, 520, 45–50. [Google Scholar] [CrossRef]
  11. Shi, S.; Zhi, L.; Chun, H.; Wen, L. Evaluating the effects of urban expansion on natural habitat quality by coupling localized shared socioeconomic pathways and the land use scenario dynamics-urban model. Ecol. Indic. 2020, 112, 106071. [Google Scholar] [CrossRef]
  12. Liu, W.; Zhan, J.; Zhao, F.; Wang, C.; Chang, J.; Kumi, M.A.; Leng, M. Scale effects and time variation of trade-offs and synergies among ecosystem services in the Pearl River Delta, China. Remote. Sens. 2022, 14, 5173. [Google Scholar] [CrossRef]
  13. Wang, B.; Cheng, W. Effects of land use/cover on regional habitat quality under different geomorphic types based on InVEST model. Remote. Sens. 2022, 14, 1279. [Google Scholar] [CrossRef]
  14. Chu, L.; Sun, T.; Wang, T.; Li, Z.; Cai, C. Evolution and Prediction of Landscape Pattern and Habitat Quality Based on CA-Markov and InVEST Model in Hubei Section of Three Gorges Reservoir Area (TGRA). Sustainability 2018, 10, 3854. [Google Scholar] [CrossRef]
  15. Aneseyee, A.B.; Noszczyk, T.; Soromessa, T.; Elias, E. The InVEST habitat quality model associated with land use/cover changes: A qualitative case study of the Winike Watershed in the Omo-Gibe Basin, Southwest Ethiopia. Remote. Sens. 2020, 12, 1103. [Google Scholar] [CrossRef]
  16. Ma, R.; Fu, Y.; Liu, M.S. Study on Land Use Change Prediction and Landscape Pattern Evolution Based on CA-MARKOV Model: A Case Study of Chengdu. Green Sci. Technol. 2023, 25, 245–252. [Google Scholar] [CrossRef]
  17. Chengdu Institute of Urban Planning and Design. Chengdu Livable and Beautiful Park City Plan (2018–2035). Chengdu Institute of Urban Planning and Design, 2019. Available online: https://www.cdipd.org.cn/index.php?m=content&c=index&a=show&catid=85&id=88 (accessed on 18 June 2025).
  18. Sun, Y.Y.; Li, Y.X.; Jiang, H.L.; Zhou, Y.X. Prediction of Land Use Change Based on Markov and GM (1,1) Models. J. Agric. Resour. Environ. 2016, 33, 289–296. [Google Scholar] [CrossRef]
  19. Ma, T.; Li, X.; Bai, J.; Ding, S.; Zhou, F.; Cui, B. Four decades’ dynamics of coastal blue carbon storage driven by land use/land cover transformation under natural and anthropogenic processes in the Yellow River Delta, China. Sci. Total. Environ. 2019, 655, 741–750. [Google Scholar] [CrossRef]
  20. Xu, G.C.; Kang, M.Y.; Li, Y.F. Land Use Change Prediction Method Based on MLP-ANN and Markov Chain: A Case Study of Xilingol League. Ecol. Environ. Sci. 2010, 19, 2386–2392. [Google Scholar] [CrossRef]
  21. Hamad, R.; Balzter, H.; Kolo, K. Predicting Land Use/Land Cover Changes Using a CA-Markov Model under Two Different Scenarios. Sustainability 2018, 10, 3421. [Google Scholar] [CrossRef]
  22. Yue, D.X.; Yang, C.; Jiang, B.H.; Guo, J.J.; Xu, X.F. Spatio-temporal pattern prediction of the biocapacity in the Shiyang River Basin on the basis of the CA-Markov model. Acta Ecol. Sin. 2019, 39, 1993–2003. [Google Scholar] [CrossRef]
  23. Abdelsamie, E.A.; Mustafa, A.-R.A.; El-Sorogy, A.S.; Maswada, H.F.; Almadani, S.A.; Shokr, M.S.; El-Desoky, A.I.; de Larriva, J.E.M. Current and Potential Land Use/Land Cover (LULC) Scenarios in Dry Lands Using a CA-Markov Simulation Model and the Classification and Regression Tree (CART) Method: A Cloud-Based Google Earth Engine (GEE) Approach. Sustainability 2024, 16, 11130. [Google Scholar] [CrossRef]
  24. Koko, A.F.; Yue, W.; Abubakar, G.A.; Hamed, R.; Alabsi, A.A.N. Monitoring and Predicting Spatio-Temporal Land Use/Land Cover Changes in Zaria City, Nigeria, through an Integrated Cellular Automata and Markov Chain Model (CA-Markov). Sustainability 2020, 12, 10452. [Google Scholar] [CrossRef]
  25. Zhang, M.F.; Liu, W.X.; Wang, J.E.; Luo, X.; Chen, P.; Gong, Q. Scenario Simulation of Ecosystem Service Value Changes in the Dongguan Section of the Shima River Basin Based on the Clue-S Model. Bull. Soil Water Conserv. 2021, 41, 152–160. [Google Scholar] [CrossRef]
  26. Dumitrașcu, M.; Kucsicsa, G.; Dumitrică, C.; Popovici, E.-A.; Vrînceanu, A.; Mitrică, B.; Mocanu, I.; Șerban, P.-R. Estimation of Future Changes in Aboveground Forest Carbon Stock in Romania. A Prediction Based on Forest-Cover Pattern Scenario. Forests 2020, 11, 914. [Google Scholar] [CrossRef]
  27. Wei, W.; Xie, Y.W.; Wei, X.X.; Xie, B. Optimal Allocation of Land Use in the Shiyang River Basin Based on the CLUE-S Model and Ecological Security Pattern. J. Wuhan Univ. 2017, 42, 1306–1315. [Google Scholar] [CrossRef]
  28. Xu, L.; Liu, X.; Tong, D.; Liu, Z.; Yin, L.; Zheng, W. Forecasting Urban Land Use Change Based on Cellular Automata and the PLUS Model. Land 2022, 11, 652. [Google Scholar] [CrossRef]
  29. Pan, C.; Wen, J.; Ma, J. Temporal and Spatial Variation in habitat quality in Guangxi Based on PLUS-InVEST Model. Land 2024, 13, 2250. [Google Scholar] [CrossRef]
  30. He, N.; Guo, W.; Wang, H.; Yu, L.; Cheng, S.; Huang, L.; Jiao, X.; Chen, W.; Zhou, H. Temporal and spatial variations in landscape habitat quality under multiple land-use/land-cover scenarios based on the PLUS-InVEST model in the Yangtze River Basin, China. Land 2023, 12, 1338. [Google Scholar] [CrossRef]
  31. Liu, X.; Liang, X.; Li, X.; Xu, X.; Ou, J.; Chen, Y.; Li, S.; Wang, S.; Pei, F. A future land use simulation model (FLUS) for simulating multiple land use scenarios by coupling human and natural effects. Landsc. Urban Plan. 2017, 168, 94–116. [Google Scholar] [CrossRef]
  32. Jiang, W.; Deng, Y.; Tang, Z.; Lei, X.; Chen, Z. Modelling the potential impacts of urban ecosystem changes on carbon storage under different scenarios by linking the CLUE-S and the InVEST models. Ecol. Model. 2017, 345, 30–40. [Google Scholar] [CrossRef]
  33. Sharp, R.; Tallis, H.T.; Ricketts, T.; Wood, S.A.; Chaplin-Kramer, B.; Guerry, A.D.; Goldstein, J.H.; Daily, G.C.; Polasky, S.; Balvanera, P.; et al. InVEST 3.2.0 User’s Guide; Stanford University: Stanford, CA, USA; University of Minnesota: Minneapolis, MN, USA, 2015; Available online: https://naturalcapitalproject.stanford.edu/software/invest (accessed on 19 May 2025).
  34. Ren, Y.M.; Liu, X.P.; Xu, X.C.; Sun, S.S.; Zhao, L.F.; Liang, X.; Zeng, L. Multi-Scenario Land Use Change Simulation and Its Impact on Ecosystem Services in Beijing-Tianjin-Hebei Region Based on the FLUS-InVEST Model. Acta Ecol. Sin. 2023, 43, 4473–4487. [Google Scholar] [CrossRef]
  35. Feng, W.B.; Lin, M.Z.; Gong, J.Z.; Zhao, J.M.; Zhong, L.; Liu, H.Y. Spatiotemporal Differentiation Characteristics of habitat quality in Zhongshan City Based on the FLUS-InVEST Model. Ecol. Sci. 2022, 41, 16–23. [Google Scholar] [CrossRef]
  36. Xiang, Q.; Kan, A.; Yu, X.; Liu, F.; Huang, H.; Li, W.; Gao, R. Assessment of Topographic Effect on Habitat Quality in Mountainous Area Using InVEST Model. Land 2023, 12, 186. [Google Scholar] [CrossRef]
  37. Limin, B.; Chunliang, X.; Xinghua, F.; Daqian, L. Influence of urbanization on regional habitat quality: A case study of Changchun City. Habitat Int. 2019, 93, 102042. [Google Scholar] [CrossRef]
  38. Cao, Y.; Wang, C.; Su, Y.; Duan, H.; Wu, X.; Lu, R.; Su, Q.; Wu, Y.; Chu, Z. Study on Spatiotemporal Evolution and Driving Forces of Habitat Quality in the Basin along the Yangtze River in Anhui Province Based on InVEST Model. Land 2023, 12, 1092. [Google Scholar] [CrossRef]
  39. GB/T 21010–2017; Current Land Use Classification. General Administration of Quality Supervision, Inspection and Quarantine of the People’s Republic of China (AQSIQ) and Standardization Administration of the People’s Republic of China (SAC). China Standard Press: Beijing, China, 2017. Available online: https://openstd.samr.gov.cn/bzgk/gb/newGbInfo?hcno=224BF9DA69F053DA22AC758AAAADEEAA (accessed on 18 June 2025).
  40. Quinn, J.E.; Fergus, C.; Hyland, E.; Vickery, C.; Lacher, I.L.; Akre, T.S. Ecosystem Service and Biodiversity Patterns Observed across Co-Developed Land Use Scenarios in the Piedmont: Lessons Learned for Scale and Framing. Land 2024, 13, 1340. [Google Scholar] [CrossRef]
  41. He, Q.Z.; Xie, D.T.; Wang, S.; Yan, J.Z.; Chen, L. Land Use Transformation and Ecological Environment Effects in Beibei District, Chongqing. Res. Soil Water Conserv. 2019, 26, 290–296. [Google Scholar] [CrossRef]
  42. Yin, Z.K.; Tan, L.F.; Jia, Q. Land Use Transformation Based on Ecological-Production-Living Spaces in Zhengzhou City and Its Ecological Effects. Yellow River 2022, 44, 93–98, 104. [Google Scholar] [CrossRef]
  43. Su, Y.Q.; Liu, G.; Zhao, J.B.; Niu, J.J.; Zhang, E.Y.; Guo, L.G.; Lin, F. Multi-Scenario Simulation and Prediction of Ecological Space in the Fenhe River Basin Based on the FLUS Model. Arid. Zone Res. 2021, 38, 1152–1161. [Google Scholar] [CrossRef]
  44. Ou, M.H.; Ding, G.Q.; Guo, J.; Liu, Q. Multi-Objective Collaborative Governance Mechanism for Territorial Spatial Planning. China Land Sci. 2020, 34, 8–17. [Google Scholar] [CrossRef]
  45. Liang, X.; Jin, X.; Sun, R.; Han, B.; Ren, J.; Zhou, Y. China’s resilience-space for cultivated land protection under the restraint of multi-scenario food security bottom line. Acta Geogr. Sin. 2022, 77, 697–713. [Google Scholar] [CrossRef]
  46. State Council of the People’s Republic of China. Land Management Law of the People’s Republic of China (Implementing Regulations) (State Council Order No. 743). 2021. Available online: https://www.gov.cn/gongbao/content/2021/content_5631813.htm (accessed on 18 May 2025).
  47. Chengdu Institute of Urban Planning and Design. Chengdu Ecological Protection Master Plan (2018–2035). 2019. Available online: https://www.cdipd.org.cn/index.php?m=content&c=index&a=show&catid=85&id=35 (accessed on 18 May 2025).
  48. Ministry of Ecology and Environment of the People’s Republic of China. National Key Ecological Function Zone Division. 2014. Available online: https://www.mee.gov.cn/ywdt/ztzl/dqgh/index.html (accessed on 18 May 2025).
  49. Wang, X.; Ma, B.W.; Li, D. Multi-scenario simulation and prediction of ecological space in Hubei Province based on FLUS model. J. Nat. Resour. 2020, 35, 230–242. [Google Scholar] [CrossRef]
  50. Terrado, M.; Sabater, S.; Chaplin-Kramer, B.; Mandle, L.; Ziv, G.; Acuña, V. Model development for the assessment of terrestrial and aquatic habitat quality in conservation planning. Sci. Total Environ. 2016, 540, 63–70. [Google Scholar] [CrossRef]
  51. Chen, C.; Liu, J.; Bi, L. Spatial and Temporal Changes of Habitat Quality and Its Influential Factors in China Based on the InVEST Model. Forests 2023, 14, 374. [Google Scholar] [CrossRef]
  52. Zhu, P.; Huang, L.; Xiao, T.; Wang, J.B. Dynamic changes of habitats in China’s typical nature reserves on spatial and temporal scales. Acta Geogr. Sin. 2018, 73, 92–103. [Google Scholar] [CrossRef]
  53. Wang, C.; Li, T.; Guo, X.; Xia, L.; Lu, C.; Wang, C. Plus-InVEST Study of the Chengdu-Chongqing urban agglomeration’s land-use change and carbon storage. Land 2022, 11, 1617. [Google Scholar] [CrossRef]
  54. Hu, F.; Zhang, Y.; Guo, Y.; Zhang, P.P.; Lv, S.; Zhang, C.C. Spatiotemporal Changes and Prediction of Land Use and habitat quality in the Weihe River Basin Based on the PLUS and InVEST Models. Arid. Land Geogr. 2022, 45, 1125–1136. [Google Scholar] [CrossRef]
  55. Li, S.P.; Liu, J.L.; Lin, J.; Fan, S.L. Spatiotemporal Evolution of habitat quality in Fujian Province Based on Land Use Changes from 1980 to 2018. J. Appl. Ecol. 2020, 31, 4080–4090. [Google Scholar] [CrossRef]
  56. Chu, L.; Zhang, X.R.; Wang, T.W.; Li, Z.X.; Cai, C.F. Spatiotemporal Evolution and Prediction of Urban Landscape Pattern and habitat quality Based on the CA-Markov and InVEST Models. J. Appl. Ecol. 2018, 29, 4106–4118. [Google Scholar] [CrossRef]
  57. Bao, Y.B.; Liu, K.; Li, T.; Hu, S. Impact of Land Use Change on Habitat Based on the InVEST Model: A Case Study of the Yellow River Wetland Nature Reserve in Shaanxi Province. Arid. Zone Res. 2015, 32, 622–629. [Google Scholar] [CrossRef]
  58. Sallustio, L.; De Toni, A.; Strollo, A.; Di Febbraro, M.; Gissi, E.; Casella, L.; Geneletti, D.; Munafò, M.; Vizzarri, M.; Marchetti, M. Assessing habitat quality in relation to the spatial distribution of protected areas in Italy. J. Environ. Manag. 2017, 201, 129–137. [Google Scholar] [CrossRef] [PubMed]
  59. Liu, C.F.; Wang, C. Spatio-temporal evolution characteristics of habitat quality in the Loess Hilly Region based on land use change: A case study in Yuzhong County. Acta Ecol. Sin. 2018, 38, 7300–7311. [Google Scholar] [CrossRef]
  60. Zhang, X.R.; Zhou, J.; Li, M.M. Spatiotemporal changes of habitat quality based on land use pattern reconstruction. Acta Geogr. Sin. 2020, 75, 160–178. [Google Scholar] [CrossRef]
Figure 1. Survey of research areas: (a) the location of Sichuan Province within China, (b) the location of Chengdu City within Sichuan Province, and (c) the Digital Elevation Model (DEM) of Chengdu.
Land 14 01568 g001
Figure 2. Land-use distribution during 1990–2020 in Chengdu City.
Land 14 01568 g002
Figure 3. The simulation maps of land-use types under different scenarios for Chengdu City in 2030.
Land 14 01568 g003
Figure 4. Comparative map of multi-scenario simulation results.
Land 14 01568 g004
Figure 5. Spatial distribution of regional habitat quality in Chengdu between 1990 and 2020.
Land 14 01568 g005
Figure 6. Bar plot showing percentage changes in land-use conversions (1990–2020). Cropland-to-built-up conversions accounted for 68% of total land loss, while forest gains (12.5%) were driven by reforestation policies.
Land 14 01568 g006
Figure 7. Changes in regional habitat quality in Chengdu from 1990 to 2020.
Land 14 01568 g007
Table 1. Data sources.
Data TypeData NameResolutionTime RangeData Source
Land-use dataLand-use data30 m1990, 1995, 2000, 2005, 2010, 2015, 2020Remote Sensing Information Processing of Wuhan University (https://doi.org/10.5194/essd-13-3907-2021, 2021. Accessed on 18 April 2025)
Base dataAdministrative boundary30 m2020National Earth System Science Data Center (https://www.geodata.cn/main/. Accessed on 18 April 2025)
Socioeconomic factorsPopulation density1 km1990–2020Geographical Conditions Monitoring Cloud Platform (http://www.dsac.cn/. Accessed on 18 April 2025)
GDP1 km
Natural environmental factorsDEM data30 m2020Resource and Environmental Science Data Center (https://www.resdc.cn/Default.aspx. Accessed on 18 April 2025)
Slope30 m
Aspect30 m
Annual mean temperature1 km
Annual precipitation1 km
Transportation factorsRailway dataVector2020National Geographic Information Resources Catalog Service System (https://www.webmap.cn/. Accessed on 18 April 2025)
Highway data
Waterbody data
Ecological policy dataChengdu ecological redline dataVector2020Chengdu Territorial Ecological Restoration Plan (2021–2035) (https://www.cdipd.org.cn/index.php?m=content&c=index&a=show&catid=85&id=35. Accessed on 18 June 2025)
National key ecological function zones2014National Ecological Function Zoning Plan (2014) (https://www.mee.gov.cn/ywdt/ztzl/dqgh/index.html. Accessed on 18 June 2025)
Table 2. Scenario Design Logic.
Scenario DesignDesign Logic
Natural Development Scenario (NDS)Follows historical land-use change trends without introducing additional policy constraints. Based on historical land-use change patterns, Markov chain analysis was used to derive the transition probability matrix. The adaptive inertia coefficient reflects the inheritance trend of land-use types. For example, the transition probability from cropland to built-up land is driven by historical data.
Ecological Priority Scenario (EPS)Prioritizes the protection of ecosystem services, with strict limitations on built-up land expansion. Integrating the National Land Management Law [46] and Chengdu Ecological Protection Master Plan (2018–2035) [47], conversion from cropland to built-up land is prohibited. The adaptive roulette selection mechanism increases cropland’s neighborhood weight (e.g., cropland neighborhood weight = 0.6) to enhance spatial agglomeration and prevent fragmentation.
Cropland Protection Scenario (CPS)Aims to ensure food security by strictly restricting the conversion of cropland to built-up areas. Guided by the National Important Ecological Function Zoning [48] and returning farmland to forest policies, conversion from built-up land to forest/grassland is prohibited. Neighborhood effect and inertia coefficients dynamically optimize the simulation accuracy, such as increasing forest/grassland neighborhood weights in priority ecological zones (e.g., hilly areas).
Table 3. Scenario parameter settings.
Scenario TypeCost MatrixAdaptive Inertia CoefficientNeighborhood Weight
EPSThe conversion costs from forestland, grassland, and water areas to built-up land are set to 0 (prohibiting conversion)The adaptive inertia coefficient of forestland is set to 0.6 (promoting the expansion of ecological land)The neighborhood weight of water areas is set to 0.76 (strengthening water areas’ protection)
NDSCompletely driven by historical data, without additional policy constraintsDefault value (0.5)Default value (0.5)
CPSThe conversion cost from cropland to built-up land is increased to 1.0 (strictly restricted)The adaptive inertia coefficient of cropland is set to 0.8 (protecting cropland)The neighborhood weight of cropland is set to 0.7
Table 4. Land-use conversion cost matrix.
Source → Target TypeNDSCPSEPS
Cropland → Built-up100
Forest → Built-up110
Grassland → Built-up110
Water → Built-up111
Built-up → Cropland101
Note: Conversion cost matrices for different scenarios were constructed based on driving factors (e.g., topography, GDP, population density) and policy constraints, where 0 indicates no allowed conversion and 1 indicates allowed conversion.
Table 5. Neighborhood weights of different land-use types.
Land-Use TypeCroplandForestGrasslandWaterBuilt-Up
Neighborhood Weight0.60.760.650.450.3
Table 6. Accuracy validation results of FLUS model under different scenarios.
Scenario TypeOverall AccuracyKappa CoefficientAnalysis
NDS87%0.81The simulation results without policy constraints show high consistency with the actual data (kappa > 0.8), indicating the rationality of historical trend-driven simulation logic.
EPS85%0.79Although ecological protection policies (e.g., prohibiting conversion to built-up land from forest/grassland) introduce additional constraints, the model still reflects actual land-use changes well. The kappa coefficient close to 0.8 verifies the effectiveness of ecological protection rules.
CPS86%0.80By strictly restricting cropland’s conversion to built-up land (set to 0) and optimizing neighborhood weights (cropland = 0.6), the model accurately simulates land-use patterns while ensuring cropland stability. The kappa coefficient of 0.8 indicates good synergy between policy constraints and dynamic adjustment strategies.
Table 7. Threat factor coefficients.
Threat FactorInfluence Distance (km)WeightSpatial Decay Type
Cropland10.5Linear
Built-up3.51Exponential
Barren20.7Linear
Note: Roads are classified as part of the “built-up” land-use type in this study, following the standard land-use classification in China (GB/T 21010–2017 [39]).
Table 8. Sensitivity table.
Land-Use TypeHabitat SuitabilityCroplandBuilt-UpBarren
Cropland0.500.90.4
Forest10.50.80.6
Grassland0.70.60.70.2
Water0.60.20.20.3
Built-up0000
Barren0000
Table 9. Conversion matrix of land use in Chengdu City from 1990 to 2020 (km2).
2020
1990CroplandForestGrasslandWaterBarrenBuilt-UpOutflows
Cropland10,593.83765.5613.4246.031.301442.512268.81
Forest305.782921.497.980.340.050.98315.12
Grassland5.8754.23110.510.5901.1761.87
Water32.025.080.2789.600.3915.9853.75
Barren0.010.163.800.103.160.144.21
Built-up7.350.010.0116.900271.3224.27
Inflows351.03825.0325.4863.961.731460.79
Table 10. Conversion matrix of land use in Chengdu City from 1990 to 2000 (km2).
2000
1990CroplandForestGrasslandWaterBarrenBuilt-UpOutflows
Cropland12,087.55496.542.9913.210262.35775.09
Forest207.053028.610.890.0200.05208.00
Grassland2.5855.00111.940.311.650.9060.44
Water30.655.150.1399.230.277.9144.11
Barren00.112.060.114.930.152.44
Built-up1.670.0106.290287.627.97
Inflows241.95556.816.0719.941.92271.35
Table 11. Conversion matrix of land use in Chengdu City from 2000 to 2010 (km2).
2010
2000CroplandForestGrasslandWaterBarrenBuilt-UpOutflows
Cropland11,531.93138.7015.5946.980.03596.28797.57
Forest856.222725.722.260.5000.72859.70
Grassland2.982.25109.950.612.030.208.07
Water10.580.120.15102.730.145.4516.45
Barren00.010.500.216.1300.72
Built-up1.330017.720539.9119.06
Inflows871.11141.0918.5166.022.20602.64
Table 12. Conversion matrix of land use in Chengdu City from 2010 to 2020 (km2).
2020
2010CroplandForestGrasslandWaterBarrenBuilt-UpOutflows
Cropland10771.581017.2913.6821.051.00578.451631.47
Forest134.752727.973.810.010.010.27138.84
Grassland2.540.85111.780.211.5611.5816.74
Water35.130.410.51124.170.378.1544.57
Barren0.0103.720.014.5003.75
Built-up0.86008.040.001133.668.89
Inflows173.281018.5621.7229.322.94598.45
Table 13. Changes in the area of regional habitat quality at different levels in Chengdu from 1990 to 2020.
YearRegional Habitat Quality LevelLowModerately LowMediumModerately HighHigh
1990Area/km2302.963478.999575.99501.542859.14
Proportion/%1.8120.8157.283.0017.10
1995Area/km2346.643477.33028837.0998648.65583406.54
Proportion/%2.0720.8052.863.8820.38
2000Area/km2565.823895.27868598.0334534.97393122.15
Proportion/%3.3823.3051.433.2018.68
2005Area/km2795.964328.278225.22469.772898.70
Proportion/%4.7625.8949.202.8117.34
2010Area/km21150.814826.477787.21431.322522.12
Proportion/%6.8828.8746.582.5815.09
2015Area/km21513.975408.256392.94615.222785.89
Proportion/%9.0632.3538.243.6816.66
2020Area/km21739.555749.305371.47790.763068.52
Proportion/%10.4134.3932.134.7318.35
Table 14. Regional habitat quality area changes in Chengdu under different scenarios for 2030 (full names: natural development scenario [NDS], ecological priority scenario [EPS], cropland protection scenario [CPS]).
YearRegional Habitat Quality LevelLowModerately LowMediumModerately HighHigh
NDSArea/km23164.704328.275384.85762.343076.10
Proportion/%18.9325.8932.214.5618.40
EPSArea/km21758.735744.285343.05443.033430.52
Proportion/%10.5234.3631.962.6520.52
CPSArea/km21758.733724.767394.34782.403056.04
Proportion/%10.5222.2844.234.6818.28
Table 15. The contribution of land-use changes in Chengdu from 1990 to 2020 to regional habitat quality.
2020
Land-Use TypeCroplandForestGrasslandWaterBuilt-UpBarren
1990Cropland−0.0023490.0235240.009793−0.3255630.0014010.042362Regional habitat quality contribution rate
Forest0.00593618.6806212.589982−7.674095−0.1660760.01419
Grassland−0.000207−0.044730−0.000063−0.2003790
Water0.0533993.2898230.0204960.4548740.0006850.000251
Built-up−0.0007290.1577850.1945−0.049888−0.0000690.002136
Barren−0.062922−0.000100−0.004146−0.0031410
Disclaimer/Publisher’s Note: The statements, opinions and data contained in all publications are solely those of the individual author(s) and contributor(s) and not of MDPI and/or the editor(s). MDPI and/or the editor(s) disclaim responsibility for any injury to people or property resulting from any ideas, methods, instructions or products referred to in the content.

