
Separate Versus Unified Ecological Networks: Validating a Dual Framework for Biodiversity Conservation in Anthropogenically Disturbed Freshwater–Terrestrial Ecosystems

 ,
,
Abstract
1. Introduction
2. Materials and Methods
2.1. Study Area
2.2. Data Sources
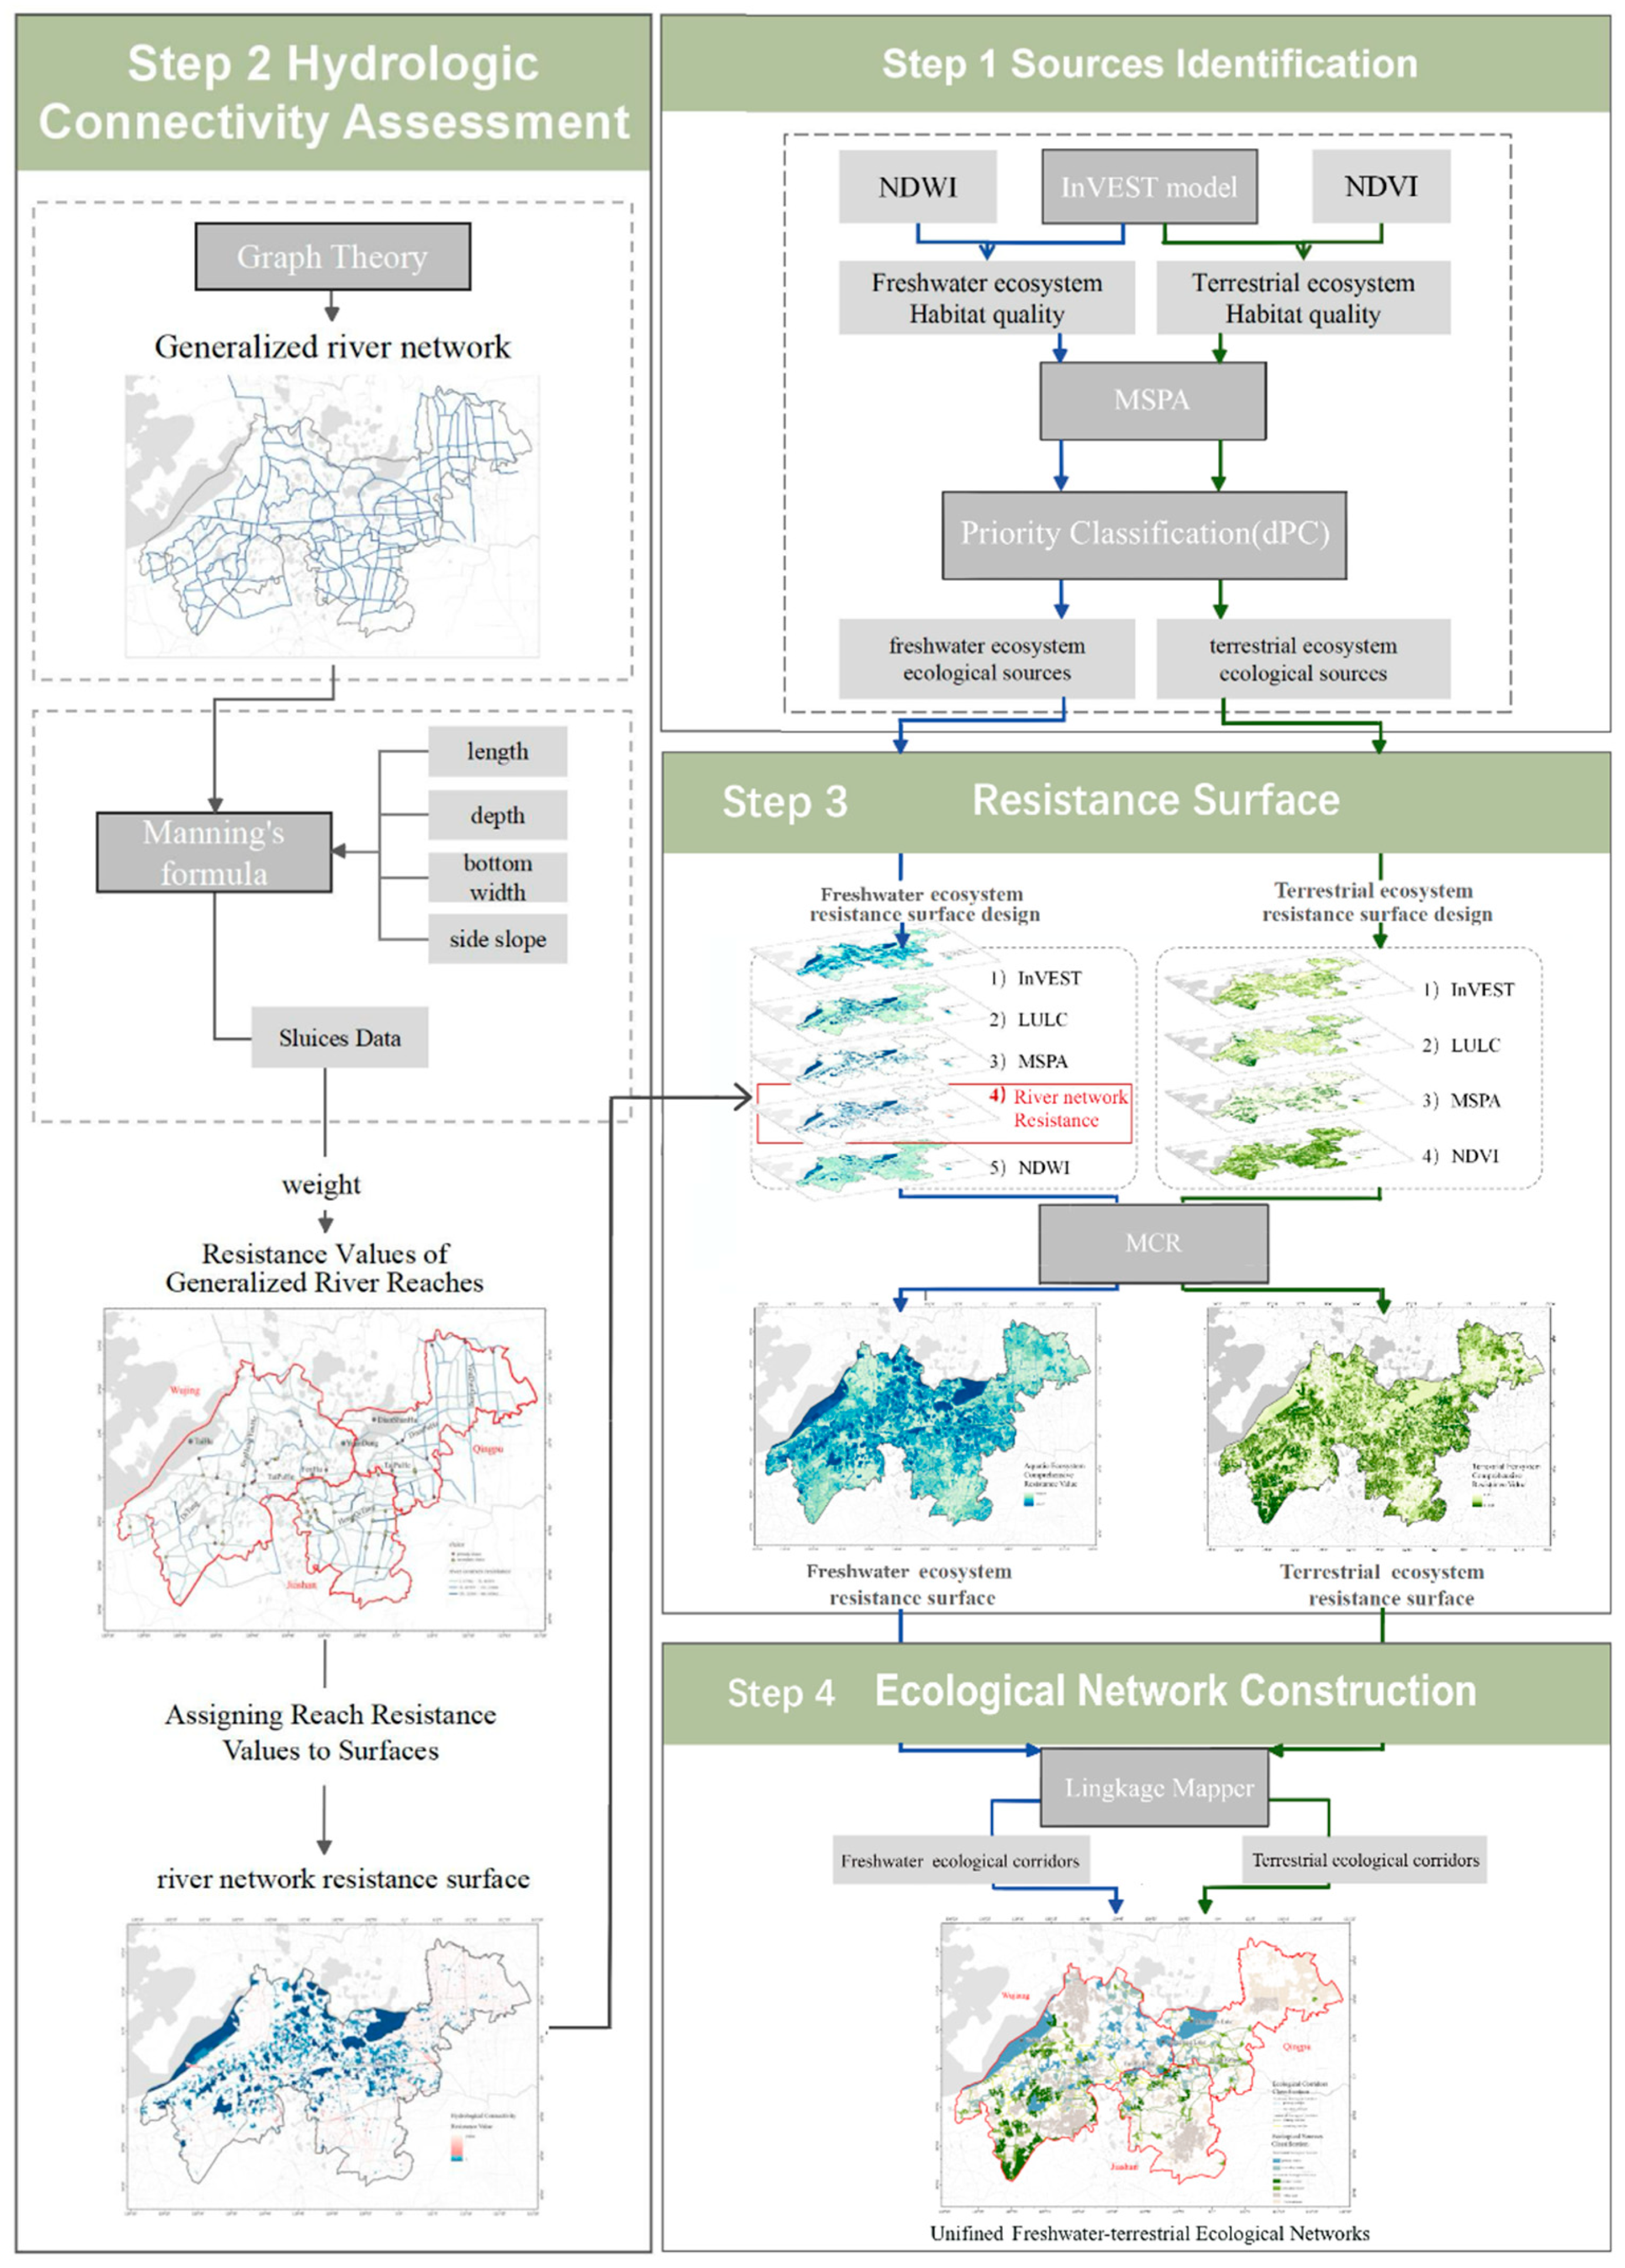
2.3. Methods
2.3.1. Sources Identification
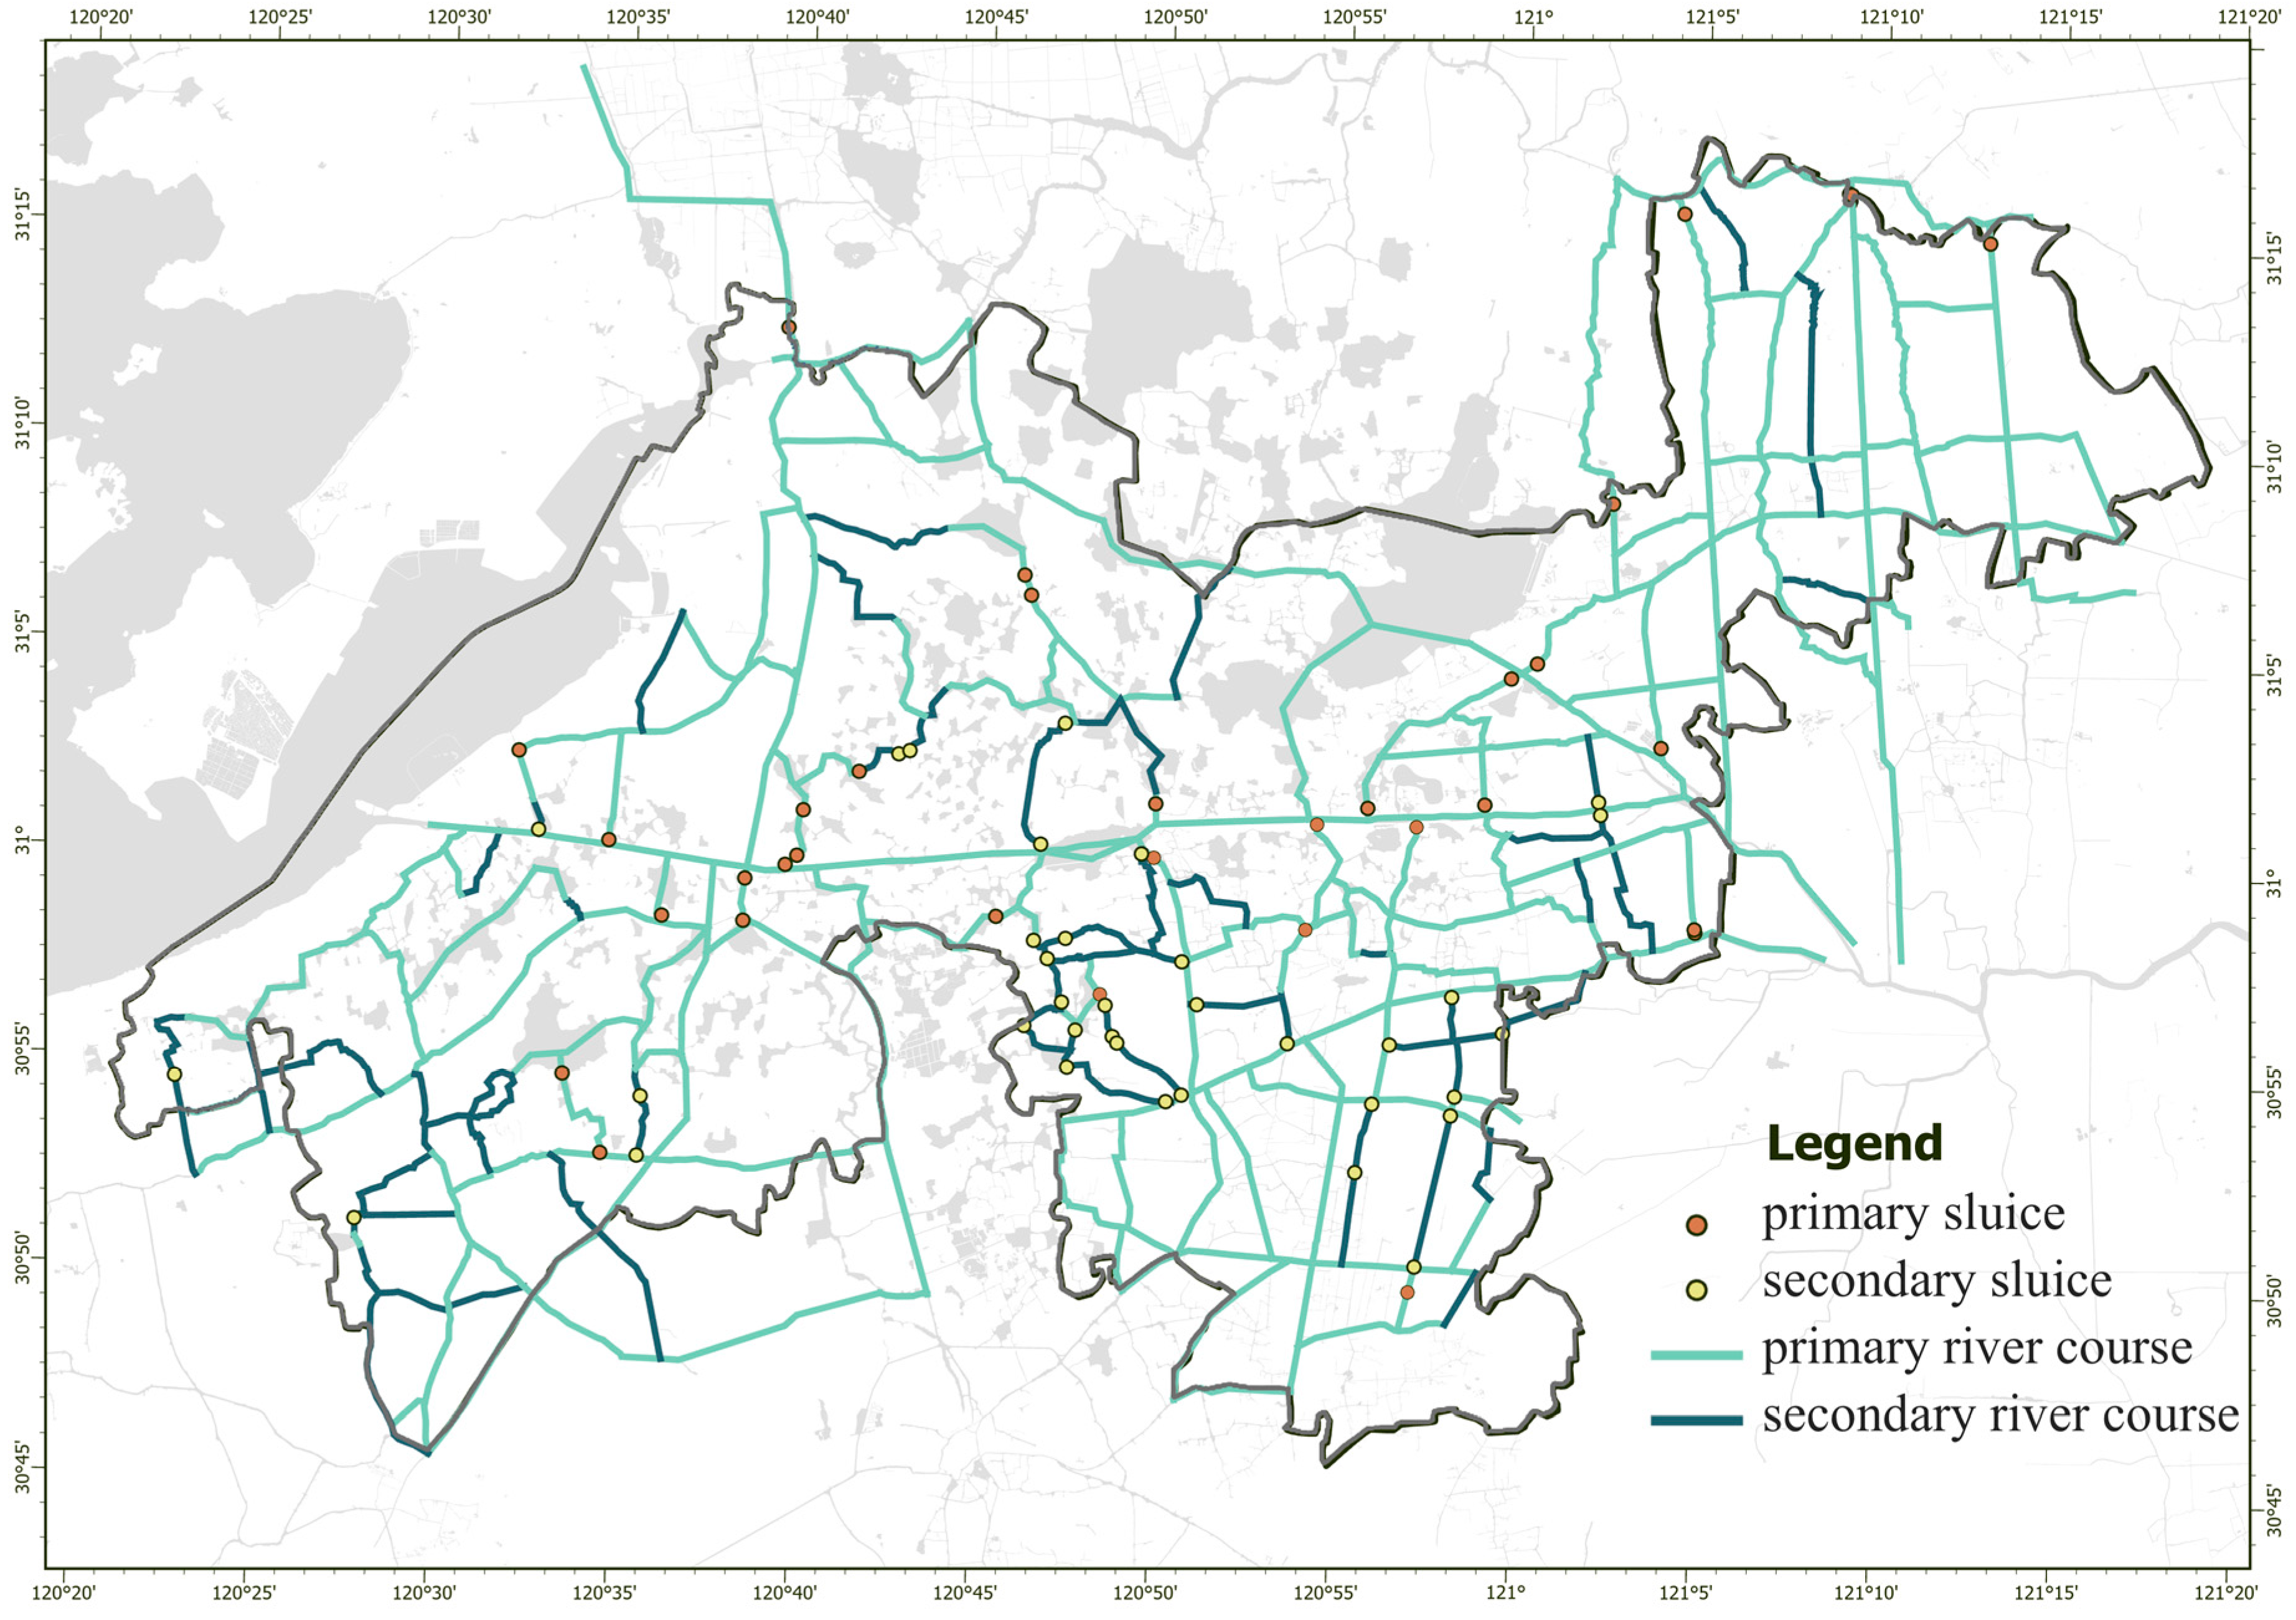
2.3.2. Hydrological Connectivity Assessment
- (1)
- River network generalization
- (2)
- Flow resistance value
- (3)
- Resistance value setting
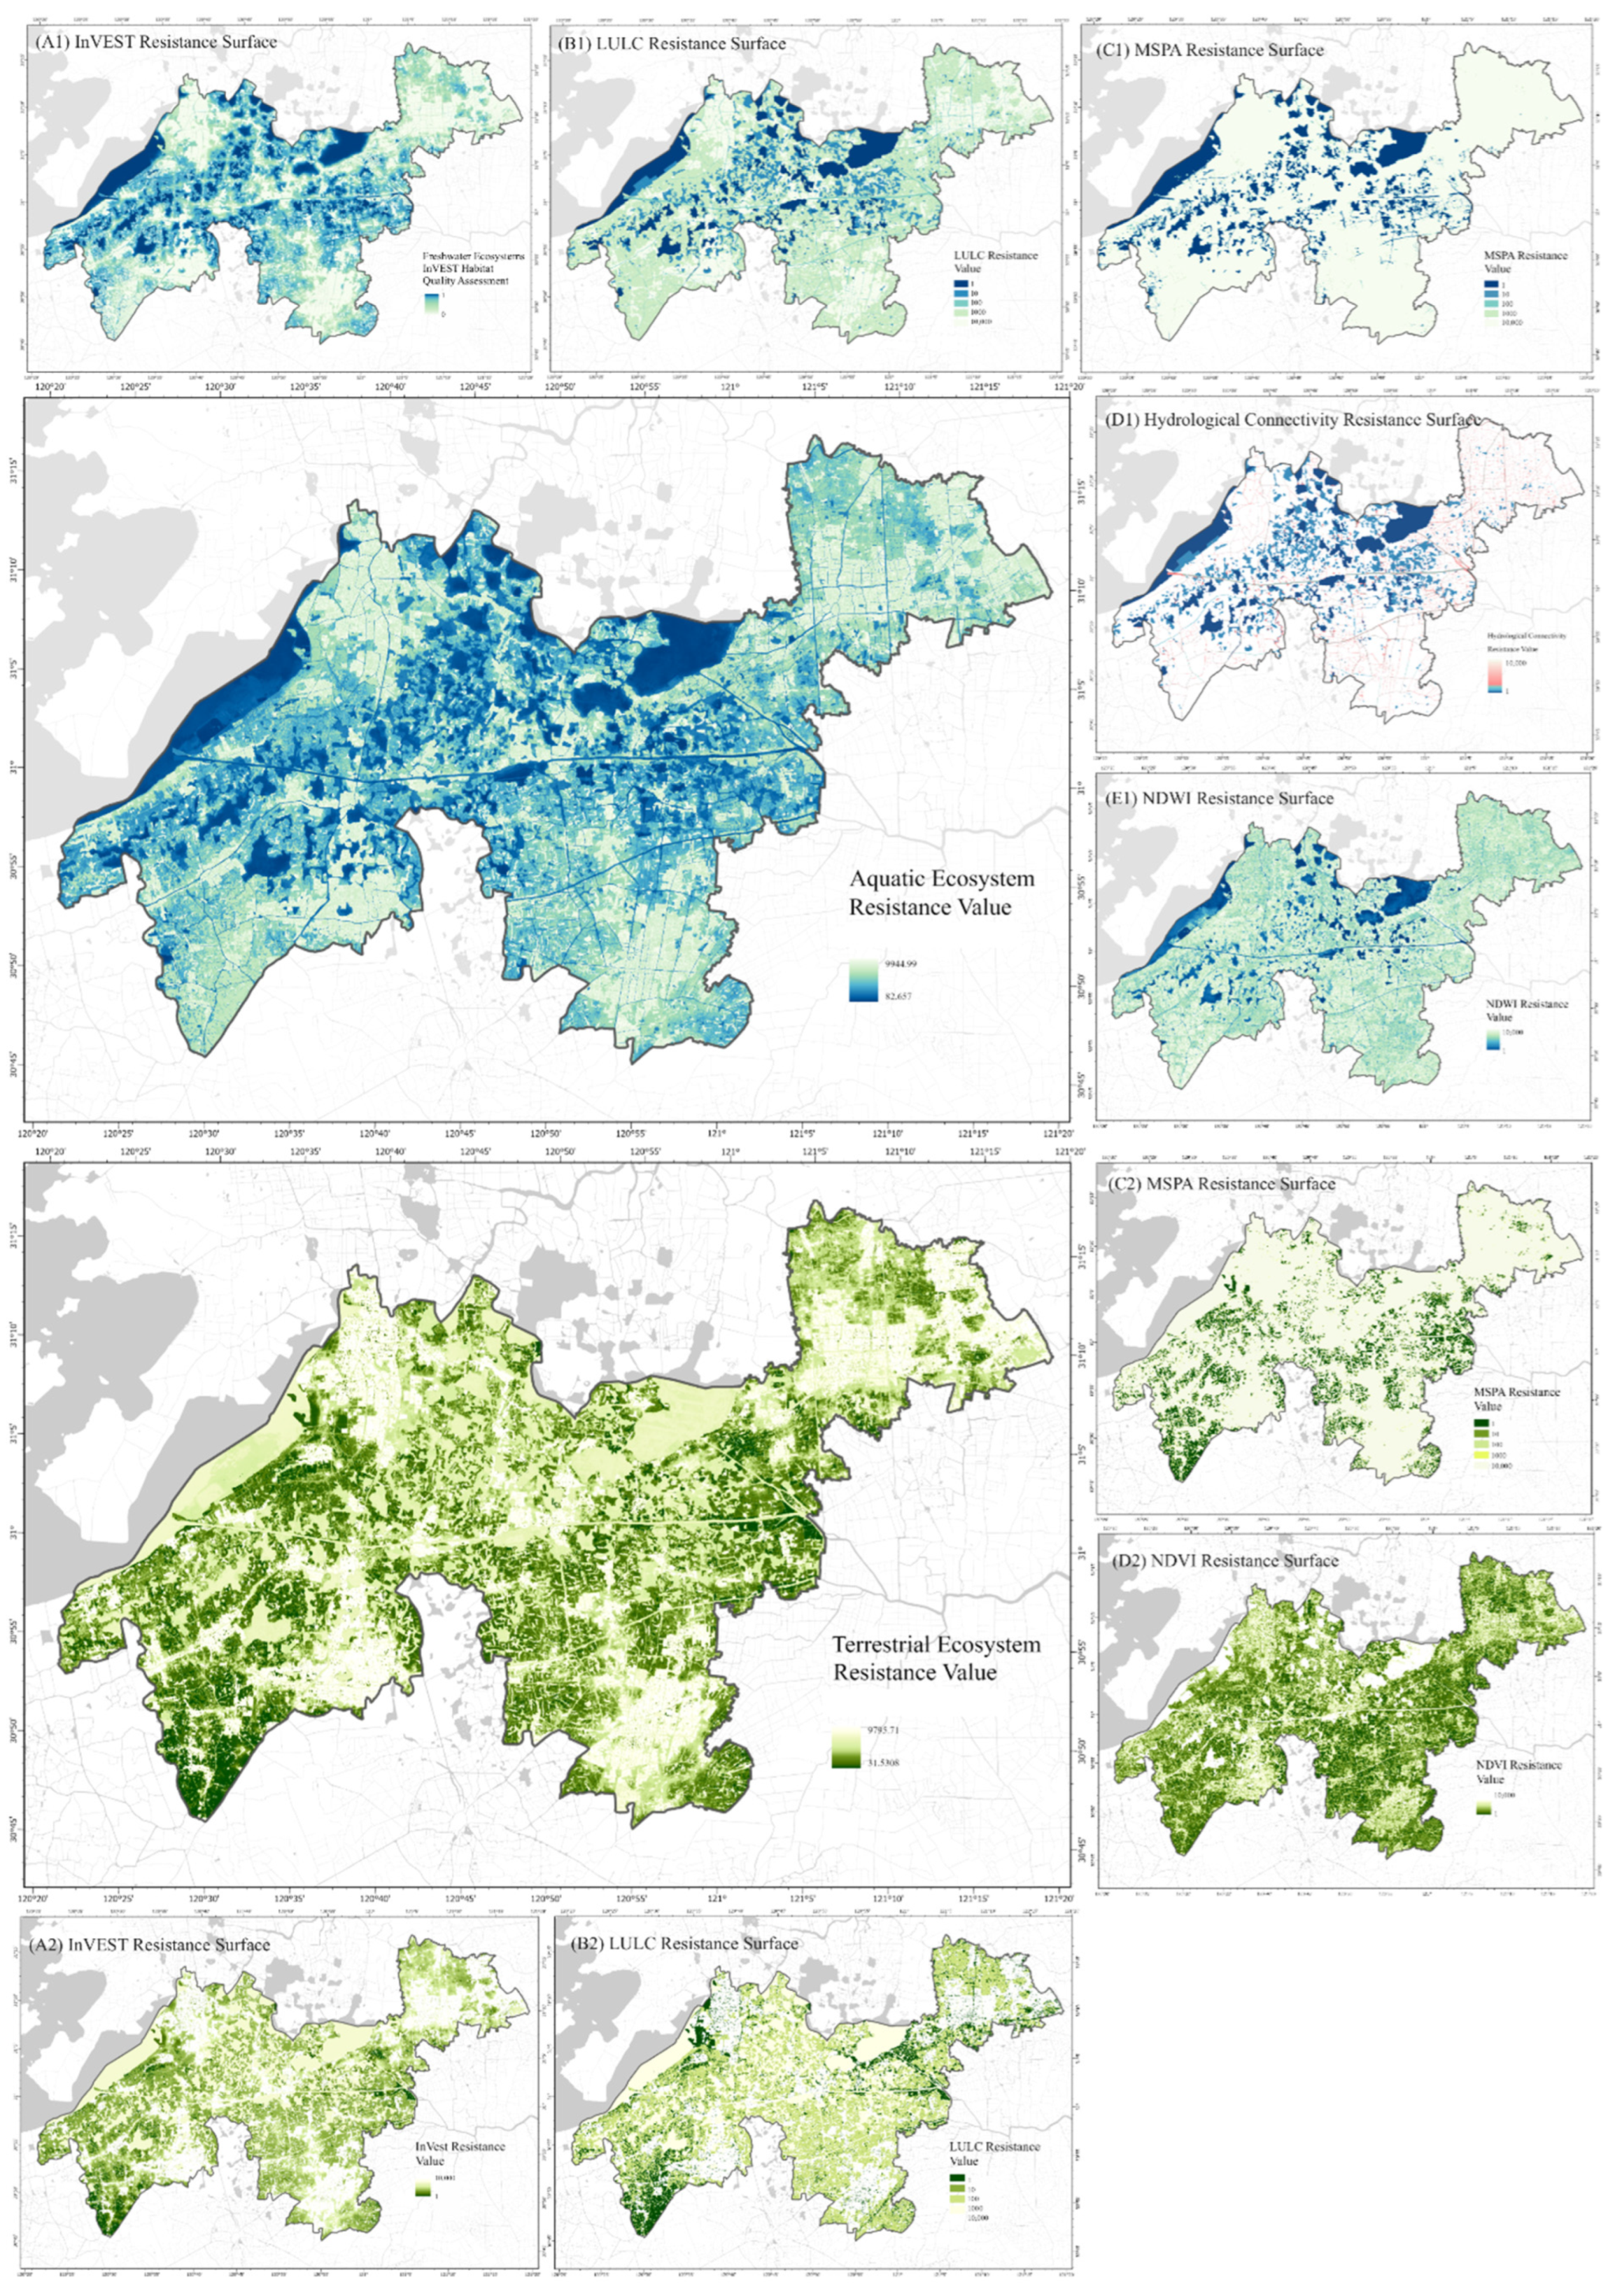
2.3.3. Resistance Surface Design
2.3.4. Ecological Corridor Identification and Classification
3. Results
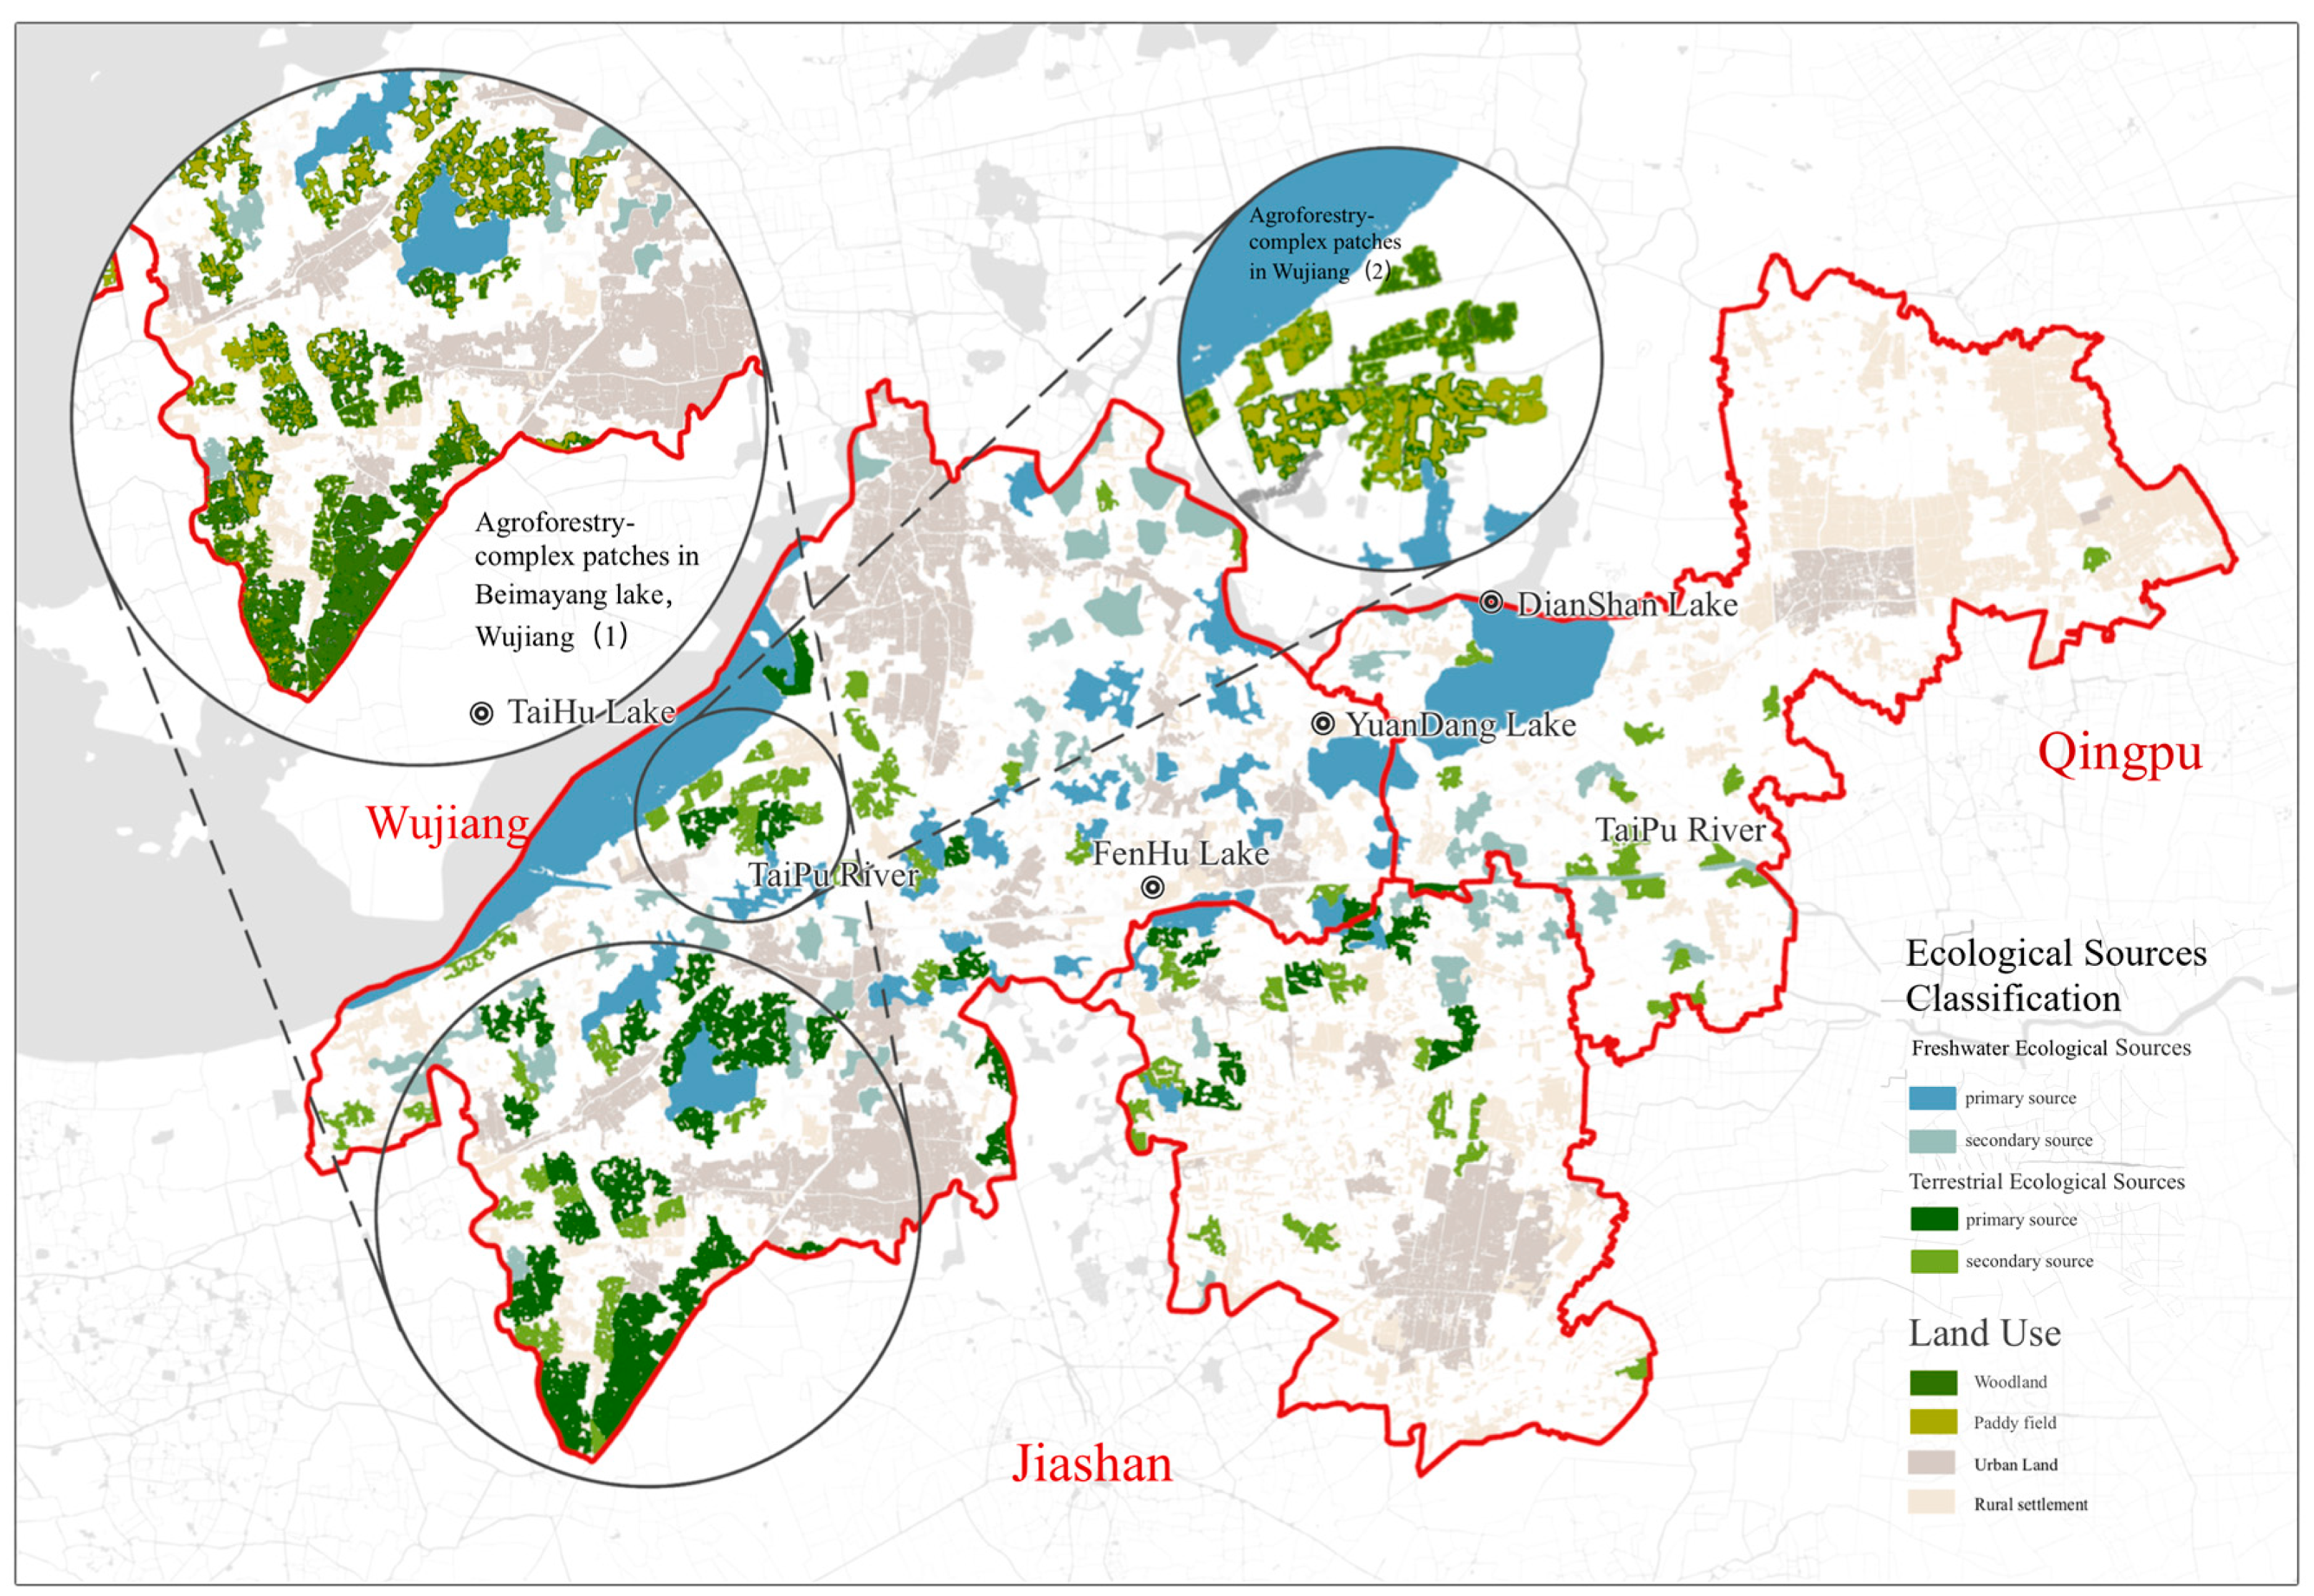
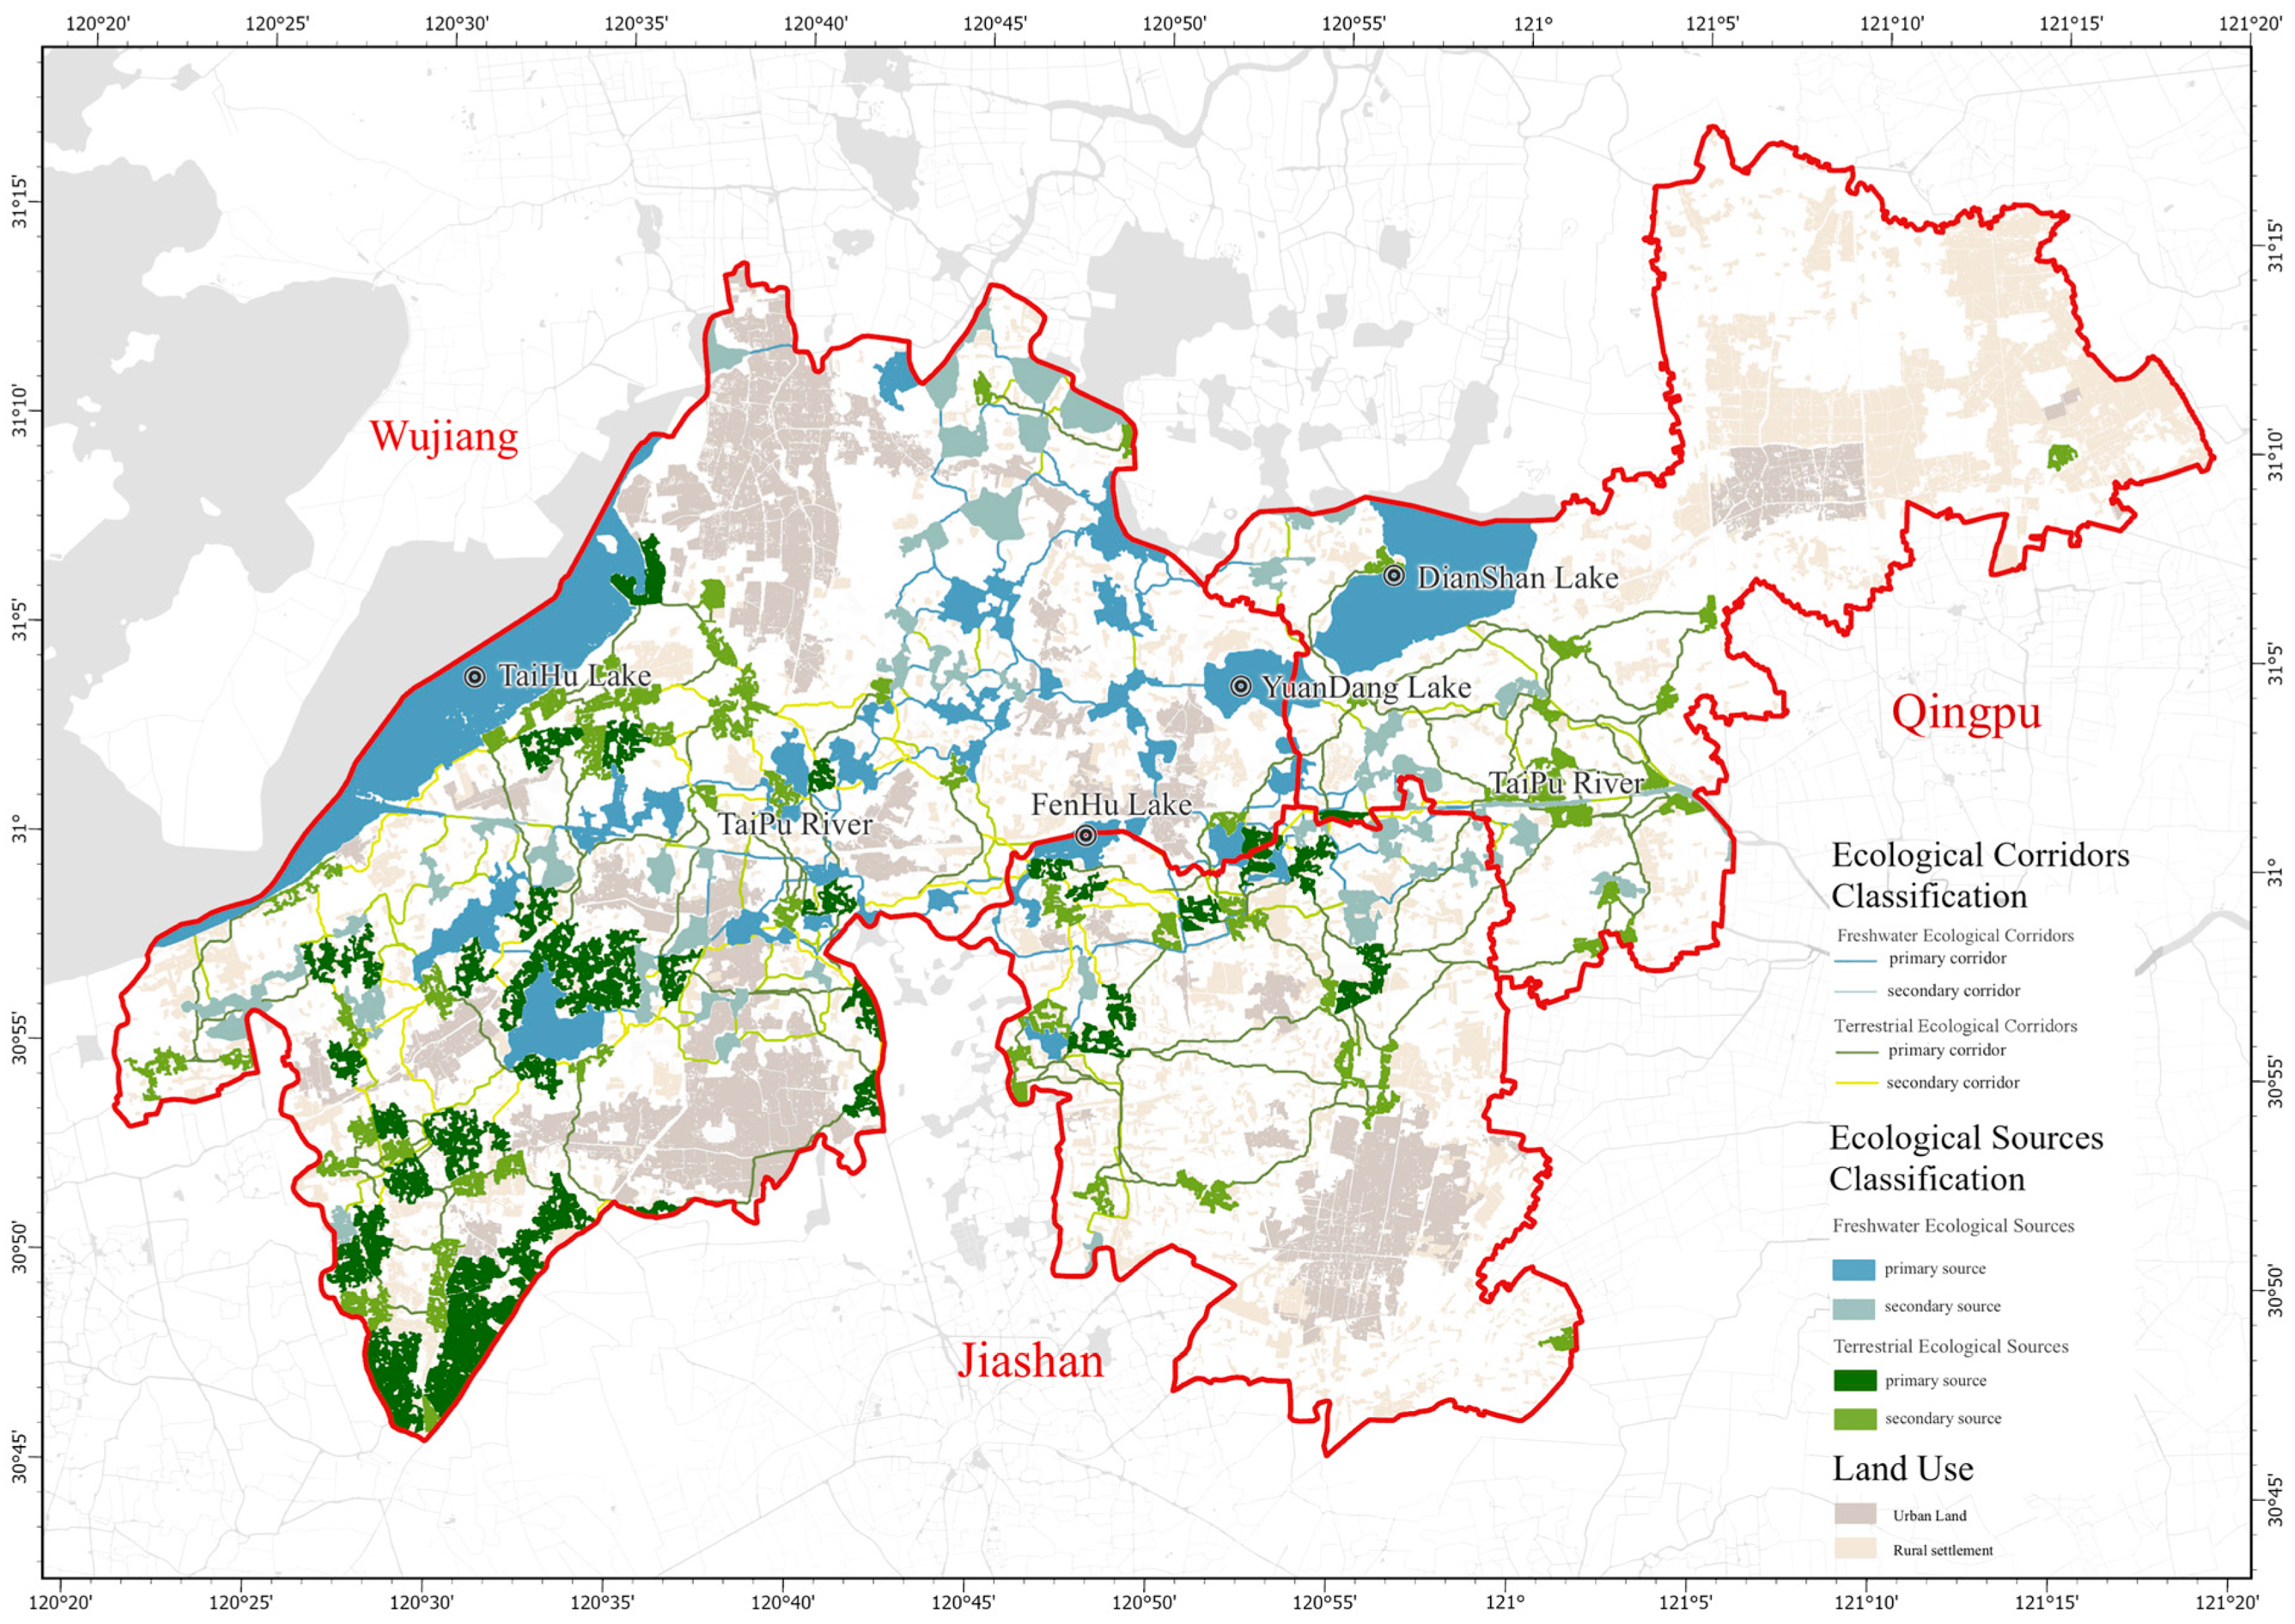
3.1. Extent, Configuration, and Spatial Patterns of Freshwater and Terrestrial Ecological Sources
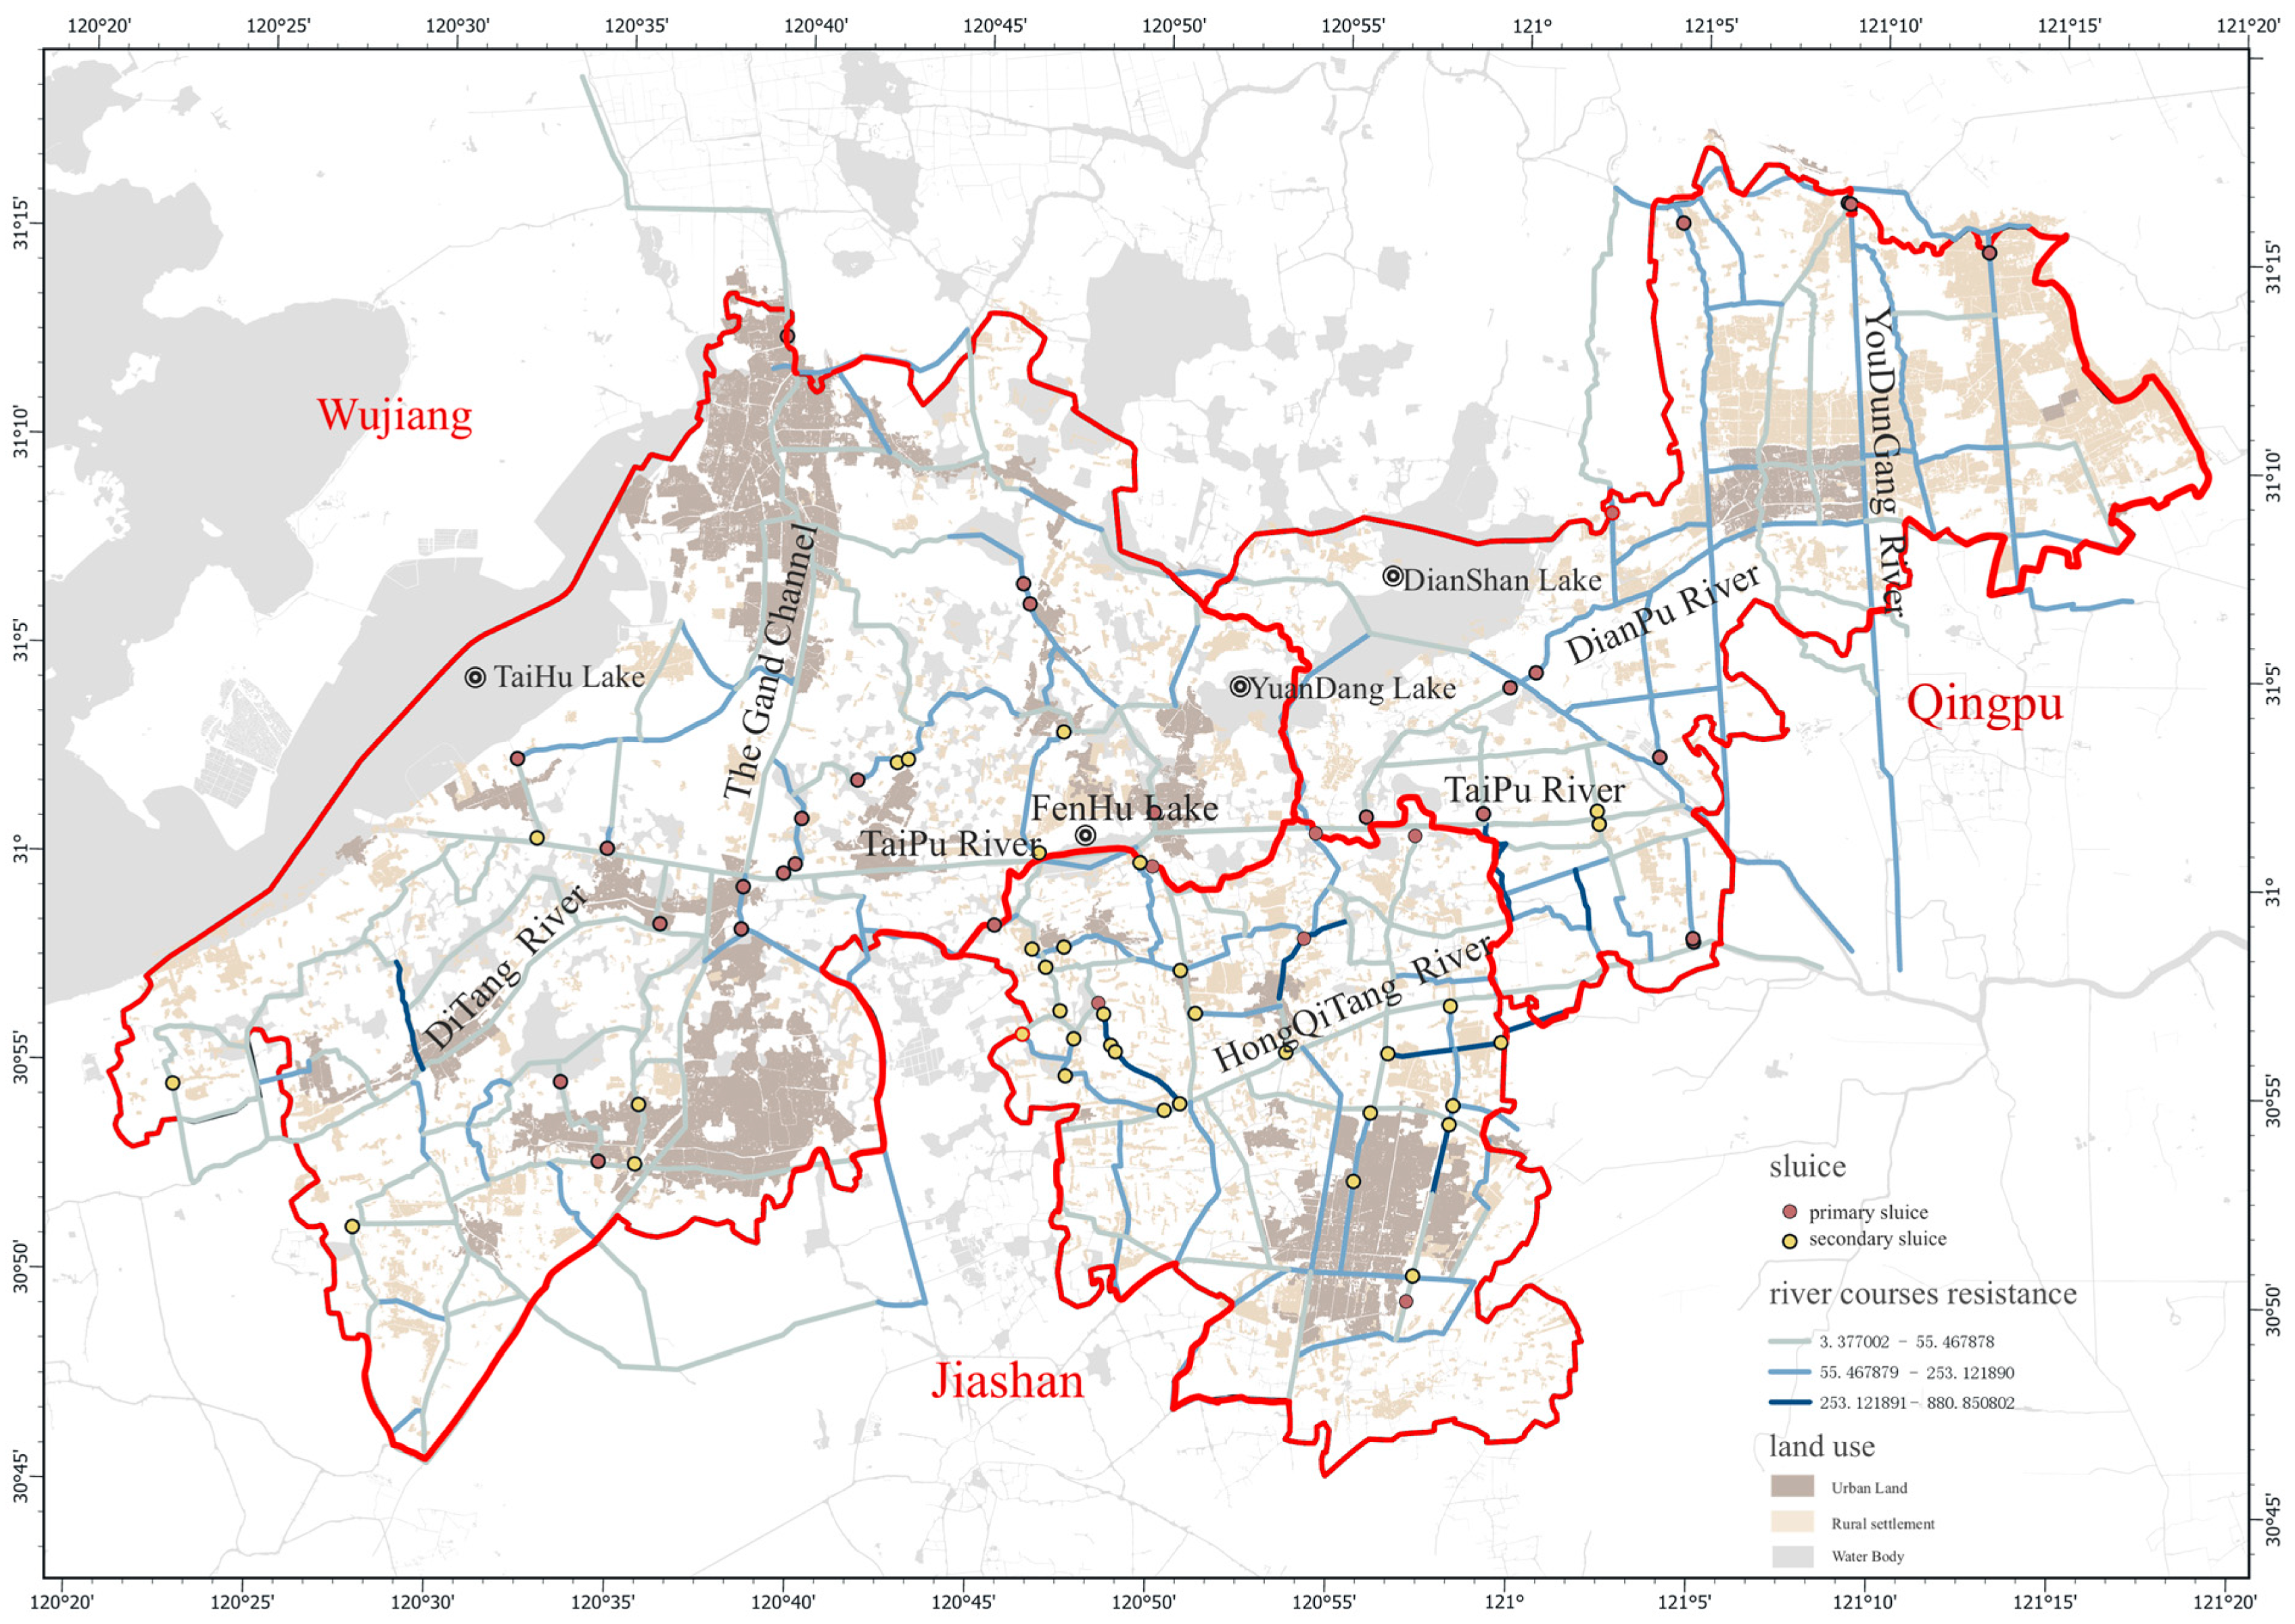
3.2. Hydrological Connectivity and Resistance Values
3.3. Number, Length, and Spatial Patterns of Freshwater and Terrestrial Ecological Corridors
4. Discussion
4.1. Distinct Assessments of Freshwater and Terrestrial Ecosystem Connectivity
4.2. Watershed-Scale Hydrological Connectivity Under Intensive Anthropogenic Disturbance
4.3. Application Potential of the Dual-Network Framework Under National Ecological Planning Contexts
4.4. Limitation and Future Research Directions
5. Conclusions
Supplementary Materials
Author Contributions
Funding
Data Availability Statement
Conflicts of Interest
References
- Carrizo, S.F.; Smith, K.G.; Darwall, W.R.T. Progress towards a global assessment of the status of freshwater fishes (Pisces) for the IUCN Red List: Application to conservation programmes in zoos and aquariums. Int. Zoo Yearb. 2013, 47, 46–64. [Google Scholar] [CrossRef]
- Dudgeon, D.; Arthington, A.H.; Gessner, M.O.; Kawabata, Z.; Knowler, D.J.; Lévêque, C.; Naiman, R.J.; Prieur-Richard, A.-H.; Soto, D.; Stiassny, M.L.J. Freshwater biodiversity: Importance, threats, status and conservation challenges. Biol. Rev. 2006, 81, 163–182. [Google Scholar] [CrossRef]
- Abell, R.; Allan, J.D.; Lehner, B. Unlocking the potential of protected areas for freshwaters. Biol. Conserv. 2007, 134, 48–63. [Google Scholar] [CrossRef]
- Ahmed, S.F.; Kumar, P.S.; Kabir, M.; Zuhara, F.T.; Mehjabin, A.; Tasannum, N.; Hoang, A.T.; Kabir, Z.; Mofijur, M. Threats, challenges and sustainable conservation strategies for freshwater biodiversity. Environ. Res. 2022, 214, 113808. [Google Scholar] [CrossRef] [PubMed]
- McDonald, R.I.; Mansur, A.V.; Ascensão, F.; Colbert, M.; Crossman, K.; Elmqvist, T.; Gonzalez, A.; Güneralp, B.; Haase, D.; Hamann, M.; et al. Research gaps in knowledge of the impact of urban growth on biodiversity. Nat. Sustain. 2020, 3, 16–24. [Google Scholar] [CrossRef]
- Grimm, N.B.; Foster, D.; Groffman, P.; Grove, J.M.; Hopkinson, C.S.; Nadelhoffer, K.J.; Pataki, D.E.; Peters, D.P.C. The changing landscape: Ecosystem responses to urbanization and pollution across climatic and societal gradients. Front. Ecol. Environ. 2008, 6, 264–272. [Google Scholar] [CrossRef]
- Johnson, P.T.J.; Hoverman, J.T.; McKenzie, V.J.; Blaustein, A.R.; Richgels, K.L.D. Urbanization and wetland communities: Applying metacommunity theory to understand the local and landscape effects. J. Appl. Ecol. 2013, 50, 34–42. [Google Scholar] [CrossRef]
- Crook, D.A.; Lowe, W.H.; Allendorf, F.W.; Erős, T.; Finn, D.S.; Gillanders, B.M.; Hadwen, W.L.; Harrod, C.; Hermoso, V.; Jennings, S.; et al. Human effects on ecological connectivity in aquatic ecosystems: Integrating scientific approaches to support management and mitigation. Sci. Total Environ. 2015, 534, 52–64. [Google Scholar] [CrossRef]
- Pringle, C.M. Hydrologic Connectivity and the Management of Biological Reserves: A Global Perspective. Ecol. Appl. 2001, 11, 981–998. [Google Scholar] [CrossRef]
- Davis, R. Habitat Fragmentation and Landscape Change: An Ecological and Conservation Synthesis. Austral Ecol. 2007, 32, 477–478. [Google Scholar] [CrossRef]
- Belletti, B.; Garcia de Leaniz, C.; Jones, J.; Bizzi, S.; Börger, L.; Segura, G.; Castelletti, A.; van de Bund, W.; Aarestrup, K.; Barry, J.; et al. More than one million barriers fragment Europe’s rivers. Nature 2020, 588, 436–441. [Google Scholar] [CrossRef]
- Taylor, P.; Fahrig, L.; With, K. Landscape Connectivity: A Return to the Basics; Cambridge University Press: Cambridge, UK, 2006; pp. 29–43. [Google Scholar]
- Baguette, M.; Blanchet, S.; Legrand, D.; Stevens, V.M.; Turlure, C. Individual dispersal, landscape connectivity and ecological networks. Biol. Rev. 2013, 88, 310–326. [Google Scholar] [CrossRef]
- Field, R.D.; Parrott, L. Mapping the functional connectivity of ecosystem services supply across a regional landscape. eLife 2022, 11, e69395. [Google Scholar] [CrossRef]
- Kang, C.S.; Kanniah, K.D. Land use and land cover change and its impact on river morphology in Johor River Basin, Malaysia. J. Hydrol. Reg. Stud. 2022, 41, 101072. [Google Scholar] [CrossRef]
- Molinari, B.; Stewart-Koster, B.; Malthus, T.J.; Bunn, S.E. Impact of water resource development on connectivity and primary productivity across a tropical river floodplain. J. Appl. Ecol. 2022, 59, 1013–1025. [Google Scholar] [CrossRef]
- Nathan, R.; Getz, W.M.; Revilla, E.; Holyoak, M.; Kadmon, R.; Saltz, D.; Smouse, P.E. A movement ecology paradigm for unifying organismal movement research. Proc. Natl. Acad. Sci. USA 2008, 105, 19052–19059. [Google Scholar] [CrossRef] [PubMed]
- Bracken, L.J.; Wainwright, J.; Ali, G.A.; Tetzlaff, D.; Smith, M.W.; Reaney, S.M.; Roy, A.G. Concepts of hydrological connectivity: Research approaches, pathways and future agendas. Earth-Sci. Rev. 2013, 119, 17–34. [Google Scholar] [CrossRef]
- Segurado, P.; Branco, P.; Ferreira, M.T. Prioritizing restoration of structural connectivity in rivers: A graph-based approach. Landsc. Ecol. 2013, 28, 1231–1238. [Google Scholar] [CrossRef]
- Kondolf, G.M.; Boulton, A.; O’Daniel, S.; Poole, G.; Rahel, F.; Stanley, E.; Wohl, E.; Bång, Å.; Carlström, J.; Cristoni, C.; et al. Process-Based Ecological River Restoration: Visualizing Three-Dimensional Connectivity and Dynamic Vectors to Recover Lost Linkages. Ecol. Soc. 2006, 11, 5. [Google Scholar] [CrossRef]
- Shao, X.; Fang, Y.; Jawitz, J.W.; Yan, J.; Cui, B. River network connectivity and fish diversity. Sci. Total Environ. 2019, 689, 21–30. [Google Scholar] [CrossRef]
- Yizhang, Z.; Yuxia, Z.; Hailong, L.I.U. Research on Evaluation of River Disturbance and Mapping of Spatial Distribution of Rivers at National Scale in China. Landsc. Archit. 2020, 27, 10–17. [Google Scholar]
- Funk, A.; Baldan, D.; Bondar-Kunze, E.; Brizuela, S.R.; Kowal, J.; Hein, T. Connectivity as a driver of river-floodplain functioning: A dynamic, graph theoretic approach. Ecol. Indic. 2023, 154, 110877. [Google Scholar] [CrossRef]
- Huang, S.; Hua, Z.; Wang, P.; Shi, J. A novel longitudinal connectivity index to evaluate reticular river networks based on the combination of network maximum flow and resistance distance. J. Environ. Manag. 2024, 367, 122062. [Google Scholar] [CrossRef] [PubMed]
- Xue, F.; Zhang, Q.; Melack, J.M.; Tang, H.; Yuan, S.; Jia, Y.; Xue, C.; Song, Y. Floodplain lakes: Linking hydrology to ecology and conservation. Earth-Sci. Rev. 2024, 258, 104967. [Google Scholar] [CrossRef]
- Erős, T.; Olden, J.; Schick, R.; Schmera, D.; Fortin, M.-J. Characterizing connectivity relationships in freshwaters using patch-based graphs. Landsc. Ecol. 2011, 27, 303–317. [Google Scholar] [CrossRef]
- Fullerton, A.H.; Burnett, K.M.; Steel, E.A.; Flitcroft, R.L.; Pess, G.R.; Feist, B.E.; Torgersen, C.E.; Miller, D.J.; Sanderson, B.L. Hydrological connectivity for riverine fish: Measurement challenges and research opportunities. Freshw. Biol. 2010, 55, 2215–2237. [Google Scholar] [CrossRef]
- Lechner, A.M.; Doerr, V.; Harris, R.M.B.; Doerr, E.; Lefroy, E.C. A framework for incorporating fine-scale dispersal behaviour into biodiversity conservation planning. Landsc. Urban Plan. 2015, 141, 11–23. [Google Scholar] [CrossRef]
- Zhu, F.; Lu, Z.; Cai, M.; Wang, Y. Evaluation of river network connectivity in plain area of Taihu basin. Hydro-Sci. Eng. 2017, 4, 52–58. [Google Scholar]
- Wegscheider, B.; Waldock, C.; Calegari, B.B.; Josi, D.; Brodersen, J.; Seehausen, O. Neglecting biodiversity baselines in longitudinal river connectivity restoration impacts priority setting. Sci. Total Environ. 2024, 954, 175167. [Google Scholar] [CrossRef]
- Linke, S.; Turak, E.; Nel, J. Freshwater conservation planning: The case for systematic approaches. Freshw. Biol. 2011, 56, 6–20. [Google Scholar] [CrossRef]
- Pe’er, G.; Henle, K.; Dislich, C.; Frank, K. Breaking functional connectivity into components: A novel approach using an individual-based model, and first outcomes. PLoS ONE 2011, 6, e22355. [Google Scholar]
- Shen, J.; Zhu, W.; Peng, Z.; Wang, Y. Improving landscape ecological network connectivity in urbanizing areas from dual dimensions of structure and function. Ecol. Model. 2023, 482, 110380. [Google Scholar] [CrossRef]
- Jongman, R.H.G. Nature conservation planning in Europe: Developing ecological networks. Landsc. Urban Plan. 1995, 32, 169–183. [Google Scholar] [CrossRef]
- Bennett, G.; Mulongoy, K.J. Review of Experience with Ecological Networks, Corridors and Buffer Zones; Secretariat of the Convention on Biological Diversity: Montreal, QC, Canada, 2006. [Google Scholar]
- Opdam, P.; Steingröver, E.; van Rooij, S. Ecological networks: A spatial concept for multi-actor planning of sustainable landscapes. Landsc. Urban Plan. 2006, 75, 322–332. [Google Scholar] [CrossRef]
- Saura, S.; Pascual-Hortal, L. A new habitat availability index to integrate connectivity in landscape conservation planning: Comparison with existing indices and application to a case study. Landsc. Urban Plan. 2007, 83, 91–103. [Google Scholar] [CrossRef]
- Foltête, J.-C. How ecological networks could benefit from landscape graphs: A response to the paper by Spartaco Gippoliti and Corrado Battisti. Land Use Policy 2019, 80, 391–394. [Google Scholar] [CrossRef]
- Kong, F.; Yin, H.; Nakagoshi, N.; Zong, Y. Urban Green Space Network Development for Biodiversity Conservation: Identification Based on Graph Theory and Gravity Modeling. Landsc. Urban Plan. 2010, 95, 16–27. [Google Scholar] [CrossRef]
- Peng, J.; Yang, Y.; Liu, Y.; Hu, Y.; Du, Y.; Meersmans, J.; Qiu, S. Linking ecosystem services and circuit theory to identify ecological security patterns. Sci. Total Environ. 2018, 644, 781–790. [Google Scholar] [CrossRef]
- Beier, P.; Majka, D.R.; Spencer, W.D. Forks in the road: Choices in procedures for designing wildland linkages. Conserv. Biol. 2008, 22, 836–851. [Google Scholar] [CrossRef]
- Mimet, A.; Clauzel, C.; Foltête, J.-C. Locating wildlife crossings for multispecies connectivity across linear infrastructures. Landsc. Ecol. 2016, 31, 1955–1973. [Google Scholar] [CrossRef]
- Li, Q.; Jin, X.; Zhang, X.; Han, B.; Li, H.; Zhou, Y. Comparison and evaluation of the ecological network construction method based on principles of landscape ecology. Acta Ecol. Sin. 2022, 43, 1461–1473. [Google Scholar]
- Wei, J.; Ni, Y.; Shou, T.; Zhang, Y. Construction of ecological security pattern based on land-water coupling ecosystem services: A case study of Yangtze River Delta Ecological Greening Development Demonstration Area. Acta Ecol. Sin. 2023, 43, 5305–5319. [Google Scholar] [CrossRef]
- Yang, Y.; Ma, Q. From deficit to balance: Identifying blue-green infrastructure networks based on trade-offs and synergies between water and terrestrial ecosystem services in a water sensitive region. Ecohydrol. Hydrobiol. 2025, 100656. [Google Scholar] [CrossRef]
- Ward, J.; Tockner, K.; Arscott, D.B.; Claret, C. Riverine landscape diversity. Freshw. Biol. 2002, 47, 517–539. [Google Scholar] [CrossRef]
- Liu, X.; Qin, H.; Ye, Z.; Yao, D.; Miao, W.; Mao, S. Interconnected Mn-Doped Ni (OH)2 Nanosheet Layer for Bifunctional Urea Oxidation and Hydrogen Evolution: The Relation between Current Drop and Urea Concentration during the Long-Term Operation. ACS ES&T Eng. 2022, 2, 853–862. [Google Scholar]
- Zhang, L.; Peng, J.; Liu, Y.; Wu, J. Coupling ecosystem services supply and human ecological demand to identify landscape ecological security pattern: A case study in Beijing–Tianjin–Hebei region, China. Urban Ecosyst. 2017, 20, 701–714. [Google Scholar] [CrossRef]
- Dong, J.; Peng, J.; Xu, Z.; Liu, Y.; Wang, X.; Li, B. Integrating regional and interregional approaches to identify ecological security patterns. Landsc. Ecol. 2021, 36, 2151–2164. [Google Scholar] [CrossRef]
- Gao, M.; Hu, Y.; Bai, Y. Construction of ecological security pattern in national land space from the perspective of the community of life in mountain, water, forest, field, lake and grass: A case study in Guangxi Hechi, China. Ecol. Indic. 2022, 139, 108867. [Google Scholar] [CrossRef]
- Liu, H.; Niu, T.; Yu, Q.; Yang, L.; Ma, J.; Qiu, S.; Wang, R.; Liu, W.; Li, J. Spatial and temporal variations in the relationship between the topological structure of eco-spatial network and biodiversity maintenance function in China. Ecol. Indic. 2022, 139, 108919. [Google Scholar] [CrossRef]
- Zhang, R.; Zhang, Q.; Zhang, L.; Zhong, Q.; Liu, J.; Wang, Z. Identification and extraction of a current urban ecological network in Minhang District of Shanghai based on an optimization method. Ecol. Indic. 2022, 136, 108647. [Google Scholar] [CrossRef]
- Hossain, M.L.; Li, J. NDVI-based vegetation dynamics and its resistance and resilience to different intensities of climatic events. Glob. Ecol. Conserv. 2021, 30, e01768. [Google Scholar] [CrossRef]
- Teng, J.; Xia, S.; Liu, Y.; Yu, X.; Duan, H.; Xiao, H.; Zhao, C. Assessing habitat suitability for wintering geese by using Normalized Difference Water Index (NDWI) in a large floodplain wetland, China. Ecol. Indic. 2021, 122, 107260. [Google Scholar] [CrossRef]
- Godet, C.; Clauzel, C. Comparison of landscape graph modelling methods for analysing pond network connectivity. Landsc. Ecol. 2021, 36, 735–748. [Google Scholar] [CrossRef]
- Luo, J.; Fu, H. Constructing an urban cooling network based on PLUS model: Implications for future urban planning. Ecol. Indic. 2023, 154, 110887. [Google Scholar] [CrossRef]
- Soille, P.; Vogt, P. Morphological segmentation of binary patterns. Pattern Recognit. Lett. 2009, 30, 456–459. [Google Scholar] [CrossRef]
- Albert, R.; Barabási, A.-L. Statistical mechanics of complex networks. Rev. Mod. Phys. 2002, 74, 47–97. [Google Scholar] [CrossRef]
- Yang, S.; Yang, G.; Li, B.; Wan, R. Water quality improves with increased spatially surface hydrological connectivity in plain river network areas. J. Environ. Manag. 2025, 377, 124703. [Google Scholar] [CrossRef]
- Van Looy, K.; Piffady, J.; Cavillon, C.; Tormos, T.; Landry, P.; Souchon, Y. Integrated modelling of functional and structural connectivity of river corridors for European otter recovery. Ecol. Model. 2014, 273, 228–235. [Google Scholar] [CrossRef]
- Harvey, J.W.; Schaffranek, R.W.; Noe, G.B.; Larsen, L.G.; Nowacki, D.J.; O’Connor, B.L. Hydroecological factors governing surface water flow on a low-gradient floodplain. Water Resour. Res. 2009, 45. [Google Scholar] [CrossRef]
- Ding, M.; Liu, W.; Xiao, L.; Zhong, F.; Lu, N.; Zhang, J.; Zhang, Z.; Xu, X.; Wang, K. Construction and optimization strategy of ecological security pattern in a rapidly urbanizing region: A case study in central-south China. Ecol. Indic. 2022, 136, 108604. [Google Scholar] [CrossRef]
- Bai, X.; Zhang, P.; Yang, Z.; Zhang, D.; Dong, X.; Wang, S.; Sun, H.; Feng, Y.; Li, S.; Xiong, L.; et al. Impacts of dams on fish habitat connectivity greatly outweigh climate change in the Jinsha river basin, China. J. Hydrol. 2025, 660, 133411. [Google Scholar] [CrossRef]
- Huang, L.; Wang, J.; Fang, Y.; Zhai, T.; Cheng, H. An integrated approach towards spatial identification of restored and conserved priority areas of ecological network for implementation planning in metropolitan region. Sustain. Cities Soc. 2021, 69, 102865. [Google Scholar] [CrossRef]
- Tang, F.; Zhou, X.; Wang, L.; Zhang, Y.; Fu, M. Linking Ecosystem Service and MSPA to Construct Landscape Ecological Network of the Huaiyang Section of the Grand Canal. Land 2021, 10, 919. [Google Scholar] [CrossRef]
- McRae, B.H.; Dickson, B.G.; Keitt, T.H.; Shah, V.B. Using Circuit Theory to Model Connectivity in Ecology, Evolution, and Conservation. Ecology 2008, 89, 2712–2724. [Google Scholar] [CrossRef] [PubMed]
- Beaujean, S.; Nor, A.N.M.; Brewer, T.; Zamorano, J.G.; Dumitriu, A.C.; Harris, J.; Corstanje, R. A multistep approach to improving connectivity and co-use of spatial ecological networks in cities. Landsc. Ecol. 2021, 36, 2077–2093. [Google Scholar] [CrossRef]
- Liang, G.; Niu, H.; Li, Y. A multi-species approach for protected areas ecological network construction based on landscape connectivity. Glob. Ecol. Conserv. 2023, 46, e02569. [Google Scholar] [CrossRef]
- Raj, A.; Jhariya, M.K.; Banerjee, A.; Meena, R.S.; Kumar, S.; Devi, A.; Poonam. Chapter 15-Agroforestry and ecosystem services. In Agroforestry for Carbon and Ecosystem Management; Jhariya, M.K., Meena, M.S., Banerjee, A., Kumar, S., Raj, A., Eds.; Academic Press: Cambridge, MA, USA, 2024; pp. 205–221. [Google Scholar]
- Chen, H.; Yan, W.; Li, Z.; Wende, W.; Xiao, S. A framework for integrating ecosystem service provision and connectivity in ecological spatial networks: A case study of the Shanghai metropolitan area. Sustain. Cities Soc. 2024, 100, 105018. [Google Scholar] [CrossRef]
- Zhang, R.; Zhang, L.; Zhong, Q.; Zhang, Q.; Ji, Y.; Song, P.; Wang, Q. An optimized evaluation method of an urban ecological network: The case of the Minhang District of Shanghai. Urban For. Urban Green. 2021, 62, 127158. [Google Scholar] [CrossRef]
- Peng, J.; Wang, X.; Liu, Y.; Zhao, Y.; Xu, Z.; Zhao, M.; Qiu, S.; Wu, J. Urbanization impact on the supply-demand budget of ecosystem services: Decoupling analysis. Ecosyst. Serv. 2020, 44, 101139. [Google Scholar] [CrossRef]
- Serrana, J.M.; Li, B.; Watanabe, K. Cross-taxa assessment of species diversity and phylogenetic structure of benthic communities in a dam-impacted river undergoing habitat restoration. Sci. Total Environ. 2025, 958, 177886. [Google Scholar] [CrossRef]
- Watson, J.M.; Coghlan, S.M., Jr.; Zydlewski, J.; Hayes, D.B.; Kiraly, I.A. Dam Removal and Fish Passage Improvement Influence Fish Assemblages in the Penobscot River, Maine. Trans. Am. Fish. Soc. 2018, 147, 525–540. [Google Scholar] [CrossRef]
- Beck, C.; Albayrak, I.; Meister, J.; Peter, A.; Selz, O.M.; Leuch, C.; Vetsch, D.F.; Boes, R.M. Swimming Behavior of Downstream Moving Fish at Innovative Curved-Bar Rack Bypass Systems for Fish Protection at Water Intakes. Water 2020, 12, 3244. [Google Scholar] [CrossRef]
- Thieme, M.; Birnie-Gauvin, K.; Opperman, J.J.; Franklin, P.A.; Richter, H.; Baumgartner, L.; Ning, N.; Vu, A.V.; Brink, K.; Sakala, M.; et al. Measures to safeguard and restore river connectivity. Environ. Rev. 2023, 32, 366–386. [Google Scholar] [CrossRef]
- Guan, F.J.; Liu, L.H.; Liu, J.W.; Fu, Y.; Wang, L.Y.; Wang, F.; Li, Y.; Yu, X.D.; Che, N.; Xiao, Y. Systematically promoting the construction of natural ecological protection and governance capacity: Experts comments on Master Plan for Major Projects of National Important Ecosystem Protection and Restoration (2021–2035). J. Nat. Resour. 2021, 36, 290–299. [Google Scholar] [CrossRef]
- Xie, Y.; Zou, J.; Chen, Y.; Li, F.; Jiang, Q. Are wading birds the ideal focal species for broader bird conservation? A cost-effective approach to ecological network planning. Ecol. Indic. 2024, 160, 111785. [Google Scholar] [CrossRef]
- Larson, D.M.; Carhart, A.M.; Lund, E.M. Aquatic vegetation types identified during early and late phases of vegetation recovery in the Upper Mississippi River. Ecosphere 2023, 14, e4468. [Google Scholar] [CrossRef]
- Mundahl, N.D.; Mundahl, E.D. Aquatic community structure and stream habitat in a karst agricultural landscape. Ecol. Process. 2022, 11, 18. [Google Scholar] [CrossRef]
- Belle, C.C.; Stoeckle, B.C.; Geist, J. Taxonomic and geographical representation of freshwater environmental DNA research in aquatic conservation. Aquat. Conserv. Mar. Freshw. Ecosyst. 2019, 29, 1996–2009. [Google Scholar] [CrossRef]
- Abecasis, D.; Steckenreuter, A.; Reubens, J.; Aarestrup, K.; Alós, J.; Badalamenti, F.; Bajona, L.; Boylan, P.; Deneudt, K.; Greenberg, L.; et al. A review of acoustic telemetry in Europe and the need for a regional aquatic telemetry network. Anim. Biotelemetry 2018, 6, 12. [Google Scholar] [CrossRef]


| Data Name | Source | Accuracy | Year |
|---|---|---|---|
| Land use data | Resource Environmental Science and Data Platform, https://www.resdc.cn/, European Space Agency (ESA), https://www.esa.int/ | 30 m | 2020 |
| Normalized Difference Vegetation Index (NDVI) | Landsat 8/9 derived from satellite remote sensing imagery | 30 m | 2022 |
| Water-system distribution data | Territorial Spatial Master Plan for Demonstration of ecological green integration development in Yangtze River Delta (2021–2035), http://www.jiashan.gov.cn; Shanghai River and Lake Report (2022), https://www.shqp.gov.cn; Wujiang District Geological Hazard Prevention and Control Plan, http://www.wujiang.gov.cn/zgwj/slsw/xxgk_list.shtml (accessed on 13 March 2023) | 1:50,000 | 2022 |
| Sluices data | – | 2022 | |
| Normalized Difference Water Index (NDWI) | Landsat 8/9 derived from satellite remote sensing imagery | 30 m | 2022 |
| Category | Freshwater Ecosystem | Terrestrial Ecosystem |
|---|---|---|
| Source | ||
| Number of Ecological Sources | 78 | 100 |
| Number of Primary Sources | 32 (66.07%) | 33 (56.81%) |
| Average Area of Primary Sources (ha) | 561.54 | 209.40 |
| Average dPC of Primary Sources | 0.10 | 0.08 |
| Number of Secondary Sources | 46 | 67 |
| Average Area of Secondary Sources (ha) | 200.62 | 78.32 |
| Average dPC of Secondary Sources | 0.0272 | 0.0222 |
| Total Area of Ecological Sources (ha) | 27,195.61 (11.82%) | 12,157.96 (5.29%) |
| Average Area of Ecological Sources (ha) | 348.66 | 121.58 |
| Corridor | ||
| Number of Ecological Corridors | 160 | 203 |
| Total Length of Ecological Corridors (km) | 456.35 | 658.79 |
| Proportion of Primary Corridors | 42.50% (96 corridors) | 36.45% (74 corridors) |
Disclaimer/Publisher’s Note: The statements, opinions and data contained in all publications are solely those of the individual author(s) and contributor(s) and not of MDPI and/or the editor(s). MDPI and/or the editor(s) disclaim responsibility for any injury to people or property resulting from any ideas, methods, instructions or products referred to in the content. |
© 2025 by the authors. Licensee MDPI, Basel, Switzerland. This article is an open access article distributed under the terms and conditions of the Creative Commons Attribution (CC BY) license (https://creativecommons.org/licenses/by/4.0/).
Share and Cite
Cai, T.; Shi, Q.; Luo, T.; Zheng, Y.; Shen, X.; Xie, Y. Separate Versus Unified Ecological Networks: Validating a Dual Framework for Biodiversity Conservation in Anthropogenically Disturbed Freshwater–Terrestrial Ecosystems. Land 2025, 14, 1562. https://doi.org/10.3390/land14081562
Cai T, Shi Q, Luo T, Zheng Y, Shen X, Xie Y. Separate Versus Unified Ecological Networks: Validating a Dual Framework for Biodiversity Conservation in Anthropogenically Disturbed Freshwater–Terrestrial Ecosystems. Land. 2025; 14(8):1562. https://doi.org/10.3390/land14081562
Chicago/Turabian StyleCai, Tianyi, Qie Shi, Tianle Luo, Yuechun Zheng, Xiaoming Shen, and Yuting Xie. 2025. "Separate Versus Unified Ecological Networks: Validating a Dual Framework for Biodiversity Conservation in Anthropogenically Disturbed Freshwater–Terrestrial Ecosystems" Land 14, no. 8: 1562. https://doi.org/10.3390/land14081562
APA StyleCai, T., Shi, Q., Luo, T., Zheng, Y., Shen, X., & Xie, Y. (2025). Separate Versus Unified Ecological Networks: Validating a Dual Framework for Biodiversity Conservation in Anthropogenically Disturbed Freshwater–Terrestrial Ecosystems. Land, 14(8), 1562. https://doi.org/10.3390/land14081562