Article

Characteristics and Driving Factors of the Spatial and Temporal Evolution of County Urban–Rural Integration—Evidence from the Beijing–Tianjin–Hebei Region, China

1
School of Architecture, Tianjin University, Tianjin 300072, China
2
School of Architecture, Tianjin Chengjian University, Tianjin 300384, China
3
Tianjin Key Laboratory of Smart City Planning, Tianjin 300190, China
4
Architectural Design Planning Research Institute Co., Ltd., Tianjin University, Tianjin 300072, China
*
Author to whom correspondence should be addressed.
Land 2025, 14(8), 1563; https://doi.org/10.3390/land14081563
Submission received: 14 June 2025 / Revised: 19 July 2025 / Accepted: 26 July 2025 / Published: 30 July 2025

Abstract

Urban–rural integration realises the coordinated development and prosperity of urban and rural areas as a whole by optimising the allocation of resources and the flow of factors, and its connotations have been extended from a single dimension to multiple dimensions such as people, land and industry. The Beijing–Tianjin–Hebei Region has a typical “Core–Periphery Structure”, and this paper took the 187 county units within the region as the research object, taking into account indicators of development and coordination to construct an evaluation index system of urban–rural integration of the Beijing–Tianjin–Hebei region counties in the dimensions of “people–land–industry”. Global principal component analysis was used to measure the evolutionary pattern of the urban–rural integration level between 2005 and 2020, and its spatiotemporal drivers were analysed by using the Geographical and Temporal Weighted Regression model (GTWR). The results of the study show that (1) the level of urban–rural integration in the Beijing–Tianjin–Hebei region showed an increasing trend during the 15-year study period, the high-value areas of urban–rural integration were mainly distributed in Beijing and the Bohai Rim region in the eastern part of the Tianjin–Hebei region, and the level of urban–rural integration of the peri-urban county units of the city was better than that of the remote counties and cities as a whole. (2) In terms of spatial agglomeration, all dimensions were characterised by significant spatial agglomeration. The degree of agglomeration was categorised as urban–rural comprehensive integration (U-RCI) > urban–rural industry integration (U-RII) > urban–rural land integration (U-RLI) > urban–rural people integration (U-RPI). (3) In terms of spatial and temporal driving factors for urban–rural integration, the driving role of U-RPI, U-RLI and U-RII for U-RCI has gradually weakened during the past 15 years, and urban–rural integration in the counties shifted from a single role to a more central coordinated and multidimensional driving role.

1. Introduction

Whether in developed countries such as Europe, the United States, Japan, and South Korea, or in developing countries such as Latin American countries and China, urban–rural relations have generally undergone an evolutionary process from binary division to unidirectional flow and finally to interactive integration [1,2]. In this process, all countries have set the ultimate goal of narrowing the urban–rural gap and achieving common prosperity, a concept first articulated in Howard’s Garden City theory [3] and Saarinen’s organic dispersion theory [4]. Industrialisation and urbanisation are the core drivers of rural–urban transformation. This is both a spontaneous outcome of labour production and closely related to local resources and policies. For example, in countries like Brazil and Mexico, radical land consolidation and lagging urbanisation processes have led to large numbers of landless farmers flooding into cities and forming slums, shifting the urban–rural divide to within cities. In China, however, collective land ownership and restrictions on land transfers have constrained rural development.
In common understanding, the urban–rural relationship is a centre–periphery relationship [5], where cities serve as centres of resource aggregation and innovation, holding a dominant position, while rural areas are viewed as dependent peripheral regions. However, the actual centre–periphery relationship is not so simple. In addition to cities and rural areas, transitional regions with distinct characteristics, such as Rurban areas, suburban areas, and peri-urban areas, have emerged [6]. In terms of spatial structure, it also exhibits multi-centric networked [7], single-polar siphon-type [8], and dual-core driven [9] structures.
The essence of urban–rural integration lies in mutual benefit and symbiosis. Rural areas provide cities with a solid foundation in terms of labour force, land resources, ecological barriers, and agricultural product supply, while cities inject capital momentum, technological diffusion, extended public services, and institutional innovation into rural areas. Through the flow of factors and functional complementarity, both sides achieve mutual prosperity. However, the process of achieving urban–rural integration is a long and complex one. Internationally, before the 1950s, Marx and Engels pointed out that urban–rural relations follow an inevitable and prolonged trend of ‘separation–opposition–integration’ [10]; during that period, numerous theoretical concepts on urban–rural integration emerged [11]. From the 1950s to the 1970s, urban–rural relations shifted from a dualistic development model [12] to a focus on agriculture and rural areas, offering insights for the development of developing countries. However, the excessive emphasis on rural development gave rise to ‘rural-centrism’, pushing urban–rural relations to another extreme. Since the 1980s, scholars have begun to emphasise balanced development between urban and rural areas and blur the boundaries between them, formally ushering urban–rural relations into the realm of urban–rural integration [13].
In China, the heavy industry-first strategy implemented in the early years of the People’s Republic of China in 1949 gave rise to a system where agriculture supported industry and rural areas supported cities. Following the reform and opening-up in 1978, rural economic reforms unleashed the vitality of production factors, leading to a period of easing in urban–rural relations. Since the 21st century, with the abolition of agricultural taxes and the advancement of new rural construction, a historic turning point was achieved where cities began to subsidise rural areas. After the 18th National Congress of the Communist Party of China, the rural revitalisation strategy and urban–rural integration policies marked the arrival of the integration phase [14]. Chinese government committed to “insist on prioritizing the development of agriculture and rural areas”, “insist on the integrated development of urban and rural areas”, and “coordinate the layout of rural infrastructure and public services, and build a liveable, workable and beautiful countryside”. This shows that the focus of urban–rural development has shifted from emphasizing cities over rural areas and emphasizing industry over agriculture to integrated urban–rural development. In the face of problems such as an insufficient understanding of the relationship between urban and rural areas, an emphasis on development rather than coordination and a lack of overall coordination between urban and rural areas [15], which have been exposed from the stage of urban–rural confrontation to the stage of urban–rural integrated development, urban–rural integration aims to promote the optimisation of economic, social, living and ecological spatial functions and structures between urban and rural areas. This would be achieved through a two-way flow of resources and factors, to achieve the goal of continuously narrowing the gap between urban and rural areas, achieving a comparable quality of life for urban and rural residents, and organically coordinating urban and rural development in an integrated manner.
Urban–rural integration describes an initiative, path or model to improve urban–rural relations and promote synergistic urban–rural development [16,17]. Internationally, developed countries began exploring the theory of urban–rural integration earlier, leading to the emergence of numerous exemplary practical cases. For instance, in the United States, the town of Clemson has promoted local urban–rural integration through measures such as a county-wide collaborative industrial system, shared supporting facilities across multiple towns, and multi-party co-management of ecological capitalisation [18]. South Korea has designated small towns as the centres of rural regions, implementing the ‘New Village Movement’ to improve the rural labour force structure and achieve modernisation of agriculture and rural areas; through ‘small town development’, it has connected rural and urban areas, gradually narrowing the urban–rural gap [19]. In Japan, through ‘municipal integration’ and the ‘One Village, One Product’ movement, it alleviated the issue of excessive population density in urban areas and differentiated the enhancement of rural competitiveness, effectively promoting on-site urbanisation rates [20].
Research in developing countries was oriented towards practical issues and explores both theory and practice, primarily addressing issues such as economic spatial evolution [21], urban–rural governance [22], and population mobility [23]. In China, some studies have reviewed the conceptual definition [24,25], the stage division [20,21,26,27], the model conception [28,29] and other characteristics of urban–rural integration research, and proposed the analytical framework and theoretical model of urban–rural integration [30,31]. Some scholars have focused on the theoretical connotation [32], the path of realisation [33], and the future prospects [34] of urban–rural integration and rural revitalisation in China’s new era (“Socialism with Chinese characteristics enters new era”). Through quantitative analysis, some scholars have measured the level of urbanisation [35], regional development policies [36,37], the level of factor agglomeration [38], and ecological resource endowment [39], to evaluate the level of urban–rural integration in the dimensions of people, land, society, industry and ecology; such research has involved the national [40], provincial [41,42], urban agglomeration [43], municipal [44], county [45] and other scales. In terms of evaluation indicators, most scholars were able to synthesise multidimensional elements to construct an evaluation framework for urban–rural integration [46].
Overall, previous research mainly focused on assessing the level of urban–rural integration, lacking research on the factors driving the level of urban–rural integration, as well as dynamic evolution and comparative analysis of the level of integration in different dimensions of urban and rural areas. In the previous urban–rural integration evaluation index system, emphasis was placed on the selection of indicators for overall urban–rural development levels, while neglecting the coupling of development and coordination-related indicators. In terms of the study area, due to the limited access to data and practicability of the research, it mainly focused on the provincial level and the prefectural and municipal scale, with less attention paid to small and medium-sized scales, such as counties, and special typical regions. These limitations could make it difficult for real-world policies to accurately address the contradictions between the lack of smooth flow of factors between urban and rural areas and the absence of coordination mechanisms.
Therefore, the purpose of this study is to analyse the level of urban–rural integration and its driving factors in counties in the Beijing–Tianjin–Hebei region. This paper took 187 districts and counties in the Beijing–Tianjin–Hebei region as the research object, and constructed urban–rural integration evaluation indexes that take into account the degree of urban–rural development and the degree of coordination in the three dimensions of people–land–industry, using global principal component analysis and GTWR models to measure the level of urban–rural integration and its driving factors in the Beijing–Tianjin–Hebei region, covering areas such as spatial planning, regional coordination, and institutional design. In particular, the Beijing–Tianjin–Hebei urban agglomeration was selected because of the uneven urban–rural development in the region, the significant siphoning effect of the Beijing–Tianjin area, and the ‘Core–Periphery’ Structure (core areas have high levels of agglomeration and influence, while these factors are lower in peripheral areas) formed with Hebei Province [47,48]. The three dimensions of ‘population, land, and industry’ were chosen because the circulation, interaction, and coordinated advancement of these elements are at the core of the mechanism for integrated urban–rural development [49]. Exploring the urban–rural integration and development law of the trinity of people, land and industry will help to comprehensively understand and grasp the complexity and systemic nature of urban–rural integration, and thus provides scientific basis and practical reference for addressing the issue of urban–rural development imbalance on a global scale.

2. Research Methods and Data Sources

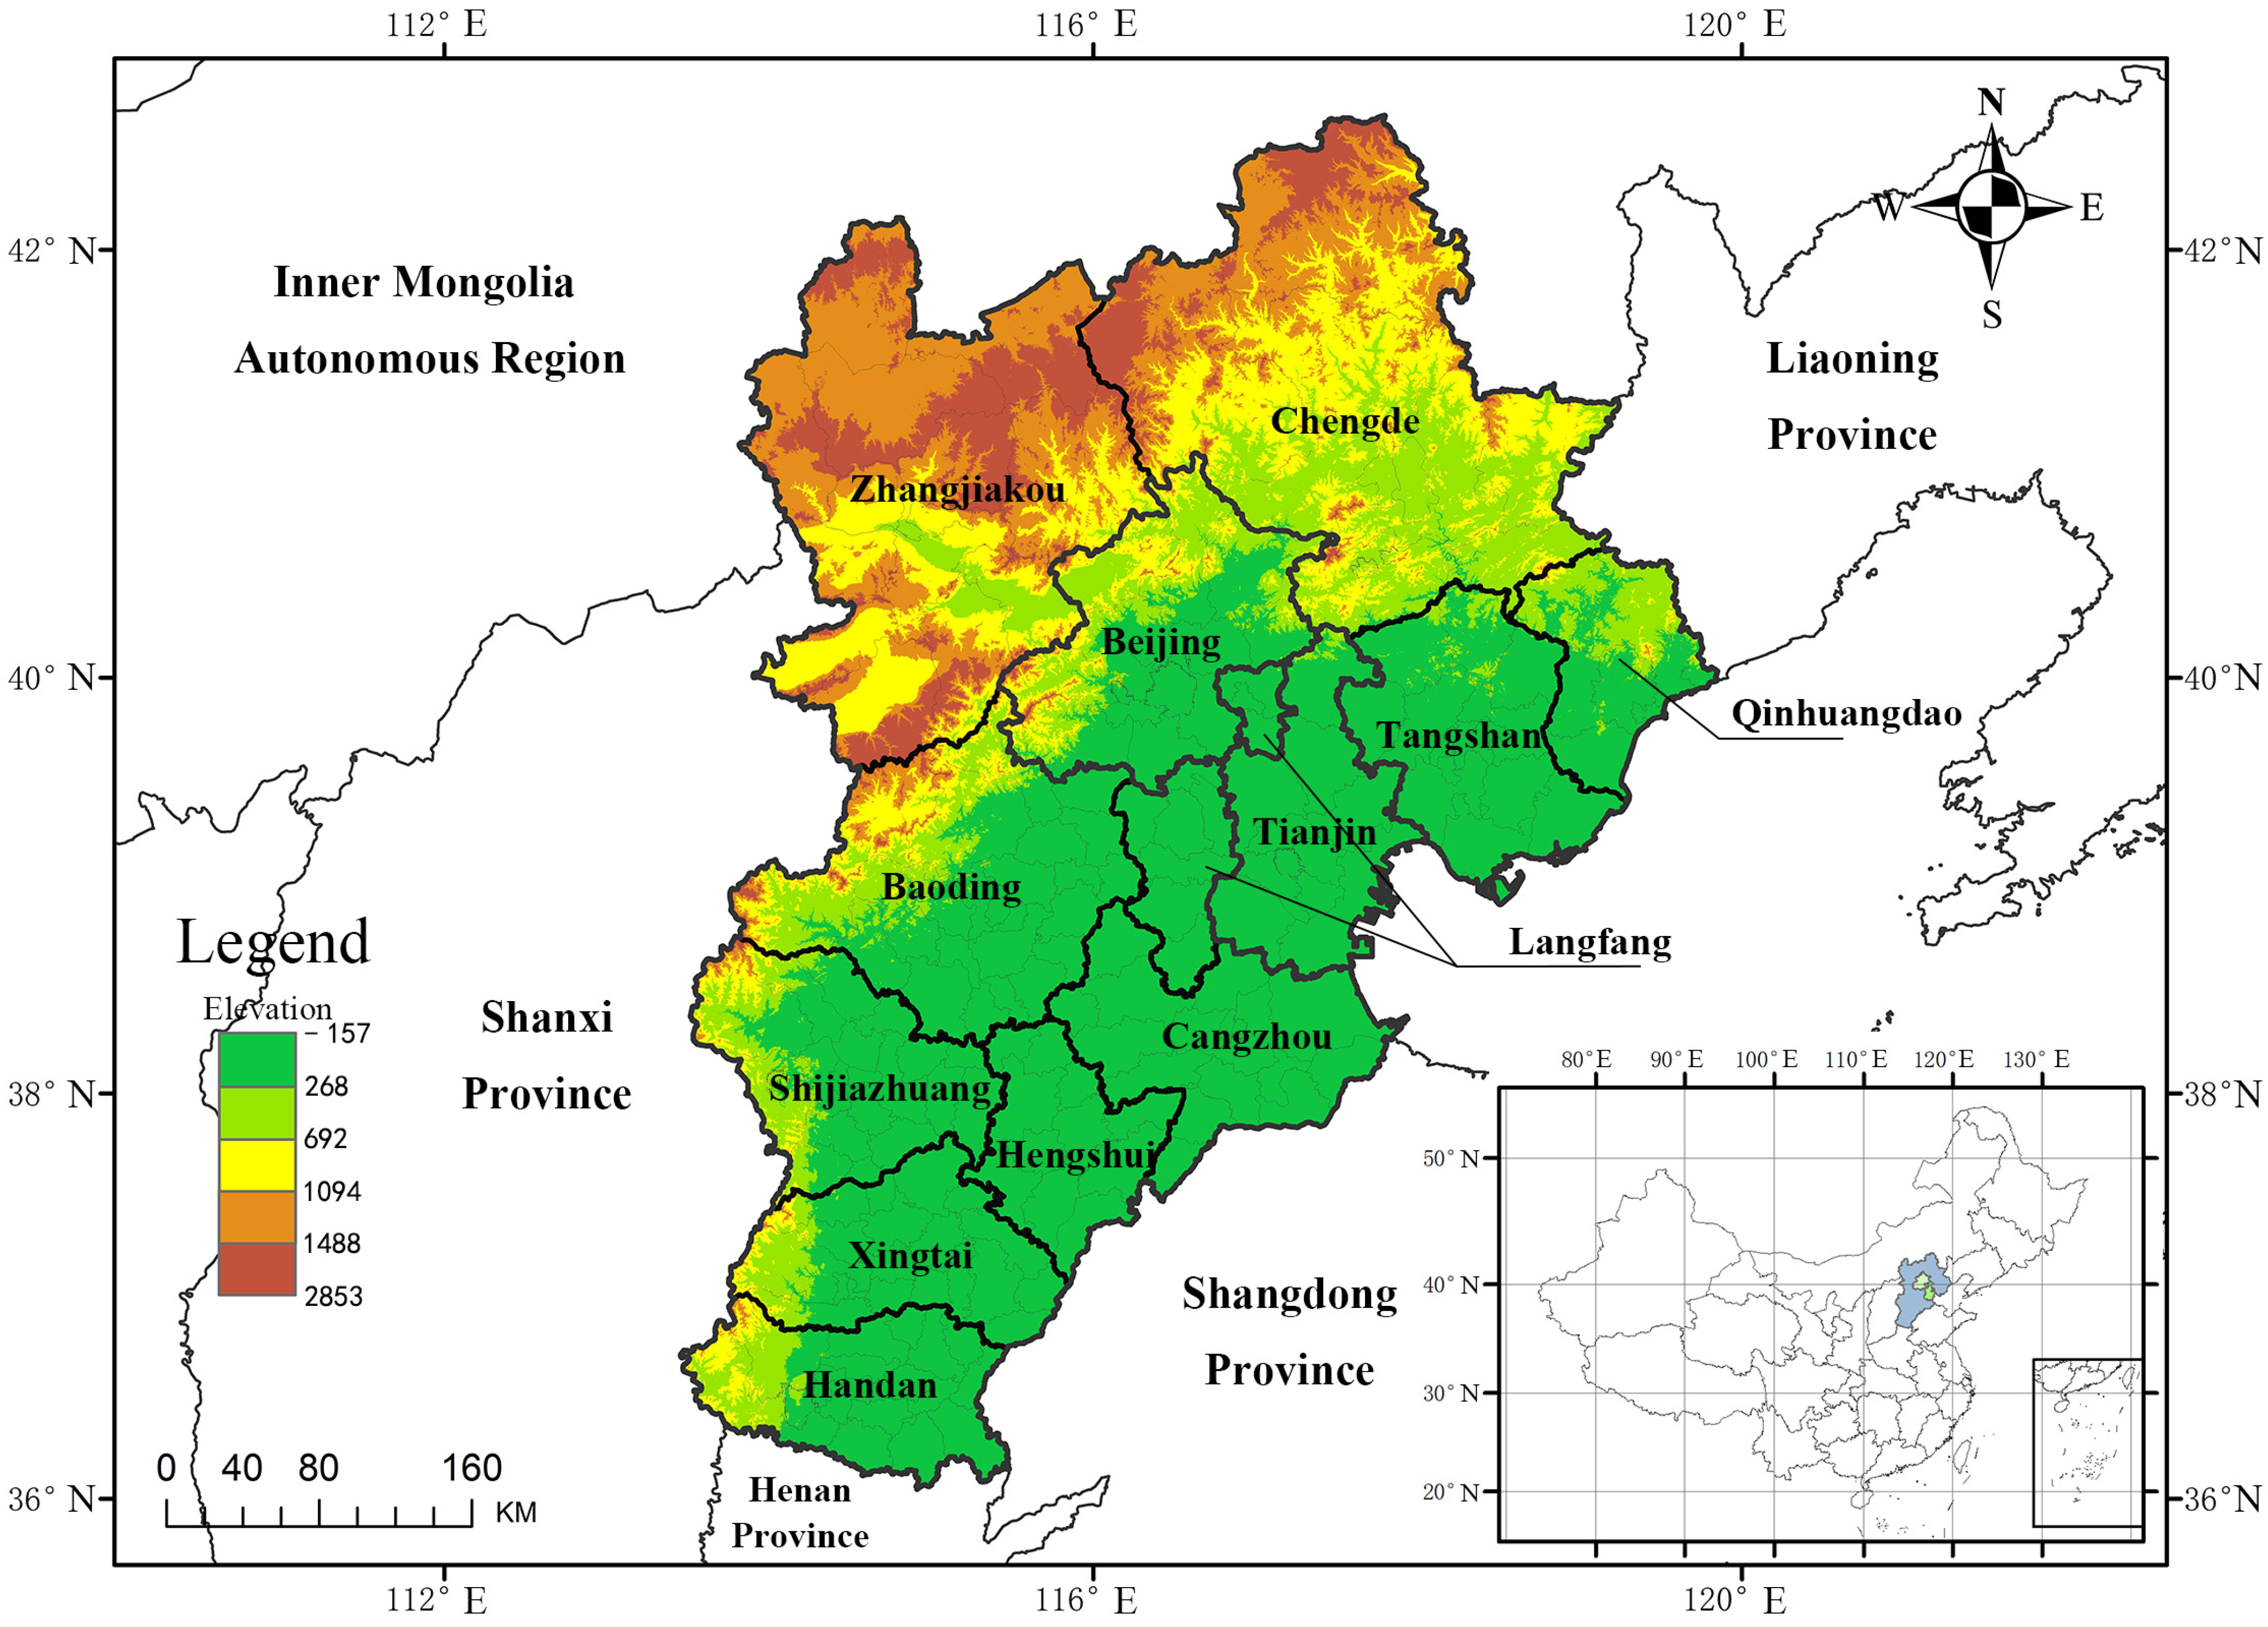
2.1. Overview of the Study Area

The study focuses on the county-level units within the Beijing–Tianjin–Hebei urban agglomeration. There are significant disparities in economic development levels within the Beijing–Tianjin–Hebei region. The dual megacities of Beijing and Tianjin form a distinct development gradient with the surrounding counties and cities in Hebei Province, creating a poverty belt around Beijing and Tianjin. The ‘Core–Periphery Structure’ is pronounced, vividly illustrating the core contradiction between the inadequate radiation capacity of core cities and the uneven development between urban and rural areas. In 2014, the National Bureau of Rural Revitalization released a list of 832 poverty-stricken counties in the country, of which 45 counties in Hebei Province, including Xingtang County and Lingshou County, were listed. As a coordinated development, the Beijing–Tianjin–Hebei development continues to deepen, and the mutual benefit to urban and rural areas has become an important driver of regional integration. However, in terms of urban–rural integration, the cities are not able to simply radiate to and drive the countryside, and the unbalanced development of urban and rural areas in terms of resource allocation, public services and industrial synergies constrains the integration of urban agglomerations and their high-quality development. At the same time, compared to the difficulty of obtaining data from remote counties, data from counties in the Beijing–Tianjin–Hebei urban agglomeration were relatively easy to obtain. Therefore, the selection of the Beijing–Tianjin–Hebei urban agglomeration as the research object in this paper has typicality and practical significance (Figure 1).
Combining data from field research and the results of the seventh national population census, the remaining 187 district and county units in the Beijing–Tianjin–Hebei region were studied, excluding those that no longer have a rural population and are considered to be fully urbanised.

2.2. An Evaluation System for Urban–Rural Integration of People–Land–Industry, Taking into Account Development and Harmonisation

Urban–rural integration is accompanied by an increase in the overall level of urban–rural development and a narrowing of the urban–rural development gap, with the degree of socioeconomic development and coordination between urban and rural areas jointly influencing the breadth and depth of urban–rural integration. Given China’s long-standing urban–rural development situation of emphasizing city while neglecting countryside and its complex and changeable evolution process, it is difficult to describe the urban–rural relationship scientifically and comprehensively with a single-dimension and single-perspective evaluation index system; therefore, connecting the three dimensions of people–land–industry to promote the degree of urban–rural development and coordination has become the way to realise high-quality urban–rural integration in the new era.
Urban–rural development is the basis and prerequisite for urban–rural coordination, focusing on the improvement of the development power, development quality and development capacity of both urban and rural areas; urban–rural coordination is the purpose and guarantee of urban–rural integration, tending to interaction, balanced rationing and a coordinated symbiosis between urban and rural areas. People, land and industry provide the actors, spatial carriers and engine power for the urban–rural system, and the three are coordinated and mutually reinforcing, thereby promoting urban–rural integration in parallel (Figure 2). Based on the dimension of “people–land–industry” and taking into account the indicators of development and coordination, an evaluation index system of urban–rural integration in the Beijing–Tianjin–Hebei region county units was constructed (Table 1).
People are the main actors in urban–rural integration, and with the two-way flow of urban and rural factors and the continuous improvement of rural functions, the gap between the quality of life of urban and rural residents and the level of services they receive has narrowed, and the people factor has become an important indicator of the level of urban–rural integration and development. The savings of urban and rural residents, the teacher–student ratio in basic education, and the number of hospitals and sanatorium beds per 1000 people reflect the degree of protection for urban and rural residents in terms of economic income, education and health care, and are positively correlated with the level of both urban and rural development. The difference in income levels between urban and rural areas, which is the basis for the functioning and needs of urban and rural residents, will further impact the ability of urban and rural residents to have equal access to social resources such as education, medical care and facilities.
Land is the spatial carrier for the flow of urban and rural factors, and land for construction, as a necessary element for urban and rural development, often determines the industrial structure and degree of infrastructure construction in a region. Cultivated land is fundamental to people’s livelihoods, and the per capita occupancy rate of cultivated land is a direct reflection of the stable supply of agricultural products, reflecting the sustainable trend of agricultural production and the attendant level and capacity to ensure food security in both urban and rural areas. Forest land cover can measure the level of ecological development of a county, reflecting the environmental quality and ecosystem health of the region. The urban–rural transportation road network builds the skeleton of urban–rural development and is a prerequisite for expanding the urban–rural development space, enhancing the carrying capacity of urban and rural areas, thereby promoting accessibility and connectivity. An urban–rural road network ratio approaching 1 indicates a more balanced level of urban–rural transport infrastructure construction, which is conducive to the orderly flow of urban and rural resource elements and the optimisation of their allocation.
Industry is the engine and driving force of urban and rural development, and urban–rural industry integration (U-RII) is a key way to drive industrial optimisation and upgrading through innovation, enable the vitality and potential of both urban and rural development, and promote and guide the coordinated and sustainable development of diversified industries. Gross regional product per capita reflects the level of development of a region, accompanied by infrastructure construction and optimisation of the industrial structure. However, if the government, to maximise economic benefits, gives priority to the advantaged industries of developed regions in resource allocation and thereby neglects to optimise and invest in the industries of the less-developed regions, the degree of imbalance in regional development will be exacerbated. Therefore, the ratio of land used for facility-based agriculture can, on the one hand, reflect the government’s support for rural areas and, on the other hand, reflect the level and trend of the development of agricultural modernisation. Urban–rural integration in terms of industry is also reflected in the coupled and coordinated development of industry. If the primary, secondary, and tertiary industries in urban and rural areas develop in a balanced manner, this proves that the industrial structure of urban and rural areas tends to be integrated, and that the products of urban and rural areas are interoperable and complement each other’s advantages. According to the characteristics of the industrial structure of urban and rural areas, agricultural output and non-agricultural output are used to characterise the level of industrial development in rural and urban areas, respectively, and the ratio of non-agricultural output to agricultural output is used to reflect the gap between the urban and rural dual economic structure, thus reflecting the degree of coordinated development of both urban and rural industries. The number of scenic spots reflects the construction and development of culture and tourism in the county, and the rich cultural heritage and pleasant landscapes offer support for the development of tourism.

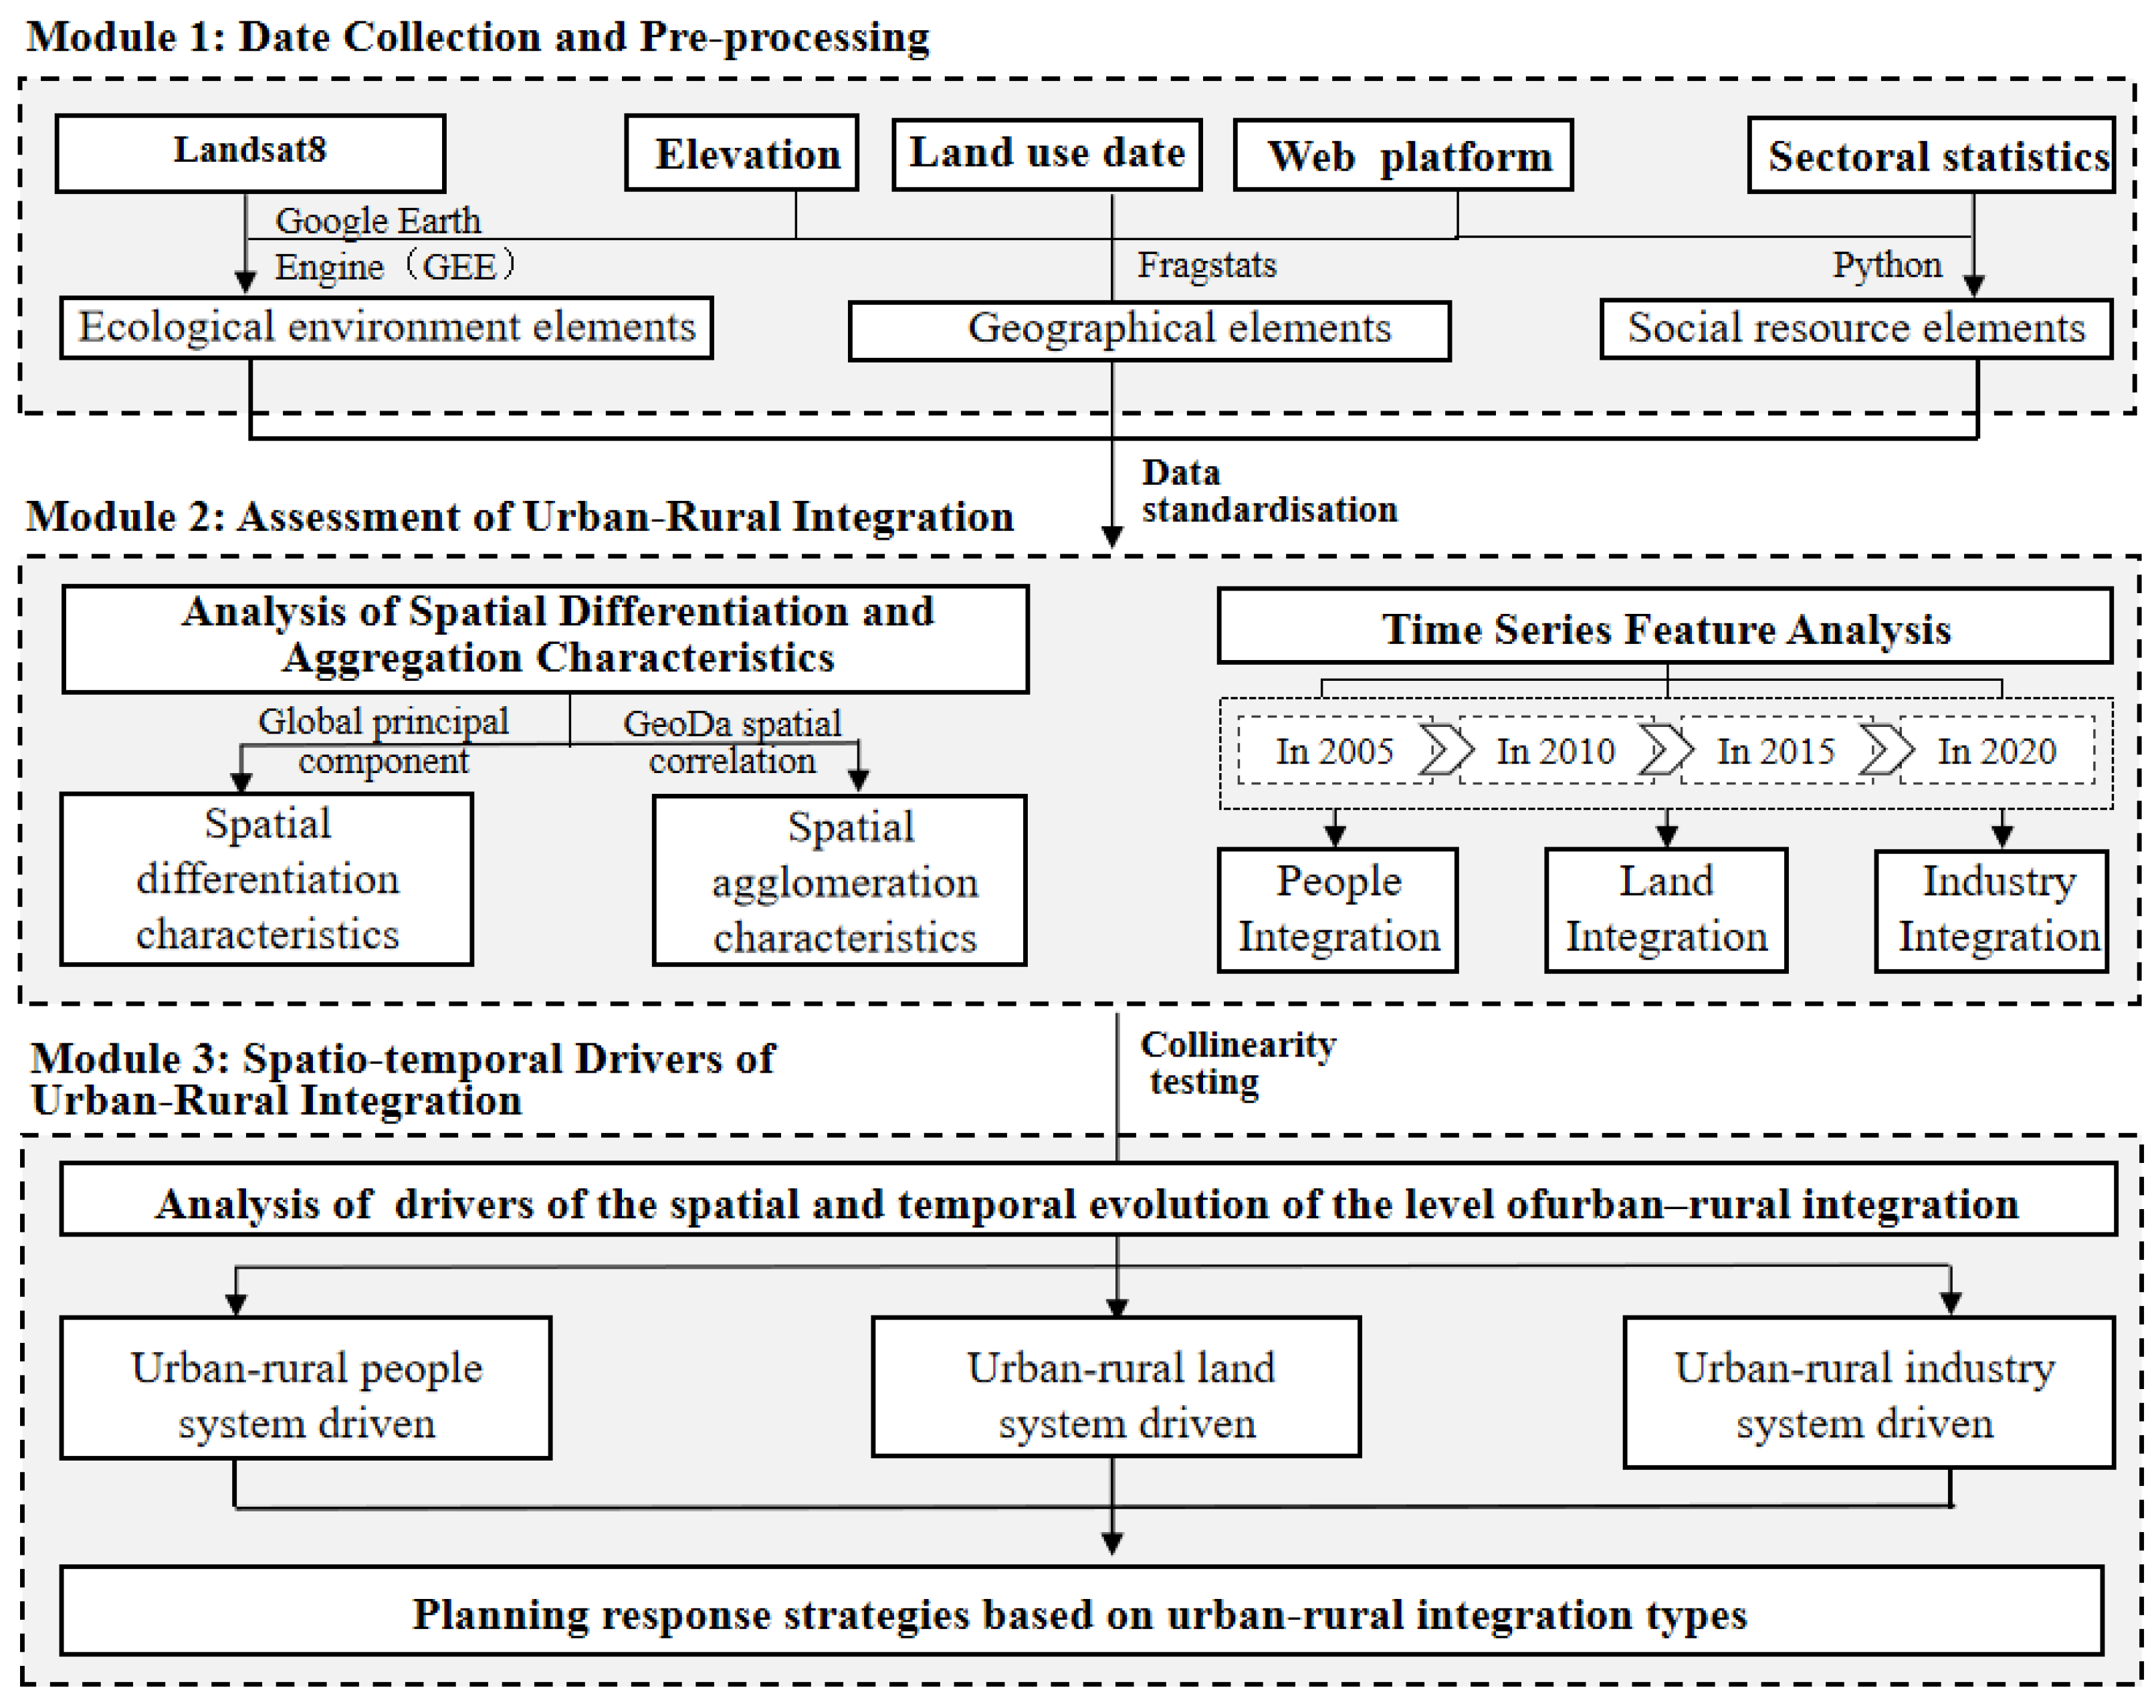
2.3. Technological Route

First, following the principles of representativeness and scientificity, the collected ecological and environmental data, geographical location data, and social resource data were pre-processed using methods such as GEE 2024, Fragstats 4.2 and Python 3.9.2. Secondly, after standardising the data, we analysed the integration of urban and rural people, land, and industries in 2005, 2010, 2015, and 2020 based on global principal component analysis and the Geoda spatial autocorrelation method, summarising their spatial differentiation and aggregation characteristics. Thirdly, based on GTWR, we analysed the driving mechanisms of urban–rural integration in terms of space and time. Finally, we categorised and proposed planning strategies to promote urban–rural integration (Figure 3).

2.4. Data Sources

Data included socioeconomic data, vector data and raster data for 2005, 2010, 2015 and 2020. Among them, the socioeconomic data came from the Seventh National Population Census, the China County Statistical Yearbook, the Beijing Regional Statistical Yearbook, the Tianjin Statistical Yearbook and the statistical yearbooks and bulletins of the cities in Hebei Province, and the missing data were supplemented by linear interpolation combined with the mean value filling method. The vector data included the administrative boundaries of the Beijing–Tianjin–Hebei region and points of interest data of tourist attractions, while the administrative boundaries data were derived from the Chinese standard map issued by the Ministry of Natural Resources (Audit No. GS(2020)4619), the road data were derived from the road dataset of OpenStreetMap, and the points of interest data were derived from the Baidu Map Open Platform. The raster data included a digital elevation model and land use classification data, which were derived from the Geospatial Data Cloud and the 30 m-accuracy China Land Cover Dataset released by Wuhan University, respectively.

2.5. Evaluation Methods

2.5.1. Global Principal Component Analysis

The level of urban–rural integration development in the counties of the Beijing–Tianjin–Hebei region was measured using a two-step global principal component analysis, which can avoid the problems of covariance and subjectivity of the evaluation indexes, and is more comparable overall in the spatiotemporal dimension than classical principal component analysis. In the first step, global principal component analysis was used to determine the weights of the X1–X12 indicators across the three dimensions of people, land and industry, and with the help of the component score coefficient matrix, the index of urban–rural integration development in each dimension was calculated; the second step of global principal component analysis treated each dimension of the urban–rural integration index as a new variable and inputted it into the principal component calculation model again, and the calculation steps were the same as in the first step of principal component analysis.
The factors were summarised using a rotated component matrix, and in general, the indicators with loadings greater than 0.7 in the rotated component matrix were extracted as the constituents of the corresponding principal component indicators. Based on the results of rotating the component matrix, the coefficients in the component score coefficient matrix were extracted and calculated to obtain each principal component score C1, C2, …, Ck and the composite index CI; each principal component was calculated as follows (1) [50]:
C k = m = 1 m α j X j
where C k is the k t h principal component score, which consists of a total of n (m can take the values 1, 2, …, j, …, n) indicators with factor loadings greater than the threshold; α j is the score in the score coefficient matrix corresponding to the j t h indicator among them; X j is the datum corresponding to the j t h indicator.
The formula for calculating the CI of the composite index is as follows (2):
C I = k = 1 p λ k C k
where CI is the composite index, λ k is the eigenvalue corresponding to the k t h principal component, and C k is the k t h principal component score.

2.5.2. Spatial Autocorrelation Analysis

(1)
Global spatial autocorrelation
Global spatial autocorrelation describes the degree of clustering of the spatial distribution as a whole and determines the strength and direction of the correlation of the spatial structure, which is calculated as follows (3):
I = n i   =   1 n j   =   1 n ω i j ( x i x ¯ ) ( x j x ¯ ) i   =   1 n ( x i x ¯ ) 2
where I is the global Moran’s I statistic, which measures the spatial autocorrelation of observations across the study area; n is the number of spatial units; x i and x j are the attribute values of the i t h and j t h spatial units, respectively; x ¯ is the average of the attribute values of all spatial units; and ω i j is an element in the spatial weighting matrix, which represents the spatial relationship between spatial units i and j.
(2)
Local spatial autocorrelation analysis
When agglomeration characteristics appear in the global Moran index, local spatial autocorrelation can be measured to better reflect the spatial location of the agglomeration centres and identify the spatial heterogeneity and spatial outliers in a specific region, which is calculated by the following formula (4):
I i = ( x i x ¯ ) j   =   1 n ω i j ( x j x ¯ ) j   =   1 n ω i j 2
where I i is the local Moran’s I statistic used to assess the local spatial autocorrelation properties of each spatial unit i. Moran’s I values vary between [−1,1], and when I i is greater than 0 and significant, it indicates that the unit has similar attribute values to its neighbouring units (positive correlation or “high-high”, “low-low” clusters), while values less than 0 indicate that the attribute values are opposite to those of neighbouring units (i.e., a negative correlation or “high-low”, “low-high” patterns).

2.5.3. Geographical and Temporal Weighted Regression Model (GTWR)

Compared with geographically weighted regression (GWR), GTWR takes into account both temporal and spatial non-stationarity and analyses the pattern of change in the relationship between the dependent and explanatory variables in the regression parameters in terms of temporal and spatial location.
In this paper, the Ordinary Least Squares (OLS) model, GWR model and GTWR model were established for the data of 187 counties in the Beijing–Tianjin–Hebei region for the years 2005, 2010, 2015 and 2020, and the best-fit model was selected based on the comprehensive measures of AICc, R2 value, and RSS [51]. The GTWR model is calculated as follows (5):
Y i = β 0 μ i , v i , t i + k = 1 p β k μ i , v i , t i X i k + ε i
where μ i , v i , t i represents the spatiotemporal coordinates of the i t h county; β k μ i , v i , t i represents the regression coefficient of the k t h explanatory variable for observation i; and ε i is the model error term.

3. Characteristics of the Spatial and Temporal Evolution in the Level of Urban–Rural Integration in the Beijing–Tianjin–Hebei Region

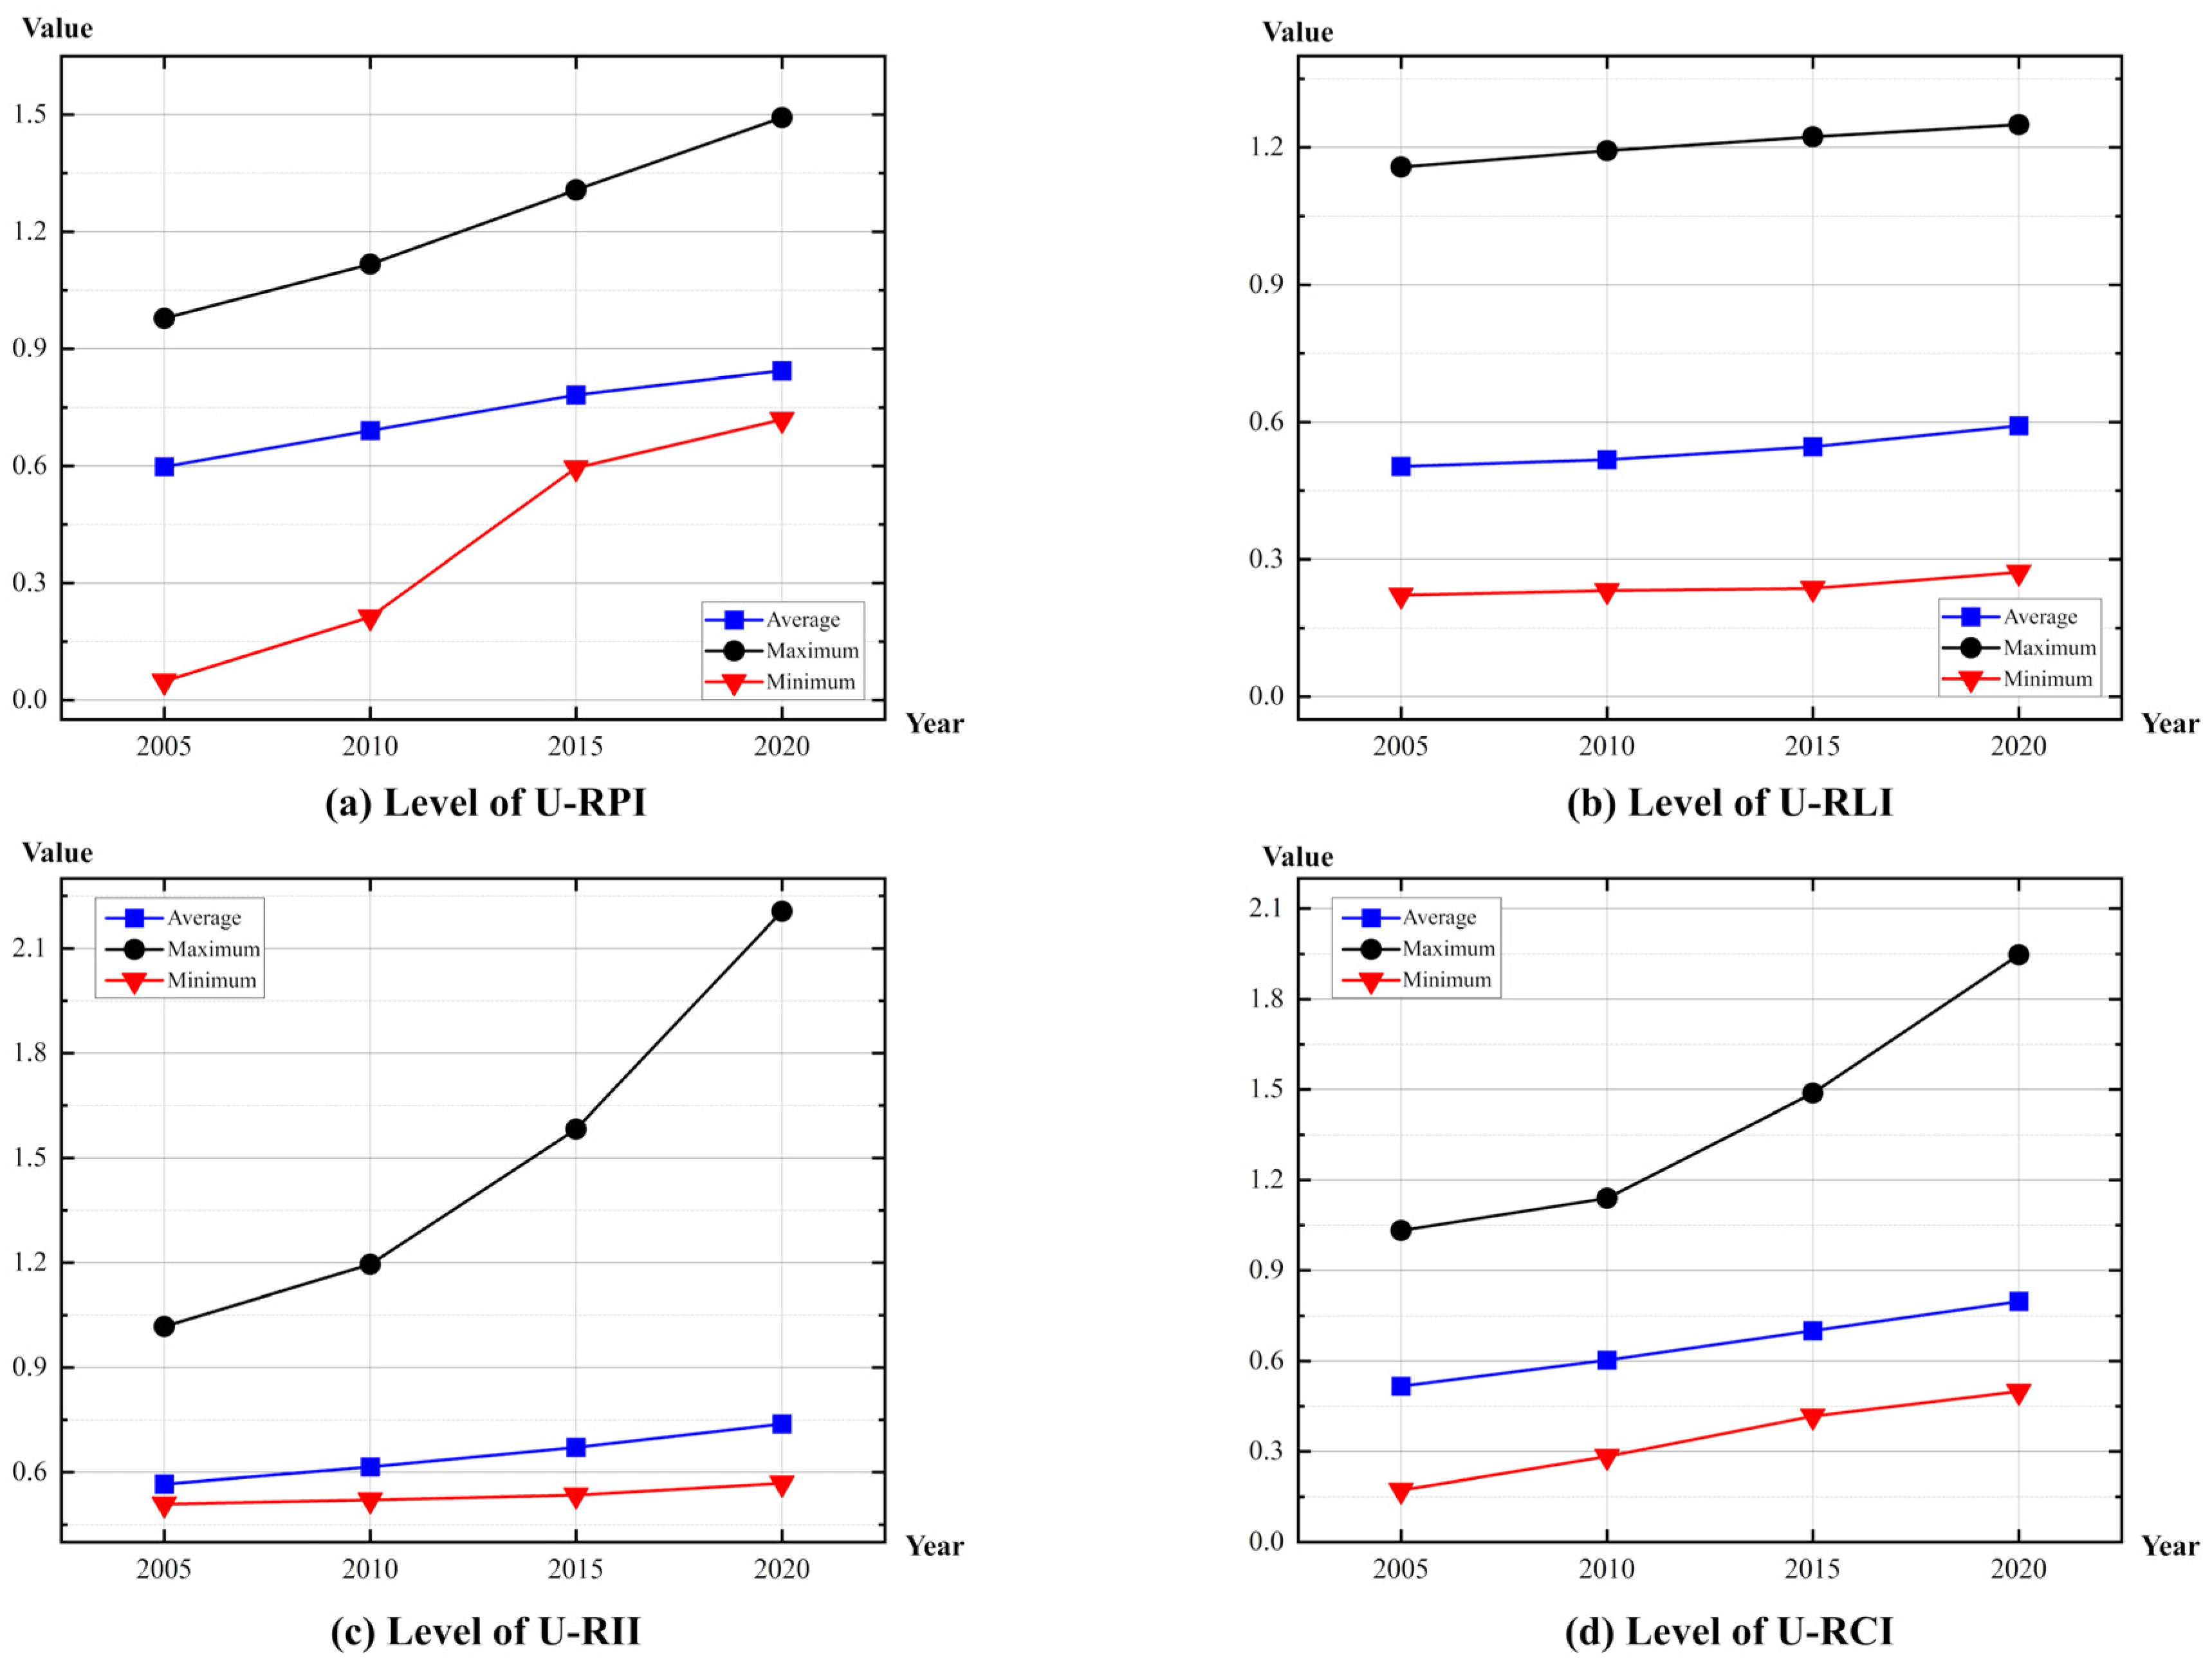
3.1. Characteristics of Time-Series Changes in the Level of Urban–Rural Integration

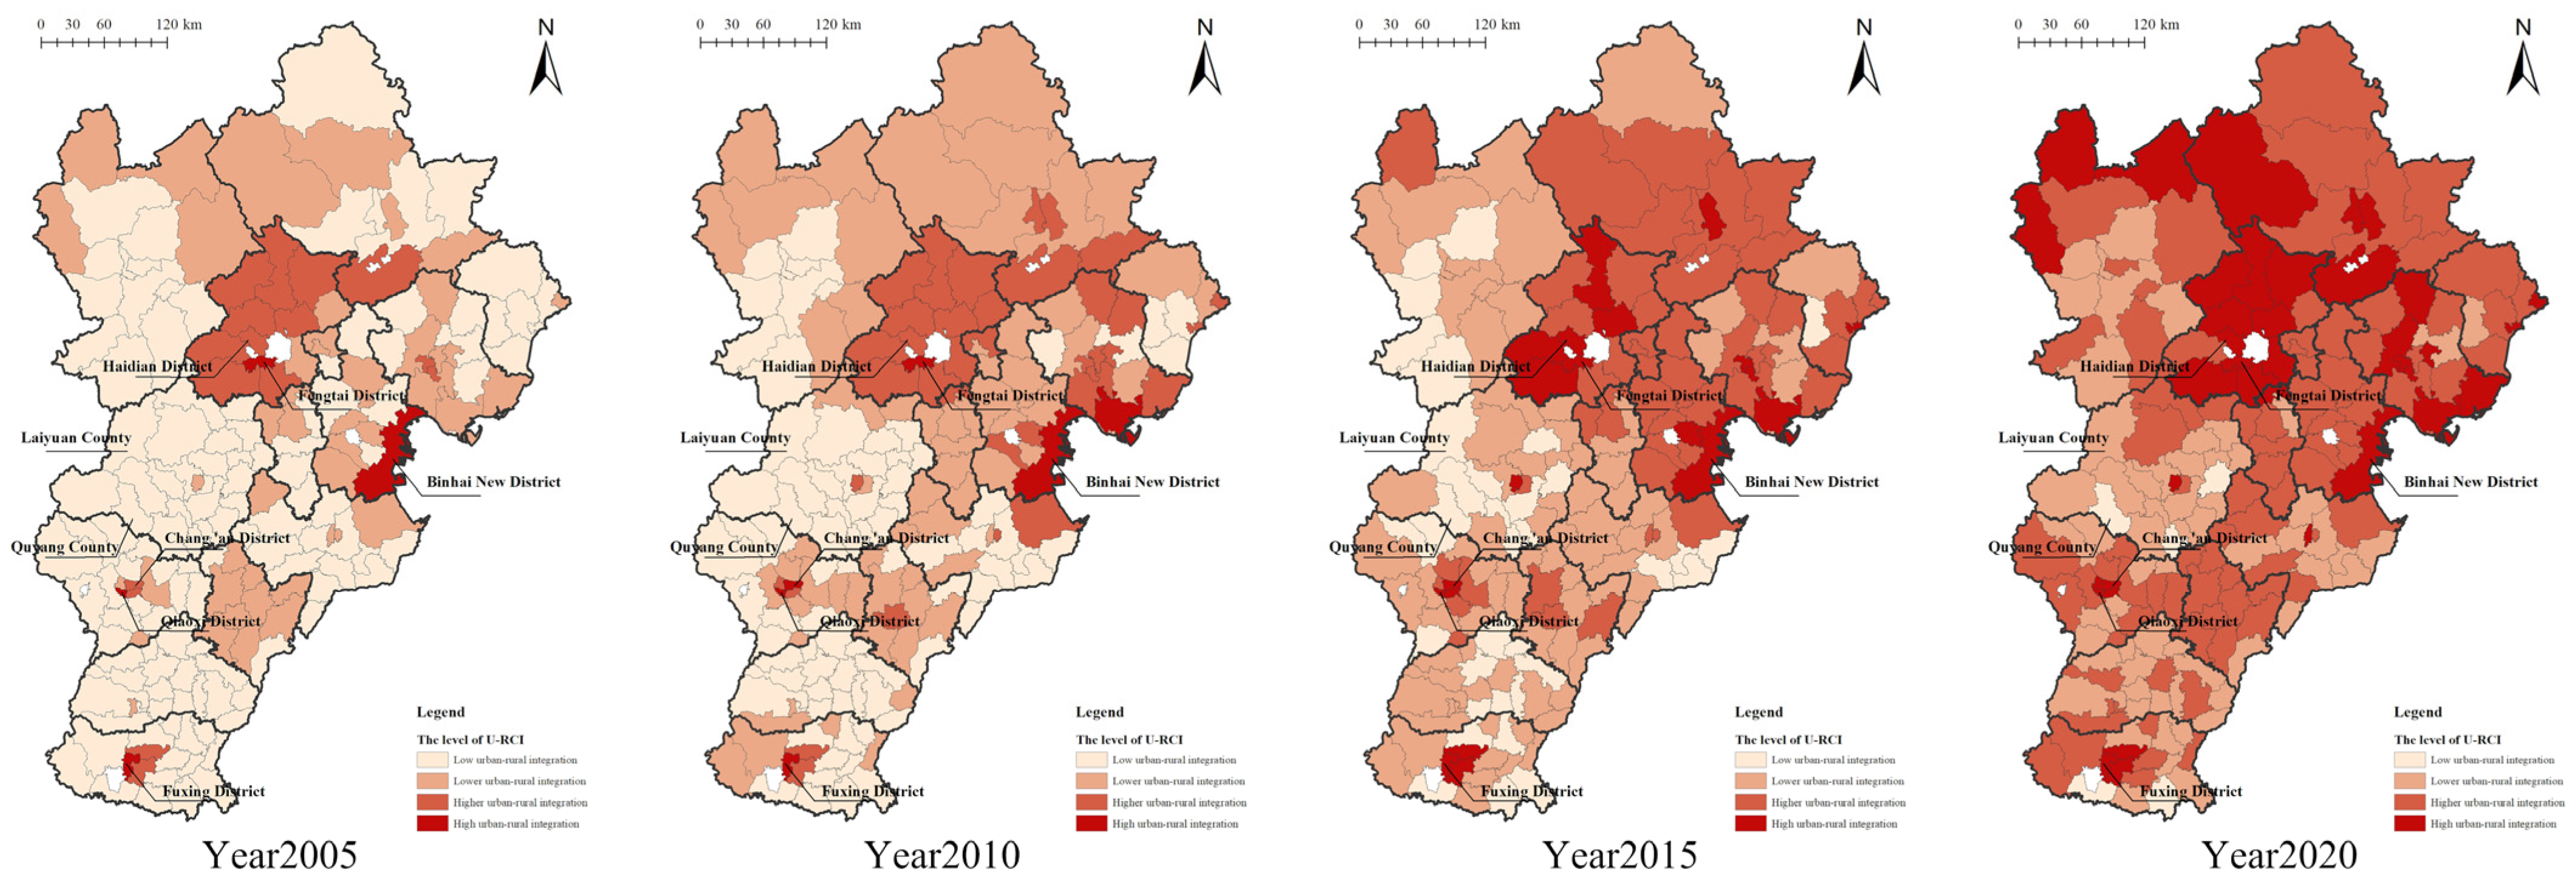
3.1.1. Level of Urban–Rural Comprehensive Integration (U-RCI)

As can be seen (Figure 4 and Figure 5), the level of urban–rural integration in the Beijing–Tianjin–Hebei region showed an incremental trend during the study period, with a significant increase of 54% over the 15-year period. The region where the extreme point is located is relatively stable. At the city level, the city with the highest level of urban–rural integration during the study period is always Beijing, and the lowest is always Baoding. At the county level, the districts and counties with the highest values of urban–rural integration from 2005 to 2020 were Qiaoxi District, Fuxing District, Binhai New Area and Haidian District, and the lowest values were in Laiyuan County and Quyang County.
With the help of the natural break method, the level of urban–rural integration was categorised into four tiers: low urban–rural integration (Lowest level), lower urban–rural integration (Second lowest level), higher urban–rural integration (Second highest level), and high urban–rural integration (Highest level). As can be seen (Figure 5), the high-value areas of urban–rural integration level were mainly distributed in Beijing and the Bohai Rim area in the east of Tianjin and Hebei and showed certain spatial clustering characteristics. Taking 2020, the year with the highest level of comprehensive urban–rural integration, for example, the five districts and counties with the highest level of integration were, in order, Haidian District, Fengtai District, Binhai New Area, Chang’an District and Qiaoxi District, which all belonged to the core region of the Beijing–Tianjin–Hebei region’s integrated development, which proved that good location and resource advantages have a driving effect on the coordinated and integrated integration of urban and rural areas. At the same time, among the 187 districts and counties in the Beijing–Tianjin–Hebei region, the level of urban–rural integration and development in the suburban areas was generally better than that in the more remote counties and cities, forming a development pattern in which the urban areas served as the core of the development, leading to the circulation of urban and rural elements and the synergistic promotion of the neighbouring regions, a feature that was most notable in Shijiazhuang and Handan cities.

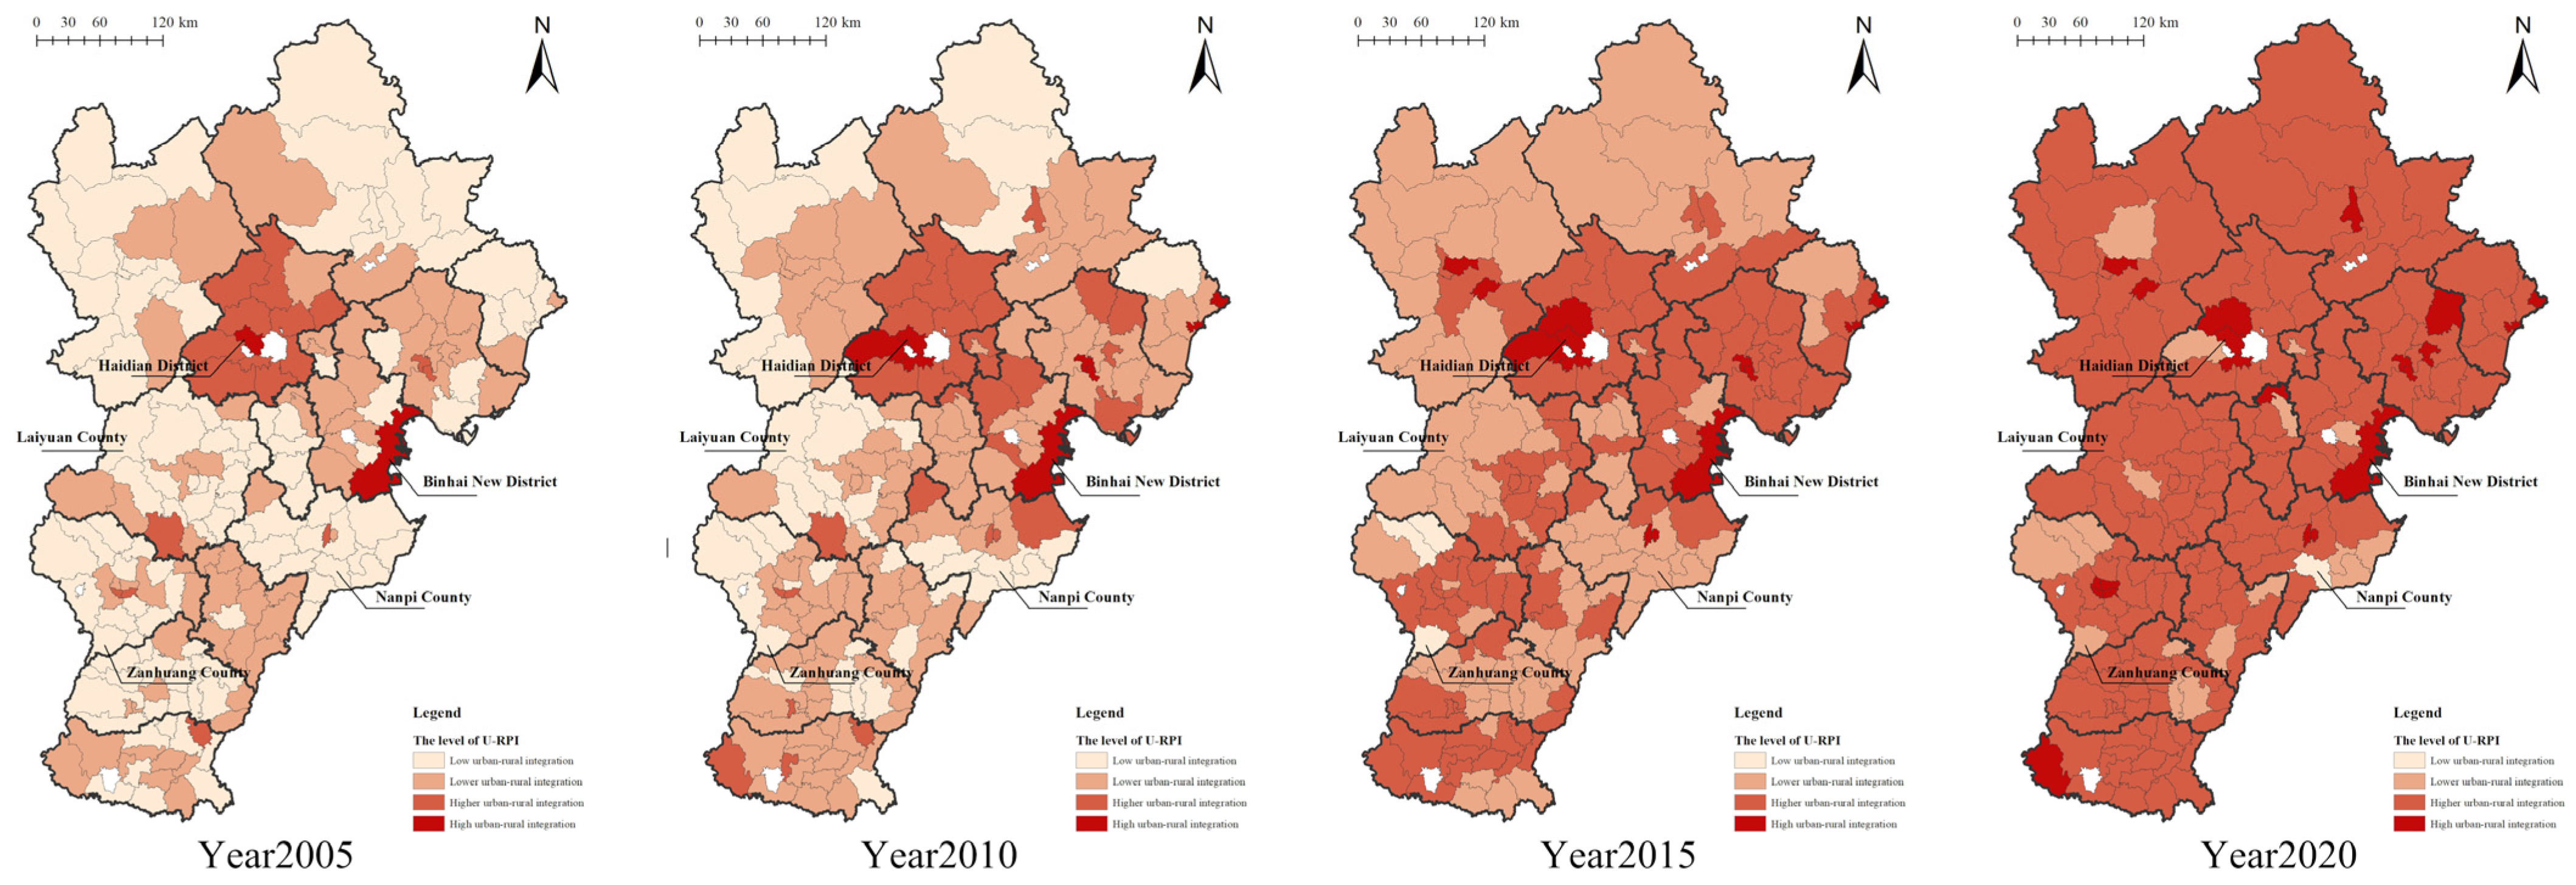
3.1.2. Level of Urban–Rural People Integration (U-RPI)

The level of U-RPI in the Beijing–Tianjin–Hebei region also showed an increasing trend, with the increased level stabilising over the study period, decreasing from 15.55% to 7.93%, and an overall increase of 41% over the 15-year period, with Beijing and Baoding remaining the cities with the highest and lowest levels of integration. In terms of the districts and counties, extremely large values appeared repeatedly in the Binhai New Area and the Haidian District, while extremely small values appeared in Laiyuan, Zanhuang and Nanpi counties, which are farther away from the urban centre, and the differences in the level of U-RPI among districts and counties were significantly reduced by 2020 (Figure 6).
At the beginning of the study, the overall level of U-RPI in the Beijing–Tianjin–Hebei region was low, and there were significant regional differences. Regions with higher levels of U-RPI were mainly concentrated in the Beijing and Tianjin coastal areas, which were characterised by large population flows, high labour demand, and excellent regional policies. As the process of urban–rural integration accelerates, the regional advantages of the Beijing area further increase, and the scope of the high-level integration zone formed around the core counties of Beijing and Tianjin gradually expanded to Langfang, Chengde and Tangshan. At the same time, the main urban areas of each city took the lead in promoting the construction of urban infrastructure, actively implementing the household registration reform system, and balancing the supply of public service facilities and resources in urban and rural areas, thus promoting the continued optimisation of urban and rural demographics and becoming the main focus of new urbanisation. By 2015, Langfang and Shijiazhuang had formed high-level integration blocks around their main urban areas, and by 2020, all of the Beijing–Tianjin–Hebei region’s low-level integration zones had vanished, with the entire region reaching a high level of integration.

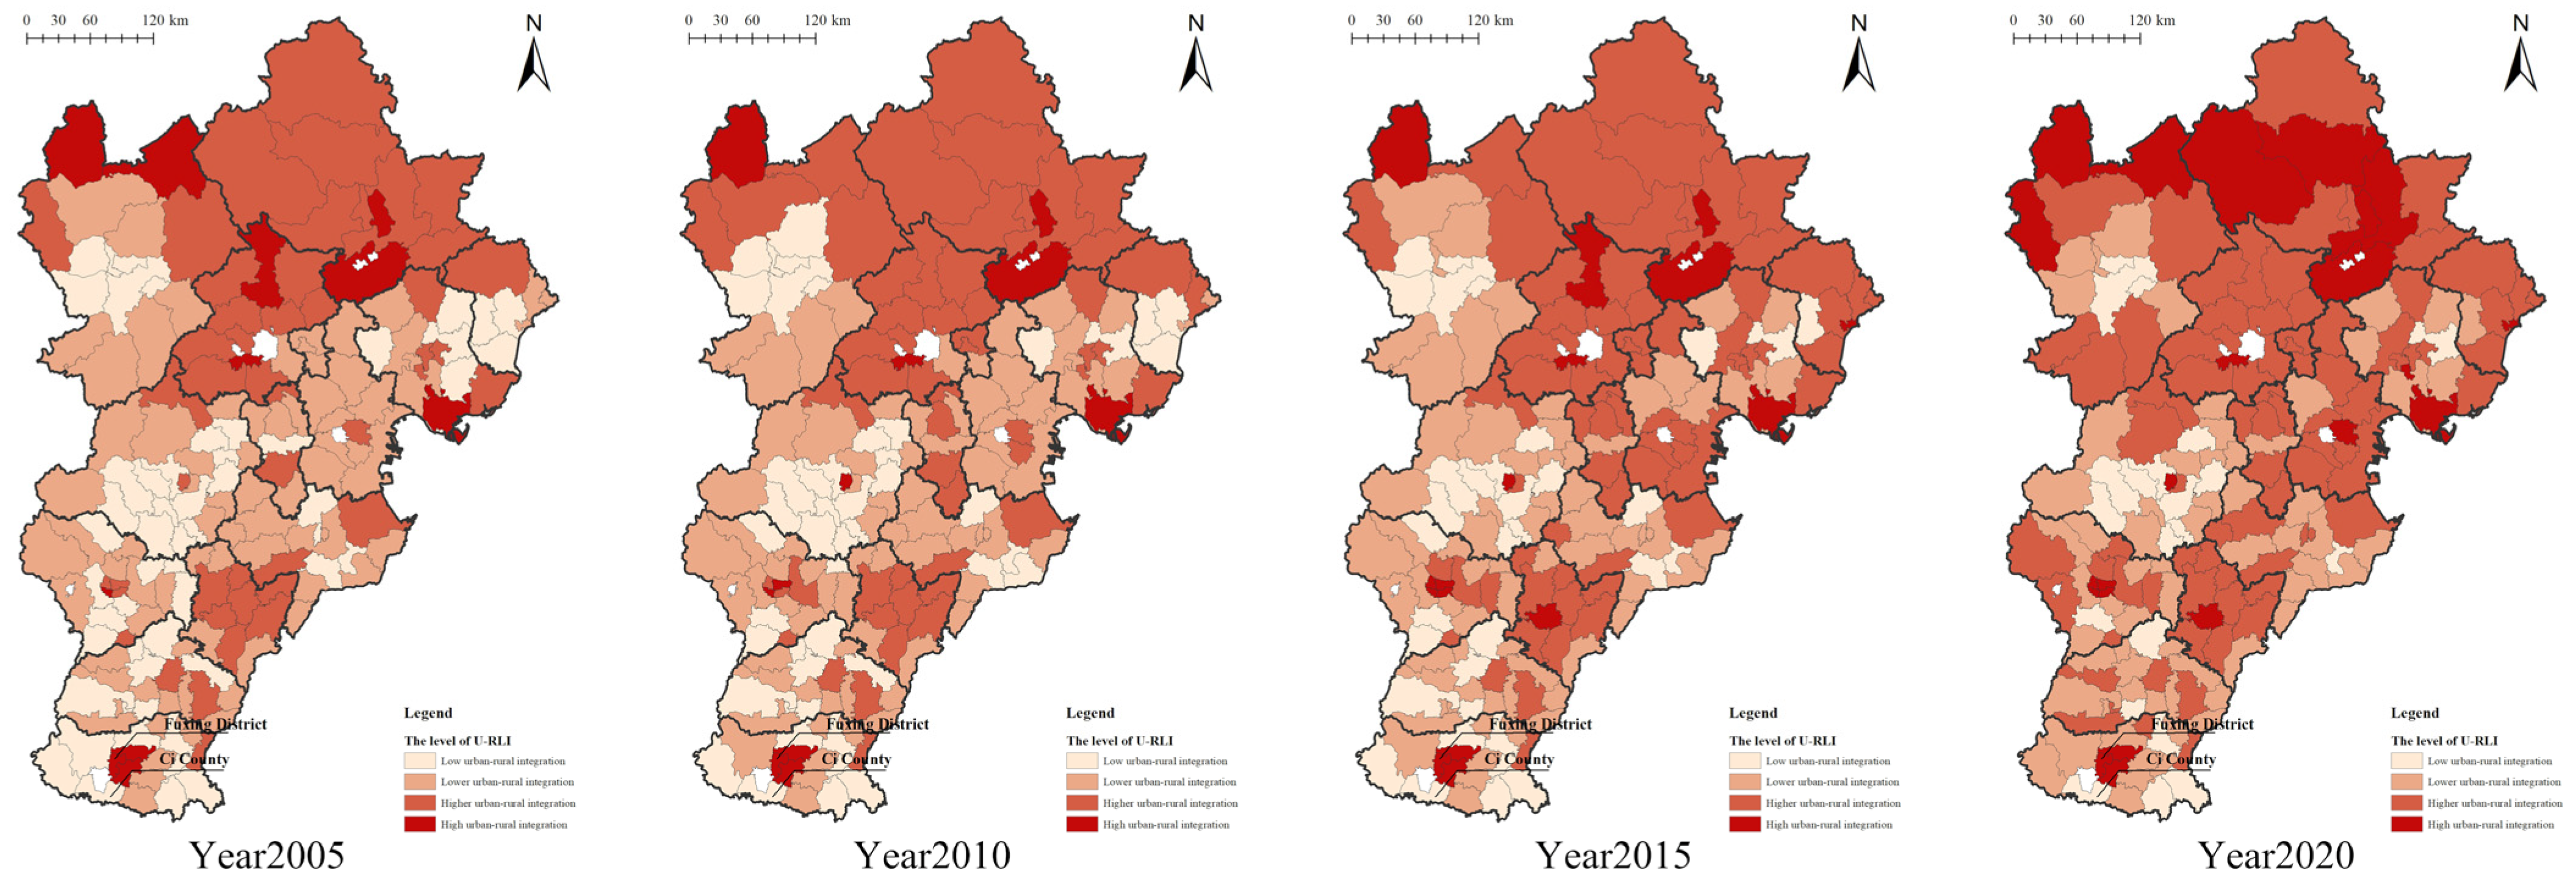
3.1.3. Level of Urban–Rural Land Integration (U-RLI)

The level of U-RLI in the Beijing–Tianjin–Hebei region increased steadily, but the structural change was small, with an increase of only 5.6% over the study period. The districts and counties where the extreme points were located were fixed, with the highest level of U-RLI always being in Fuxing District, and the smallest value always being in Ci County. In terms of U-RLI, Baoding remained the least integrated, while Chengde overtook Beijing as the most integrated city. It can be noted that the overall development of U-RLI in the Beijing–Tianjin–Hebei region was slow, and Chengde City and Zhangjiakou City, which are located along the Yanshan Mountains, had higher levels of integration and smaller regional differences, presenting large-scale spatial agglomeration characteristics (Figure 7). In contrast, the level of land integration in Xingtai and Cangzhou, which are located in the North China Plain, was poorer, while improving by 2020, but still characterised by uneven integration levels and weak cluster-driven effects.

3.1.4. Level of Urban–Rural Industry Integration (U-RII)

The level of U-RII increased compared to U-RPI and U-RLI, showing more positive and steady growth. The city with the highest level of U-RII in the study period was Beijing, while the lowest was Xingtai. The largest values occurred in Binhai New Area from 2005 to 2015 and shifted to Haidian District by 2020, while the smallest points were in Shangyi County, Wei County, and Quyang County (Figure 8). In the early period, areas with high levels of U-RII were mainly clustered in the Beijing–Tianjin corridor, and with the deepening of the regional synergy strategy, on the one hand, its radiation-driven effect was prompted to radiate and spread farther, and on the other hand, U-RII-driven clusters were formed, represented by Baoding and Handan; the scope of the low-level integration zone was reduced significantly during the study period, and only Quyang County was in the low category of urban–rural industry integration in 2020, while the gap between the lower urban–rural integration zones also shrank.
At the beginning of the study, most of the districts and counties in north-western Hebei were unable to form regional cluster-driven effects due to the weak development of their industrial bases, and the overall U-RII was poor. In 2005, for example, the three districts and counties with the lowest degree of integration were Shangyi, Kangbao, and Guyuan counties, which were clustered in the north-western part of Zhangjiakou City. While accompanied by a series of industrial support policies, the north-western Hebei Province focused on industrial transformation, the formation of rural tourism and ecological convalescence as the driving force of the northwest Hebei green ecological conservation area, breaking free from urban and rural industrial development constraints. In one of the 10 deeply impoverished counties in Hebei Province, Zhangjiakou Shangyi County, for example, the degree of U-RII rose from 0.512 in 2005 to 0.684 in 2020; the increase in the degree of integration was significant.

3.2. Characteristics of Spatial Agglomeration in the Level of Urban–Rural Integration

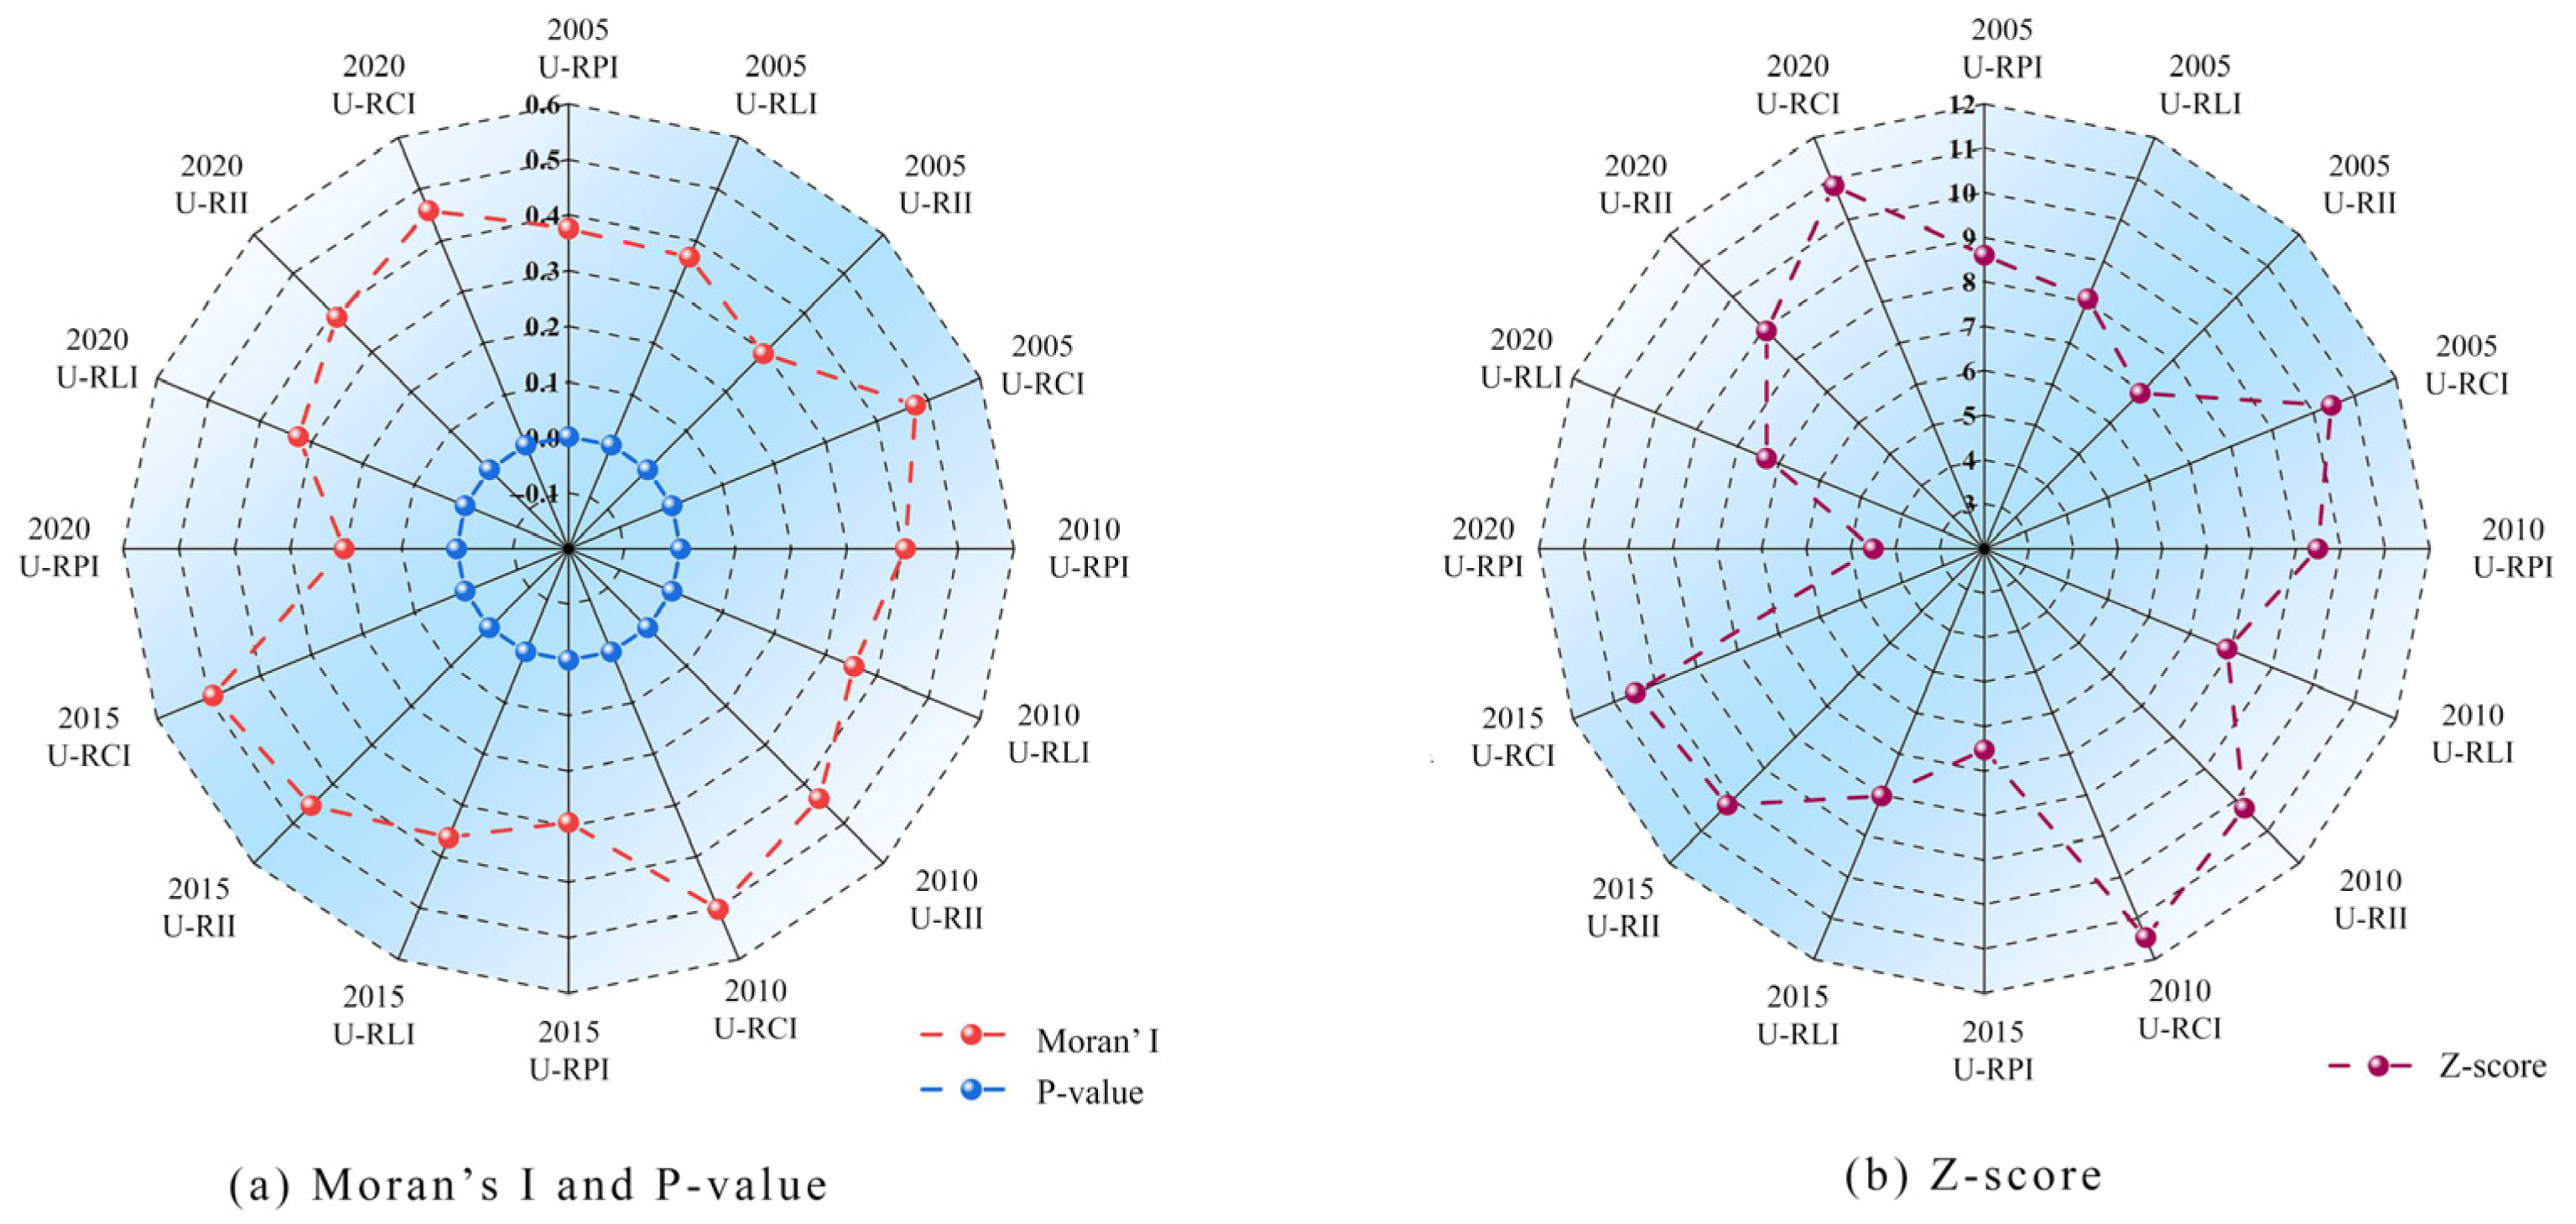
3.2.1. Global Spatial Autocorrelation Analysis

The global spatial autocorrelation results are shown (Figure 9), where Moran’s I was significantly greater than 0 at the 5% significance level for all years, indicating that the level of urban–rural integration in all dimensions had significant spatial correlation, and that spatial autocorrelation had a very high level of confidence based on the p-value of the dispersion value and the Z-score of the standard deviation multiplier. In addition, the points in the Moran scatterplot were mainly concentrated in the first and third quadrants, and urban–rural integration tended to be spatially positively correlated with agglomeration.

3.2.2. Local Spatial Autocorrelation Analysis

To further verify the conjecture of the existence of spatial agglomeration characteristics of urban–rural integration, local spatial autocorrelation analysis was carried out. The results showed that the proportion of high-high agglomeration and low-low agglomeration areas in the agglomeration area was above 80%, and the distribution characteristics of clustering were significant (Figure 10).
In terms of U-RCI, the high-high agglomeration area can be divided into two parts, with the core plate stably concentrated in Beijing, and the other part clustered in the coastal area of “Tianjin–Tangshan”, with the clustering feature being most significant in 2015, and by 2020, the “Tianjin–Tangshan” agglomeration area dispersed into several patches once again. In terms of the low-low agglomeration area, from 2005 to 2015, the districts and counties of Baoding City and Zhangjiakou City along the Taihang Mountains constituted a wide range of low-low agglomeration areas, presenting the characteristics of a belt-shaped distribution along the mountains, of which the Baoding City part was also characterised by the encircling structure around the main urban area. By 2020, the belt-shaped structure broke up, and Baoding City became the core part of this agglomeration area, at which time the east–west extension belt of Xingtai City and the Xingtai–Handan north–south extension belt overlapped, forming a crossing agglomeration involving the two cities. It is worth noting that the number of low-low agglomeration areas reached 44 in 2020, accounting for 71% of the districts and counties displaying agglomeration characteristics, far exceeding the number of high-high agglomeration areas, which indicates that the shackles of urban–rural integration and development among contiguous backward areas had still not been relieved effectively.
In terms of U-RPI, the agglomeration characteristics weakened considerably. Initially, the high-high agglomeration areas were similarly located in parts of Beijing and Tianjin, where population density was high. By 2020, the number of agglomerations had decreased significantly, with only five districts and counties remaining in the high-high agglomeration, and they were scattered. In terms of low-low agglomeration areas, in the early days, regional development and population movement were affected by topography and terrain, and the low-value areas of U-RPI were mainly concentrated in the mountainous areas in the western part of Baoding and Zhangjiakou. With the continuous improvement of the infrastructure of the urban–rural integration process and the balanced and reasonable supply of resources, topography and terrain no longer became the key factors restricting people integration, and low-low agglomerations shifted to the east and the north, so that by 2020, new agglomerations appeared in the eastern part of Cangzhou City.
As for U-RLI, it remained in a stable state of agglomeration. There was significant north–south differentiation in the agglomeration areas, with the high-high agglomeration areas located mainly in Chengde City and Zhangjiakou City, while the low-low agglomeration areas were located in the central part of Baoding City in the region surrounding the main urban area and in some districts and counties of Hengshui City and Handan City. In 2020, the “Hengshui–Handan” low-low agglomeration area dissipated, while the Baoding City agglomeration area along the edge of the main urban area was extended and closed in a ring, forming a “nucleus-free circle radiation” structure.
Unlike U-RPI and U-RLI, U-RII increased in spatial agglomeration over the 15-year study period, and there were significantly more low-low agglomeration areas than high-high agglomeration areas in U-RII. At the beginning of the study, the agglomeration clusters were distributed sporadically, with high-high agglomerations appearing in Beijing, Tianjin and Shijiazhuang, etc., and then agglomerating in most of the districts and counties of Beijing and Tianjin by 2015, when the Beijing–Tianjin corridor was formed. By 2020, the Beijing agglomeration block shifted and expanded to the northwest, while the Tianjin agglomeration block shifted to the coastal area south of Tangshan. Initially, the low-low agglomeration area was mainly located in the north-western part of Zhangjiakou City, the south-central part of Baoding City, Hengshui City and Xingtai City. Subsequently, the low-low agglomeration continued to shrink to the point of disappearance in Zhangjiakou City, became more compact and concentrated in Baoding City, and further spread and expanded in Hengshui City and Xingtai City.
Overall, all dimensions had relatively significant positively correlated agglomeration characteristics, and the degree of agglomeration was U-RCI > U-RII > U-RLI > U-RPI. In the 15-year study period, due to the implementation and promotion of new urbanisation, rural reform, talent introduction and other policies, which played a positive role in the urban–rural integration of the Beijing–Tianjin–Hebei region, except for the increase in the spatial agglomeration of U-RII, the agglomeration degree of urban–rural people, land and comprehensive integration slowed down, and the differences in the level of urban–rural integration among county units decreased. On the ground where spatial agglomeration occurred, Beijing and Baoding were the core areas of the high-high and low-low agglomeration zones, respectively.

4. Analysis of Factors Affecting the Spatial and Temporal Evolution of Urban–Rural Integration Level Based on GTWR

To further explore the mechanism of factors affecting the level of urban–rural integration in the Beijing–Tianjin–Hebei region during the study period, and to analyse the influencing factors causing differences in the spatial pattern of urban–rural integration, this paper used the GTWR model to measure the spatial pattern drivers of the level of urban–rural comprehensive integration separately, with the explanatory variables being the degree of urban–rural integration of the three dimensions of people, land and industry.

4.1. Data and Model Screening

To verify the degree of correlation between the explanatory variables and the explained variables, the data were subjected to the Pearson correlation test, where the Pearson correlation coefficient indicates directionality and Sig value represents significance. According to Pearson’s regulations, a Sig value of less than 0.05 represents a significant correlation between the two variables and is positive if the correlation coefficient is >0 and negative if the correlation coefficient is <0. According to the results (Table 2), there was a correlation between both the explanatory variable X and the explained variable Y.
Spatial multicollinearity refers to the spatial correlation of spatial independent variables, which may lead to inaccurate parameter estimation in spatial regression models. In this paper, the variance inflation factor (VIF) method was used to detect multicollinearity in the explanatory variables. In general, a VIF value greater than 10 is considered to have serious multicollinearity. According to the results (Table 3), the VIF coefficients of each explanatory variable were <10 and the model did not suffer from multicollinearity.
To analyse the mode of action of each spatial unit variable over time on the level of urban–rural integration, while considering the non-stationary effects of space and time, the GTWR model was used for regression analysis. Compared with the OLS model and the GWR model (Table 4), the GTWR as a whole possesses a larger R2, smaller AICc and RSS values, which can more reasonably explain the relationship between the dependent and independent variables and the characteristics of spatial and temporal heterogeneity.

4.2. Analysis of the Drivers of the Spatial and Temporal Evolution of the Level of Comprehensive Urban–Rural Integration

From the results of the drivers of the spatial and temporal evolution of urban–rural integration (Figure 11 and Figure 12), the development of urban–rural integration in the dimension of “people–land–industry” progressed in an orderly manner, and all of these dimensions played a positive role in promoting the comprehensive integration of urban and rural areas. During the 15-year study period, the structure of urban–rural “people–land–industry” integration was gradually optimised, and the driving effect of all dimensions on urban–rural integration was gradually weakened, which proved that urban–rural integration in the Beijing–Tianjin–Hebei region had shifted from a single role to a coordinated drive of multidimensional factors and that urban–rural integration had tended to become more stable and harmonious. The mean values of the impact coefficients for each dimension were closer to the median and had smaller standard deviations, so the means better reflect the overall level of regional drivers. The degree of influence of each factor on comprehensive urban–rural integration was significantly different across time, with the average drivers throughout the study period, from highest to lowest, being U-RPI, U-RLI and U-RII.
In terms of U-RPI factors, the positive driver decreased most significantly. At the beginning of the study, the areas that were driven by U-RPI were mainly concentrated in the “northwest–southeast” Beijing–Tianjin diagonal expansion axis centred on Beijing and Tianjin, but in the middle and late stages of the study, it shifted to the western areas of Handan and Zhangjiakou. The positive driving effect of U-RLI was shown spatially as a decreasing distribution from the Beijing–Tianjin southern corridor area, and although the driving effect weakened over time, it was stably concentrated in the area of Beijing, Langfang and Tianjin. In terms of U-RII, the city of Shijiazhuang was taken as the core of the significant driving role of the region, involving Xingtai City, Hengshui City, western and southern Baoding City and other counties and districts.
To summarise, the level of urban–rural integration in the Beijing–Tianjin and Langfang areas was initially driven by urban–rural “people–land” integration, and then became driven by U-RLI in the later stages, and radiated to the eastern districts and counties of Cangzhou City. In Handan and north-western Zhangjiakou, U-RPI drove urban–rural integration, while areas such as Shijiazhuang, Xingtai, Hengshui and the western and southern parts of Baoding were driven by U-RLI, and the rest of the country had no significant driving effect.

5. Discussion

The level of urban–rural integration over the 15-year study period was linked to the context and policy changes of the times. At the beginning of the study, due to the influence of the long-term urban–rural dichotomy, urban–rural people, land, industry and other elements were less mobile, urban–rural links were limited, and the overall level of urban–rural integration in the region was poor, except for a small number of districts and counties in Beijing and Tianjin. Since 2007, the state has put forward a new pattern of integrated urban–rural economic and social development and strategies for integrated urban–rural development in the new period, gradually narrowing the urban–rural development gap and accelerating the reshaping of urban–rural relations and development systems. By 2015, 38.5% of the districts and counties in the study area had an urban–rural integration development index that was above the higher integration level. The strategy of rural revitalisation was proposed in the report of the 19th CPC National Congress in 2017, and priority was given to the development of agriculture and rural areas in the new development stage; based on the foundation of urban–rural integration in the past fifteen years and the leading promotion of relevant policies, rural development was significantly improved [52], and the level of urban–rural integration was further developed and improved, with an increase of a total of 54.35% by 2020, and most of the districts and counties had achieved rapid and stable growth in the level of integration.
China is currently in a critical period of urban–rural integration. It needs to use the county economy as a link and, through land system innovation, equalisation of public services, and digital technology empowerment, build a new relationship of ‘mutual promotion between industry and agriculture, urban–rural complementarity, coordinated development, and common prosperity’. Among the five more mature major city agglomerations in China, the Beijing–Tianjin–Hebei urban agglomeration has better resource and policy advantages and leads more in terms of economic output and scientific and technological innovation; however, its level of urban–rural integration has been in the doldrums for a long time. From the perspective of coordinated development of municipal areas, the Beijing–Tianjin municipal area has a significant siphoning and polarisation effect on the Hebei provincial area [53,54], with a concentric circle structure formed due to cliff-like development, which constitutes a poverty belt around Beijing and Tianjin. The experimental results and previous research [55] found an inconsistency between the level of urban–rural integration in the municipal area and its economic development. For example, the GDP of Baoding City is in the mid-range for the Beijing–Tianjin–Hebei region, which is far more than the GDP of Chengde City, but the level of urban–rural integration between the two places shows an opposite relationship, which demonstrates that the level of urban–rural integration is affected by the outside world and the dual influence of the urban and rural regions themselves. This also confirms that ‘agglomeration shadow’ and ‘borrowed scale’ may coexist in different evaluation contents. Through research on counties in the Beijing–Tianjin–Hebei region, it can be seen that counties in Baoding City and Chengde City, which are close to Beijing, the core metropolis, exhibit ‘agglomeration shadow’ in economic development, while exhibiting ‘borrowed scale’ in urban–rural integrated development.
In the study area of this paper, urban–rural relations encompass both the relationship between rural areas and small towns, as well as the relationship between rural areas and large cities. In most counties of Hebei Province, urban–rural integration is structured around the basic hierarchy of ‘county seat—central town—rural areas.’ The county seat serves as a hub for the flow of urban–rural elements, fulfilling functions such as industrial linkage and the provision of public services. Some counties have adopted the ‘central town, leading villages’ model to develop specialised industrial clusters, thereby forming a path toward future urbanisation. In the districts and counties of Beijing and Tianjin, the urban core directly drives the development of surrounding rural areas through industrial spillover and technological diffusion. However, the large cities’ attraction of labour and capital can lead to a single-industry structure in some counties, which is detrimental to their sustainable development. Additionally, there is another type known as the urban–rural mixed type, such as the urban–rural fringe transition zones formed between urban and rural areas or along transportation corridors, which exhibit high land use functionality but are prone to issues like spatial disorderly expansion and ecological fragmentation. Therefore, while we must recognise the complementary nature of urban–rural elements such as technology, land, and labour, as well as the optimisation of transportation networks and spatial layout in urban–rural integration, we must also be vigilant against the encroachment of large cities on rural land, the siphoning of resources, and ecological destruction, which may further exacerbate social division risks.
Urban–rural integration as the core path for regional coordination reveals universal patterns of factor flow and functional complementarity through both international experience and local practice. Explorations in developed countries indicate that successful urban–rural integration relies on three pillars: institutional design, industrial synergy, and spatial restructuring. Germany’s ‘urban–rural equivalence’ philosophy narrows development gaps through land consolidation and regional balance policies, while the United States’ ‘metropolitan area-driven’ model achieves urban–rural symbiosis through transportation networks and equalised public services [56]. These practices all emphasise the importance of breaking down institutional barriers such as household registration and land ownership rights and activating the functions of small and medium-sized towns [57,58]. Focusing on the Beijing–Tianjin–Hebei region, its urban–rural integration exhibits significant gradation and complexity. The megacities of Beijing and Tianjin exert a dual ‘siphoning–radiation’ effect on surrounding counties: on one hand, the concentration of labour and capital in core cities leads to a ‘poverty belt’ around Beijing and Tianjin and ‘semi-urbanisation’ issues, confirming the distorting effects of institutional barriers on factor mobility [59]; on the other hand, elements such as the digital economy and transportation integration provide opportunities for counties to undertake industrial relocation, demonstrating the possibility for small and medium-sized towns to break through the ‘agglomeration shadow’ through functional specialisation [60]. In terms of county unit synergy, economic development then roughly coincides with the level of urban–rural integration, both of which are characterised by a tendency to decline and weaken from the city centre urban areas to the far suburban counties [52], and the villages in the edge of the band are easily marginalised in the process of development. Regarding the special region of Beijing, its spillover effect is significant; the dimensions of “people–land–industry” are driven by each other, the whole area is in the high-value zone of urban–rural integration and development, and it is gradually detaching from the Beijing–Tianjin development corridor. In the next phase of regional coordination and development, Beijing’s successful models and market demand should be further transferred to Hebei Province to drive development in lagging areas [61]. At the same time, inter-county transportation networks and digitalisation should be used to break down administrative boundaries and connect supply chains and industrial structures, thereby activating and utilising the urban and rural advantages of each region [62].
In terms of evaluation indicators and driving factors of urban–rural integration, this paper discusses categorisation from the dimension of “people–land–industry”, to better clarify the spatial and temporal changes in the level of urban–rural integration in different dimensions and the driving mechanism of U-RCI. Taking Chengde City as an example, its mountainous and grassland topography is not conducive to urban–rural population mobility and urban–rural industrial linkage, but it has an excellent urban and rural ecological environment which facilitates high U-RLI; this evaluation is an expansion of and innovation on the previous research [63]. At the same time, it should be noted that there is a coupling and linkage relationship between the strategies for enhancing urban–rural integration in all dimensions, which are also mutually influential and interdependent. For example, while the reform of the household registration system promotes the free movement of urban and rural populations, land policies and industrial development policies should also be adjusted to adapt to changes in population structure and demand. For districts and counties that are strongly driven by a single dimension, the spillover effect of urban–rural integration in that dimension should be brought into play, leading to the comprehensive development of other dimensions. Functional departments of “people–land–industry” should coordinate the establishment of a planning and management system for urban–rural integration and development, strengthen the coupling and articulation between urban and rural factors, and form a coordinated urban–rural governance mechanism involving the government, enterprises, social organisations and the public, to promote multidimensional urban–rural integration. At the same time, global experience should be drawn upon to promote the integrated development of urban and rural areas in the Beijing–Tianjin–Hebei region. For example, the multi-centre network structure of the Rhine–Ruhr region in Germany has facilitated balanced urban–rural development in small and medium-sized urban agglomerations. Therefore, in terms of spatial planning, it is feasible to cultivate the ‘Xiongan–Baoding–Shijiazhuang’ secondary node and strengthen the anchor function of small and medium-sized towns within the regional network to alleviate pressure on Beijing and Tianjin. In terms of industry, a ‘vertical specialisation–horizontal specialisation’ industrial system can be established, such as the Beijing R&D–Hebei manufacturing semiconductor supply chain. Additionally, digital platforms can be used to reduce the time it takes for agricultural products to reach Beijing and Tianjin to within 48 h, thereby unlocking the potential of entrepreneurs to connect urban and rural resources [64]. Institutionally, we should be vigilant against the ‘slum trap’ experienced by Latin American countries and prevent excessive urbanisation from leading to the collapse of public services. Therefore, we should strictly control the unregulated expansion of Beijing and Tianjin and strengthen the carrying capacity of counties in Hebei Province. For economically disadvantaged counties, we should strengthen infrastructure construction and farmer skill training, promote integrated development of towns and villages, and form a dual-drive model with towns and villages complementing urban centres [65].
Finally, this study still has several shortcomings in its research process. Restricted by the difficulty of data acquisition, the data were obtained in fewer years, making it difficult to reflect the evolution of urban–rural integration smoothly. At the same time, urban–rural integration is a complex systematic project involving many factors, and this study fails to cover all relevant dimensions comprehensively. Future research should further broaden the data sources, construct the evaluation index system of urban–rural integration in different dimensions, and summarise and analyse the spatial and temporal evolution characteristics of urban–rural integration in different counties in the Beijing–Tianjin–Hebei region, to provide more comprehensive and in-depth theoretical support and practical guidance for the development of urban–rural integration in the Beijing–Tianjin–Hebei region and even in the whole country.

6. Conclusions

This paper researched and analysed the level of urban–rural integration and driving factors of the Beijing–Tianjin–Hebei region county units from 2000 to 2020, and the main conclusions were as follows:
(1)
The level of U-RCI, U-RPI, U-RLI and U-RII in the Beijing–Tianjin–Hebei region increased during the study period. The areas with high levels of urban–rural integration were mainly located in Beijing and the Bohai Rim region in the eastern part of Tianjin and Hebei, and the level of urban–rural integration in the peri-urban areas of the cities was generally better than that in the remote counties and cities. Among them, U-RPI showed the largest increase, reaching a high level of integration in the category by 2020 for the whole region. U-RLI increased less and was characterised by significant north–south divergence. U-RII showed a more positive and steady increase, with a significant increase in the north-western Damshang Grassland region.
(2)
In terms of spatial agglomeration, urban–rural integration was characterised by significant spatial agglomeration. The degree of agglomeration, in descending order, was U-RCI > U-RII > U-RLI > U-RPI. The spatial concentration of U-RII increased over the 15-year study period, while the concentration of U-RPI, U-RLI and U-RCI decreased. On the ground where spatial agglomeration occurred, Beijing and Baoding were the core areas of high-high agglomeration and low-low agglomeration, respectively.
(3)
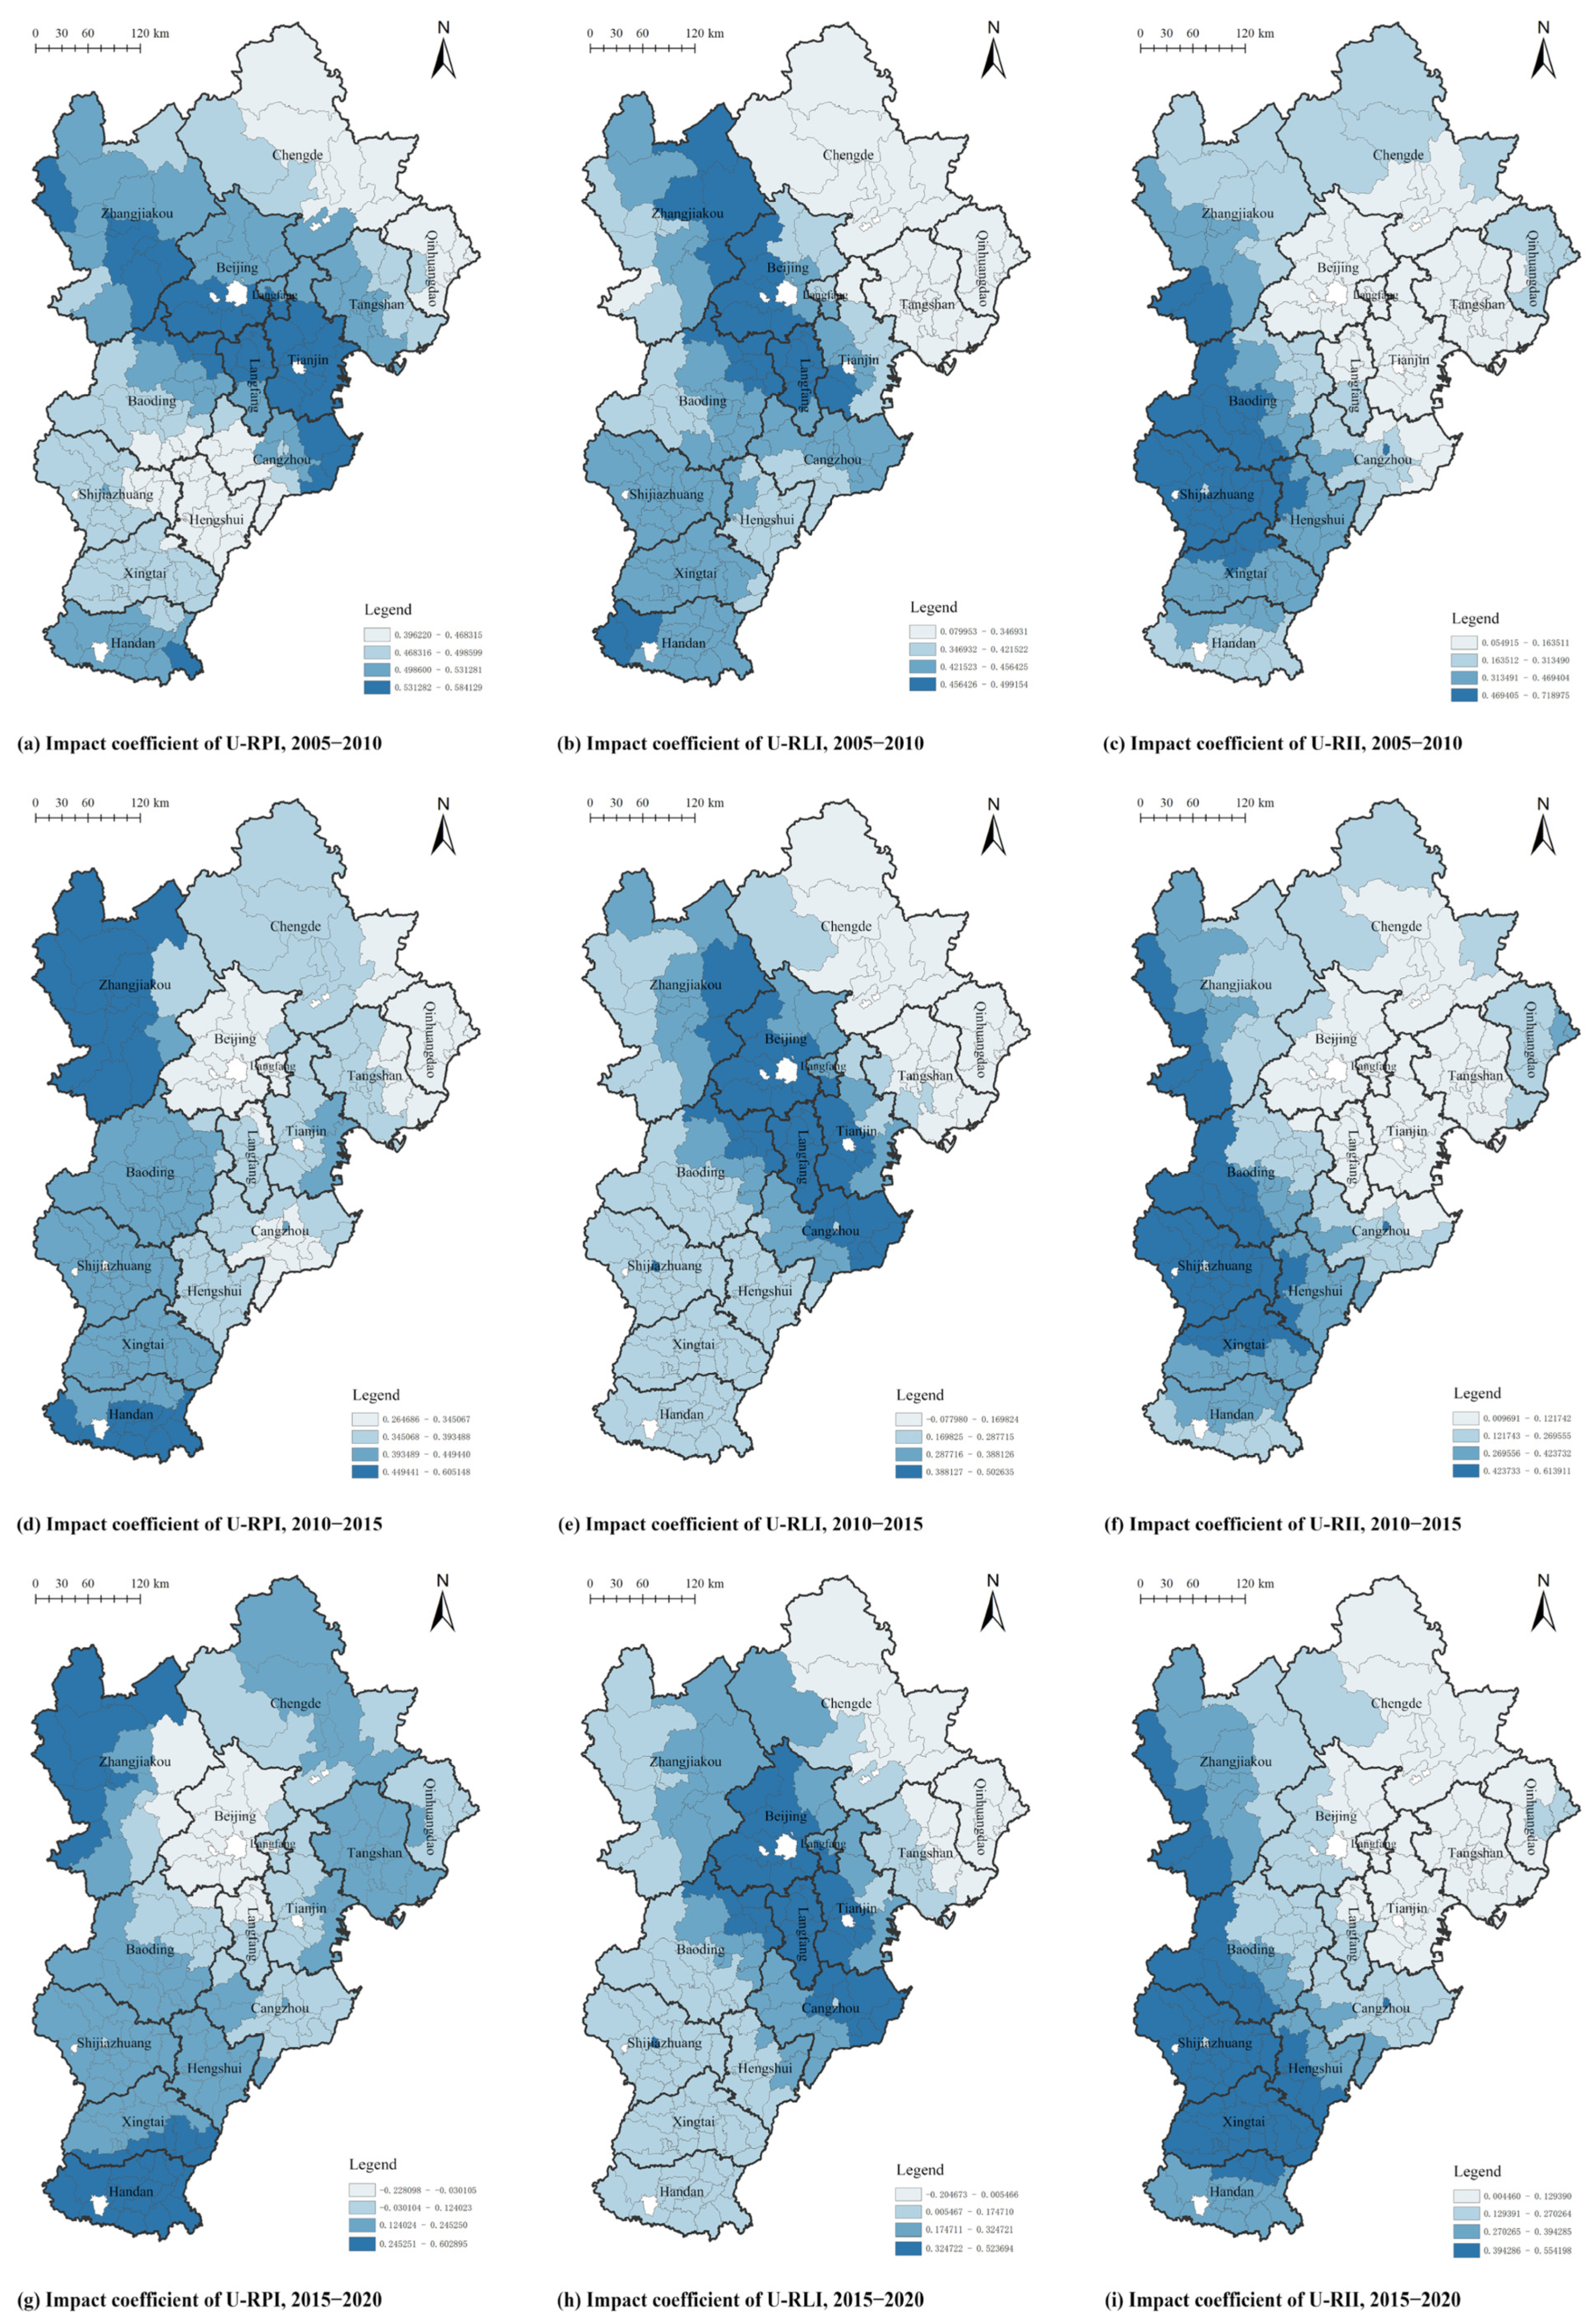
In terms of spatial and temporal drivers of urban–rural integration, the driving role of U-RPI, U-RLI and U-RII for U-RCI weakened gradually. Urban–rural integration in the Beijing–Tianjin–Hebei region counties during the 15 years shifted from a single-role driver to a multidimensional coordinated driver, with the average drivers, from high to low, being U-RPI, U-RLI and U-RII.
In the global context of multidimensional poverty risk coexistence and prominent relative poverty, our study took a social-ecological system perspective, based on traditional data collection; compensated for the lack of geographic data by using python, GEE, and other multi-source data acquisition methods; comprehensively utilized RF and geo-detectors to jointly identify the main poverty-causing factors; analysed the coupling-enhanced effects of different factors on poverty formation; and systematically analysed the spatial differentiation driving mechanisms of recurrent poverty, marginal poverty, and potential poverty with the help of MGWR. In this study, we have constructed a methodology to analyse the mechanism of spatial poverty differentiation in macro-regions using villages as data units, and proposed targeted poverty governance strategies. However, due to the lack of grass-roots data in villages, we failed to further analyse the evolution of spatial poverty differentiation rules from a dynamic perspective, which should be the direction of our efforts in the future.

Supplementary Materials

The following supporting information can be downloaded at: https://www.mdpi.com/article/10.3390/land14081563/s1.

Author Contributions

Conceptualization, J.T.; methodology, J.M.; software, J.M.; validation, S.Z.; formal analysis, S.Z.; investigation, J.T.; resources, S.Z.; data curation, J.M.; writing—original draft, J.T.; writing—review and editing, J.M.; supervision, S.Z.; project administration, J.T.; funding acquisition, S.Z. and Y.B. All authors have read and agreed to the published version of the manuscript.

Funding

This study was supported by National Natural Science Foundation of China (Grant No. 52378065), Tianjin Key Laboratory of Smart City Planning Open Fund (Grant No. GHKF-202401), Tianjin Philosophy and Social Sciences Planning Project (Grant No. TJJWQN02-01) and Tianjin University Independent Innovation Fund (Grant No. 2025XSC-0096).

Data Availability Statement

The original contributions presented in the study are included in the article/Supplementary Materials, and further inquiries can be directed to the corresponding author.

Conflicts of Interest

Author Jian Tian was employed by the company Architectural Design Planning Research Institute Co., Ltd. The remaining authors declare that the research was conducted in the absence of any commercial or financial relationships that could be construed as a potential conflict of interest.

References

  1. Chen, L.; Jiang, H. Integrated Urban-rural Development: Foreign Models, Experiences and Implementation Path. Issues Agric. Econ. 2024, 45, 52–59. [Google Scholar]
  2. Ye, L.; Wang, J. The Evolution and Prospect of Urban-Rural Relations in China Since the Founding of PRC. J. Huazhong Agric. Univ. (Soc. Sci. Ed.) 2021, 6, 110–120+191. [Google Scholar] [CrossRef]
  3. Howard, E. Garden Cities of Tomorrow; S. Sonnenschein & Co., Ltd.: London, UK, 1902. [Google Scholar]
  4. Saarinen, E. The City. Its Growth, Its Decay, Its Future; Reinhold Publishing Corporation: New York, NY, USA, 1943. [Google Scholar]
  5. Krugman, P. Increasing Returns and Economic Geography. J. Political Econ. 1991, 99, 483–499. [Google Scholar] [CrossRef]
  6. Ortizbáez, P.; Boisson, S.; Torres, M.; Bogaert, J. Analysis of the urban-rural gradient terminology and its imaginaries in a Latin-American context. Theor. Empir. Res. Urban Manag. 2020, 15, 81–98. [Google Scholar]
  7. Liu, W.; Wu, M.; Zhang, J. Research on the Effect of Polycentric Spatial Structure in Promoting Urban-rural Integration. J. Manag. 2024, 37, 24–41. [Google Scholar] [CrossRef]
  8. Wang, X. Compatibility of Urban-Rural Coordination with Regiona! Coordination: From the Practice of Wuhan Urban Agglomeration. Urban Dev. Stud. 2012, 19, 60–65. [Google Scholar]
  9. Bao, H.; Zhong, W.; Chen, S. Spatial and temporal characteristics, driving pattern and enlightenment of county scale common prosperity in Zhejiang province. J. Nat. Resour. 2025, 40, 382–401. [Google Scholar] [CrossRef]
  10. Xie, X. Marx’s Thought on the Relationship between Urban and Rural Areas and lts contemporary Enlightenment. Theory Horiz. 2019, 11, 10–16. [Google Scholar] [CrossRef]
  11. Wang, Z. The Three Humanistic Masters of Urban Planning: Howard, Geddes, and Mumford. Archit. Des. Manag. 2007, 4, 41–43. [Google Scholar]
  12. Chen, G. A Review of Fei-Lanis’ Binary Structure Model. World Econ. Stud. 1988, 5, 76–81. [Google Scholar] [CrossRef]
  13. McGee, T.G. Urbanisasi or Kotadesasi? The Emergence of New Regions of Economic Interaction in Asia; East-West Environment and Policy Institute: Honolulu, HI, USA, 1987. [Google Scholar]
  14. Li, K. The Historical Evolution, Logical Framework, and Implementation Path of China’s Urban-Rural Integration Development. Soc. Sci. Beijing 2025, 5, 39–53. [Google Scholar] [CrossRef]
  15. Li, X. The Integration of Urban and Rural Areas is Not the Homogenization of Urban and Rural: Thoughts of Rural Construction on the Context of Urbanization. Planners 2013, 29, 32–35. [Google Scholar]
  16. Litcher, D.T.; Brown, D.L. Rural America in an urban society: Changing spatial and social boundaries. Annu. Rev. Sociol. 2011, 37, 565–592. [Google Scholar] [CrossRef]
  17. Li, G. Urban-Rural Integration: Logic and Process of Practice. City Plan. Rev. 2021, 45, 109–114+120. [Google Scholar]
  18. Guo, Z.; Liu, W. A Study on the Rural Development of the United States from the Viewpoint of Urban-rural Integration: Introduction to the Urban and Rural System of the Clemson Area. Shanghai Urban Plan. Rev. 2020, 5, 117–123. [Google Scholar]
  19. Zhang, L.; Li, W.; Bai, Y. Rural Social Policies and Experiences in Japan and South Korea in Response to Rural Shrinkage. Urban Plan. Int. 2022, 37, 1–9. [Google Scholar] [CrossRef]
  20. Jiao, B. Progress and Characteristics of the Urbanization in Japan—Evidence from the Structural Change of “City-Town-Village System” in Japan. Fudan J. (Soc. Sci. Ed.) 2017, 59, 162–172. [Google Scholar]
  21. Sujarwoto, S.; Tampubolon, G. Spatial inequality and the Internet divide in Indonesia 2010–2012. Telecommun. Policy 2016, 40, 602–616. [Google Scholar] [CrossRef]
  22. Krishna, A. The urban-rural gap and the dilemma of governance. Curr. Hist. 2015, 114, 291–297. [Google Scholar] [CrossRef]
  23. Edwards, S.E.; Strauss, B.; Miranda, M.L. Geocoding Large Population-level Administrative Datasets at Highly Resolved Spatial Scales. Trans. GIS 2014, 18, 586–603. [Google Scholar] [CrossRef]
  24. Hiner, C.C. Beyond the Edge and in Between: (Re)conceptualizing the Rural–Urban Interface as Meaning–Model–Metaphor. Prof. Geogr. 2016, 68, 520–532. [Google Scholar] [CrossRef]
  25. Zeng, Q.; Chen, X. Identification of urban-rural integration types in China–an unsupervised machine learning approach. China Agric. Econ. Rev. 2023, 15, 400–415. [Google Scholar] [CrossRef]
  26. Pu, X.; Liu, Q.; Xie, B. The Historical Stages and Characteristics of Urban-rural Relationship Driven by Relevant Elements. Planners 2018, 34, 81–87. [Google Scholar]
  27. Zhang, Q.; Zhang, Y.; Yang, P. China’s Urban-rural Integration Evolution and Fuzhou Practice. Planners 2021, 37, 25–31. [Google Scholar] [CrossRef]
  28. He, Y.; Tan, H.; Kang, F. Development Model and Effect Evaluation of Urban–rural Integrated in Metropolitan Fringe Areas: A Case Study of Wangcheng District. Econ. Geogr. 2022, 42, 156–164. [Google Scholar] [CrossRef]
  29. Ma, Y.; Liu, X.; Gao, Z.; Gao, Y. Planning Strategy of Xi’an–Xianyang Urban–rural Integration Pilot Area. Planners 2021, 37, 32–37. [Google Scholar] [CrossRef]
  30. Sun, J.; Zhang, L. The ProductionLife Theoretical Framework and Key Issues of County—Level Urban–Rural Integration Development. J. Yunnan Minzu Univ. (Philos. Soc. Sci. Ed.) 2024, 41, 129–138. [Google Scholar] [CrossRef]
  31. Li, Z.; Liu, C.; Chen, X. Power of digital economy to drive urban–rural integration: Intrinsic mechanism and spatial effect, from perspective of multidimensional integration. Int. J. Environ. Res. Public Health 2022, 19, 15459. [Google Scholar] [CrossRef]
  32. Liu, Y.; Zang, Y.; Yang, Y. China’s rural revitalization and development: Theory, technology and management. J. Geogr. Sci. 2020, 30, 1923–1942. [Google Scholar] [CrossRef]
  33. Xu, X.; Wang, Y. Research on the Logical Mechanism, Multidimensional Measurement and Regional Coordinated Development of Urban–rural Integration: From the Perspective of Coordinated Promotion of New Urbanization and Rural Vitalization. Issues Agric. Econ. 2023, 11, 49–62. [Google Scholar] [CrossRef]
  34. Li, J.; Zhang, C. Prospect of urban–rural integration development research under the vision of the Chinese path to modernization. West Forum 2023, 33, 114–122. [Google Scholar] [CrossRef]
  35. Zhao, M.; Fang, C.; Chen, C. Re-theorizing and Assessing Integrated Urban–rural Development: An Empirical Study on China’s Megacities. Urban Plan. Forum 2018, 2, 11–18. [Google Scholar] [CrossRef]
  36. Shi, Y.; Zhu, Q.; Xu, L.; Lu, Z.; Wu, Y.; Wang, X.; Fei, Y.; Deng, J. Independent or influential? Spatial-temporal features of coordination level between urbanization quality and urbanization scale in China and its driving mechanism. Int. J. Environ. Res. Public Health 2020, 17, 1587. [Google Scholar] [CrossRef]
  37. Oddershede, A.; Arias, A.; Cancino, H. Rural development decision support using the Analytic Hierarchy Process. Math. Comput. Model. 2007, 46, 1107–1114. [Google Scholar] [CrossRef]
  38. Ma, L.; Long, H.; Ge, D.; Tu, S. Research on the Ways of Urban-Rural Coordinated Development and Rural Vitalization in the Farming Areas of China. Econ. Geogr. 2018, 38, 37–44. [Google Scholar] [CrossRef]
  39. Zhang, H.; He, R.; Li, G.; Wang, J. Spatiotemporal Evolution of Coupling Coordination Degree of Urban-Rural Integration System in Metropolitan Area and Its Influencing Factors: Taking the Capital Region as an Example. Econ. Geogr. 2020, 40, 56–57. [Google Scholar] [CrossRef]
  40. Lichter, D.T.; Ziliak, J.P. The rural-urban interface: New patterns of spatial interdependence and inequality in America. Ann. Am. Acad. Political Soc. Sci. 2017, 672, 6–25. [Google Scholar] [CrossRef]
  41. Guo, L.; Liu, Y.; Feng, J.; He, S. Spatial-temporal Pattern of Provincial New–type Urbanization and Integrated Urban–rural Development in China and Its Influence Factor. J. Earth Sci. Environ. 2023, 45, 751–795. [Google Scholar] [CrossRef]
  42. Victor, O.U.; Hope, E.N. Rural–Urban ‘Symbiosis’, community self-help, and the new planning mandate: Evidence from Southeast Nigeria. Habitat Int. 2011, 35, 350–360. [Google Scholar] [CrossRef]
  43. Zhou, D.; Qi, J.; Zhong, W.; Wang, J. Urban and rural integration development in urban agglomerations: Measurement and evaluation, obstacle factors and driving factors. Geogr. Res. 2023, 42, 2914–2939. [Google Scholar] [CrossRef]
  44. Qin, Y.; Xu, J.; Zhang, H.; Ren, W. The Measurement of the Urban–Rural Integration Level of Resource-Exhausted Cities—A Case Study of Zaozhuang City, China. Sustainability 2022, 15, 418. [Google Scholar] [CrossRef]
  45. Xie, X.; Li, H.; Li, C.; Fu, P. Research on Dynamics Identification and Development Path of Urban–rural Integration Based on BP Neural Network: A Study of 72 Typical Counties in the East, Middle, and West of China. Planners 2022, 38, 109–116. [Google Scholar] [CrossRef]
  46. Zhou, J.; Qin, F.; Liu, J.; Zhu, G.; Zou, W. Measurement, spatial–temporal evolution and influencing mechanism of urban-rural integration level in China from a multidimensional perspective. China Population. Resour. Environ. 2019, 29, 166–167. [Google Scholar]
  47. Liu, H.; Ma, L.; Li, G. Spatial-temporal evolution pattern of unbalanced economic development in Beijing–Tianjin–Hebei region since the 1990s. Geogr. Res. 2016, 35, 471–481. [Google Scholar] [CrossRef]
  48. Xu, L.; Tao, J.; Zhang, M.; Zhang, P.; Zhang, J. Potential Evaluation and Zoning Optimization of County Industrial Undertaking in the Poverty Belt around Beijing and Tianjin Based on Multivariate Data. Geogr. Geo-Inf. Sci. 2021, 37, 135–142. [Google Scholar] [CrossRef]
  49. Li, X.; Liu, Y.; Guo, Y. The spatial pattern of population–land–industry coupling coordinated development and its influencing factor detection in rural China. J. Geogr. Sci. 2023, 33, 2257–2277. [Google Scholar] [CrossRef]
  50. Qiao, F.; Yao, J. The application of time series analysis and all-around PCA in the economic dynamic description. J. Appl. Stat. Manag. 2003, 2, 1–5. [Google Scholar] [CrossRef]
  51. Xuan, H.; Zhang, A.; Lin, Q.; Chen, J. Affecting Factors Research of Chinese Provincial Economic Development Based on GTWR Model. J. Ind. Technol. Econ. 2016, 35, 154–160. [Google Scholar] [CrossRef]
  52. Gao, H. Spatio-Temporal Analysis of Rural Economic Development in Beijing, Tianjin and Hebei Based on Night Time. Master’s Thesis, Hebei Normal University, Shijiazhuang, China, 2023. [Google Scholar]
  53. Liu, H.; Ma, L.; Li, G. Pattern evolution and its contributory factor of cold spots and hot spots of economic development in Beijing–Tianjin–Hebei region. Geogr. Res. 2017, 36, 97–108. [Google Scholar]
  54. Chen, Y.; Sun, B. Does “agglomeration shadow” exist in Beijing–Tianjin–Hebei region? Large cities impact on regional economic growth. Geogr. Res. 2017, 36, 1936–1946. [Google Scholar]
  55. Zhang, H.; He, R.; Li, N.; Li, G. Spatio-temporal differentiation of urban-rural integration level and rural revitalization path in the Capital Region. J. Nat. Resour. 2021, 36, 2652–2671. [Google Scholar] [CrossRef]
  56. Mao, R.; Lin, X. Promoting Integrated Development of Rural and Urban Areas amid the Rural Revitalization Strategy: Implications and Lessons from Main Developed Countries. Int. Econ. Rev. 2022, 1, 155–173+8. [Google Scholar]
  57. Tacoli, C. The links between urban and rural development. Environ. Urban. 2003, 15, 3–12. [Google Scholar] [CrossRef]
  58. Kratzer, A.; Kister, J. (Eds.) . Rural-Urban Linkages for Sustainable Development; Routledge: Abingdon, UK, 2021. [Google Scholar]
  59. Satterthwaite, D.; Tacoli, C. Seeking an Understanding of poverty that recognizes rural–urban differences and rural–urban linkages. In Urban Livelihoods; Routledge: Abingdon, UK, 2014; pp. 52–70. [Google Scholar]
  60. Meijers, E.; Burger, M. Small and medium-sized towns: Out of the dark agglomeration shadows and into the bright city lights? In A Research Agenda for Small and Medium-Sized Towns; Edward Elgar Publishing: Cheltenham, UK, 2022; pp. 23–38. [Google Scholar]
  61. Li, L.; Huang, T.; Ou, Y. Research on the measurement of the level and spatial and temporalpattern of urban and rural industrial integration in China. Geogr. Res. 2025, 44, 1119–1142. [Google Scholar]
  62. Xu, H.; Zhao, J.; Yu, X.; Mei, X.; Zhang, X.; Yan, C. A Model Assembly Approach of Planning Urban–rural Transportation Network: A Case Study of Jiangxia District, Wuhan, China. Sustainability 2023, 15, 11876. [Google Scholar] [CrossRef]
  63. Cao, X.; Cheng, H.; Shang, Y.; Li, H.; Wang, D. Research on the spatial–temporal evolution characteristics and influencing factors of urban—Rural integration based on the “population–land–industry” system—A case study of Jilin Province. Resour. Dev. Mark. 2023, 39, 810–818. [Google Scholar] [CrossRef]
  64. Mayer, H.; Habersetzer, A.; Meili, R. Rural–urban linkages and sustainable regional development: The role of entrepreneurs in linking peripheries and centers. Sustainability 2016, 8, 745. [Google Scholar] [CrossRef]
  65. Li, Y.; Huang, H.; Song, C. Rural economic resilience in poor areas and its enlightenment: Case study of Yangyuan County, Hebei Province. Prog. Geogr. 2021, 40, 1839–1846. [Google Scholar] [CrossRef]
Figure 1. Spatial extent and elevation of the Beijing–Tianjin–Hebei region.
Land 14 01563 g001
Figure 2. Connotation and extension of high-quality urban–rural integration.
Land 14 01563 g002
Figure 3. Technological route.
Land 14 01563 g003
Figure 4. (ad) Characteristics of urban–rural integration level in the Beijing–Tianjin–Hebei region.
Land 14 01563 g004
Figure 5. Level of U-RCI in the Beijing–Tianjin–Hebei region.
Land 14 01563 g005
Figure 6. Level of U-RPI in the Beijing–Tianjin–Hebei region.
Land 14 01563 g006
Figure 7. Level of U-RLI in the Beijing–Tianjin–Hebei region.
Land 14 01563 g007
Figure 8. Level of U-RII in the Beijing–Tianjin–Hebei region.
Land 14 01563 g008
Figure 9. (a,b) Results of spatial autocorrelation analysis in the Beijing–Tianjin–Hebei region.
Land 14 01563 g009
Figure 10. Spatial distribution of urban–rural integration level clusters areas in the Beijing–Tianjin–Hebei region.
Land 14 01563 g010
Figure 11. (ad) Descriptive statistics of coefficients influencing the level of U-RCI in the GTWR model.
Land 14 01563 g011
Figure 12. Results of spatio-temporal drivers of U-RCI level in the Beijing–Tianjin–Hebei region.
Land 14 01563 g012
Table 1. Evaluation index system of urban–rural integration in the Beijing–Tianjin–Hebei region.
DimensionIDEvaluation IndicatorsTypeCalculation MethodEfficacy
People dimensionX1Savings of urban and rural residentsDevelopment——+
X2Teacher–student ratio in basic educationDevelopmentThe ratio of the number of teachers to the number of students enrolled in general primary and secondary schools+
X3The number of hospitals and sanatorium beds per 1000 peopleDevelopmentThe number of hospitals and sanatorium beds × 1000/resident population+
X4The ratio of urban to rural income levelsCoordinationThe ratio of disposable income of urban residents to rural residents
Land dimensionX5Built-up area ratioDevelopmentThe ratio of built-up area to total land area+
X6Per capita occupancy rate of cultivated landDevelopmentThe ratio of cultivated land area to total county population+
X7Forest land coverDevelopmentThe ratio of forest area to total land area+
X8Urban–rural road network ratioCoordinationThe ratio of rural roads to other roads (1 is the optimal value)
Industry dimensionX9Gross regional product per capitaDevelopmentThe ratio of GDP to county population+
X10Ratio of land used for facility-based agricultureDevelopmentThe ratio of the area of land used for facility-based agriculture to the area of cultivated land+
X11The ratio of non-agricultural output to agricultural outputCoordinationThe ratio of secondary and tertiary industry output to primary industry output
X12The number of scenic spotsDevelopment——+
Note: + represents positive indicators that promote urban–rural integration; − represents negative indicators that inhibit urban–rural integration. Source: self-drawn.
Table 2. Results of the correlation test for the level of U-RCI.
Variable YU-RCI
Variable XU-RPIU-RLIU-RLI
Relevance0.782 **0.744 **0.782 **
Significance000
Note: ** indicates significant correlation at 0.01. Source: self-drawn.
Table 3. Results of the covariance test for the level of U-RCI.
Variable YU-RCI
Variable XU-RPIU-RLIU-RLI
Tolerances0.6650.8790.644
VIF1.5031.1381.552
Source: self-drawn.
Table 4. Comparison results of OLS, GWR and GTWR models.
CategoryR2AICcResidual Squares (RSS)
OLSGWRGTWROLSGWRGTWROLSGWRGTWR
U-RCI0.401340.5340.5989−660.66−762.55−859.9717.73313.821611.9004
Disclaimer/Publisher’s Note: The statements, opinions and data contained in all publications are solely those of the individual author(s) and contributor(s) and not of MDPI and/or the editor(s). MDPI and/or the editor(s) disclaim responsibility for any injury to people or property resulting from any ideas, methods, instructions or products referred to in the content.

