
Beyond a Single Story: The Complex and Varied Patterns of Park Accessibility Across China’s Emerging Cities


Abstract
1. Introduction
- (1)
- How does urban park accessibility vary across 10 s-tier provincial capitals in China?
- (2)
- How do contextual characteristics influence the spatial patterns of park accessibility observed in different cities?
- (3)
- How do the relationships between housing prices and park accessibility differ among these second-tier cities, and what insights do these patterns offer regarding potential issues of social equity?
2. Methods
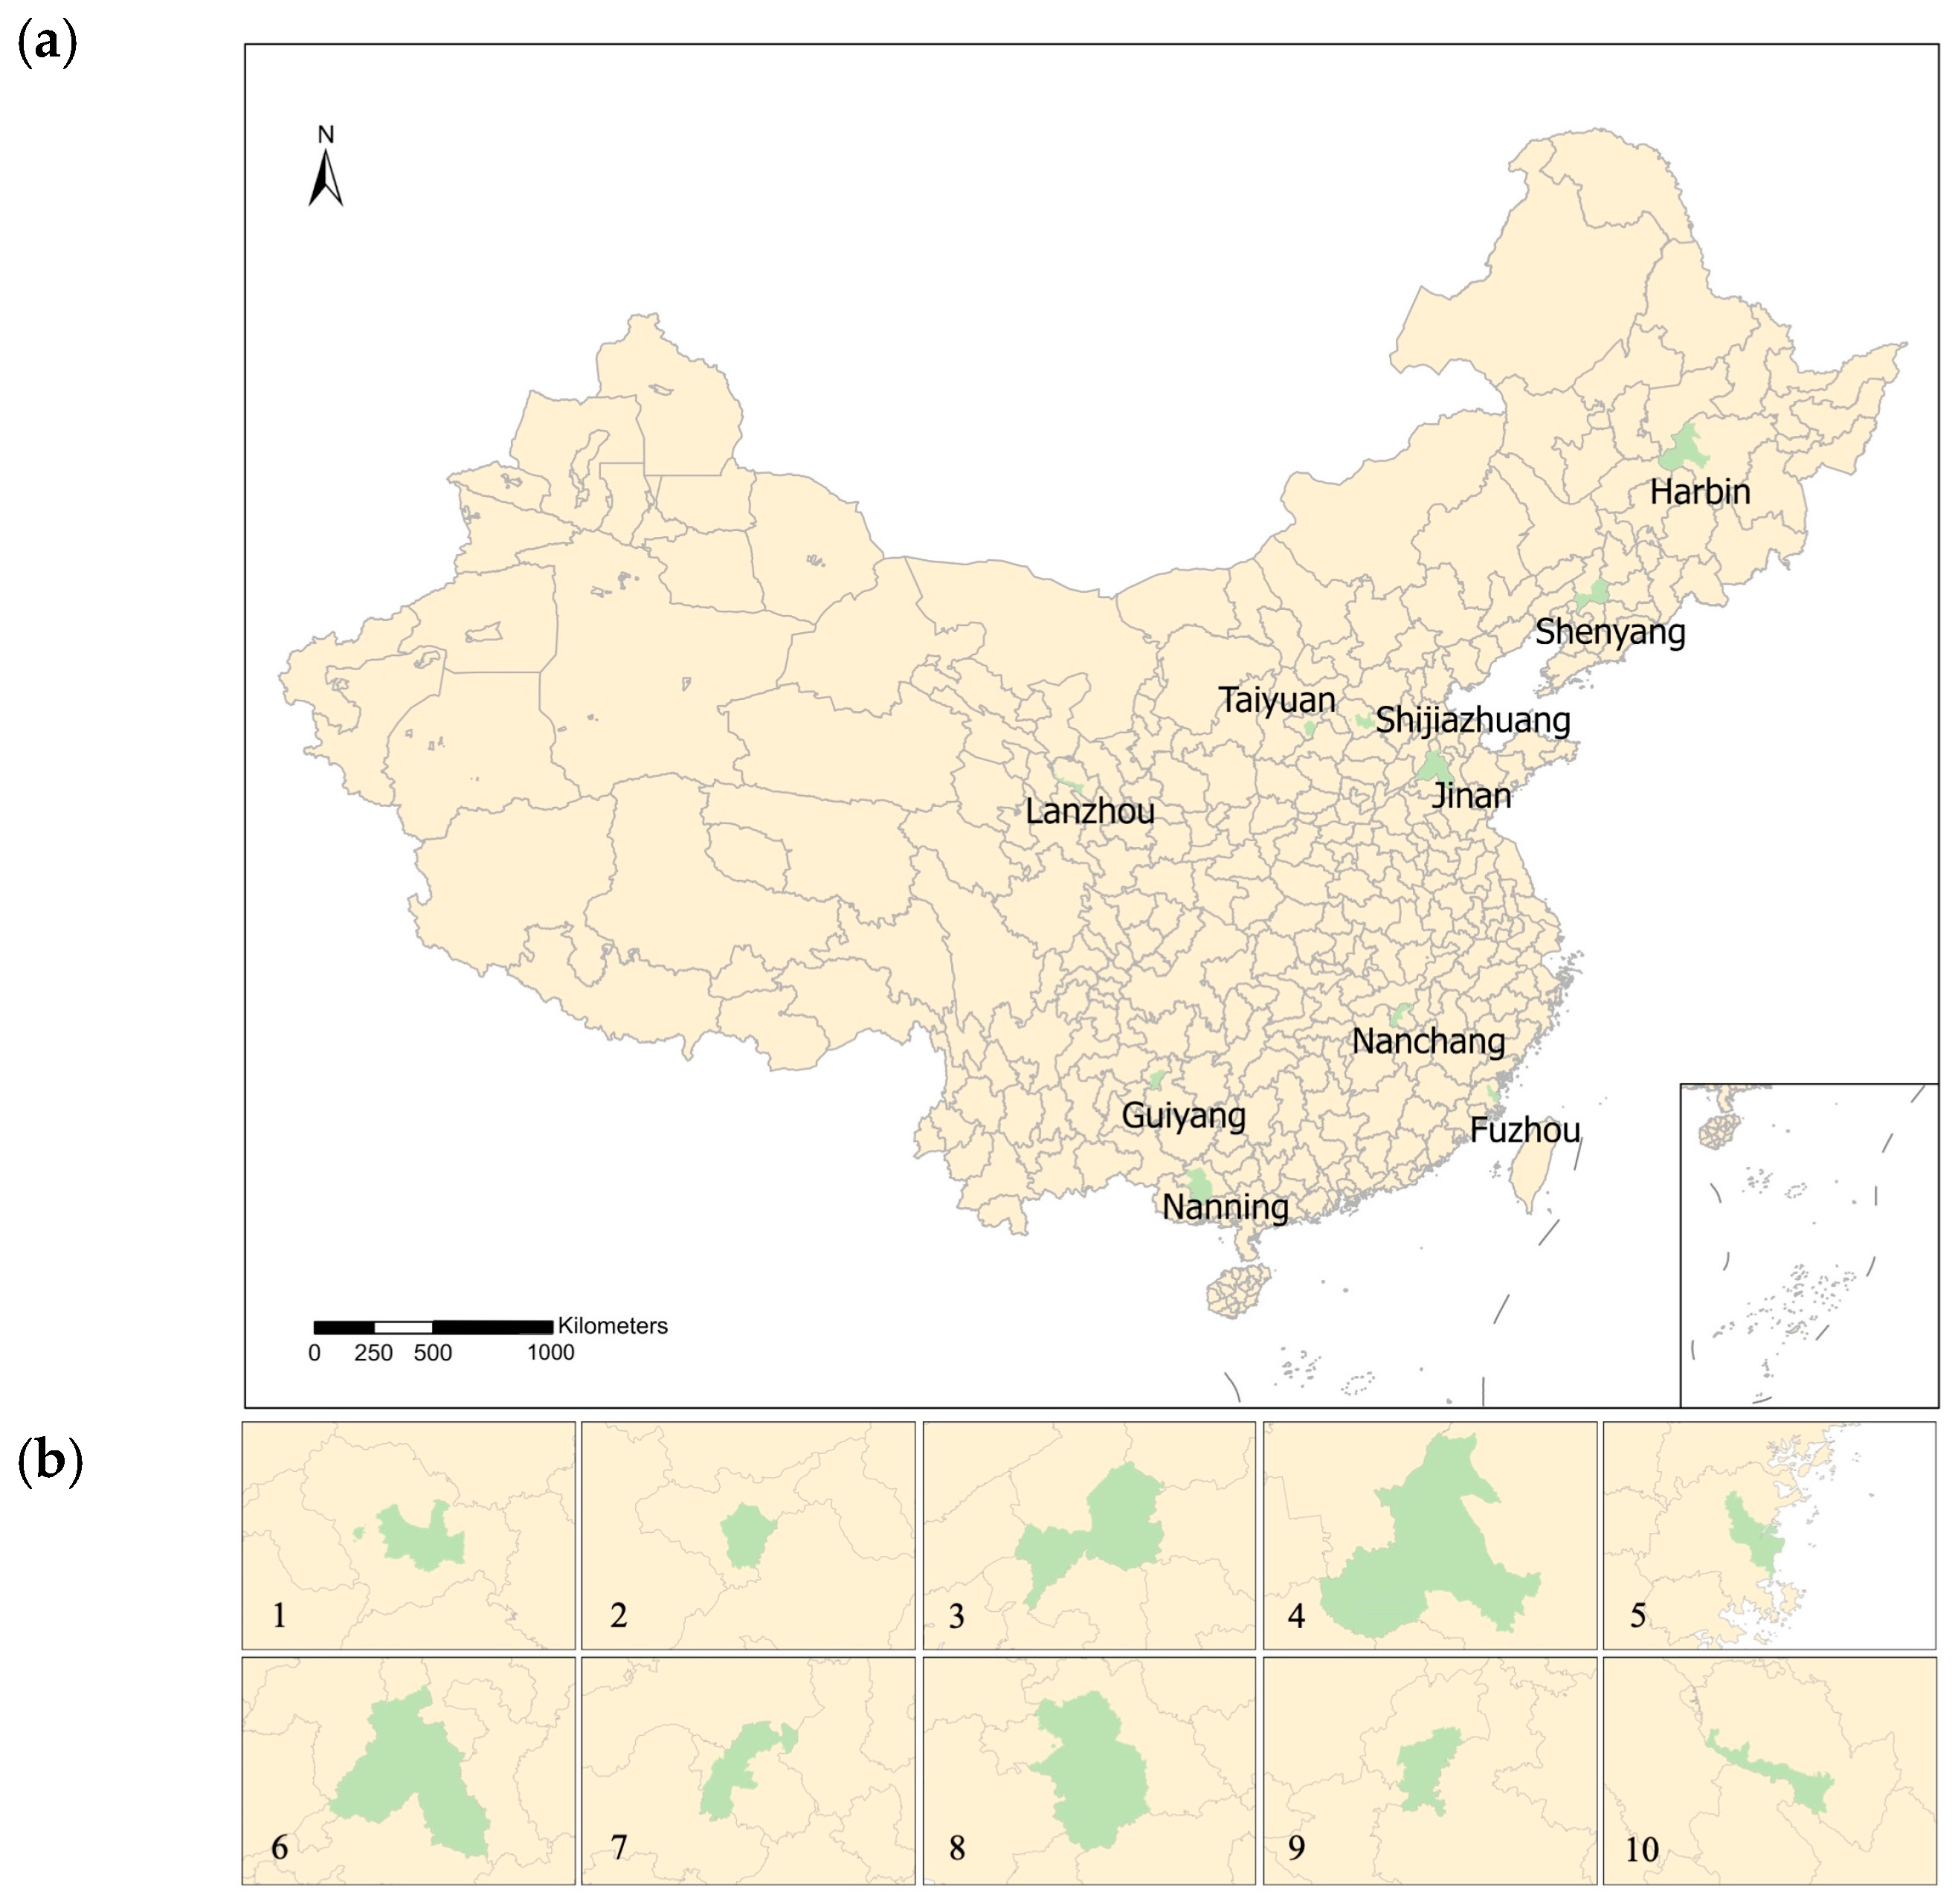
2.1. Study Area
2.2. Data Description
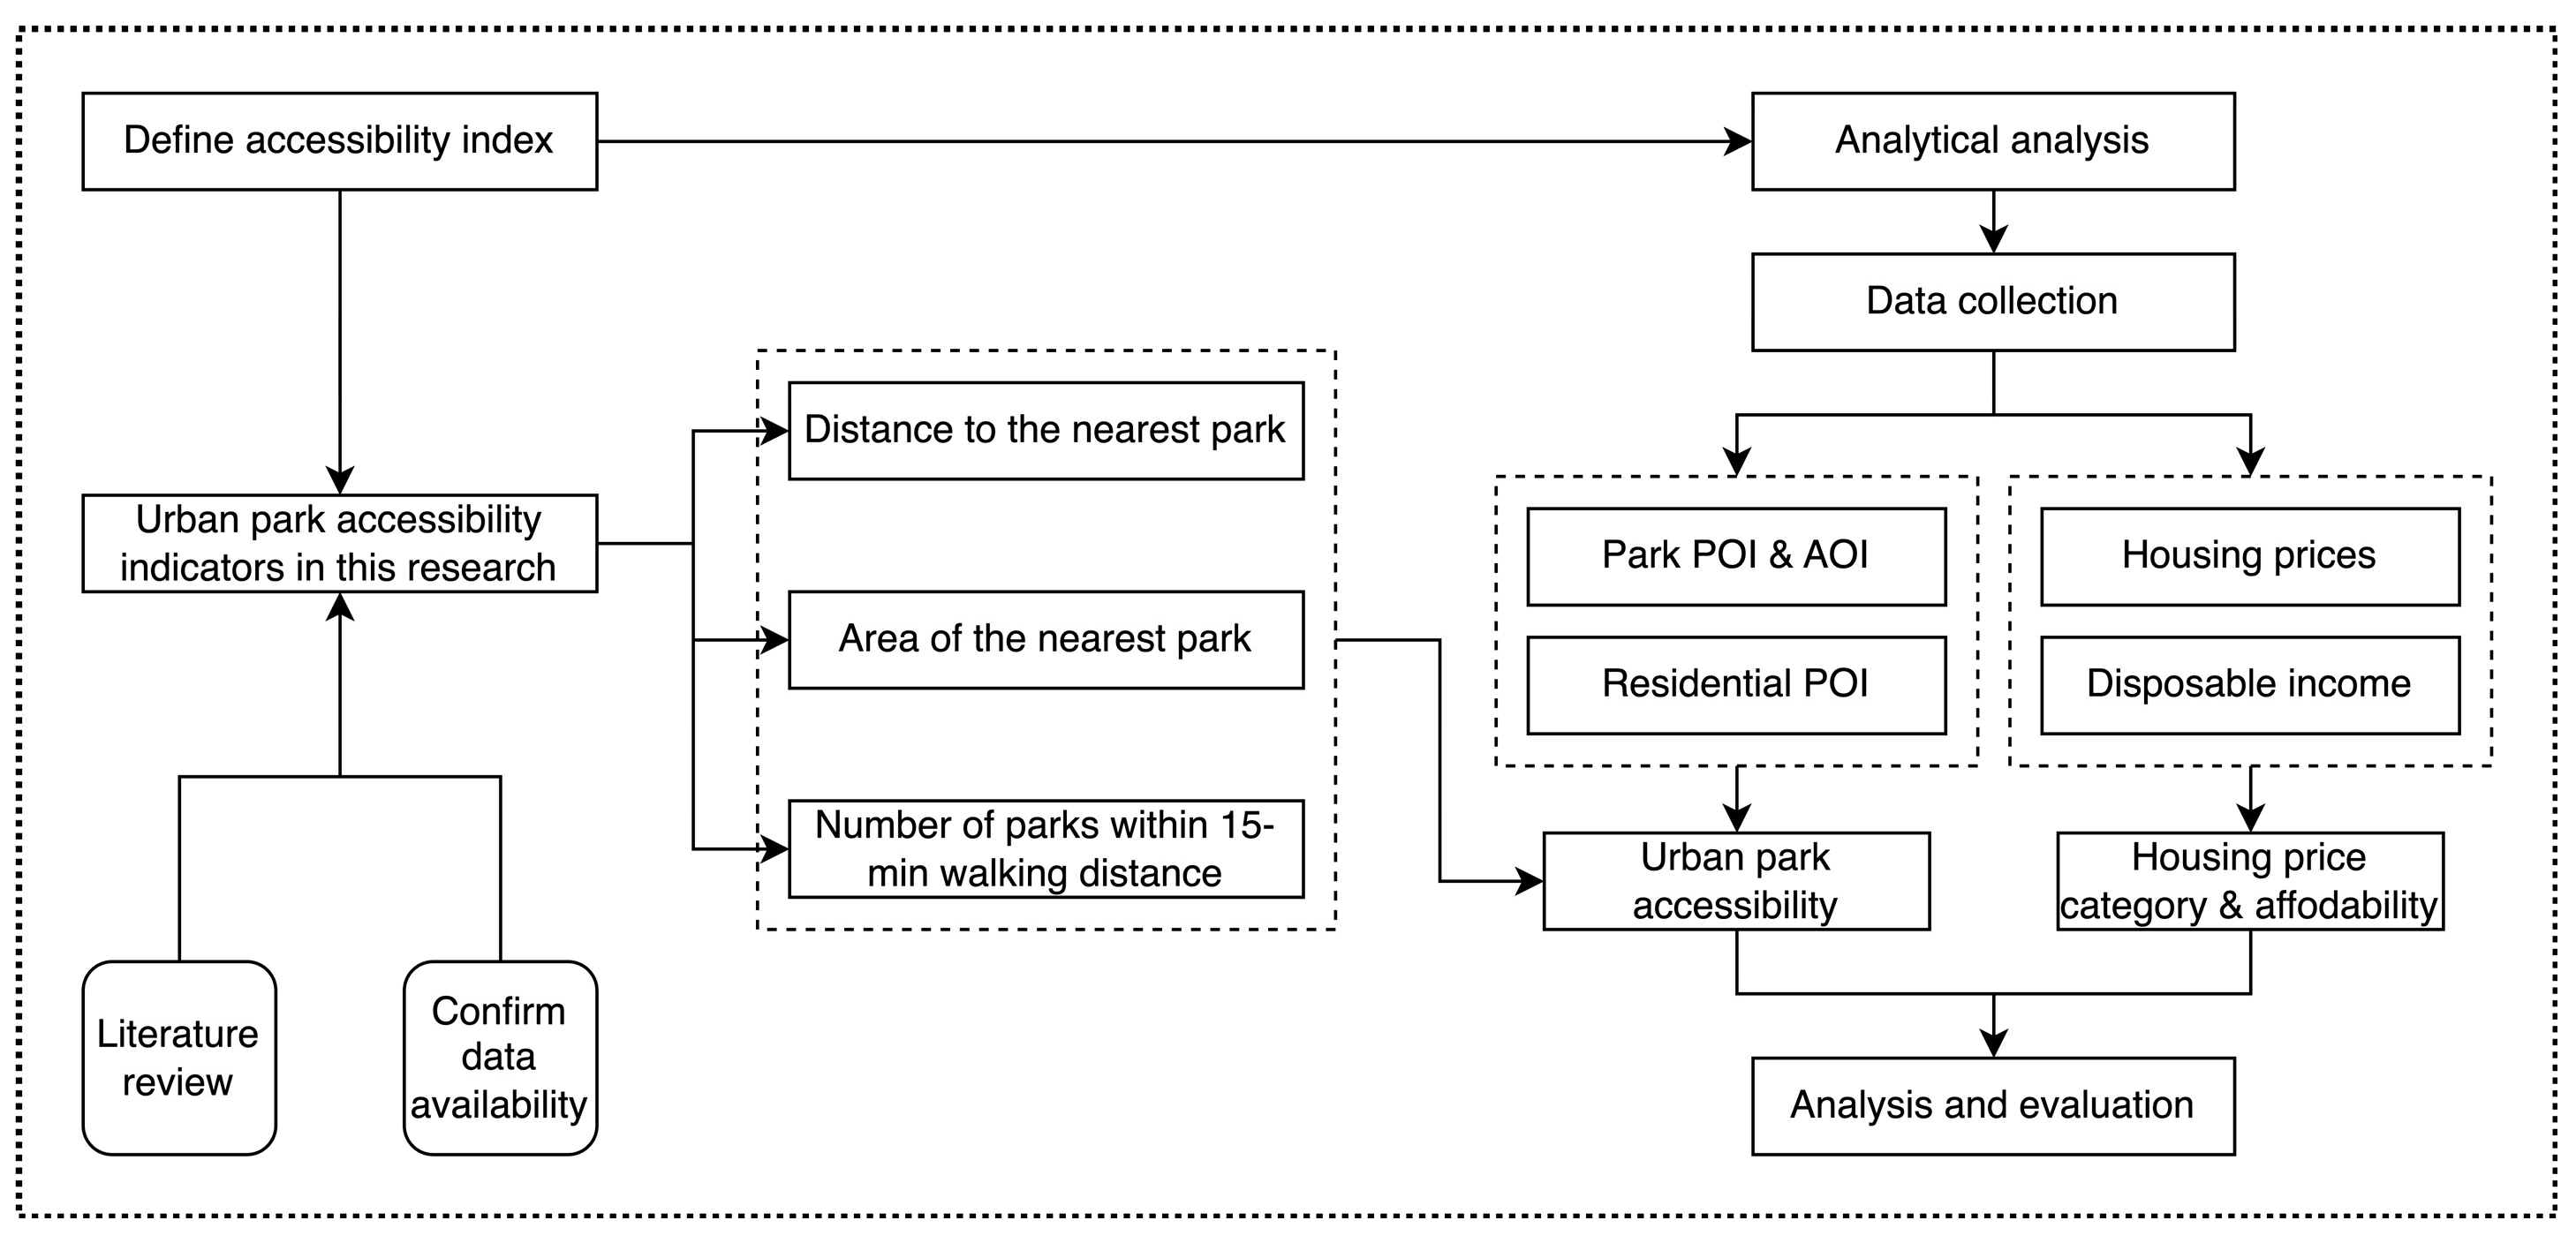
2.3. Data Analysis
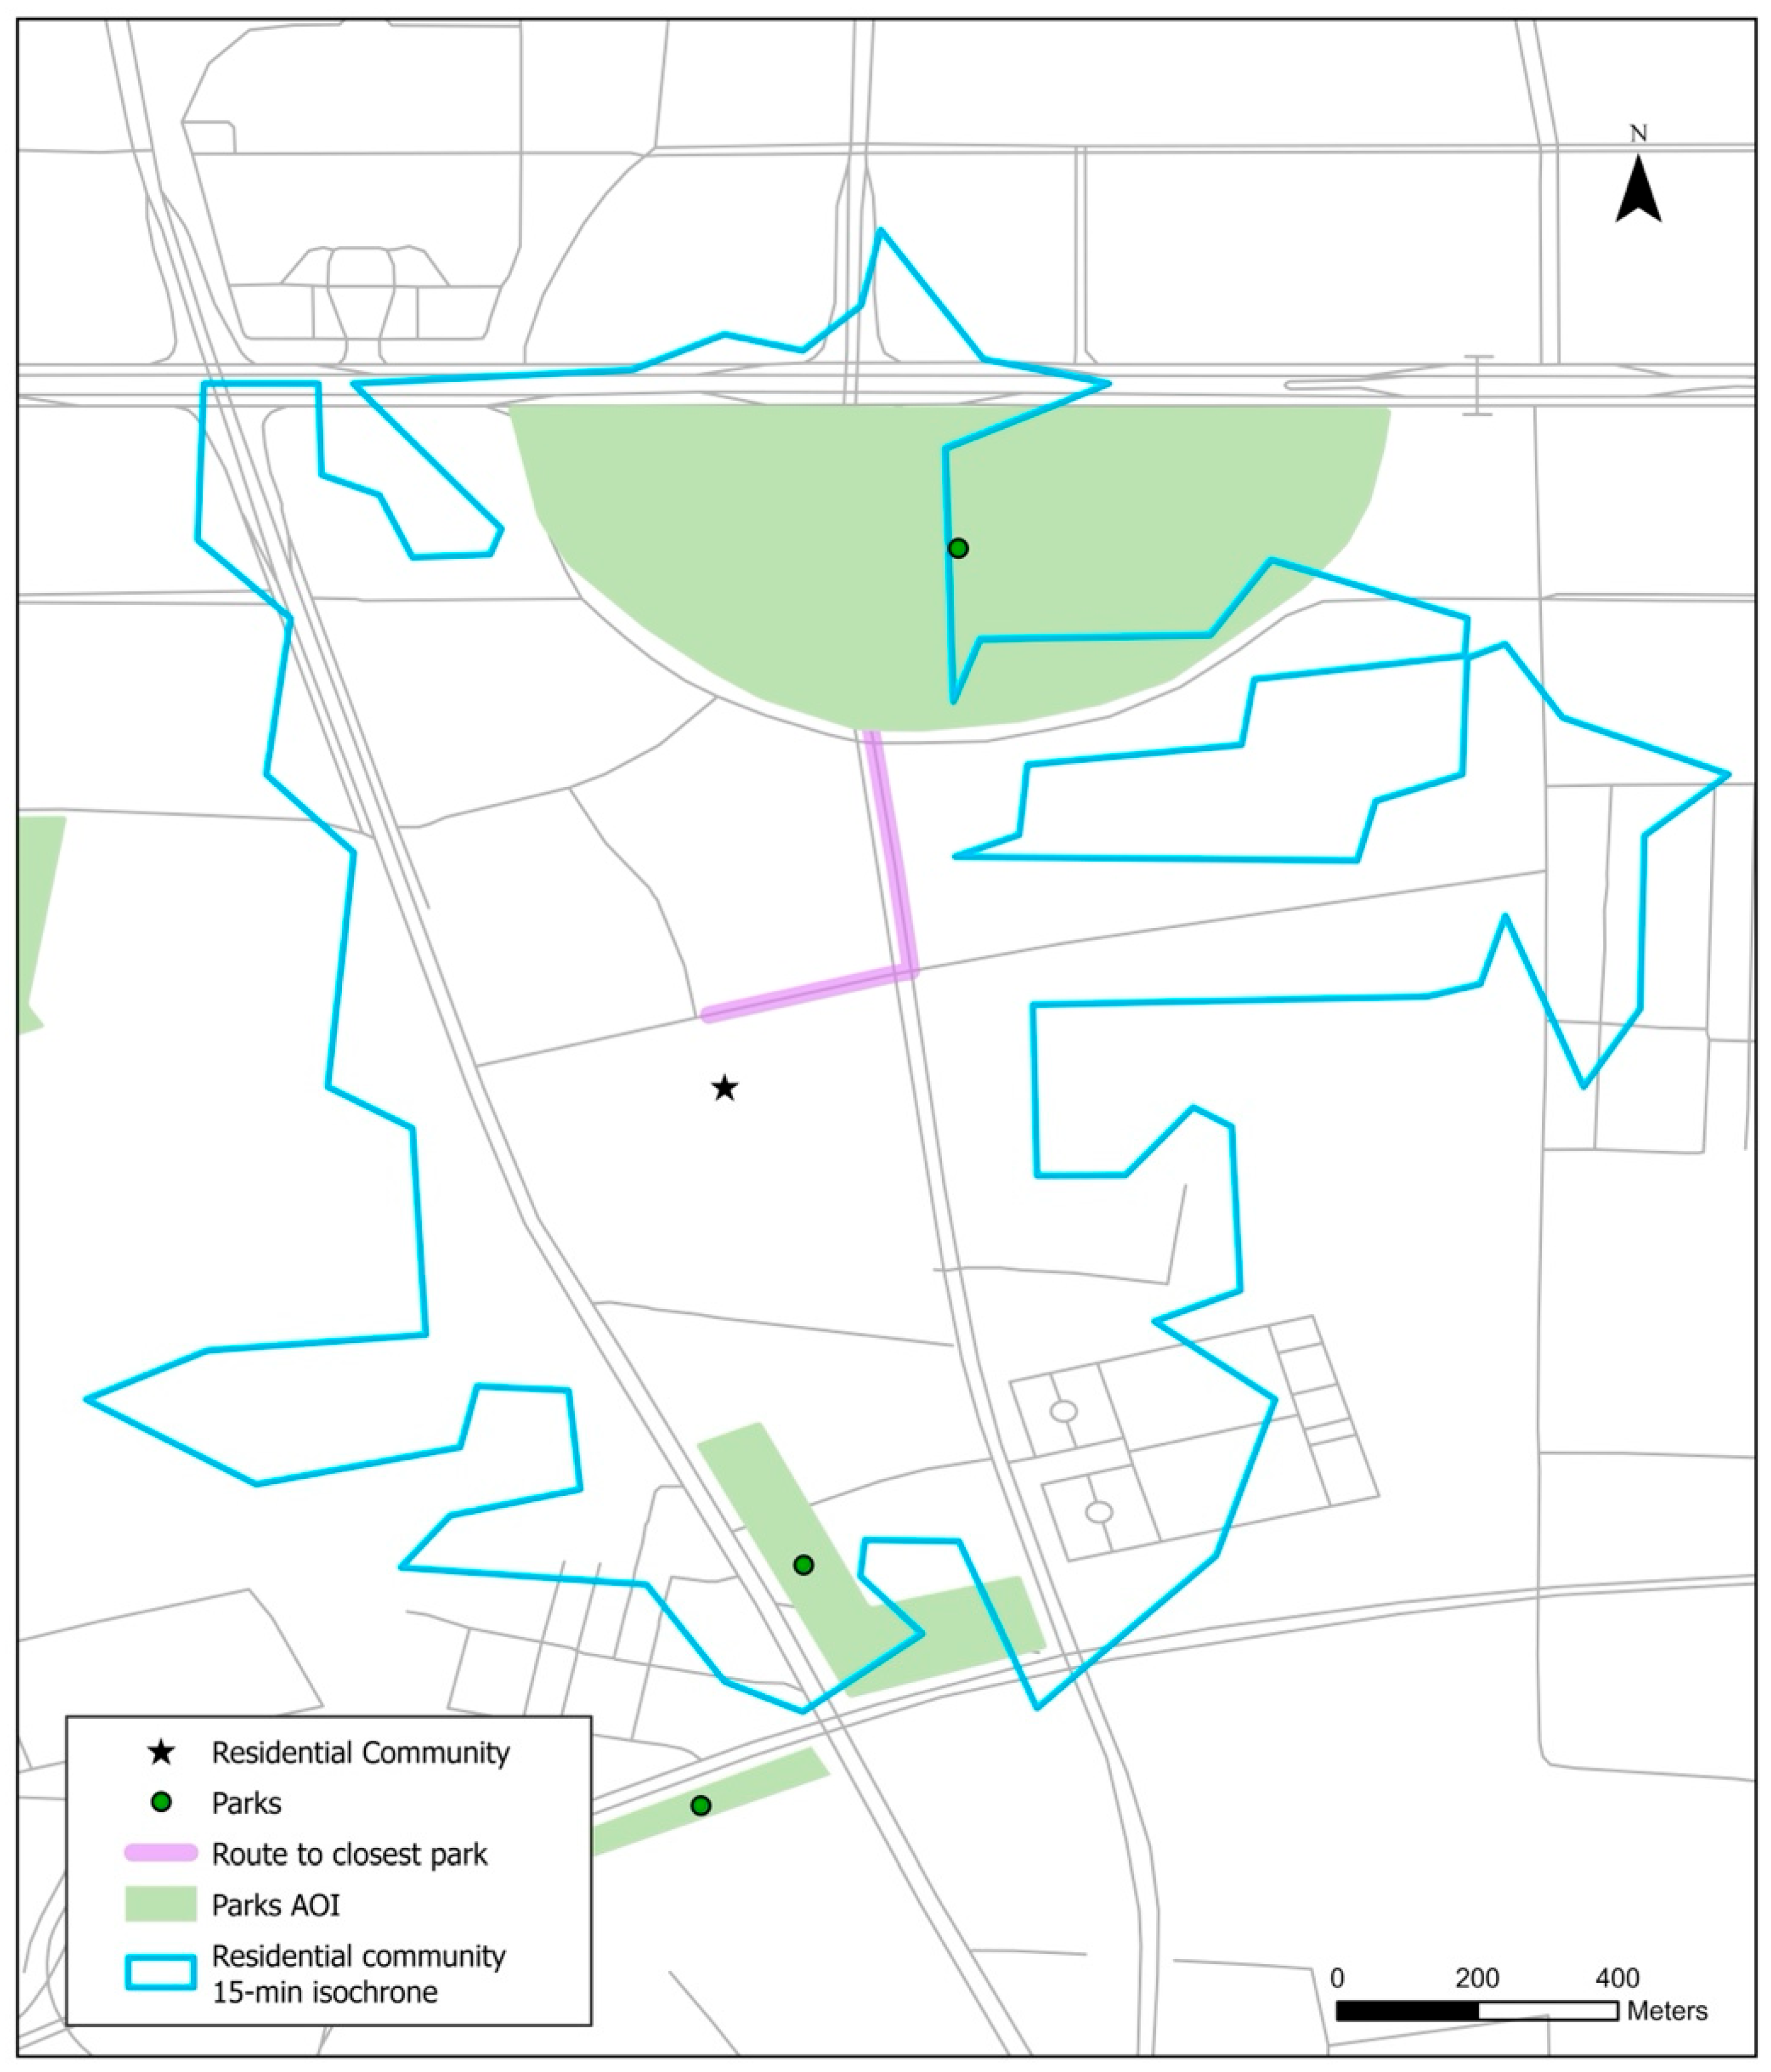
2.4. Accessibility Index
2.5. Home-Price-to-Disposable-Income Ratio
3. Results
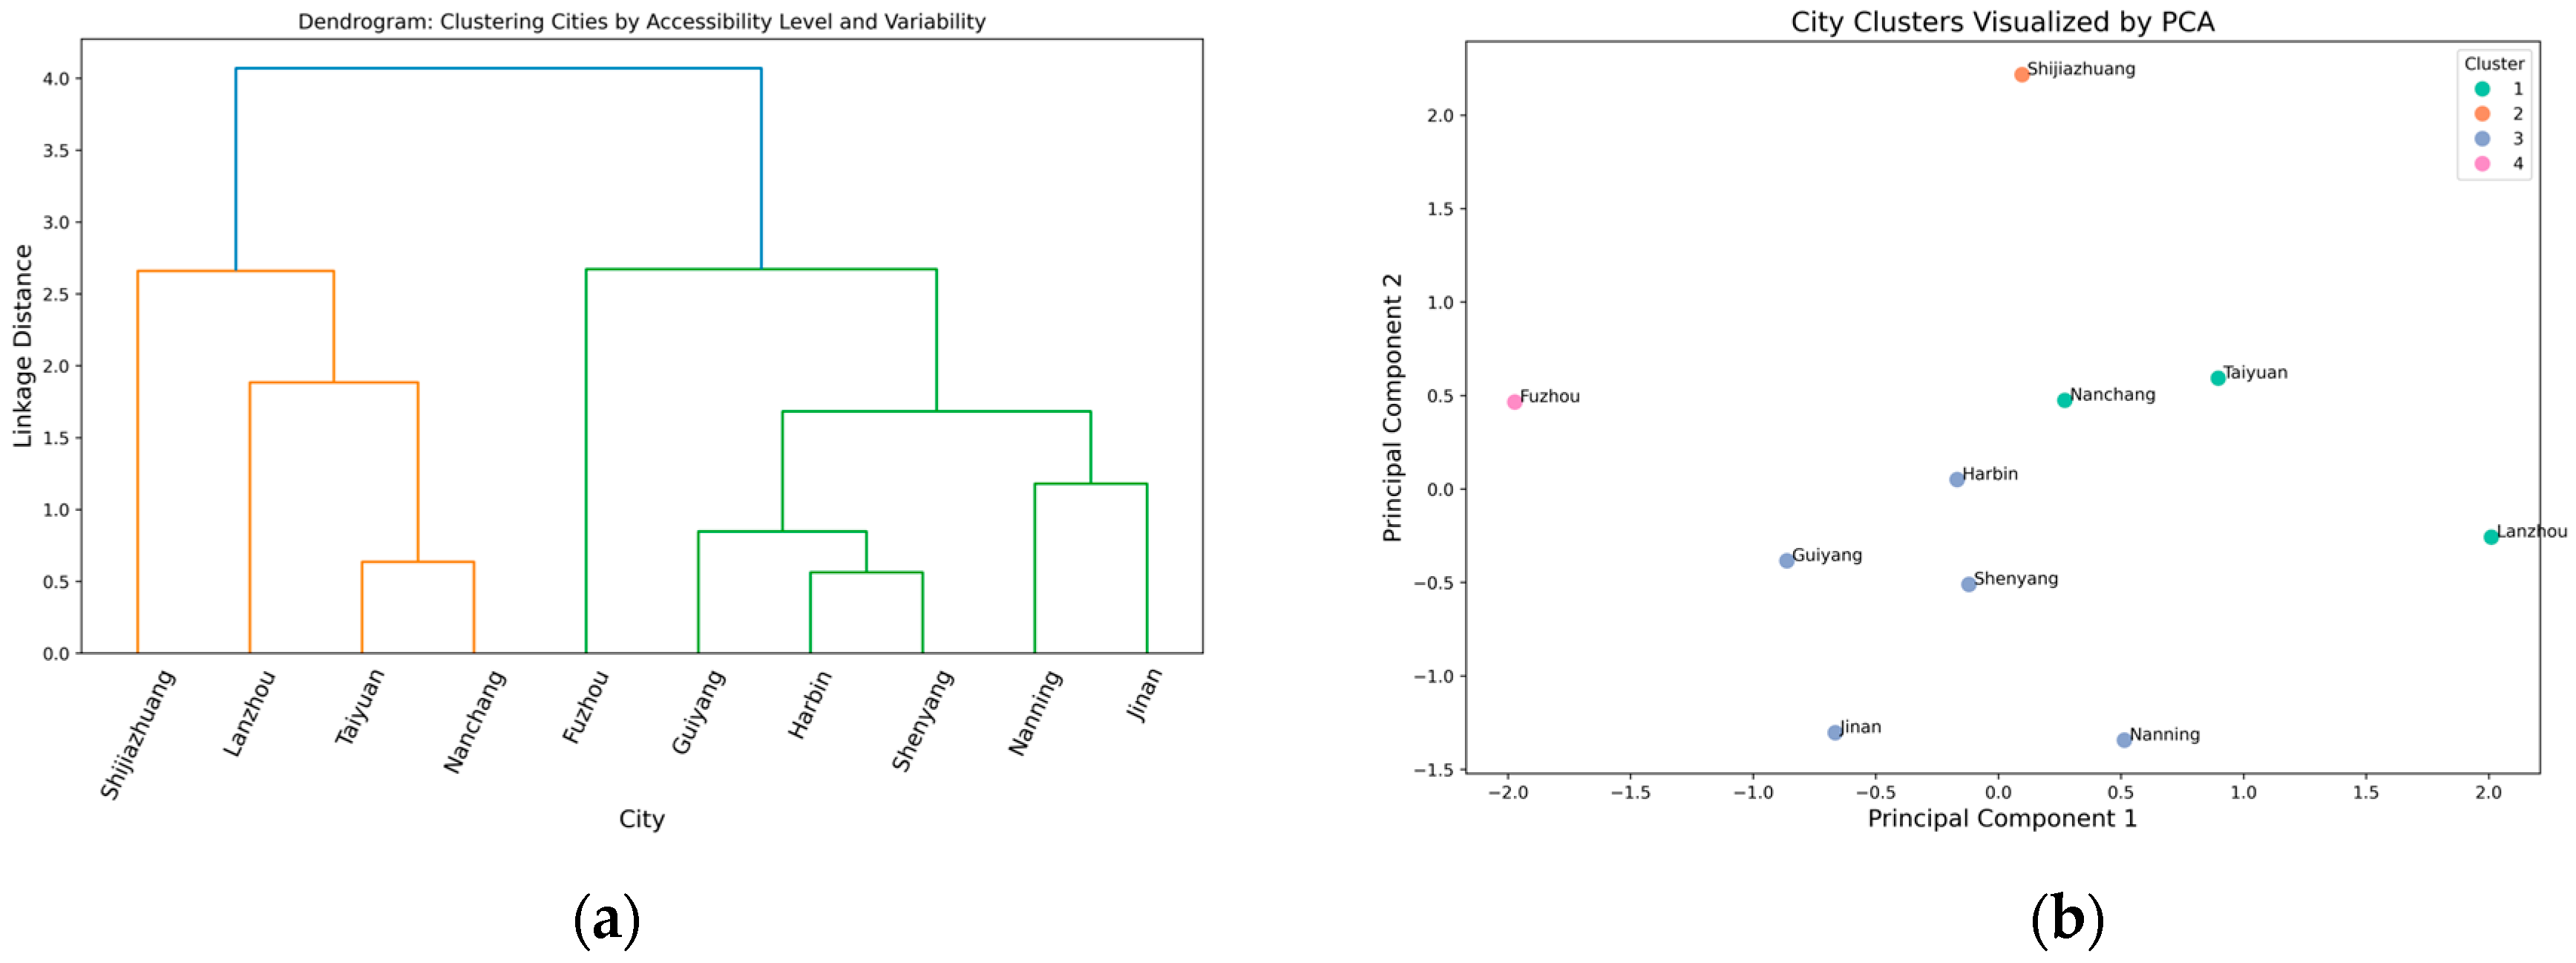
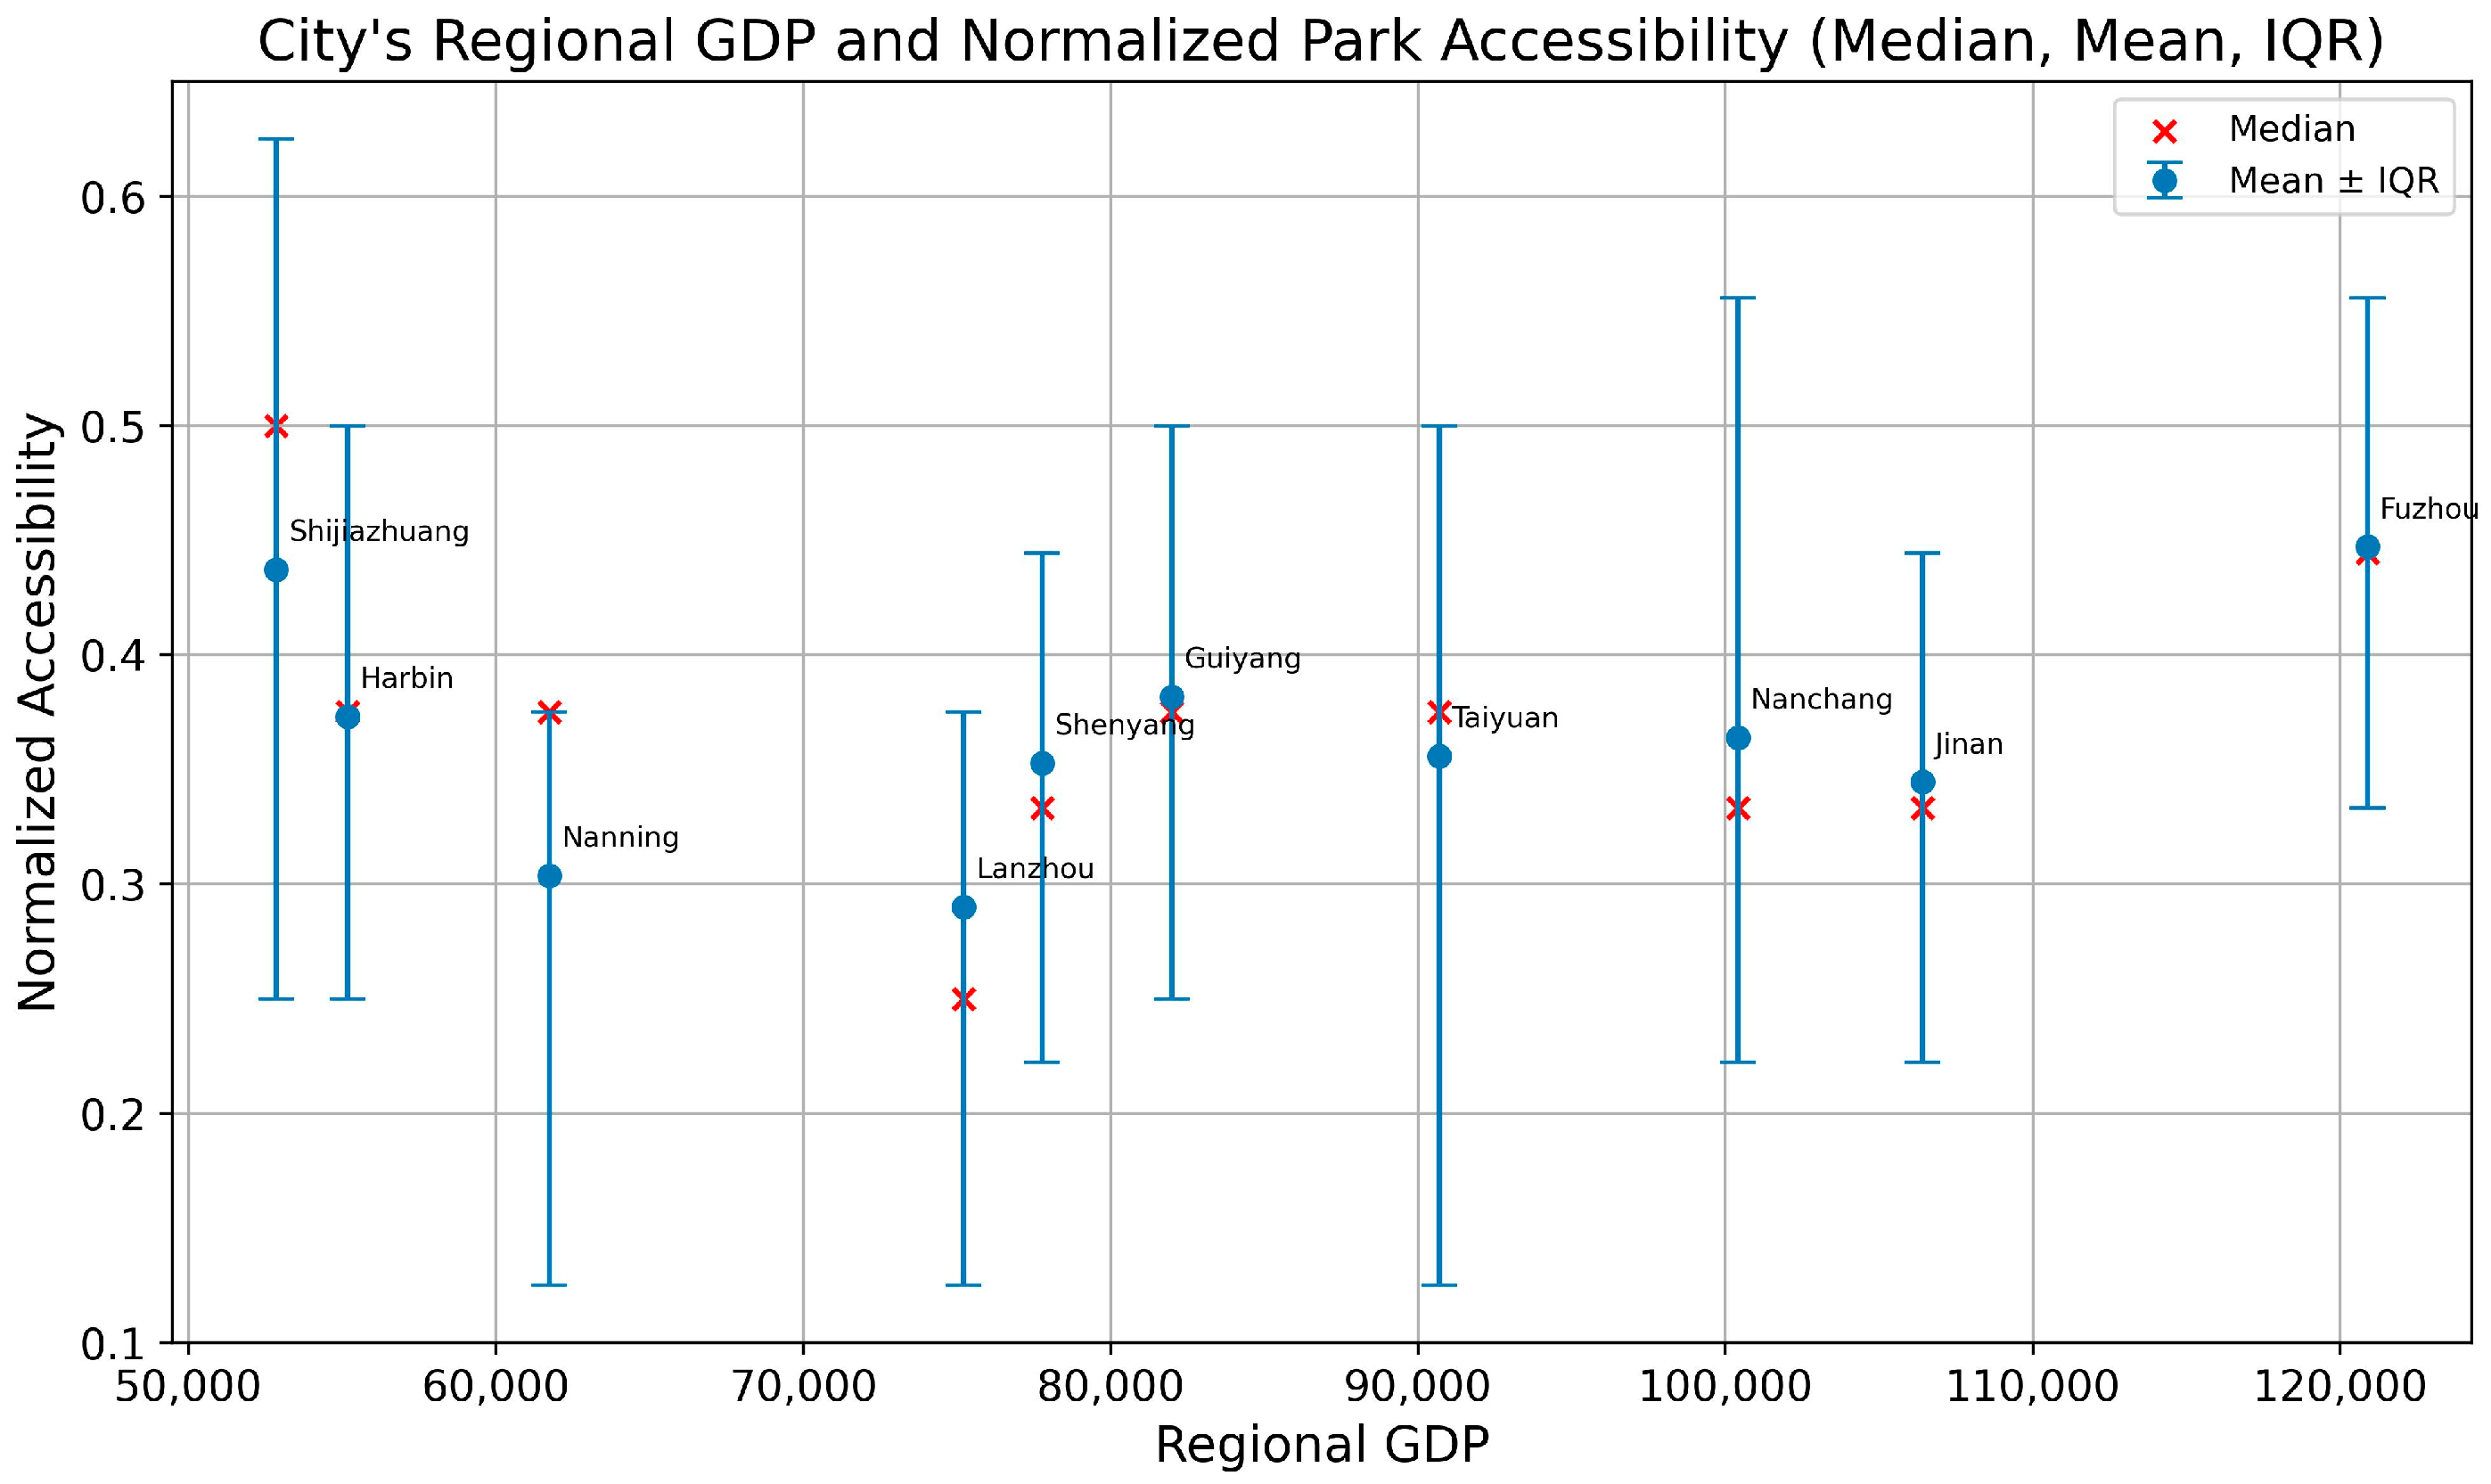
3.1. Urban Park Accessibilities Among Cities
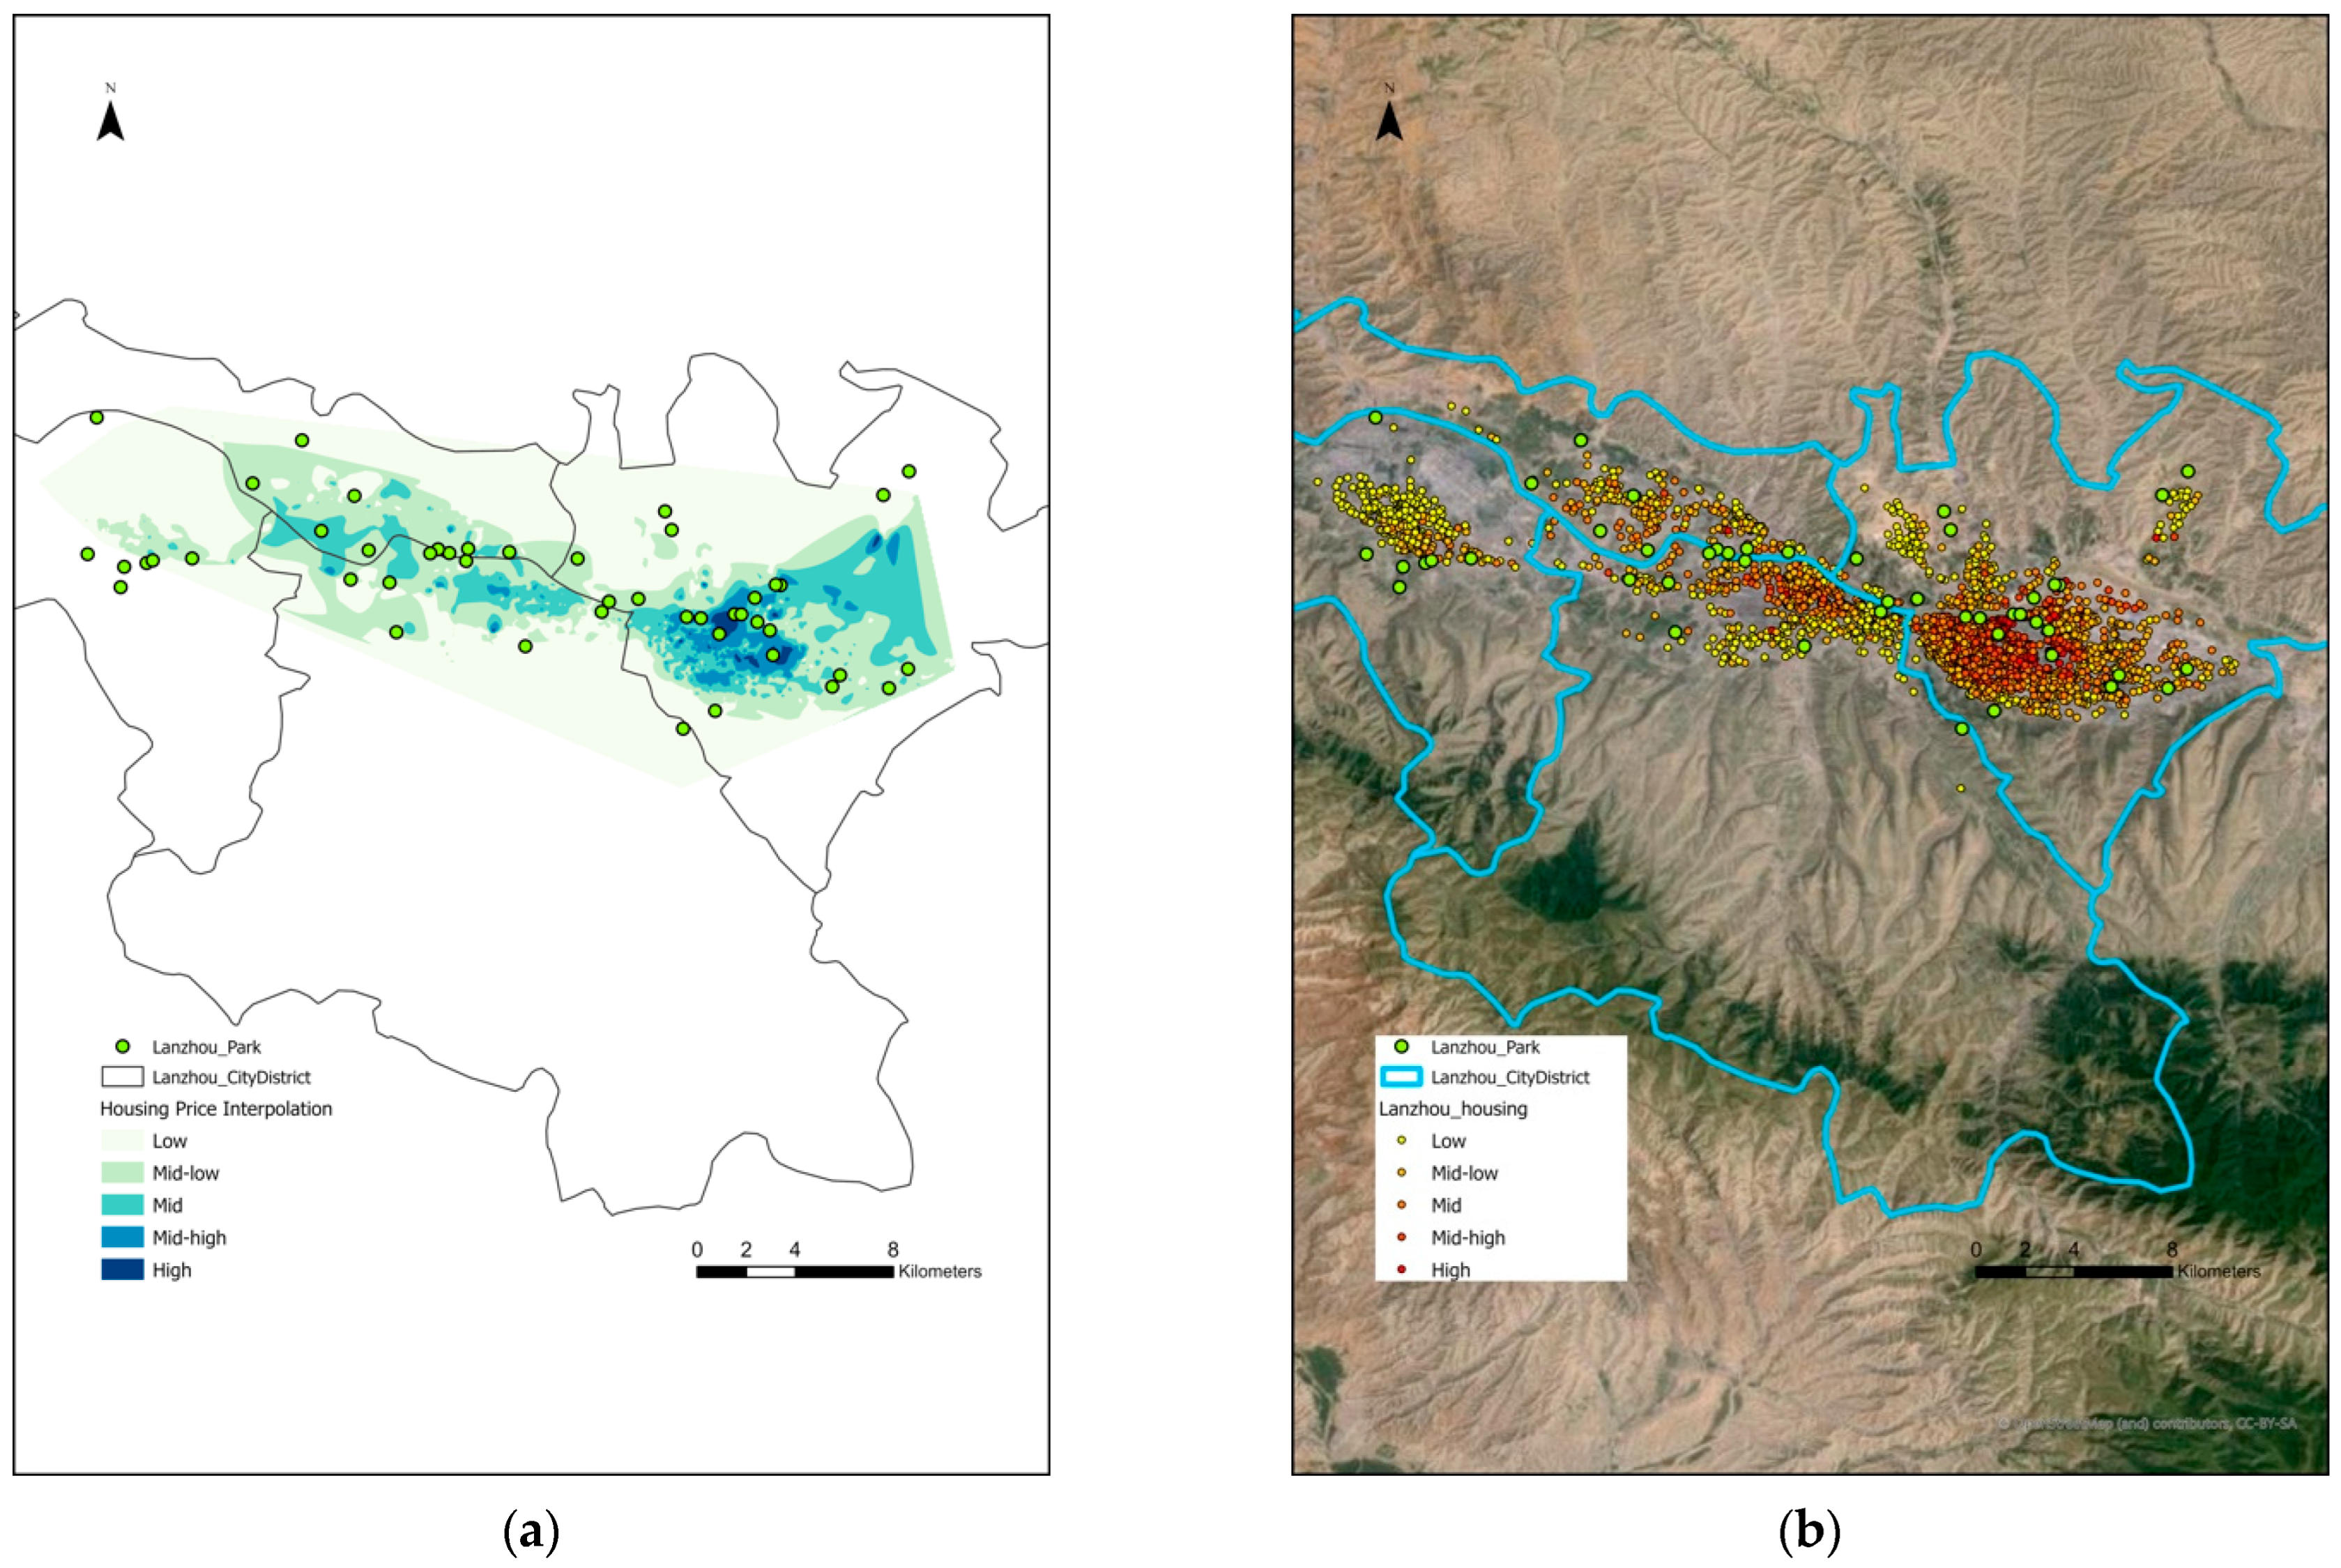
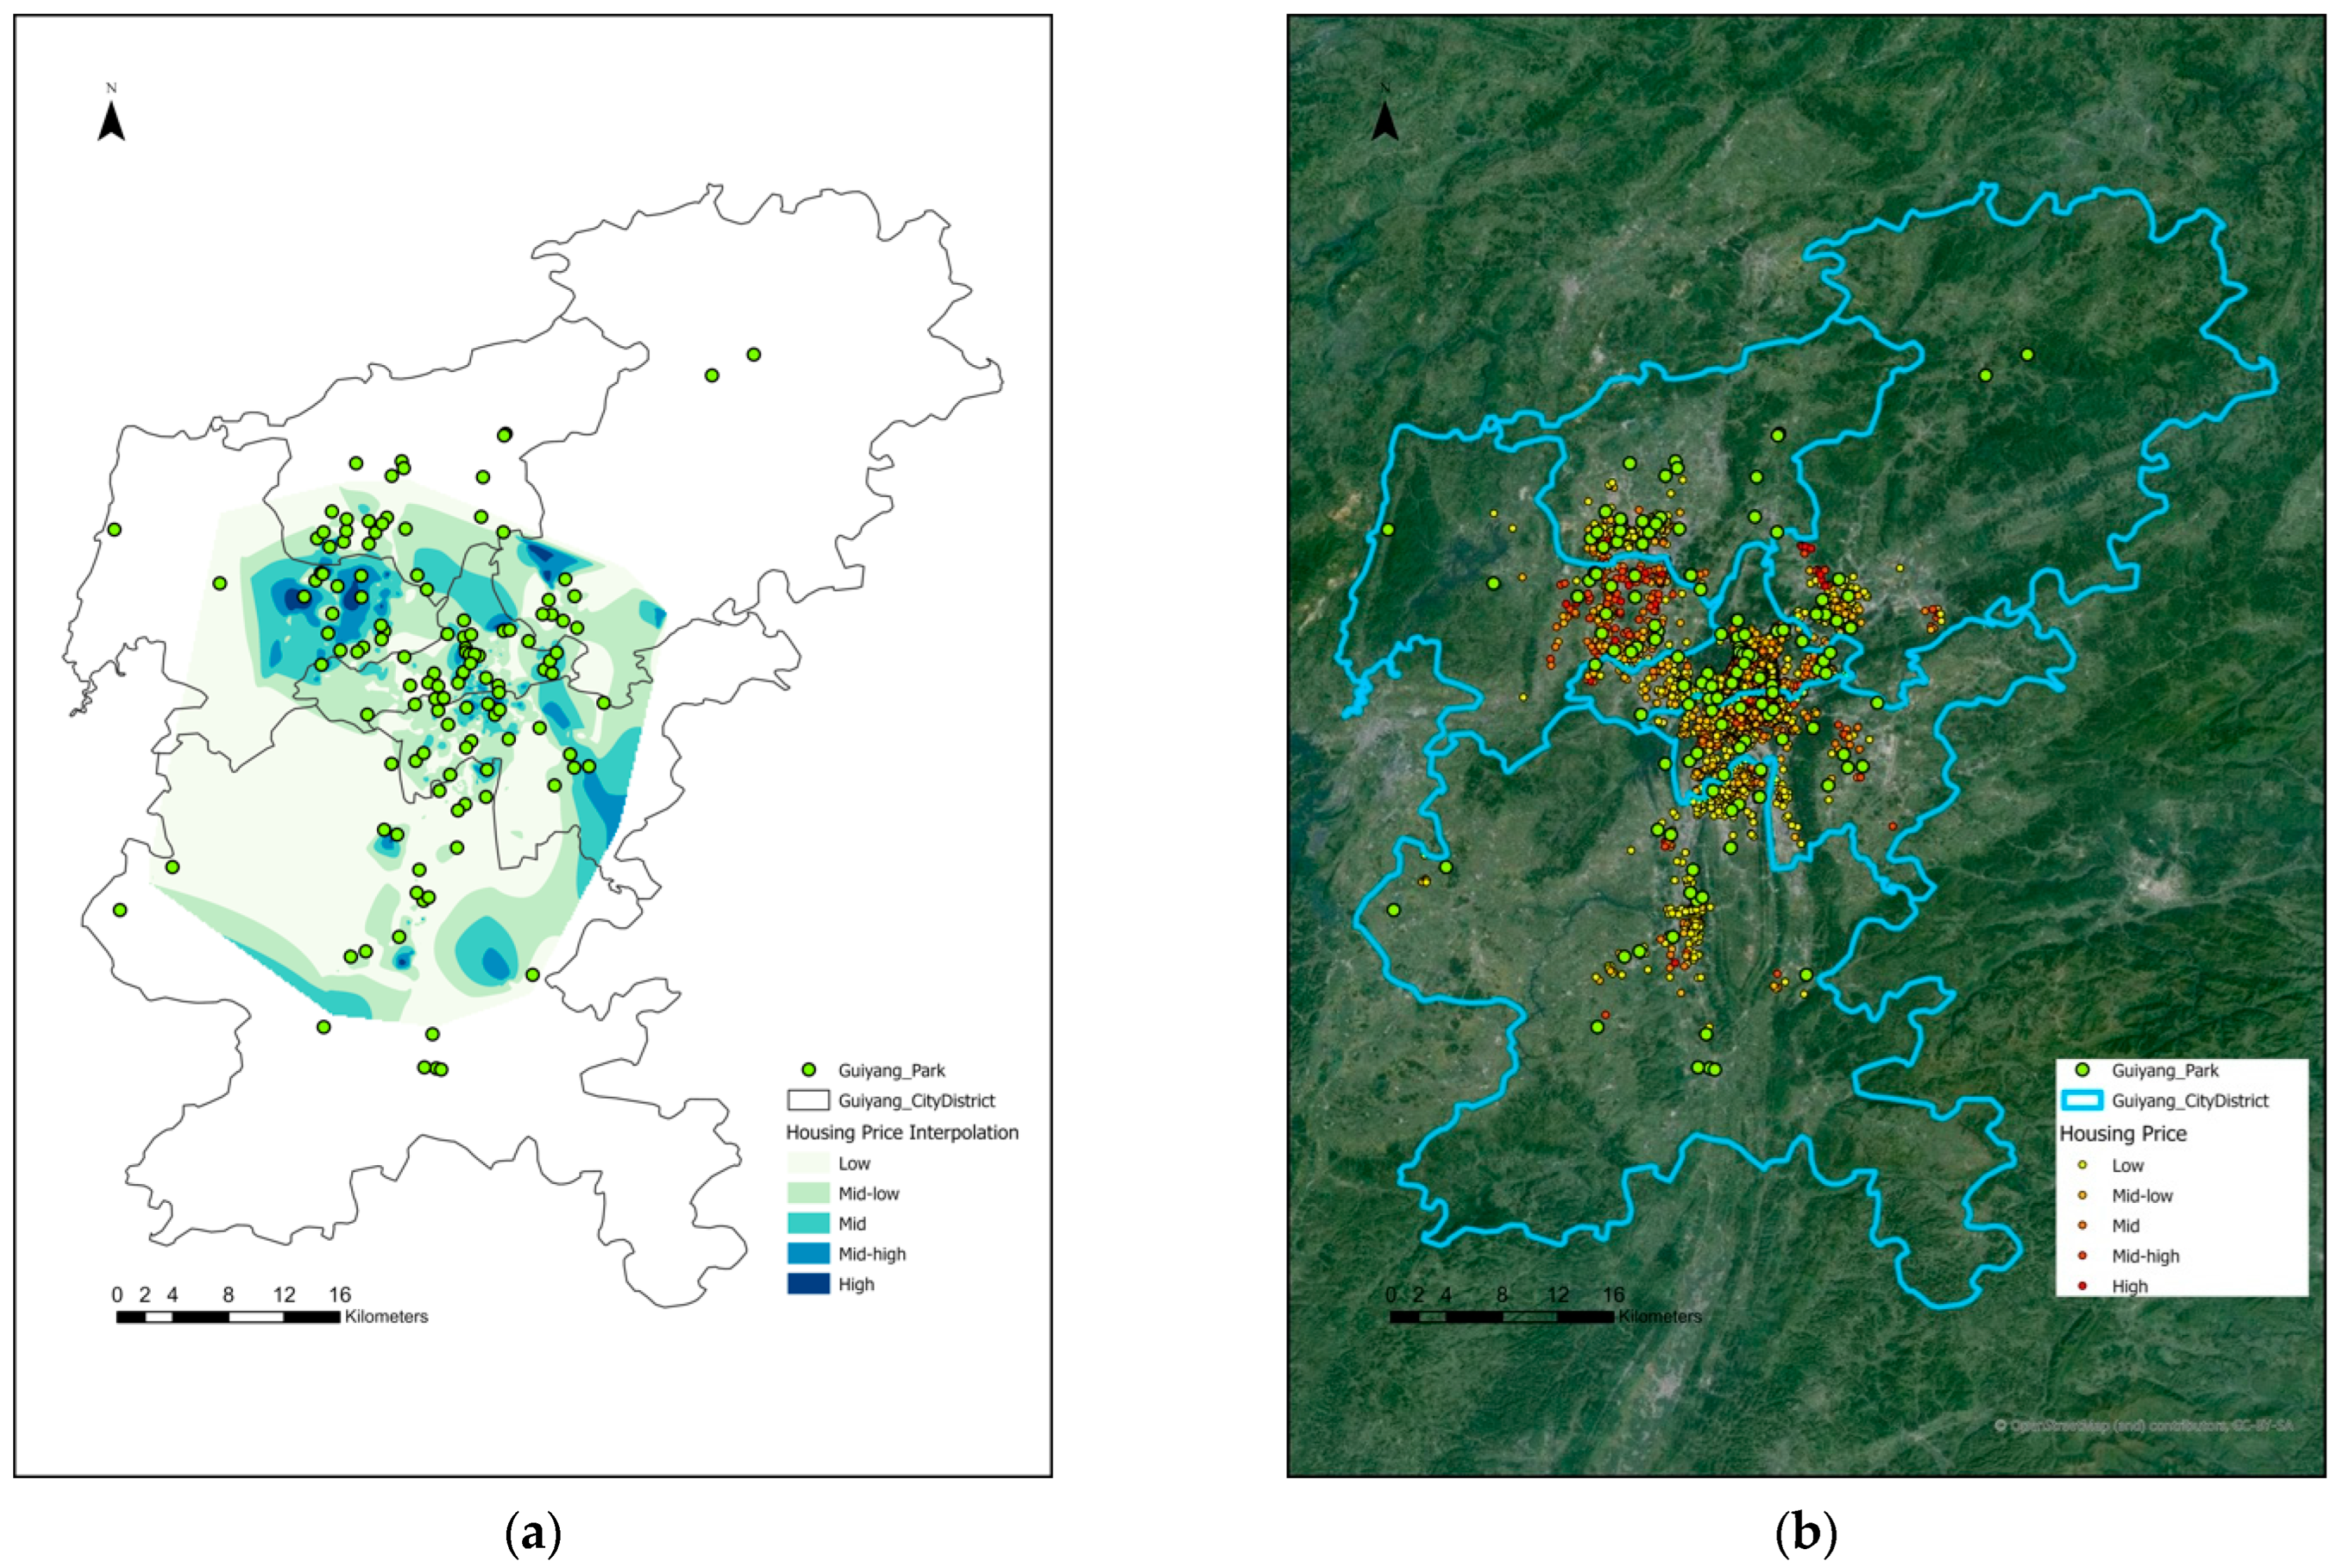
3.2. Accessibility Distribution Within the Cities Based on Housing Prices
4. Discussion
4.1. Diverse Pathways of Park Accessibility Across Cities
4.1.1. Economic Performance
4.1.2. Strategical Position
4.1.3. Geographical Context
4.2. Explaining Varying Patterns of Accessibility–Housing-Price Patterns
4.2.1. Socioeconomic Development and Disparities
4.2.2. Natural Environment and Uniformity
4.3. Social Equity, Urban Change, and the Reproduction of Inequality
4.4. Study Limitations
5. Conclusions
Author Contributions
Funding
Data Availability Statement
Conflicts of Interest
References
- Fainstein, S.S. The Just City; Cornell University Press: Ithaca, NY, USA, 2010; ISBN 978-0-8014-4655-9. [Google Scholar]
- Israel, E.; Frenkel, A. Social Justice and Spatial Inequality: Toward a Conceptual Framework. Prog. Hum. Geogr. 2018, 42, 647–665. [Google Scholar] [CrossRef]
- Bedimo-Rung, A.L.; Mowen, A.J.; Cohen, D.A. The Significance of Parks to Physical Activity and Public Health: A Conceptual Model. Am. J. Prev. Med. 2005, 28, 159–168. [Google Scholar] [CrossRef] [PubMed]
- Crompton, J.L. The Impact of Parks on Property Values: A Review of the Empirical Evidence. J. Leis. Res. 2001, 33, 1–31. [Google Scholar] [CrossRef]
- Duan, Y.; Wagner, P.; Zhang, R.; Wulff, H.; Brehm, W. Physical Activity Areas in Urban Parks and Their Use by the Elderly from Two Cities in China and Germany. Landsc. Urban Plan. 2018, 178, 261–269. [Google Scholar] [CrossRef]
- Maas, J.; Verheij, R.A.; Groenewegen, P.P.; de Vries, S.; Spreeuwenberg, P. Green Space, Urbanity, and Health: How Strong Is the Relation? J. Epidemiol. Community Health 2006, 60, 587–592. [Google Scholar] [CrossRef]
- Mitchell, R.; Popham, F. Greenspace, Urbanity and Health: Relationships in England. J. Epidemiol. Community Health 2007, 61, 681–683. [Google Scholar] [CrossRef]
- Yao, X.; Yu, K.; Zeng, X.; Lin, Y.; Ye, B.; Shen, X.; Liu, J. How Can Urban Parks Be Planned to Mitigate Urban Heat Island Effect in “Furnace Cities”? An Accumulation Perspective. J. Clean. Prod. 2022, 330, 129852. [Google Scholar] [CrossRef]
- Wolch, J.R.; Byrne, J.; Newell, J.P. Urban Green Space, Public Health, and Environmental Justice: The Challenge of Making Cities ‘Just Green Enough’. Landsc. Urban Plan. 2014, 125, 234–244. [Google Scholar] [CrossRef]
- Wang, C.; Li, C.; Wang, M.; Yang, S.; Wang, L. Environmental Justice and Park Accessibility in Urban China: Evidence from Shanghai. Asia Pac. Viewp. 2022, 63, 236–249. [Google Scholar] [CrossRef]
- Feng, D.; Bao, W.; Yang, Y.; Fu, M. How Do Government Policies Promote Greening? Evidence from China. Land Use Policy 2021, 104, 105389. [Google Scholar] [CrossRef]
- Rigolon, A. A Complex Landscape of Inequity in Access to Urban Parks: A Literature Review. Landsc. Urban Plan. 2016, 153, 160–169. [Google Scholar] [CrossRef]
- Xiao, Y.; Wang, Z.; Li, Z.; Tang, Z. An Assessment of Urban Park Access in Shanghai–Implications for the Social Equity in Urban China. Landsc. Urban Plan. 2017, 157, 383–393. [Google Scholar] [CrossRef]
- Zhang, R.; Sun, F.; Shen, Y.; Peng, S.; Che, Y. Accessibility of Urban Park Benefits with Different Spatial Coverage: Spatial and Social Inequity. Appl. Geogr. 2021, 135, 102555. [Google Scholar] [CrossRef]
- Schläpfer, F.; Waltert, F.; Segura, L.; Kienast, F. Valuation of Landscape Amenities: A Hedonic Pricing Analysis of Housing Rents in Urban, Suburban and Periurban Switzerland. Landsc. Urban Plan. 2015, 141, 24–40. [Google Scholar] [CrossRef]
- Zhang, Y.; Dong, R. Impacts of Street-Visible Greenery on Housing Prices: Evidence from a Hedonic Price Model and a Massive Street View Image Dataset in Beijing. ISPRS Int. J. Geo-Inf. 2018, 7, 104. [Google Scholar] [CrossRef]
- Wu, C.; Ye, X.; Du, Q.; Luo, P. Spatial Effects of Accessibility to Parks on Housing Prices in Shenzhen, China. Habitat Int. 2017, 63, 45–54. [Google Scholar] [CrossRef]
- Wu, J.; He, Q.; Chen, Y.; Lin, J.; Wang, S. Dismantling the Fence for Social Justice? Evidence Based on the Inequity of Urban Green Space Accessibility in the Central Urban Area of Beijing. Environ. Plan. B Urban Anal. City Sci. 2020, 47, 626–644. [Google Scholar] [CrossRef]
- Yu, S.; Zhu, X.; He, Q. An Assessment of Urban Park Access Using House-Level Data in Urban China: Through the Lens of Social Equity. Int. J. Environ. Res. Public. Health 2020, 17, 2349. [Google Scholar] [CrossRef]
- Li, X.; Wang, Y.; Ju, C.; Huang, B.; Wang, X.; Ma, L.; Wang, P.; Wang, H.; Wang, X.; Fang, X.; et al. China City Statistical Yearbook 2021; National Bureau of Statistics of China, Ed.; National Bureau of Statistics of China: Beijing, China, 2022. [Google Scholar]
- He, J.; Ren, F.; Dong, J.; Zhang, H.; Yan, W.; Liu, J. Social Inequity of Park Accessibility in Taiyuan: Highlighting the Unfair Layout of Parks in Second-Tier Cities of China and the Relative Role of Contributors. Geo-Spat. Inf. Sci. 2022, 27, 1118–1140. [Google Scholar] [CrossRef]
- Chen, J.; Hu, M.; Lin, Z. Does Housing Unaffordability Crowd out Elites in Chinese Superstar Cities? J. Hous. Econ. 2019, 45, 101571. [Google Scholar] [CrossRef]
- Devan, J.; Negri, S.; Woetzel, J.R. Meeting the Challenges of China’s Growing Cities; McKinsey Global Institute: New York, NY, USA, 2008. [Google Scholar]
- Wei, H. The Administrative Hierarchy and Growth of Urban Scale in China. Chin. J. Urban Environ. Stud. 2015, 03, 1550001. [Google Scholar] [CrossRef]
- Yin, K.; Wang, R.; An, Q.; Yao, L.; Liang, J. Using Eco-Efficiency as an Indicator for Sustainable Urban Development: A Case Study of Chinese Provincial Capital Cities. Ecol. Indic. 2014, 36, 665–671. [Google Scholar] [CrossRef]
- Loures, L.; Santos, R.; Panagopoulos, T. Urban Parks and Sustainable City Planning–The Case of Portimão, Portugal. Environ. Dev. 2007, 15, 171–180. [Google Scholar]
- Nesbitt, L.; Meitner, M.J.; Girling, C.; Sheppard, S.R.J.; Lu, Y. Who Has Access to Urban Vegetation? A Spatial Analysis of Distributional Green Equity in 10 US Cities. Landsc. Urban Plan. 2019, 181, 51–79. [Google Scholar] [CrossRef]
- Rao, Y.; Zhong, Y.; He, Q.; Dai, J. Assessing the Equity of Accessibility to Urban Green Space: A Study of 254 Cities in China. Int. J. Environ. Res. Public. Health 2022, 19, 4855. [Google Scholar] [CrossRef]
- Rigolon, A.; Browning, M.; Jennings, V. Inequities in the Quality of Urban Park Systems: An Environmental Justice Investigation of Cities in the United States. Landsc. Urban Plan. 2018, 178, 156–169. [Google Scholar] [CrossRef]
- Comber, A.; Brunsdon, C.; Green, E. Using a GIS-Based Network Analysis to Determine Urban Greenspace Accessibility for Different Ethnic and Religious Groups. Landsc. Urban Plan. 2008, 86, 103–114. [Google Scholar] [CrossRef]
- Higgs, G.; Fry, R.; Langford, M. Investigating the Implications of Using Alternative GIS-Based Techniques to Measure Accessibility to Green Space. Environ. Plan. B Plan. Des. 2012, 39, 326–343. [Google Scholar] [CrossRef]
- Kabisch, N.; Strohbach, M.; Haase, D.; Kronenberg, J. Urban Green Space Availability in European Cities. Ecol. Indic. 2016, 70, 586–596. [Google Scholar] [CrossRef]
- Biernacka, M.; Kronenberg, J. Classification of Institutional Barriers Affecting the Availability, Accessibility and Attractiveness of Urban Green Spaces. Urban For. Urban Green. 2018, 36, 22–33. [Google Scholar] [CrossRef]
- Guo, S.; Song, C.; Pei, T.; Liu, Y.; Ma, T.; Du, Y.; Chen, J.; Fan, Z.; Tang, X.; Peng, Y.; et al. Accessibility to Urban Parks for Elderly Residents: Perspectives from Mobile Phone Data. Landsc. Urban Plan. 2019, 191, 103642. [Google Scholar] [CrossRef]
- Wang, P.; Zhou, B.; Han, L.; Mei, R. The Motivation and Factors Influencing Visits to Small Urban Parks in Shanghai, China. Urban For. Urban Green. 2021, 60, 127086. [Google Scholar] [CrossRef]
- Wüstemann, H.; Kalisch, D.; Kolbe, J. Access to Urban Green Space and Environmental Inequalities in Germany. Landsc. Urban Plan. 2017, 164, 124–131. [Google Scholar] [CrossRef]
- McCormack, G.R.; Giles-Corti, B.; Bulsara, M. The Relationship between Destination Proximity, Destination Mix and Physical Activity Behaviors. Prev. Med. 2008, 46, 33–40. [Google Scholar] [CrossRef]
- Standard for Classification of Urban Green Space. Available online: https://www.mohurd.gov.cn/gongkai/zc/wjk/art/2018/art_17339_236545.html (accessed on 24 August 2024).
- Giles-Corti, B.; Broomhall, M.H.; Knuiman, M.; Collins, C.; Douglas, K.; Ng, K.; Lange, A.; Donovan, R.J. Increasing Walking: How Important Is Distance to, Attractiveness, and Size of Public Open Space? Am. J. Prev. Med. 2005, 28, 169–176. [Google Scholar] [CrossRef]
- Abdelfattah, L.; Deponte, D.; Fossa, G. The 15-Minute City: Interpreting the Model to Bring out Urban Resiliencies. Transp. Res. Procedia 2022, 60, 330–337. [Google Scholar] [CrossRef]
- Ma, W.; Wang, N.; Li, Y.; Sun, D. 15-Min Pedestrian Distance Life Circle and Sustainable Community Governance in Chinese Metropolitan Cities: A Diagnosis. Humanit. Soc. Sci. Commun. 2023, 10, 364. [Google Scholar] [CrossRef]
- Weng, M.; Ding, N.; Li, J.; Jin, X.; Xiao, H.; He, Z.; Su, S. The 15-Minute Walkable Neighborhoods: Measurement, Social Inequalities and Implications for Building Healthy Communities in Urban China. J. Transp. Health 2019, 13, 259–273. [Google Scholar] [CrossRef]
- Fan, G.; Xie, X.; Chen, J.; Wan, Z.; Yu, M.; Shi, J. Has China’s Free Trade Zone Policy Expedited Port Production and Development? Mar. Policy 2022, 137, 104951. [Google Scholar] [CrossRef]
- Fuzhou Municipal People’s Government Fuzhou City’s 14th Five-Year Plan for Ecological Civilization Construction (2021–2025). Available online: https://www.fuzhou.gov.cn/zgfzzt/sswgh/fzssswghzswj/202303/P020230313380045030001.pdf (accessed on 20 July 2024).
- Cui, H.; Liu, Z. Spatial-Temporal Pattern and Influencing Factors of the Urban Green Development Efficiency in Jing-Jin-Ji Region of China. Pol. J. Environ. Stud. 2021, 30, 1079–1093. [Google Scholar] [CrossRef]
- Office of the People’s Government of Hebei Province Notice of the General Office of the People’s Government of Hebei Province on Issuing the 14th Five-Year Plan for the Construction of the Beijing-Tianjin-Hebei Ecological Environment Support Zone in Hebei. Available online: https://hbepb.hebei.gov.cn/hbhjt/zwgk/fdzdgknr/guihuazongjie/guihua/101633000446818.html (accessed on 16 August 2024).
- General Office of Guiyang Municipal People’s Government Notice of the General Office of the Municipal People’s Government on Issuing the Implementation Plan for Consolidating and Enhancing the Construction of National Forest Cities in Guiyang (2023–2025). Available online: https://www.guiyang.gov.cn/zwgk/zfxxgks/fdzdgknr/lzyj/gfxwj/szfgfxwj/qfbh/202310/t20231018_82796233.html (accessed on 16 August 2024).
- General Office of Guiyang Municipal People’s Government Notice of the General Office of the Municipal People’s Government on Issuing the Implementation Plan for Promoting the Construction of the Western Land-Sea New Channel in Guiyang City. Available online: https://www.guiyang.gov.cn/zwgk/zwgkzfgb/zwgkzfgb2020/202004/t20200421_56136369.html (accessed on 16 August 2024).
- Lanzhou Municipal People’s Government Lanzhou City’s 14th Five-Year Plan for Forestry, Grassland, and Urban Landscape Development. Available online: https://www.lanzhou.gov.cn/module/download/downfile.jsp?classid=0&filename=2fa714430de24833af4aa5a8c3a6faa3.pdf (accessed on 16 August 2024).
- Tong, H.; Shi, P. City Profile Lanzhou. Cities 2015, 45, 51–59. [Google Scholar] [CrossRef]
- Lu, C.; Pang, M.; Zhang, Y.; Li, H.; Lu, C.; Tang, X.; Cheng, W. Mapping Urban Spatial Structure Based on POI (Point of Interest) Data: A Case Study of the Central City of Lanzhou, China. ISPRS Int. J. Geo-Inf. 2020, 9, 92. [Google Scholar] [CrossRef]
- General Office of Guiyang Municipal People’s Government Guiyang City Center Urban Area Sponge City Construction Plan (2019–2025). Available online: https://www.guiyang.gov.cn/ztzl/rdzt/ghgj/qygh_5888935/202111/t20211115_71669740.html (accessed on 16 August 2014).
- Krings, A.; Schusler, T.M. Equity in Sustainable Development: Community Responses to Environmental Gentrification. Int. J. Soc. Welf. 2020, 29, 321–334. [Google Scholar] [CrossRef]


| Area | City | Province | Administrative Areas (km2) | Park and Green Land Area (ha) | Green Covered Areas as % of Completed Areas (%) | ||
|---|---|---|---|---|---|---|---|
| Total City | City Districts | Built-Up Area | |||||
| North | Shijiazhuang | Hebei | 15,848 | 2240 | 312 | 5003 | 42.85 |
| Taiyuan | Shanxi | 6988 | 1500 | 340 | 4716 | 46.59 | |
| Northeast | Shenyang | Liaoning | 12,860 | 5116 | 563 | 8115 | 40.82 |
| Harbin | Heilongjiang | 53,076 | 10,193 | 446 | 5153 | 34.22 | |
| East | Fuzhou | Fujian | 12,255 | 1756 | 301 | 5273 | 45.40 |
| Jinan | Shandong | 10,244 | 8376 | 716 | 7833 | 40.85 | |
| Nanchang | Jiangxi | 7195 | 2777 | 297 | 3814 | - | |
| Central South | Nanning | Guangxi Zhuang AR | 22,245 | 9947 | 320 | 4640 | 41.14 |
| Southwest | Guiyang | Guizhou | 8043 | 2525 | 369 | 5269 | 41.80 |
| Northwest | Lanzhou | Gansu | 13,192 | 1574 | 235 | 2912 | 40.03 |
| Data Type | Sources | Purpose of Utilization |
|---|---|---|
| Park POI and AOI | AMAP | Spatial location and boundary data for accessibility calculations |
| Housing prices and residential community locations | Lianjia Platform | Real estate pricing and geocoded residential communities |
| Road network data | OpenStreetMap | Network analysis and routing analysis to determine the accessibility indicators |
| Statistical data | Chinese Statistical Yearbook | City-level socioeconomic indicators |
| Indicators | Classification | Score |
|---|---|---|
| P—Proximity, distance to the nearest park, meter | P > 1500 | 1 |
| 1500 ≥ P > 1000 | 2 | |
| 1000 ≥ P > 500 | 3 | |
| 500 ≥ P | 4 | |
| S—Size, size of the nearest park, ha | 1 > S | 1 |
| 5 > S ≥ 1 | 2 | |
| 10 > S ≥ 5 | 3 | |
| S ≥ 10 | 4 | |
| D—Density, number of parks within 15 min walking distance | D = 0 | 1 |
| D = 1 | 2 | |
| 1 > D ≥ 3 | 3 | |
| D > 3 | 4 |
| City | Mean | Median | SD | Skewness | Kurtosis | % of Good Accessibility |
|---|---|---|---|---|---|---|
| Fuzhou | 0.45 | 0.44 | 0.20 | –0.13 | –0.42 | 42.33 |
| Shijiazhuang | 0.44 | 0.50 | 0.23 | –0.10 | –0.72 | 52.51 |
| Guiyang | 0.38 | 0.38 | 0.20 | 0.01 | –0.46 | 39.60 |
| Harbin | 0.37 | 0.37 | 0.21 | 0.26 | –0.48 | 49.78 |
| Taiyuan | 0.36 | 0.37 | 0.22 | 0.19 | –0.85 | 37.49 |
| Nanchang | 0.36 | 0.33 | 0.22 | 0.23 | –0.38 | 26.50 |
| Shenyang | 0.35 | 0.33 | 0.20 | 0.15 | –0.56 | 24.63 |
| Jinan | 0.34 | 0.33 | 0.19 | –0.02 | –0.46 | 20.54 |
| Nanning | 0.30 | 0.37 | 0.20 | 0.30 | –0.30 | 20.65 |
| Lanzhou | 0.29 | 0.25 | 0.22 | 0.57 | –0.47 | 22.45 |
| City | Average Price (CNY/m2) | Disposable Income 2022 (CNY) | Regional GDP | Price-to-Income Ratio (/m2) | Price-to-Income Ratio (/90 m2) |
|---|---|---|---|---|---|
| Shijiazhuang | 12,585.65 | 44,745 | 52,589 | 0.28 | 25.31 |
| Taiyuan | 9132.43 | 43,694 | 90,968 | 0.21 | 18.81 |
| Shenyang | 9013.03 | 44,003 | 77,777 | 0.20 | 18.43 |
| Harbin | 7888.44 | 43,981 | 55,175 | 0.18 | 16.14 |
| Fuzhou | 26,312.95 | 53,817 | 120,879 | 0.49 | 44.00 |
| Jinan | 16,358.4 | 59,459 | 106,469 | 0.28 | 24.76 |
| Nanchang | 11,185.57 | 52,622 | 100,415 | 0.21 | 19.13 |
| Nanning | 11,335.73 | 42,636 | 61,738 | 0.27 | 23.93 |
| Guiyang | 8490.99 | 46,242 | 81,995 | 0.18 | 16.53 |
| Lanzhou | 12,142.7 | 45,277 | 75,217 | 0.27 | 24.14 |
Disclaimer/Publisher’s Note: The statements, opinions and data contained in all publications are solely those of the individual author(s) and contributor(s) and not of MDPI and/or the editor(s). MDPI and/or the editor(s) disclaim responsibility for any injury to people or property resulting from any ideas, methods, instructions or products referred to in the content. |
© 2025 by the authors. Licensee MDPI, Basel, Switzerland. This article is an open access article distributed under the terms and conditions of the Creative Commons Attribution (CC BY) license (https://creativecommons.org/licenses/by/4.0/).
Share and Cite
Liu, M.; Terada, T. Beyond a Single Story: The Complex and Varied Patterns of Park Accessibility Across China’s Emerging Cities. Land 2025, 14, 1552. https://doi.org/10.3390/land14081552
Liu M, Terada T. Beyond a Single Story: The Complex and Varied Patterns of Park Accessibility Across China’s Emerging Cities. Land. 2025; 14(8):1552. https://doi.org/10.3390/land14081552
Chicago/Turabian StyleLiu, Mengqi, and Toru Terada. 2025. "Beyond a Single Story: The Complex and Varied Patterns of Park Accessibility Across China’s Emerging Cities" Land 14, no. 8: 1552. https://doi.org/10.3390/land14081552
APA StyleLiu, M., & Terada, T. (2025). Beyond a Single Story: The Complex and Varied Patterns of Park Accessibility Across China’s Emerging Cities. Land, 14(8), 1552. https://doi.org/10.3390/land14081552