Article

Multimodal Data-Driven Hourly Dynamic Assessment of Walkability on Urban Streets and Exploration of Regulatory Mechanisms for Diurnal Changes: A Case Study of Wuhan City

School of Geography and Information Engineering, China University of Geosciences, Wuhan 430074, China
*
Author to whom correspondence should be addressed.
Land 2025, 14(8), 1551; https://doi.org/10.3390/land14081551
Submission received: 6 July 2025 / Revised: 19 July 2025 / Accepted: 26 July 2025 / Published: 28 July 2025

Abstract

The use of multimodal data can effectively compensate for the lack of temporal resolution in streetscape imagery-based studies and achieve hourly refinement in the study of street walkability dynamics. Exploring the 24 h dynamic pattern of urban street walkability and its diurnal variation characteristics is a crucial step in understanding and responding to the accelerated urban metabolism. Aiming at the shortcomings of existing studies, which are mostly limited to static assessment or only at coarse time scales, this study integrates multimodal data such as streetscape images, remote sensing images of nighttime lights, and text-described crowd activity information and introduces a novel approach to enhance the simulation of pedestrian perception through a visual–textual multimodal deep learning model. A baseline model for dynamic assessment of walkability with street as a spatial unit and hour as a time granularity is generated. In order to deeply explore the dynamic regulation mechanism of street walkability under the influence of diurnal shift, the 24 h dynamic score of walkability is calculated, and the quantification system of walkability diurnal change characteristics is further proposed. The results of spatio-temporal cluster analysis and quantitative calculations show that the intensity of economic activities and pedestrian experience significantly shape the diurnal pattern of walkability, e.g., urban high-energy areas (e.g., along the riverside) show unique nocturnal activity characteristics and abnormal recovery speeds during the dawn transition. This study fills the gap in the study of hourly street dynamics at the micro-scale, and its multimodal assessment framework and dynamic quantitative index system provide important references for future urban spatial dynamics planning.

1. Introduction

Understanding the dynamic 24 h pattern of change in urban streets is essential to creating more livable and sustainable urban environments. Cities are not static entities but dynamically changing systems whose form and function evolve over time. At the heart of this evolution lies the ongoing, dynamic interaction between the physical environment and the human activities that occur within it [1]. Street space is transforming from a mere transportation corridor to an important place for daily pedestrian experiences and social activities, serving as a direct bridge between residents and the urban environment [2]. In the context of accelerating urban operation rhythm, in-depth understanding of the dynamic change law of street space and exploring the evolution characteristics of walkability in circadian rhythm are of urgent practical significance for optimizing urban design and improving residents’ living quality.
The rapid development of computer vision technology and the wide coverage of streetscape imagery have led to well-studied street walkability assessments [3,4,5]. However, most of these studies focus on the static assessment at a specific point in time, ignoring its continuous change characteristics over time. Although some studies have begun to focus on the dynamic analysis of urban fabric, such as the use of multi-temporal remote sensing imagery to detect land use status and green coverage over decades [6], and the analysis of urban road traffic volume changes over a week based on geographic big data [7]. Studies addressing the dynamics of street walkability, especially exploring it at fine-grained time scales, are still thin. Only a few studies have explored walkability under coarse time granularity in terms of years and seasons [8,9].
Due to the limitation of the temporal resolution of the street view image data, it cannot express the time change continuously, so the dynamic analysis of walkability in a short period of time cannot be realized by relying only on a single street view image. This is also the reason why most of the past studies are only at static time points. In contrast, the emergence of artificial intelligence technology and multimodal modeling brings new opportunities and solutions [10]. Human-centered visual, textual, audio, and other multimodal data enable machine learning models to simulate more realistic pedestrian feelings [11] and compensate for the missing time dimension information of street view image data. Integrating urban big data with AI-driven methods can analyze and quantify the dynamic interactions between the physical environment and humans and the environment across time scales [12].
This study aims to evaluate the walkability of streets by simulating the real walking experience of pedestrians in street environments through a machine learning model supported by multimodal data and explores the dynamic change patterns of walkability of urban streets during the alternation of day and night. By analyzing the 24 h dynamic change pattern of walkability, we propose a quantitative system for characterizing diurnal variation in walkability with core indicators: the Night Attenuation Index, Dawn Recovery Rate, and Entropy of Rhythmic Fluctuations. This system breaks away from the traditional walking system, which has been used in the past to evaluate the walkability of streets. It breaks through the static framework of the traditional street walkability research and is committed to revealing the dynamic regulation mechanism of the street system under the influence of day–night transition.
Our study has the following contributions:
(1) We propose a new dynamic assessment method of street walkability by integrating multimodal data and machine learning techniques and generate a baseline model of temporal changes in urban walkability with hourly time granularity and street as spatial scale. This method proposed in this study has important transferability and fills the gap in the study of urban street dynamics.
(2) Based on the baseline model of temporal change of walkability, a framework for the assessment of circadian change characteristics of walkability is constructed, which powerfully explores the dynamic adjustment mechanism of street walkability under the influence of diurnal transition.
(3) Through the spatio-temporal clustering algorithm and quantitative analysis, we empirically reveal the significant influence of economic activities and pedestrian experience on the dynamic change of street walkability. For example, in the case of Wuhan, highly developed areas (e.g., urban centers such as riverine areas) show strong resistance to nighttime disturbance and abnormal dawn period change characteristics. Validated by the results, this research system provides an effective conceptual tool and metrics for understanding the dynamics of urban micro-level studies, which are important references in different urban landscapes as well as social contexts.

2. Literature Review

2.1. Research Process for Street Walkability

Street walkability, often defined as the degree of walking friendliness of an area, also known as pedestrian friendliness [13,14], is an important indicator of how conducive the built environment is to walking [15]. For street walkability, initially scholars approached it from the perspective of the static built environment, which was thought to refer to the ease of walking in an area or the ease of reaching a destination on foot [16]. And they attempted to explore the physical characteristics that influence the pedestrian walking experience [17], which affect the distance walked to a destination, such as residential density, street connectivity, and land use mix [18]. In contrast, in recent years, there has been an emerging awareness of the influence of micro-scale factors on street walkability, based on the fact that street walkability, as reflected in objective environmental studies, is somewhat different from pedestrians’ subjective perceptions [19].
While most of the early studies on human perception of urban environments were based on field data collection in the form of face-to-face interviews and questionnaires [20], which were limited to smaller areas of interest, streetscape image coverage services have made it possible to describe urban streets and visualize the perceived walkability of streets on a large scale [21,22]. The application of deep learning techniques has enabled the processing of street view images to reach pixel-level accuracy. Zhang et al. measured human perceptions of large urban areas based on the Place Pulse 2.0 crowdsourced urban street perception scoring project conducted by the Media Lab at the Massachusetts Institute of Technology (MIT) in the US [23]. Yao et al. used a human–computer adversarial strategy that realizes large-scale batch evaluation of urban street perception [24]. These studies have solved the challenge of large-scale quantification of street environmental factors at the micro-scale and provided help to study the perception and relevance of human and city. However, these studies are still essentially static snapshot analyses focusing on environmental perception at a specific point in time, and thus, new research frameworks are needed to fill the gap in analyzing the dynamically changing characteristics of street walkability.

2.2. From Macro to Micro, Dynamic Assessment of Urban Systems

A city is a complex system resulting from the interaction between socioeconomic and environmental factors [25,26,27]. In the past decades, China has experienced rapid urbanization, leading to the emergence of many large cities (e.g., Beijing, Shanghai, Shenzhen, etc.) [28]. Also, many studies have gradually started to pay attention to the dynamics of cities. Specialized, environmental problems brought by urbanization, such as carbon emissions [29] and the heat island effect [30], are important targets for the detection of long-term changes in urban environments. Hou et al. used multi-source remote sensing data to determine the influencing factors of changes in the heat island effect [31], and Chakraborty and Lee assessed its spatial and temporal variability [32]. Recently, more scholars focused on the spatiotemporal pattern of human-centered cities. For instance, Wang et al. conducted a multi-scale geographically weighted regression analysis of the spatiotemporal pattern of urban vitality in Beijing based on microblogging check-in data [33]. Ouyang et al. further explored the stability of urban vitality on the basis of the time series of human activities [34]. Meanwhile, the concept of a 15 min city model has been proposed and explored in depth [35], and these studies provide important research ideas for the study of the dynamics of urban systems from the perspective of residents [36,37]. The interconnections between pedestrians and the urban environment were explored under the urban time perspective [38,39]. At present, the advancement of science and techniques has led to the gradual refinement of researchers’ choice of time series. The study of urban dynamics is shifting from coarse time granularity to fine time granularity and from macro scale to micro scale.

2.3. Challenges in the Study of Street Diurnal Dynamics

Conducting street-level studies at fine-grained time scales, we must consider the impact of circadian rhythms on their dynamism patterns. Despite the growing number of studies on the spatio-temporal characterization of cities, there is still a scarcity of studies that assess the dynamics of cities throughout the day and 24 h, and especially scarce for the assessment of linear public areas at the micro-scale, such as streets [40]. For the coverage of urban nighttime hours is an important factor that must be considered. Part of the existing nighttime urban research is aimed at understanding the global spatial and temporal characteristics by applying satellite remote sensing data for the acquisition of a large-scale nighttime lighting index [41,42]. Some scholars have also revealed the role of nighttime human activities on urban vitality based on the dynamic distribution of urban population [43]. However, the lack of a complete nighttime assessment system that integrates the physical environment and anthropogenic elements and the lack of continuity in the assessment system of street walkability have led to incompleteness as well as significant breaks in most of the current studies.

3. Study Area

Wuhan, the capital city of Hubei Province in China, is renowned for its strategic location along the Yangtze River and has been referred to as the “River City.” The city serves as the political, economic, and cultural epicenter of the middle reaches of the Yangtze River, as well as one of China’s most significant transportation hubs (see Figure 1). The city has demonstrated a notable commitment to enhancing pedestrian friendliness, implementing a series of policies aimed at encouraging urban residents to utilize foot travel. First, the government has incorporated walking into urban transportation and actively promotes walking and non-motorized transportation as green travel modes. Secondly, the city has undertaken significant renovation and upgrading initiatives for pedestrian thoroughfares, including Jiefang Road Pedestrian Street, Jianghan Road Pedestrian Street, Tube Alley Pedestrian Street, etc. These pedestrian streets have transformed into vibrant hubs that drive the cultural, commercial, and tourism activities of the city. Furthermore, the city has constructed numerous walking roads and landscape trails, such as the East Lake Greenway, the South Lake Trail, and the Yellow Crane Tower Trail, to promote pedestrian activity among citizens and tourists alike. In light of these developments, the central city of Wuhan was selected as the primary study area, encompassing seven administrative districts: Hanyang, Qiaokou, Jianghan, Jiangan, Wuchang, Qingshan, and Hongshan.

4. Materials and Methods

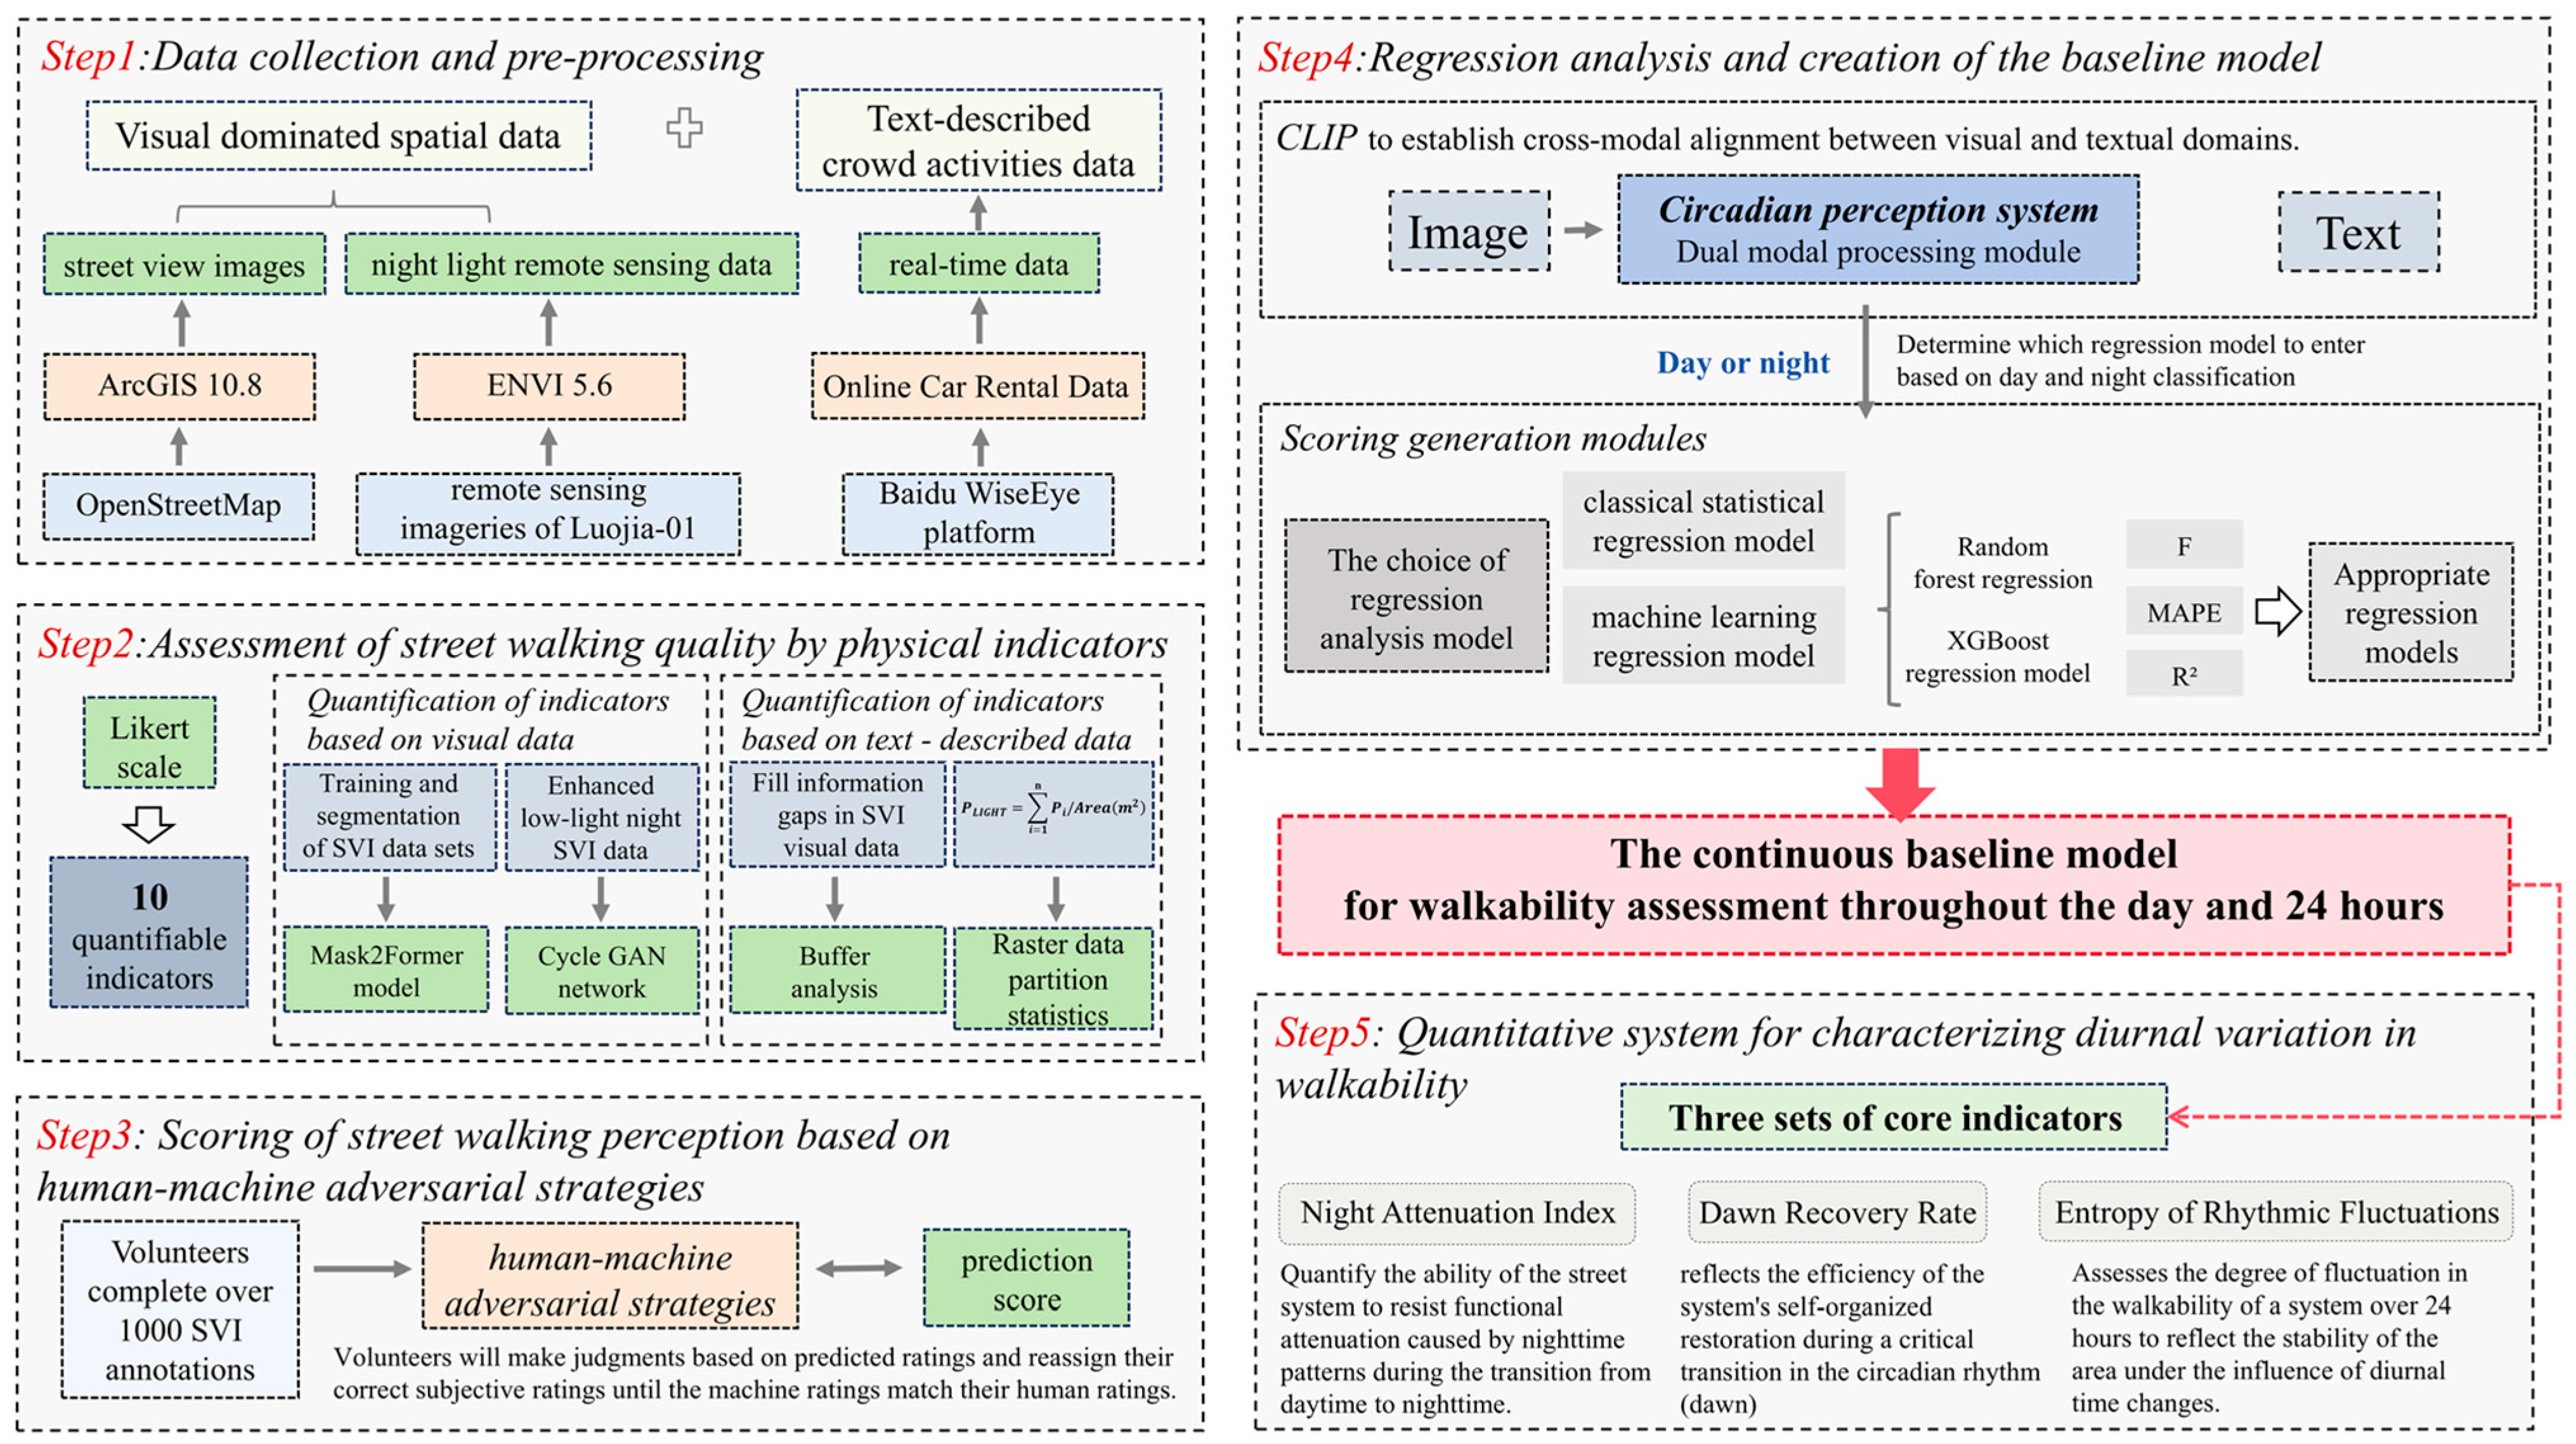
The research framework is shown in Figure 2. This study will be carried out in the following stages: first, multimodal data such as visual and textual data are collected and preprocessed to construct a multimodal dataset covering day and night scenes. Subsequently, street walkability is evaluated from both physical and perception perspectives. In this process we introduce the concepts of street walking quality and street walking perception. Street walking quality is an objective description of the walking environment, which is divided into a variety of physical quantitative metrics based on many micro-factors in the walking environment. Street walking perception is the subjective experience that pedestrians have when they walk in a specific street environment, and it is measured at the perception level by using artificial scoring with human–computer countermeasures to measure the walkability of the street. This combination of objective and subjective, physical and perceptual aspects of walkability has been shown to be effective in the classic studies of Zhang et al. and Yao et al. [23,24].
In the next section, we are committed to establishing the relationship between physical quantitative metrics and walkability perception scores, i.e., the relationship between street walking quality and street walking perception, through multimodal data fusion techniques and machine learning models. The specific methods are to develop appropriate performance measures to select appropriate regression analysis models to construct the quantitative relationship between the two, to realize the batch generation of diurnal scene recognition and walkability scores by training CLIP models, and to construct a baseline model for walkability evaluation. Finally, based on the three indicators we proposed to characterize the diurnal variation of street walkability, we combined the baseline model of walkability evaluation to calculate and evaluate the walkability of roads in the study area in a fine-grained quantitative manner.

4.1. Data Collection and Pre-Processing

4.1.1. Visual-Dominated Spatial Data

In the part of visual data collection, we start from the acquisition and processing of street view images and night light remote sensing data, respectively, in order to realize the combination of the micro scale and the overall macro scale of the city street from the pedestrian’s perspective.
The road network dataset used in this study was obtained from OpenStreetMap. We performed topology processing and manual calibration to obtain simplified road network data by using ArcGIS 10.8. The simplified street network data was then used as a data source for collecting sample points and calculating street accessibility. The establishment of road sample points was undertaken, and the latitude and longitude coordinates of all sample points were acquired in 100-m step intervals. Baidu Street View (BSV) was then obtained for all sample points using crawler technology. The acquisition of four street maps (0°, 90°, 180°, and 270°) was conducted using 90-degree intervals horizontally for each sample point of the image, resulting in a total of 170,601 street maps. Furthermore, the street view images were meticulously annotated and systematically classified based on their distinctive temporal characteristics. Street view images have played a crucial role in many urban street walkability studies [44,45,46].
As mentioned above, in terms of time, current research on nighttime walkability is at a relatively blank stage, and in order to fully analyze dynamic walkability over multiple time periods, analyses based on nighttime hours need to be more meaningful and accurate. Nighttime light remote sensing is an optical remote sensing technique that can detect faint light at night and obtain information that cannot be obtained by daytime remote sensing. Since artificial light sources in urban areas are the main source of stable bright light at night, nighttime light remote sensing images have been shown to reflect the differences in human activities at night more intuitively [47]. In view of the application of nighttime light remote sensing data for the analysis of human economic activities at night, we acquired several remote sensing imageries of Luojia-01 covering urban areas in Wuhan, which is the world’s first professional nighttime light remote sensing satellite with a spatial resolution of up to 130 m and can clearly reflect the nighttime conditions of streets in various urban areas.
The implementation of radiometric calibration, atmospheric correction, and geometric correction on night-light remote sensing images is performed using ENVI 5.6, with the geometric correction being of particular importance in obtaining the correct corresponding light index of the streets. The radiance brightness correction formula is as follows:
L = D N 3 / 2 · 10 10
In the context of radiant luminance, the term L denotes the radiant luminance value subsequent to absolute radiation correction. The unit of measurement for L is W / m 2 · s r · μ m . The gray value of the image is represented by D N . Subsequently, a series of operations, including projection transformations, resampling, and normalization, are performed to ensure data consistency with other geographic data sources.
Remote sensing image data of nighttime lighting is primarily used to capture the overall spatial and temporal patterns of nighttime human activities in the study area. However, this is limited by the spatial resolution of remote sensing images, which are unable to finely capture street-scale micro conditions, such as sidewalk conditions. However, in the multimodal dataset, it serves as one of the key input elements for constructing the multimodal fusion model, rather than the sole or direct proxy variable for walkability. Therefore, in the application process, we fused it with micro-visual data street view images as well as many real-time data in a multi-source fusion, with the aim of realizing the effective assessment of walkability more comprehensively through data complementation.

4.1.2. Text-Described Crowd Activities Data

In this study, the text-described data include flow of people, traffic volume, and a range of real-time data related to pedestrian activity. The real-time flow of people in Wuhan city within 48 h was obtained from Baidu WiseEye platform. The traffic volume in the same time with pedestrian flow was computed based on online car rental data. Vehicles have a non-negligible role to play in the walking experience of pedestrians, and the resulting real-time traffic flow data will serve as an important base data for calculating the Vehicle Interference Index. Additionally, information such as the number of openings of facilities at different points of interest (POIs) during the corresponding time period and the probability of rainfall are also included for supplementation to make up for the dynamic attribute vacancies that exist in visual data such as SVI. Combined with the other modal data mentioned above, the daytime period training dataset (8:00–20:00) and the nighttime period training dataset (20:00–8:00) are constructed.

4.2. Assessment of Street Walking Quality by Physical Indicators

For the assessment of street walking quality, firstly, we considered the variability in street walking quality between daytime (8:00–20:00) and nighttime (20:00–8:00). For example, for nighttime streets, the light level affects the walking quality more significantly, whereas the walking quality of daytime streets is seldom affected by such disturbances, making it difficult to rely on simple qualitative analyses of dynamic walking quality. In this study, to achieve the validity of the dynamic analysis of street walking quality, we propose the following principles to evaluate the street walking quality. Firstly, different indicators should be selected for quantification in different time zones. The similarity between daytime and nighttime indicators should not be simply adopted as the same quantification scheme. Data used in quantification of the quality of streets with different time zones should be in real time.

4.2.1. Selection of Physical Indicators

For quantitative indicators of street walking quality, existing studies have identified key built environment characteristics [48] and urban human characteristics [49,50]. In order to select evaluation indicators that meet the actual needs of pedestrians, this study initially constructed a pool of indicators based on a large number of existing studies, including such indicators as street connectivity, land type, street density, population density, and so on. A Likert-scale questionnaire for pedestrians was designed and implemented [51]. In this questionnaire, we screened more than 20 core indicators affecting street walking quality and designed a five-point rating scale ranging from “very important” (with a score of 5/5) to “very unimportant” (with a score of 1/5). The questionnaires were distributed to secondary school students, graduate students, office workers, and some retirees to ensure the diversity and comprehensive coverage of the sample. Among the hundreds of questionnaires collected, 10 core indicators were identified to quantify and assess street walking quality by setting an average importance score greater than or equal to 3.5 as the main basis (Table 1).
Among them, we use the average foot traffic of the whole time period (12 h) as the training set data for the crowd density of that time period. Meanwhile, based on the differentiation of day and night points of interest, the participating counting units of POI facilities in the daytime include gourmet food and beverage, shopping facilities, science, education and culture, governmental organizations, medical services, and public facilities, and the participating counting units in the nighttime are gourmet food and beverage, shopping facilities, medical services, and public facilities. In addition, it is especially emphasized that the lighting index is only a nighttime time period consideration.

4.2.2. Quantification of Indicators Based on Visual Data

Semantic segmentation is an important way of obtaining image pixel features, and the SVI dataset is segmented to obtain the factors required for quantitative metrics. We used the state-of-the-art Mask2Former model [52] with ViT-Adapter-L as the backbone network. The model is based on the masked-attention mechanism, which is capable of accurately accomplishing image segmentation in many different scenarios by extracting high-scale multi-resolution features. The model shows more excellent segmentation accuracy compared to other traditional semantic segmentation models when performing segmentation work on images with lower illumination and more small objects. The CitySpaces dataset provides a comprehensive analysis of the pixel-level annotation of road, tree, and pedestrian street elements is mainly used for urban streetscape analysis, so the model is first used for pre-training on the CitySpaces dataset and then for training and segmentation work on our SVI dataset.
For nighttime images, which have low illumination and poor light, it is difficult to reach extremely high accuracy in image segmentation quality. Therefore, we adopt the low-light image enhancement module based on the CycleGAN network [53], which utilizes the ResNet residual network for coding through the cavity convolution method to realize the transformation of low-light images to high light. The advantage of CycleGAN recurrent generative adversarial network, which enables the discriminator and generator to play with each other during the training process. Then the two mirror GANs will be used for the training and segmentation work. The cyclic consistency constraints of the two mirror GANs make the quality of the generated image closer to the original image, enhance the low-light nighttime SVI data, and improve the image segmentation accuracy. Compared with the classical algorithms such as Retinex and dark channel a priori theory, the generated images achieve better levels in Peak Signal-to-Noise Ratio (PSNR), Structural Similarity (SSIM), and Natural Image Quality Evaluator (NIQE). For example, on the LOL dataset, its PSNR and SSIM are 24.62 and 0.8628, which are much higher than those of the traditional representative method, Retinex (PSNR is 18.66 and SSIM is 0.7094). What is more, the cycleGAN network is an unsupervised learning, and its framework characteristics make it relatively flexible to the data requirements, which is more efficient and robust in dealing with nighttime street scene data. In addition, we use the LOL-1 dataset and ExDark dataset to train it so that it can accurately accomplish illumination nighttime image enhancement. Finally, the metrics are calculated based on the number of pixels obtained after the segmentation work is completed (Table 2).

4.2.3. Quantification of Indicators Based on Text-Described Data

A walkable living area is a zone within a certain area where residents can reach various living services on foot. A radius of 15 min walking distance is a standard delineation index within the range of human activity accessibility [54]. Based on the optimal walking time for facility accessibility, POI data, as well as public transportation data, we constructed a buffer zone with a radius of 300 m centered on the sampling point. By analyzing the buffer zone using ArcGIS 10.8 software, the calculation was completed according to the following formula to obtain the spatial indicators based on the real information to fill the information gaps in the SVI visual data (Table 3):
Finally, using the brightness threshold and spatial analysis methods, the nighttime light remote sensing raster data are partitioned and counted and then spatially connected with the sampling points to calculate the nighttime light index:
P L I G H T = i = 1 n P i / A r e a m 2
where P i is the brightness value of each raster in the buffer zone, and A r e a is the area of the buffer zone.

4.3. Scoring of Street Walking Perception Based on Human–Machine Adversarial Strategies

Based on the evaluation strategy of human–computer confrontation, this study constructs a quantitative evaluation system for street walking perception. The system uses deep learning algorithms to simulate pedestrians’ perceptual judgment of the street, and measures street walking perception through subjective perception scores, i.e., obtains the perceptual score of walkability. It breaks through the limitations of traditional qualitative analysis methods and realizes a wide range of refined metrics of street walking perception dimensions.
It is well known that the Place Pulse 2.0 dataset, which provides pairwise training results for six moods containing many cities, is one of the commonly used datasets for training perceptual walkability scores. But its main scenarios are for Western cities and it does not have a better classification of time periods. Therefore, we recruited 30 volunteers with study experience in geographic information science and urban design subjects. According to the statistics, about one-third of people have the habit of walking between 20:00 and 8:00. Based on their walking time preference, the volunteers will be divided into two parts to complete the task of labeling the SVI-D training dataset of 8:00–20:00 and the SVI-N training dataset of 20:00–8:00 so as to build a more accurate SVI scoring dataset that covers different time periods and avoids the influence of regional errors. The task is to construct more accurate SVI scoring datasets covering different time periods and avoiding the influence of regional errors. Before the experiment, we conducted a standardized training session for all volunteers and restricted their rating range to 0–100. This protocol was designed to ensure comparability between daytime and nighttime scores, even when evaluation criteria naturally differed across the two periods.
During the training process, five experts in the field were invited to standardize the scoring rules in detail to ensure inter-rater reliability and consistency of the scoring data. Volunteers made comprehensive scores based on many perceptions, such as comfort, safety, and convenience of the environment. This design greatly improves the refinement of the scoring labeling. Then, based on the typical street scene cases (covering a wide range of possible environments, 50 copies) rated by the expert consensus, volunteers were asked to independently label and compare the differences and to reach a consensus on the rating criteria through group discussion. The labeling process adopted a double-blind design: the same image was labeled by 2 groups, with 3 volunteers in each group independently scoring the image; differences within 10 points would be averaged, while differences >10 points would be re-arbitrated. Through this method, the scoring difference percentage can be controlled within 0.15 by the two groups’ scoring, which ensures that the reliability of scoring among volunteers reaches a more excellent degree.
The “human–machine confrontation” design provides a conditioned environment where machine learning assists human annotation in global attribute categorization [24]. The “human–machine confrontation” phase adopts an incremental optimization strategy: the initial model is trained based on the first 1000 annotations, and volunteers review the disputed samples (original double-scoring discrepancy >10 points) based on the model predictions until a scoring consensus is reached after iteration. The final training dataset was verified by expert sampling, and the human–machine scoring consistency ratio of 200 random samples (predicted scores and manually labeled scores) within the range of 0.9 to 1.1 passed the test.
The model has the following advantages: first, it can obtain the machine score more accurately through the random forest regression model; second, when the human correction of the machine score reaches the satisfaction level, the predicted score provided by the machine will provide the volunteers with score hints, which greatly shortens the time of personnel annotation; third, to a certain extent, the model after the completion of the training can be used as one of the references for the results of the prediction model, and it can be used as one of the references to the SVI data for large-scale scoring reasonableness. Data to determine the reasonableness of scoring on a large scale.

4.4. Regression Analysis and Creation of the Baseline Model

4.4.1. Selection of Regression Analysis Models

In order to further explore the relationship between street walking perception and street walking quality, this study conducted regression analyses from the SVI-D dataset and the SVI-N dataset and their corresponding indicator scores, respectively. Due to the large number of indicators and the correlation of some of them, in order to avoid overfitting, multicollinearity, and other problems, we finally found a more suitable and widely used regression model, including two kinds of classical statistical regression model and machine learning regression model.
For statistical regression models, multicollinearity refers to the existence of exact or high correlation between explanatory variables in a linear regression model due to the existence of exact or high correlation [55]. The ridge regression is one of the classical models widely used to solve the problem of multicollinearity. Additionally, stepwise regression is a regression method based on the explanatory of the variables to carry out feature extraction, and the process of introducing the independent variables into the model step by step The independent variables are judged and eliminated by testing whether the model has changed significantly, which fully solves the multicollinearity problem. In machine learning regression models, Random Forest regression and XGBoost regression are both algorithms based on decision trees, but they are constructed and optimized in different ways. Random Forest increases model uncertainty by randomly selecting features and randomly dividing the dataset, thus reducing the overfitting problem. XGBoost, on the other hand, gradually optimizes the loss function through the gradient descent method to obtain the best decision tree model. Both have accuracy in handling multidimensional data, as well as better robustness to missing values and outliers. In the evaluation of the above regression analysis models, we will mainly focus on their F-value (statistical regression model), mean absolute percentage error (MAPE), and R2 in order to select a more compatible regression model.
F = S S R / k S S E / n k 1
The F-value is a statistic used to test the overall significance of a regression model, where SSR is the sum of squared regressions, SSE is the sum of squared errors, k is the number of independent variables, and n is the sample size.
M A E = 1 n i = 1 n y i y ^ i
M A P E = 100 % n i = 1 n y i y ^ i y i
where y i is the actual value and y ^ i is the model predicted value. The closer the MAE is to 0 and the closer the MAPE is to 0% indicates that the constructed model has less error. The closer R2 is to 1 indicates that the variables of the model explain the dependent variable better and this model fits the data better.

4.4.2. CLIP-Based Multi-Temporal Walking Score Generation Model

The proposed framework employs Contrastive Language-Image Pretraining (CLIP) [56] to establish cross-modal alignment between visual and textual domains. As a dual-encoder architecture comprising visual and textual pathways, CLIP projects images and their corresponding captions into a shared embedding space through contrastive learning. Specifically, the visual encoder (typically Vision Transformer or CNN based) generates image embeddings, while the textual encoder (Transformer based) produces text embeddings. The model optimizes cosine similarity between matched image–text pairs against mismatched combinations using InfoNCE loss. This pre-training paradigm enables effective zero-shot transfer capabilities through modality alignment.
In this study, we construct a circadian perception system based on the CLIP framework, and its core architecture contains a bimodal processing module. The time determination module adopts the visual–text alignment mechanism of CLIP for day/night classification. Specifically, the preprocessed street scene image is input into the Image Encoder to generate image feature vectors. At the same time, the text descriptions of daytime/night are input into the Text Encoder to construct semantic anchors. Time discrimination is achieved by calculating the cosine similarity between the image features and the two types of text anchors. By calculating the cosine similarity between the image features and the two types of text anchors, we can achieve the time period discrimination. The SVI-D/N dataset is used to fine-tune the model, and its small-sample learning feature enables the system to achieve high time slot classification accuracy with limited labeled data.
After passing through the time determination module, the generated image features will be fed into different score generation modules according to the determined period (day/night). The multimodal processing structure of the basic CLIP model allows us to input textual data corresponding to real-time activity descriptions while obtaining image features. By aligning the image with the text, the image can be given information about hourly activity changes equivalent to the textual description. For each period (day/night), we trained separate regression models. These regression models take as input the image feature vectors extracted by CLIP and predict numerical walkability scores. They were trained with quantitative metrics corresponding to each image, as well as walkability perception scores provided by volunteers.
The walkability scoring model composed of the above multiple modules has the following functions: (1) obtaining the walkability scores within the time period determined by the model through the input images; (2) realizing the prediction of the walkability scores across the time periods by manually selecting the time periods based on the text feature extraction function of the time processing module. With this model, we can realize the generation of a baseline model for 24 h continuous walkability assessment.

4.5. Quantitative System for Characterizing Diurnal Variation in Walkability

To better understand the hourly change pattern of urban street walkability in a 24 h cycle and to reveal the nature of the dynamic change of walkability due to the circadian shift, in this study, we constructed a system for evaluating the circadian characteristics of walkability, aiming to systematically quantify the dynamic changes in walkability driven by circadian rhythms from a micro street unit. Based on the hourly walkability baseline model, the system proposes three sets of core indicators to deconstruct and quantify the key features of walkability dynamics during circadian hours, with the help of the regulation mechanism of “resistance, recovery, and stabilization” in the study of urban dynamics.
The Night Attenuation Index (NAI) quantifies the ability of the street system to resist functional attenuation caused by nighttime patterns during the transition from daytime to nighttime. Larger values indicate more attenuation of walkability, indicating a stronger exposure to nighttime impacts. Smaller values indicate a greater ability of the street to maintain walkability levels at night, effectively buffering the pressure on walkability caused by the circadian shift. Where is the average score of S d a y a v g daytime hours and the lowest score of S n i g h t m i n nighttime hours.
N A I = S d a y a v g S n i g h t m i n S d a y a v g
The Dawn Recovery Rate (DRR) reflects the efficiency of the system’s self-organized restoration during a critical transition in the circadian rhythm (dawn). An approximately high value indicates that the street walkability has a high capacity to recover from dynamic changes in the process. Among them, we positioned the dawn recovery period as the 4:00–8:00 time period, S d a w n s t a r t and S d a w n e n d as the period start score and end score, respectively, and S b a s e l i n e as the daytime baseline score.
D R R = S d a w n e n d S d a w n s t a r t Δ t × 1 S b a s e l i n e
The Entropy of Rhythmic Fluctuations (EORF) assesses the degree of fluctuation in the walkability of a system over 24 h to reflect the stability of the area under the influence of diurnal time changes, with higher values indicating greater fluctuation and lower values indicating greater stability.
E O R F = i = 1 n p i l n p i l n n
where p i is the proportion of the ratings of the i-th time period to the total ratings, calculated by the formula:
p i = S i k = 1 n S k
where S i is the walking score for the i-th period, and n is the total number of periods the day is divided into.

5. Results and Discussion

5.1. Description and Analysis of Walking Quality

5.1.1. Pixel-Level Quantification Results for Visual Data

The pixel extraction of SVI data through a semantic segmentation technique was used to filter and identify six element categories involved in the calculation of pixel-level quantitative metrics. Based on the semantic similarity, we merged terrain and vegetation into the category of green vegetation. In addition to counting the pixel share of each element category in the panorama, the relative sidewalk width category was obtained by using the relative share calculation method for the ROAD element and the SIDEWALK element, as shown in Table 4. For each spatial sampling point, the average data after semantic segmentation of four street view images acquired at 90° azimuthal intervals were taken for calculation. The pixel-level data of all sampling points in the study area were used for statistics, where Max represents the maximum value of the element’s share in all sampling points in the area, Min is the minimum value, mean is the arithmetic mean of the element’s share in all sampling points, and Std Dev (standard deviation) characterizes the spatial dispersion of the element’s share.

5.1.2. Correlation Analysis Between Walking Quality Factors

The generation of multicollinearity between variables has a great impact on the parameters of the regression model. Obviously, we have made a detailed delineation of walking quality factors, which makes our regression model construction more accurate, but too fine a delineation inevitably leads to a certain correlation between some indicators. In the construction of the prediction model, we need to suppress or avoid the occurrence of multicollinearity, so it is necessary to carry out a correlation analysis on the walking quality factor.
It is a reasonable and necessary task to test the correlation of the analyzed variables, and in order to further explore the correlation between the walking quality factors, we used Pearson correlation analysis. The Pearson correlation coefficient is a strong indicator of the linear relationship between variables [57]. Results of the Pearson correlation analysis between the walk quality factors are shown in Table 5.
Among the quality factors during the daytime hours, we have to admit that there is a medium-strength correlation between sky openness and green visibility, with a Pearson correlation coefficient of 0.544, and a more significant correlation between road width and fencing, while rainfall and the number of bus stops maintain good independence from the other variables. In addition, the POI index, traffic flow, and population density present weak correlations within expectations. The Pearson correlation index ≥ 0.8 is one of the main judgments of multicollinearity. For this reason, despite the existence of correlations among some of the qualitative factors, their impact on the model construction is still within manageable limits. Fortunately, the correlation analysis further proves that the first-level indicators control the quality factors. Specifically, the sky openness and green visibility are important embodiments of the comfort of the street. The road width and fences are specific construction of the road environment. And economic activities are the important factors affecting the vitality of the city. The POI index is an important indicator of the economic activities measured, and its correlation with the traffic flow and the population density is the process of the city’s economic development. The correlation between traffic flow and population density is the inevitable result of the process of urban economic development.
In the nighttime, the addition of the lighting index increases the complexity of the correlation relationship of the walking quality factor. The lighting index has a more significant level of significance with the POI index and vehicle interference. Based on the visualization results, there is a large overlap between areas with high lighting index, complex POI facilities, and a high number of bus stops, which is especially obvious in the high-development urban areas on both sides of the Yangtze River, proving to be a certain extent that people’s judgment of safety when walking at night is somehow related to social activities. It is hypothesized that the level of urban development is higher in areas with more POI facilities. It is also clear from the luminous remote sensing images that the light index tends to be higher in this type of area.

5.2. Geo-Visualization of Walking Perception Scores

Based on the human–machine adversarial model, the volunteers constructed a dataset of daytime and nighttime walkability scores. Using latitude and longitude coordinates, we averaged the scores obtained by different volunteers at the same sampling point and then imported the scores into the street sampling point using ArcGIS to visualize the scores. In this way, the walkability scores we obtained for both daytime and nighttime are typical and generalizable, and the visualization results show the spatial distribution of walkability more intuitively (Figure 3).
In summary, the analysis and the comprehensive visualization of the scored dataset show that the areas with higher walkability indices are mainly located along the river, i.e., in the western part of the city, as well as in the main central area, which is located in the Jianghan and Wuchang districts. These two districts are in the core of the city and have more modern commercial facilities and a higher level of economic activity capacity. And the high development zone along the river even somewhat weakens, if not overcomes, the influence of environmental factors on walking perception in a temporal context. The change in the walking perception index is, firstly, affected by the subjective impression of pedestrians, which is mainly reflected in the change of the weight status of the elements affecting walkability in people’s thinking in different time periods. Second, economic vitality exerts a strong directional influence at hourly granularity, with areas of intense economic interaction showing reduced temporal sensitivity in walkability perception, whereas their perceptual variations increasingly covary with real-time socioeconomic dynamics. The change in perceptions of walking in zones with high levels of economic interaction is less affected by the time factor and is instead linked to the change in social activity in the region over time. Detailed spatial heterogeneity analyses of specific factors are provided in Appendix A.

5.3. Predictive Model Performance Evaluation and Selection Results

5.3.1. Performance Analysis of CLIP-Based Circadian Judgment Module

The CLIP model plays a crucial role in this study by establishing cross-modal alignment between street view images and pedestrian-aware text to achieve high-precision diurnal time slot discrimination. By designing a data validation set, we systematically evaluated the performance of multiple CLIP variants on the circadian time slot discrimination task, including Vision Transformer (ViT)-based and ResNet (RN)-based backbone networks, and the final results are shown in Table 6.
As shown in Table 6, the ViT-B/32 model achieved the highest accuracy (96.63%) on the diurnal discrimination task. Meanwhile, compared with larger models (e.g., ViT-L/14@336px or RN50 × 16), ViT-B/32 has significant advantages in terms of computational resources and inference efficiency. Therefore, we finally selected ViT-B/32 as the core CLIP architecture for this study. In the process of fine-tuning, we use the Information Noise Contrastive Estimation Loss function, which minimizes the cosine distance of the embedding of the matched image–text pairs while maximizing the cosine distance of the mismatched pairs through contrast learning. Thanks to the zero-short mode of CLIP and the sufficient pre-training of the backbone network model, a small number of training rounds (within 10 rounds) is required to significantly reduce the loss.
In terms of the Image Encoder: the final architectural setup is based on the ViT-B/32 variant of Vision Transformer. It segments the input image into a sequence of 32 × 32 pixel blocks, extracts features through the Transformer layer, and outputs a 512-dimensional image embedding vector. The Text Encoder encodes text cues such as “daytime”, “nighttime” and other related time dimensions into 512-dimensional text embedding vectors. Highly accurate time period discrimination and efficient computation are realized.

5.3.2. Performance Evaluation and Selection Results of Computational Modules

The optimal backbone algorithm was selected for the prediction model, so as to ultimately better predict the walkability scores in each time period. Based on the above regression analysis method, we constructed the corresponding walking score model. As shown in Table 7, the statistical model reached the significance level (p ≤ 0.01) at all time periods. And after the F-test, the model construction is established, but all of them are smaller than the machine learning model in the performance index R2. Among the machine learning models, Random Forest regression and XGBoost regression showed stronger prediction. The stepwise regression R2 is only slightly larger than the ridge regression and is almost the same, but the F-test value of the stepwise regression model is much higher than that of the ridge regression model. Upon further examination, the stepwise regression process eliminated several independent variables that deviated from the indicator system. We believe that it is not a good solution to improve the accuracy of the model by reducing the independent variables but failing to present the SOTA. It also suggests that the statistical model lacks accuracy when dealing with large multivariate data, and that the machine learning regression model fits better with this dataset.
In the selection of daytime regression models, the Random Forest model and XGBoost model with similar R2 values are concentrated around 0.7, and the XGBoost model has lower MAE and MAPE values than the Random Forest model, with higher fitting accuracy. It is worth mentioning that, although the XGBoost model reached an R2 value as high as 0.961 during the training process of the nighttime data, it performed worse than the random forest model during the test. Under the SVI-N test set, the random forest model achieved a satisfactory accuracy in prediction with an MAE value of 0.083, a MAPE value of 14.8, and an R2 value of 0.783. Therefore, we selected the XGBoost model as the backbone of the daytime walkability score prediction model and the random forest model as the backbone of the nighttime walkability score prediction model.

5.4. Walkability Baseline Model Generation and Analysis

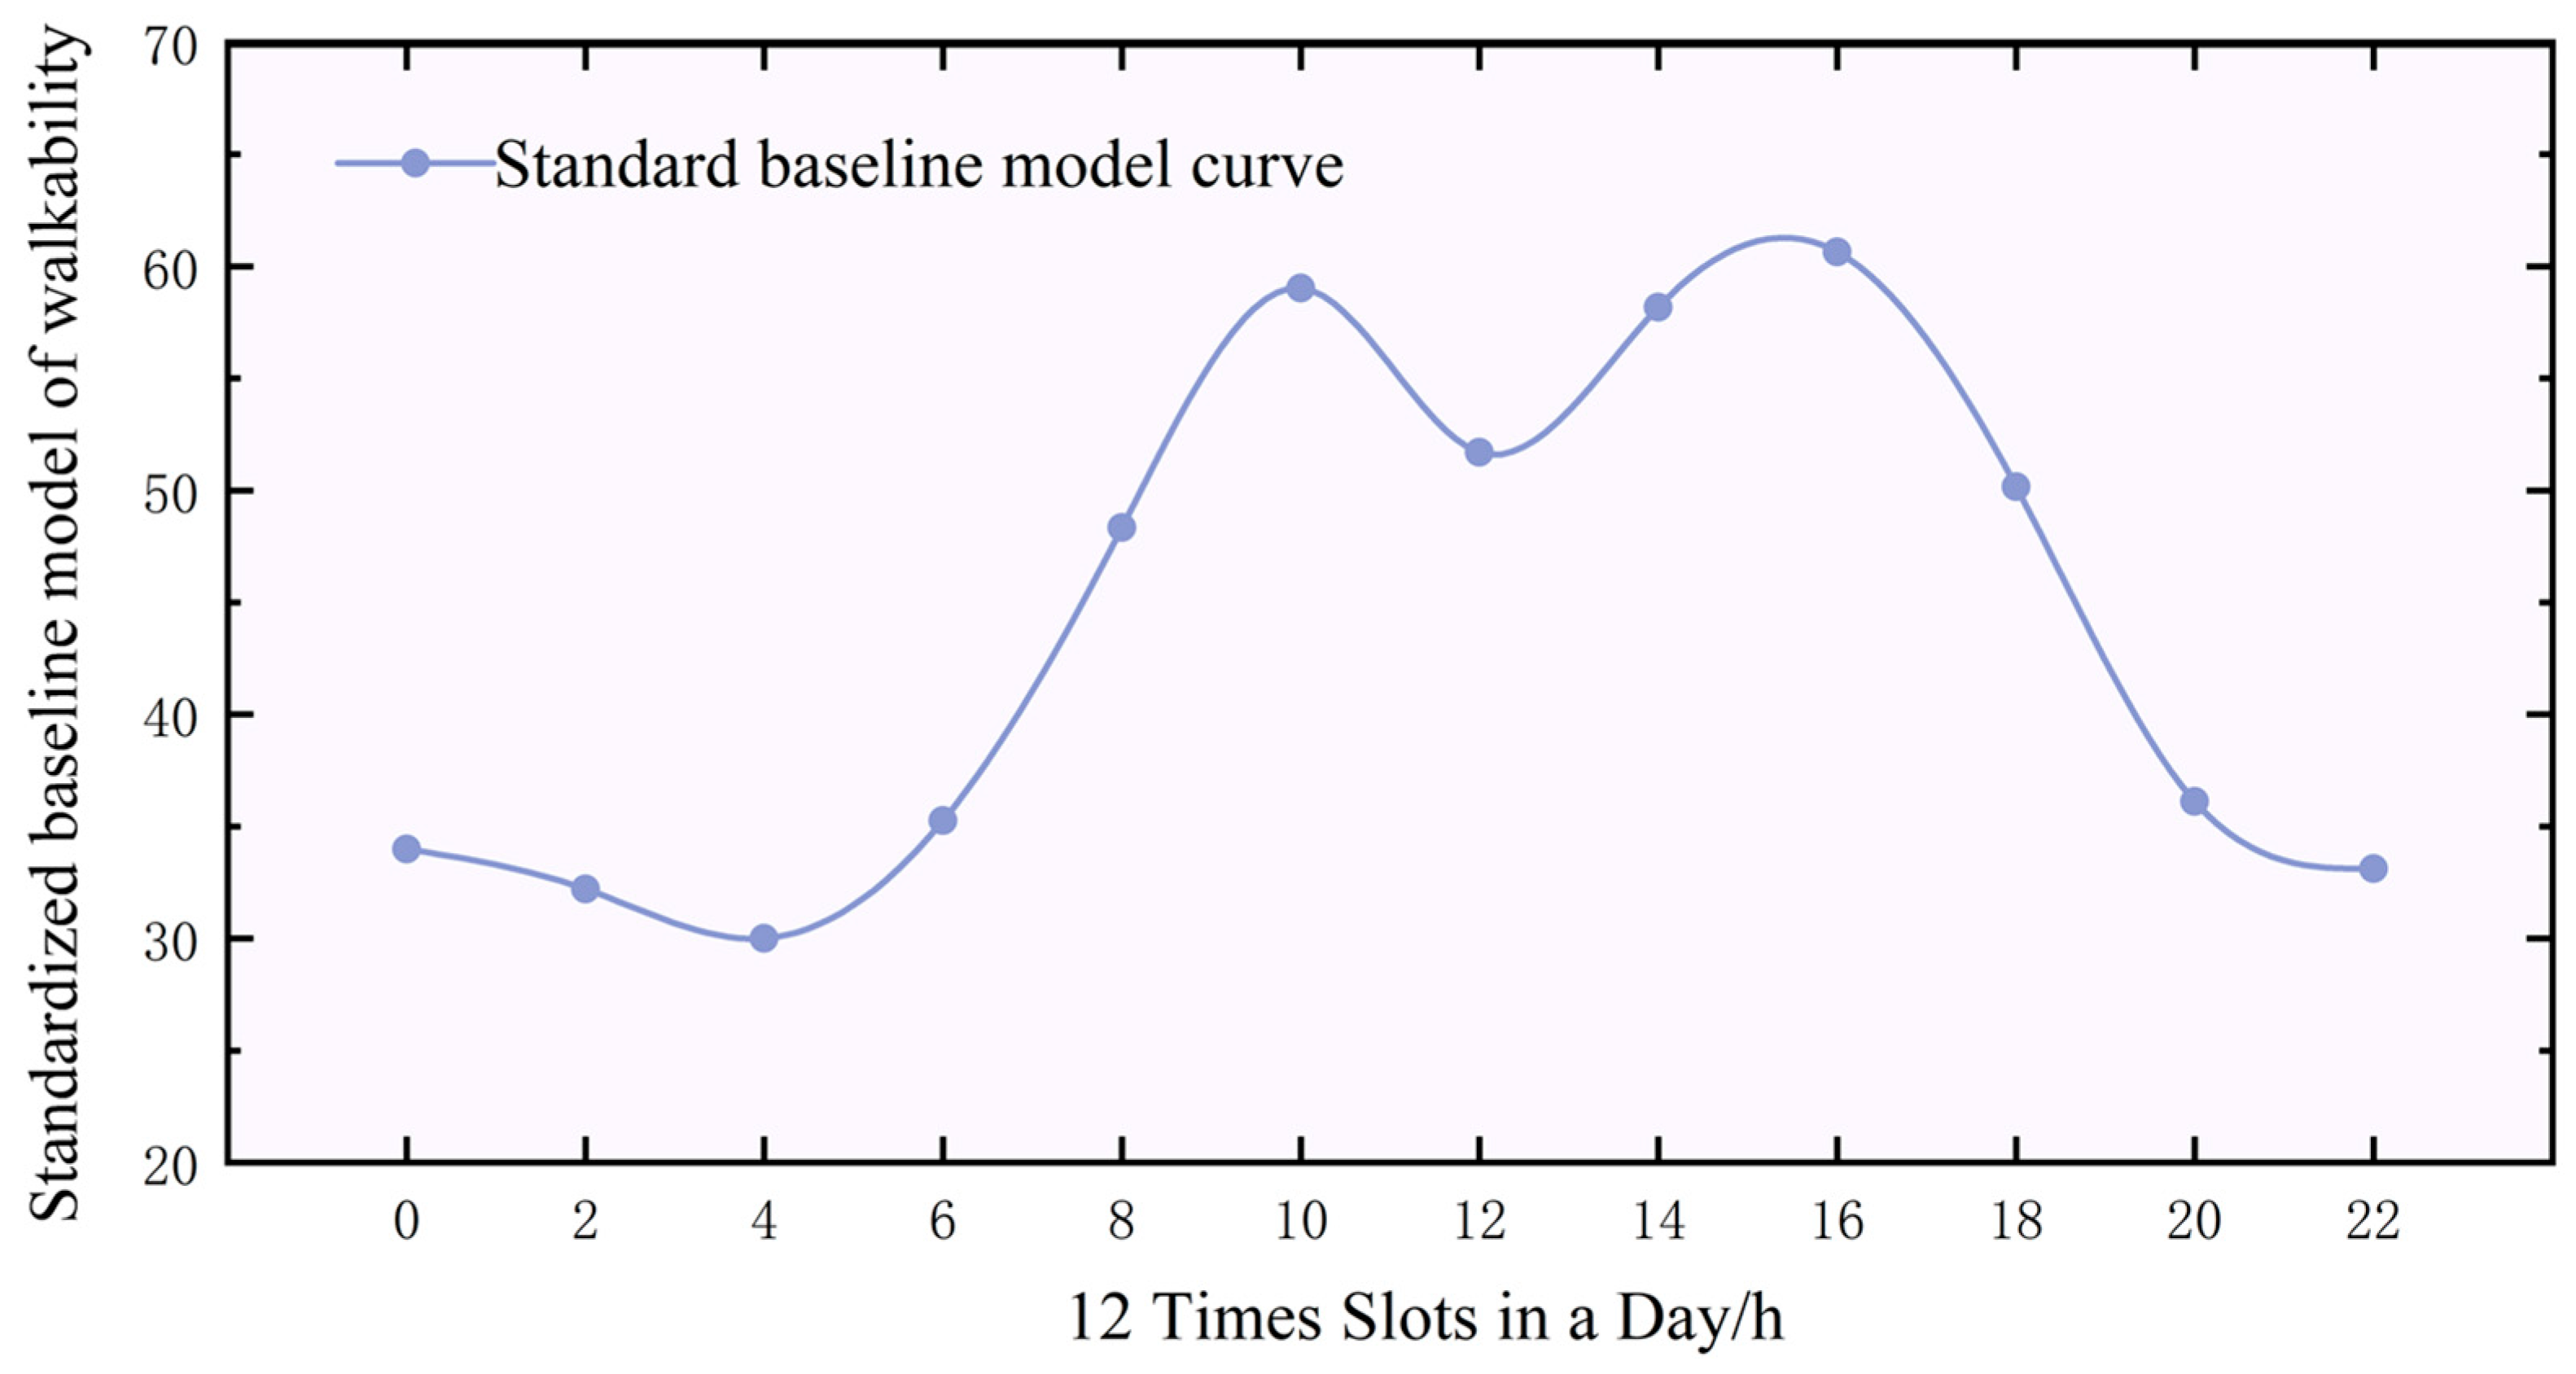
The front-end time judgment module can be trained to effectively distinguish the period that the SVI belongs to. Then, transmit the SVI data into the machine learning processing module that belongs to different time intervals of day and night and use the corresponding quantization algorithms. After obtaining the pixel-level walking quality factor data, we combine the data with the textual descriptions to complete the score generation. We generated a fine-grained walkability score for the road network in the center of Wuhan city with a time step of 2 h. In order to more clearly represent the spatial and temporal variation patterns of walkability in urban streets, this study uses the average of the predicted scores in each time period as the representative value to obtain the baseline model for the evaluation of walkability in a sequential order, as shown in Figure 4.
The mean walkability score did not show significant fluctuations during the nighttime period (20:00–8:00) but was in a decreasing trend from 20:00 onwards until after 4:00 am, when it showed a slow increase (see Figure 4). By establishing a relationship between the walkability score and its physical influences, we can assume that the dominant physical factors affecting the change of safety, i.e., the data on pedestrian density, traffic flow, and nighttime lighting, lead to the creation of a decreasing trend in the mean walkability scores since 20:00. Furthermore, it is important to emphasize that the time series curves only change in small increments which illustrates the abovementioned nighttime walkability factors as important influences on change, rather than their dominance in the composition of the overall nighttime walkability.
Walkability scores continue to decrease over time as the number of pedestrians out at night decreases, and most people go to sleep or engage in indoor activities. The process reaches a low point at 4:00 a.m. until the 6:00–8:00 a.m. hour when it begins to pick up, and pedestrian walking increases. Due to the geography and economic activities of the three towns of Wuhan, the breakfast culture penetrates the minds of the people too early and therefore has an impact on the walkability of the streets at that moment. During the daytime hours (8:00–20:00), the time series curves show fluctuation phenomena, with peaks at 10:00–12:00 and 16:00–18:00. Commuters are the main component of the urban pedestrian group. These two time periods avoid the peak hours of commuting to work and leaving work. The walkability is not significantly negatively affected by congested people and dense traffic. While at the same time during these hours, the POI facilities are mostly open, transport facilities are easily accessible, and the overall mean value of walkability peaks. During the lunch hour from 12:00 to 14:00, the walkability scores decreased, mainly due to the reduction in pedestrian density and the temporary closure of some POI facilities. During the peak commuting hours. Although the walkability mean is lower than the peak zone, it is still higher overall than the nighttime hours.

5.5. Spatio-Temporal Analysis of Walkability

5.5.1. Time Series Clustering and Geovisualization

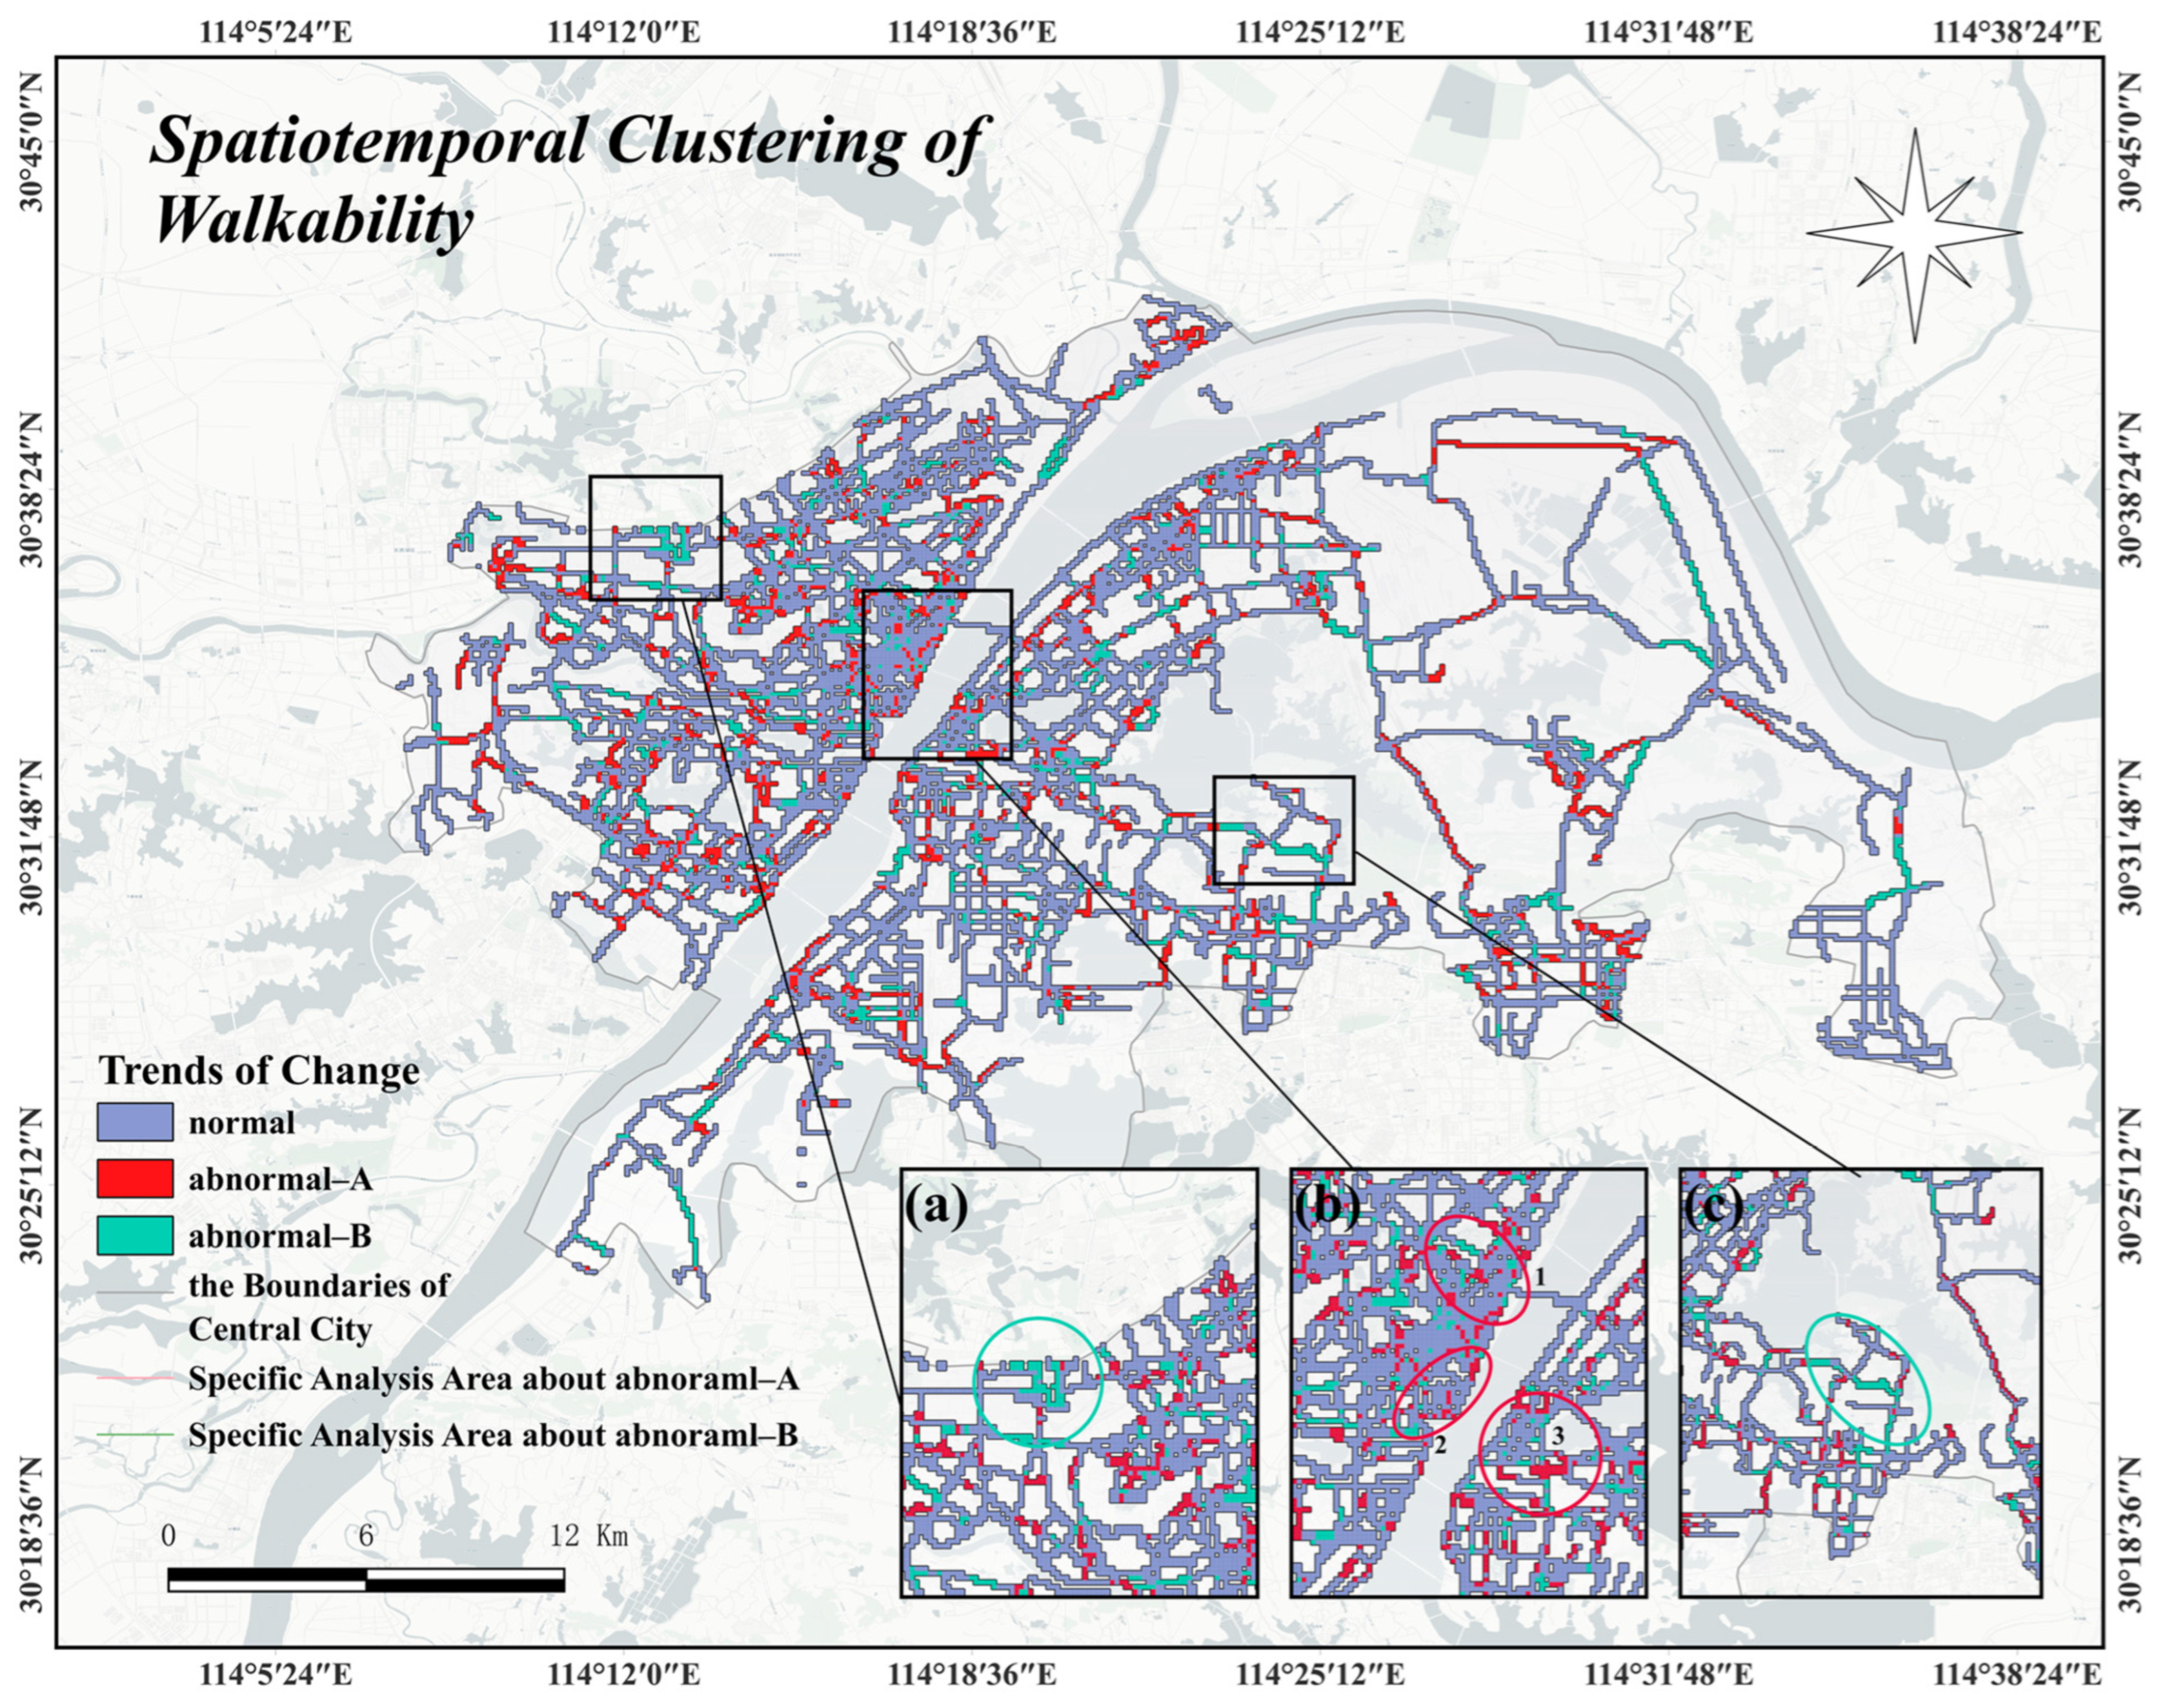
To further analyze the possible variability of walkability time series within a small area, we superimposed the score generation results of each sampling point at different periods. That is, each sampling point added a temporal dimension on top of having the coordinate data and the score result data. That is, each sampling point possesses its own time-series curve of walkability scores, which in turn constitutes a large collection of time-series curves in terms of individual points. Based on the similarity of the time-series features of each road sampling point, we performed spatio-temporal clustering on the set. In particular, we define feature similarity in terms of the statistical correlation of trends in the change process, which measures the similarity of the time series at points within the set, as shown in Figure 5.
According to the clustering results, we found that in addition to the NORMAL collection largely conforms to the baseline model change rule, in the local area there are abnormal change trend of ABNORMAL-A class and ABNORMAL-B class, it is necessary to analyze it carefully.
As shown in Figure 5, ABNORMAL-A trend study area, the (b)-1 area contains the Wuguang business district and the pedestrian street on Jianghan Road, which is rich in shopping malls, recreational facilities, and catering venues, with a huge flow of people and many economic activities, and the nighttime lighting index is relatively high, which is best for the city. Economic activities and the night lighting index are high; the (b)-2 zone is a famous tourist area in Wuhan, including famous historical and cultural sites such as the Huanghe Tower and popular attractions on the Internet such as the Tambu-Lin and Tube Alley, with more service facilities, which reflect better walking convenience during rest time; the (b)-3 zone is the area where two hospitals are located, and hospitals, as one of the necessary urban facilities and the centralized place of urban traffic, are an important zone for the economy and construction. (b)-3 is the area where the two hospitals are located.
In the study area of the ABNORMAL-B trend, the (a) area is the natural landscape area of the park, located at the edge of the urban area, with very high vegetation coverage, flat roads, and obvious garden features but with low foot traffic and a small number and single type of facilities of interest; the (c) area is located at the lakeshore, along the mountain road, which has a better comfort during the daytime and lacks a certain degree of security during nighttime hours.

5.5.2. Quantification and Analysis of the Characteristics of Diurnal Variation in Walkability

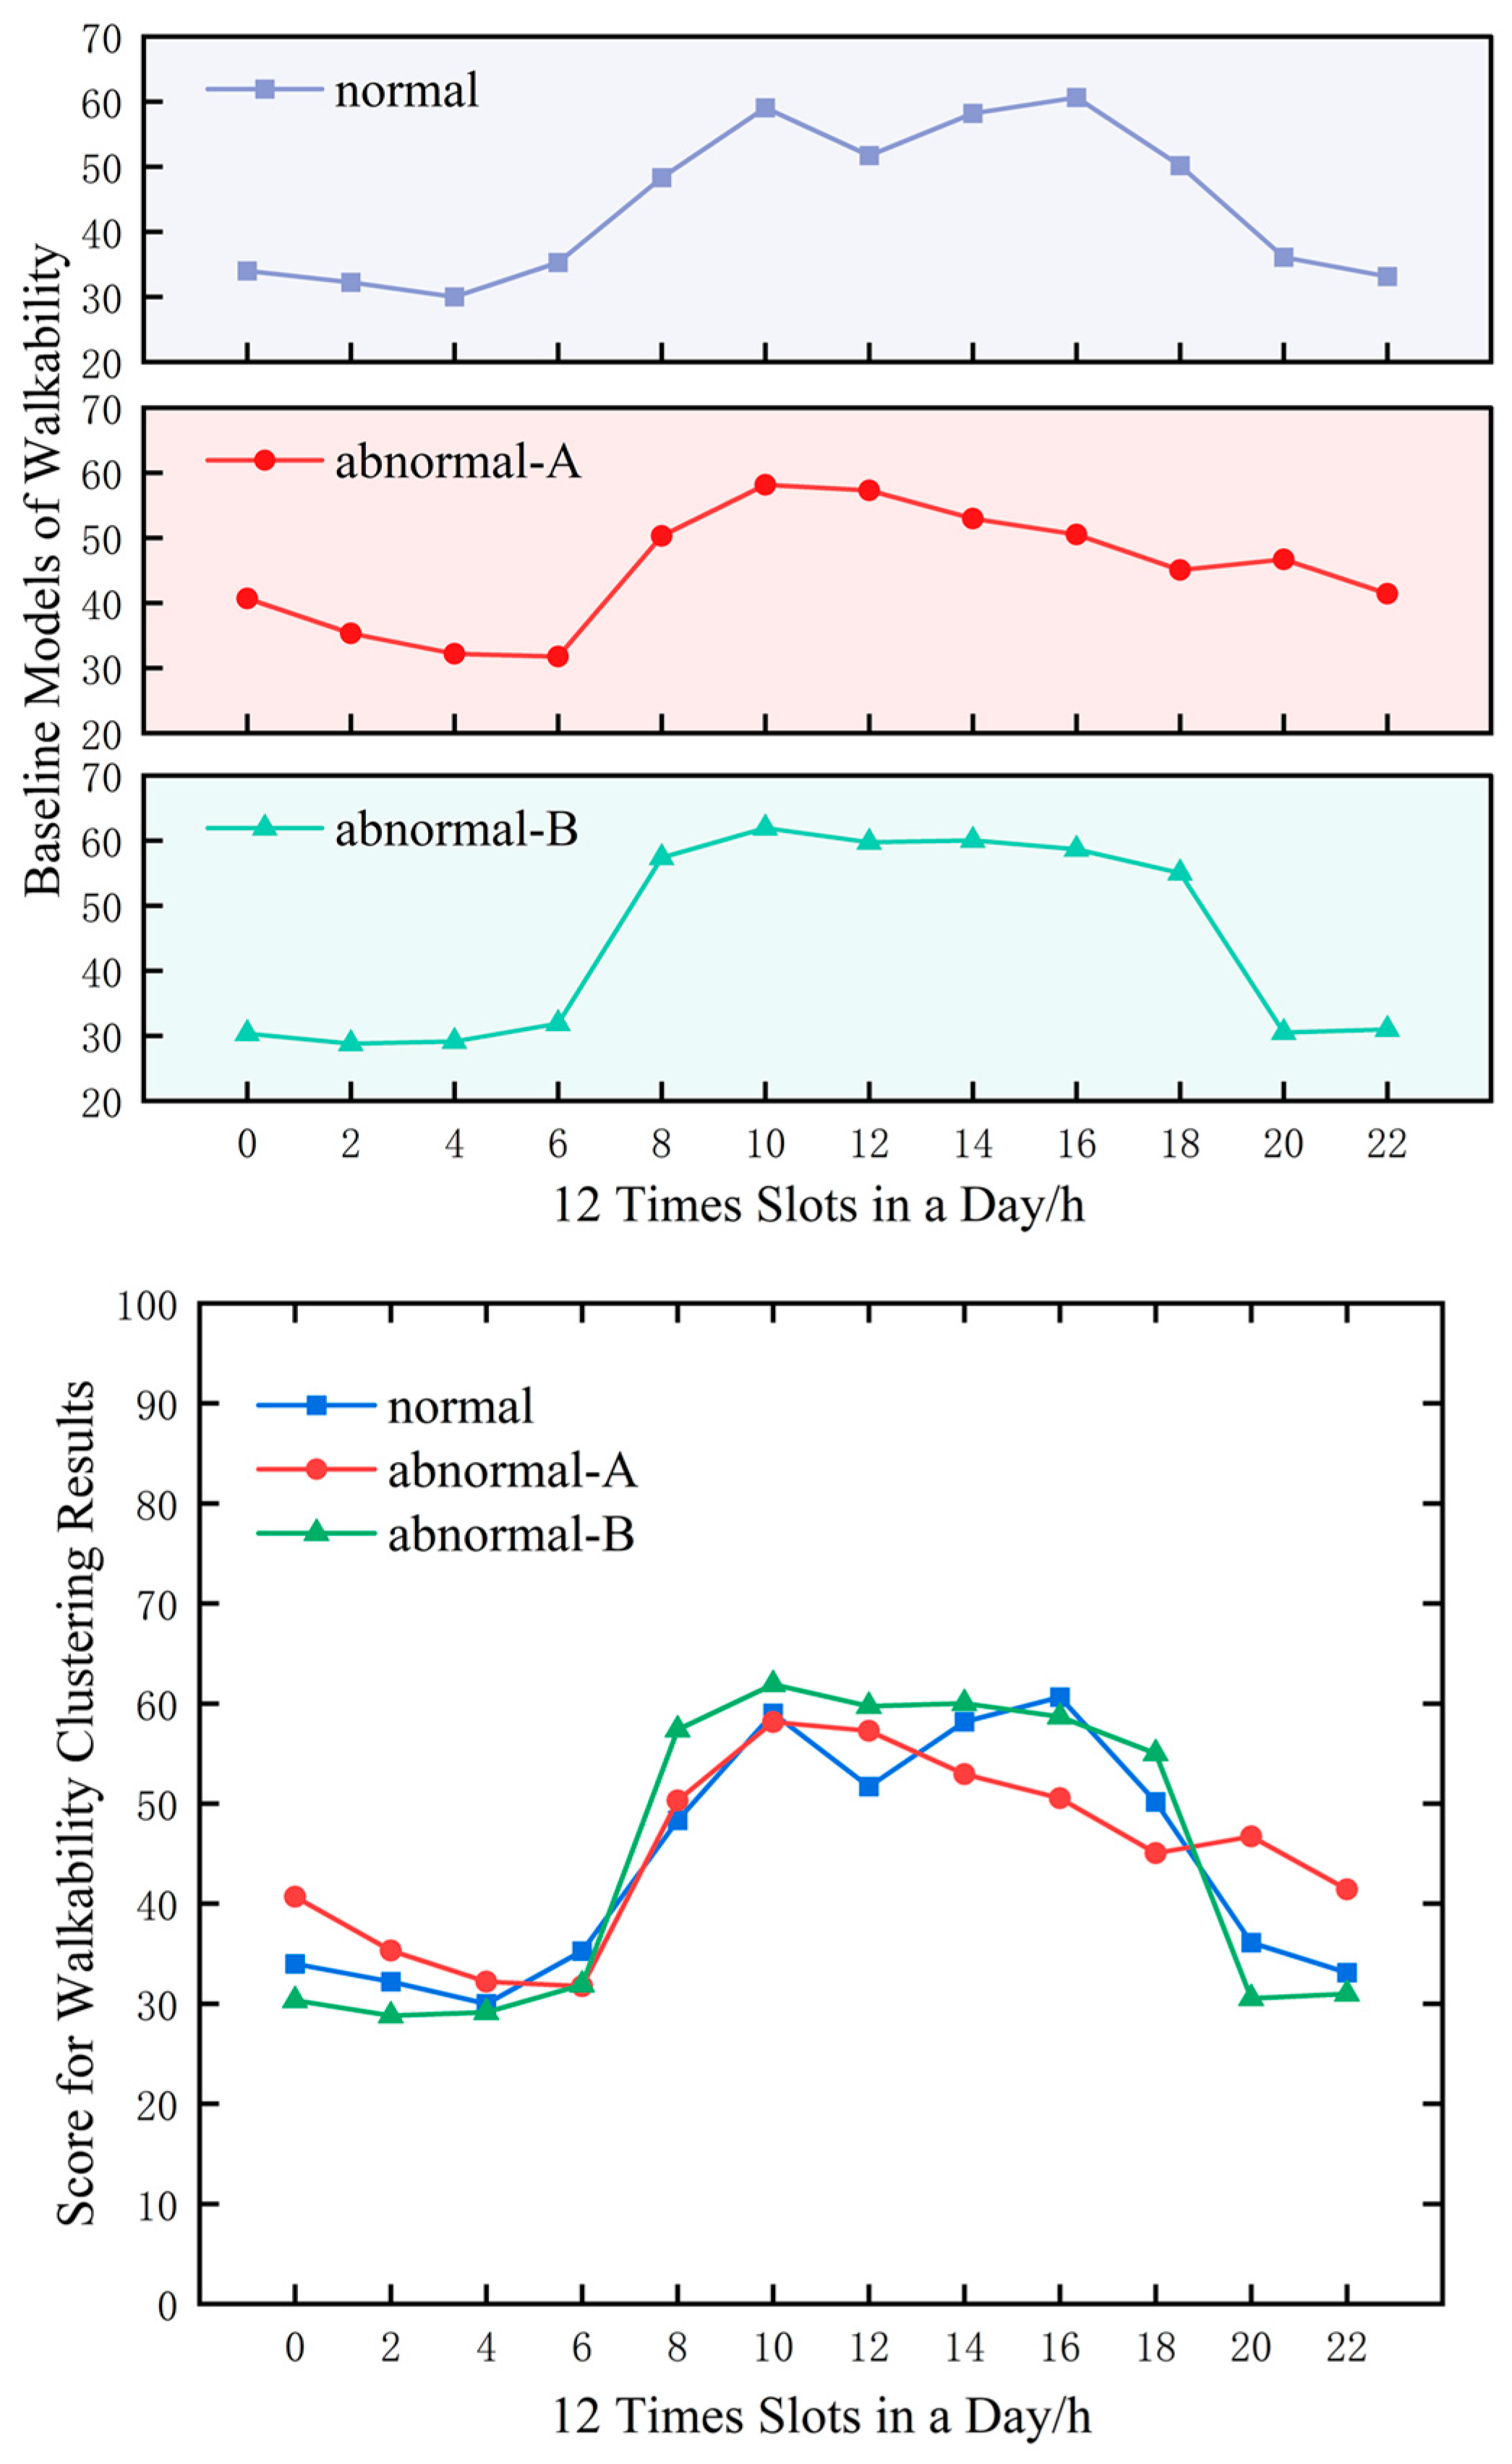
We homogenized the set of sampling points for each of the three different trends mentioned above and generated the corresponding time series curve models, as shown in Figure 6. Combined with the above geographic information analysis results, in order to further explore the hourly variation characteristics of walkability and reveal the internal regulation mechanism caused by circadian rhythms, it is necessary to compare and analyze the baseline models with the abnormal curves and explore whether there are corresponding links and influences among them.
Based on the walkability diurnal variation character assessment system, the results of the calculations are shown in Table 8. The NORMAL baseline model, which was examined to be very similar to the standard baseline model of walkability mean scores without clustering operations (the average difference between the indicators was only 0.02), further reflects the fact that the collection of sampling points of the NORMAL class tendency is greatly represented in the spatio-temporal clustering results. The quantitative system of core indicators can reflect the overall performance of the change characteristics of walkability in the study area under the influence of day and night. Its NAI is 0.388, which is mainly affected by the uneven nighttime light coverage and the sudden drop in pedestrian flow at night. The recovery rate in the dawn period reaches a satisfactory level, although the recovery rate is slow in the period of 4:00–6:00. But in the period of 6:00–8:00, the urban vitality improves and the pedestrian walking phenomenon begins to increase, and the unique breakfast culture in Wuhan also plays a positive role. The EORF reflects the overall fluctuation characteristics of walkability scores in the study area. This indicator shows that although walkability shows some fluctuation phenomenon during the diurnal cycle, the system maintains a relatively balanced functional continuity through dynamic regulation, and no extreme outliers occur.
ABNORMAL-A shows a better anti-decay ability during the mode shift from daytime to nighttime, which is significantly higher than the NORMAL model. The core mechanism stems from the synergistic effect of high-density POI facilities (shopping centers, transportation hubs) and nighttime lighting system. Such areas have successfully shifted the peak of nighttime population density to 20:00–22:00 through rich economic activities and regulation of pedestrian flow dynamics. And in the nighttime hours, due to its high lighting index, it makes the nighttime walkability scores drop only slightly compared with the daytime, which creates a pseudo-continuous feature of day and night to a certain extent and breaks the obvious demarcation between the daytime and nighttime walkability scores. However, its DRR is overall lower than that of the standard baseline model versus the Class B model, suggesting that nighttime economic activity prolongs the duration of the trough, with the scoring trough delayed to 6:00 am rather than 4:00 am. The recovery efficiency is affected by the lag in merchant closing time, so the walkability dawn recovery efficiency is low and shows a regressive trend between 4:00 and 6:00. In addition, the walkability stability is relatively good, with a small EORF of 0.455, which is mainly attributed to the fact that the walkability of the street decreases during the daytime due to the high pedestrian flow, while it achieves high walkability scores during the nighttime hours. Therefore, the model has good continuity. The fluctuation of the model curve is concentrated in the early morning hours, reflecting the diurnal continuity of business-driven streets. Human activities, economic construction and the internal regulation mechanism of the urban street system are inextricably linked, which has an obvious activating effect on nighttime walkability.
The walkability scores of the ABNORMAL-B type reached a steady state in all day and night hours without obvious fluctuations. But its diurnal difference was large, so this also means that its nighttime resistance was poor, and it was affected by the transition of the diurnal pattern. The Nighttime Attenuation Index was as high as 0.493, which was mainly due to the poor nighttime lighting index and the sparse population in this type of area. This type of study area has good vegetation cover and a pleasant walking environment, and achieves higher scores in the daytime period, with a higher value of DRR than in the other baseline models at 0.481. Walkability is more volatile overall, but it is not difficult to see that it is more stable in a single period of time during the day and night, Spatially, most of these areas are in the fringe and sparsely populated along the river, which is different from the trend of the other types. This makes them less affected by human activities than other types of trends, i.e., in the study area of the ABNORMAL-B walkability score, human activities are sparse due to geographic constraints, which has a negative effect on the dynamics of walkability. Accordingly, in the prediction model for the nighttime hours, the walkability scores were lower than average and again did not change significantly. To some extent, their walkability scores during the nighttime hours remained at a low level. Thus, the walkability diurnal variation within the ABNORMAL-B region is broadly characterized by low resistance, high recovery, and local temporal stability.

6. Conclusions

6.1. Research Findings and Contributions

This study fills the gap of walkability research in the time dimension. A 24 h dynamic baseline model of walkability is constructed by using multimodal data and deep learning techniques, and based on which a quantitative system for characterizing diurnal variation in walkability is proposed, revealing the dynamic regulation mechanism of walkability on urban streets under the influence of circadian rhythms. The methodology serves the low-carbon travel policy and urban construction approach. It contributes to the improvement of walkability research and sustainable urban development.
First of all, this study divided the day into day and nighttime periods based on the population’s work and rest patterns and screened and constructed a baseline model for evaluating walkability based on different time periods through comparative analysis and performance evaluation. We used 2 h as the time step to generate a score for the walkability of roads in Wuhan city center, defined the feature similarity by the statistical correlation of the trend of the change process, and clustered the spatial changes of the walkability of each road. The results show that the change pattern of walkability time change is mainly presented as the NORMAL change trend, i.e., the standard baseline model, accompanied by a small number of areas appearing in the class A anomalous model as well as the class B anomalous model representation. The natural landscape, including green visibility and sky openness, is the basic component of walkability, but the change is not obvious on the time scale. Based on the assessment system of circadian characteristics of walkability, we further revealed the internal regulation mechanism of the walkability system under the influence of circadian rhythms based on the three core indicators, and the socio-economic activities and the interaction between pedestrians and the environment more obviously affected the resistance to nighttime disturbance and the recovery rhythms of walkability. For example, in areas with high levels of social activity and economic activity, street walkability is less disturbed at night, and high economic activity in busy urban areas during the nighttime hours can, to some extent, reverse the otherwise low levels of walkability at night. Some remote areas have higher rates of walkability recovery at dawn (4:00–8:00 a.m.) despite their greater diurnal variability.
Secondly, the analysis of spatial and temporal variations shows that the spatial and temporal distribution of walkability at the street scale in Wuhan follows the typical spatial structure with the center of economic development on both sides of the Yangtze River radiating to the surrounding area. The overlay visualization of multi-temporal data at the geographic scale shows the linkage between changes in walkability and geographic location in the spatial dimension, with high-development areas somewhat weakening, or even overcoming, the influence of environmental factors on changes in walkability. It is necessary to consider the dynamic effects of natural and social factors on walkability in urban planning at the street level to make walking the main mode of green and low-carbon traveling and to make effective use of the pattern of change in urban walkability to create a comfortable aerobic and healthy walking experience during the daytime and a safe and convenient walking environment at night to serve the low-carbon traveling policy and the urban construction policy.
Thirdly, in this study, we use Street View Images in combination with other multimodal data to achieve a cross-temporal study based on multidisciplinary branches. The investigation of nighttime walkability is an area that has rarely been touched upon in previous studies, and the GIS processing of corrected remote sensing imagery to match roads and nighttime lighting remote sensing imagery data plays a crucial role in quantifying the quality of nighttime walkability in this study, which has a significant impact on the spatial distribution of nighttime walkability. The pixel-level data extracted from Street View imagery makes it more difficult to achieve such a fine-grained variation in the hourly time change, and by collecting real-time geographic information, live data such as people flow, traffic flow, and the number of POI facility openings, it completes the gap in SVI data in the form of digital text. The research methodological framework proposed in this study benefits from artificial intelligence technology and multimodal data fusion technology, which is transferable for multi-temporal urban street planning and change law exploration.

6.2. Limitations and Future Directions

Although this study has accomplished the revelation of the dynamic change patterns of walkability on urban streets throughout the day and 24 h, there are still several aspects that deserve improvement and breakthroughs. In this study, the multimodal deep learning model plays an important role, but due to the distribution density of the urban sensor network and the degree of data openness, we are unable to obtain real-time auditory modal data and olfactory modal data in the study area on a large scale, such as noise and odor, which will affect pedestrians’ perception of the walkability of the street. In our next study, we will aim to extend the multimodal dataset to more realistically simulate pedestrian perception.
Meanwhile, we will further study the dynamic change patterns of walkability in special phenomenon cases other than weekdays, such as in the scenarios of weekends, seasonal changes, and extreme weather, and explore the multi-scenario regulation mechanism of walkability based on the consideration of special temporal heterogeneity. It is worth noting that the dynamic assessment baseline model and the quantitative system for characterizing diurnal variation in walkability established in this study have good transferability. Future studies addressing weekday and weekend pattern differences or seasonal variations need not change the overall architecture. By adding multimodal data for corresponding periods, such as all-day weekends and representative dates of different seasons, the existing framework can be utilized to complete the data collection, model assessment, and dynamic analysis and efficiently explore the fine-grained change mechanisms of walkability on urban streets in different time contexts.

Author Contributions

Conceptualization, X.W. and X.Y.; methodology, X.W.; software, X.W. and Z.P.; validation, X.W. and X.Y.; formal analysis, X.Y.; investigation, Z.P.; resources, X.Y.; data curation, X.W.; writing—original draft preparation, X.W. and Z.P.; writing—review and editing, X.Y.; visualization, X.W.; supervision, Z.P.; project administration, X.Y.; funding acquisition, X.Y. All authors have read and agreed to the published version of the manuscript.

Funding

The research presented in this article received funding support from the National Natural Science Foundation of China (No.42271449).

Data Availability Statement

The data used in this study can be made available by contacting the corresponding author.

Acknowledgments

We would like to express our sincere gratitude to Xiong Yaxuan, a student from Wuhan No.11 High School, for her invaluable assistance in this research. She was responsible for the collection of survey questionnaire data during the study.

Conflicts of Interest

The authors declare no conflicts of interest.

Appendix A. Spatial Heterogeneity Analysis Mediated by Walking Perception Attributes

Appendix A.1. Methodology

Objective walkability and perceived walkability are highly correlated. To better describe the spatial distribution of the quantitative indicators of street walking quality and to analyze the causes of the spatial heterogeneity they present for walkability, we grouped the 10 quantitative indicators into three categories based on their correlations with different attributes of street walking perception. These are walking comfort, walking safety, and walking convenience.
The quantitative indicators of street walking quality obtained in this study have strong volatility in different road sections; for this reason, we use the CRITIC weighting method for objective assignment. The CRITIC weighting method is an objective assignment method based on the volatility of data, which is analyzed by comparing the intensity and correlation indicators. Combining the research background and related work, we classified the quantitative indicators of the 8:00–20:00 time period and the 20:00–8:00 time period positively and negatively, respectively. The normalized score x i j , volatility S j , correlation A j , and weights W j are then calculated using the following formulas:
x i j = x i j m i n x j m a x x j m i n x j
S j = i = 1 m x i j x ¯ j 2 n 1
A j = i = 1 n 1 r i j
W j = C j j = 1 n C j
where x ¯ j is the average of the data for each indicator column, r i j denotes the correlation coefficient between the ith and jth indicators, and C j is the amount of information, which is obtained by multiplying S j by.
Based on the objective assignment method, we also adopt the AHP hierarchical analysis method and invite relevant practitioners as well as professional teachers to conduct a secondary review of the weights that have been obtained in order to enhance the rationality and standardization of the weights and finally obtain the comprehensive weights W i :
W i = w ¯ i o w i s i = 1 H w ¯ i o w i s

Appendix A.2. Geovisualization and Spatial Analysis

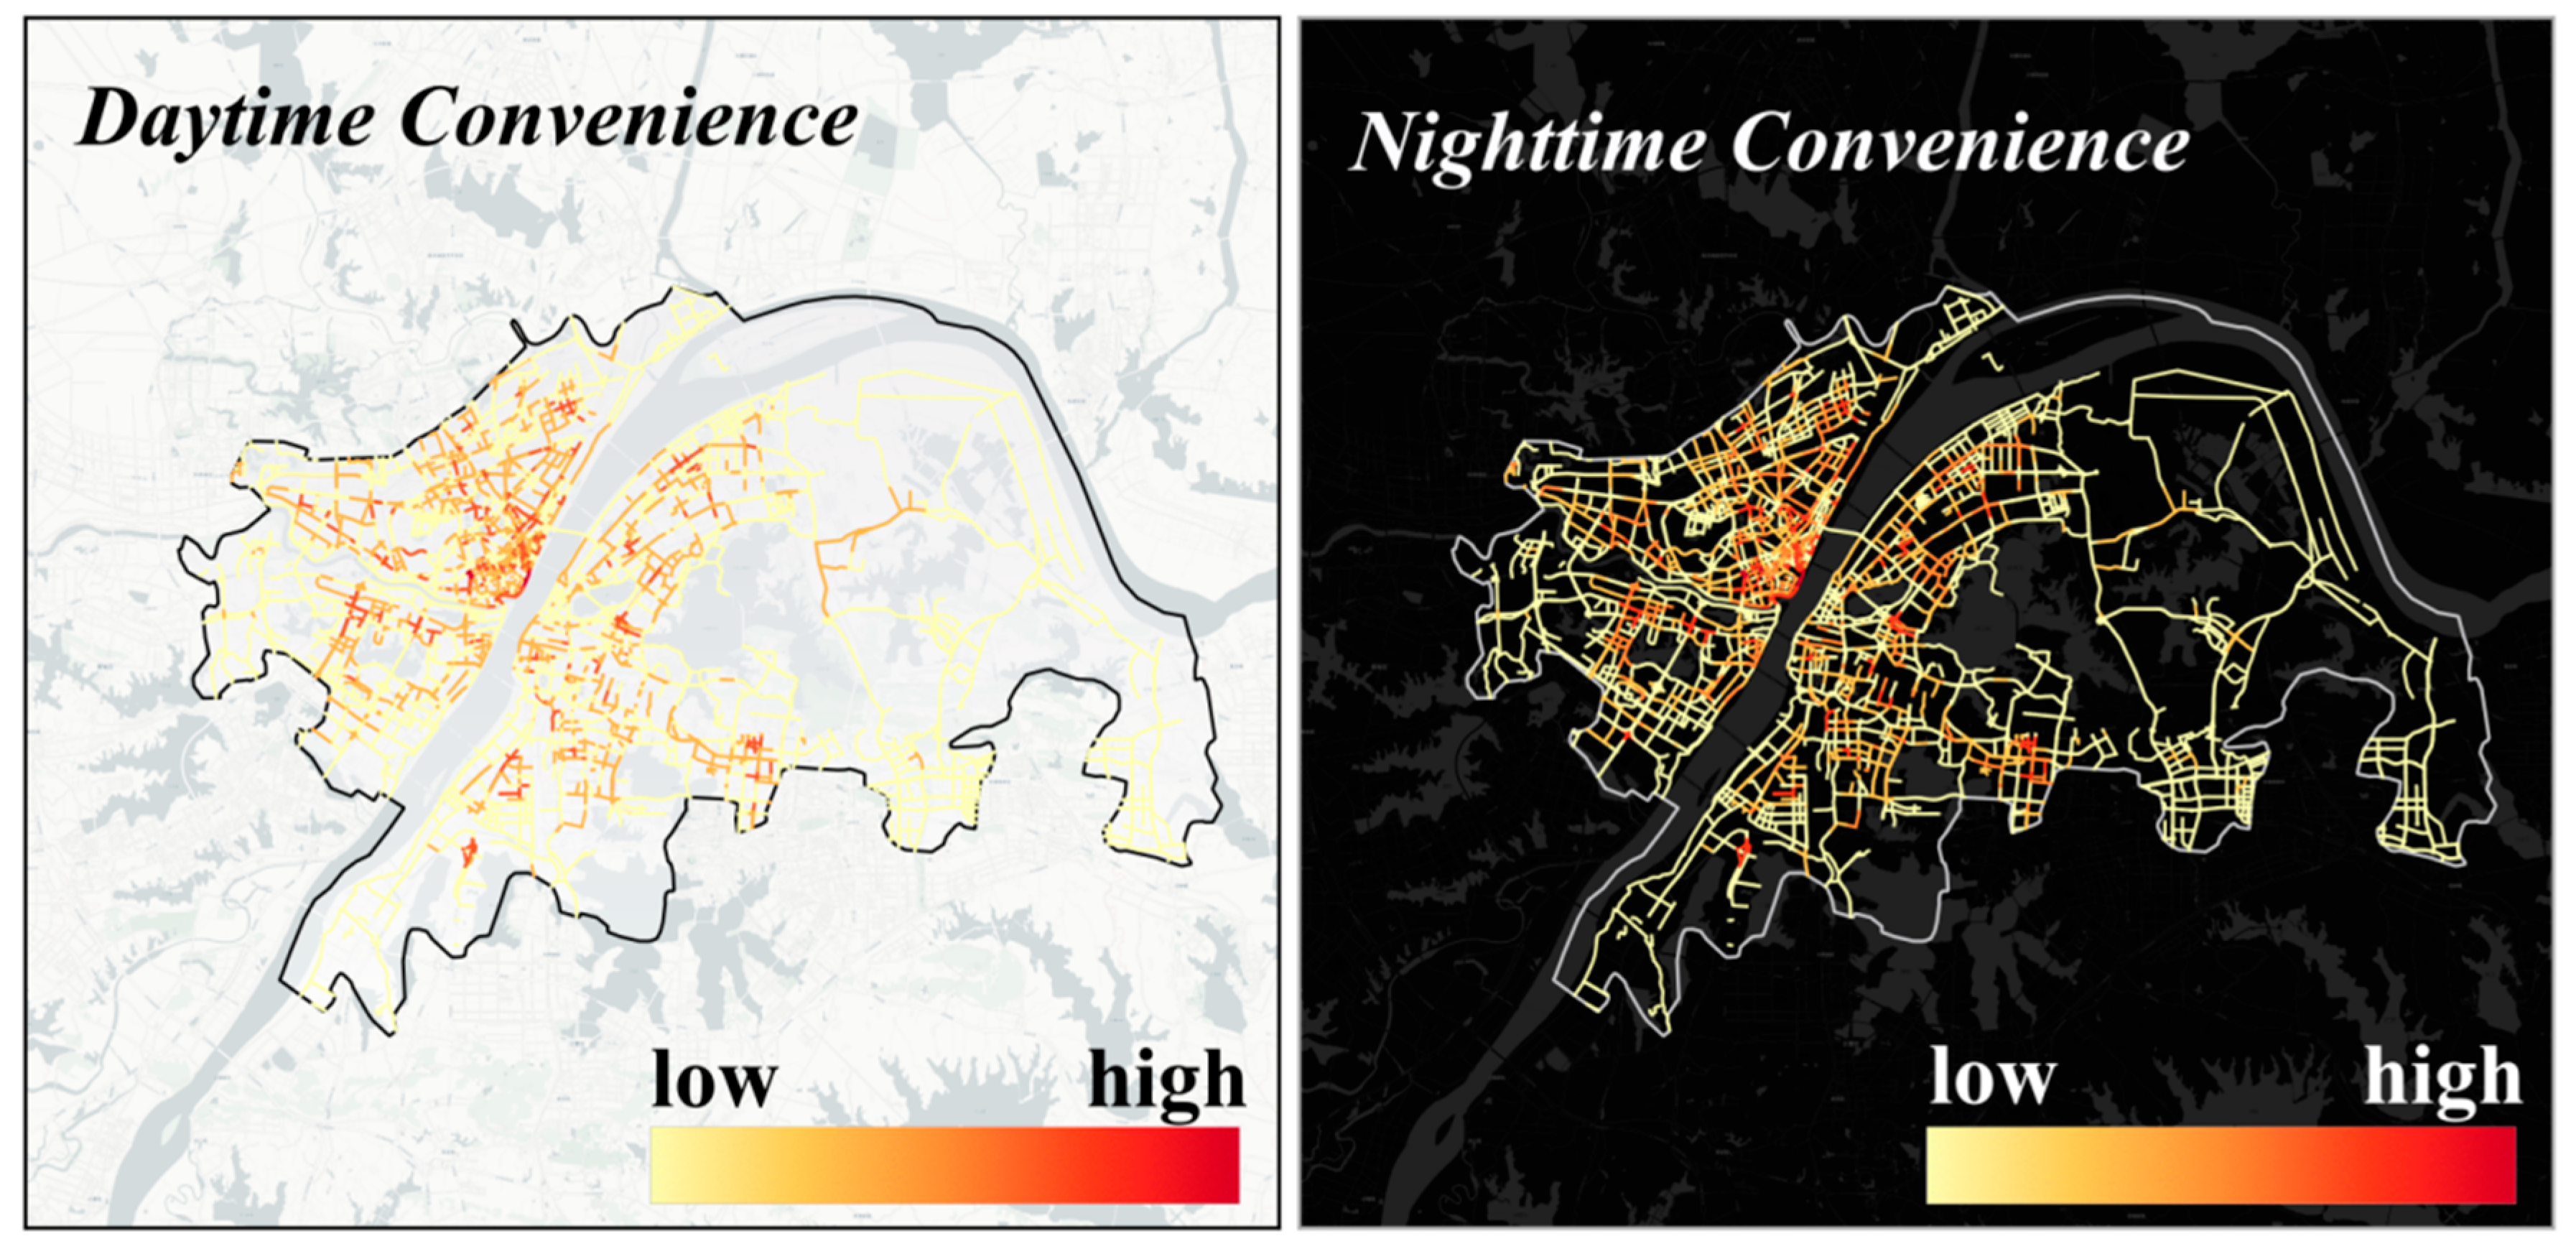
Through the integration of subjective and objective assignment methods, we identified the physical quantitative indicators of walkability that are in the same direction as comfort, safety, and convenience and obtained the results as shown in Table A1. This process not only refines and classifies the quantitative indicators, which are more in line with the concept of human-centered assessment, but also avoids the redundancy of analysis to a certain extent.
Table A1. Composition of walking perception attributes and their weights.
AttributesDeterminantsDaytimeNighttime
ComfortGreen visual index0.3210.193
Sky view factor0.2730.186
Relative pavement width0.2040.377
Quantity of rainfall0.2020.244
SafetyPopulation density0.1650.294
Vehicle interference0.4290.172
Pavement fence0.4060.153
Lighting index 0.381
ConvenienceNumber of POI facilities0.5220.759
Number of bus stops0.4780.241
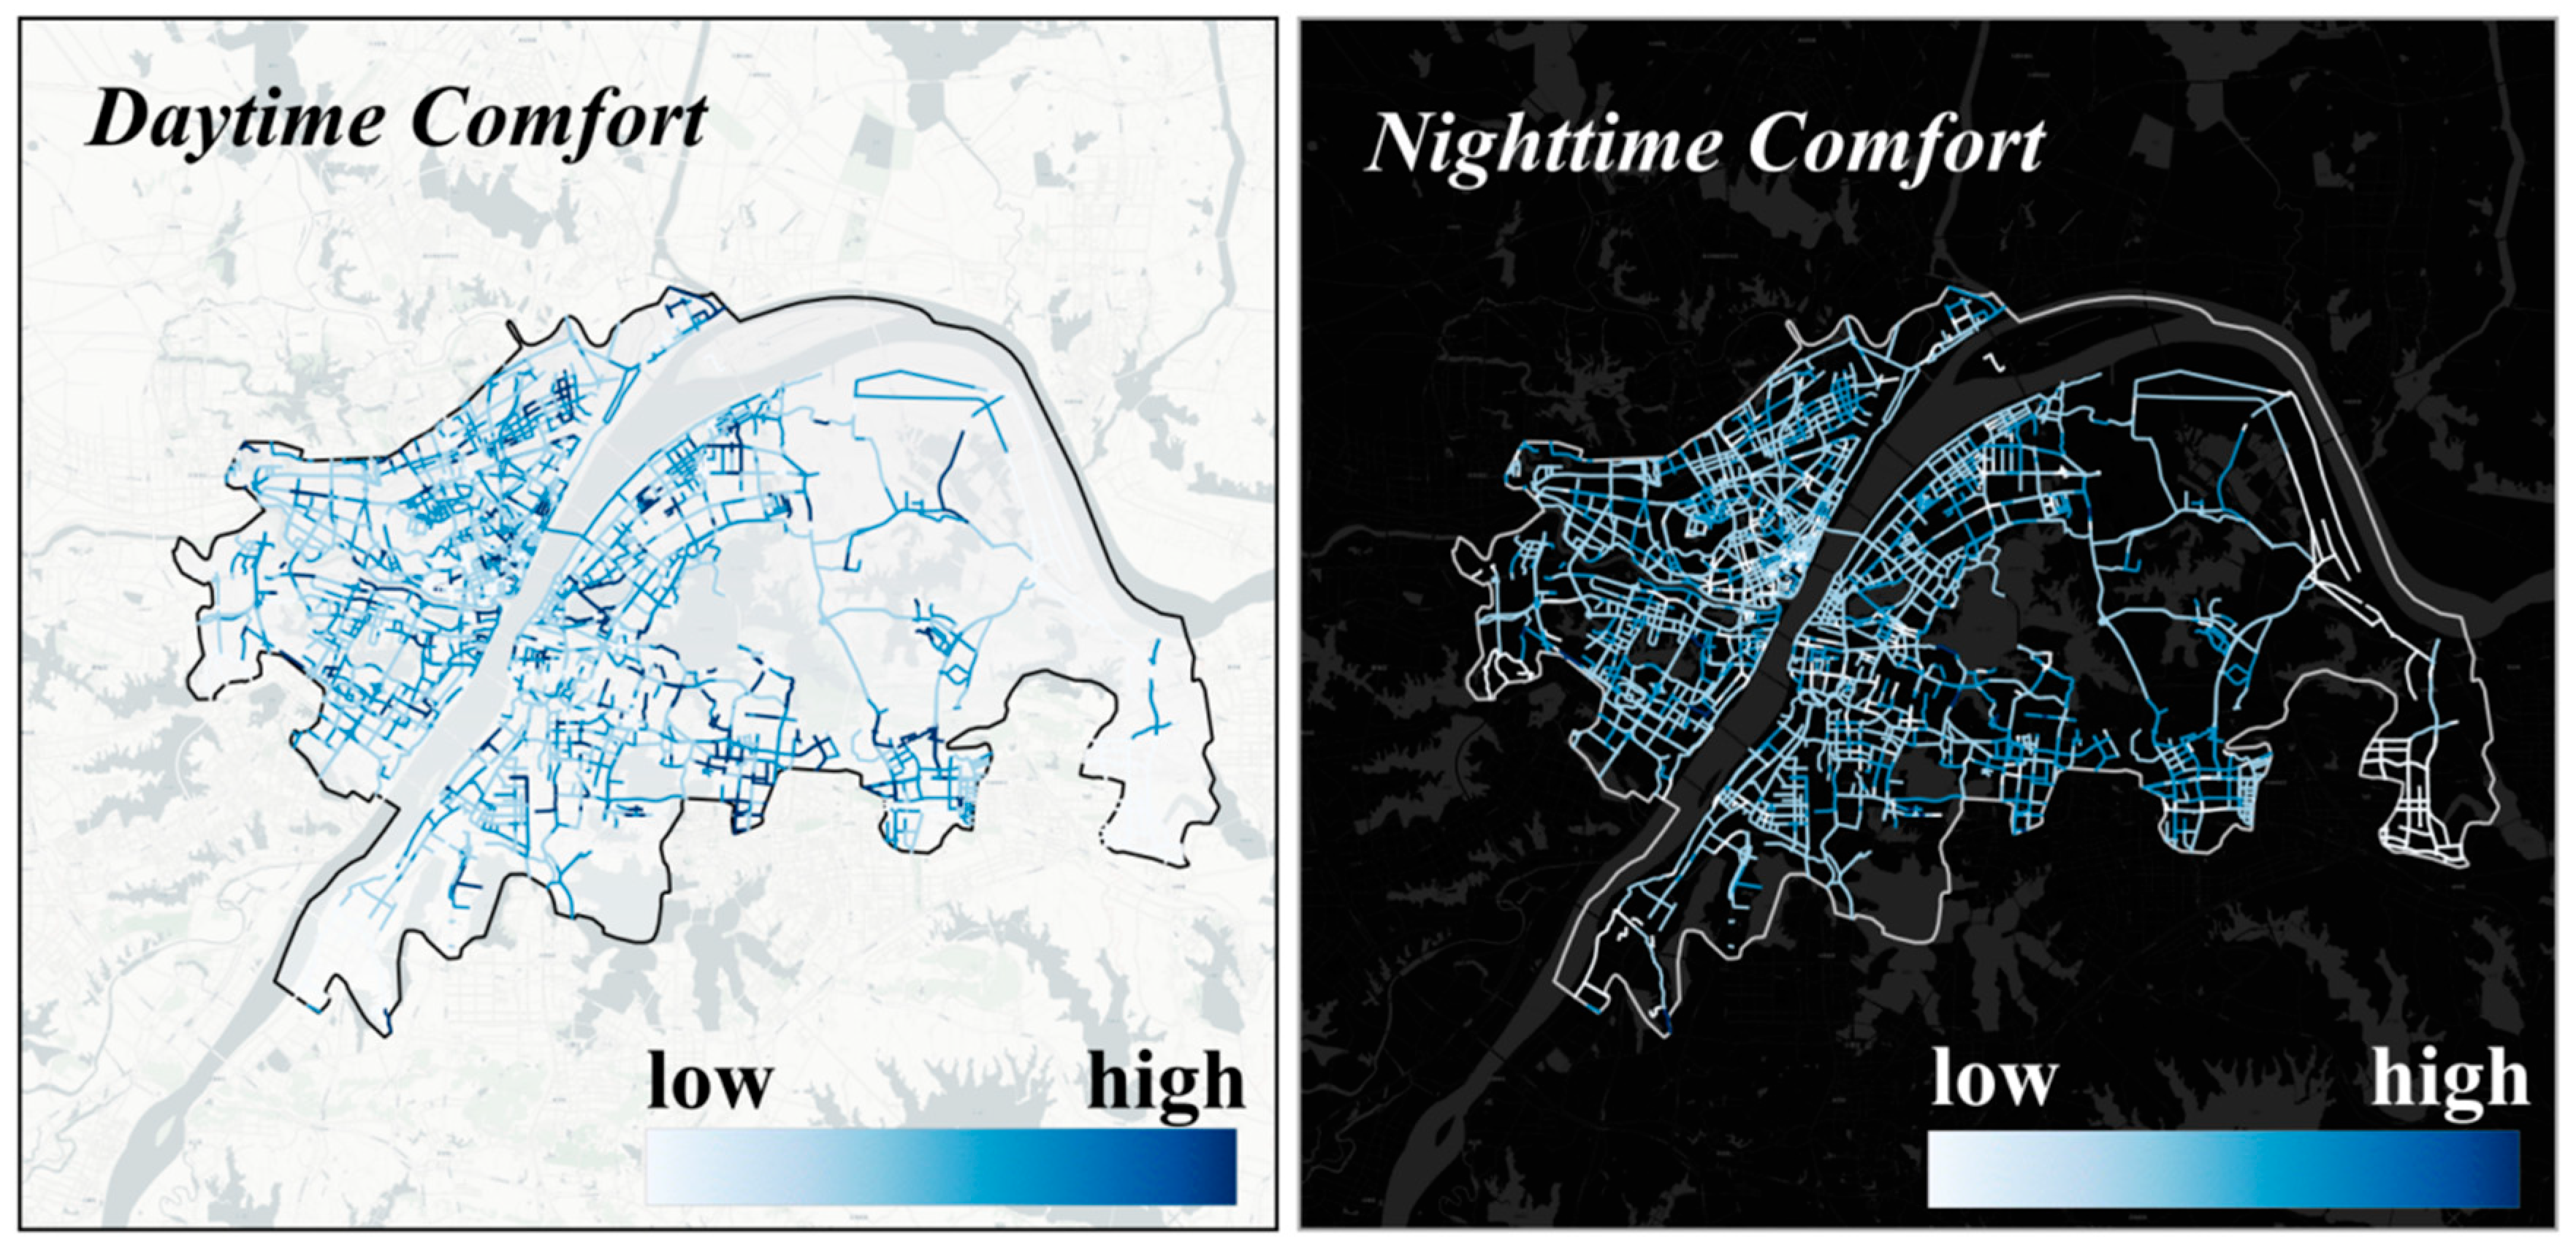
Based on the connection of this relationship, we are able to better analyze the characteristics of the spatial distribution of walking perception attributes and their short-term variations. Figure A1 shows its visualization at the geographical level. The results for comfort, as an important dynamic factor for measuring walking perception and discussing pedestrian-environment interactions, show significant differences in its daytime and nighttime performances: in the daytime, the effects of green visibility and sky openness on comfort are more pronounced, which coincides with people’s daytime preference for walking in natural environments and open spaces, while at night the effects of these two factors are weakened due to the decrease in visibility, and accordingly, the road width has a significant effect on pedestrians’ judgement of walking comfort, and pleasantness was greater, while rainfall showed a significant negative correlation with comfort. In most of the areas along the river in the western part of the city center, comfort is more satisfactory for pedestrians in both day and night, while walking comfort in the remote areas in the extreme east is not as good as it should be. There is a significant change in comfort from daytime to nighttime, with the decline concentrated in the western part of the city. The complexity of the road network in this area means that the change in comfort is staggered and not an overall decline, and it is worth noting that although the day/night variation results in a number of significant increases and decreases in comfort in this area, overall the area still shows high levels of comfort at night, while the eastern part of the city and the fringes of the city away from the western center, although less comfortable during the day, show some improvement at night.
Figure A1. Visualization of road comfort.
Land 14 01551 g0a1
Regarding pedestrian perception of safety in the daytime hours from vehicle interference and fencing, pedestrians have a higher concern for the traffic flow and road isolation facilities, and complex traffic conditions are often accompanied by a higher probability of accidents. Dense traffic greatly reduces the pedestrian’s perception of safety, dense crowds increase the occurrence of accidents, which have a negative feedback effect, and fences and other protective measures indicate a significant positive correlation. As shown in Figure A2. According to statistics, in the daytime hours, the higher security area is mainly distributed in the streets of the secondary main road, and the area is denser, but the traffic flow is limited and there are more safety facilities along the street, while the main road with more traffic flow shows slightly weaker security.
The distribution of nighttime safety shows a radial pattern from the center to the edge of the river, and the formation mechanism consists of three dimensions: the spatial substrate formed by the gradient attenuation of light intensity, the overall decline in traffic flow to weaken the traffic interference effect, and the psychological compensation effect generated by the gathering of people. It is found that the core area along the river, with its high economic vitality and complex functional layout, forms a special zone of positive day–night safety gain, and its safety perception level breaks through the constraints of natural circadian rhythms, whereas the peripheral area is affected by the decline of illumination and the dispersion of pedestrian flow, and the nighttime safety index generally declines. This spatial heterogeneity confirms the role of economic activity elements in regulating the pedestrian perception mechanism and to a certain extent reveals the key influence of the synergy between the functional organization of the city and human spatio-temporal behavior of safety perception.
Figure A2. Visualization of road safety.
Land 14 01551 g0a2
The perceived convenience of walking on the street is mainly reflected by the number of POI facilities and public transport stops along the street, and we differentiated the data acquisition of POI facilities in different time periods for the different frequencies of facility use during daytime and nighttime. During daytime hours, daytime convenience perception is generally high in the western center of the city, while it is not satisfactory in the eastern part of the city, except for some small areas of streets. However, nighttime convenience perceptions declined in the western center, where the number of POI facilities had a greater impact on convenience at night due to the closure of the transport system, but in the extremely peripheral eastern region, convenience did not change significantly during the night, which may be related to the already low number of public transport facilities and points of interest, which failed to have a more significant impact on their convenience over time. Nonetheless, the perceived convenience in the city center is still better at night than the other areas thanks to its well-developed infrastructure and higher density of services (Figure A3).
Figure A3. Visualization of road convenience.
Land 14 01551 g0a3

References

  1. Batty, M. Modelling Cities as Dynamic Systems. Nature 1971, 231, 425–428. [Google Scholar] [CrossRef]
  2. Strom, E. The Street: A Quintessential Social Public Space. J. Urban Technol. 2015, 22, 139–141. [Google Scholar] [CrossRef]
  3. Yin, L.; Wang, Z. Measuring visual enclosure for street walkability: Using machine learning algorithms and Google Street View imagery. Appl. Geogr. 2016, 76, 147–153. [Google Scholar] [CrossRef]
  4. Zhou, H.; He, S.; Cai, Y.; Wang, M.; Su, S. Social inequalities in neighborhood visual walkability: Using street view imagery and deep learning technologies to facilitate healthy city planning. Sustain. Cities Soc. 2019, 50, 101605. [Google Scholar] [CrossRef]
  5. Liu, D.; Jiang, Y.; Wang, R.; Lu, Y. Establishing a citywide street tree inventory with street view images and computer vision techniques. Comput. Environ. Urban Syst. 2023, 100, 101924. [Google Scholar] [CrossRef]
  6. Kabisch, N.; Selsam, P.; Kirsten, T.; Lausch, A.; Bumberger, J. A multi-sensor and multi-temporal remote sensing approach to detect land cover change dynamics in heterogeneous urban landscapes. Ecol. Indic. 2019, 99, 273–282. [Google Scholar] [CrossRef]
  7. Yan, X.; Song, C.; Pei, T.; Wang, X.; Wu, M.; Liu, T.; Shu, H.; Chen, J. Revealing spatiotemporal matching patterns between traffic flux and road resources using big geodata—A case study of Beijing. Cities 2022, 127, 103754. [Google Scholar] [CrossRef]
  8. Tang, J.; Long, Y. Measuring visual quality of street space and its temporal variation: Methodology and its application in the Hutong area in Beijing. Landsc. Urban Plan. 2019, 191, 103436. [Google Scholar] [CrossRef]
  9. Wang, M.; Haworth, J.; Chen, H.; Liu, Y.; Shi, Z. Investigating the potential of crowdsourced street-level imagery in understanding the spatiotemporal dynamics of cities: A case study of walkability in Inner London. Cities 2024, 153, 105243. [Google Scholar] [CrossRef]
  10. Wang, H.-C.; Wang, Y.-Q.; Wang, X.; Yin, W.-X.; Yu, T.-C.; Xue, C.-H.; Wang, A.-J. Multimodal Machine Learning Guides Low Carbon Aeration Strategies in Urban Wastewater Treatment. Engineering 2024, 36, 51–62. [Google Scholar] [CrossRef]
  11. Xu, P.; Zhu, X.; Clifton, D.A. Multimodal Learning With Transformers: A Survey. IEEE Trans. Pattern Anal. Mach. Intell. 2023, 45, 12113–12132. [Google Scholar] [CrossRef]
  12. Zhang, F.; Salazar-Miranda, A.; Duarte, F.; Vale, L.; Hack, G.; Chen, M.; Liu, Y.; Batty, M.; Ratti, C. Urban Visual Intelligence: Studying Cities with Artificial Intelligence and Street-Level Imagery. Ann. Assoc. Am. Geogr. 2024, 114, 876–897. [Google Scholar] [CrossRef]
  13. Abley, S. Walkability Scoping Paper; Land Transport New Zealand: Wellington, New Zealand, 2005. Available online: https://www.livingstreets.org.nz/node/71 (accessed on 18 July 2022).
  14. Frank, L.D.; Andresen, M.A.; Schmid, T.L. Obesity relationships with community design, physical activity, and time spent in cars. Am. J. Prev. Med. 2004, 27, 87–96. [Google Scholar] [CrossRef]
  15. Wang, H.; Yang, Y. Neighbourhood walkability: A review and bibliometric analysis. Cities 2019, 93, 43–61. [Google Scholar] [CrossRef]
  16. De Vos, J.; Lättman, K.; van der Vlugt, A.-L.; Welsch, J.; Otsuka, N. Determinants and effects of perceived walkability: A literature review, conceptual model and research agenda. Transp. Rev. 2023, 43, 303–324. [Google Scholar] [CrossRef]
  17. Southworth, M. Designing the Walkable City. J. Urban Plan. Dev. 2005, 131, 246–257. [Google Scholar] [CrossRef]
  18. Grasser, G.; Van Dyck, D.; Titze, S.; Stronegger, W. Objectively measured walkability and active transport and weight-related outcomes in adults: A systematic review. Int. J. Public Health 2013, 58, 615–625. [Google Scholar] [CrossRef]
  19. Gebel, K.; Bauman, A.E.; Sugiyama, T.; Owen, N. Mismatch between perceived and objectively assessed neighborhood walkability attributes: Prospective relationships with walking and weight gain. Health Place 2011, 17, 519–524. [Google Scholar] [CrossRef]
  20. Chen, B.; Adimo, O.A.; Bao, Z. Assessment of aesthetic quality and multiple functions of urban green space from the users’ perspective: The case of Hangzhou Flower Garden, China. Landsc. Urban Plan. 2009, 93, 76–82. [Google Scholar] [CrossRef]
  21. Wang, L.; Han, X.; He, J.; Jung, T. Measuring residents’ perceptions of city streets to inform better street planning through deep learning and space syntax. ISPRS J. Photogramm. Remote Sens. 2022, 190, 215–230. [Google Scholar] [CrossRef]
  22. Lu, Y.; Chen, H.-M. Using google street view to reveal environmental justice: Assessing public perceived walkability in macroscale city. Landsc. Urban Plan. 2024, 244, 104995. [Google Scholar] [CrossRef]
  23. Zhang, F.; Zhou, B.; Liu, L.; Liu, Y.; Fung, H.H.; Lin, H.; Ratti, C. Measuring human perceptions of a large-scale urban region using machine learning. Landsc. Urban Plan. 2018, 180, 148–160. [Google Scholar] [CrossRef]
  24. Yao, Y.; Liang, Z.; Yuan, Z.; Liu, P.; Bie, Y.; Zhang, J.; Wang, R.; Wang, J.; Guan, Q. A human-machine adversarial scoring framework for urban perception assessment using street-view images. Int. J. Geogr. Inf. Sci. 2019, 33, 2363–2384. [Google Scholar] [CrossRef]
  25. Barthelemy, M. Modeling cities. C. R. Phys. 2019, 20, 293–307. [Google Scholar] [CrossRef]
  26. Monteiro, J.; Sousa, N.; Coutinho-Rodrigues, J.; Natividade-Jesus, E. Benchmarking real and ideal cities—A multicriteria analysis of city performance based on urban form. Cities 2024, 150, 105040. [Google Scholar] [CrossRef]
  27. Phillis, Y.A.; Kouikoglou, V.S.; Verdugo, C. Urban sustainability assessment and ranking of cities. Comput. Environ. Urban Syst. 2017, 64, 254–265. [Google Scholar] [CrossRef]
  28. Chen, Y.; Yu, B.; Shu, B.; Yang, L.; Wang, R. Exploring the spatiotemporal patterns and correlates of urban vitality: Temporal and spatial heterogeneity. Sustain. Cities Soc. 2023, 91, 104440. [Google Scholar] [CrossRef]
  29. Wang, Y.; Niu, Y.; Li, M.; Yu, Q.; Chen, W. Spatial structure and carbon emission of urban agglomerations: Spatiotemporal characteristics and driving forces. Sustain. Cities Soc. 2022, 78, 103600. [Google Scholar] [CrossRef]
  30. Guo, A.; Yang, J.; Xiao, X.; Xia, J.; Jin, C.; Li, X. Influences of urban spatial form on urban heat island effects at the community level in China. Sustain. Cities Soc. 2020, 53, 101972. [Google Scholar] [CrossRef]
  31. Hou, H.; Longyang, Q.; Su, H.; Zeng, R.; Xu, T.; Wang, Z.-H. Prioritizing environmental determinants of urban heat islands: A machine learning study for major cities in China. Int. J. Appl. Earth Obs. Geoinf. 2023, 122, 103411. [Google Scholar] [CrossRef]
  32. Chakraborty, T.; Lee, X. A simplified urban-extent algorithm to characterize surface urban heat islands on a global scale and examine vegetation control on their spatiotemporal variability. Int. J. Appl. Earth Obs. Geoinf. 2019, 74, 269–280. [Google Scholar] [CrossRef]
  33. Wang, X.; Zhang, Y.; Yu, D.; Qi, J.; Li, S. Investigating the spatiotemporal pattern of urban vibrancy and its determinants: Spatial big data analyses in Beijing, China. Land Use Policy 2022, 119, 106162. [Google Scholar] [CrossRef]
  34. Ouyang, J.; Fan, H.; Wang, L.; Zhu, D.; Yang, M. Revealing urban vibrancy stability based on human activity time-series. Sustain. Cities Soc. 2022, 85, 104053. [Google Scholar] [CrossRef]
  35. Pozoukidou, G.; Chatziyiannaki, Z. 15-Minute City: Decomposing the New Urban Planning Eutopia. Sustainability 2021, 13, 928. [Google Scholar] [CrossRef]
  36. Moreno, C.; Allam, Z.; Chabaud, D.; Gall, C.; Pratlong, F. Introducing the “15-Minute City”: Sustainability, Resilience and Place Identity in Future Post-Pandemic Cities. Smart Cities 2021, 4, 93–111. [Google Scholar] [CrossRef]
  37. Zakariasson, A. A Study of the 15-Minute City Concept: Identifying Strengths, Risks and Challenges Through Imagining the Implementation of the 15-Minute City Concept in Munich. Master’s Thesis, KTH Royal Institute of Technology, Stockholm, Sweden, 2022. Available online: https://urn.kb.se/resolve?urn=urn:nbn:se:kth:diva-315750 (accessed on 18 July 2022).
  38. Allam, Z.; Khavarian-Garmsir, A.R.; Lassaube, U.; Chabaud, D.; Moreno, C. Mapping the Implementation Practices of the 15-Minute City. Smart Cities 2024, 7, 2094–2109. [Google Scholar] [CrossRef]
  39. Logan, T.; Hobbs, M.; Conrow, L.; Reid, N.; Young, R.; Anderson, M. The x-minute city: Measuring the 10, 15, 20-minute city and an evaluation of its use for sustainable urban design. Cities 2022, 131, 103924. [Google Scholar] [CrossRef]
  40. Sabesan, L.; Meetiyagoda, L.; Rathnasekara, S. Landmarks and walkability: Wayfinding during nighttime in a tourism-based city. Case study of Jaffna, Sri Lanka. GeoJournal 2024, 89, 212. [Google Scholar] [CrossRef]
  41. Zhao, M.; Cheng, C.; Zhou, Y.; Li, X.; Shen, S.; Song, C. A global dataset of annual urban extents (1992–2020) from harmo-nized nighttime lights. Earth Syst. Sci. Data 2022, 14, 517–534. Available online: https://essd.copernicus.org/articles/14/517/2022/ (accessed on 18 July 2022). [CrossRef]
  42. Zheng, Q.; Seto, K.C.; Zhou, Y.; You, S.; Weng, Q. Nighttime light remote sensing for urban applications: Progress, challenges, and prospects. ISPRS J. Photogramm. Remote Sens. 2023, 202, 125–141. [Google Scholar] [CrossRef]
  43. Wu, C.; Zhao, M.; Ye, Y. Measuring urban nighttime vitality and its relationship with urban spatial structure: A data-driven approach. Environ. Plan. B Urban Anal. City Sci. 2022, 50, 130–145. [Google Scholar] [CrossRef]
  44. D’aCci, L. Aesthetical cognitive perceptions of urban street form. Pedestrian preferences towards straight or curvy route shapes. J. Urban Des. 2019, 24, 896–912. [Google Scholar] [CrossRef]
  45. Ball, K.; Baumanb, A.; Lesliec, E.; Owenc, N. Perceived Environmental Aesthetics and Convenience and Company Are Associated with Walking for Exercise among Australian Adults. Prev. Med. 2001, 33, 434–440. [Google Scholar] [CrossRef] [PubMed]
  46. Humpel, N.; Owen, N.; Iverson, D.; Leslie, E.; Bauman, A. Perceived environment attributes, residential location, and walking for particular purposes. Am. J. Prev. Med. 2004, 26, 119–125. [Google Scholar] [CrossRef]
  47. Zhao, M.; Zhou, Y.; Li, X.; Cao, W.; He, C.; Yu, B.; Li, X.; Elvidge, C.D.; Cheng, W.; Zhou, C. Applications of Satellite Remote Sensing of Nighttime Light Observations: Advances, Challenges, and Perspectives. Remote Sens. 2019, 11, 1971. [Google Scholar] [CrossRef]
  48. Huang, X.; Liang, H.; Zeng, L.; White, M. Evaluating urban walkability: A comprehensive review of tools and techniques. Archit. Sci. Rev. 2024, 68, 263–277. [Google Scholar] [CrossRef]
  49. Deng, C.; Dong, X.; Wang, H.; Lin, W.; Wen, H.; Frazier, J.; Ho, H.C.; Holmes, L. A Data-Driven Framework for Walkability Measurement with Open Data: A Case Study of Triple Cities, New York. ISPRS Int. J. Geo-Inf. 2020, 9, 36. [Google Scholar] [CrossRef]
  50. Brownson, R.C.; Hoehner, C.M.; Day, K.; Forsyth, A.; Sallis, J.F. Measuring the Built Environment for Physical Activity. Am. J. Prev. Med. 2009, 36, S99–S123.e12. [Google Scholar] [CrossRef]
  51. Joshi, A.; Kale, S.; Chandel, S.; Pal, D.K. Likert Scale: Explored and Explained. Br. J. Appl. Sci. Technol. 2015, 7, 396–403. [Google Scholar] [CrossRef]
  52. Cheng, B.; Misra, I.; Schwing, A.G.; Kirillov, A.; Girdhar, R. Masked-attention Mask Transformer for Universal Image Segmentation. In Proceedings of the 2022 IEEE/CVF Conference on Computer Vision and Pattern Recognition (CVPR), New Orleans, LA, USA, 18–24 June 2022; pp. 1280–1289. [Google Scholar]
  53. Zhou, D.; Qian, Y.; Ma, Y.; Fan, Y.; Yang, J.; Tan, F. Low illumination image enhancement based on multi-scale CycleGAN with deep residual shrinkage. J. Intell. Fuzzy Syst. 2022, 42, 2383–2395. [Google Scholar] [CrossRef]
  54. Guzman, L.A.; Oviedo, D.; Cantillo-Garcia, V.A. Is proximity enough? A critical analysis of a 15-minute city considering individual perceptions. Cities 2024, 148, 104882. [Google Scholar] [CrossRef]
  55. Chan, J.Y.-L.; Leow, S.M.H.; Bea, K.T.; Cheng, W.K.; Phoong, S.W.; Hong, Z.-W.; Chen, Y.-L. Mitigating the Multicollinearity Problem and Its Machine Learning Approach: A Review. Mathematics 2022, 10, 1283. [Google Scholar] [CrossRef]
  56. Radford, A.; Kim, J.W.; Hallacy, C.; Ramesh, A.; Goh, G.; Agarwal, S.; Sastry, G.; Askell, A.; Mishkin, P.; Clark, J.; et al. Learning Transferable Visual Models From Natural Language Supervision. In Proceedings of the International Conference on Machine Learning, Vienna, Austria, 18–24 July 2021. [Google Scholar]
  57. Ly, A.; Marsman, M.; Wagenmakers, E. Analytic posteriors for Pearson’s correlation coefficient. Stat. Neerl. 2018, 72, 4–13. [Google Scholar] [CrossRef] [PubMed]
Figure 1. Study area and location.
Land 14 01551 g001
Figure 2. Framework for the phases of the study.
Land 14 01551 g002
Figure 3. Visualization of walking perception score for circadian rhythm time periods.
Land 14 01551 g003
Figure 4. Walking time change curve.
Land 14 01551 g004
Figure 5. Spatio-temporal clustering results for walkability.
Land 14 01551 g005
Figure 6. Abnormal baseline modeling and comparison with normal baseline modeling.
Land 14 01551 g006
Table 1. Quantitative indicators of street walking quality.
Quantitative Indicators
Green visual index P g r e e n e r y Sky view factor P s k y o p e n n e s s Relative pavement width P r e l a t i v e w i d t h Pavement fence P f e n c e
Population density C p e r s o n Vehicle interference V I Quantity of rainfall l C r a i n f a l l Lighting index P l i g h t
Number of bus stops B N Number of POI facilities P F
Table 2. Quantitative formulae for indicators based on elements of visual information.
FormulasInterpretation
P g r e e n e r y = i = 1 4 G P i / i = 1 4 P i G P i is the number of green pixels in the image, P i is the total number of pixels in the image.
P s k y o p e n n e s s = i = 1 4 S P i / i = 1 4 P i S P i is the number of sky pixels in the image.
P r e l a t i v e w i d t h = i = 1 4 P P i / i = 1 4 R P i P P i is the number of sidewalk pixels in the image, RP i is the number of road pixels in the image.
P f e n c e = i = 1 4 F P i / i = 1 4 P i F P i is the number of fence pixels in the image.
Table 3. Indicator quantification formulae based on elements of live information.
FormulasInterpretation
C r a i n f a l l = N r a i n f a l l t × S N r i a n f a l l t is the unit rainfall at time t; S is the sidewalk area.
C p e r s o n = N p e r s o n t N p e r s o n t is the traffic at time t.
V I = 1 1 n i = 1 n C n + 1 n i = 1 n T n + 1 n i = 1 n B u n + 1 n i = 1 n M n C n , B u n ,   T n ,   a n d   M n represent the traffic volume of cars, buses, trucks, and motorcycles in t time.
B N = N s t a t i o n X N s t a t i o n x is the number of bus stops within the buffer of the Xth sampling point.
F P = N P O I X / A r e a m 2 N P O I x is the number of facilities within the Xth sampling point buffer.
A r e a m 2 is the area of the buffer zone.
Table 4. Pixel category percentage result.
IndexColumnMaxMinMeanStd Dev
1sky0.6990.00119.84010.575
2green0.4600.0015.8805.756
3road0.1950.0014.4763.328
4fence0.1880.0012.0322.840
5sidewalk0.1320.0010.8571.373
Table 5. Pearson correlation index analysis results.
Sky View FactorGreen Visual
Index
Lighting IndexQuantity of RainfallVehicle InterferenceNumber of POI FacilitiesPopulation
Density
Number of Bus StopsRelative Pavement WidthPavement Fence
Sky view factor1 (0.000 ***)0.544 (0.000 ***)−0.19 (0.058 *)−0.119 (0.237)0.093 (0.359)−0.217 (0.030 **)−0.077 (0.445)−0.156 (0.122)0.066 (0.512)−0.074 (0.466)
Green visual index0.544 (0.000 ***)1 (0.000 ***)0.067 (0.505)−0.096 (0.344)0.066 (0.512)−0.18 (0.073 *)0.2 (0.046 **)−0.018 (0.858)−0.098 (0.333)−0.057 (0.576)
Lighting index−0.19 (0.058 *)0.067 (0.505)1 (0.000 ***)0.032 (0.748)0.123 (0.222)0.417 (0.000 ***)0.117 (0.247)0.548 (0.000 ***)−0.058 (0.569)−0.009 (0.926)
Quantity of rainfall−0.119 (0.237)−0.096 (0.344)0.032 (0.748)1 (0.000 ***)−0.149 (0.140)−0.048 (0.635)−0.049 (0.630)0.045 (0.658)0.011 (0.914)0.018 (0.857)
Vehicle interference0.093 (0.359)0.066 (0.512)0.123 (0.222)−0.149 (0.140)1 (0.000 ***)0.213 (0.033 **)0.103 (0.307)0.099 (0.325)0.031 (0.760)−0.188 (0.061 *)
Number of POI facilities−0.217 (0.030 **)−0.18 (0.073 *)0.417 (0.000 ***)−0.048 (0.635)0.213 (0.033 **)1 (0.000 ***)0.226 (0.024 **)0.146 (0.147)0.045 (0.658)−0.08 (0.428)
Population density−0.077 (0.445)0.2 (0.046 **)0.117 (0.247)−0.049 (0.630)0.103 (0.307)0.226 (0.024 **)1 (0.000 ***)−0.003 (0.975)0.003 (0.976)−0.039 (0.702)
Number of bus stops−0.156 (0.122)−0.018 (0.858)0.548 (0.000 ***)0.045 (0.658)0.099 (0.325)0.146 (0.147)−0.003 (0.975)1 (0.000 ***)−0.074 (0.466)0.124 (0.219)
Relative pavement width0.066 (0.512)−0.098 (0.333)−0.058 (0.569)0.011 (0.914)0.031 (0.760)0.045 (0.658)0.003 (0.976)−0.074 (0.466)1 (0.000 ***)−0.679 (0.000 ***)
Pavement fence−0.074 (0.466)−0.057 (0.576)−0.009 (0.926)0.018 (0.857)−0.188 (0.061 *)−0.08 (0.428)−0.039 (0.702)0.124 (0.219)−0.679 (0.000 ***)1 (0.000 ***)
Note: ***, **, and * represent 1%, 5%, and 10% significance levels, respectively.
Table 6. Backbone network performance analysis results.
Model ArchitectureParamsAccuracy
RN101278 M0.8810
RN50 × 16630 M0.8857
ViT-B/32338 M0.9663
ViT-B/16335 M0.9532
ViT-L/14@336px891 M0.8481
Table 7. Model performance evaluation results.
ModelR2F Test
DayNightDayNight
Statistical Regression ModelRidge Regression0.5030.50110.1078.932
Stepwise Regression0.5340.53427.19527.195
R2 (Train/Test)MAPE (Train/Test)MAE (Train/Test)
DayNightDayNightDayNight
Machine Learning Regression ModelRandom Forest Regression0.903/0.7540.910/0.7836.751/11.11513.342/14.80.839/2.2380.057/0.083
XGBoost Regression0.964/0.710.961/0.6874.173/10.0878.874/23.7860.445/1.5780.036/0.112
Table 8. Visualization of indicators characterizing diurnal variation in walkability.
Baseline ModelNight Attenuation IndexDawn Recovery RateEntropy of Rhythmic Fluctuations
Normal0.3880.3460.586
Abnormal-A0.2810.3250.455
Abnormal-B0.4930.4810.750
Disclaimer/Publisher’s Note: The statements, opinions and data contained in all publications are solely those of the individual author(s) and contributor(s) and not of MDPI and/or the editor(s). MDPI and/or the editor(s) disclaim responsibility for any injury to people or property resulting from any ideas, methods, instructions or products referred to in the content.