
Multimodal Data-Driven Hourly Dynamic Assessment of Walkability on Urban Streets and Exploration of Regulatory Mechanisms for Diurnal Changes: A Case Study of Wuhan City


Abstract
1. Introduction
2. Literature Review
2.1. Research Process for Street Walkability
2.2. From Macro to Micro, Dynamic Assessment of Urban Systems
2.3. Challenges in the Study of Street Diurnal Dynamics
3. Study Area
4. Materials and Methods
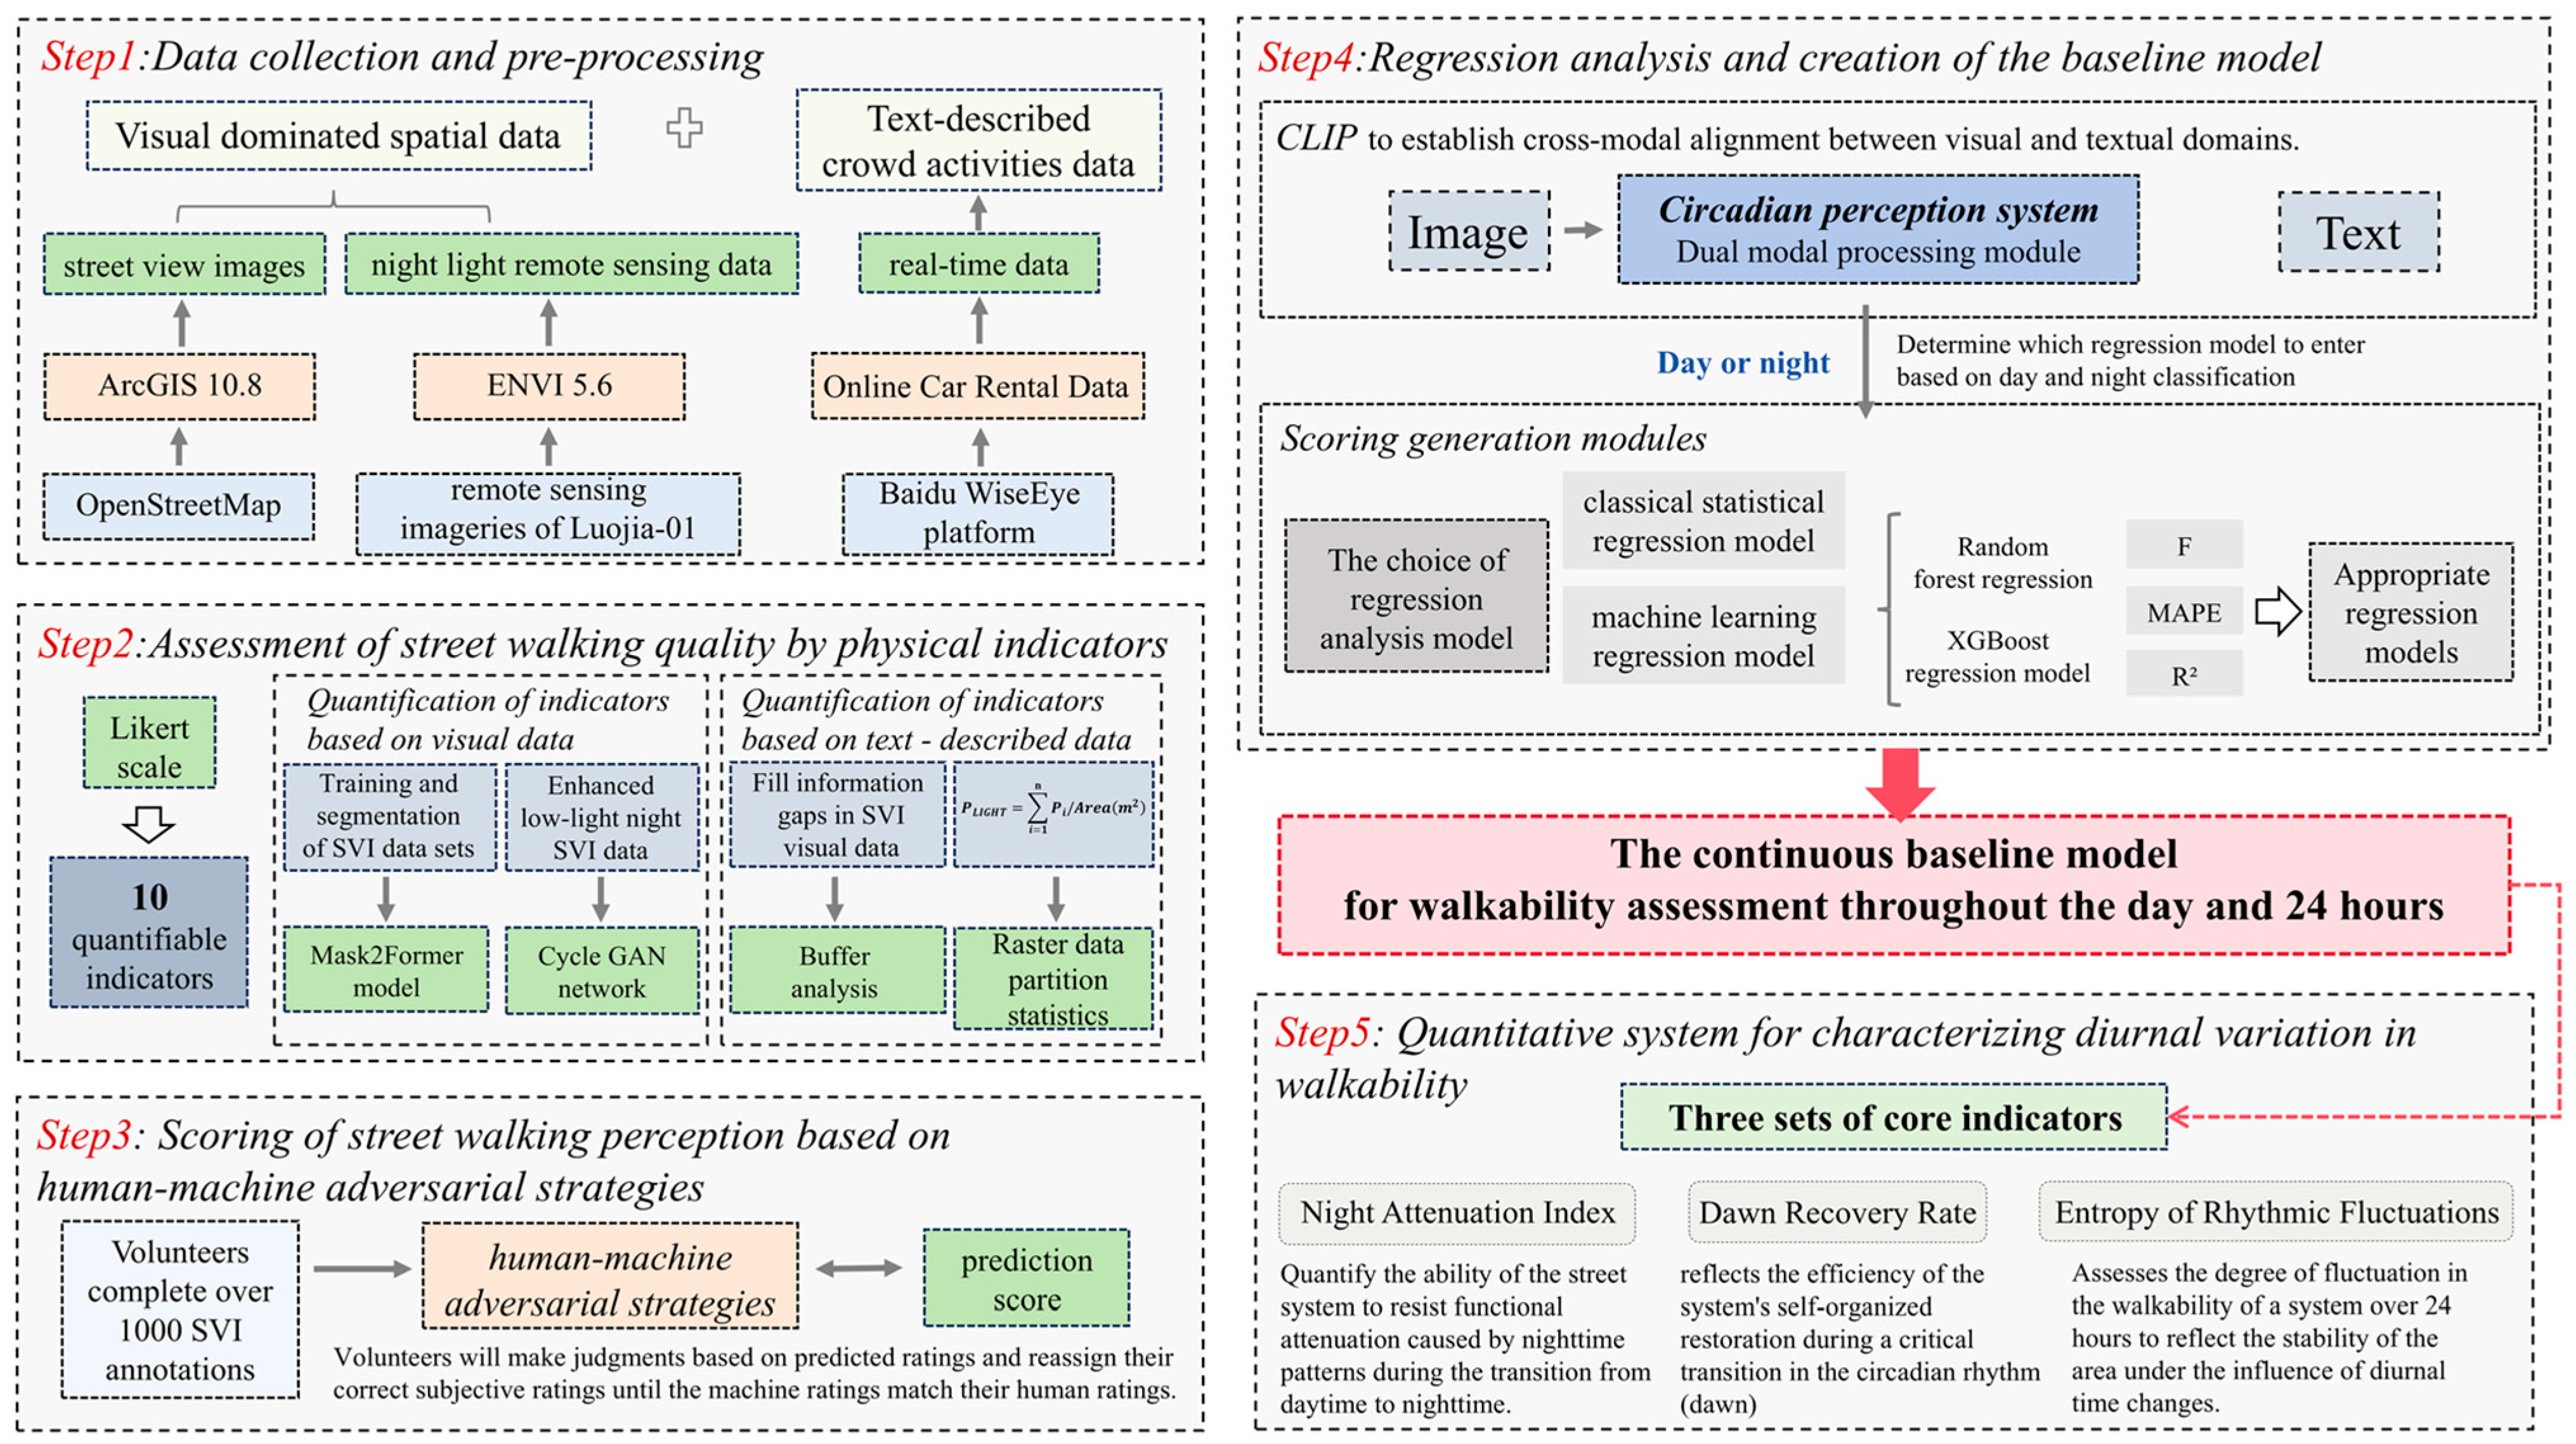
4.1. Data Collection and Pre-Processing
4.1.1. Visual-Dominated Spatial Data
4.1.2. Text-Described Crowd Activities Data
4.2. Assessment of Street Walking Quality by Physical Indicators
4.2.1. Selection of Physical Indicators
4.2.2. Quantification of Indicators Based on Visual Data
4.2.3. Quantification of Indicators Based on Text-Described Data
4.3. Scoring of Street Walking Perception Based on Human–Machine Adversarial Strategies
4.4. Regression Analysis and Creation of the Baseline Model
4.4.1. Selection of Regression Analysis Models
4.4.2. CLIP-Based Multi-Temporal Walking Score Generation Model
4.5. Quantitative System for Characterizing Diurnal Variation in Walkability
5. Results and Discussion
5.1. Description and Analysis of Walking Quality
5.1.1. Pixel-Level Quantification Results for Visual Data
5.1.2. Correlation Analysis Between Walking Quality Factors
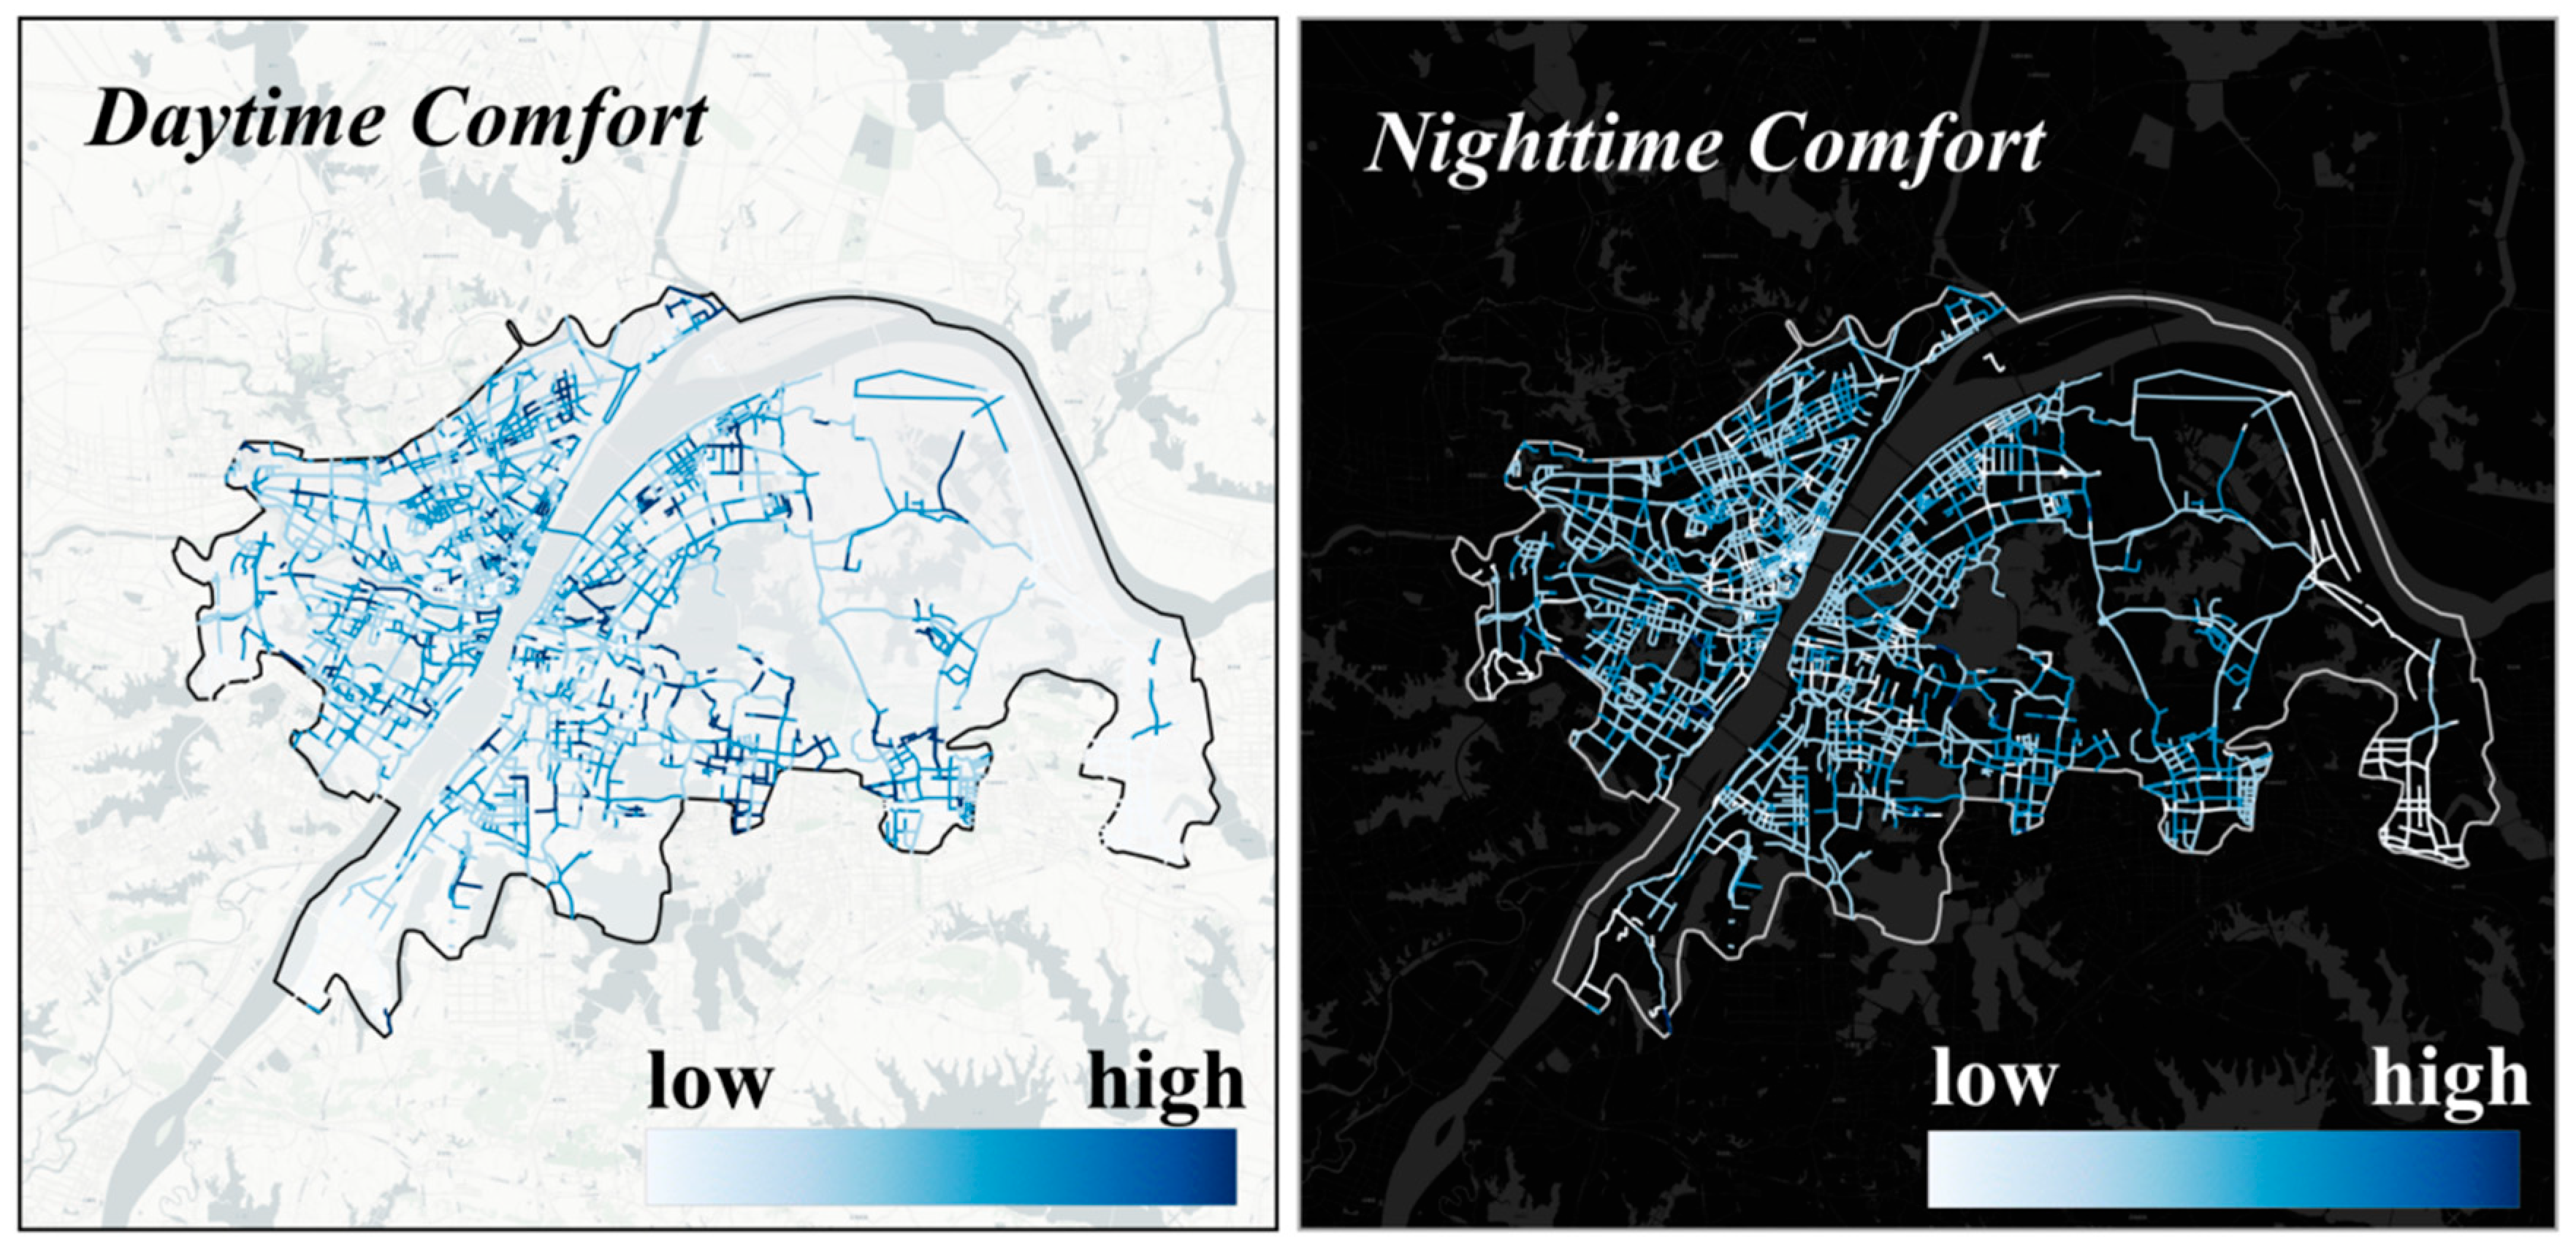
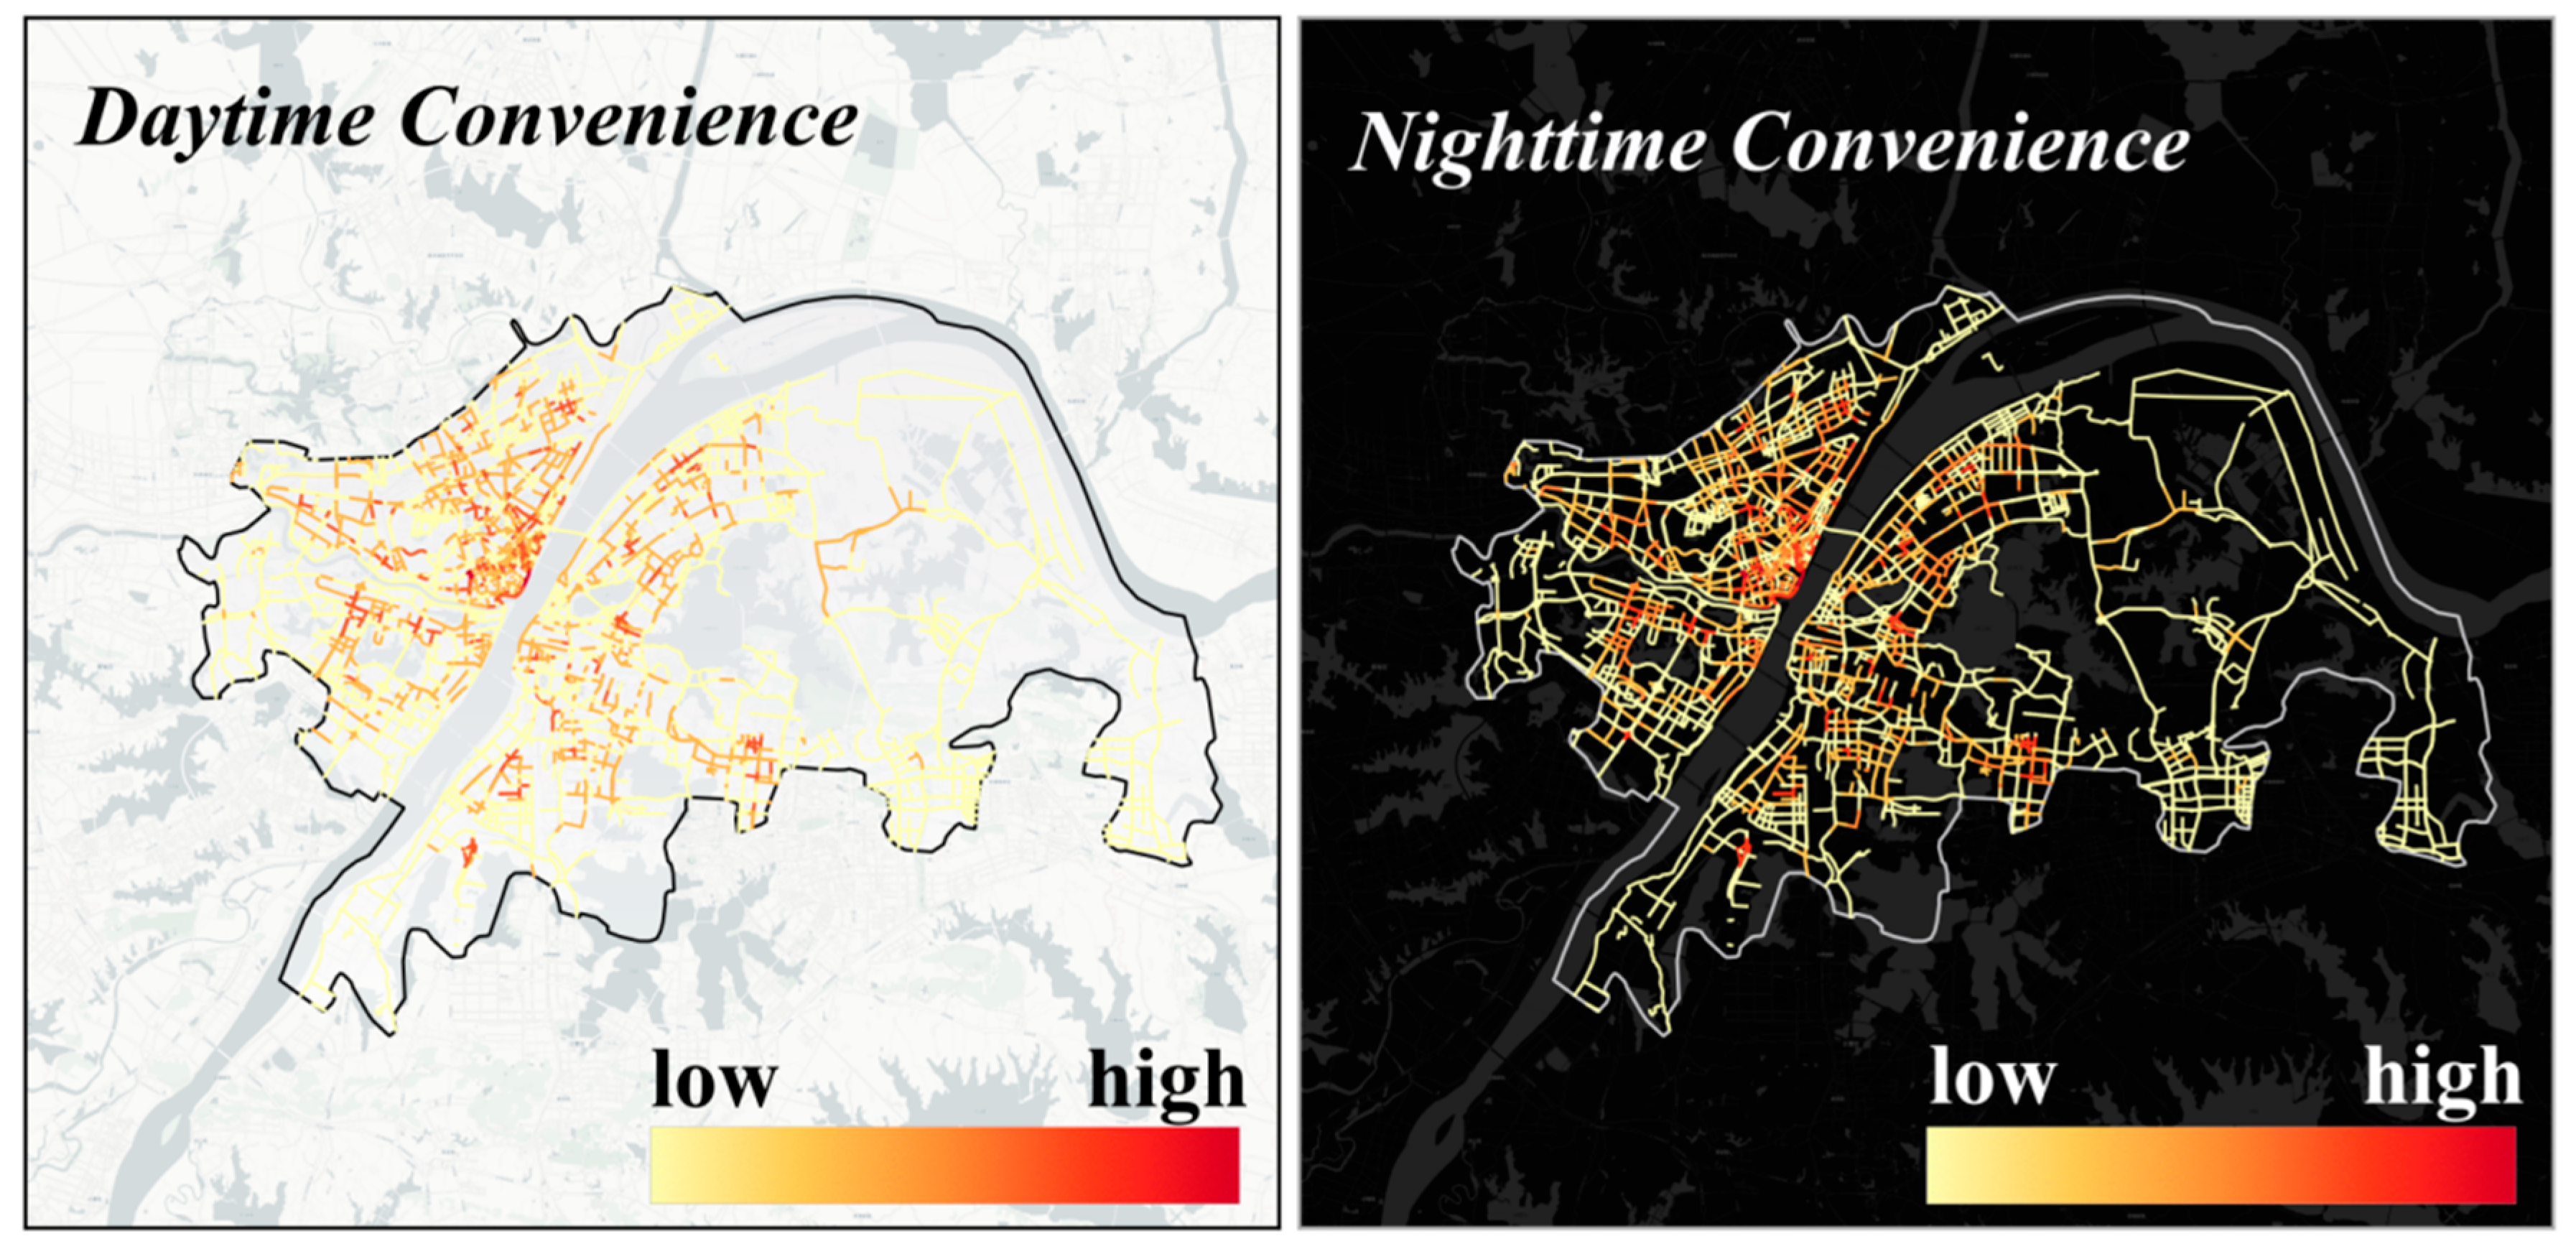
5.2. Geo-Visualization of Walking Perception Scores
5.3. Predictive Model Performance Evaluation and Selection Results
5.3.1. Performance Analysis of CLIP-Based Circadian Judgment Module
5.3.2. Performance Evaluation and Selection Results of Computational Modules
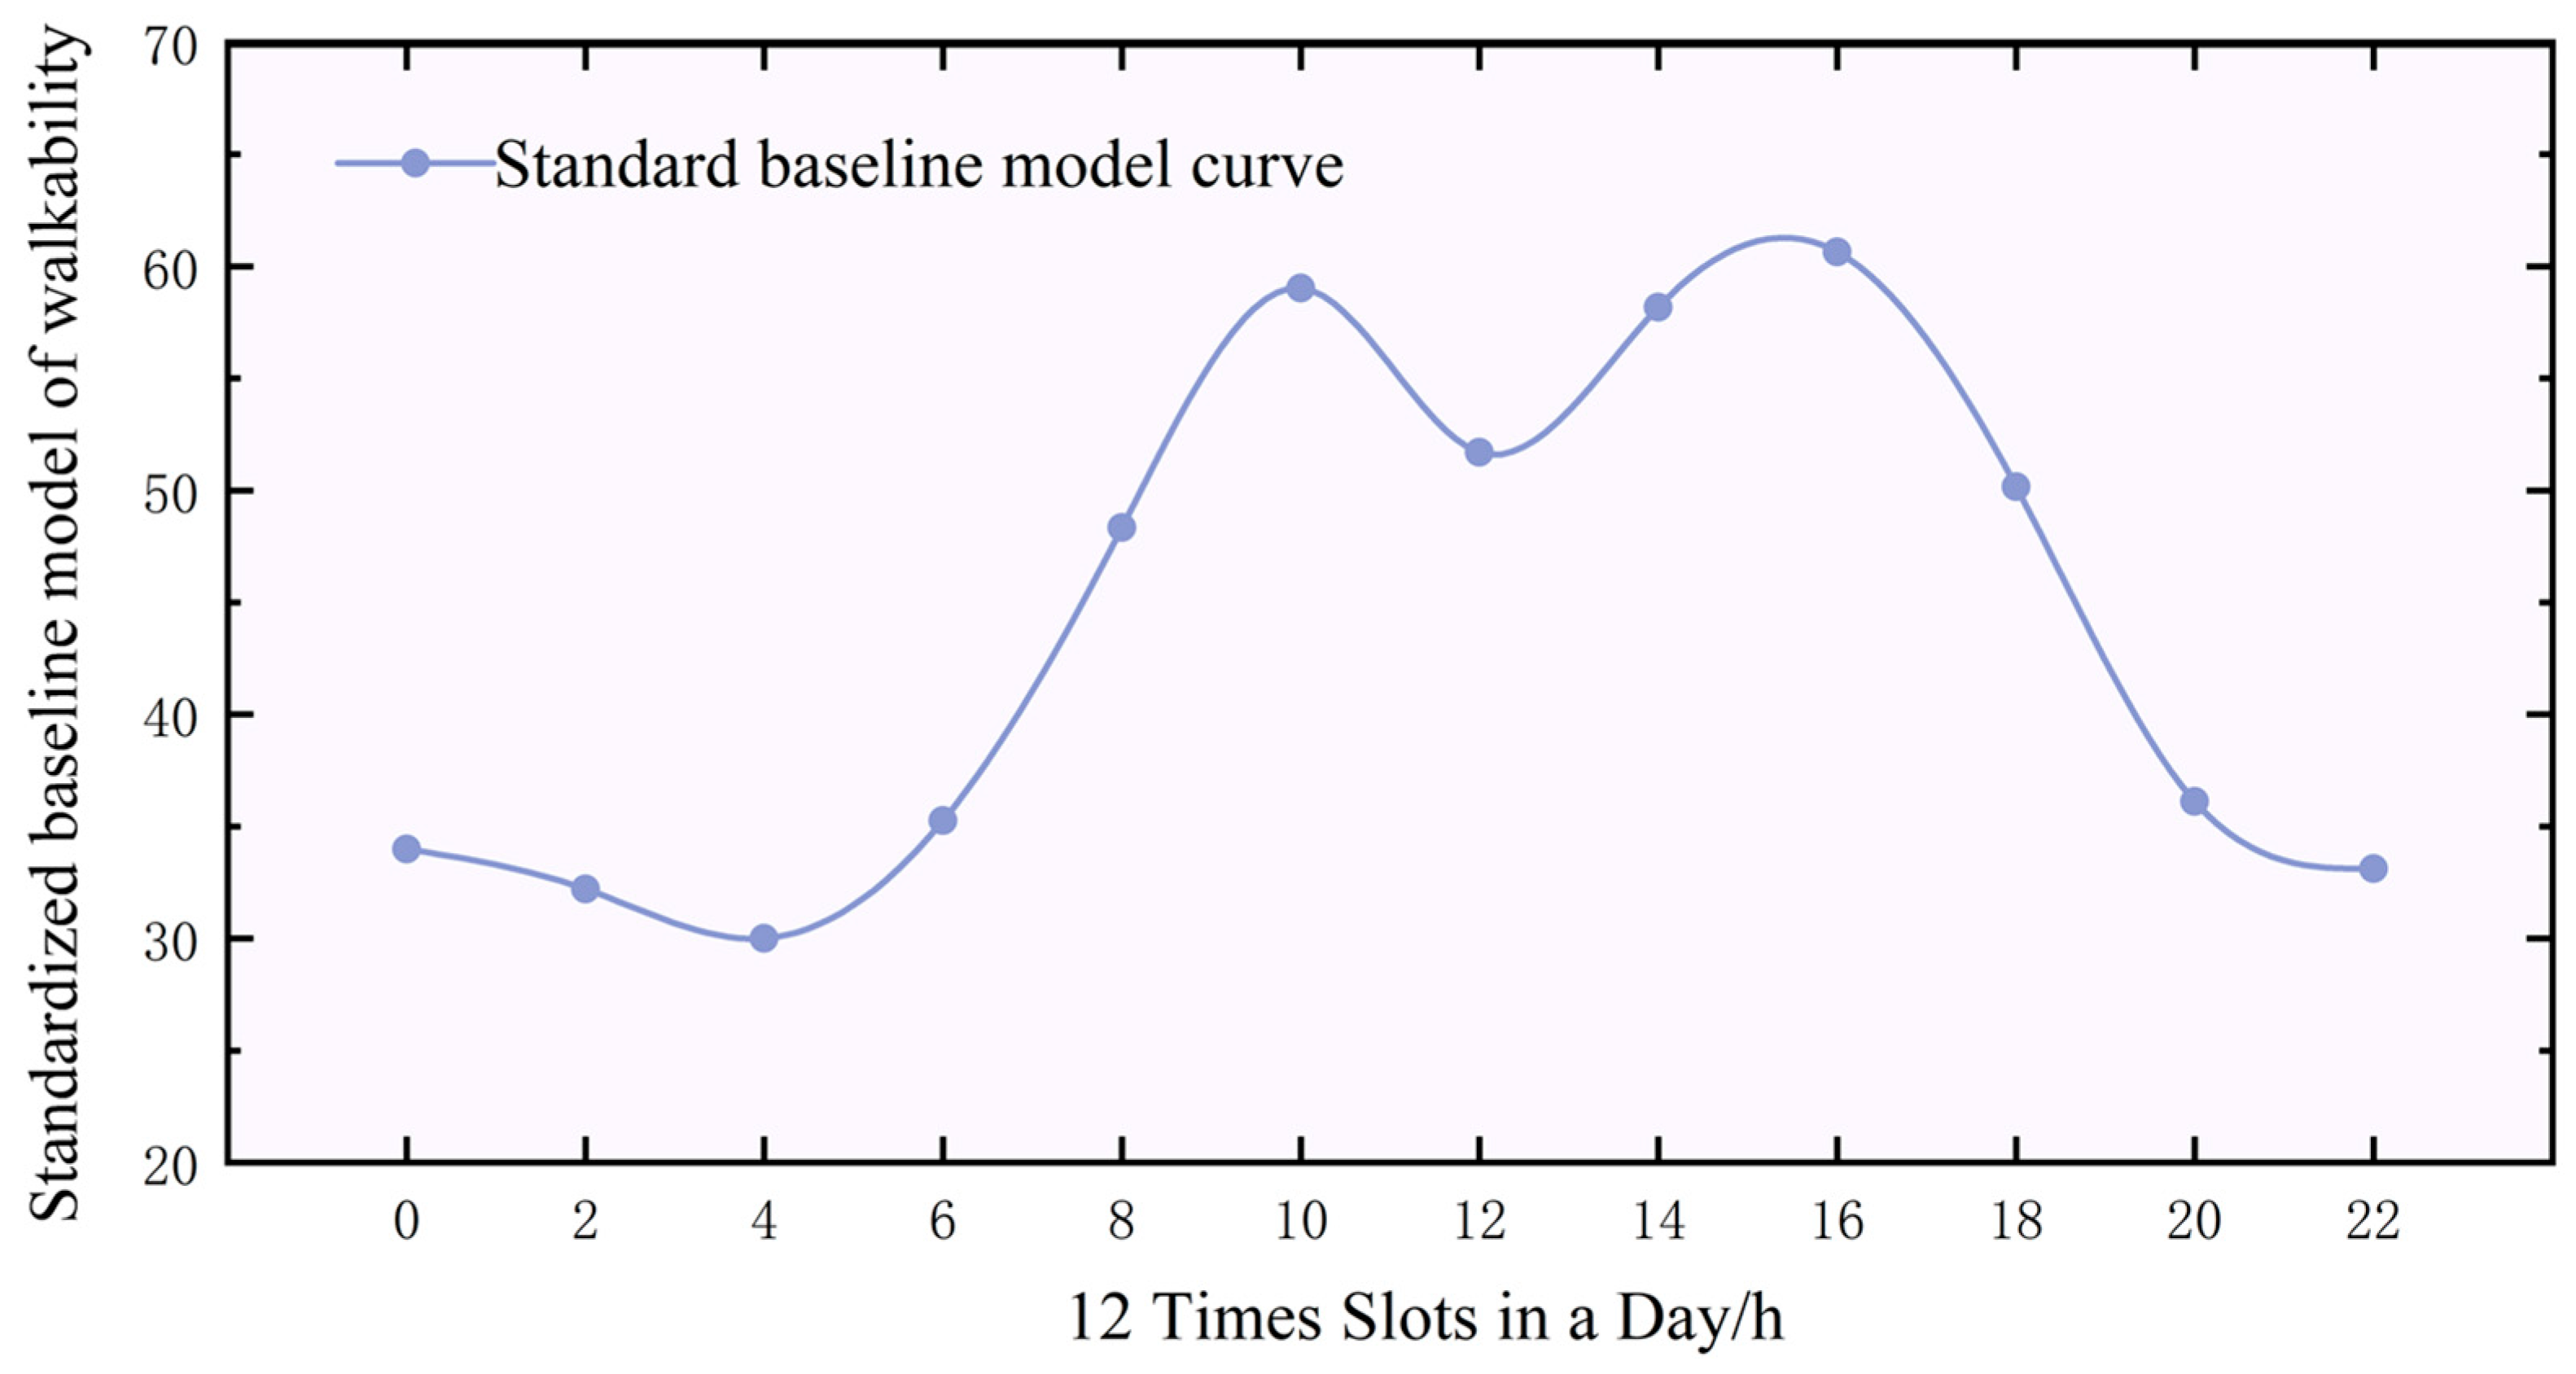
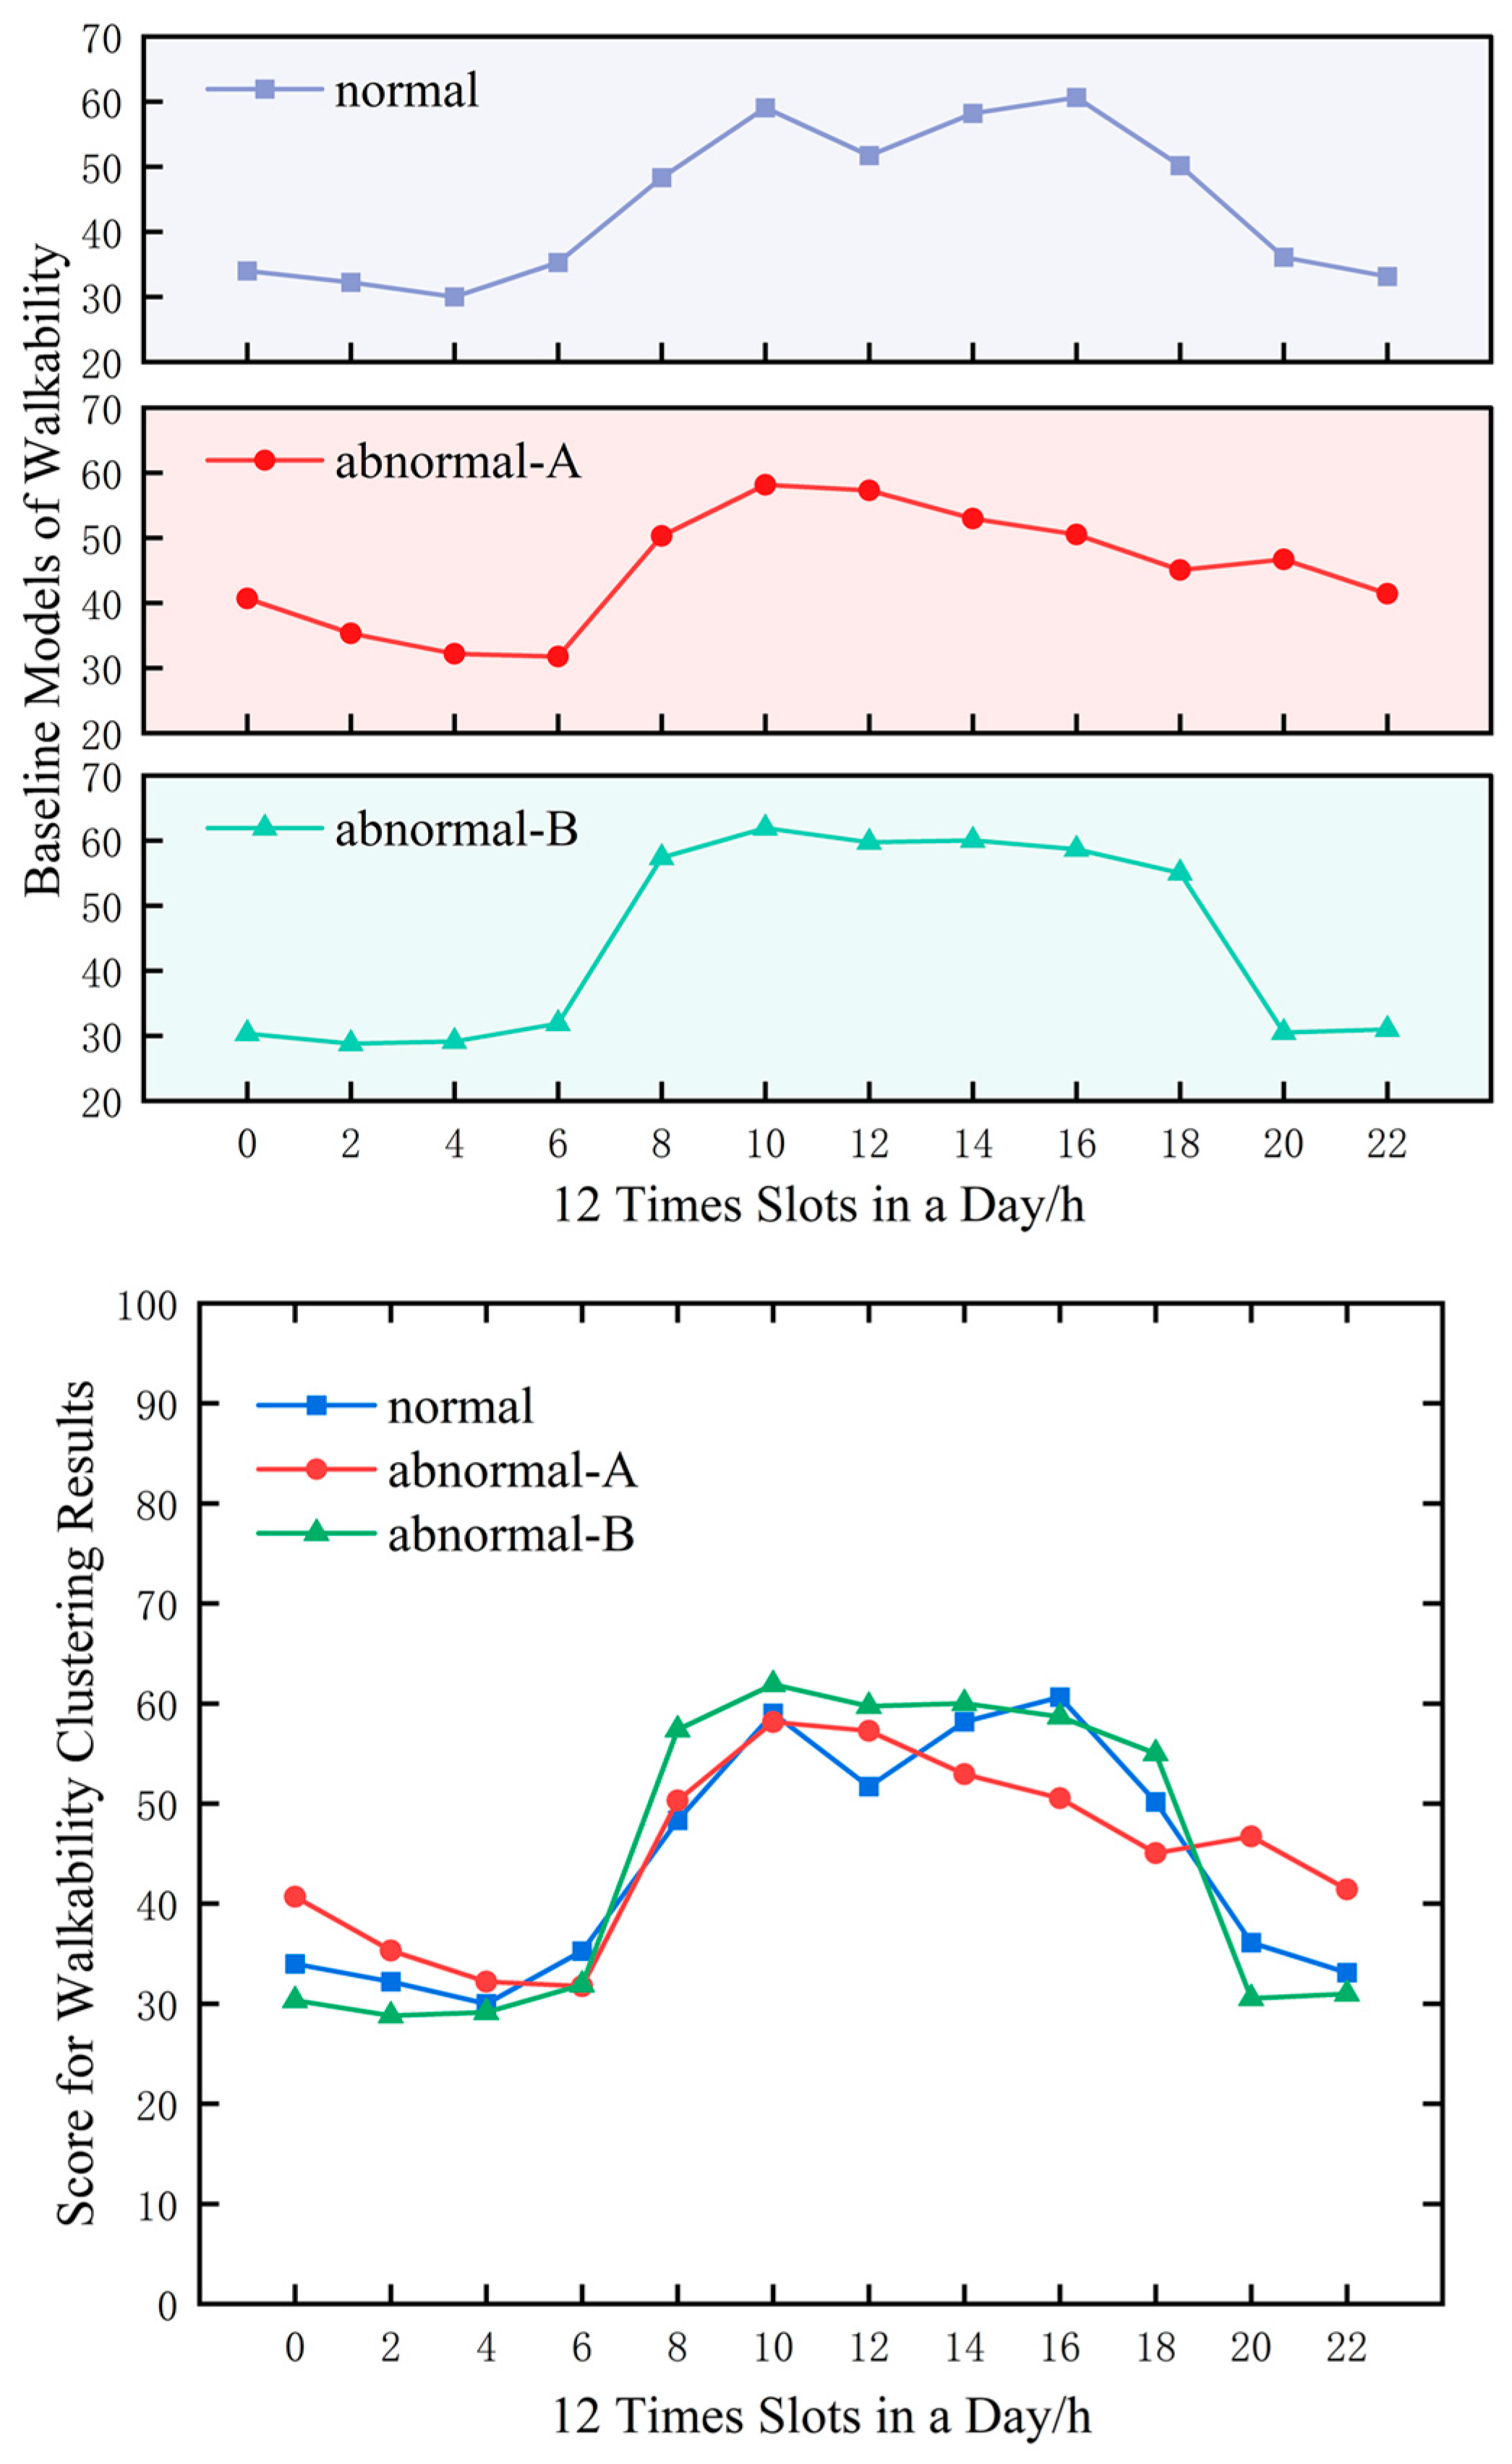
5.4. Walkability Baseline Model Generation and Analysis
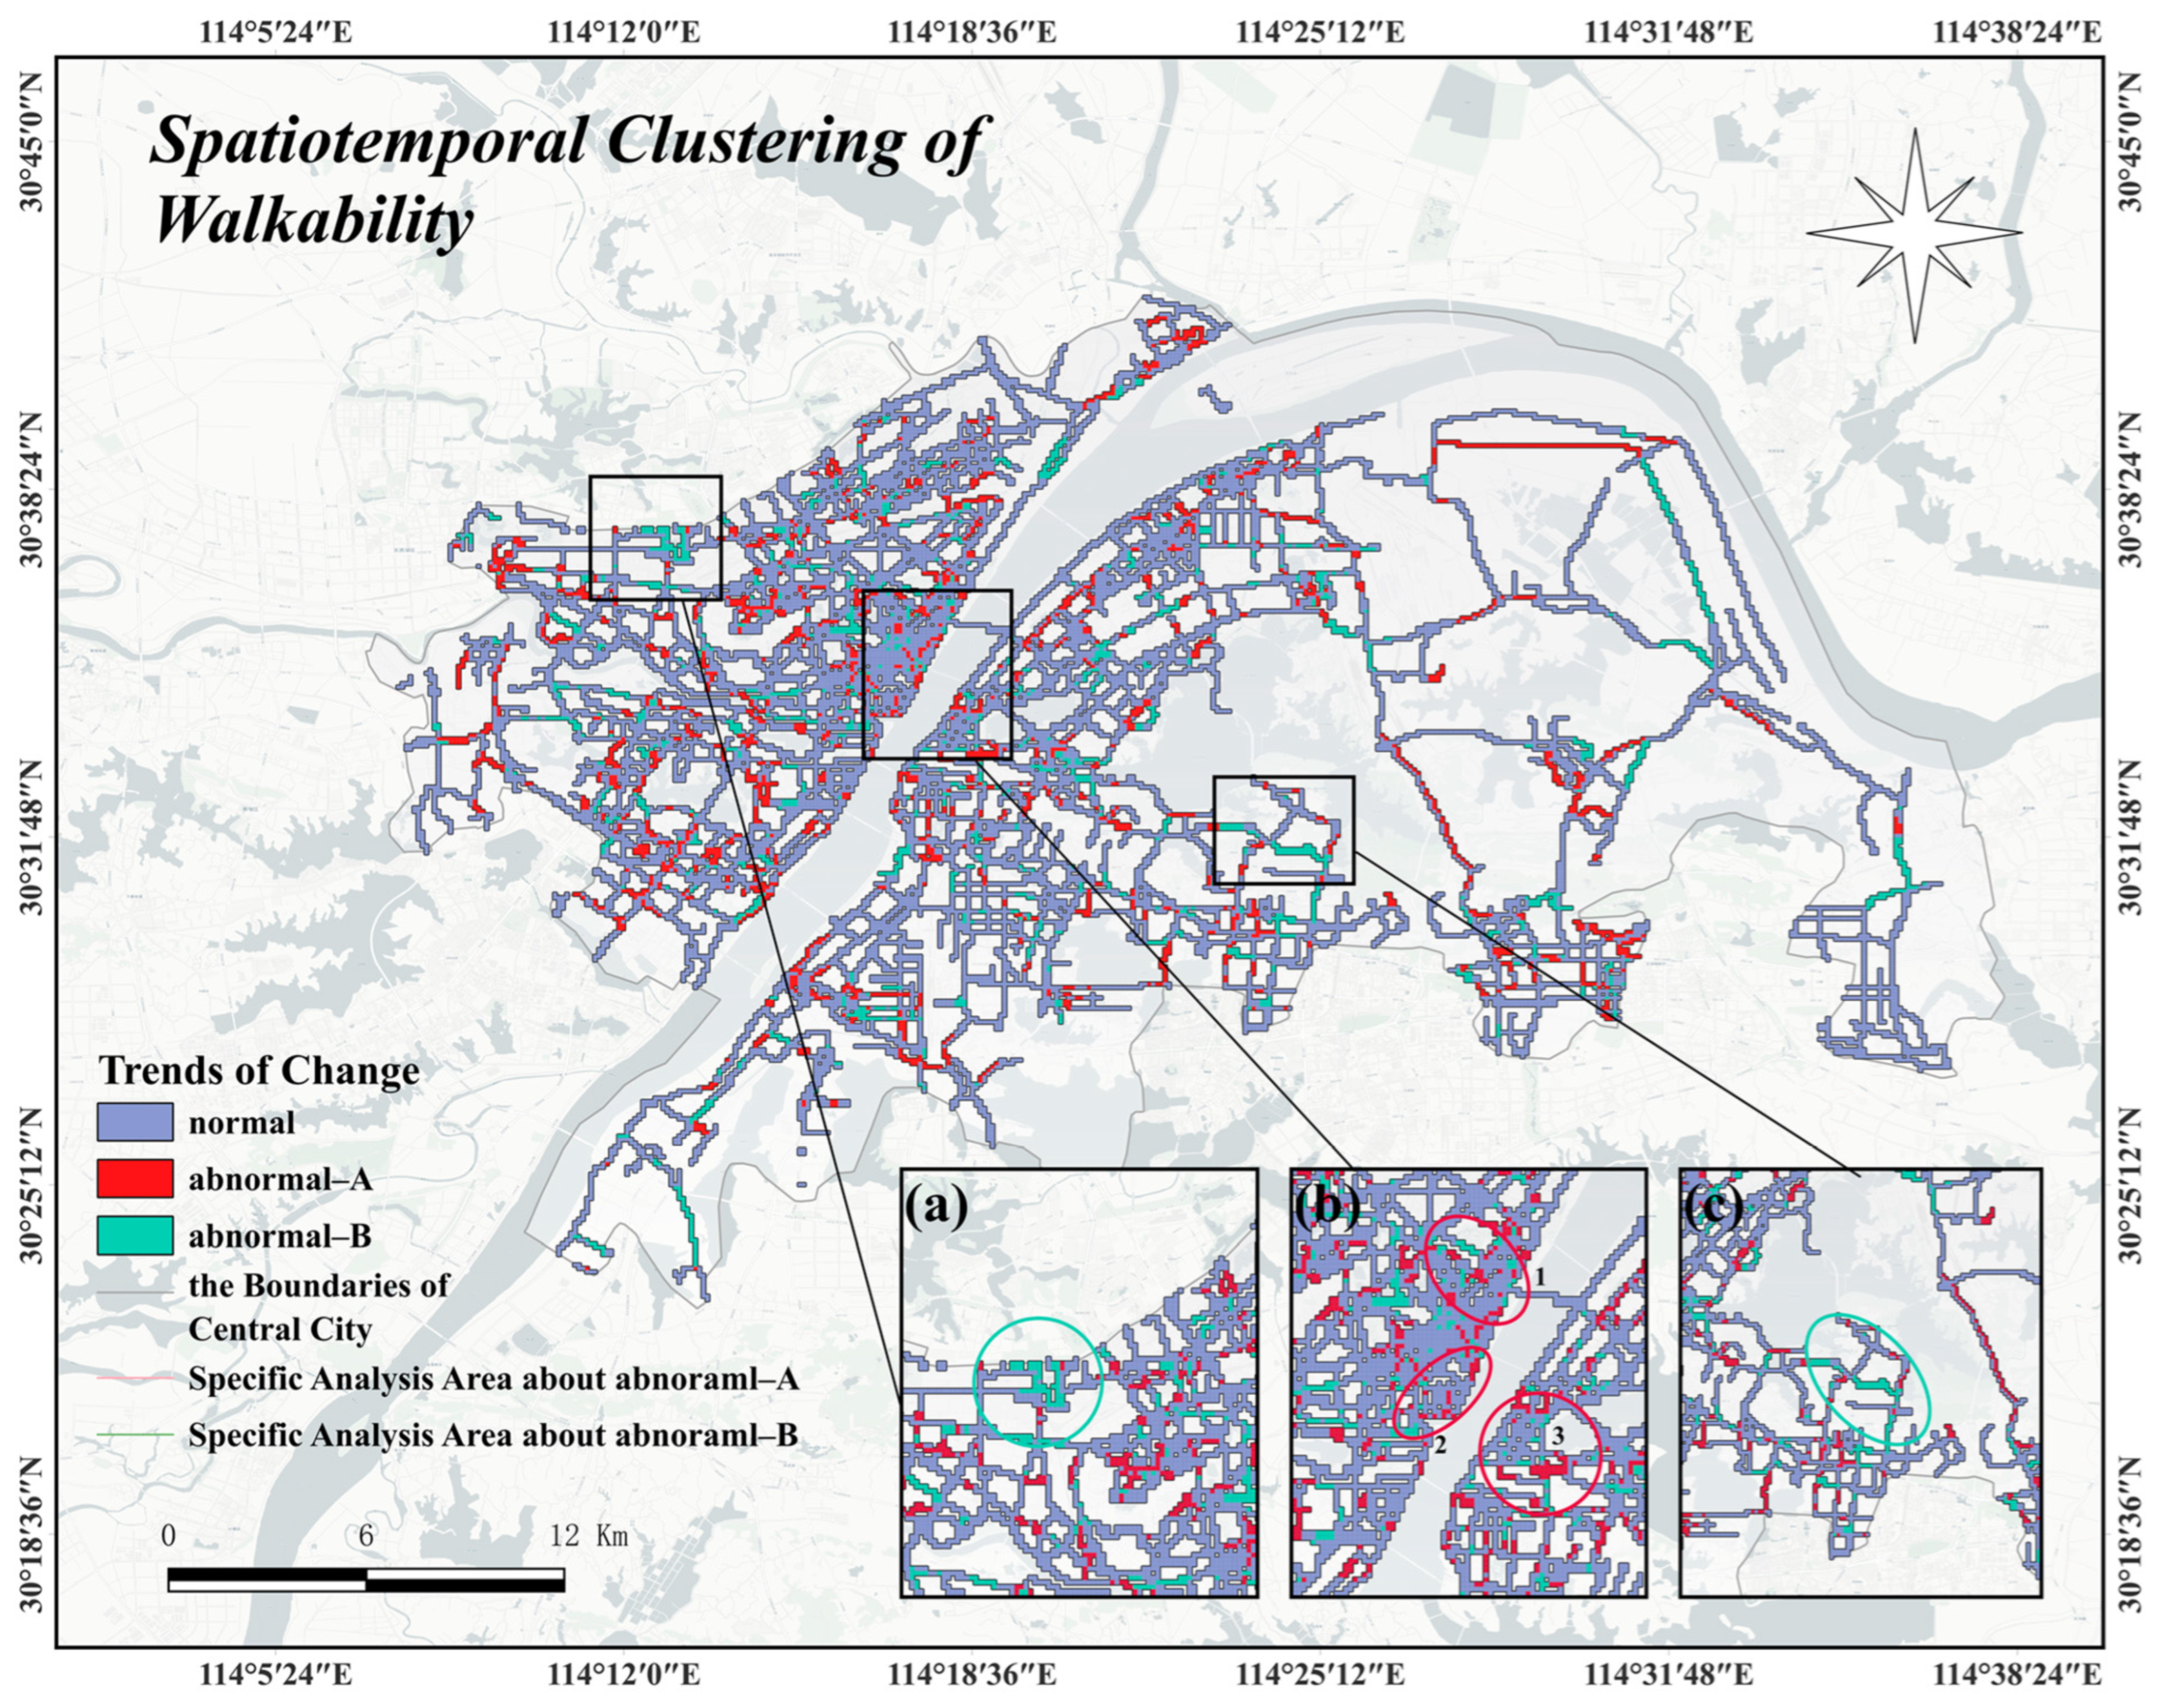
5.5. Spatio-Temporal Analysis of Walkability
5.5.1. Time Series Clustering and Geovisualization
5.5.2. Quantification and Analysis of the Characteristics of Diurnal Variation in Walkability
6. Conclusions
6.1. Research Findings and Contributions
6.2. Limitations and Future Directions
Author Contributions
Funding
Data Availability Statement
Acknowledgments
Conflicts of Interest
Appendix A. Spatial Heterogeneity Analysis Mediated by Walking Perception Attributes
Appendix A.1. Methodology
Appendix A.2. Geovisualization and Spatial Analysis

| Attributes | Determinants | Daytime | Nighttime |
|---|---|---|---|
| Comfort | Green visual index | 0.321 | 0.193 |
| Sky view factor | 0.273 | 0.186 | |
| Relative pavement width | 0.204 | 0.377 | |
| Quantity of rainfall | 0.202 | 0.244 | |
| Safety | Population density | 0.165 | 0.294 |
| Vehicle interference | 0.429 | 0.172 | |
| Pavement fence | 0.406 | 0.153 | |
| Lighting index | 0.381 | ||
| Convenience | Number of POI facilities | 0.522 | 0.759 |
| Number of bus stops | 0.478 | 0.241 |

References
- Batty, M. Modelling Cities as Dynamic Systems. Nature 1971, 231, 425–428. [Google Scholar] [CrossRef]
- Strom, E. The Street: A Quintessential Social Public Space. J. Urban Technol. 2015, 22, 139–141. [Google Scholar] [CrossRef]
- Yin, L.; Wang, Z. Measuring visual enclosure for street walkability: Using machine learning algorithms and Google Street View imagery. Appl. Geogr. 2016, 76, 147–153. [Google Scholar] [CrossRef]
- Zhou, H.; He, S.; Cai, Y.; Wang, M.; Su, S. Social inequalities in neighborhood visual walkability: Using street view imagery and deep learning technologies to facilitate healthy city planning. Sustain. Cities Soc. 2019, 50, 101605. [Google Scholar] [CrossRef]
- Liu, D.; Jiang, Y.; Wang, R.; Lu, Y. Establishing a citywide street tree inventory with street view images and computer vision techniques. Comput. Environ. Urban Syst. 2023, 100, 101924. [Google Scholar] [CrossRef]
- Kabisch, N.; Selsam, P.; Kirsten, T.; Lausch, A.; Bumberger, J. A multi-sensor and multi-temporal remote sensing approach to detect land cover change dynamics in heterogeneous urban landscapes. Ecol. Indic. 2019, 99, 273–282. [Google Scholar] [CrossRef]
- Yan, X.; Song, C.; Pei, T.; Wang, X.; Wu, M.; Liu, T.; Shu, H.; Chen, J. Revealing spatiotemporal matching patterns between traffic flux and road resources using big geodata—A case study of Beijing. Cities 2022, 127, 103754. [Google Scholar] [CrossRef]
- Tang, J.; Long, Y. Measuring visual quality of street space and its temporal variation: Methodology and its application in the Hutong area in Beijing. Landsc. Urban Plan. 2019, 191, 103436. [Google Scholar] [CrossRef]
- Wang, M.; Haworth, J.; Chen, H.; Liu, Y.; Shi, Z. Investigating the potential of crowdsourced street-level imagery in understanding the spatiotemporal dynamics of cities: A case study of walkability in Inner London. Cities 2024, 153, 105243. [Google Scholar] [CrossRef]
- Wang, H.-C.; Wang, Y.-Q.; Wang, X.; Yin, W.-X.; Yu, T.-C.; Xue, C.-H.; Wang, A.-J. Multimodal Machine Learning Guides Low Carbon Aeration Strategies in Urban Wastewater Treatment. Engineering 2024, 36, 51–62. [Google Scholar] [CrossRef]
- Xu, P.; Zhu, X.; Clifton, D.A. Multimodal Learning With Transformers: A Survey. IEEE Trans. Pattern Anal. Mach. Intell. 2023, 45, 12113–12132. [Google Scholar] [CrossRef]
- Zhang, F.; Salazar-Miranda, A.; Duarte, F.; Vale, L.; Hack, G.; Chen, M.; Liu, Y.; Batty, M.; Ratti, C. Urban Visual Intelligence: Studying Cities with Artificial Intelligence and Street-Level Imagery. Ann. Assoc. Am. Geogr. 2024, 114, 876–897. [Google Scholar] [CrossRef]
- Abley, S. Walkability Scoping Paper; Land Transport New Zealand: Wellington, New Zealand, 2005. Available online: https://www.livingstreets.org.nz/node/71 (accessed on 18 July 2022).
- Frank, L.D.; Andresen, M.A.; Schmid, T.L. Obesity relationships with community design, physical activity, and time spent in cars. Am. J. Prev. Med. 2004, 27, 87–96. [Google Scholar] [CrossRef]
- Wang, H.; Yang, Y. Neighbourhood walkability: A review and bibliometric analysis. Cities 2019, 93, 43–61. [Google Scholar] [CrossRef]
- De Vos, J.; Lättman, K.; van der Vlugt, A.-L.; Welsch, J.; Otsuka, N. Determinants and effects of perceived walkability: A literature review, conceptual model and research agenda. Transp. Rev. 2023, 43, 303–324. [Google Scholar] [CrossRef]
- Southworth, M. Designing the Walkable City. J. Urban Plan. Dev. 2005, 131, 246–257. [Google Scholar] [CrossRef]
- Grasser, G.; Van Dyck, D.; Titze, S.; Stronegger, W. Objectively measured walkability and active transport and weight-related outcomes in adults: A systematic review. Int. J. Public Health 2013, 58, 615–625. [Google Scholar] [CrossRef]
- Gebel, K.; Bauman, A.E.; Sugiyama, T.; Owen, N. Mismatch between perceived and objectively assessed neighborhood walkability attributes: Prospective relationships with walking and weight gain. Health Place 2011, 17, 519–524. [Google Scholar] [CrossRef]
- Chen, B.; Adimo, O.A.; Bao, Z. Assessment of aesthetic quality and multiple functions of urban green space from the users’ perspective: The case of Hangzhou Flower Garden, China. Landsc. Urban Plan. 2009, 93, 76–82. [Google Scholar] [CrossRef]
- Wang, L.; Han, X.; He, J.; Jung, T. Measuring residents’ perceptions of city streets to inform better street planning through deep learning and space syntax. ISPRS J. Photogramm. Remote Sens. 2022, 190, 215–230. [Google Scholar] [CrossRef]
- Lu, Y.; Chen, H.-M. Using google street view to reveal environmental justice: Assessing public perceived walkability in macroscale city. Landsc. Urban Plan. 2024, 244, 104995. [Google Scholar] [CrossRef]
- Zhang, F.; Zhou, B.; Liu, L.; Liu, Y.; Fung, H.H.; Lin, H.; Ratti, C. Measuring human perceptions of a large-scale urban region using machine learning. Landsc. Urban Plan. 2018, 180, 148–160. [Google Scholar] [CrossRef]
- Yao, Y.; Liang, Z.; Yuan, Z.; Liu, P.; Bie, Y.; Zhang, J.; Wang, R.; Wang, J.; Guan, Q. A human-machine adversarial scoring framework for urban perception assessment using street-view images. Int. J. Geogr. Inf. Sci. 2019, 33, 2363–2384. [Google Scholar] [CrossRef]
- Barthelemy, M. Modeling cities. C. R. Phys. 2019, 20, 293–307. [Google Scholar] [CrossRef]
- Monteiro, J.; Sousa, N.; Coutinho-Rodrigues, J.; Natividade-Jesus, E. Benchmarking real and ideal cities—A multicriteria analysis of city performance based on urban form. Cities 2024, 150, 105040. [Google Scholar] [CrossRef]
- Phillis, Y.A.; Kouikoglou, V.S.; Verdugo, C. Urban sustainability assessment and ranking of cities. Comput. Environ. Urban Syst. 2017, 64, 254–265. [Google Scholar] [CrossRef]
- Chen, Y.; Yu, B.; Shu, B.; Yang, L.; Wang, R. Exploring the spatiotemporal patterns and correlates of urban vitality: Temporal and spatial heterogeneity. Sustain. Cities Soc. 2023, 91, 104440. [Google Scholar] [CrossRef]
- Wang, Y.; Niu, Y.; Li, M.; Yu, Q.; Chen, W. Spatial structure and carbon emission of urban agglomerations: Spatiotemporal characteristics and driving forces. Sustain. Cities Soc. 2022, 78, 103600. [Google Scholar] [CrossRef]
- Guo, A.; Yang, J.; Xiao, X.; Xia, J.; Jin, C.; Li, X. Influences of urban spatial form on urban heat island effects at the community level in China. Sustain. Cities Soc. 2020, 53, 101972. [Google Scholar] [CrossRef]
- Hou, H.; Longyang, Q.; Su, H.; Zeng, R.; Xu, T.; Wang, Z.-H. Prioritizing environmental determinants of urban heat islands: A machine learning study for major cities in China. Int. J. Appl. Earth Obs. Geoinf. 2023, 122, 103411. [Google Scholar] [CrossRef]
- Chakraborty, T.; Lee, X. A simplified urban-extent algorithm to characterize surface urban heat islands on a global scale and examine vegetation control on their spatiotemporal variability. Int. J. Appl. Earth Obs. Geoinf. 2019, 74, 269–280. [Google Scholar] [CrossRef]
- Wang, X.; Zhang, Y.; Yu, D.; Qi, J.; Li, S. Investigating the spatiotemporal pattern of urban vibrancy and its determinants: Spatial big data analyses in Beijing, China. Land Use Policy 2022, 119, 106162. [Google Scholar] [CrossRef]
- Ouyang, J.; Fan, H.; Wang, L.; Zhu, D.; Yang, M. Revealing urban vibrancy stability based on human activity time-series. Sustain. Cities Soc. 2022, 85, 104053. [Google Scholar] [CrossRef]
- Pozoukidou, G.; Chatziyiannaki, Z. 15-Minute City: Decomposing the New Urban Planning Eutopia. Sustainability 2021, 13, 928. [Google Scholar] [CrossRef]
- Moreno, C.; Allam, Z.; Chabaud, D.; Gall, C.; Pratlong, F. Introducing the “15-Minute City”: Sustainability, Resilience and Place Identity in Future Post-Pandemic Cities. Smart Cities 2021, 4, 93–111. [Google Scholar] [CrossRef]
- Zakariasson, A. A Study of the 15-Minute City Concept: Identifying Strengths, Risks and Challenges Through Imagining the Implementation of the 15-Minute City Concept in Munich. Master’s Thesis, KTH Royal Institute of Technology, Stockholm, Sweden, 2022. Available online: https://urn.kb.se/resolve?urn=urn:nbn:se:kth:diva-315750 (accessed on 18 July 2022).
- Allam, Z.; Khavarian-Garmsir, A.R.; Lassaube, U.; Chabaud, D.; Moreno, C. Mapping the Implementation Practices of the 15-Minute City. Smart Cities 2024, 7, 2094–2109. [Google Scholar] [CrossRef]
- Logan, T.; Hobbs, M.; Conrow, L.; Reid, N.; Young, R.; Anderson, M. The x-minute city: Measuring the 10, 15, 20-minute city and an evaluation of its use for sustainable urban design. Cities 2022, 131, 103924. [Google Scholar] [CrossRef]
- Sabesan, L.; Meetiyagoda, L.; Rathnasekara, S. Landmarks and walkability: Wayfinding during nighttime in a tourism-based city. Case study of Jaffna, Sri Lanka. GeoJournal 2024, 89, 212. [Google Scholar] [CrossRef]
- Zhao, M.; Cheng, C.; Zhou, Y.; Li, X.; Shen, S.; Song, C. A global dataset of annual urban extents (1992–2020) from harmo-nized nighttime lights. Earth Syst. Sci. Data 2022, 14, 517–534. Available online: https://essd.copernicus.org/articles/14/517/2022/ (accessed on 18 July 2022). [CrossRef]
- Zheng, Q.; Seto, K.C.; Zhou, Y.; You, S.; Weng, Q. Nighttime light remote sensing for urban applications: Progress, challenges, and prospects. ISPRS J. Photogramm. Remote Sens. 2023, 202, 125–141. [Google Scholar] [CrossRef]
- Wu, C.; Zhao, M.; Ye, Y. Measuring urban nighttime vitality and its relationship with urban spatial structure: A data-driven approach. Environ. Plan. B Urban Anal. City Sci. 2022, 50, 130–145. [Google Scholar] [CrossRef]
- D’aCci, L. Aesthetical cognitive perceptions of urban street form. Pedestrian preferences towards straight or curvy route shapes. J. Urban Des. 2019, 24, 896–912. [Google Scholar] [CrossRef]
- Ball, K.; Baumanb, A.; Lesliec, E.; Owenc, N. Perceived Environmental Aesthetics and Convenience and Company Are Associated with Walking for Exercise among Australian Adults. Prev. Med. 2001, 33, 434–440. [Google Scholar] [CrossRef] [PubMed]
- Humpel, N.; Owen, N.; Iverson, D.; Leslie, E.; Bauman, A. Perceived environment attributes, residential location, and walking for particular purposes. Am. J. Prev. Med. 2004, 26, 119–125. [Google Scholar] [CrossRef]
- Zhao, M.; Zhou, Y.; Li, X.; Cao, W.; He, C.; Yu, B.; Li, X.; Elvidge, C.D.; Cheng, W.; Zhou, C. Applications of Satellite Remote Sensing of Nighttime Light Observations: Advances, Challenges, and Perspectives. Remote Sens. 2019, 11, 1971. [Google Scholar] [CrossRef]
- Huang, X.; Liang, H.; Zeng, L.; White, M. Evaluating urban walkability: A comprehensive review of tools and techniques. Archit. Sci. Rev. 2024, 68, 263–277. [Google Scholar] [CrossRef]
- Deng, C.; Dong, X.; Wang, H.; Lin, W.; Wen, H.; Frazier, J.; Ho, H.C.; Holmes, L. A Data-Driven Framework for Walkability Measurement with Open Data: A Case Study of Triple Cities, New York. ISPRS Int. J. Geo-Inf. 2020, 9, 36. [Google Scholar] [CrossRef]
- Brownson, R.C.; Hoehner, C.M.; Day, K.; Forsyth, A.; Sallis, J.F. Measuring the Built Environment for Physical Activity. Am. J. Prev. Med. 2009, 36, S99–S123.e12. [Google Scholar] [CrossRef]
- Joshi, A.; Kale, S.; Chandel, S.; Pal, D.K. Likert Scale: Explored and Explained. Br. J. Appl. Sci. Technol. 2015, 7, 396–403. [Google Scholar] [CrossRef]
- Cheng, B.; Misra, I.; Schwing, A.G.; Kirillov, A.; Girdhar, R. Masked-attention Mask Transformer for Universal Image Segmentation. In Proceedings of the 2022 IEEE/CVF Conference on Computer Vision and Pattern Recognition (CVPR), New Orleans, LA, USA, 18–24 June 2022; pp. 1280–1289. [Google Scholar]
- Zhou, D.; Qian, Y.; Ma, Y.; Fan, Y.; Yang, J.; Tan, F. Low illumination image enhancement based on multi-scale CycleGAN with deep residual shrinkage. J. Intell. Fuzzy Syst. 2022, 42, 2383–2395. [Google Scholar] [CrossRef]
- Guzman, L.A.; Oviedo, D.; Cantillo-Garcia, V.A. Is proximity enough? A critical analysis of a 15-minute city considering individual perceptions. Cities 2024, 148, 104882. [Google Scholar] [CrossRef]
- Chan, J.Y.-L.; Leow, S.M.H.; Bea, K.T.; Cheng, W.K.; Phoong, S.W.; Hong, Z.-W.; Chen, Y.-L. Mitigating the Multicollinearity Problem and Its Machine Learning Approach: A Review. Mathematics 2022, 10, 1283. [Google Scholar] [CrossRef]
- Radford, A.; Kim, J.W.; Hallacy, C.; Ramesh, A.; Goh, G.; Agarwal, S.; Sastry, G.; Askell, A.; Mishkin, P.; Clark, J.; et al. Learning Transferable Visual Models From Natural Language Supervision. In Proceedings of the International Conference on Machine Learning, Vienna, Austria, 18–24 July 2021. [Google Scholar]
- Ly, A.; Marsman, M.; Wagenmakers, E. Analytic posteriors for Pearson’s correlation coefficient. Stat. Neerl. 2018, 72, 4–13. [Google Scholar] [CrossRef] [PubMed]


| Quantitative Indicators | |||
|---|---|---|---|
| Green visual index | Sky view factor | Relative pavement width | Pavement fence |
| Population density | Vehicle interference | Quantity of rainfall l | Lighting index |
| Number of bus stops | Number of POI facilities | ||
| Formulas | Interpretation |
|---|---|
| is the number of green pixels in the image, is the total number of pixels in the image. | |
| is the number of sky pixels in the image. | |
| is the number of sidewalk pixels in the image, is the number of road pixels in the image. | |
| is the number of fence pixels in the image. |
| Formulas | Interpretation |
|---|---|
| is the unit rainfall at time t; S is the sidewalk area. | |
| is the traffic at time t. | |
| represent the traffic volume of cars, buses, trucks, and motorcycles in t time. | |
| is the number of bus stops within the buffer of the Xth sampling point. | |
| is the number of facilities within the Xth sampling point buffer. is the area of the buffer zone. |
| Index | Column | Max | Min | Mean | Std Dev |
|---|---|---|---|---|---|
| 1 | sky | 0.699 | 0.001 | 19.840 | 10.575 |
| 2 | green | 0.460 | 0.001 | 5.880 | 5.756 |
| 3 | road | 0.195 | 0.001 | 4.476 | 3.328 |
| 4 | fence | 0.188 | 0.001 | 2.032 | 2.840 |
| 5 | sidewalk | 0.132 | 0.001 | 0.857 | 1.373 |
| Sky View Factor | Green Visual Index | Lighting Index | Quantity of Rainfall | Vehicle Interference | Number of POI Facilities | Population Density | Number of Bus Stops | Relative Pavement Width | Pavement Fence | |
|---|---|---|---|---|---|---|---|---|---|---|
| Sky view factor | 1 (0.000 ***) | 0.544 (0.000 ***) | −0.19 (0.058 *) | −0.119 (0.237) | 0.093 (0.359) | −0.217 (0.030 **) | −0.077 (0.445) | −0.156 (0.122) | 0.066 (0.512) | −0.074 (0.466) |
| Green visual index | 0.544 (0.000 ***) | 1 (0.000 ***) | 0.067 (0.505) | −0.096 (0.344) | 0.066 (0.512) | −0.18 (0.073 *) | 0.2 (0.046 **) | −0.018 (0.858) | −0.098 (0.333) | −0.057 (0.576) |
| Lighting index | −0.19 (0.058 *) | 0.067 (0.505) | 1 (0.000 ***) | 0.032 (0.748) | 0.123 (0.222) | 0.417 (0.000 ***) | 0.117 (0.247) | 0.548 (0.000 ***) | −0.058 (0.569) | −0.009 (0.926) |
| Quantity of rainfall | −0.119 (0.237) | −0.096 (0.344) | 0.032 (0.748) | 1 (0.000 ***) | −0.149 (0.140) | −0.048 (0.635) | −0.049 (0.630) | 0.045 (0.658) | 0.011 (0.914) | 0.018 (0.857) |
| Vehicle interference | 0.093 (0.359) | 0.066 (0.512) | 0.123 (0.222) | −0.149 (0.140) | 1 (0.000 ***) | 0.213 (0.033 **) | 0.103 (0.307) | 0.099 (0.325) | 0.031 (0.760) | −0.188 (0.061 *) |
| Number of POI facilities | −0.217 (0.030 **) | −0.18 (0.073 *) | 0.417 (0.000 ***) | −0.048 (0.635) | 0.213 (0.033 **) | 1 (0.000 ***) | 0.226 (0.024 **) | 0.146 (0.147) | 0.045 (0.658) | −0.08 (0.428) |
| Population density | −0.077 (0.445) | 0.2 (0.046 **) | 0.117 (0.247) | −0.049 (0.630) | 0.103 (0.307) | 0.226 (0.024 **) | 1 (0.000 ***) | −0.003 (0.975) | 0.003 (0.976) | −0.039 (0.702) |
| Number of bus stops | −0.156 (0.122) | −0.018 (0.858) | 0.548 (0.000 ***) | 0.045 (0.658) | 0.099 (0.325) | 0.146 (0.147) | −0.003 (0.975) | 1 (0.000 ***) | −0.074 (0.466) | 0.124 (0.219) |
| Relative pavement width | 0.066 (0.512) | −0.098 (0.333) | −0.058 (0.569) | 0.011 (0.914) | 0.031 (0.760) | 0.045 (0.658) | 0.003 (0.976) | −0.074 (0.466) | 1 (0.000 ***) | −0.679 (0.000 ***) |
| Pavement fence | −0.074 (0.466) | −0.057 (0.576) | −0.009 (0.926) | 0.018 (0.857) | −0.188 (0.061 *) | −0.08 (0.428) | −0.039 (0.702) | 0.124 (0.219) | −0.679 (0.000 ***) | 1 (0.000 ***) |
| Model Architecture | Params | Accuracy |
|---|---|---|
| RN101 | 278 M | 0.8810 |
| RN50 × 16 | 630 M | 0.8857 |
| ViT-B/32 | 338 M | 0.9663 |
| ViT-B/16 | 335 M | 0.9532 |
| ViT-L/14@336px | 891 M | 0.8481 |
| Model | R2 | F Test | |||||||||||
| Day | Night | Day | Night | ||||||||||
| Statistical Regression Model | Ridge Regression | 0.503 | 0.501 | 10.107 | 8.932 | ||||||||
| Stepwise Regression | 0.534 | 0.534 | 27.195 | 27.195 | |||||||||
| R2 (Train/Test) | MAPE (Train/Test) | MAE (Train/Test) | |||||||||||
| Day | Night | Day | Night | Day | Night | ||||||||
| Machine Learning Regression Model | Random Forest Regression | 0.903/0.754 | 0.910/0.783 | 6.751/11.115 | 13.342/14.8 | 0.839/2.238 | 0.057/0.083 | ||||||
| XGBoost Regression | 0.964/0.71 | 0.961/0.687 | 4.173/10.087 | 8.874/23.786 | 0.445/1.578 | 0.036/0.112 | |||||||
| Baseline Model | Night Attenuation Index | Dawn Recovery Rate | Entropy of Rhythmic Fluctuations |
|---|---|---|---|
| Normal | 0.388 | 0.346 | 0.586 |
| Abnormal-A | 0.281 | 0.325 | 0.455 |
| Abnormal-B | 0.493 | 0.481 | 0.750 |
Disclaimer/Publisher’s Note: The statements, opinions and data contained in all publications are solely those of the individual author(s) and contributor(s) and not of MDPI and/or the editor(s). MDPI and/or the editor(s) disclaim responsibility for any injury to people or property resulting from any ideas, methods, instructions or products referred to in the content. |
© 2025 by the authors. Licensee MDPI, Basel, Switzerland. This article is an open access article distributed under the terms and conditions of the Creative Commons Attribution (CC BY) license (https://creativecommons.org/licenses/by/4.0/).
Share and Cite
Wang, X.; Peng, Z.; Yang, X. Multimodal Data-Driven Hourly Dynamic Assessment of Walkability on Urban Streets and Exploration of Regulatory Mechanisms for Diurnal Changes: A Case Study of Wuhan City. Land 2025, 14, 1551. https://doi.org/10.3390/land14081551
Wang X, Peng Z, Yang X. Multimodal Data-Driven Hourly Dynamic Assessment of Walkability on Urban Streets and Exploration of Regulatory Mechanisms for Diurnal Changes: A Case Study of Wuhan City. Land. 2025; 14(8):1551. https://doi.org/10.3390/land14081551
Chicago/Turabian StyleWang, Xingyao, Ziyi Peng, and Xue Yang. 2025. "Multimodal Data-Driven Hourly Dynamic Assessment of Walkability on Urban Streets and Exploration of Regulatory Mechanisms for Diurnal Changes: A Case Study of Wuhan City" Land 14, no. 8: 1551. https://doi.org/10.3390/land14081551
APA StyleWang, X., Peng, Z., & Yang, X. (2025). Multimodal Data-Driven Hourly Dynamic Assessment of Walkability on Urban Streets and Exploration of Regulatory Mechanisms for Diurnal Changes: A Case Study of Wuhan City. Land, 14(8), 1551. https://doi.org/10.3390/land14081551