1. Introduction
Climate change, rapid urbanization, and significant shifts in land use patterns are profoundly affecting global ecosystems. These changes not only drive the degradation of ecological functions but also erode ecosystem resilience, thereby impairing ecosystems’ capacity to absorb external disturbances while maintaining essential functions [
1,
2]. In response to these mounting challenges, there is increasing global concern over how to mitigate and adapt to environmental changes, particularly in regions experiencing intense resource competition and rapid urban expansion. Consequently, the scientific community has recognized that understanding ecosystems’ capacity to respond to external disturbances demands an integrated approach that integrates both natural and socioeconomic factors [
3].
Ecosystem resilience is defined as the ability of an ecosystem to resist disturbances while maintaining its own structure and functions and consists of three components: ecosystem recovery capacity (ERC), ecosystem resistance (ER), and ecosystem adaptation capacity (EA). However, as research on ecosystem resilience continues to deepen, there is an urgent need to shift from the previous single-perspective of only focusing on stability to quantitative research that incorporates the ability to describe the adaptability and dynamics of the coupled state of social and natural systems, thereby addressing global environmental changes [
4,
5,
6,
7]. Additionally, with the rise of socio-ecological system research, ecological resilience assessments have broadened from traditional ecological indicators to include socio-economic factors such as population distribution, economic vitality, and infrastructure resilience. Zhao et al. proposed the Driving Forces-Pressure-State-Impact-Response framework, emphasizing the significant influence of socio-economic drivers on ecological resilience [
8]. Through data-driven quantitative methods, this framework explores the multidimensional effects of urbanization and climate change on resilience [
9]. The strength of this multidimensional framework lies in its ability to dynamically and systematically integrate the complex relationships between ecological and social systems, offering both current assessments and future scenario simulations that support ecosystem management and decision-making [
10].
While urban resilience research has advanced considerably, it has primarily centered on artificial ecosystems—such as built environments and managed green spaces—thus offering a relatively limited perspective on broader socio-ecological processes [
11,
12]. In contrast, studying watershed ecosystem resilience (RES) from a watershed perspective not only involves more complex ecosystems but also captures the coupled interactions between natural processes, human activities, and managed ecological systems such as plantations, pastures, and agricultural lands. RES research offers a broader and more integrated perspective, providing a systematic scientific foundation for cross-regional ecological conservation. However, research on RES from a watershed perspective remains limited. Cumming and Peterson emphasized the dynamic characteristics of resilience across multiple scales, highlighting the critical role of the interaction between social and natural systems in shaping ecological resilience [
5]. These studies expand the focus of resilience from the stability of individual systems to the adaptability and transformational potential of complex social-ecological systems, offering new theoretical insights into addressing global environmental challenges. The upper Yangtze River basin (UYRB), located in southwestern China, is a key area for the country’s ecological security. Its rich natural environment and biodiversity make it a crucial region for water conservation within the Yangtze River basin [
13]. Moreover, this region plays an indispensable role in soil and water conservation, flood mitigation, and providing ecological support for the downstream economic zones [
14].
Changes in land use and climate patterns, as recognized key factors affecting RES, have an impact on material and biological migration between habitat patches that cannot be ignored. Land use or land cover (LULC) change typically reduces landscape connectivity, which impacts the movement of materials and organisms between habitat patches [
15]. This disruption is considered one of the primary drivers of biodiversity loss [
16]. Therefore, understanding how land use changes affect the spatial and temporal distribution of natural resources and ecological resilience is essential for developing effective ecological protection strategies. LULC change is a continuous and dynamic process that requires quantitative modeling for systematic and in-depth analysis [
17]. Widely used CA models, such as the CA-Markov, FLUS, and PLUS models, have shown strong applicability in simulating LULC changes [
18]. The PLUS model effectively addresses the challenges of simulating the spatiotemporal dynamics of land patches by integrating patch-generating mechanisms and land expansion analysis [
19], enabling the identification of both driving factors and landscape patterns of LULC change [
20]. Its application in various regional studies has demonstrated strong predictive capacity and spatial precision, especially in urban expansion and ecological planning scenarios [
21]. For detailed information on the model’s underlying principles and simulation procedures, please refer to references [
22].
This study focuses on the UYRB, aiming to explore the spatiotemporal dynamics and driving mechanisms of its RES through raster-scale system analysis, thus providing scientific support for watershed ecological conservation and sustainable development. In classical RES frameworks, EP, ERC, and EA are regarded as the three fundamental dimensions for assessing the ability of ecosystems to withstand, recover from, and adapt to disturbances [
23,
24] However, these traditional indicators primarily reflect the internal response mechanisms of ecosystems and may not fully capture the functional attributes and vitality necessary to sustain long-term ecological stability, especially in large and complex watershed systems. Given the strong human–nature interactions and multifunctionality of the UYRB ecosystem, this study expands the resilience framework by introducing two additional indicators: ecosystem services (ES) [
25,
26] and ecosystem vitality (EV) [
27,
28]. Furthermore, to further characterize changes in ecosystem resilience in the UYRB, this study also depicts the dynamic characteristics of the five dimensions on an annual scale through comparisons of multiple periods.
Overall, this study will address the spatiotemporal dynamic characteristics of RES from a watershed perspective and analyze the interactions between natural and social driving factors and their impacts on RES; furthermore, this study will simulate the evolution trends of RES under different climate and land use scenarios and finally propose corresponding strategies to optimize ecosystem resilience and enhance the effectiveness of its management.
2. Materials and Methods
2.1. Study Area
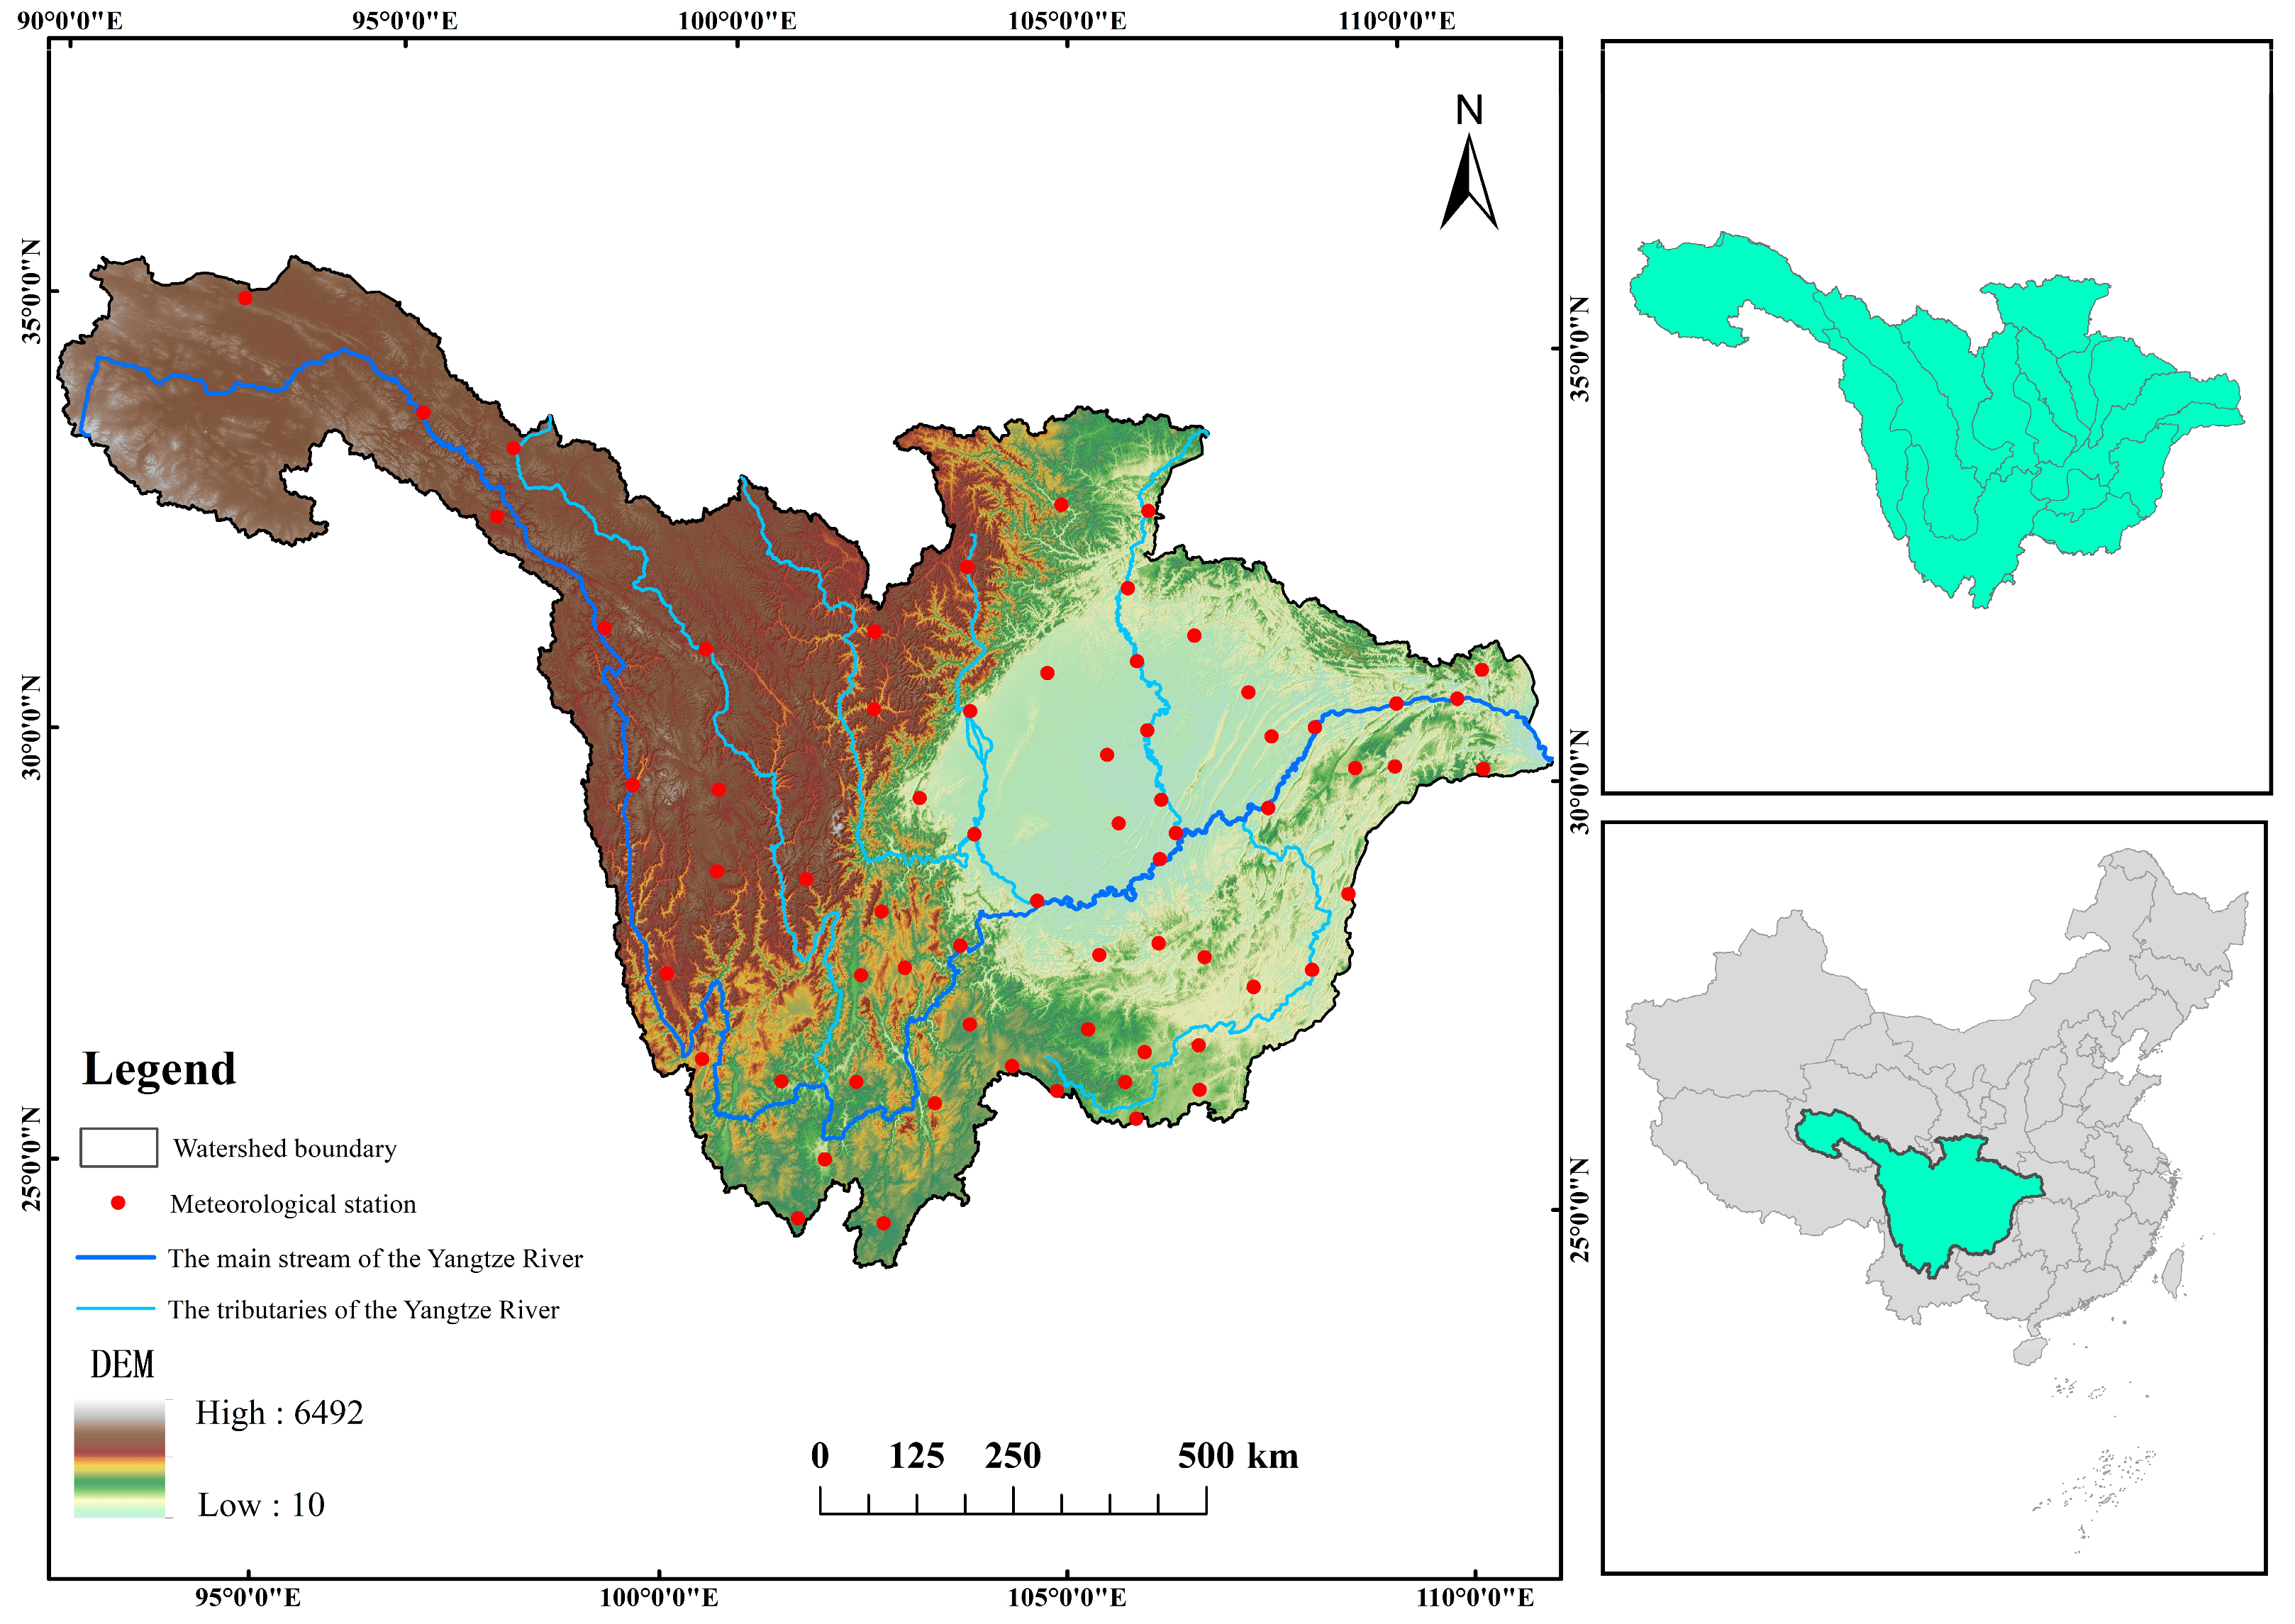
The Yangtze River, the third-largest river in the world, plays an indispensable role in China’s economy, culture, and ecosystems, while also supporting one of the country’s largest grain-producing regions [
29]. Flowing through the subtropical monsoon region of East Asia, the river experiences an average annual precipitation of approximately 1045 mm, leading to highly seasonal hydrological processes within its basin [
30]. This study focuses on the UYRB (
Figure 1), which covers an area of 1,013,809.4 km
2, and is characterized by diverse topographies and ecological types, including urban, rural, and mountainous areas. As urbanization progresses, the structure and function of the UYRB’s ecosystem have become increasingly disrupted. Studying the resilience of this basin is crucial for protecting the watershed’s ecological environment and promoting regional sustainable development.
2.2. Data Sources
This study employs a range of publicly available, high-quality datasets from national and international scientific institutions. LULC data (30 m), digital elevation model (DEM, 60 m), Gross Domestic Product (GDP) data (1000 m), the geographic point data of county-level government administrative centers, road network data (30 m resolution), and population distribution data (1000 m) were obtained from the Resource Science and Data Center of the Chinese Academy of Sciences (
https://www.resdc.cn/, accessed on 1 June 2024). Normalized Difference Vegetation Index (NDVI) was sourced from NASA’s MOD13A3 product (1000 m). Soil data, including soil type, texture, organic matter content, and root depth, were obtained from the World Soil Database (1000 m), which provides essential information for regional soil characteristic analysis. Meteorological data on precipitation, evapotranspiration, and temperature (1000 m) were provided by the National Qinghai-Tibet Plateau Data Center (
https://data.tpdc.ac.cn/, accessed on 15 July 2024), supplying the necessary inputs for climate change scenario analysis in the study area.
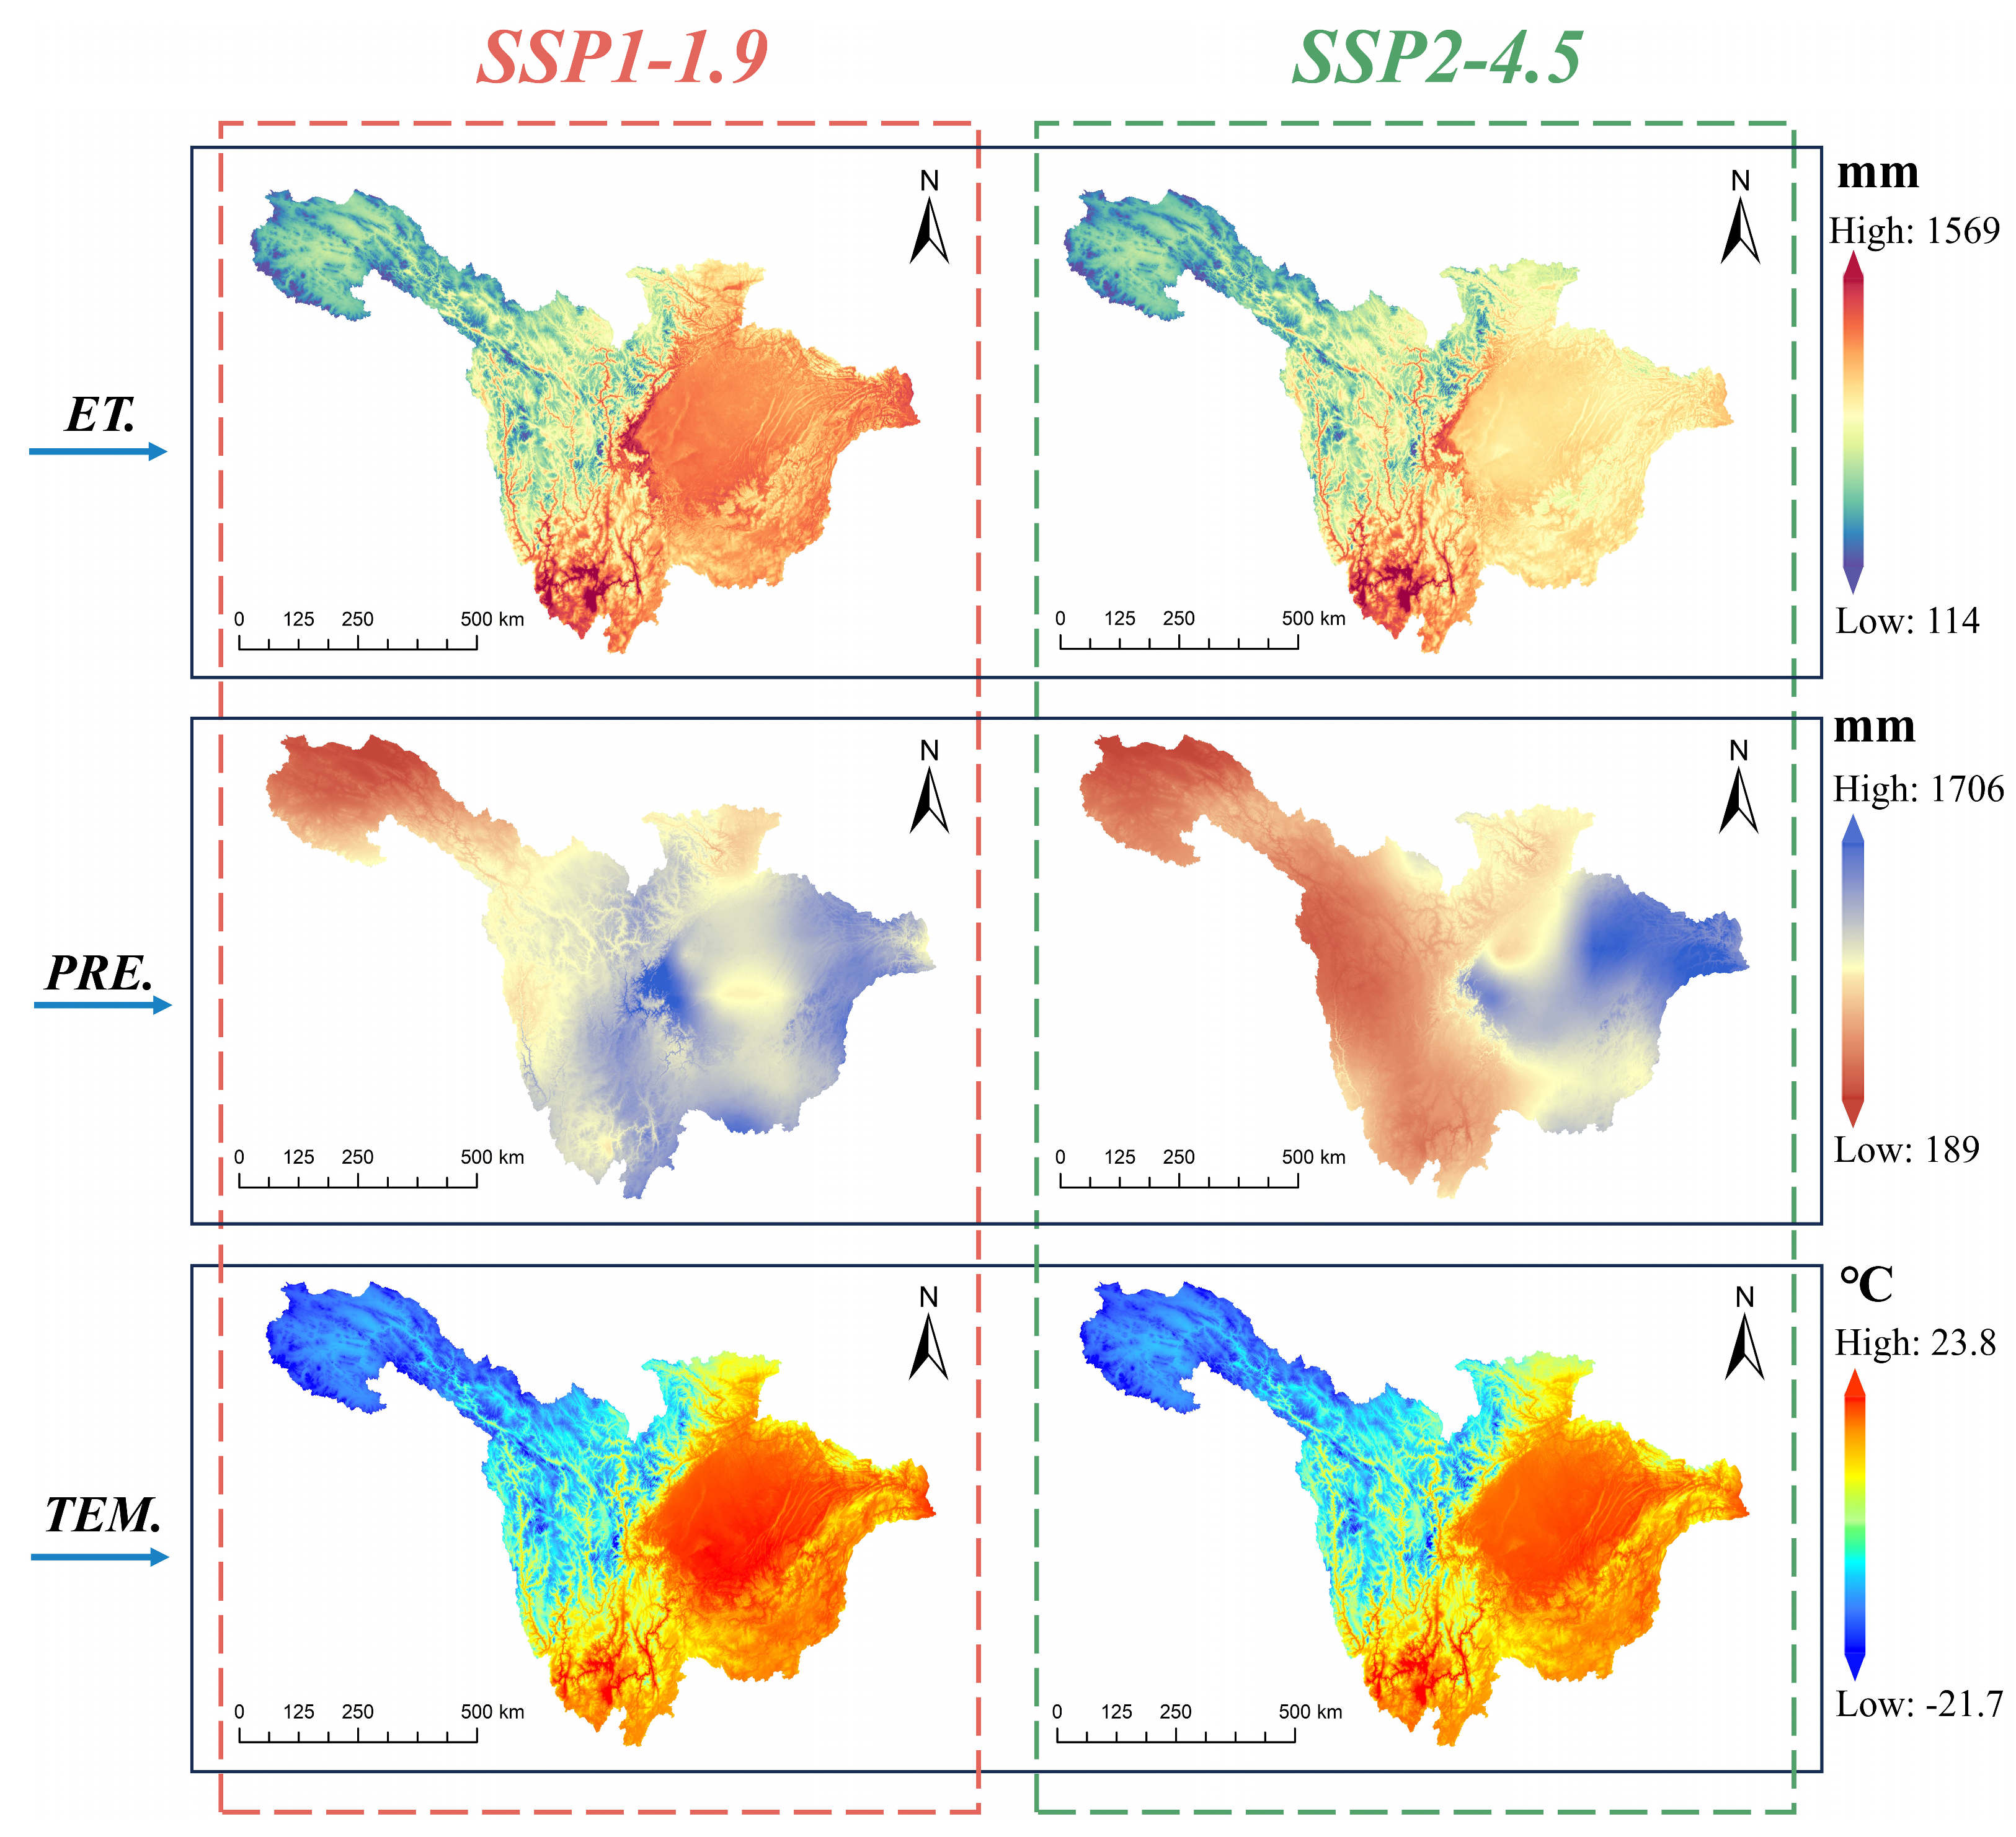
To simulate the potential impacts of future climate change on ecosystems, this study employed simulation results from the MRI-ESM2-0 global climate model under the CMIP6 framework, incorporating climate scenarios from the Shared Socioeconomic Pathways (SSP) with varying emission trajectories. The climate data were downscaled using the Delta spatial downscaling method, combining the CMIP6 global climate model (initial resolution of approximately 100 km) with high-resolution WorldClim data (1000 m) to generate monthly climate data at a 1 km resolution for the Yangtze River region [
31]. The spatial resolution of the dataset is 0.0083333° (roughly 1 km). Climate data for the SSP1-1.9 and SSP2-4.5 scenarios for the year 2030 were selected (
Figure 2), sourced from the National Qinghai-Tibet Plateau Data Center [
32]. SSP1-1.9 represents a sustainability-oriented pathway with very low greenhouse gas emissions, while SSP2-4.5 reflects a “middle-of-the-road” scenario with moderate mitigation efforts.
2.3. Methodological Framework
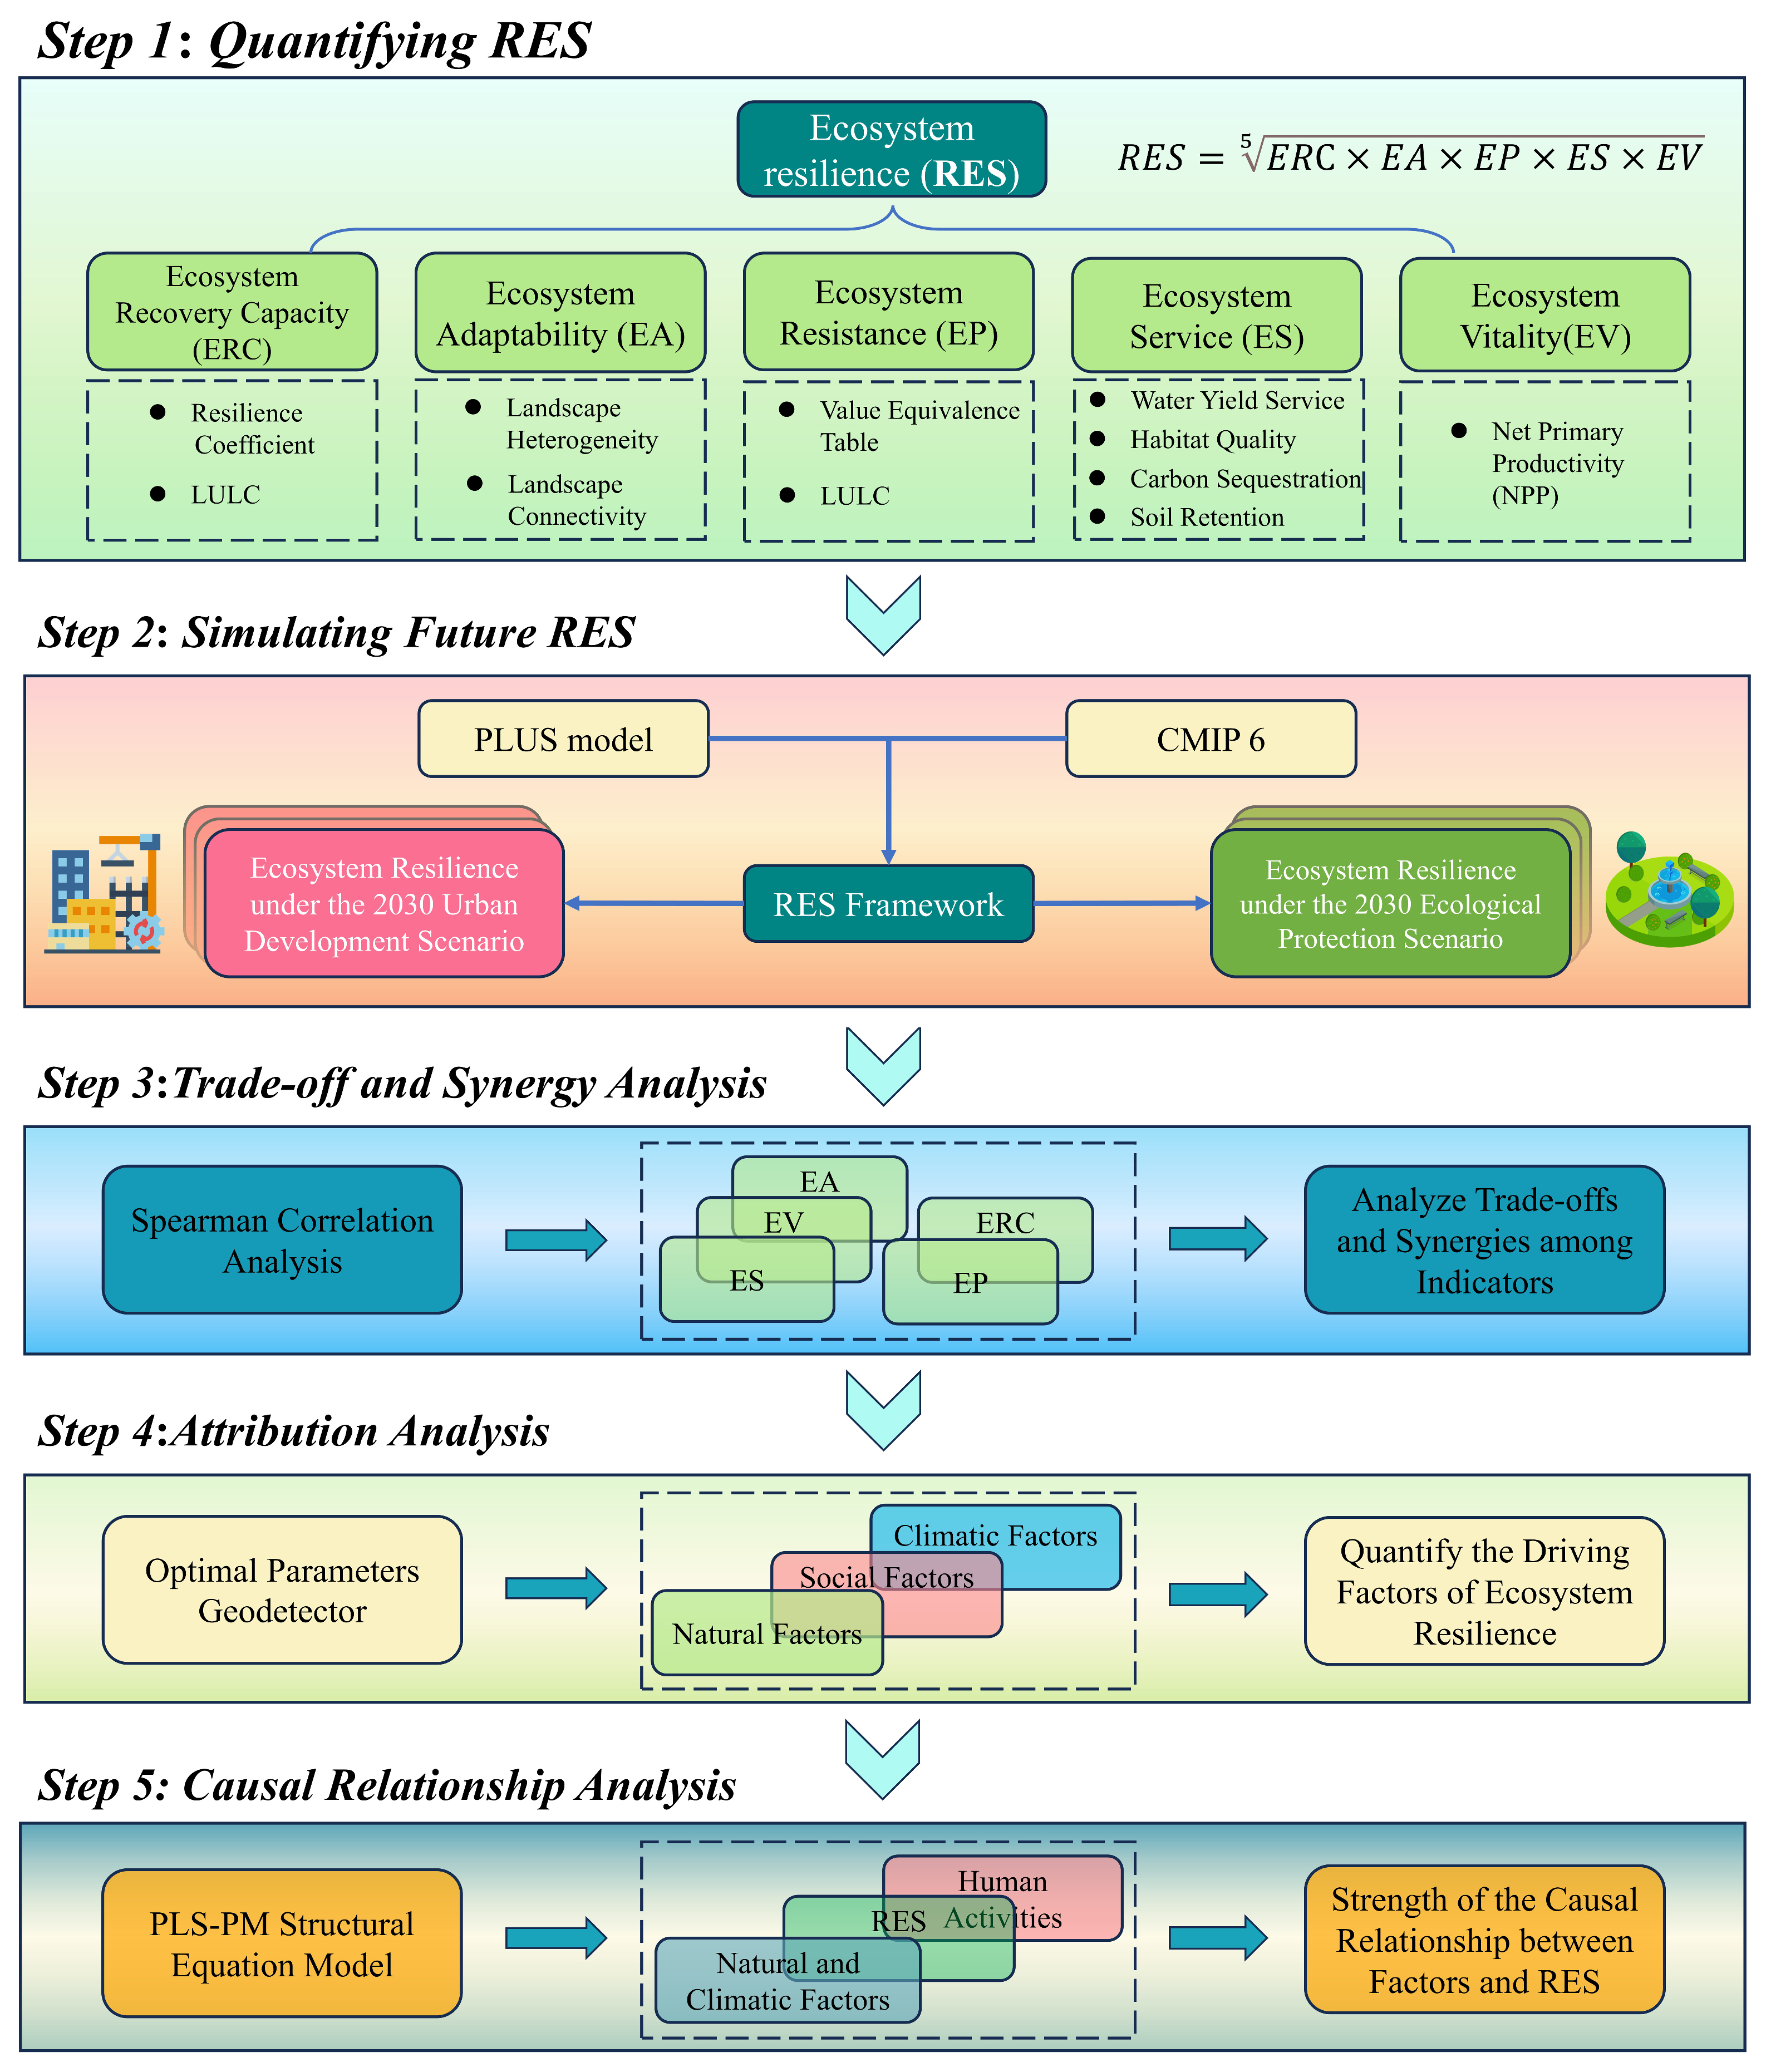
To address the multifaceted nature of ecological resilience in large-scale watersheds, this study adopts a three-stage analytical framework: (1) RES quantification via multidimensional indicators, (2) scenario-based future projection, and (3) attribution analysis to uncover driving mechanisms. This integrative approach enables a holistic understanding of spatiotemporal dynamics and supports evidence-based ecological management.
First, we developed a multidimensional and integrative framework to quantify and evaluate watershed-scale RES under both current conditions and future scenarios. The framework includes five core dimensions—ERC, EP, EA, ES, and EV—each standardized through relevant ecological indicators. Analytical models were selected to match the functional nature of each dimension: the value equivalency scale for ERC and EP, the InVEST model for ES, the CASA model for EV, and landscape heterogeneity and connectivity indices for EA. The overall RES index is calculated as the geometric mean of the five components, offering a robust and balanced measure of resilience across functional and structural dimensions.
Second, to simulate future dynamics, two alternative development scenarios for the year 2030—Urban Development and Ecological Protection—were constructed by coupling the PLUS land use simulation model with CMIP6 climate projections. The year 2030 was chosen as a widely recognized forecasting benchmark that aligns with global sustainability targets and corresponds to a decadal projection horizon calibrated with observed land use data from 2010 to 2020. This setup provides a balance between predictive relevance and temporal uncertainty, enabling the simulation of RES patterns under different human–nature interaction pathways.
Third, to examine internal relationships and external drivers of resilience, we performed Spearman correlation analysis to assess synergies and trade-offs between resilience components. The GeoDetector model was applied to quantify the relative contributions of natural and anthropogenic factors to changes in RES, while Partial Least Squares Path Modeling (PLS-PM) was employed to explore the causal pathways through which climate, land use, and socioeconomic variables influence resilience dynamics. This multi-method workflow (
Figure 3) offers both descriptive and explanatory power, supporting comprehensive insight into watershed ecological resilience and informing spatially targeted strategies for the UYRB.
2.4. Ecosystem Resilience Assessment
Traditional frameworks for RES primarily focus on three dimensions: resistance, adaptability, and recovery [
33,
34,
35]. To offer a more holistic and robust assessment of watershed ecological resilience, this study introduces two additional indicators—ecosystem vitality [
36] and ecosystem services [
37]—building upon previous research. Ecosystem vitality is a critical indicator of an ecosystem’s productive capacity and overall health, reflecting the watershed’s ability to regenerate. Meanwhile, ecosystem services expand the traditional framework by highlighting the diverse roles of watershed ecosystems in supporting human livelihoods. By incorporating these indicators, this study provides a more integrated and multidimensional quantification of RES, particularly in assessing its long-term sustainability in the face of climate change and human impact.
Finally, the RES index is calculated as the geometric mean of these five core indicators, providing a synthetic index measure of overall RES at the basin scale. The specific formula for calculating RES is outlined below as follows:
To better capture the spatiotemporal dynamics of resilience, this study employs the natural breaks method, implemented using Python 3.9, within the resilience assessment framework. Raster data from multiple time periods are imported, and a unified threshold is calculated to assess the spatiotemporal changes in indicators at different levels. The data are then classified into three categories: high, medium, and low (
Table 1).
2.4.1. Ecosystem Recovery Capacity
ERC refers to an ecosystem’s ability to return to its original state after disturbance or degradation. It serves as a critical indicator for assessing the speed and extent of an ecosystem’s recovery from external shocks. Specifically, we quantify ERC through the recovery coefficient and LULC patterns, which reflect the ecosystem’s capacity to resist and adapt to environmental changes. The calculation formula and recovery coefficient are referenced from [
38], as follows:
where
ERC represents the ecosystem’s recovery capacity,
is the area of LULC type
i, and
is the ecosystem elasticity coefficient for LULC type
i.
In this study, the RC represents the relative capacity of each LULC type to restore its ecological structure and function after disturbance. Higher RC values reflect greater RES, typically found in LULC with high vegetation density, biodiversity, and self-regulation potential. Conversely, lower RC values indicate weaker recovery ability, often associated with intensive human modification or low ecosystem functionality. Based on the specific environmental and LULC conditions of the study area, the elasticity coefficients are assigned as follows: 0.3 for cropland, 0.8 for forest, 0.5 for grassland, 0.8 for water, 0.2 for construction land, and 1.0 for unused land.
2.4.2. Ecosystem Resistance
EP refers to an ecosystem’s ability to maintain stability in the face of external disturbances, reflecting its resistance to short-term shocks. In this study, EP is quantified using the Ecosystem Services Value (ESV), a composite indicator that monetizes multiple ecosystem services—such as food production, water regulation, climate moderation, and biodiversity maintenance—based on land use types. The estimation of ESV follows the equivalence factor method, in which the standard value of one unit of ecosystem service is derived from one-seventh of the annual grain yield value per hectare [
39]. This reference value serves as a benchmark for calculating the relative contribution of different land cover types to total ecosystem services [
40]. ESV is used here as a proxy for RES because it provides a broad and functional measure of the ecosystem’s economic and service-providing capacity. It captures both structural and functional aspects of ecological stability, offering a robust basis for assessing an ecosystem’s ability to buffer short-term shocks. The detailed calculation formula and process are provided in
Supplementary Materials.
2.4.3. Ecosystem Services
ES refers to the various benefits that ecosystems provide to human societies and biological communities, including supporting, regulating, and provisioning services. These services are essential for maintaining ecological balance and human well-being. Kohler et al. proposed a conceptual approach that uses ES as indicators for quantifying RES, exploring how individual ES functions may exhibit varying sensitivities to disturbances [
37], thereby emphasizing the pivotal role of ecosystem services in assessing ecosystem resilience.
In this study, the InVEST model is employed to quantify watershed ecosystem services, focusing on four core components: water yield (WY), habitat quality (HQ), carbon sequestration (CS), and soil conservation (SC). The relative importance of these ecosystem service functions varies across regions due to differences in ecological conditions and social needs. To account for the unique characteristics of the UYRB, the analytic hierarchy process (AHP) is used to assign weights to each service function and assess their relative significance (
Table 2). The weighted calculations yield a composite ecosystem service index tailored to this watershed, providing a more precise reflection of the region’s ecological features and their contributions to both ecological balance and human well-being. This model offers valuable scientific insights to inform management decisions. Detailed model principles and parameter settings are provided in
Supplementary Materials.
2.4.4. Ecosystem Vitality
EV refers to the efficiency and sustainability of material cycling and energy flow within an ecosystem, representing its ability to maintain ecological functions and support biodiversity under environmental stress. In this study, Net Primary Productivity (NPP) is used as a proxy for EV, as NPP indicates the total amount of carbon fixed by plants through photosynthesis, minus the carbon lost through respiration. It reflects both the productivity of plant communities under natural conditions and the overall quality of terrestrial ecosystems [
36]. To quantify EV, this study uses NPP, simulated by the CASA model, as the primary indicator.
2.4.5. Ecosystem Adaptability
EA refers to the ability of an ecosystem to adjust its structure and functions in response to environmental changes in order to maintain stability and ensure sustainable development. Adaptability is mainly assessed through indicators of landscape heterogeneity and connectivity, reflecting an ecosystem’s ability to mitigate external pressures by adjusting to and adapting to varying environmental conditions. In this study, we used the Shannon Diversity Index, Area-weighted Mean Patch Fractal Dimension, and the Contagion Index to represent spatial heterogeneity of landscapes. These indices capture the diversity of LULC types, the complexity of patch shapes, and the degree of patch aggregation within the landscape [
41]. Additionally, Patch Cohesion and the Landscape Fragmentation Index were employed to assess landscape connectivity, representing the ecosystem’s ability to support species migration and ecological processes.
Landscape indices were calculated using the ArcGIS 10.2 platform. Multi-year LULC data were clipped into a 10 km × 10 km grid (14,143 grid units) and processed using Fragstats 4.2 software. This approach facilitated precise landscape feature assessment at a consistent scale, providing robust data to support the analysis of an ecosystem’s capacity to adapt to external disturbances.
2.5. PLUS Model
The Patch-generating LULC Simulation PLUS model is a cellular automaton (CA)-based tool designed to simulate and forecast complex LULC changes. Detailed information on the model’s principles can be found in [
42,
43].
In this study, model predictions integrated both natural and socio-economic factors (
Table S6) and considered two future development scenarios: urban development scenario (UDS) and ecological protection scenario (EPS). The Markov Chain method [
44] was also employed to refine and optimize the transition probabilities between different LULC types. Detailed information on the transition probabilities is provided in
Section S3.2 of the Supplementary Materials, while the model’s simulation accuracy is presented in
Section S3.1.
2.6. Spearman Correlation Analysis
Spearman’s correlation is a non-parametric statistical method used to evaluate the strength and direction of the monotonic relationship between two variables. Unlike the Pearson correlation coefficient, which assumes a linear relationship and normal distribution of data, Spearman’s correlation is based on the ranks of the data rather than the raw values. This makes it particularly suitable for data that exhibits a monotonic but non-linear trend. In this study, Spearman correlation analysis was employed to examine the potential synergies and trade-offs among the five core dimensions of RES: EA, EV, ES, EP, and ERC. These dimensions often interact in complex, non-independent ways—an increase in one component may promote (synergy) or constrain (trade-off) others, depending on ecological and landscape conditions. Identifying such interdependencies is essential for understanding the internal consistency or conflict within the RES system and for informing integrated ecological management strategies. Operationally, raster data for EA, EV, ES, EP and ERC were assigned to 10 km × 10 km grid points using the “Extract Multi-values to Points” tool in ArcGIS 10.2. The data for each variable were then ranked, with tied values receiving the same rank. The rank differences for each pair of observations between the two variables were calculated and the differences squared and summed. The formula for the Spearman correlation coefficient is as follows:
where,
represents the Spearman correlation coefficient,
denotes the rank difference between each pair of observations in the two variables, where
, with
and
being the ranks of variables X and Y, respectively. The variable
n refers to the number of data pairs. This formula quantifies the strength of the monotonic relationship between the two variables by summing the squared differences in their ranks. The Spearman correlation coefficient ranges from −1 to +1, indicating a positive (direct) correlation or a negative (inverse) correlation between the variables.
2.7. The Optimal Parameter Geodetector
Geodetector is a statistical method used to identify spatial heterogeneity and explore the relationships between driving factors. It consists of four components: risk detector, factor detector, ecological detector, and interaction detector [
45]. The core concept involves evaluating the explanatory power of each independent variable in relation to the dependent variable by comparing the spatial distribution patterns of both [
46].
This study applies GeoDetector to quantitatively assess the relative contributions of natural and socioeconomic drivers to the spatial differentiation of RES, thereby addressing the key issue of the dominant factors driving RES changes in the UYRB.
The Optimal Parameter GeoDetector (OPGD) extends the GeoDetector methodological framework by optimizing parameters to identify the combination that maximizes the explanatory power (
q value) under various discretization methods [
47]. For each independent variable, OPGD considers multiple discretization parameter combinations, including the number of categories (3–10 classes) and discretization methods (e.g., natural breaks, equal intervals). By adjusting the number of classes, discretization method, and spatial scale, OPGD enhances the model’s explanatory capacity [
48]. The
q value corresponding to each discretization combination is then computed:
where
h represents the strata of variable
Y or factor
X, such as categories or regions,
Nh and
N denote the number of units in stratum ℎ and the entire region, respectively,
and
are the variances of
Y within stratum ℎ and the entire region, SSW is the sum of squared deviations within strata, and
SST is the total sum of squared deviations for the entire region.
2.8. Partial Least Squares Path Modeling
Partial Least Squares Path Modeling (PLS-PM) is a multivariate statistical method that combines path analysis with causal modeling, specifically designed to address structural equation models involving both latent and observed variables [
49].
In this study, the reflective model of PLS-PM was employed, wherein observed variables are treated as reflections of latent variables, to analyze the direct and indirect relationships between climate and natural driving factors, human activities, and RES. Raster data for observed variables were mapped onto a 10 km × 10 km grid using the “Extract Multi Values to Points” tool in ArcGIS 10.2. The resulting data underwent dimensionality reduction before being input into the PLS-PM model. A Goodness-of-Fit (GOF) value exceeding 0.6 was used as the criterion for a satisfactory model fit [
50]. The PLS-PM model was implemented using the PLS-PM package in R.
Table S13 presents the PLS-PM model specification. This table documents the overall modeling structure and fit performance;
Table S14 summarizes the estimated path coefficients between latent constructs and their statistical significance;
Table S15 provides a breakdown of total and indirect effects, allowing for interpretation of mediated causal pathways;
Table S16 reports outer model diagnostics, including indicator weights, loadings, and communality values, which collectively assess the reliability and validity of the measurement model.
This structured modeling approach enables a comprehensive understanding of the complex interactions governing RES and supports robust ecological decision-making.
3. Results
3.1. Spatiotemporal Dynamics of RES in the UYRB
3.1.1. Spatiotemporal Variations in Indicators
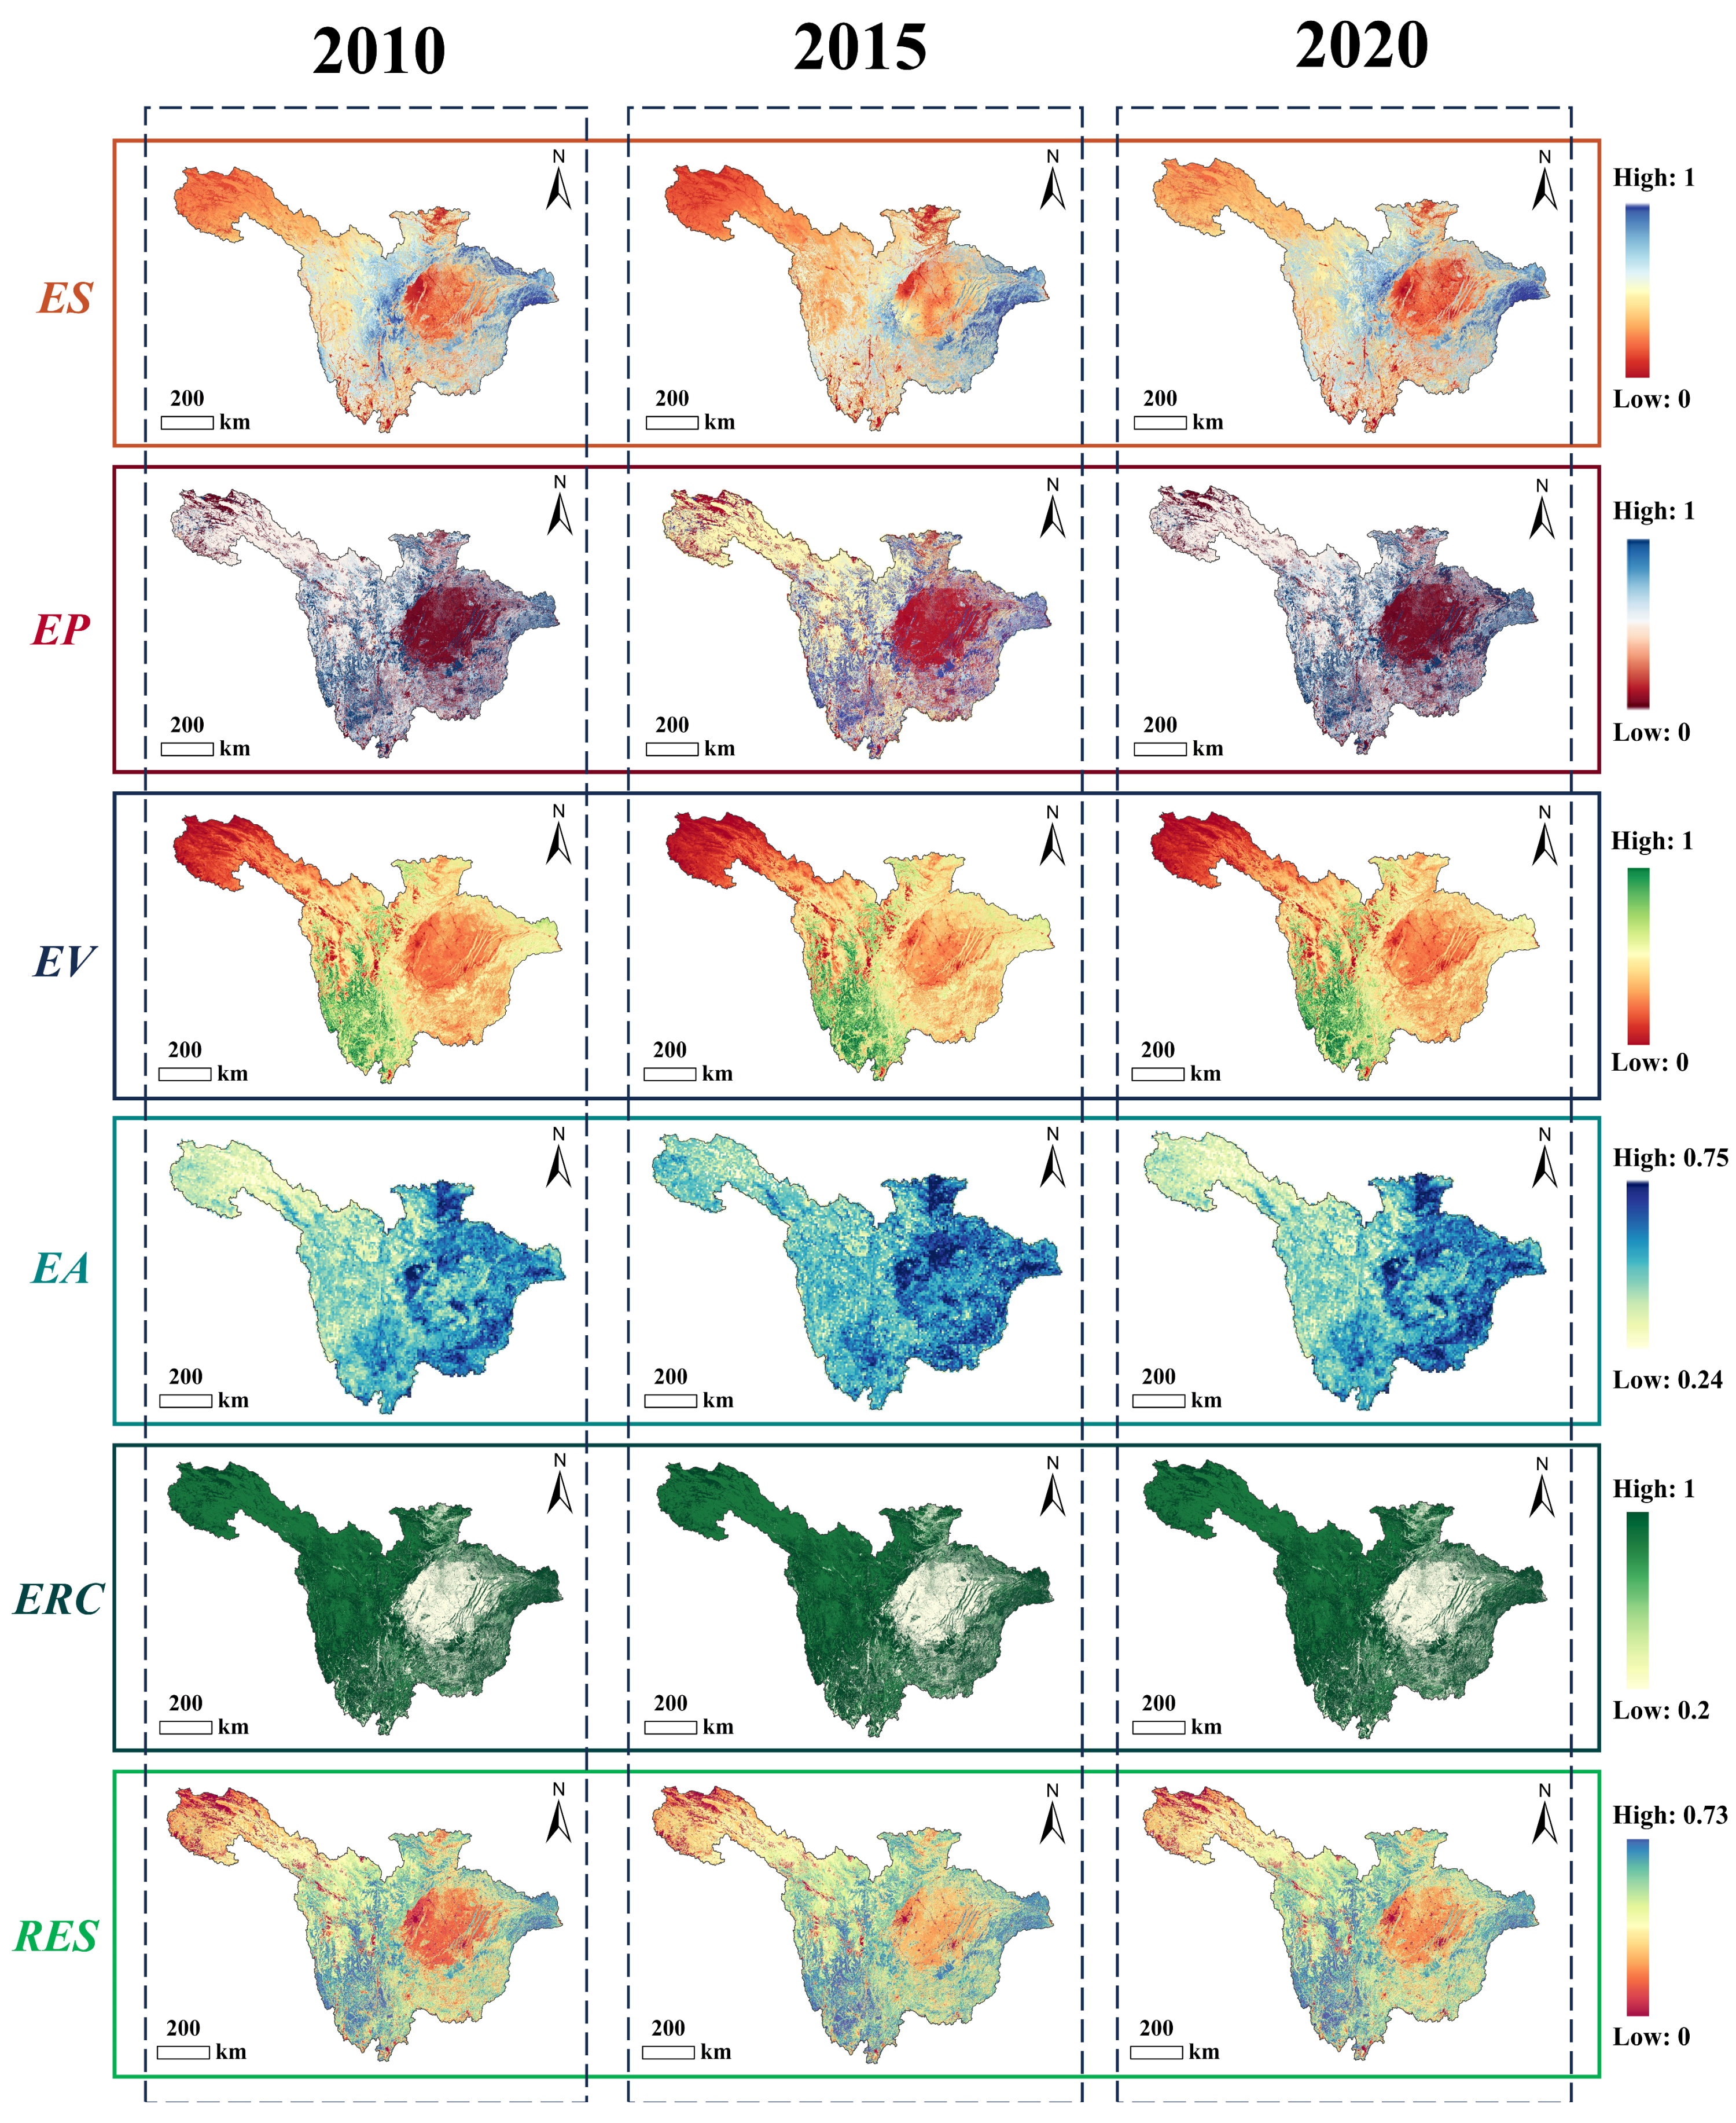
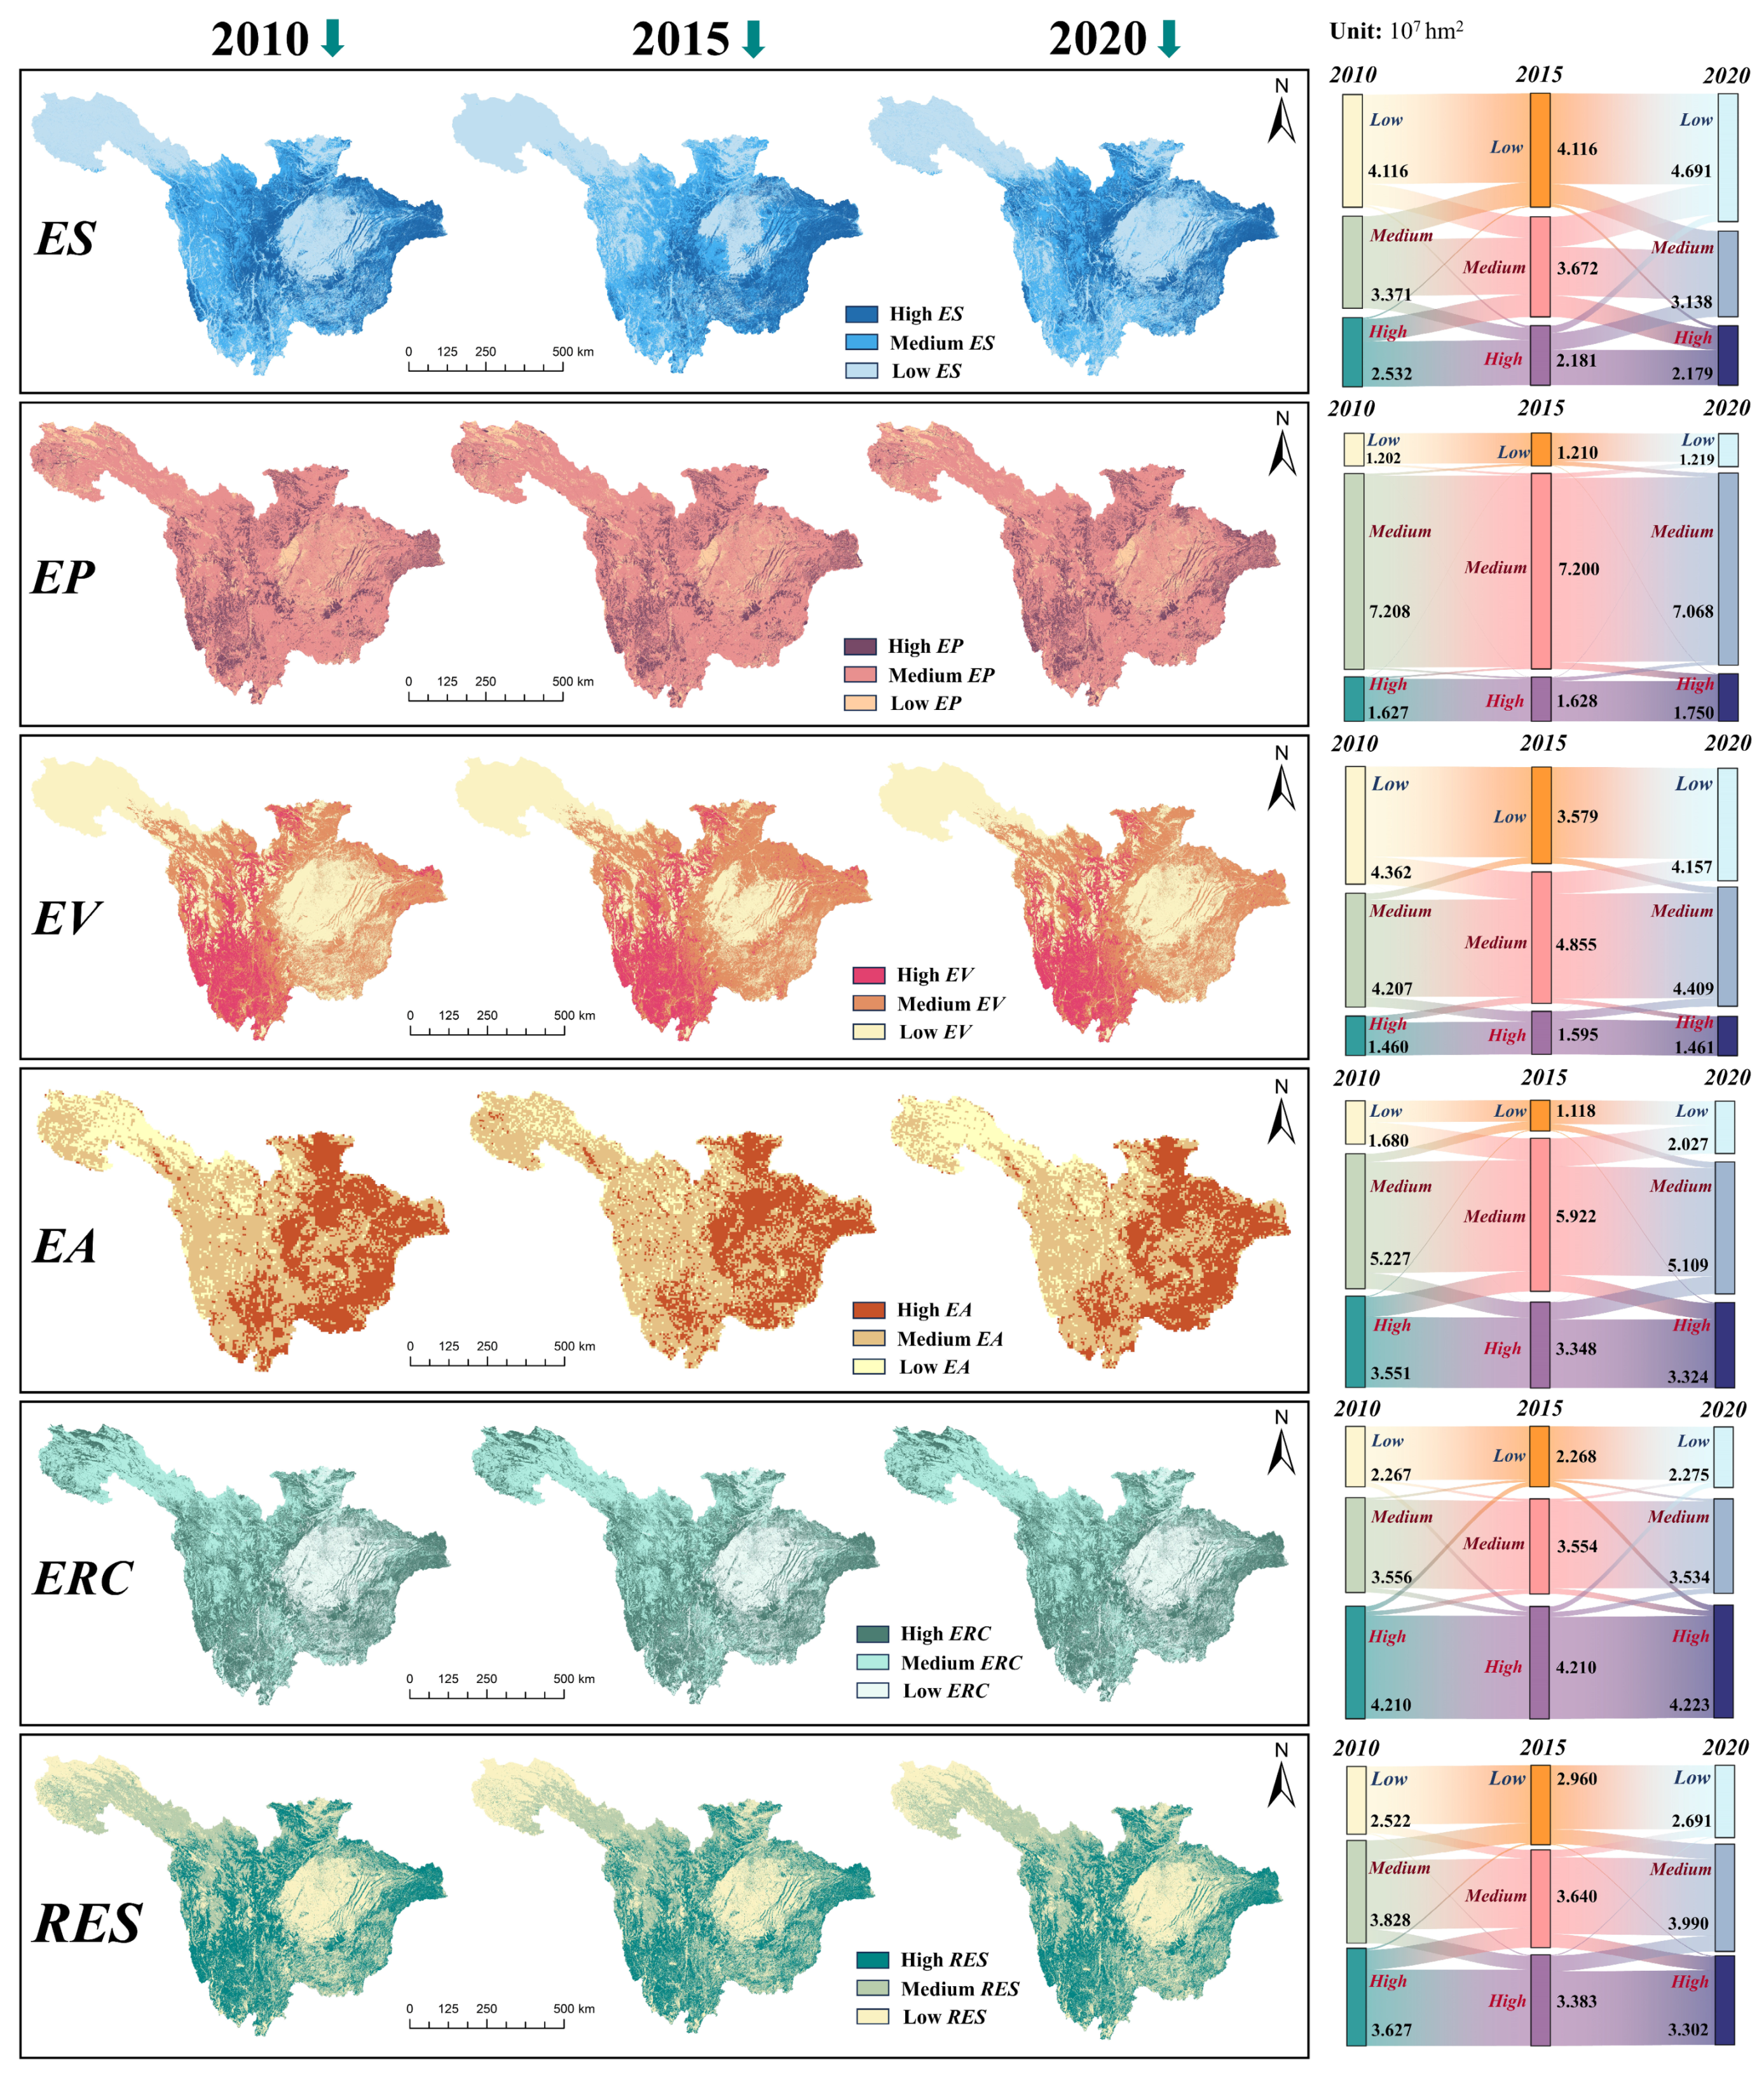
Between 2010 and 2020, RES and its key indicators (ES, EP, EA, EV, ERC) in the UYRB underwent significant spatiotemporal changes (
Figure 4). The average RES level declined by 2.80%, influenced by LULC changes, climate change, urban expansion, and ecological protection policies. Spatially, ES, EV, EA, and ERC showed a “low in the center, high in the periphery” pattern, while EP and EV were notably higher in the southwest. High ES areas concentrated along the central basin’s periphery and high EV areas in the study core.
During this period, ES were notably influenced by human activities, particularly LULC changes from urban expansion in central and northern regions. The low ES area increased from 4.116 × 10
7 hm
2 to 4.691 × 10
7 hm
2, most significantly in rapidly urbanizing central areas (
Figure 5), linked to reduced green spaces and wetlands, as urban sprawl weakened ecosystem provisioning services. The less human-affected western region maintained higher ES, highlighting the role of green spaces and protected areas in preserving ecosystem services.
EP and ERC were higher in southern and eastern mountainous regions, lower in urbanized areas. In rapidly urbanizing central regions, low EP and ERC areas increased significantly to 1.219 × 10⁷ hm2 and 2.275 × 10⁷ hm2, respectively, reflecting human activities’ detrimental impact on ecosystem stability. EP and ERC enhancement derived primarily from the recovery capacity of green areas like forests and grasslands, particularly evident in the southern mountainous regions. Urbanization-induced land degradation hindered ecosystems’ resistance to external disturbances, making the central region representative of low EP and ERC.
EV showed considerable regional variation between 2010 and 2020. Southern forested and hilly regions maintained high EV, tied to their carbon sequestration, biological productivity, and water conservation. Since 2015, northern EV levels declined, with the low EV area increasing from 3.579 × 10⁷ hm2 in 2015 to 4.157 × 10⁷ hm2 in 2020, driven by reduced vegetation cover and land degradation. Southern EV levels were sustained by ongoing ecological protection policies and effective green space management.
As a composite measure, RES exhibited distinct phase-specific changes. Between 2010 and 2015, urban expansion significantly impacted basin RES, with the low RES area increasing from 2.522 × 10⁷ hm2 to 2.960 × 10⁷ hm2, indicating a notable decline. From 2015 to 2020, after ecological protection policies, RES levels gradually improved, surpassing 2010 levels. High RES areas are concentrated in the southwest and eastern regions with abundant forests and grasslands, while low RES areas concentrated in central urbanized regions and northwestern unused lands. Improvements in ES and EP were critical to enhancing RES, with changes in EV and ERC also contributing to overall basin ecological resilience recovery. In summary, UYRB ecological resilience changes between 2010 and 2020 resulted from combined factors: urban expansion weakened ES and EV in the central region, while ecological protection policies positively impacted RES in the southwest and eastern regions.
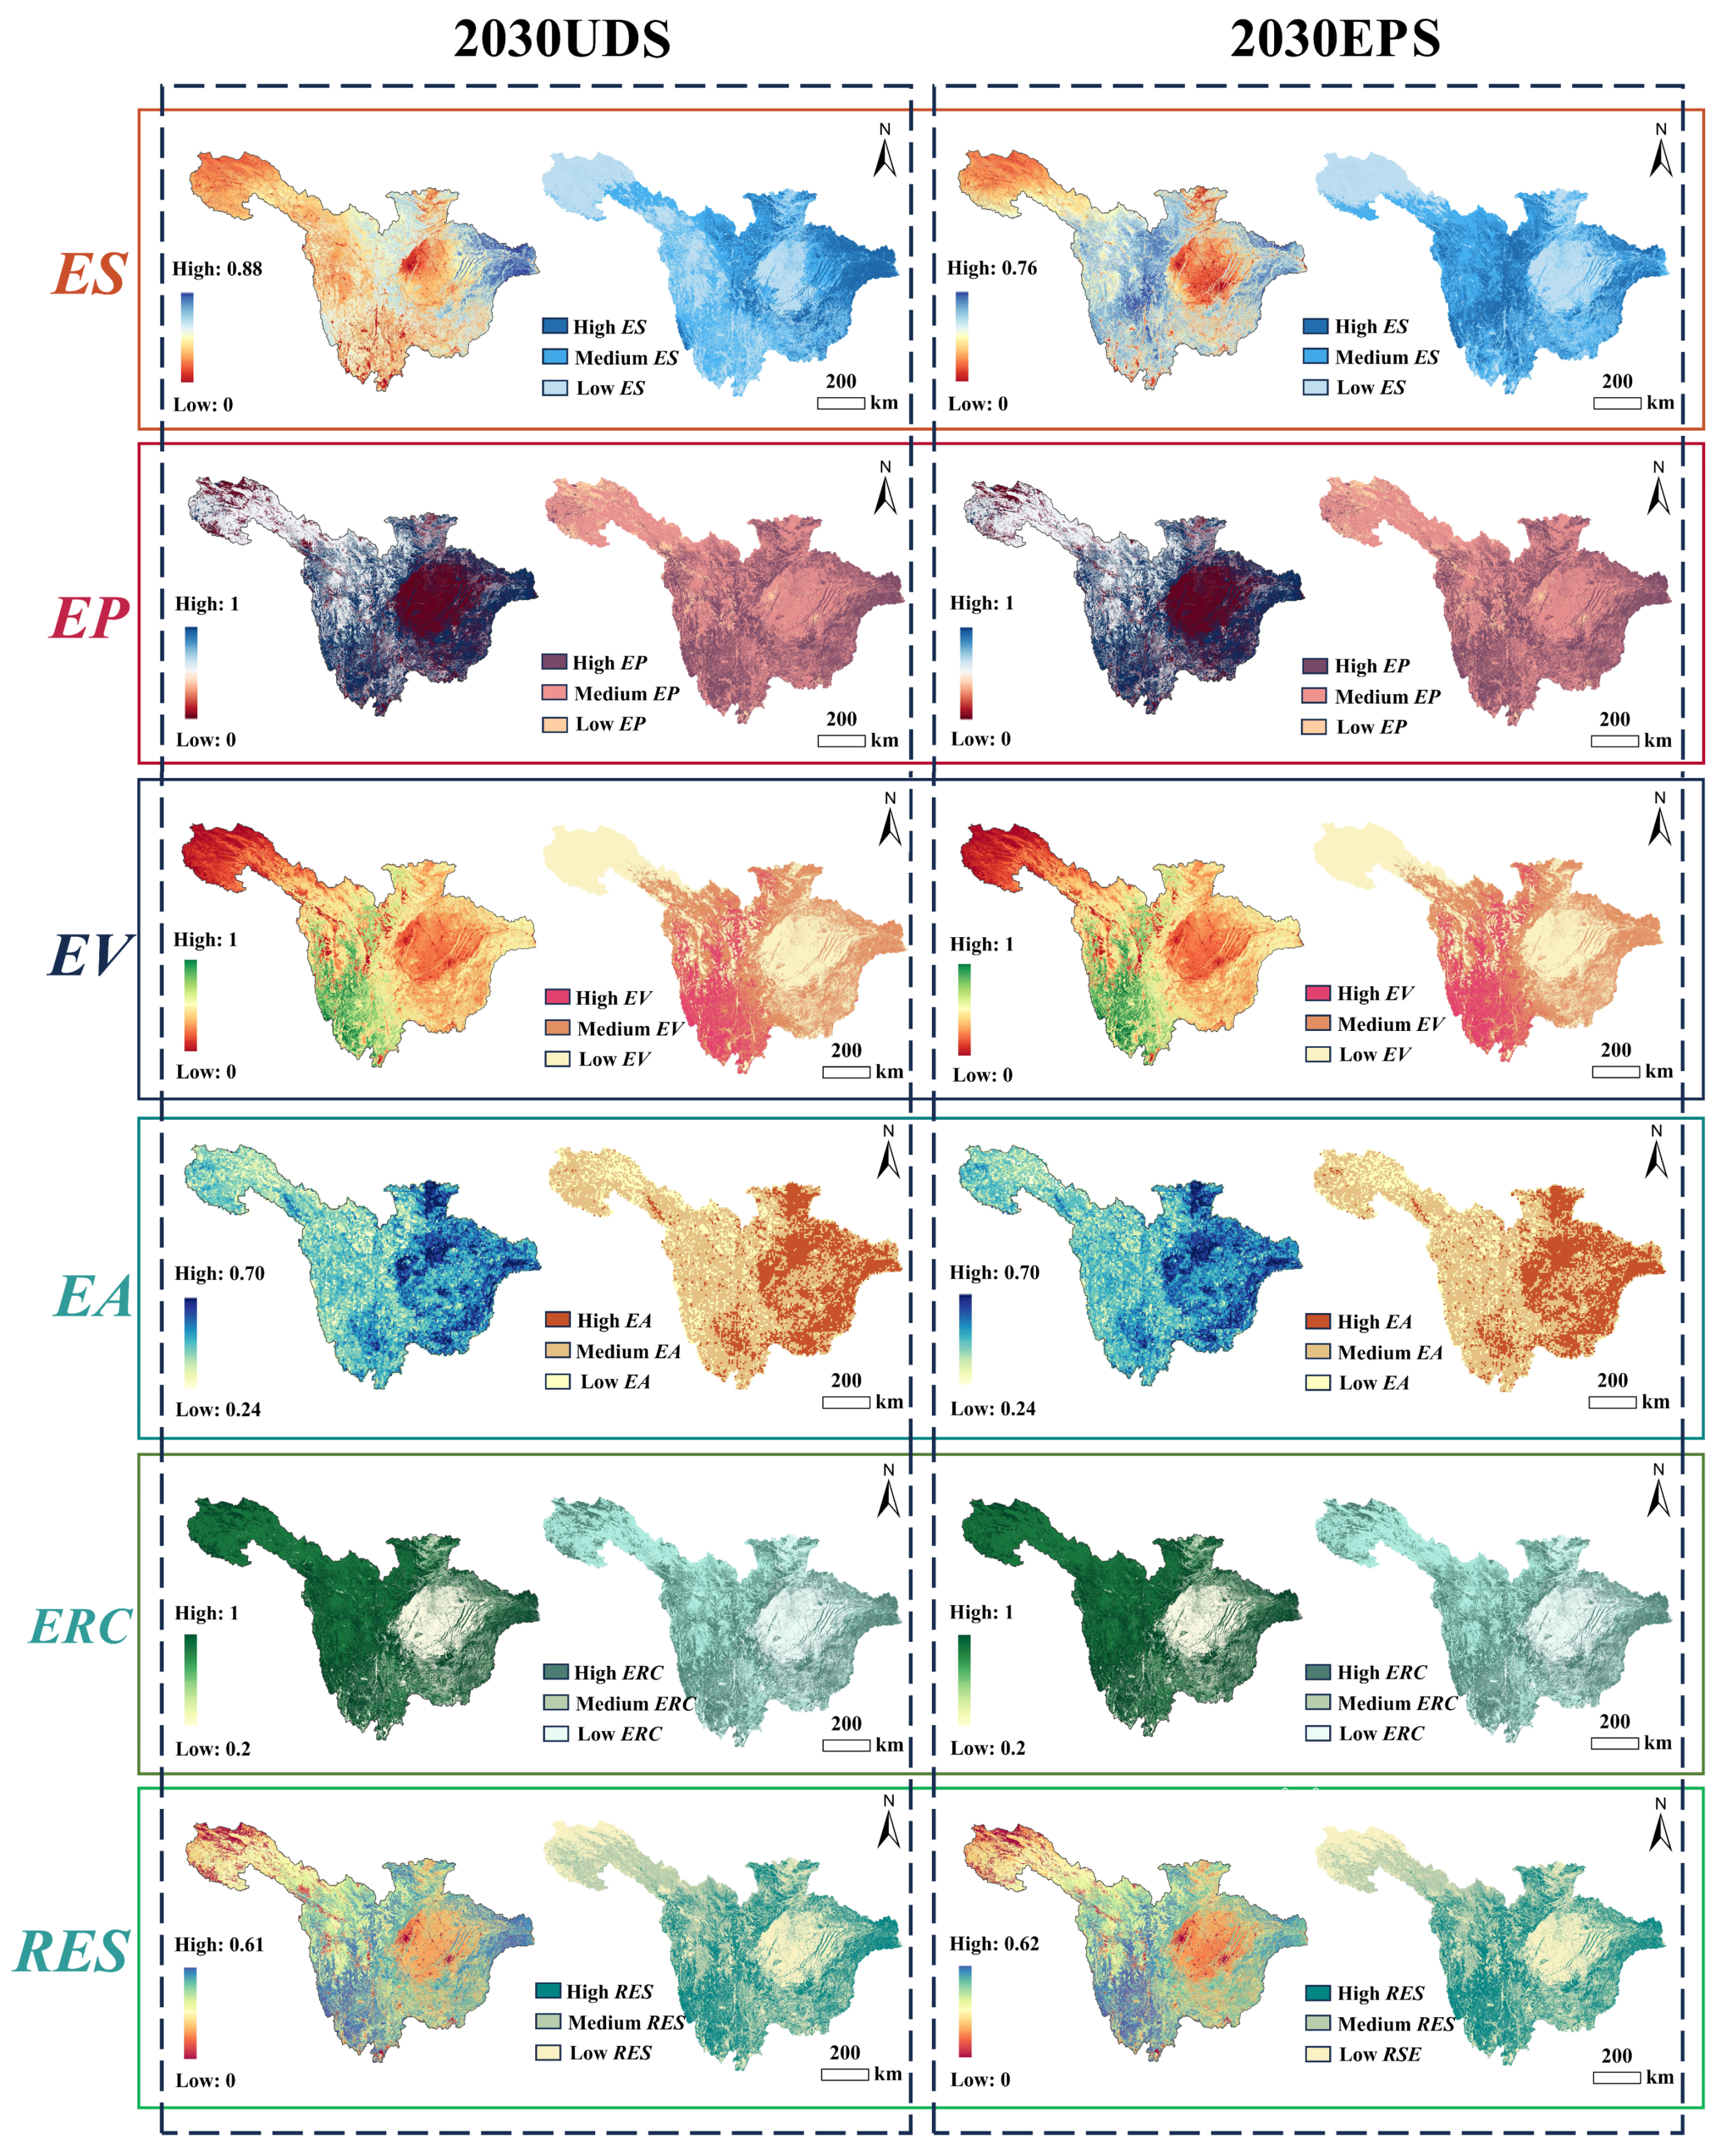
3.1.2. Spatial Simulation of RES Under Future Scenarios
The 2030 simulations of the UDS and EPS (
Figure 6) highlight the significant impact of LULC and climate change on RES and its constituent indicators. Specifically, the average RES level in the UDS is 2.69% lower than in the EPS. The most notable spatial differences occur in the distribution of ES and EV, while the changes in EP, EA, and ERC are more concentrated in specific regions. These differences stem from the dual influence of LULC and climate factors on ES and EV, whereas the changes in EP, EA, and ERC are primarily driven by LULC changes.
In the UDS, rapid urban expansion in the central and eastern basin exerted significant pressure, reducing ES and EV, expanding low-ES areas due to rising land development intensity, weakening key services like water conservation and climate regulation, and, combined with high temperatures and uneven precipitation, sharply lowering ecological productivity with EV below the EPS; the less human-disturbed western region, with natural reserves, alleviated urbanization’s negative effects though some areas saw suppressed EA and ERC, while urban fringe green space encroachment impaired EP and ERC connectivity, weakening edge ecosystem stability and recovery capacity.
In contrast, the EPS enhanced ES, EV, and overall basin ecological resilience by restricting urban expansion and prioritizing green space protection it prevented ES erosion in the central plains with higher ES than UDS, boosted water conservation and soil retention in the southern region maintaining high EV, improved ERC and EP connectivity in western reserves and central hills to withstand disturbances, optimized ecological resilience distribution, mitigated urban expansion and climate change impacts in key regions central plains, southeastern hills, western reserves, and, aided by favorable precipitation and temperature, strengthened ecological functions and green space benefits.
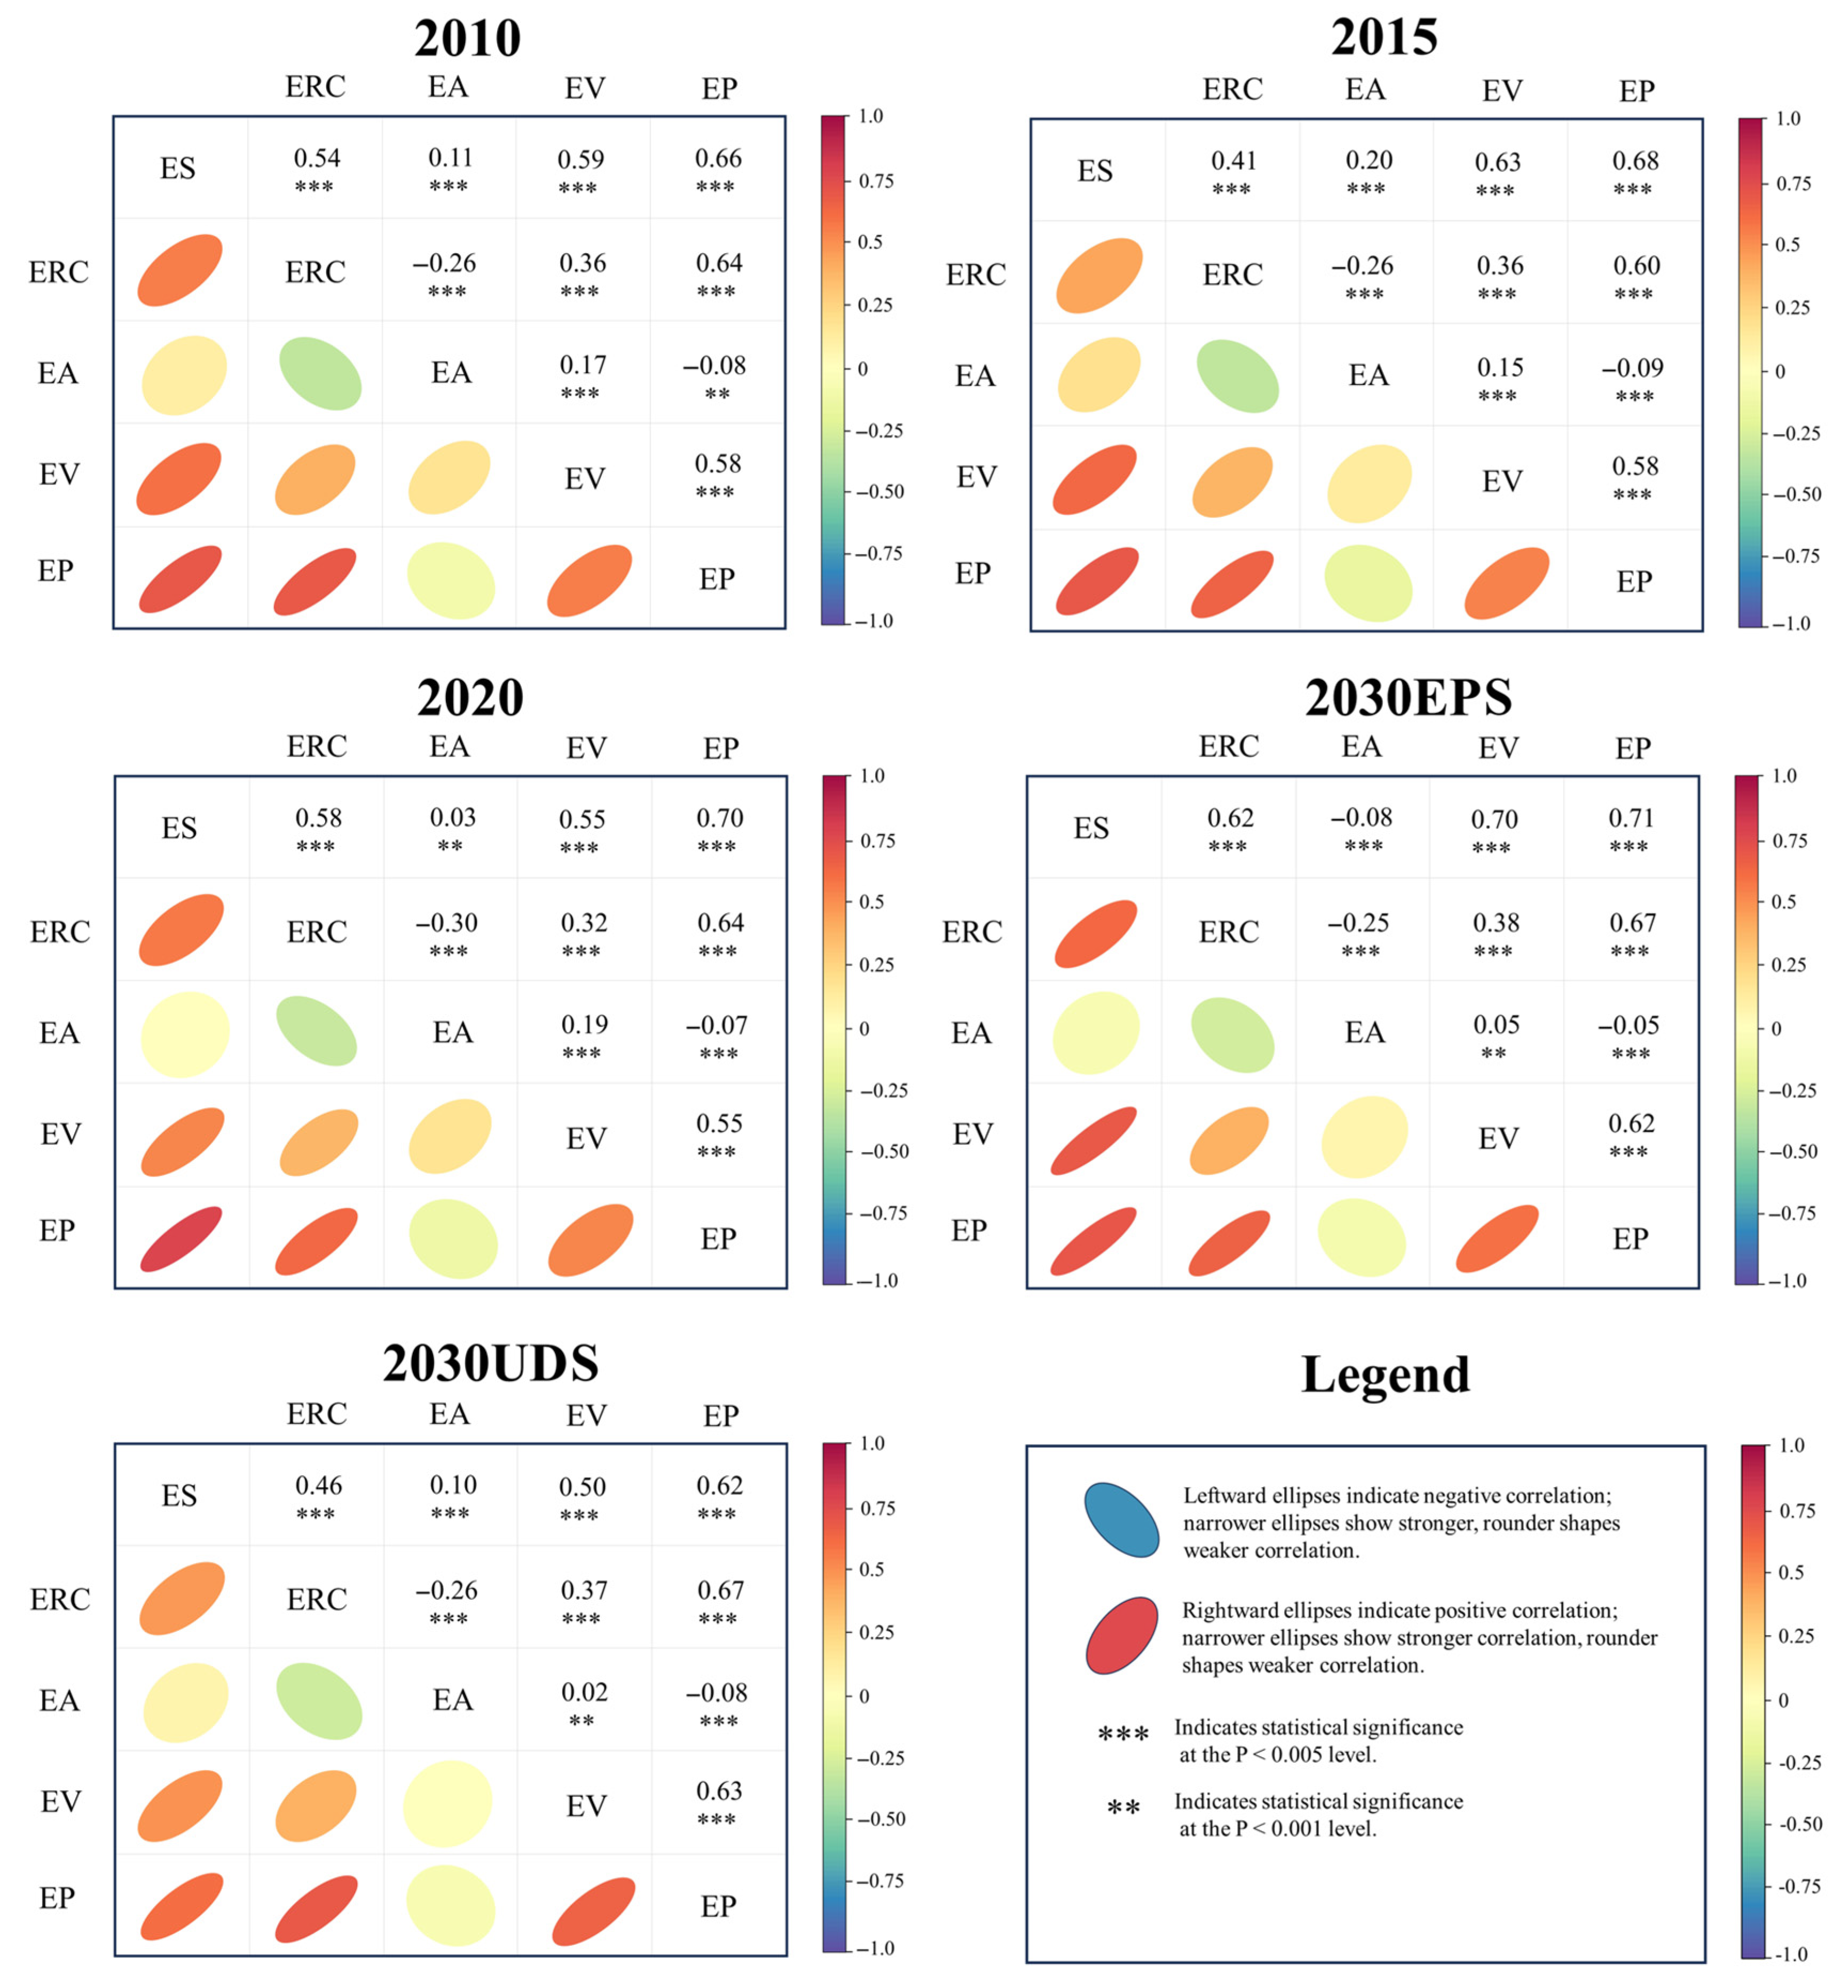
3.2. Trade-Offs and Synergies Among ER, EP, ES, EV, and EA
As shown in
Figure 7, the trade-offs (negative correlations) and synergies (positive correlations) among various indicators over different periods and scenarios highlight the dynamic characteristics of RES. Overall, ES, EV, and EP exhibit strong synergies, particularly by 2020, where the correlation coefficient between ES and EP increases to 0.70. Additionally, the positive correlation between ES and EV is significant across different scenarios, indicating that improvements in ecosystem services are generally accompanied by enhanced system vitality. This synergistic relationship among the three indicators is further strengthened in the EPS, suggesting that protective measures enhance the coupling of system stability and service functions.
ERC and EA display a more complex trade-off relationship. In all years and scenarios, ERC and EA are consistently negatively correlated, with the correlation coefficient ranging from −0.26 to −0.30, and the relationship remains significant. ERC is positively correlated with ES, EV, and EP, particularly in the 2030 UDS and EPS, where the correlation coefficient between ERC and EP reaches 0.67. As the core indicator of system recovery, ERC plays a crucial role in enhancing overall RES by resisting disturbances and rebuilding system stability. Despite some compromises in adaptability, ERC’s contribution to overall ecological resilience remains substantial.
EA behaves relatively independently, with weaker correlations to other indicators. In future scenarios, the correlation between EA and ES or EP approaches zero, suggesting that adaptability is more dependent on the system’s self-adjustment and long-term response to environmental changes, rather than being directly constrained by other resilience indicators. Furthermore, the synergy between EA and EV significantly weakens in both the UDS and EPS compared to the 2010–2020 period, indicating that future urban expansion or ecological protection measures may further weaken the mutually reinforcing relationship between the two.
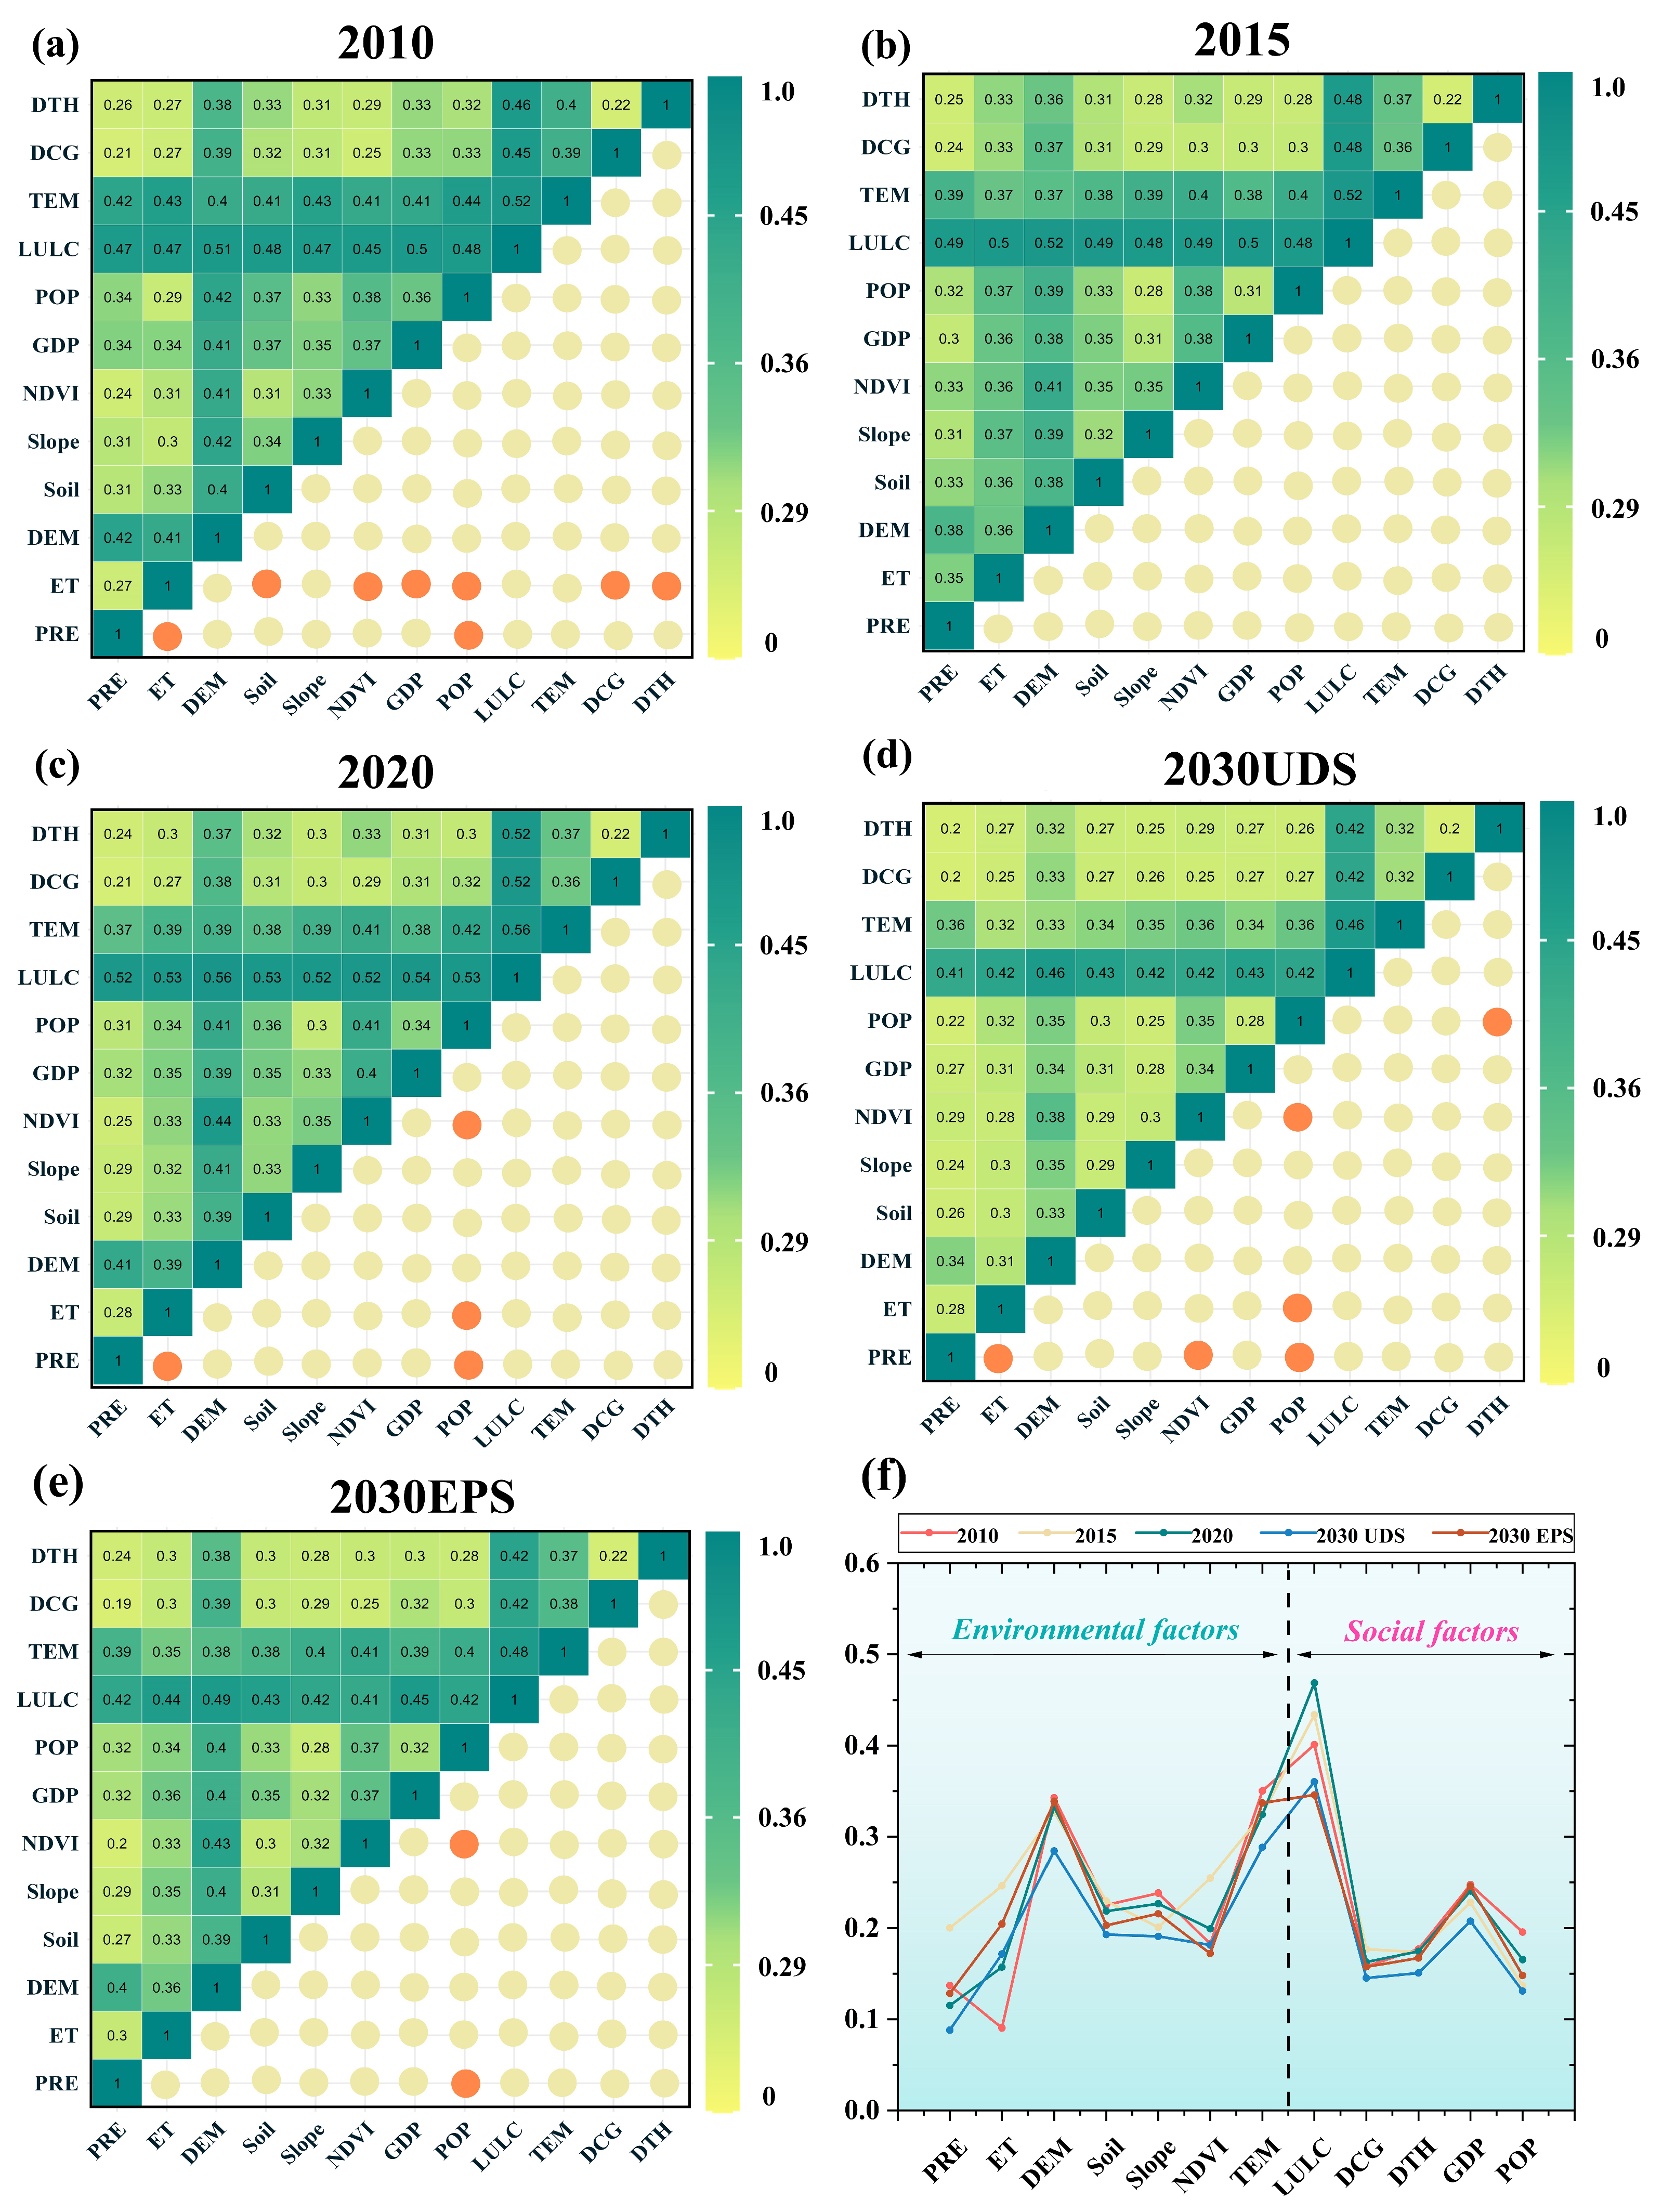
3.3. Analysis of RES Driving Factors Based on OPGD
Between 2010 and 2020, RES in the UYRB was influenced by both natural and socio-economic factors, with their driving effects exhibiting significant spatiotemporal variation (
Figure 8). Among the environmental factors, PRE and DEM played a consistently fundamental role, with q-values remaining stable at 0.21–0.23 and 0.32–0.34, respectively. Meanwhile, the influence of ET increased notably, with the
q-value rising from 0.09 in 2010 to 0.25 in 2015.
Regarding socio-economic factors, the influence of LULC steadily increased over the years, with its q-value rising from 0.40 in 2010 to 0.47 in 2020. This reflects the growing pressure on the ecosystem due to urbanization and agricultural expansion. Additionally, the q-values for POP and GDP increased to 0.17 and 0.24, respectively, by 2020, indicating that the intensification of socio-economic activities has increasingly impacted the ecosystem.
Interaction detector analysis revealed that the interactive effects between natural and social factors on RES have strengthened over time. Notably, the interactions between precipitation and LULC, as well as ET and POP, significantly increased in 2015 and 2020. Overall, environment factors remained the dominant drivers of RES between 2010 and 2020, although the importance of social factors notably increased. The interaction between natural and social factors played an increasingly significant role in regulating ecosystem stability.
In the two future scenarios, the impacts of RES drivers are markedly differentiated. In the UDS, LULC emerges as the primary driver, with a q-value of 0.37, reflecting the significant pressure urban expansion exerts on the ecosystem. In contrast, in the EPS, environment factors such as terrain and temperature assume a stronger driving role, both with q-values of 0.34, while the influence of social factors is relatively weaker. This suggests that, under the EPS, the supportive role of environment factors in enhancing RES is more pronounced.
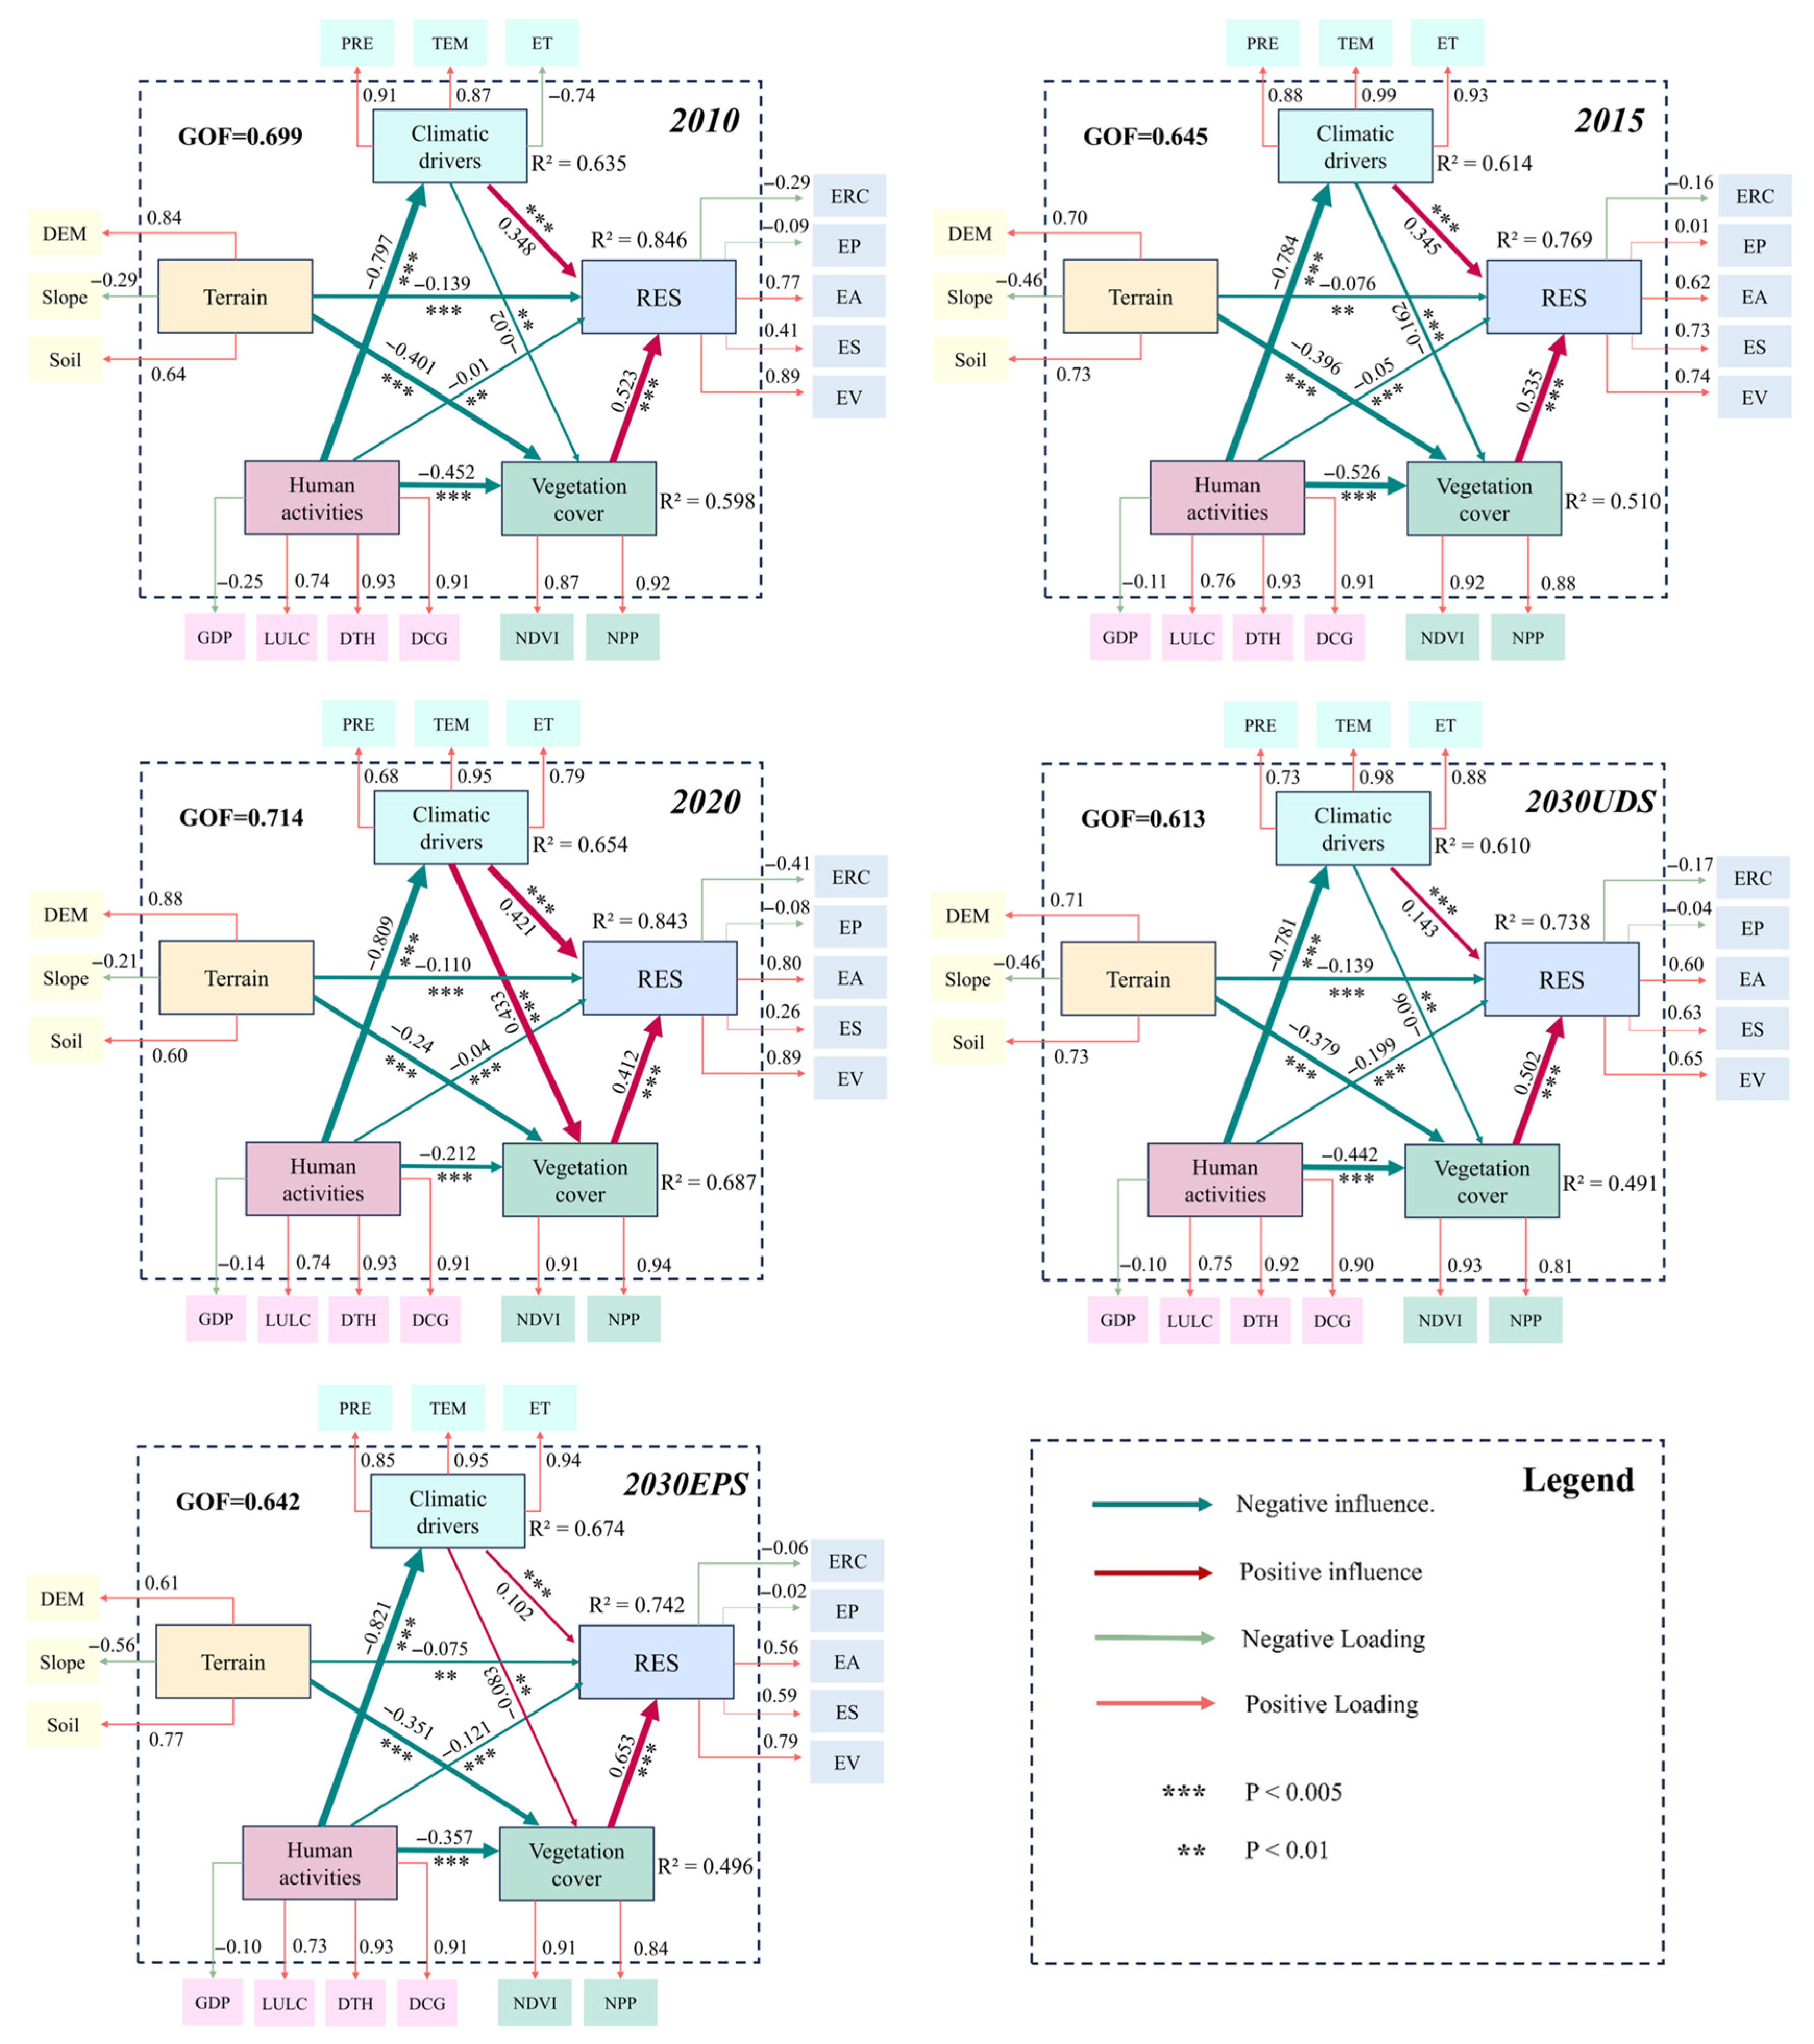
3.4. Vertical Path Analysis of RES Determinants in the Watershed Based on PLS-PM
The path analysis results from the PLS-PM (
Figure 9) elucidate the roles of climate, terrain, vegetation cover, and human activities in the dynamic evolution of RES in the UYRB. Between 2010 and 2020, the principal drivers of RES exhibited notable temporal variations. Initially, climate factors played a significant positive role in driving RES in 2010, with a path coefficient of 0.348; however, this effect gradually diminished to 0.212 by 2020. Conversely, the influence of vegetation factors on RES progressively strengthened, with the path coefficient increasing from 0.522 in 2010 to 0.687 in 2020. In the 2030 projections, the positive effect of vegetation on RES was further enhanced under the EPS, reaching a path coefficient of 0.653. In contrast, under the UDS, the influence of vegetation weakened (path coefficient of 0.502).
Terrain factors exhibited a consistently negative impact on RES between 2010 and 2020, with path coefficients of −0.139, −0.076, and −0.11, respectively, reflecting their inhibitory role on ecosystem resilience. Moreover, the impact of terrain on vegetation also showed a negative correlation, with path coefficients of −0.401 and −0.396 in 2010 and 2015, respectively, weakening to −0.24 by 2020. In contrast, human activities had a relatively modest negative effect on RES during this period, with path coefficients ranging from −0.01 to −0.05, suggesting a limited suppressive effect on ecosystem functions. However, by 2030, human activities were projected to exert a significantly stronger negative impact in the UDS, with a path coefficient of −0.199, while in the EPS, the negative effect was notably reduced (path coefficient of −0.121).
In summary, both climate and vegetation factors continued to provide substantial positive support for RES throughout the study period, although the relative contribution of these factors evolved in response to changing environmental conditions and human activities.
4. Discussion
4.1. The Trends in the Evolution of the RES in the UYRB
This study focuses on monitoring and assessing the dynamic changes in RES across the UYRB at a grid scale. Spatial analysis reveals that the most significant changes in RES occurred in the central urbanized and agricultural areas, particularly in regions undergoing rapid urban expansion. Between 2010 and 2015, RES levels in the central basin saw a marked improvement, primarily driven by increased agricultural productivity and the implementation of localized ecological restoration initiatives. Advances in agricultural technology enhanced EP and ES, contributing positively to the overall improvement in RES. Furthermore, local vegetation restoration projects, such as small-scale ecological forest restoration and water resource management, supported the watershed’s resilience. However, during this period, economic development remained a primary focus, and the adverse effects of human activities had not yet fully materialized. The pace and extent of land development were relatively moderate, limiting the suppressive effects on RES.
The introduction of ecological protection policies had a significant impact on the spatiotemporal variations in RES. The 2015 ecological redline protection policy began to restrict land development [
51], while the 2020 Yangtze River Protection Law provided comprehensive legal safeguards for the watershed’s ecosystem [
52]. However, the full benefits of these policies were not immediately apparent, as ecosystem restoration is a long-term process. Between 2015 and 2020, the lingering ecological damage from the previous expansion of impermeable surfaces contributed to a slight decline in RES. This underscores the delayed effects of ecological protection policies and highlights the need for stronger enforcement and sustained long-term efforts to safeguard ecosystem health [
53]. In urbanizing areas, the emphasis should be on optimizing land use and adopting low-impact development approaches, while in resource-scarce regions, strengthening ecological restoration and resource management is essential to enhancing RES and achieving long-term ecological balance and sustainable development in the UYRB.
4.2. Interactions and Potential Mechanisms Between Climate Change, Human Activities, and RES
This study has revealed the complex relationships between climate change, human activities, topography, vegetation cover, and RES and has quantitatively analyzed the driving mechanisms and spatial differentiation characteristics of these factors. The study has found that climate change and vegetation cover are the core driving factors of RES dynamic changes, while human activities, by affecting the interaction between climate and vegetation, have jointly shaped the spatiotemporal evolution process of RES. Previous studies have shown that changes in PRE and ET directly affect water resources and vegetation distribution, and significantly increase RES levels [
54]; however, when PRE is insufficient or high temperatures intensify ET, the beneficial effects of climate change may weaken or even reverse [
55], and this study has further demonstrated that such changes can become a potential threat to ecosystem stability. For instance, in the central urbanized areas, although increased precipitation has somewhat improved ecological functions, the urban heat island effect—driven by rising temperatures and higher ET—has exacerbated water resource pressures and hindered vegetation recovery capacity [
56]. This combined effect of climate change and urban expansion presents a significant challenge to RES, consistent with previous studies on the impact of urbanization on ecological systems [
57].
Human activities play a critical role in the spatial heterogeneity of RES. In the OPGD analysis, LULC, either as a standalone factor or in interaction with other variables, demonstrated significantly higher explanatory power for RES compared to other factors. In areas experiencing concentrated urbanization and agricultural expansion, excessive land development, the spread of impermeable surfaces, and the reduction of ecological land directly undermine ES, EP, and EV [
58]. Human activities also exert a substantial negative impact on climate and vegetation, especially in urban areas, where development-induced destruction of vegetation and alterations to soil structure further reduce EA and ERC. However, in regions with stringent policy enforcement, such as the nature reserves in the southern watershed, the negative impact of human activities on RES is significantly mitigated, underscoring the importance of scientific LULC planning and policy intervention in alleviating the pressures of human activities [
59].
4.3. Limitations
This study simulates future LULC distribution under different scenarios using the PLUS model, integrated with CMIP6 climate projections. It estimates ES, EV, EA, ERC, and EP at the raster scale. The models employed for simulation include PLUS for LULC, the CASA model for NPP estimation, and the InVEST model for ecosystem service functions.
However, the applicability and limitations of these models can influence the reliability of the simulation results and the robustness of decision-making processes. Firstly, the PLUS model, which identifies the contributions of driving factors for LULC change within the LEAS rule mining framework, lacks the consideration of policy factors. This omission may reduce the simulation’s responsiveness to complex socio-economic contexts [
60]. Secondly, the CASA model, used for estimating NPP, is constrained by parameters such as light use efficiency, NDVI threshold settings, and data resolution, which can compromise the accuracy of local predictions [
61]. Finally, the InVEST model, which depends on fixed parameters and static input assumptions, fails to capture dynamic changes and nonlinear processes, limiting its accuracy in complex ecosystems [
62]. To mitigate these uncertainties, this study enhanced model reproducibility through multiple simulations and parameter adjustments. Nonetheless, management decisions should carefully account for these inherent uncertainties to avoid over-reliance on the model outcomes.
4.4. The Optimization of Watershed Management and Sustainable Development Recommendations
Future watershed management must balance ecological protection and socio-economic development. Due to high regional heterogeneity in the UYRB, a one-size-fits-all approach is ineffective. Urbanized areas should limit impermeable surface expansion, while ecologically sensitive areas need enhanced vegetation protection. Additionally, development strategies exhibit a lag effect on RES; decision-makers should anticipate long-term policy impacts, implement dynamic monitoring, and ensure management strategies address current needs and future challenges to support the health and sustainability of the watershed ecosystem.
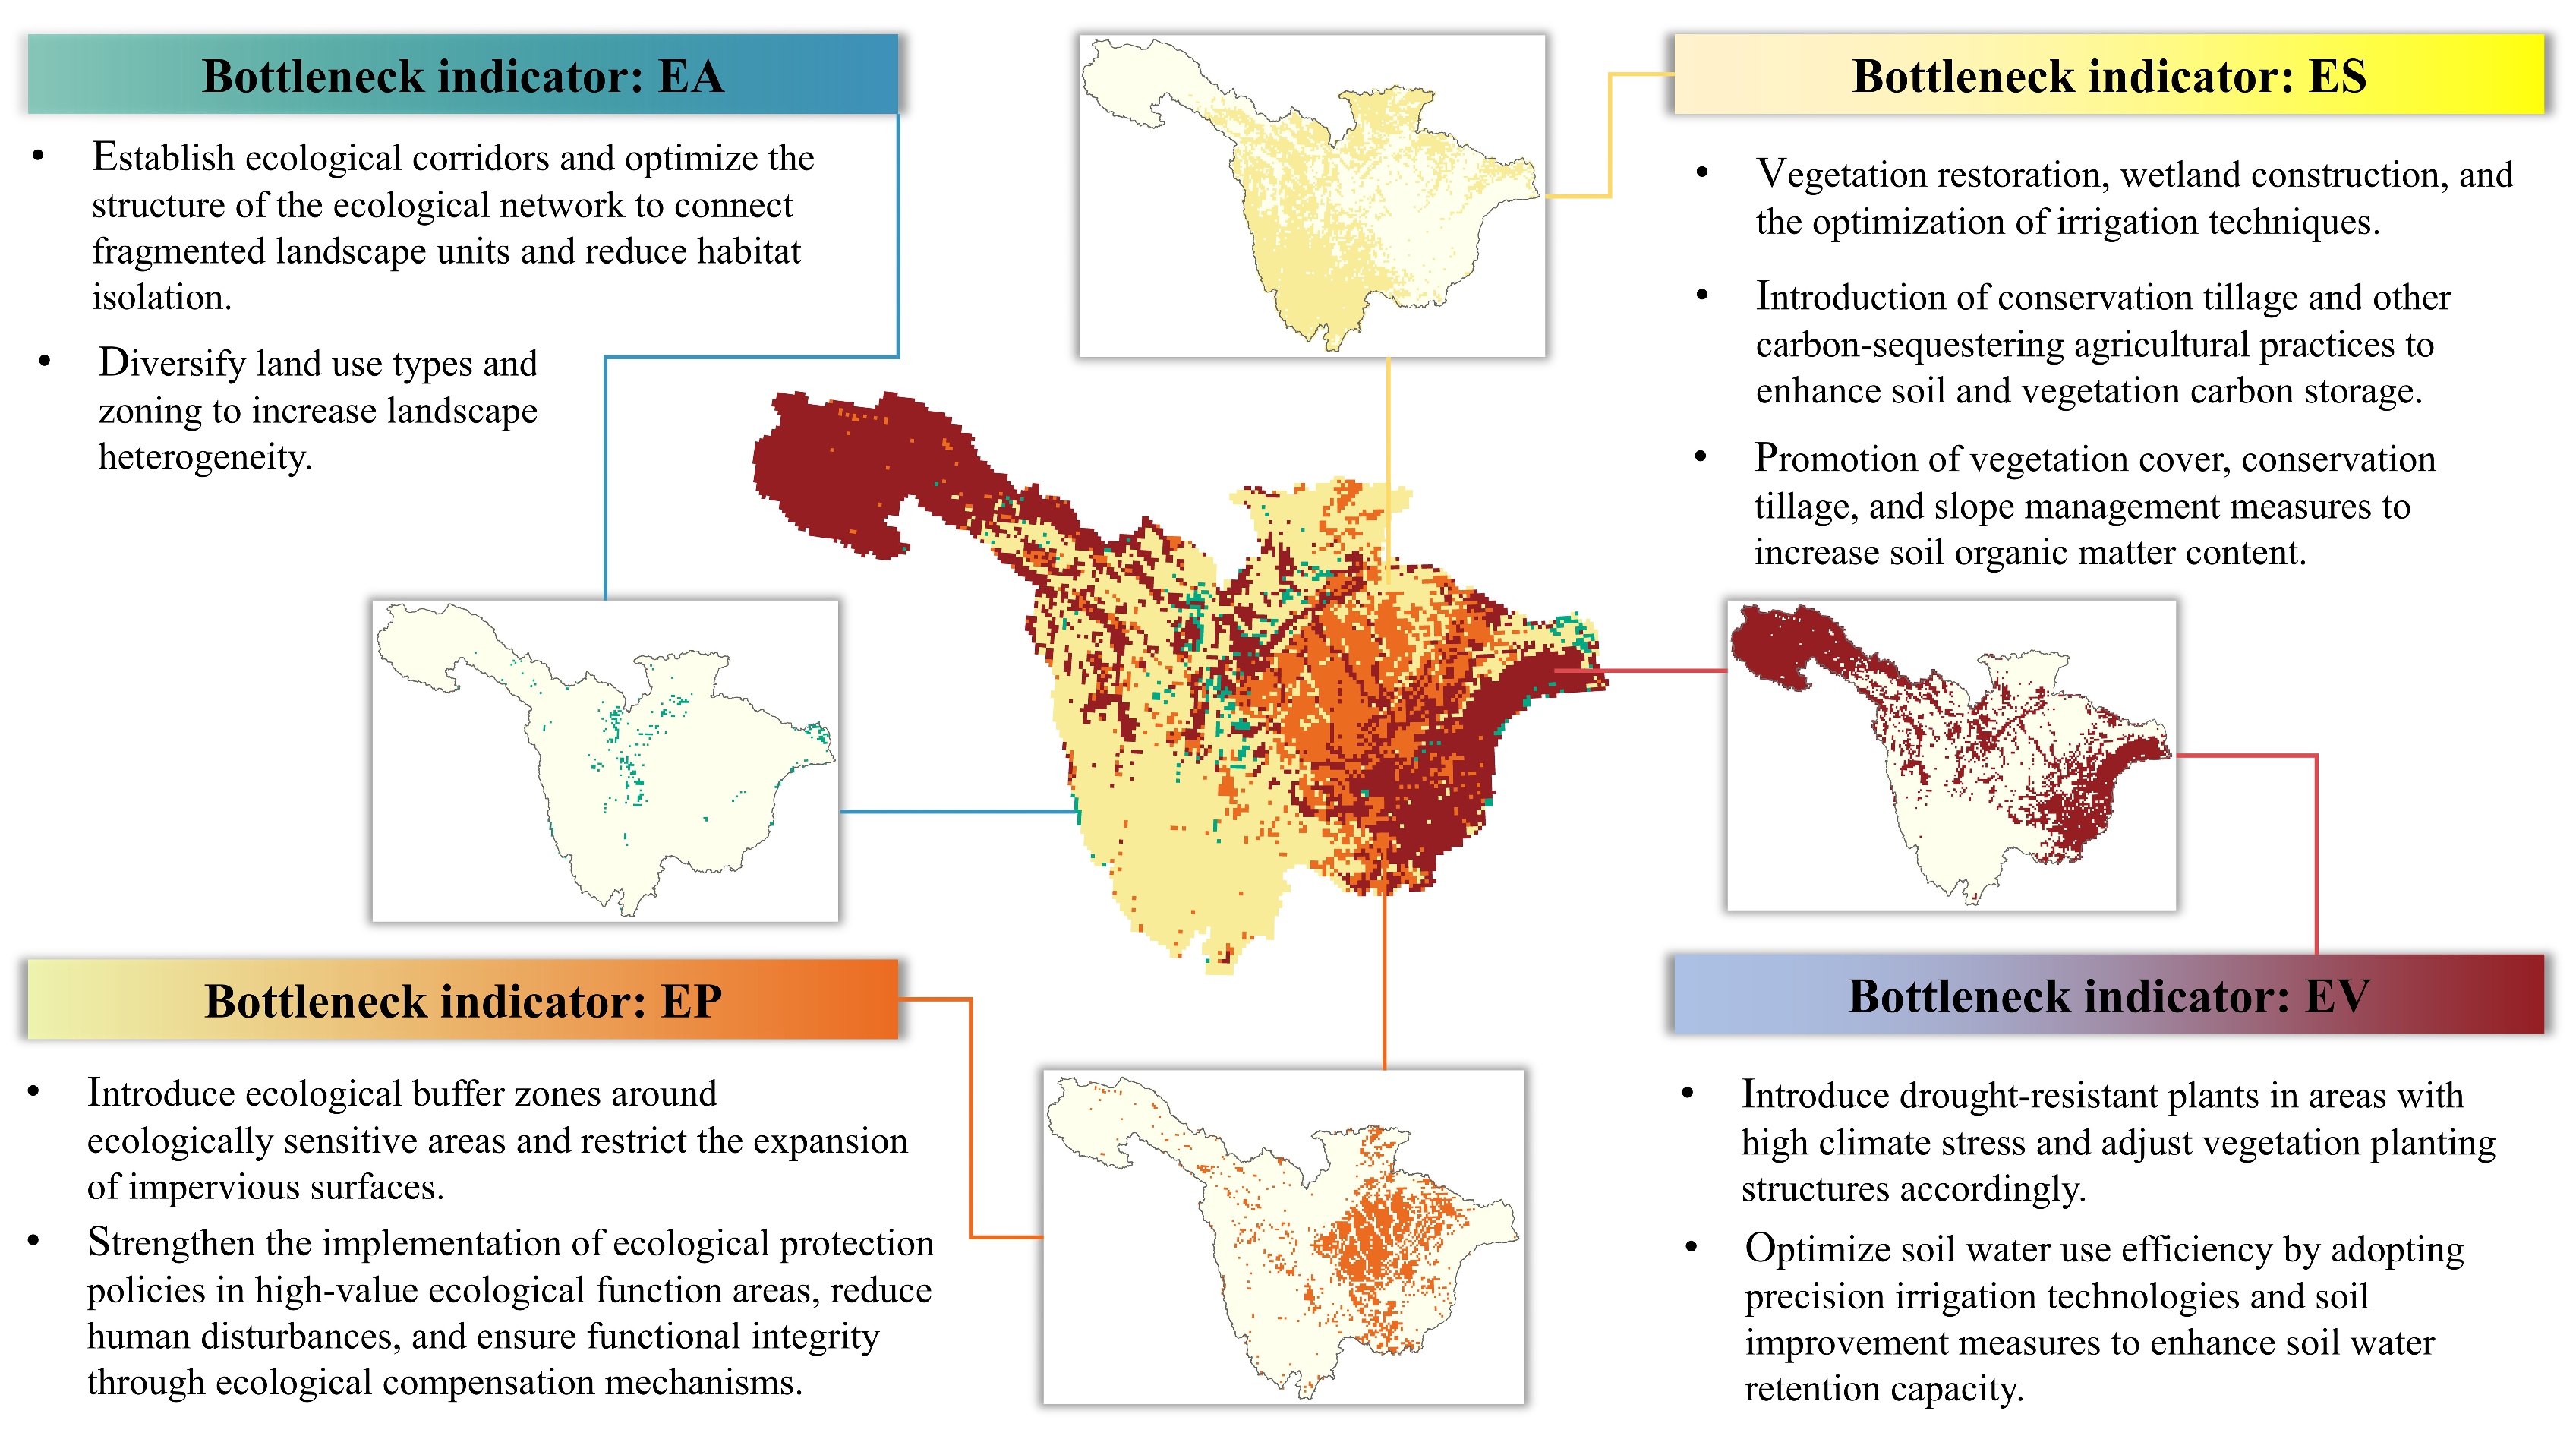
According to the “wooden barrel theory”, the limitation of a single key indicator can significantly constrain the overall RES; thus, identifying and addressing these limiting factors is critical to enhancing regional ecological resilience. Through visualization analysis of the minimum RES indicators in the basin (
Figure 10), the spatial distribution of resilience limiting factors across different regions can be clarified; combining the trade-offs and synergies among indicators, the core factors hindering RES improvement can be identified, providing a scientific basis for formulating targeted ecological management strategies.
5. Conclusions
This study establishes a comprehensive framework by integrating five key indicators—ES, EV, EA, EP, and ERC—to quantify and model the RES of the UYRB at the grid scale. The PLUS model, coupled with CMIP climate scenarios, was used to assess RES distribution under future conditions. PLS-PM and OPGD were employed to examine the interactions between various driving factors and RES. From 2010 to 2020, the average RES in the UYRB decreased by 2.80%, with a spatial distribution pattern characterized by “high in the east and west, and low in the center.” Spearman correlation analysis revealed strong synergies between ES and both EV and EP, while a significant trade-off relationship was observed between ERC and EA. OPGD analysis demonstrated that geological conditions provide stable foundational support for RES, while the influence of LULC has progressively increased over the years, remaining a dominant driver. The dual-line interaction between natural and socio-economic factors has significantly amplified their impact on RES. PLS-PM further indicated that the relative contribution of climate conditions to RES has declined over time, whereas the positive role of vegetation cover in enhancing RES has increased annually, proving crucial in bolstering ecosystem stability and resilience. Conversely, the negative effects of human activities on RES have been notably amplified under rapid urbanization, particularly in the urban development scenario, where the path coefficient increased from −0.04 in 2020 to −0.199. However, the implementation of ecological protection policies effectively mitigated the adverse impact of human activities, reducing the path coefficient from −0.199 to −0.121 under the urban development scenario, suggesting that protection policies can substantially alleviate the negative consequences of human actions on the basin’s ecology. Future scenario simulations indicate that the stability of ERC, EA, and EP mitigates the significant differences observed in ES, with RES being slightly higher under the EPS compared to the urban development scenario, although the overall spatial distribution differences are minimal. Finally, integrating the “bucket theory” approach highlights the critical bottlenecks in improving regional RES, laying the groundwork for developing long-term, effective ecological protection and restoration strategies to promote the sustainable ecological and environmental development of the UYRB.


