Abstract
Eco-migration (EM) constitutes a specialized form of migration aimed at enhancing living environments and alleviating ecological pressure. Nevertheless, large-scale external migration has intensified habitat fragmentation (HF) in resettlement areas. This paper takes the Shule River Resettlement Project (SRRP) as a case, based on the China Land Cover Dataset (CLCD) data of the resettlement area from 1996 to 2020, using the Landscape Pattern Index (LPI) and the land use transfer matrix (LTM) to clearly define the stages of migration and the types of resettlement areas and to quantitative explore how EM affects HF. The results show that (1) EM accelerates the transformation of natural habitats (NHs) to artificial habitats (AHs) and shows the characteristics of sudden changes in the initial stage (1996–2002), with stability in the middle stage (2002–2006) and late stage (2007–2010) and dramatic changes in the post-migration stage (2011–2020). In IS, MS, LS, and PS, AH increased by 26.145 km2, 21.573 km2, 22.656 km2, and 16.983 km2, respectively, while NH changed by 73.116 km2, −21.575 km2, −22.655 km2, −121.82 km2, and −213.454 km2, respectively. The more dispersed the resettlement areas are the more obvious the expansion of AH will be, indicating that the resettlement methods for migrants have a significant effect on habitat changes. (2) During the resettlement process, the total number of plaques (NP), edge density (ED), diversity (SHDI), and dominance index (SHEI) all continued to increase, while the contagion index (C) and aggregation index (AI) continued to decline, indicating that the habitat is transforming towards fragmentation, diversification, and complexity. Compared with large-scale migration bases (LMBs), both small-scale migration bases (SMBs), and scattered migration settlement points (SMSPs) exhibit a higher degree of HF, which reflects how the scale of migration influences the extent of habitat fragmentation. While NHs are experiencing increasing fragmentation, AHs tend to show a decreasing trend in fragmentation. Ecological migrants play a dual role: they contribute to the alteration and fragmentation of natural habitat patterns, while simultaneously promoting the formation and continuity of artificial habitat structures. This study offers valuable practical insights and cautionary lessons for the resettlement of ecological migrants.
1. Introduction
Eco-migration (EM), known as poverty alleviation relocation (PAR) in China, refers to the systematic relocation of populations and economic activities from areas characterized by harsh or severely degraded natural environments, critical ecological function zones, or suboptimal living conditions to regions offering relatively better prospects for survival and economic development in pursuit of long-term stability [1]. The International Organization for Migration (IOM) defines it as “the forced or voluntary, temporary or permanent movement of individuals or groups driven by sudden or gradual environmental changes that adversely impact living conditions.” At present, approximately 10 million people are resettled globally each year, with China accounting for a significant proportion of involuntary migrants [2]. Eco-migration plays a pivotal role in achieving the United Nations Sustainable Development Goals and serves as a key livelihood initiative in China aimed at alleviating poverty, implementing rural revitalization strategies, and fostering harmony between humans and nature [1,3,4,5,6]. While the Chinese government emphasizes that eco-migration (EM) plays a positive role in poverty alleviation and environmental improvement, questions remain regarding its impact on the ecological conditions of the resettlement areas. Some scholars have expressed skepticism about the effectiveness of large-scale eco-migration in achieving environmental protection goals within ecologically fragile regions [7,8]. However, the large-scale external migration of migrants has led to increasingly severe and distinct habitat fragmentation in the resettlement areas. Therefore, scientifically monitoring and evaluating the processes and outcomes of such habitat fragmentation carries substantial theoretical and practical significance in harmonizing human activities with the ecological environment and promoting the sustainable resettlement of displaced populations.
Habitat fragmentation, which is a primary manifestation of habitat degradation, refers to the process by which originally continuous habitats are divided and fragmented into isolated, island-like patches [9,10]. Externally, this phenomenon manifests as the progressive reduction in large, contiguous habitats into smaller, dispersed fragments. Internally, it involves a structural transformation from a simple, homogeneous, and continuous landscape to a complex, heterogeneous, and discontinuous mosaic of patches [10,11,12]. Extensive research has confirmed that large-scale regional development activities serve as a key driver of habitat fragmentation. Eco-migration is frequently perceived as an external intrusion into resettlement areas, most notably through extensive land reclamation efforts that convert natural habitats into anthropogenic landscapes, thereby accelerating habitat degradation [13,14] and exacerbating fragmentation. Unlike the gradual changes observed in undisturbed regions, the abrupt and intensive transformations induced by eco-migration lead to more pronounced and rapid habitat modifications—a characteristic nonlinear shift that may have been overlooked or underestimated in previous studies [15]. Critical questions remain unresolved, including the following: How exactly does eco-migration drive habitat fragmentation? What are the coupling mechanisms between these processes [15,16,17]? Therefore, anchoring research in resettlement areas and migration processes to elucidate the drivers of habitat fragmentation can provide a robust scientific foundation and valuable policy insights for sustainable ecological resettlement and habitat conservation.
The Comprehensive Development Project of Hexi Corridor (Shule River watershed) Agriculture Irrigation and Resettlement in Gansu Province, China is abbreviated as the Shule River Resettlement Project (SRRP), and has been recognized by the World Bank as “the world’s largest resettlement program of its kind” due to its unprecedented scale, garnering significant international attention. The SRRP is a key national comprehensive development project with poverty alleviation relocation as its main body, water conservancy project construction as its backbone, and water control and soil improvement as its core. The targets of poverty alleviation and migrants are hundreds of thousands of people in 11 counties in the arid central area and the high-altitude, cold, and damp mountainous area in the south of Gansu Province. On 2 July 1996, the Chinese government officially signed the Project Agreement, the Development Credit Agreement, and the Loan Agreement with the World Bank in Washington, D. C. The SRRP was allocated a loan of USD 150 million from the World Bank, with a total estimated investment amounting to CNY 2.673 billion. The project involves the development of a new land area of 546 km2, the resettlement of approximately 200,000 migrants, and the establishment of an irrigated area covering 978 km2. The total construction period is projected to be 10 years. In June 1996, the voluntary resettlement program was officially initiated and by September 2010, the handover of the last two resettlement villages to the Yumen Municipal People’s Government was completed, marking the full completion of the resettlement work for the SRRP. In 2002, taking into account factors such as the level of water resource utilization in the Shule River Basin, ecological conservation efforts, and the capacity to mobilize matching funds, the Gansu Provincial Government reached a mutual agreement with the World Bank to implement mid-term adjustments to the project. Consequently, the scale of resettlement was reduced from the original estimate of 200,000 to 75,000 individuals.
Since the implementation of the SRRP, scholars have conducted extensive research on its feasibility, early warning analyses, and post-resettlement evaluations. Research by Wang Junde indicated that from 1970 to 2013, significant transformations occurred in forests, grasslands, and water bodies within the mid-lower reaches of the Shule River Basin [18]. The gradual reduction in oases, primarily due to the decline in grassland and water areas [19], has been closely associated with migration activities [20]. Although these studies offer valuable insights into the relationship between migration and habitat changes, they are constrained by issues of “scale mismatch” and “process ambiguity”. Specifically, many analyses rely on data at the river basin or irrigation area level as proxies for actual resettlement zones, thereby conflating macro- and micro-scale dynamics. As a result, it remains unclear whether observed habitat changes are directly attributable to eco-migration or other external factors. Early studies merely attributed habitat changes to migration but lacked in-depth and detailed analysis.
The SRRP adopted a hybrid resettlement model, integrating large-scale migration bases (LMBs), small-scale migration bases (SMBs), and scattered migration settlement points (SMSPs), all concentrated within geographically limited areas. Therefore, only by concretizing it to the scale of the resettlement area can we truly reveal whether migration activities have an impact on habitat fragmentation. The SRRP has clear time nodes and landmark events; the resettlement project was initiated in 1996, concluded in 2010, and underwent mid-term adjustments in 2002. During this process, the impact of different intensifies of migration on habitat fragmentation cannot be consistent. Therefore, only by clarifying the time process can we truly understand how migration activities drive habitat fragmentation.
This study takes SRRP as a case, based on China Land Cover Dataset (CLCD) data, to obtain the land use data of the resettlement area from 1996 to 2020. We use the Landscape Pattern Index (LPI) and the Land Use Transfer Matrix (LTM) to quantitatively explore whether the EM really contributes to HF. The research objectives of this article include: (1) Clarify the time boundary, subdivide EM activities into the initial, middle, final and post-migration periods of migration, and reveal the phased impact of the EM process on HF. (2) Identify the types of resettlement areas for migrants (large-scale resettlement bases, small-scale resettlement bases, and resettlement sites), and examine the impact of the scale of migrants and resettlement methods on HF. Thus, it provides a scientific basis and decision-making reference for the resettlement of migrants and the protection of habitats and offers reference and warnings for the implementation of similar resettlement projects.
2. Materials and Methods
2.1. Study Area
The Shule River Basin is located in the western Hexi Corridor of Gansu Province (92°54′–99°14′ E, 38°36′–41°34′ N), representing the second-largest endorheic basin in the region. The upper reaches extend southeast of the Changma Gorge, the middle reaches span from Changma Gorge to the Shuangta Reservoir, and the lower reaches lie downstream of the reservoir. The terrain in the middle and lower reaches is flat, with oases and deserts alternating; it is the main resettlement area for migrants. The average annual runoff of the main stream of Shule River is 1.039 × 10⁸ m3.
The middle and lower reaches of the Shule River Basin (95°30′–97°20′ E, 40°12′–40°40′ N) fall within the temperate to warm temperate arid climatic zone. The annual average temperature ranges from 7 °C to 9 °C, with annual precipitation varying between 36.0 mm and 63.5 mm, while annual evaporation rates range from 1500 mm to 2500 mm. The region exhibits a diverse array of vegetation types, including forest vegetation, agricultural vegetation, marsh vegetation, and desert vegetation. The dominant soil types are marsh soil, meadow soil, and brown desert soil. The landscape pattern can be broadly categorized into three types: oasis landscapes, river corridor landscapes, and desertification landscapes. Oasis landscapes primarily consist of cultivated land, woodland, and grassland; rivers and artificial canals form water body corridors; and fixed sandy land, semi-fixed sandy land, mobile sandy land, wind-eroded unused land, and saline–alkali land constitute the main components of desertification landscapes.
The basin comprises three major irrigation districts: Changma, Shuangta, and Huahai. Specifically, the Changma Irrigation Area (CMIA) has a total irrigated area of 5.28 × 10⁴ hm2, covering 12 towns (townships), including Yumen Town, Bulongji Township, and Shahe Hui Ethnic Township, as well as 59 administrative villages. The effective irrigated area of the Shuangta Irrigation Area (STIA) currently stands at 3.83 × 10⁴ hm2, encompassing 6 towns and townships such as Nancha, Guazhou, and Xihu. The Huahai Irrigation Area (HHIA) has a total irrigated area of 1.34 × 10⁴ hm2, covering five towns including Xiaojinwan and one state-owned farm, with a population of about 36,000. The primary natural vegetation includes species such as tamarisk and camel thorn, while the principal crops cultivated in the region include wheat and corn.
In 2022, the total population of the basin was approximately 480,900, predominantly concentrated in oasis areas and urban centers, with an urbanization rate of 62.78%. The regional GDP reached approximately CNY 50.13 billion, although per capita GDP remained below the national average. Economic growth is primarily driven by the secondary industry, whereas the primary and tertiary industries exhibit relatively weaker performance. The principal agricultural bases are located in the relatively flat terrain of the middle and lower reaches of the basin, corresponding to the oasis zones.
The SRRP adopts a combined approach of LRB, SRB, and SMSP (i.e., centralized resettlement and decentralized resettlement). According to the SRRP Plan, it is planned to build 1 LRB: Yaozhanzi Base; 4 SRB: Qidaogou Village in Hedong Township, Bulongji Village in Bulongji Township, Guazhou County, Guazhou Township Agricultural Comprehensive Development Zone, and Chengnan migrants Development Zone; and 6 SMSPs: Farm in Xihu Township, Guazhou County, Jiunan Village in Nancha Town, Xiangyang Village in Xihu Town, Sangong Village in Guazhou Town, Beitan Village in Sandaogou Town, and Xiqu Village in the former Anshidai Township. This is the specific resettlement area referred to in this article (Figure 1).
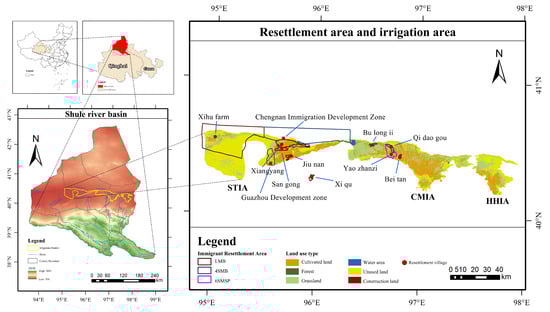
Figure 1.
Schematic diagram of study area.
According to the SRRP Plan, it was estimated that a total of 200,000 migrants would be resettled (later adjusted to 75,000). The migrants were mainly concentrated from 2002 to 2006, totaling 53,716 people, accounting for 86.64% of the total migrants. They were mainly resettled in the Changma Irrigation District, Shuangta Irrigation District of Guazhou County, and Huahai Irrigation District of Yumen City. Among them, 7455 households and 37,908 people (accounting for 61.14% of the total migrants) were resettled in the Changma Irrigation District, mainly in Yaozhanzi Township. And new migrant towns such as Shuangta Town, Qidun Township, and Shahe Township were established. A total of 9419 people (accounting for 15.19%) were relocated to the Shuangta Irrigation District, and a new resettlement site, Lianghu Township, was built. The Huahai Irrigation District has resettled 14,673 migrants (accounting for 23.67%), and newly established migrant towns such as Dushanzi Township and Xiaojinwan Dongxiang Ethnic Township (Figure 2, Table 1). We defined four phases based on policy and migration intensity:
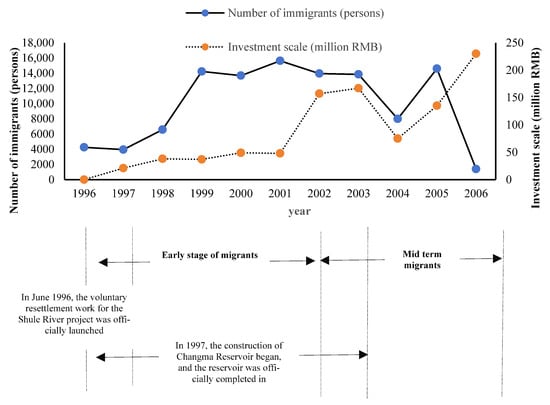
Figure 2.
Population and investment changes in ecological migrants in SRRP (1996–2006).

Table 1.
Migrant situation in voluntary resettlement area of SRRP (1997–2006).
This article categorizes the resettlement process into four distinct periods based on policy changes and the intensity of migration: the initial stage (IS) (1996–2002), the middle stage (MS) (2002–2006), the late stage (LS) (2007–2010), and the post-migration stage (PS) (2011–2020).
2.2. Data Sources
- (1)
- The land use data from 1996 to 2021 is sourced from the China Land Cover Dataset (CLCD) of Wuhan University (http://doi.org/10.5281/zenodo.4417809). This CLCD data is created by the team of Professor Huang Xin from Wuhan University based on 335,709 scenes of Landsat data on the Google Earth Engine. The team constructed spatio-temporal features, combined with a random forest classifier to obtain classification results, and proposed a post-processing method including spatio-temporal filtering and logical reasoning to further improve the spatio-temporal consistency of CLCD. Finally, based on 5463 visual interpretation samples, the overall accuracy rate of CLCD reached 80%. In addition, they compared CLCD with existing thematic products and found that CLCD showed good consistency with the global forest change, global surface water, and impervious water time series datasets. Compared with other global products, CLCD has a higher time resolution, but it only covers the Chinese region. The classification of this data is a new data classification system, mainly including nine categories: farmland, forest, shrub, grassland, water body, ice and snow, unused land, impervious surface, and wetland. Among them, impervious surface is reclassified as construction land. This paper defines the above-mentioned land types as different habitat types, among which farmland and construction land represent artificial habitats, while the rest of the land types represent natural habitats.
- (2)
- The data on eco-migration and investment from the SRRP.
- (3)
- Basic map including terrain and vector administrative boundaries were sourced from Gansu Provincial Surveying and Mapping Bureau (https://gansu.tianditu.gov.cn); DEM data sourced from geographic spatial data clouds (http://www.gscloud.cn/search) (accessed on 6 August 2020).
- (4)
- Social and economic statistical data mainly come from the “Yumen City Statistical Yearbook” and the “Guazhou County Statistical Yearbook”.
2.3. Research Methods
- (1)
- Habitat fragmentation
Habitat fragmentation is typically characterized by five key aspects: a reduction in the total amount of habitat patches, an increase in their number, a shrinkage in patch area, an increase in isolation, and an enhancement in heterogeneity. Consequently, the extent of habitat fragmentation can be quantified through the use of landscape pattern indices (LPI). In this study, we selected eight indices—namely, the total number of patches, edge density, contagion index, aggregation degree, diversity, uniformity, dominance degree, and fractal dimension (Table 2)—to systematically reflect the size, shape, density, clustering relationships, and fragmentation degree of habitat patches within the resettlement areas for migrants.
Table 2.
Landscape Pattern Index (LPI).
- (2)
- Land use transfer matrix (LTM)
The land use transfer matrix is a quantitative description used to analyze the transfer of states and conditions in a research system, reflecting the transformation of various land types in the early and late stages of the study, and thus reflecting the process of land use change.
In the formula, K is the area (km2); i is the type of land use in the initial stage of research; j is the land use type at the end of the research period; and n is the number of land use types.
3. Results
3.1. Natural Habitats Are Gradually Transforming into Artificial Habitats
Eco-migration activities are a process of constantly reshaping the habitat types in the resettlement areas, resulting in the gradual transformation of the habitat types in the resettlement areas from natural habitats to artificial habitats. From the perspective of the time dimension, it shows the changing pattern of sudden change → stability → rapid change from the initial stage (IS) to the middle stage (MS) and then the post-migration stage (PS) (Table 3; Figure 3).
Table 3.
Area changes in habitat types in different migration periods and resettlement areas/km2.
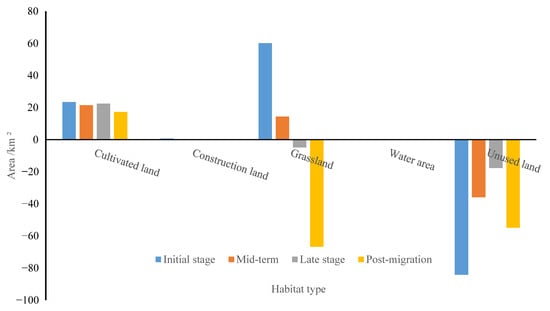
Figure 3.
Changes in habitat types in different migration periods.
In LMBs, construction land has undergone a sudden change from nothing to something. The entire resettlement period saw an increase of 0.629 km2, especially during the peak migrant period in 2006, when the growth was even greater. The net increase in cultivated land in the initial stage, middle stage, and late stage of migration was 4.078 km2, 3.594 km2, and 3.795 km2, respectively. The natural habitats (grasslands and unused lands) are decreasing, especially in the initial stage, with a net reduction of 49.74 km2 of grassland. The area of unused land has sharply decreased from 13.26 km2 in 1996 to 2.28 km2 in 2010 (Figure 4a).
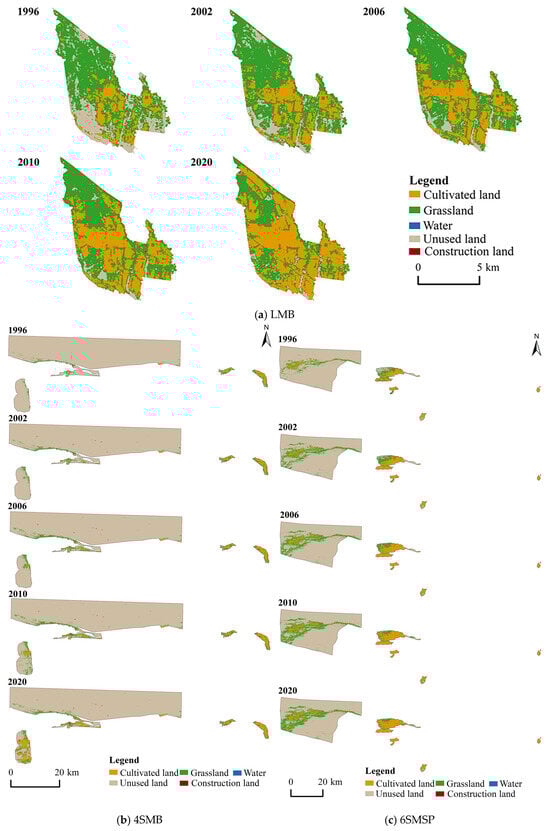
Figure 4.
Habitat types in different periods and resettlement areas.
In 4SMB, a net increase of 10.16 km2 in cultivated land and 0.99 km2 in construction land were determined. Among these, the Agricultural Comprehensive Development Zone and the Southern City Resettlement Development Zone exhibited the most notable expansion, with net increases of 4.5 km2 and 4.4 km2 in cultivated land, respectively, over the entire resettlement period. Similarly, natural habitats significantly diminished, with unused land experiencing a total net reduction of 31.69 km2. Specifically, the Agricultural Comprehensive Development Zone and the Southern City Resettlement Development Zone saw reductions of 12.7 km2 and 17.2 km2 in unused land, respectively, indicating a very pronounced decline in natural habitats. The only exception was grassland, which continued to increase. The single dynamic degrees of cultivated land and unused land in the early, middle, and late resettlement stages were 1.77%, 6.52%, and 6. 48%, and −0.21%, −0.36%, and −0.34%, respectively, demonstrating the continuous expansion of cultivated land and the contraction of natural habitats (Figure 4b).
In 6SMSP, a net increase of 51.96 km2 in cultivated land and 0.37 km2 in construction land (Figure 4c) was collectively recorded, alongside a substantial reduction in unused land (114.25 km2). Among these, key resettlement areas—Xiangyang Village, Xihu Township, and Sangong Village—saw net increases of 1.7 km2, 42.7 km2, and 6.1 km2 in cultivated land, respectively, over the entire resettlement period. Conversely, Xiangyang Village and Sangong Village experienced reductions of 1.7 km2 and 5.8 km2 in grassland, respectively. The single dynamic degrees of cultivated land and unused land in the initial stage, middle stage, and the late stage were 3.36%, 4.42%, and 3.85%, and −1.27%, −1.00%, and −0.38%, respectively.
In a horizontal comparison, the more concentrated the resettlement of migrants is, the higher the degree of intensive and economical utilization of artificial habitats (cultivated land and construction land) tends to be. However, during the post-migration period, there was a significant reduction in cultivated land and construction land across 6SMSP, indicating a substantial adjustment in land use for these purposes. From the perspective of natural habitats, during the initial stage and middle stages of migration, grassland changes exhibited a trend where 6SMSP > 4SMB > 1LMB (Figure 5).
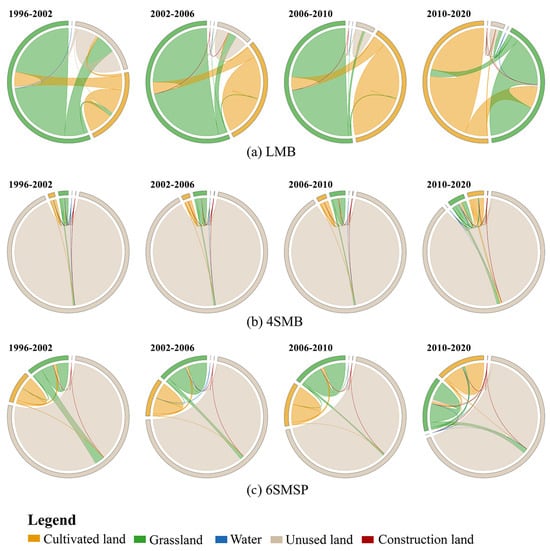
Figure 5.
Habitat type transfer map in resettlement area.
This suggests that smaller-scale migration correlates with more pronounced growth in natural habitats (grassland). In the late stage and the post-migration stage, grassland areas throughout the entire resettlement region began to decline, showing an inverse relationship with the migration scale—smaller migration scales were associated with more prominent reductions in grassland area. Changes in unused land mirrored those in grassland, with both decreasing throughout the migration period. The extent of reduction was inversely correlated with migration intensity. Notably, during the post-migration stage at this specific site, there was an increase in unused land, which can be attributed to significant adjustments in cultivated land use. Specifically, reducing the area of cultivated land allowed for some recovery of natural land.
Ecological resettlement has reshaped habitat types, with a general trend of increasing artificial habitats and shrinking natural habitats. Due to the gradient distribution of land and water resources in oasis–desert systems, habitat types in oasis, transition, and desert zones exhibit spatial heterogeneity. In undisturbed conditions, habitats typically follow a river–axial symmetric pattern: river–forest–shrubland–grassland–unused land. However, resettlement disrupted this pattern, shifting it to a concentric model: settlements–cultivated land–grassland–unused land.
3.2. Habitat Fragmentation
The process of habitat fragmentation closely aligns with the migration process, characterized by abrupt changes in the initial stage of migration, relative stability during the middle and late stages, and significant variability in the post-migration stage. In the initial stage, LPI such as total number of plaques (NP), edge density (ED), diversity (SHDI), and dominance index (SHEI) all exhibited rapid increases, while the contagion index (C), aggregation index (AI), and fractal dimension (FRAC) demonstrated sharp declines, all reflecting substantial variability. By 2002, following adjustments to the migration plan, total number of plaques, and edge density began to decline, and fluctuations during the middle and late stages of migration were relatively minor. In the post-migration stage, the range of fluctuations has shown a tendency to increase once more, suggesting that after the initial stage of disorder, government-planned and organized interventions effectively controlled habitat fragmentation. The significant changes in the LPI during the post-migration stage, indicating that with population growth and economic development, disturbances to habitat fragmentation are intensifying again. The years 2002 and 2015 represent two distinct turning points, highlighting the substantial and direct influence of migration plan adjustments on habitat fragmentation (Table 4). Overall, the unevenness and complexity of habitats are increasing and qualitative habitat conditions are improving, yet habitat connectivity is declining.
Table 4.
Changes in Landscape Pattern Index in different resettlement areas.
Habitat fragmentation is intricately linked to the scale of migration. The indices of edge density and dominance index demonstrate a hierarchy: 1LMB > 4SMB > 6SMSP. Conversely, the indices of total number of plaques, contagion index, and aggregation index exhibit an inverse trend, highlighting the pronounced disturbance and shaping effects of migration scale on habitats. LMBs, which are prioritized by the government for construction, exhibit greater construction intensity and scale, thereby exerting stronger intervention on habitats. Both diversity and dominance index in the LMBs surpass those of SMBs and DMSP, reflecting a higher degree of habitat fragmentation. The expansion of construction land and cultivated land areas, along with the development of transportation infrastructure, has led to an interweaving and partitioning effect on the original habitat, increasing the number of landscape patches and enhancing fragmentation.
At the type scale, the total number and density of patches for cultivated land and construction land have gradually decreased, while aggregation levels have increased and connectivity has strengthened, indicating that artificial habitat fragmentation tends toward convergence. Connectivity for cultivated land and construction land in both LMBs and SMBs is superior, with higher intensification levels. In contrast, the fragmentation of water bodies and unused land has intensified. This is attributed to ensuring production and domestic water supplies for migrants, necessitating the construction of upstream reservoirs and irrigation canal systems within resettlement areas. These interventions have significantly altered the distribution patterns and connectivity of natural water systems, exacerbating fragmentation. The escalating fragmentation of unused land stems from continuous human reclamation efforts. To secure livelihoods, migrants continually recultivate arable unused land, fragmenting originally contiguous unused land areas and increasing their fragmentation over time.
4. Discussion and Conclusions
4.1. Discussion
Eco-migrants are special migrants formed to improve the living environment and relieve ecological pressure. Due to the external migration of large-scale migrants, the fragmentation of habitats in resettlement areas is characterized by suddenness and particularity compared with general areas. This paper finds that the natural habitats in the resettlement areas of migrants continue to transform into artificial habitats and have obvious phased characteristics. Habitats are transforming towards fragmentation, diversification and complexity. Compared with SMBs and DMSP, LMBs have a higher degree of fragmentation, reflecting the impact of the scale of migration on habitat fragmentation. While the degree of fragmentation of natural habitats intensifies, the degree of fragmentation of artificial habitats tends to converge, indicating the bidirectional impact of migration activities on habitats.
The majority of existing studies associate habitat fragmentation primarily with ecological migration. However, recent findings suggest that while ecological migration accelerates the fragmentation of natural habitats, it simultaneously enhances the integrity of human settlements or workers’ habitats. Therefore, the impact of ecological migration on habitat structure is bidirectional rather than unidirectional. Most existing research focuses on describing the general process of habitat fragmentation without identifying its staged characteristics, which are closely linked to the resettlement process. Furthermore, the current literature has not explicitly recognized that different resettlement strategies produce heterogeneous effects on habitat fragmentation. Although previous studies have established that ecological migration accelerates habitat fragmentation, they lack in-depth analysis regarding the underlying mechanisms and influencing factors.
- (1)
- Why does eco-migration drive habitat fragmentation?
As early as 1993, ecologist Norman Myers warned that hundreds of thousands of people would be displaced in the 21st century due to direct or indirect environmental factors [21]. UNEP Executive Director Tolba emphasized that “as many as 50 million people could become environmental refugees” if global action for sustainable development remained inadequate [22]. Given the scale of such migration, policymakers and scholars have grown increasingly interested in the dynamic linkages between migration and environmental change [23,24]. While many studies have attempted to assess the impacts of eco-migration on ecosystems in origin or destination areas, no consensus has yet been reached [25,26]. One perspective suggests that eco-migration serves as a mechanism to mitigate ecological degradation, alleviating environmental pressures in areas of origin [27,28], removing populations from hazardous conditions [29], and diminishing long-term anthropogenic damage to fragile ecosystems [30]. It is argued that this process enhances ecological quality in out-migration zones while strengthening the livelihood resilience and social adaptability of migrants [31,32,33,34,35]. Conversely, another viewpoint asserts that large-scale eco-migration inevitably imposes significant stress on destination ecosystems [36,37], potentially entrapping migrants in a cycle of environmental degradation [21] and exacerbating ecological deficits [38]. Rapid population growth and over exploitation of resources in resettlement areas create new environmental pressures [38,39], intensify human–habitat conflicts [40], and result in high rates of abandonment and re-migration [41,42], thereby increasing the risk of recurrent poverty and hindering sustainable development. Furthermore, some scholars emphasize that due to the scarcity of longitudinal studies on resettlement areas [6], habitat degradation in these regions is frequently underappreciated [43,44] or underestimated [15,45]. Therefore, an objective evaluation of the environmental impacts of eco-migration in resettlement zones is essential.
The Shule River Basin represents a typical inland river basin located in an arid region, where the mountain–oasis–desert system constitutes the predominant habitat differentiation pattern [46,47], with the vast desert and Gobi serving as the primary habitat matrix, resulting in a habitat that is extremely fragile. But in the absence of human interference, this natural habitat configuration could remain stable over an extended period. However, external interventions, particularly eco-migration activities, have significantly accelerated changes in habitat types and patterns within the midstream oasis area. Existing research has demonstrated that between 2005 and 2010, the cultivated land area in the middle and lower reaches of Shule River expanded, leading to a gradual increase in oasis areas [48,49]. During this period, semi-artificial land (cultivated land) and artificial land (urban and rural construction land) exhibited continuous growth, while the extent of semi-natural land (forest land, grassland, and wetland) decreased annually [50,51]. Landscape fragmentation intensified, and habitat shapes became increasingly simplified. Both multi-diversity and homogeneity indices declined [51]. Agricultural population growth and economic development emerged as the primary driving forces behind these changes. Notably, the inflection point for oasis area changes occurred around the year 2000. Prior to this, the rate of change was relatively slow, whereas afterward, it accelerated markedly, with the period from 2000 to 2005 witnessing the most rapid transformation. This acceleration can be attributed primarily to the migrant resettlement program [52]. These findings align closely with the conclusions of this study. Additionally, this paper reveals that while the degree of fragmentation in artificial habitats (particularly cultivated land) tends to stabilize, natural habitat fragmentation continues to increase—a phenomenon often overlooked in previous studies.
Why has eco-migration driven the fragmentation of habitats in resettlement areas? Ecological resettlement refers to the process of relocating and reconstructing a community’s place of residence. This process does not merely involve redistributing arable land and other resources within the resettlement area but rather focuses on redeveloping and effectively utilizing these resources. Therefore, to address the livelihood challenges faced by relocated populations, it is essential to cultivate arable land and establish well-planned villages. This transformation entails the continuous conversion of natural habitats—particularly grasslands suitable for cultivation and previously unused land—into artificial living environments and also reflects ongoing changes in habitat quality. Early studies merely attributed habitat changes to eco-migration but lacked in-depth and detailed analysis.
The fundamental reason lies in the fact that after the migrants entered, the natural habitat pattern dominated by natural processes was completely changed. In June 1996, the SRRP was officially launched, and the voluntary resettlement work was initiated, which led to an accelerated transformation of the habitat pattern from being dominated by natural processes to being dominated by artificial processes. Therefore, the changes were the greatest from 1996 to 2002. After the mid-term adjustment of the project in 2002, there were fluctuating changes from 2002 to 2006. After 2007, with the orderly advancement of migrant activities, it entered a stage of stable changes. To solve the housing and livelihood problems of the migrants, a large area of residential land and cultivated land was needed. However, under the constraints of water resources and fragile ecological environment, even if cultivated land was reclaimed, the scale of cultivated land was inevitably strongly restricted due to the lack of irrigation water. It is precisely for this reason that reclamation and abandonment of farmland occur frequently. After the Changma Reservoir was put into operation in 2003, the bottleneck of irrigation water was fundamentally solved, providing a fundamental and decisive guarantee for the large-scale and diversified development of artificial habitats. Coupled with the adjustment of the resettlement plan, the structure of artificial habitats tended to be rationalized and stabilized.
Habitat fragmentation represents a quintessential manifestation of socio-ecological conflicts, fundamentally reflecting the tensions among multiple value objectives in resource development and utilization. The eco-migration initiatives led by the Chinese government, while considering both poverty alleviation and ecological conservation, prioritize social goals over environmental ones [53]. Consequently, during the initial stage of migration, the primary objective is to address the livelihood challenges faced by the migrant. Socioeconomic priorities take precedence, emphasizing the principles of “being able to relocate, settle down, and prosper”. Construction activities are typically phased and organized sequentially according to residential areas (resettlement villages), farmland (cultivated land), water resources (irrigation and domestic water), and forestry (primarily farmland protection forests). Housing and production represent the most fundamental and urgent needs within the resettlement project. The expansion of construction land aims to resolve housing security issues, whereas the increase in arable land addresses livelihood concerns. Adequate housing serves as a critical material foundation for stability and prosperity. According to the SRRP Plan, residential areas will be rationally distributed following the principles of unified planning, land conservation, population determination based on available land, and appropriate concentration. Each resettlement household will receive 0.053 hm2 of house site, along with an additional 0.067 hm2 of orchard. Initially, per capita housing subsidies amounted to only CNY 600, leaving each migrant with approximately CNY 2000 to 3000 for house construction. As a result, the majority of houses (first-generation houses; “burrow” or “hidden house”) measured between 20~30 m2, with per capita living space less than 6 m2. Consequently, the impact of housing construction on native habitats remained relatively limited. Around 2005, large-scale renovations of burrows commenced, giving rise to brick–soil mixed structure houses (“second-generation houses”) and traditional quadrangle courtyards, accompanied by an increase in construction land. By 2010, clusters of new brick and tile houses emerged, further expanding the scale of construction land (Figure 6). It is notable that at the onset of migrants, the issue of living fuel was inadequately addressed. Consequently, migrants relied heavily on tamarisk and white thorn trees from the Gobi Desert for cooking and heating, resulting in the significant depletion of shrub forests and exacerbating habitat degradation due to fuel shortages.
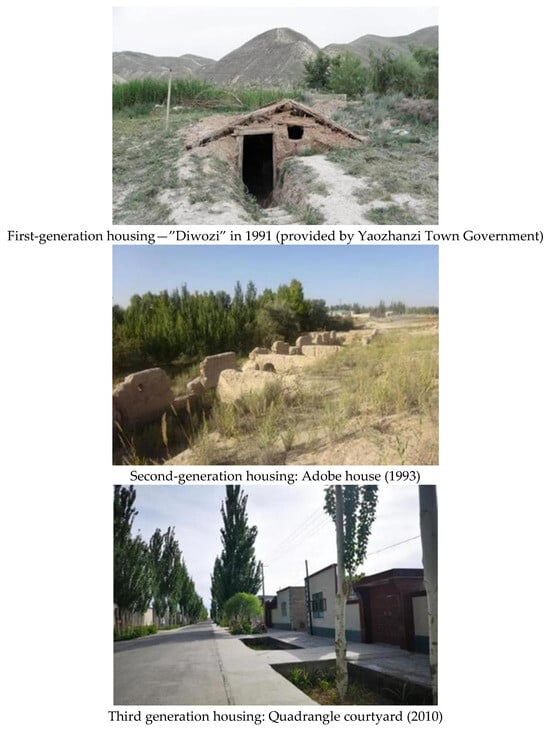
Figure 6.
Changes in housing in resettlement area.
Cultivated land serves as the foundation for migrants to settle and sustain their livelihoods. Following the arrival of ecological migrants, to address the “production” needs of these populations, large-scale reclamation efforts were undertaken, particularly converting grasslands and shrublands, which are relatively easy to develop and utilize, into farmland. However, this expansion occurred under conditions of inadequate irrigation infrastructure and extensive agricultural practices, leading to a vicious cycle where increased reclamation resulted in larger but less productive farmland, ultimately being abandoned. It was not until the completion of the Changma Reservoir Hub Project in 2003, along with its coordinated operation with the Shuangta Reservoir and Chijinxia Reservoir, that a stable water supply for irrigation was ensured. By then, however, the ecological damage caused by unregulated farmland expansion and the significant loss of natural habitats had already taken place, prompting the Gansu Provincial Government to implement mid-term adjustments to the project in 2002. The unchecked expansion of farmland was only curbed due to reduced investment scale, which also led to a temporary decline in the number of incoming migrants.
The influx of migrants not only altered the types of habitats but also transformed their spatial patterns. Habitat type changes became more pronounced closer to settlement sites (Figure 7). Concurrently, the continuous expansion and densification of the artificial irrigation canal system facilitated an increase in cultivated land area, enhanced connectivity, and greater dominance and homogeneity within agricultural landscapes. Conversely, the interweaving and fragmentation caused by artificial structures (irrigation canals and road networks) encroached upon and fragmented natural habitats (grasslands and unused lands), resulting in habitat destruction, disrupted connectivity, and a continuous reduction in patch sizes. This paper finds that while the degree of fragmentation of natural habitats is increasing, the degree of fragmentation of artificial habitats (cultivated land and construction land) tends to converge. Ecological migrants are both the destroyers of changes in natural habitat patterns and habitat fragmentation, and the constructors of artificial habitat patterns and habitat continuity and integrity.
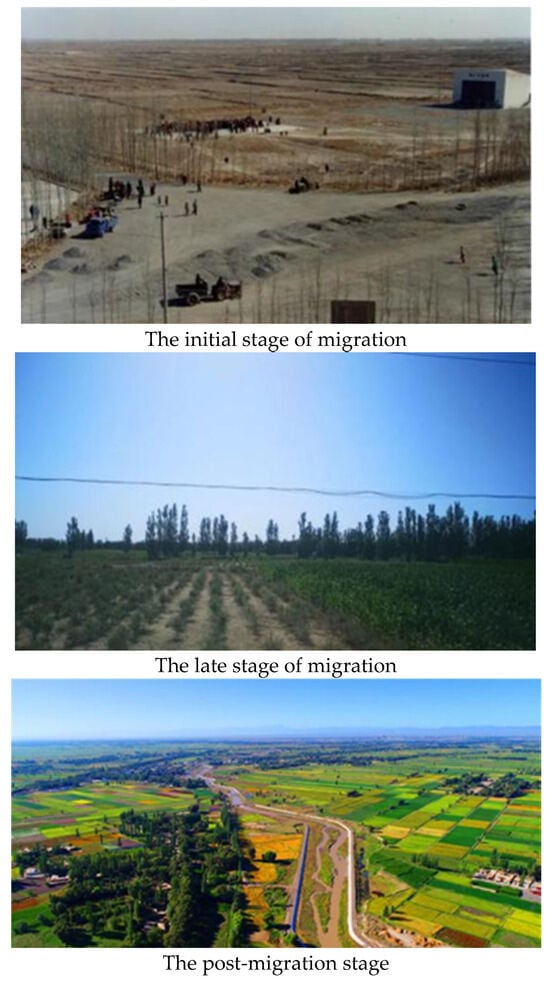
Figure 7.
Change in land use and landscape.
In arid inland river basins, the healthy functioning of production, life, and ecological systems fundamentally depends on the allocation and management of “water”. Rational and effective utilization of water and soil resources serves as a prerequisite for the development of oasis irrigation agriculture [54]. Theoretically, arid inland river basins, particularly in their middle and lower reaches, are not deficient in “fertile alluvial plains.” However, transforming these areas into arable land requires addressing two primary challenges: ensuring an adequate supply of irrigation water and mitigating soil salinization through desalination processes. Over 98% of the cultivated land in migrant resettlement areas originates from artificially developed fields. To prepare this land for cultivation, the top layer of sand and gravel, approximately 30–40 cm thick, must be removed using heavy machinery. Additionally, large-scale and long-term efforts are required to remove salts, reduce alkalinity, and improve medium- and low-yield fields. According to the “Key Points of the Plan”, the area requiring renovation of low-yield fields in the migrant region totals 1.52 × 10⁴ hm2, accounting for 80% of the total cultivated land available for migrants. Among this, saline–alkali land covers 1.10 × 10⁴ hm2, representing 58% of the total cultivated land. These conditions not only increase the complexity of land reclamation but also exacerbate water resource consumption.
To address agricultural and domestic water demands, a control project (the Changma Reservoir) was constructed upstream, while the existing Shuangta Reservoir and Chijinxia Reservoir were renovated. Six main canals, 21 branch canals, and 2083 electromechanical wells have been completed [55]. While the construction of water conservancy infrastructure has resolved issues related to agricultural irrigation and domestic water supply, it has simultaneously diverted precious ecological water, leading to a significant reduction or complete disappearance of natural grasslands and shrubbery. Furthermore, after the establishment of the Changma and Shuangta Reservoirs, nearly all runoff at the mountain outlet of Shule River has been artificially regulated. This has severely compromised the ecological nurturing function of the natural river channel and caused the contraction of natural habitats within the desert transition zone. During the resettlement process of Shule River migrants, mid-term adjustments were necessitated due to severe ecological degradation that threatened the livelihoods of the relocated population. Therefore, achieving the dual goals of poverty alleviation and ecological sustainability requires prioritizing habitat changes in resettlement areas. In particular, for arid inland river basins with inherently fragile ecological backgrounds, these challenges warrant profound reflection and vigilance.
Although eco-migration has generally led to habitat fragmentation, the degree of HF of in the post-migration stage is higher compared with the entire resettlement period. The reason lies in that the SRRP is a resettlement project led by the Chinese government. Apart from the relatively chaotic initial stage of migration, throughout the entire resettlement period, whether it is the development of land and water resources or the resettlement of migrants, all are implemented under the guidance and supervision of the government. Therefore, the impact on the entire habitat is limited. After the completion of the resettlement project, with the withdrawal of government planning activities and the decline in supervision intensity, the degree of habitat fragmentation is more severe. This phenomenon has not been discovered in existing studies.
- (2)
- The impact of ecological migration on habitats is complex and multidirectional.
Previous studies regarded eco-migration as the chief culprit of habitat fragmentation, without noticing that the primary purpose of eco-migration is to solve the survival and development problems of migrants. China’s eco-migration project and poverty alleviation and development strategy are closely interconnected initiatives. The achievements of Shule River eco-migration in enhancing the lives of migrants and driving local economic development remain commendable and undeniable. Upon completion of the project, the living conditions of the migrants were significantly improved, and initial progress toward a livable environment became evident. The per capita net income of migrants increased from less than CNY 300 in 1996 to CNY 1850 in 2010. In Yumen City’s Liuhu Township, the per capita net income reached CNY 2890, surpassing the CNY 2380 earned by farmers in Dingxi City, their original outflow area. In 2009, the per capita net income of migrants resettled from Jishishan County to Ankang Village in Guazhou County reached CNY 3100, exceeding the income of their former region by over CNY 1000. The majority of migrants have resolved food and clothing issues, with their production and living standards gradually improving. It is evident that eco-migration has yielded significant results in addressing China’s poverty challenges and is often referred to as a people’s livelihood project benefiting present and future generations. This initiative has alleviated the poverty alleviation burden on 11 national-level impoverished counties, mitigated population pressure, and reduced poverty in relocated areas.
The SRRP has not only achieved significant socioeconomic outcomes but also ensured that migrants attain net economic income in the resettlement areas. Local governments have actively guided migrants to develop distinctive and advantageous industries, including rural tourism, ecological planting and breeding, as well as green energy sectors such as solar power and photovoltaic technology. These efforts have promoted the development of processing industries, extended industrial chains, increased product added value, optimized production processes, and facilitated resource conservation. According to surveys, migrants express relatively high satisfaction with government subsidies, public security, educational facilities, transportation infrastructure, water and electricity supply, and community relations [56]. Migrants have played a crucial role and made positive contributions to regional economic and social development, infusing vitality into this land while alleviating social and ecological pressures in their places of origin. To support the resettlement process, the state has invested substantial funds to accelerate the construction of rural infrastructure and improve agricultural production conditions. For example, large-scale water conservancy projects such as the Changma Irrigation District and Shuangta Irrigation District have been established, enabling the reclamation of 5. 46 × 104 hm2 of unused land, the promotion of water-saving irrigation techniques, the improvement of saline–alkali soil, and the establishment of commercial grain bases, cotton bases, and fruit and vegetable production zones. Over the past decade, 0.903 × 10⁴ hm2 of new forestation has been implemented, and 0. 33 × 104 hm2 of land has been designated for natural regeneration. As a result, vegetation coverage has significantly increased, transforming the fragile desert ecosystem into an efficient oasis-based agricultural system.
- (3)
- In ecologically fragile areas, eco-resettlement must give priority to ecological carrying capacity.
Artificial oases created through migrant reclamation serve as the foundation for migrant settlement, with the scale of irrigated agriculture directly determining the extent of these artificial oases. The expansion of artificial oases has enhanced the connectivity and integration of farmland and increased crop planting areas and grain production, thereby meeting the basic living needs of migrants and improving their well-being. However, the size of artificial oases is not necessarily optimal when expanded indiscriminately. Oasis expansion inevitably increases water demand, and when the scale exceeds the carrying capacity of available water resources, the stability and quality of oasis habitats face severe challenges, leading to significant ecological and environmental issues. Natural oases, formed over long periods of natural succession, possess robust “self-protection” mechanisms, making them far more stable, adaptive, and self-regulating compared to artificial oases. Artificial oases are rapidly established under conditions of human-directed water and soil resource utilization. Given the current limited understanding of the interaction mechanisms and outcomes between human activities and natural processes, it remains essential to evaluate the ecological and economic implications of migrants from a long-term perspective. Extensive historical evidence demonstrates that oases in arid inland river basins follow patterns of origin and migration. The disappearance of numerous ancient oases downstream serves as a cautionary lesson for contemporary migrants. The interdependence of the “water-land-migrant” system underscores its symbiotic nature. Any factor exceeding reasonable limits will profoundly impact the coordination and stability of this system. The isolated characteristics of oasis habitats result in extremely limited environmental carrying capacities. Large-scale population migration and economic development have pushed environmental carrying capacities to their limits [57]. Once these capacities are exceeded, the ecological environment system risks collapse, severely affecting oasis system stability and, consequently, the livelihoods of migrants. Therefore, for ecological migrants, ecological protection and adherence to ecological carrying capacities must be prioritized.
Water resources are the most critical controlling factor influencing the habitat patterns of inland river basins in arid regions. The availability of water plays a decisive role in determining the intensity of migration [57]. The abundance and spatial distribution of water resources generally dictate the direction, scale, and extent of land development. Any damage to water resources inevitably disrupts the regional balance of water–heat, water–salt, and water–land relationships. The strong coupling between water and soil resources in arid areas implies that human-induced habitats continuously expand at the expense of natural habitats. Spatially, as artificial oases expand outward, the desert transition zone contracts and degrades. This contraction of the transition zone and expansion of desert areas pose significant threats to the sustainable development of oases [58]. Monitoring data indicate that excessive land reclamation by migrants has led to a reduction of 1.84 × 10⁴ hm2 in natural grasslands, 1.91 × 10⁶ hm2 in wetlands, 2.61 × 10⁶ hm2 in Gobi desert steppes, and 2.35 × 10⁴ hm2 in halophyte meadow steppes [59]. The deterioration of the ecological environment has significantly increased the frequency of windy and sand-blowing weather events. Water resources, as the core element for oasis formation and structural evolution, are typically categorized into three types based on their usage: production water, domestic water, and ecological water. With the influx of migrants, the water usage structure exhibits the characteristic of “Production and domestic water consumption increasingly impinge upon ecological water requirements”. Since 2016, the rate of water resource exploitation has risen sharply, reaching approximately 172.8%, far exceeding the internationally recognized warning threshold of 40.0% for water resource development [59]. Therefore, ensuring harmony between migrants and ecological sustainability fundamentally requires aligning population and land use with available water resources.
- (4)
- In ecologically fragile areas, eco-migrants must attach great importance to the rational development and utilization of water resources.
In arid inland river basins, native habitats are predominantly sustained by natural river systems. However, human migration activities and the substitution of natural water systems with artificial irrigation canals have fundamentally altered the underlying forces driving habitat differentiation. In artificial habitats, the continuous construction of multi-level irrigation canals has progressively expanded the water network, thereby enhancing connectivity among cultivated lands. Conversely, the connectivity of natural habitats, such as grasslands and unused lands, has significantly declined or even disappeared due to reduced or entirely ceased river inflows caused by artificial water diversion for irrigation purposes. Upstream water control projects, particularly large reservoirs, play a crucial role in water retention and regulation, addressing the water demands for production and domestic use among ecological migrants. Nevertheless, these projects have also disrupted the natural hydrological cycle and ecological characteristics, leading to the contraction and degradation of numerous natural habitats within the oasis–desert transition zone. Therefore, it is imperative to not only focus on the rational allocation of water resources among production, living, and ecological needs but also prioritize the spatial distribution of water resources [60]. Additionally, large-scale land reclamation by migrants has increasingly intensified conflicts over land and water resources with local residents, necessitating attention due to the social dimensions of water resource allocation.
This paper aims to investigate the impact of migration scale on habitat fragmentation. However, during the research process, data accuracy limitations, particularly after land type integration, resulted in an underestimation of the degree of fragmentation. The study uses village areas (i.e., administrative divisions) as statistical units and aggregates them into large-scale migration bases (LMBs), small-scale migration bases (SMBs), and scattered migration settlement points (SMSPs). Nevertheless, the jurisdictional areas of each administrative village vary significantly, and its habitat is also heterogeneous. Consequently, the calculation process also leads to a reduction in the measured degree of fragmentation. Furthermore, while the thesis emphasizes changes during the resettlement period, it lacks sufficient detail regarding the post-migration stage. A comparison of changes between 2000 and 2021 reveals that post-migration changes were more pronounced. This indicates that government-planned actions effectively mitigate habitat fragmentation. Conversely, when government interventions diminish and regulatory intensity declines, habitats become more susceptible to fragmentation.
4.2. Conclusions
- (1)
- With the entry of large-scale migrants, the natural habitat in the resettlement areas has been continuously transformed into artificial habitats, and it has shown obvious phased change characteristics along with the migrant process. The suddenness is stronger in the initial stage of migration. From a spatial dimension perspective, the increasing dispersion of migrant resettlement areas corresponds to a more pronounced expansion of artificial habitats.
- (2)
- NP, ED, SHDI, and SHEI all continued to increase, while C and AI continued to decline, indicating that the habitat is developing towards fragmentation, diversification, and complexity. Compared with LMBs, both SMBs and SMSPs exhibit a higher degree of HF, which reflects how the scale of migration influences the extent of habitat fragmentation. While NHs are experiencing increasing fragmentation, AHs tend to show a decreasing trend in fragmentation. Eco-migration plays a dual role by contributing to the alteration and fragmentation of natural habitat patterns, while simultaneously promoting the formation and continuity of artificial habitat structures. This study offers valuable practical insights and cautionary lessons for the resettlement of ecological migrants.
Author Contributions
Conceptualization, L.W.; fund provider, L.W.; supervision, L.W.; investigation, T.L. and J.G.; methodology, data curation, T.L. and J.G.; writing—original draft, L.W. and T.L.; writing—review and editing, L.W.; model, T.L. and J.G.; visualization, T.L. and J.G. All authors have read and agreed to the published version of the manuscript.
Funding
This research was funded by the National Natural Science Foundation of China (42371219), and jointly funded by The Action Plan for Breakthrough in Oasis Scientific Research Achievements (NWNU-LZKX-202302).
Institutional Review Board Statement
Not applicable.
Informed Consent Statement
Not applicable.
Data Availability Statement
The data that support the findings of this research are available upon reasonable request from the corresponding author.
Conflicts of Interest
The authors declare that do not have any known competing financial interests or personal ties that could appear to have influenced the work indicated in this research.
References
- Jia, Y. Review of benefit evaluation research on eco-migration in China. Resour. Sci. 2016, 38, 1550–1560. (In Chinese) [Google Scholar]
- Swain, A. Environmental migration and conflict dynamics: Focus on developing regions. Third World Q. 1996, 17, 959–973. [Google Scholar] [CrossRef] [PubMed]
- Hu, Y.; Zhou, W.; Yuan, T. Environmental impact assessment of eco-migration in China: A survey of migrant resettlement regions. J. Zhejiang Univ.-Sci. A 2018, 19, 240–254. [Google Scholar] [CrossRef]
- Li, J.; Dong, H.; Li, S. Economic development and optimal allocation of land use in ecological emigration area in China. Land Use Policy 2024, 142, 107178. [Google Scholar] [CrossRef]
- Yang, Y.; de Sherbinin, A.; Liu, Y. China’s poverty alleviation resettlement: Progress, problems and solutions. Habitat Int. 2020, 98, 102135. [Google Scholar] [CrossRef]
- Zhou, Z.; Feng, Q.; Zhu, C.; Luo, W.; Wang, L.; Zhao, X.; Zhang, L. The spatial and temporal evolution of ecological environment quality in karst ecologically fragile areas driven by poverty alleviation resettlement. Land 2022, 11, 1150. [Google Scholar] [CrossRef]
- Rogers, S.; Xue, T. Resettlement and climate change vulnerability: Evidence from rural China. Glob. Environ. Change 2015, 35, 62–69. [Google Scholar] [CrossRef]
- Liu, Y.; Liu, J.; Zhou, Y. Spatio-temporal patterns of rural poverty in China and targeted poverty alleviation strategies. J. Rural Stud. 2017, 52, 66–75. [Google Scholar] [CrossRef]
- Gardner, R.H.; Turner, M.G. Quantitative Methods in Landscape Ecology: The Analysis and Interpretation of Landscape Heterogeneity; Springer: New York, NY, USA, 1991. [Google Scholar]
- Li, W.; Kang, J.; Wang, Y. Effects of habitat fragmentation on ecosystem services and their trade-offs in Southwest China; a multi-perspective analysis. Ecol. Indic. 2024, 167, 112699. [Google Scholar] [CrossRef]
- Teckentrup, L.; Kramer-Schadt, S.; Jeltsch, F. The risk of ignoring fear: Underestimating the effects of habitat loss and fragmentation on biodiversity. Landsc. Ecol. 2019, 34, 2851–2868. [Google Scholar] [CrossRef]
- Haddad, N.M.; Brudvig, L.A.; Clobert, J.; Davies, K.F.; Gonzalez, A.; Holt, R.D.; Lovejoy, T.E.; Sexton, J.O.; Austin, M.P.; Collins, C.D.; et al. Habitat fragmentation and its lasting impact on Earth’s ecosystems. Sci. Adv. 2015, 1, e1500052. [Google Scholar] [CrossRef] [PubMed]
- Tang, J.; Zhou, L.; Dang, X.; Hu, F.; Yuan, B.; Yuan, Z.; Wei, L. Impacts and predictions of urban expansion on habitat quality in the densely populated areas: A case study of the Yellow River Basin, China. Ecol. Indic. 2023, 151, 110320. [Google Scholar] [CrossRef]
- Tao, Y.; Hastings, A.; Lafferty, K.D.; Hanski, I.; Ovaskainen, O. Landscape fragmentation overturns classical metapopulation thinking. Proc. Natl. Acad. Sci. USA 2024, 121, e2303846121. [Google Scholar] [CrossRef] [PubMed]
- Black, R. Environmental refugees: Myth or reality? Un High Comm. Refug. 2001, 19, 167–182. [Google Scholar]
- Li, Y.; López-Carr, D.; Chen, W. Factors affecting migration intentions in ecological restoration areas and their implications for the sustainability of ecological migration policy in arid Northwest China. Sustainability 2014, 6, 8639–8660. [Google Scholar] [CrossRef]
- Bozkurt, S.G.; Basaraner, M. Spatio-temporal investigation of urbanization and its impact on habitat fragmentation in natural ecosystems of Istanbul using Shannon’s entropy and landscape metrics in GIS. Environ. Dev. Sustain. 2024, 26, 26879–26907. [Google Scholar] [CrossRef]
- Wang, J.; Cheng, Y.; Jin, Y. Analysis on land use variation and its driving force of comprehensive development region for migrant settlement—A case of main stream region of Mid-Shulehe River. Water Resour. Hydropower Eng. 2018, 49, 46–51. (In Chinese) [Google Scholar]
- Ma, Q.; Li, D.; Liao, J.; Han, J. Analysis of land use change and its driving forces in the Oasis of Shule River middle and lower Reaches. Econ. Geogr. 2014, 34, 148–155. (In Chinese) [Google Scholar]
- Ma, L.; Li, X.; Cheng, W.; Bo, J. Basin land use intensity based on panel data of irrigation district and the identification of spatiotemporal difference of influencing factors. Chin. J. Ecol. 2019, 38, 908–918. (In Chinese) [Google Scholar]
- Myers, N. Environmental refugees in a globally warmed world estimating the scope of what could well become a prominent international phenomenon. Bioscience 1993, 43, 752–761. [Google Scholar] [CrossRef]
- Tolba, M.K. AIBS news: Our biological heritage under siege. Bioscience 1989, 39, 725–728. [Google Scholar] [CrossRef]
- Jäger, J. Environmental change and forced migration. Environment. 2009, 51, 4. [Google Scholar]
- Hugo, G. Environmental concerns and international migration. Int. Migr. Rev. 1996, 30, 105–131. [Google Scholar] [CrossRef] [PubMed]
- Li, X.; Xu, S.; Hu, Y. Understanding the rural livelihood stability system: The eco-migration in Huanjiang County, China. Sustainability 2020, 12, 6374. [Google Scholar] [CrossRef]
- Vlassopoulos, C.A. Defining environmental migration in the climate change era; problem, consequence or solution? In Disentangling Migration and Climate Change; Methodologies, Political Discourses and Human Rights; Springer: Dordrecht, The Netherlands, 2013; pp. 145–163. [Google Scholar]
- Woube, M. Effects of Resettlement Schemes on the Biophysical and Human Environments: The Case of the Gambela Region, Ethiopia; Universal-Publishers: Irvine, CA, USA, 2005. [Google Scholar]
- Correa, E. Preventive Resettlement of Populations at Risk of Disaster; Experiences from Latin America; World Bank: Washington, DC, USA, 2011. [Google Scholar]
- William, M.J. Understanding the relationship between environmental change and migration: The development of an effects framework based on the case of northern Ethiopia. Glob. Environ. Change 2013, 23, 1501–1510. [Google Scholar]
- Adamo, S.B. Environmental migration and cities in the context of global environmental change. Curr. Opin. Environ. Sustain. 2010, 2, 161–165. [Google Scholar] [CrossRef]
- Mao, X.F.; Wei, X.Y.; Xia, J.X. Evaluation of ecological migrants’ adaptation to their new living area in Three-River Headwater wetlands, China. Procedia Environ. Sci. 2012, 13, 1346–1353. [Google Scholar] [CrossRef]
- Kura, Y.; Joffre, O.; Laplante, B.; Sengvilaykham, B. Coping with resettlement: A livelihood adaptation analysis in the Mekong River basin. Land Use Policy 2017, 60, 139–149. [Google Scholar] [CrossRef]
- Tan, Y. Development-induced displacement and resettlement: An overview of issues and interventions. In Routledge Handbook of Migration and Development; Routledge: London, UK, 2020; pp. 373–381. [Google Scholar]
- Li, J.; Peng, X.; Tang, R.; Geng, J.; Zhang, Z.; Xu, D.; Bai, T. Spatial and temporal variation characteristics of ecological environment quality in China from 2002 to 2019 and influencing factors. Land 2024, 13, 110. [Google Scholar] [CrossRef]
- Reuveny, R. Ecomigration and violent conflict; Case studies and public policy implications. Hum. Ecol. 2008, 36, 1–13. [Google Scholar] [CrossRef]
- Platt, R.V.; Ogra, M.V.; Badola, R.; Hussain, S.A. Conservation-induced resettlement as a driver of land cover change in India: An object-based trend analysis. Appl. Geogr. 2016, 69, 75–86. [Google Scholar] [CrossRef]
- Warner, K. Global environmental change and migration; Governance challenges. Glob. Environ. Change 2010, 20, 402–413. [Google Scholar] [CrossRef]
- Ocello, C.; Petrucci, A.; Testa, M.R. Environmental aspects of internal migration in Tanzania. Popul. Environ. 2015, 37, 99–108. [Google Scholar] [CrossRef]
- Wilmsen, B.; Van Hulten, A. Following resettled people over time: The value of longitudinal data collection for understanding the livelihood impacts of the Three Gorges Dam, China. Impact Assess. Proj. Apprais. 2017, 35, 94–105. [Google Scholar] [CrossRef]
- Miller, F.; Ha, T.T.P.; Van Da, H.; Thuy, N.T.; Ngo, B.H. Double displacement–interactions between resettlement, environmental change and migration. Geoforum 2022, 129, 13–27. [Google Scholar] [CrossRef]
- Bossio, D.; Geheb, K.; Cri Engle, N.L. Adaptive capacity and its assessment. Glob. Environ. Change 2011, 21, 647–656. [Google Scholar]
- Evrard, O.; Goudineau, Y. Planned resettlement, unexpected migrations and cultural trauma in Laos. Dev. Change 2004, 35, 937–962. [Google Scholar] [CrossRef]
- Bessho, Y. Migration for ecological preservation? Tibetan herders’ decision making process in the eco-migration policy of Golok Tibetan autonomous prefecture (Qinghai province, PRC). Nomadic Peoples 2025, 19, 189–208. [Google Scholar] [CrossRef]
- Riva, F.; Fahrig, L. Landscape-scale habitat fragmentation is positively related to biodiversity, despite patch-scale ecosystem decay. Ecol. Lett. 2023, 26, 268–277. [Google Scholar] [CrossRef] [PubMed]
- Wang, X.; David, L.; Liang, Z. Combined effects of forest conservation and population resettlement on the ecological restoration of Qilian Mountain National Park. Land 2024, 13, 1983. [Google Scholar] [CrossRef]
- Ma, L.; Bo, J.; Li, X.; Fang, F.; Cheng, W. Identifying key landscape pattern indices influencing the ecological security of inland river basin: The middle and lower reaches of Shule River Basin as an example. Sci. Total Environ. 2019, 674, 424–438. [Google Scholar] [CrossRef] [PubMed]
- Xie, X.; Yang, G.; Wang, Z.; Wang, J. Landscape pattern change in mountainous areas along an altitude gradient in the upper reaches of Shule River. Chin. J. Ecol. 2010, 29, 1420–1426. (In Chinese) [Google Scholar]
- Zhang, Q.; Chen, Y.; Sun, C.; Xiang, Y.; Hao, H. Changes in terrestrial water storage and evaluation of oasis ecological security in the Tarim River Basin. Arid. Land Geogr. 2024, 47, 1–14. (In Chinese) [Google Scholar]
- Zhang, X.; Xu, D.; Wang, H.; Chen, X.S. Study on the dynamic variation of landscape pattern in the middle and lower reaches of the Shule River Basin. J. Lanzhou Univ. (Nat. Sci.) 2004, 40, 81–85. (In Chinese) [Google Scholar]
- Ma, L.; Cheng, W.; Bo, J.; Li, X.; Gu, Y. Spatio-temporal variation of land-use intensity from a multi-perspective-taking the middle and lower reaches of Shule River Basin in China as an example. Sustainability 2018, 10, 771. [Google Scholar] [CrossRef]
- Cheng, S. Study on Dynamic Change of Landscape in Shule River Basin; Northwest University: Xi’an, China, 2004. (In Chinese) [Google Scholar]
- Pan, J.; Su, Y.; Huang, Y.; Liu, X. Dynamic changes of land use and landscape patterns in middle reaches of Shule River, Northwest China. Chin. J. Appl. Ecol. 2012, 23, 1090–1096. (In Chinese) [Google Scholar]
- Chang, G.; Zhang, W. Ecological civilization-based rethinking of large-scale migrants and land development along Shule River. J. Lanzhou Univ. (Nat. Sci.) 2014, 50, 405–409. (In Chinese) [Google Scholar]
- Yang, J.; Zhou, D.; Ma, J.; Zhu, X.; Jin, Y.; Zhou, F.; Zhang, J. Spatial and temporal matching characteristics of agricultural land and water resources in the Shule River Basin. Arid. Land Geogr. 2023, 46, 982–992. (In Chinese) [Google Scholar]
- Liu, Q.; Ai, X.S. Research on Combined Operation of the Three Reservoirs in the Shule River Irrigation. China Rural Water Hydropower 2008, 4, 42–45. (In Chinese) [Google Scholar]
- Zhang, P.; Li, X.; Bao, H. Analysis on the Performance of the Ecological Minorities Migrant: A case study of the Shule River Project. Areal Res. Dev. 2011, 30, 42–47. (In Chinese) [Google Scholar]
- Zhao, R.; Long, D.; Yang, M.; Fan, X. From resettlement to revitalization: Examining the water resource environment carrying capacity of ecological migrant resettlement areas in China. Ecol. Indic. 2024, 160, 111879. [Google Scholar] [CrossRef]
- Chen, B.; Duan, Q.; Zhao, W.; Wang, L.; Zhong, Y.; Zhuang, Y.; Chang, X.; Dong, C.; Du, W.; Luo, L. Oasis sustainability is related to water supply mode. Agric. Water Manag. 2023, 290, 108589. (In Chinese) [Google Scholar] [CrossRef]
- Zheng, Y.; Yang, Q.; Ren, H.; Wang, D.; Zhao, C.; Zhao, W. Spatial pattern variation of artificial sand-binding vegetation based on UAV imagery and its influencing factors in an oasis–desert transitional zone. Ecol. Indic. 2022, 141, 109068. [Google Scholar] [CrossRef]
- Zhang, W.; Ma, L.; Li, H.; Wang, X. Trends in the future evolution of rural settlements in oasis-desert areas under water use simulation scenarios: Take the Hexi Corridor region of China as an example. Landsc. Urban Plan. 2024, 248, 105110. [Google Scholar] [CrossRef]
Disclaimer/Publisher’s Note: The statements, opinions and data contained in all publications are solely those of the individual author(s) and contributor(s) and not of MDPI and/or the editor(s). MDPI and/or the editor(s) disclaim responsibility for any injury to people or property resulting from any ideas, methods, instructions or products referred to in the content. |
© 2025 by the authors. Licensee MDPI, Basel, Switzerland. This article is an open access article distributed under the terms and conditions of the Creative Commons Attribution (CC BY) license (https://creativecommons.org/licenses/by/4.0/).