Article

A Framework for Synergy Measurement Between Transportation and Production–Living–Ecological Space Using Volume-to-Capacity Ratio, Accessibility, and Coordination

1
Guangzhou Transport Planning Research Institute Co., Ltd., Guangzhou 510030, China
2
Guangdong Sustainable Transportation Engineering Technology Research Center, Guangzhou 510030, China
*
Author to whom correspondence should be addressed.
Land 2025, 14(7), 1495; https://doi.org/10.3390/land14071495
Submission received: 6 May 2025 / Revised: 20 June 2025 / Accepted: 20 June 2025 / Published: 18 July 2025

Abstract

In the stage of high-quality development, the functional coordination between transportation systems and territorial space is a key issue for improving urban spatial efficiency. This paper breaks through the traditional volume-to-capacity ratio analysis paradigm and innovatively integrates the “production-living-ecological space” theory. By introducing an improved accessibility evaluation model and developing a coordination measurement algorithm, a three-dimensional evaluation mechanism covering development potential assessment, service efficiency diagnosis, and resource allocation optimization is established. Empirical research indicates that the improved accessibility indicators can precisely identify the transportation location value of regional functional cores, while the composite coordination indicators can deconstruct the spatiotemporal matching characteristics of “transportation facilities—spatial functions,” providing a dual decision-making basis for the redevelopment of existing space. This measurement system innovatively realizes the integration of planning transmission mechanisms with multi-scale application scenarios, guiding both overall spatial planning and urban renewal area re-optimization. The methodology, applied to the urban villages of Guangzhou, can significantly increase land utilization intensity and value. The research results offer a technical tool for cross-scale collaboration in land space planning reforms and provide theoretical innovations and practical guidance for the value reconstruction of existing spaces under the context of new urbanization.

1. Introduction

Under China’s spatial planning restructuring and advancing urbanization, transportation–territorial space synergy is undergoing a paradigmatic transformation. After three decades of rapid expansion, infrastructure development has shifted from quantitative growth to structural optimization, revealing acute supply-side contradictions: (1) “Spatial sunk costs” from underutilized facilities (e.g., low-usage subway stations/hubs like “subways in farmlands”) and (2) diminishing economic returns at transport nodes, exemplified by the Guangzhou South Railway Station (89.38 million passengers in 2024 yet stagnant peripheral development). This reveals that the traditional unidirectional feedback model between transportation and spatial development has become inadequate to meet the demands of the stock development phase.
Institutional environment reforms have further intensified the urgency for synergistic transportation–spatial development. Driven by the ecological civilization strategy, strict control of construction land has become a national strategic objective. Particularly in megacities, Shanghai plans to limit urban construction land to 3200 km2 by 2035—merely 15 km2 more than 2020 levels—while Beijing aims to reduce construction land to 3670 km2, 50 km2 less than 2020. This fundamental transformation in spatial supply modes has catalyzed the demand for planning paradigm innovation, creating policy-level opportunities for transportation–spatial synergy.
Although existing studies have made progress in facility layout optimization and transit-oriented development (TOD), methodological limitations remain in the quantitative analysis of the synergistic development mechanism of transportation and space in the existing context. First, the unidirectionality of evaluation indexes prevents transportation planning from providing feedback to urban planning. For example, the volume-to-capacity ratio index can only guide transportation planning, not urban planning. Second, there is still no unified standard for evaluation methods. Apart from external uncontrollable factors, a major obstacle lies in the limited operability of these methods in practical planning scenarios. For instance, accessibility evaluations often focus solely on public transportation access, neglecting the accessibility of individual transportation modes, which limits their effectiveness in providing decision-makers with insights into further development needs. Third, the use of a single evaluation tool is insufficient to meet the diverse needs across different stages of development.
Based on the above-introduced limitations, we improve the quantitative evaluation of synergy between transportation and production–living–ecological space, aiming to promote synergy between transportation and territorial space. The contributions manifest in several aspects: we enhance the technology tools for a synergistic-level evaluation to make them applicable to different stages of urban development. We improve existing accessibility algorithms into a comprehensive evaluation model based on production–living–ecological space, enabling integrated assessments of accessibility across various scenarios. This approach evaluates the alignment between transportation infrastructure layouts and spatial characteristics, with results in supporting decision-making in multi-scenario land-use planning. To refine the coordination metrics evaluation, we enhance the node–place model to assess the regional development scale and identify imbalance areas, while introducing the Data Envelopment Analysis (DEA) model to resolve its inherent limitation in precisely quantifying transportation–space matches, ultimately establishing a comprehensive coordination assessment framework.
The remainder of this paper is structured as follows. Section 2 contains the literature review. Section 3 introduces the existing evaluation methods and shortcomings, as well as the framework of the synergistic evaluation method established in this case. Section 4 describes the Guangzhou practice of the evaluation methodology, and Section 5 contains the results and discussion.

2. Literature Review

At present, research on production–living–ecological space primarily focuses on the concept and connotation of production–living–ecological space, functional classification, and identification, as well as evolution and driving mechanisms. Some studies have also applied the concept of production–living–ecological space to various fields, such as land consolidation, calculation of resource and environmental carrying capacity, and land suitability evaluation. The scientific validity and feasibility of these research ideas have been well-verified.
On the other hand, research on the coordination of land use and transportation mainly focuses on quantitative analysis models. These models include coordination evaluation methods based on composite system theory, economic input–output efficiency, and expert scoring methods. The composite system theory primarily includes methods or theories such as order parameters, coupling degree, system dynamics, and the node–place model, which evaluate the degree of coordination between subsystems using internal indicators of the composite system. There is no refined evaluation framework or method from the perspective of production–living–ecological space to analyze the coordination between transportation and land use.
For the analysis of the interaction between spatial utilization and transportation facilities, existing evaluation methods can be mainly divided into three categories:
(1)
Carrying capacity evaluation
The concept of carrying capacity in transportation was first introduced in its narrow sense by Gao et al., who defined it as the maximum number of pedestrians and vehicles that a limited road space can accommodate under specific transportation facility conditions and service levels [1]. Later, in practical applications, the concept of carrying capacity was expanded to represent the ability of the transportation system to function normally under multiple constraints, such as public transportation service capacity, regional transportation resources, and urban transportation infrastructure [2]. Common evaluation indicators include saturation and the load factor. As an important indicator for urban transportation construction and management, carrying capacity is integrated upstream with urban transportation planning and downstream with individual and public transportation demand management. Currently, it is primarily used as a constraint condition for urban development during the stages of urban master planning and urban regulatory detailed planning [3].
(2)
Accessibility evaluation
The concept of accessibility was first proposed by Walter G. Hansen, who defined it as the magnitude of interaction opportunities between nodes in a transportation network [4]. Subsequently, various algorithms and definitions of accessibility have been developed, which can be broadly classified into two categories based on the research object: macro-level and micro-level categories. Macro-level algorithms, which focus on aggregated group characteristics, include three main approaches: space–time impedance [5], cumulative opportunities [6,7], and spatial interaction [4,8]. Micro-level algorithms primarily involve individual utility-based models [9], where the research object is precise to the individual level. Accessibility has been institutionalized in London, UK [10], and in China, it has been partially applied in planning as a non-mandatory element. Additionally, it has been incorporated into the “Guidelines for Municipal Territorial Spatial Master Plan Preparation (Trial)” issued by the Ministry of Natural Resources.
(3)
Coordination evaluation
The concept of coordination was introduced by Vanka for the coordinated management of national highways and local development along their routes [11]. Later, in China, Yang et al. proposed that coordination refers to the degree of mutual promotion and interdependence between land use and urban transportation, and they were the first to provide a detailed quantitative evaluation method, demonstrating the feasibility of quantifying coordination [12].
Subsequent research has focused on developing coordination models using mathematical methods such as order parameters [13], coupling degree [14,15], system dynamics [16,17,18,19], and node–place models [20,21,22], as well as integrated models based on the Lowry model [23,24], planning methodologies [25,26], and economic analysis methods [27]. The forms of these models and their application scenarios have continued to expand. Jiang et al. proposed an innovative framework combining the Future Land Use Simulation Model (FLUS), Shared Socioeconomic Pathways (SSPs), and an Eco-environmental Effect Method to simulate the spatiotemporal dynamics of production–living–ecological space and evaluate its ecological effects [28]. Shabnam used gravity models based on open data, including OpenStreetMap and GTFS, to assess public transport accessibility to facilities in Rome, offering a practical tool for transport planning and social equity analysis [29].
Currently, the United Kingdom is the only country that has incorporated accessibility evaluation into statutory procedures. In 1963, the UK Ministry of Transport published Traffic in Towns: A Study of the Long-Term Problems of Traffic in Urban Areas, which identified accessibility, standards of living environments, and the costs of physical redevelopment investments as the three primary indicators reflecting transportation issues.
China’s Urban and Rural Planning Law (1968) adopted the recommendation that transportation planning should be included as a mandatory component of statutory development plans for large cities [10]. The Transport for London (TfL) agency uses accessibility to quantify the quality of transportation infrastructure and various services. Among these, Public Transport Accessibility Levels (PTALs) is one of the most widely applied technical systems for accessibility evaluation.
In 2003, the UK Deputy Prime Minister’s Office required local transportation authorities to include public transport accessibility analysis in their statutory Local Transport Plan (LTP). PTALs quantify the service capacity of public transportation infrastructure based on spatial grids, with evaluation results primarily reflecting public transport accessibility from the perspectives of infrastructure and time dimensions.
The accessibility model can be categorized into four types, as shown in Table 1.
Currently, in some Chinese cities, it has also been preliminarily applied and included in pilot government documents. Accessibility evaluation is applicable throughout the entire urban development process, particularly after the introduction of the territorial spatial planning system. It is especially relevant for cities and regions with a certain level of economic scale.
However, accessibility evaluation overly emphasizes transportation, resulting in a relatively limited scope of application. Among the four types of accessibility models, cumulative opportunity models reflect the macroscopic aggregated characteristics of a region but tend to overlook the microscopic characteristics of individual travel behaviors. Spatial interaction models exhibit significant errors in short-distance travel scenarios. Individual utility models fail to consider opportunity demand and require diverse and complex datasets for calculation. Additionally, accessibility evaluation struggles to provide optimization strategies for facilities and land use. Its calculations primarily rely on transportation infrastructure factors, making it incapable of reflecting land-use characteristics. Furthermore, the determination of importance weights is overly subjective and lacks scientific rigor. Therefore, there is a need for supplementary indicators to address these shortcomings.

3. Materials and Methods

3.1. Existing Synergy Measurement

3.1.1. Traditional Supply-to-Demand Ratio Analysis Paradigm

In February 2000, the General Office of the State Council of China issued the “Opinions on Implementing the National Urban Road Traffic Smooth Project,” jointly released by the Ministry of Public Security and the Ministry of Construction [24]. In 2003, the evaluation system for the Smooth Project stated the following: “For large-scale construction and development projects, traffic impact analysis must be conducted for at least 95% of such projects.” Since then, the traffic evaluation (TE) system, primarily based on the supply-to-demand ratio, has played a significant role.
During the regulatory detailed planning phase, planners and decision-makers are familiar with the concept of road service levels. When the supply-to-demand ratio of roads within the affected area reaches level F, the development scale must be reduced in the detailed planning phase.
The supply-to-demand ratio analysis has been widely adopted in the planning field. By simply obtaining traffic flow and network capacity data for roads or rail systems, planners can calculate the supply-to-demand ratio as an evaluation indicator through straightforward computations. The formula for calculating the supply-to-demand ratio is as follows:
Q = V / C
where V represents traffic volume and C represents maximum capacity.
The supply-to-demand ratio is a simple and easily comprehensible evaluation indicator, making it one of the most commonly used metrics for measuring the synergy between transportation and land use. It is widely applied in various transportation planning levels, including transportation strategic planning, comprehensive transportation planning, specialized planning for roads and rail systems, and traffic impact analysis/capacity evaluation.

3.1.2. Synergy Evaluation Based on the Node–Place Model

Among the existing methods for coordination evaluation, the node–place model has been widely applied in TOD planning. This model considers the transportation services provided by key hubs and the utilization of surrounding spaces as the “node value” and “place value,” respectively. The higher the values of both, the greater the comprehensive value of the region.
The model can also roughly indicate the matching status between the supply of transportation infrastructure and the demand for travel activities. By identifying the discrepancy between the node value and place value, the model helps users detect areas with mismatches. The original node–place model categorizes regions into five types: dependency, accessibility, stress, unsustained node, and unsustained place. These types are used to depict the differences among areas surrounding key hubs, as shown in Figure 1.
The node–place model has already demonstrated its capability to compare the development progress of different areas and identify the matching status of facilities and land use. While it cannot effectively provide optimization strategies for problematic areas, it still contributes to a better understanding of regional development progress.

3.2. Existing Issues

3.2.1. Dilemmas of Supply-to-Demand Ratio Analysis

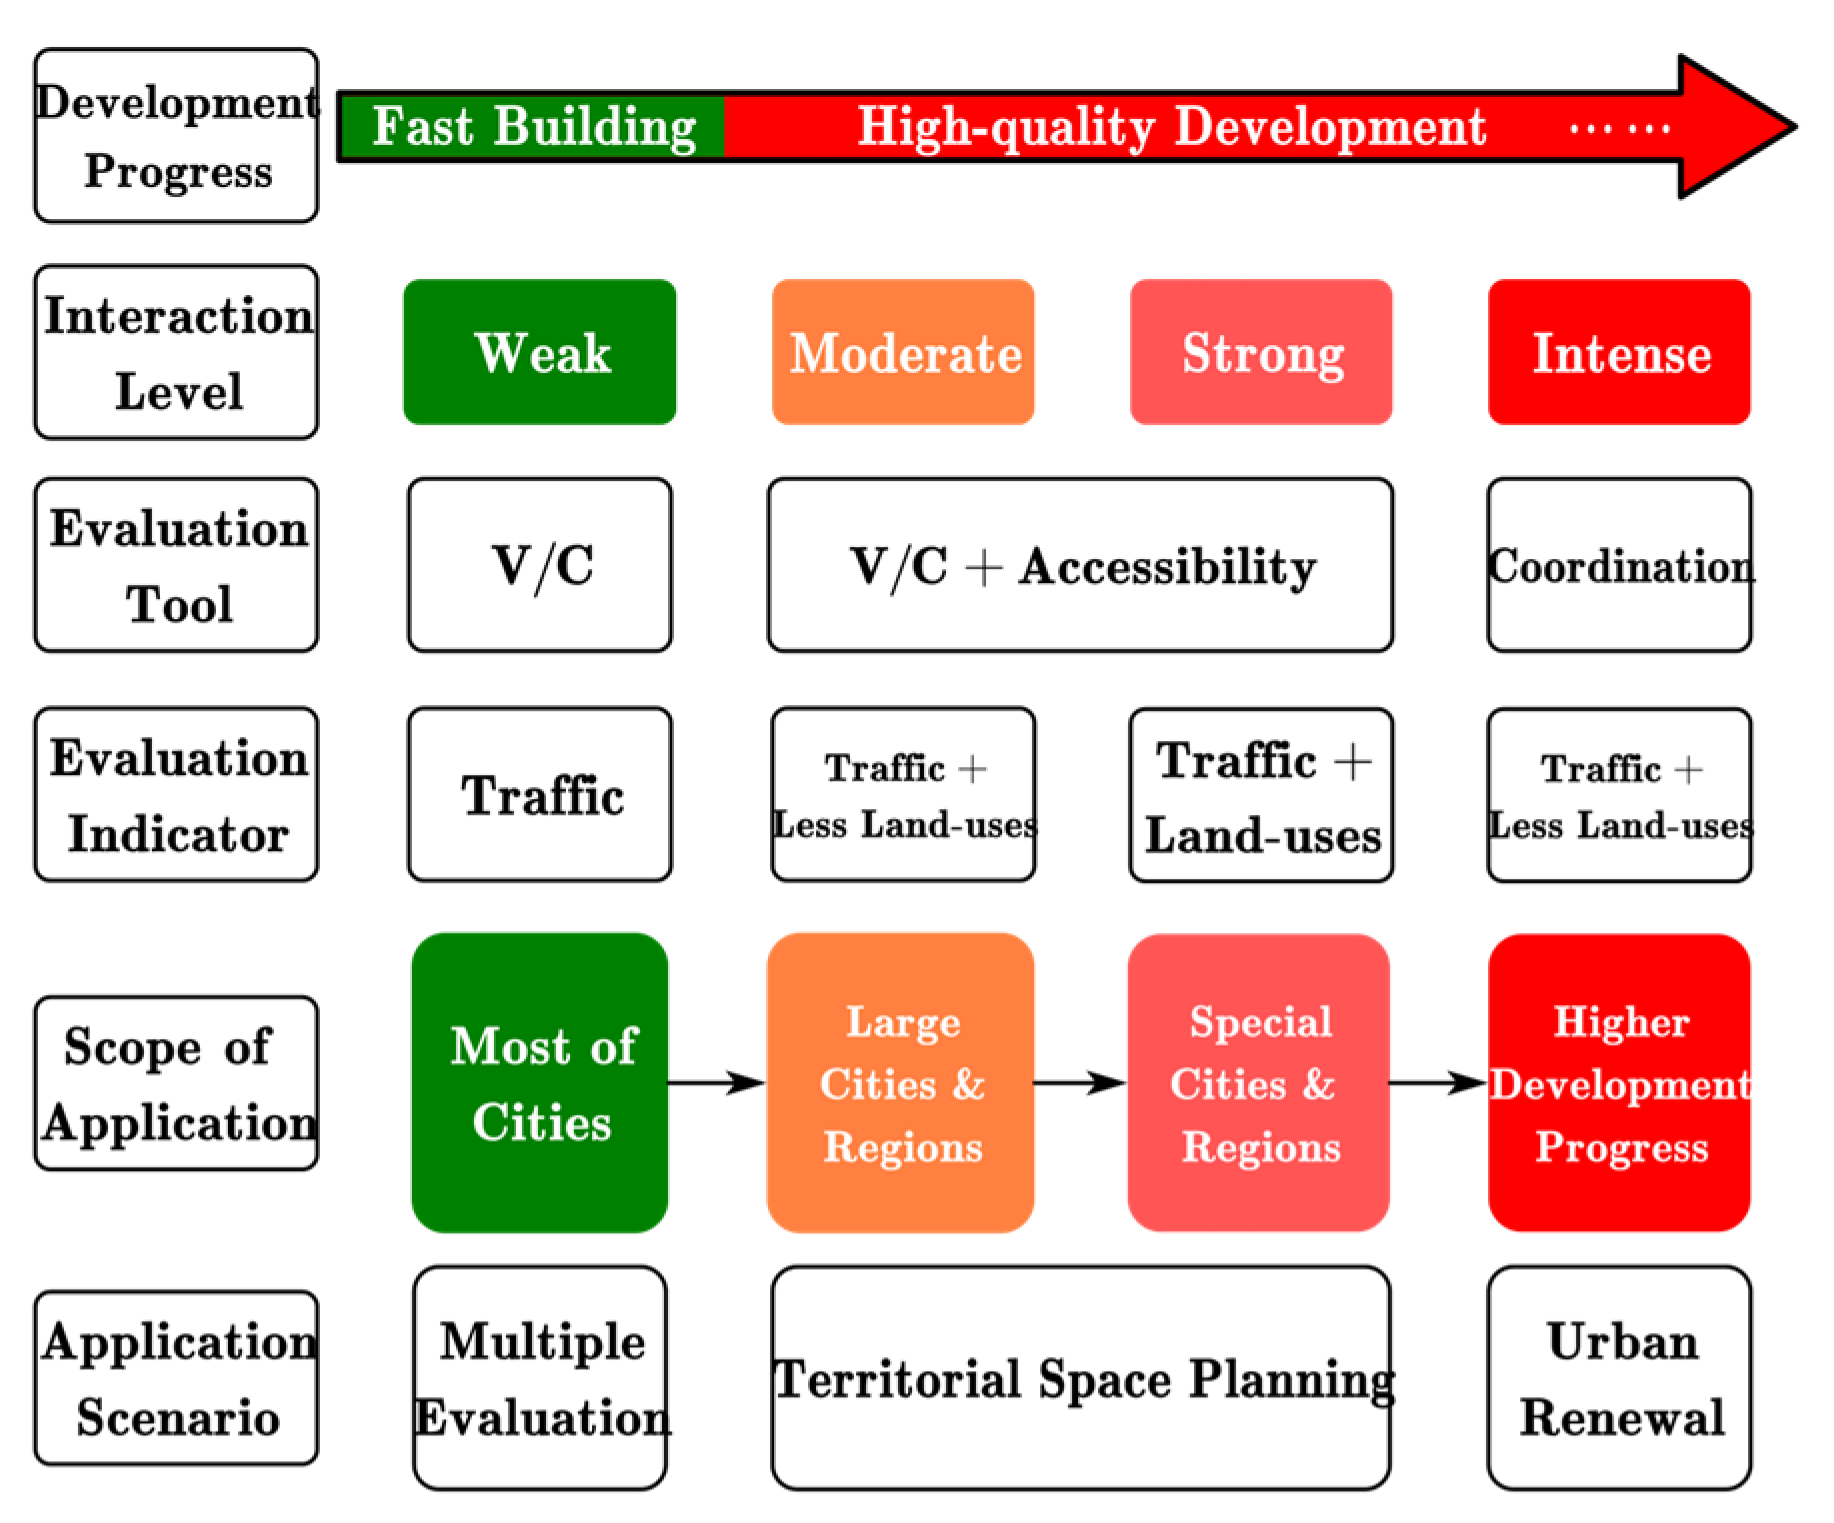
Due to its simplicity, supply-to-demand ratio analysis is only suitable for evaluating the extent to which transportation supports land development and construction. It struggles to reflect the adaptability of land development characteristics and scale to transportation infrastructure. Furthermore, it is less applicable in higher-level planning stages, such as master planning and zoning planning. As a result, it cannot support the optimization of existing spatial resources in the stage of promoting high-quality development—specifically, the maximization of spatial value under the same level of transportation infrastructure. Cities and regions at different stages of development may exhibit various states of synergy between transportation infrastructure and land use, as illustrated in Figure 2.
During the phase of rapid growth, China experienced a significant increase in total population and urbanization levels, accompanied by abundant construction land and accelerated transportation infrastructure development. The rapid growth on both the demand and supply sides masked many critical, overarching planning issues. At this stage, the layout and early construction of transportation infrastructure helped improve service levels for undeveloped land, thereby attracting and introducing industrial development.
Before the introduction of the territorial spatial planning system, the planning and construction of transportation infrastructure lacked feedback mechanisms and pathways to inform urban planning. As a result, the synergy between transportation infrastructure and spatial development was largely one-directional.

3.2.2. Limitations of the Node–Place Model

The node–place model’s concept of synergy analysis between transportation infrastructure and land development demonstrates its applicability in evaluating coordination within territorial spatial planning. However, there remains a significant gap between its theoretical applicability and practical usability. The results shown in Figure 2 highlight four key limitations of the node–place model:
  • Lack of skewed distribution preprocessing: A large number of scatter points are concentrated along the boundary formed by the minimum value on one side, resulting in negative scatter coordinates that are difficult to interpret and understand.
  • Unclear boundary and internal classification of the balance range: The boundaries of the balance range and its internal classifications are not well-defined. For example, in Figure 3, there is no quantitative delineation method between the balance range (the shaded area, including dependency, accessibility, and stress) and the imbalance range (including unsustained node and unsustained place), nor among the three states within the balance range.
  • Failure to consider the matching of land-use types and transportation facilities: For instance, industrial land development generally prioritizes highways and external transportation hubs in planning evaluations, while it is less sensitive to public transportation facilities and the quality of resident travel. However, in cases where public transportation facilities are abundant, using evaluation systems with specific biases or unweighted comprehensive evaluation methods like the node–place model may lead to erroneous conclusions, such as the assumption that industrial land development is already well-supported by transportation facilities.
  • Lack of factor optimization methods: When scatter points fall into an imbalanced state, the model cannot provide optimization strategies, such as the types and scales of resources that should be allocated to improve the imbalanced areas.

3.3. Measuring Synergy Between Transportation and Production–Living–Ecological Space

3.3.1. Integration of the Production–Living–Ecological Space Theory

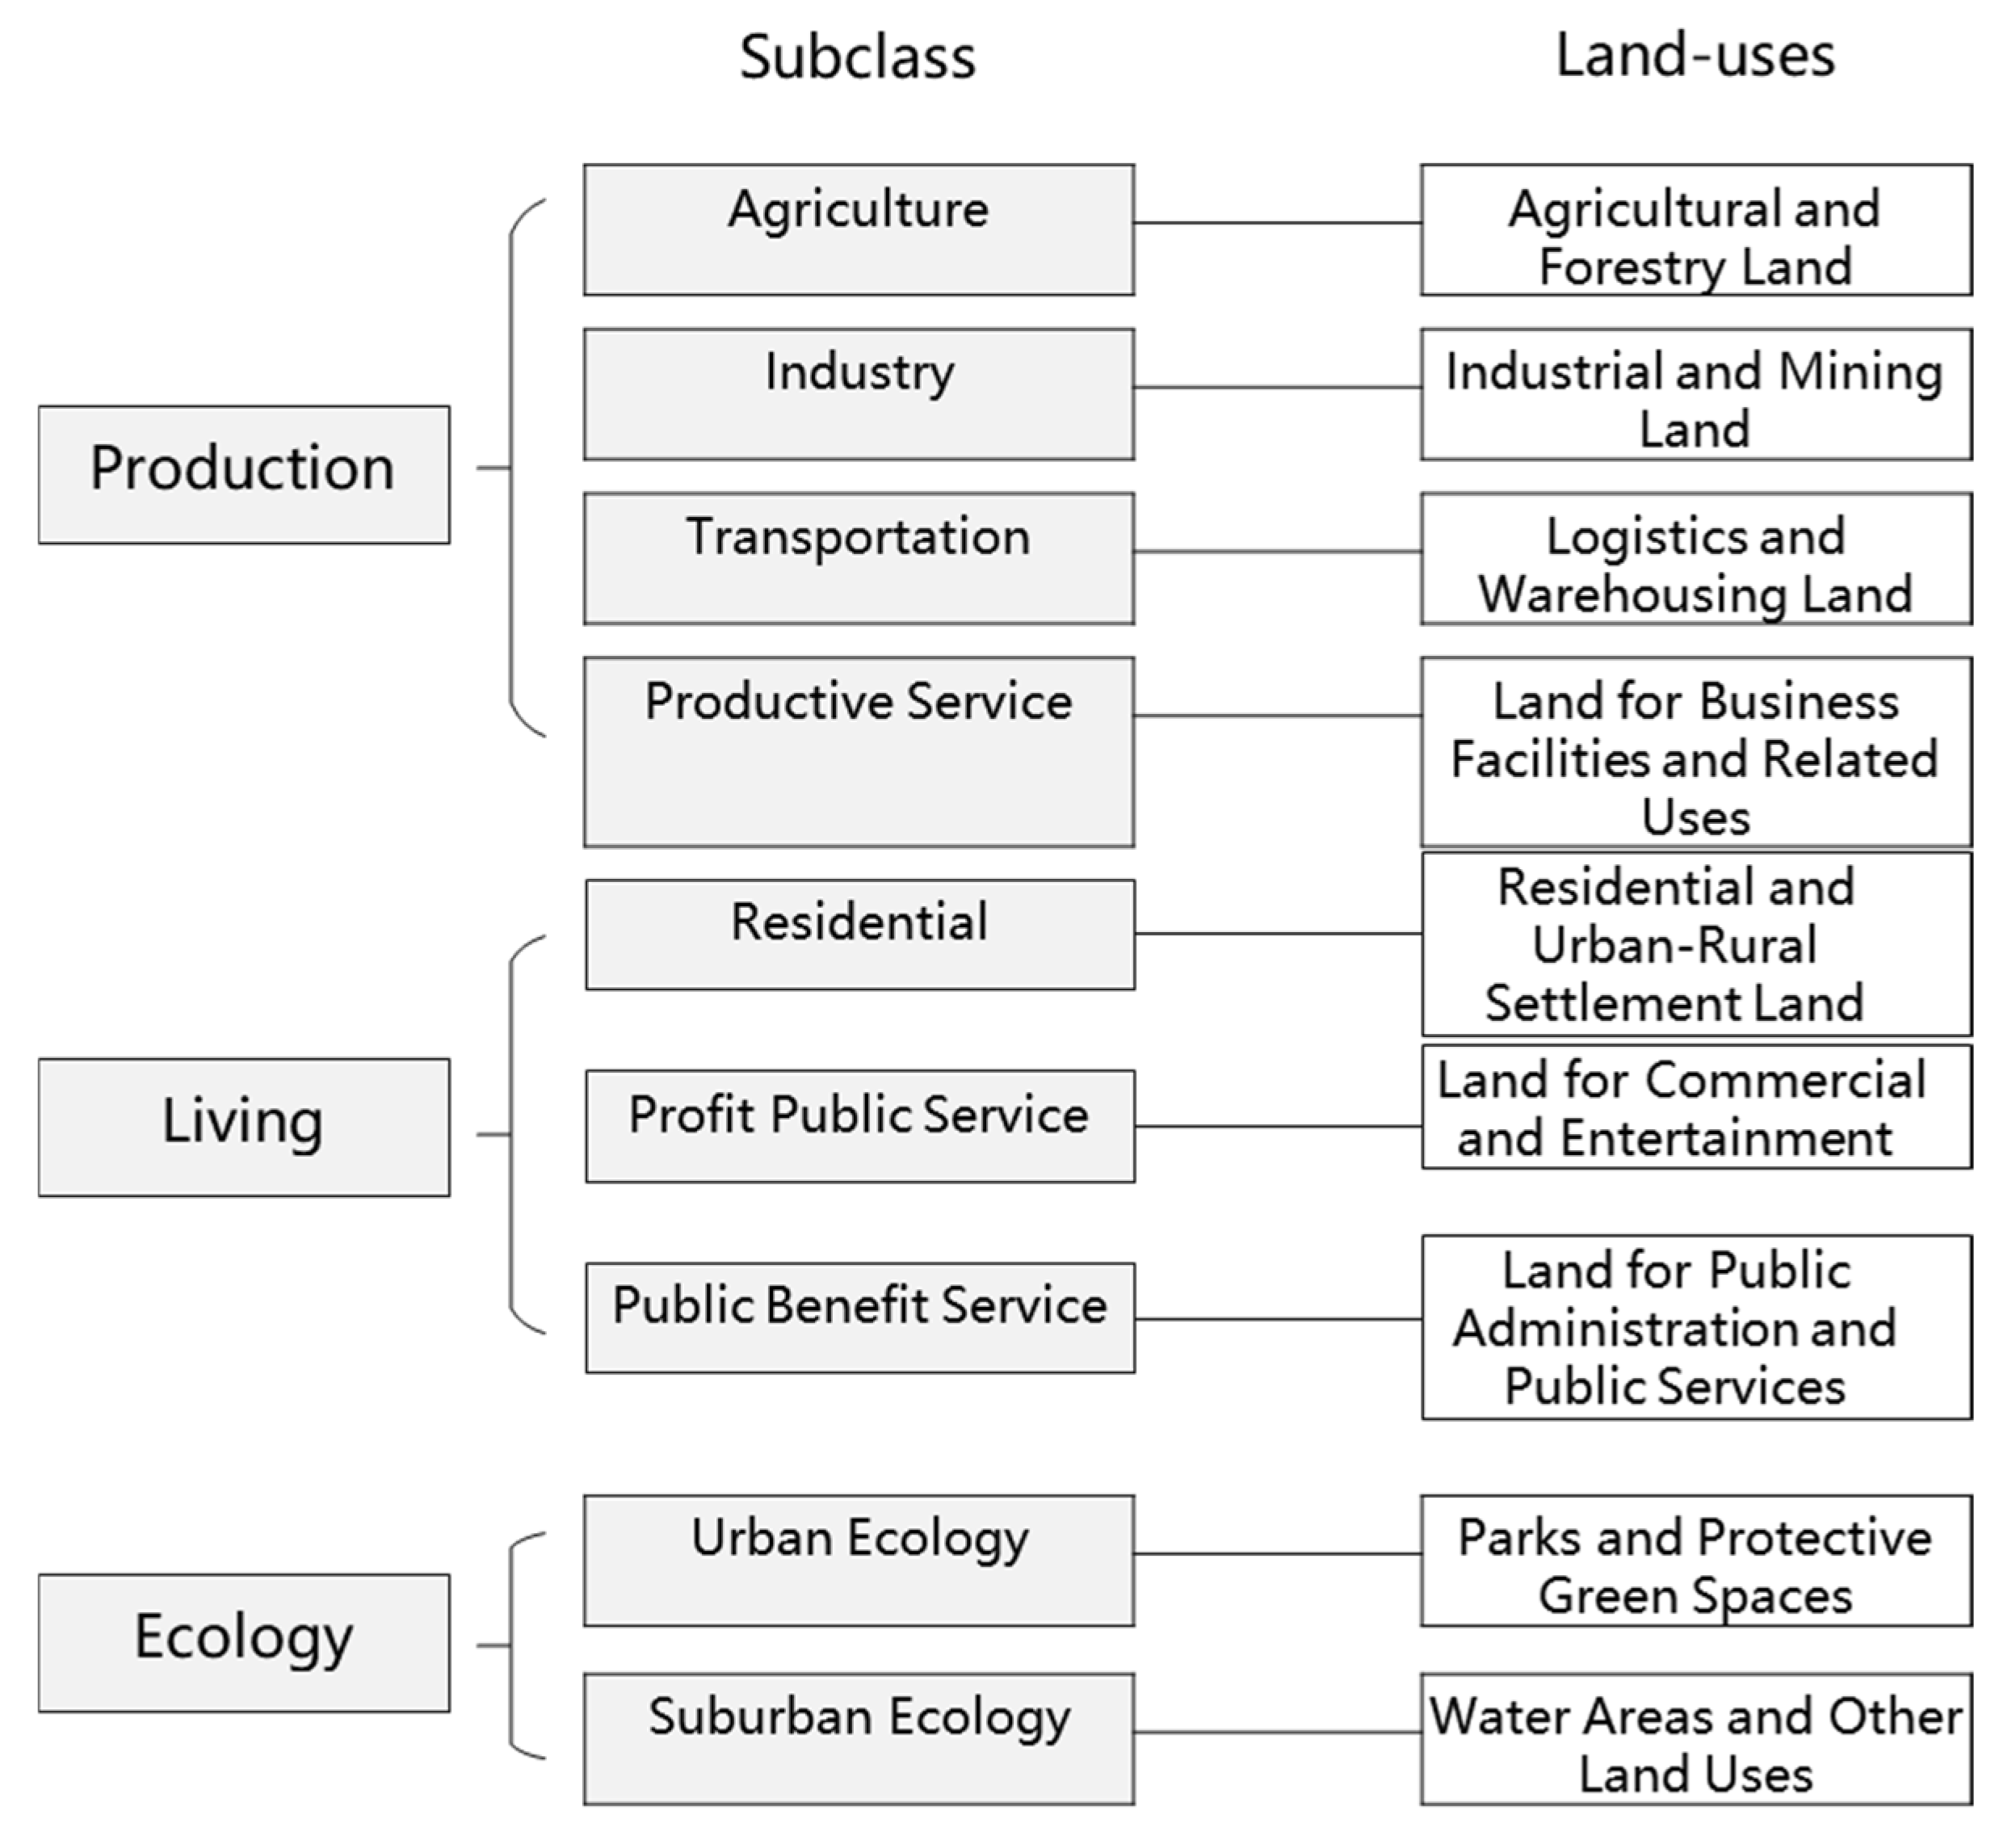
The subdivision of production–living–ecological space serves as an essential foundation for scientifically analyzing the interaction between urban transportation and land use, as well as for promoting the efficient utilization of territorial space. The primary classification includes three main categories: production space, living space, and ecological space, which are further divided into nine subcategories: agricultural space, industrial space, transportation space, productive service space, residential living space, non-public service space, public service space, urban ecological space, and suburban ecological space. Production space refers to land used for activities such as agriculture, forestry, mining, and commerce. Living space encompasses land for residential areas and public service facilities, such as commercial and service-oriented spaces. Ecological space consists of urban green spaces and suburban ecological protection zones, forming a function-oriented spatial classification system, as illustrated in Figure 4.
Different types of spatial functions correspond to differentiated transportation demands. Production space primarily relies on economical transportation modes. Traditional productive service activities favor transportation methods that balance economic efficiency and time, such as highways and railways connecting to air transport. In contrast, high-end productive service activities prioritize more efficient transportation modes, including high-speed rail, subways, and private vehicles. Living space focuses on the interaction between transportation, housing security, and public or community services, emphasizing the integration of slow traffic systems (e.g., walking and cycling) with diversified travel modes. Ecological space, on the other hand, prioritizes environmentally friendly transportation to minimize human activities’ impact on the ecosystem.
This categorization of demands stems from the functional diversity of land use, which requires transportation planning to adapt to the differentiated characteristics of spatial functions across various stages of development. The diversification of urban development patterns inevitably leads to diversity in land-use structures, which, in turn, results in diverse transportation demands driven by land use. These demands are hierarchical, as different stages of land development entail distinct transportation needs. Therefore, the synergy between transportation and land use is a multi-layered concept that must account for diversity and avoid measuring coordination levels using uniform standards or fixed factors.

3.3.2. Selection of Input Factors for Synergy Measurement Between Transportation and Production–Living–Ecological Space

The selection of evaluation factors must take into account the following principles: (1) accuracy: the chosen evaluation factors should not be overly general, ensuring they can precisely describe the target under study; (2) hierarchy: the factors should reflect the outcomes of planning under the dominance of different spatial functions; and (3) accessibility: the selected factors should be relatively easy to obtain and convenient for calculation and processing.
The evaluation factors for the transportation system primarily include static statistical indicators of various types of transportation infrastructure and indicators reflecting travel costs under the operational conditions of different transportation modes, as shown in Table 2.
The evaluation factors for territorial space are categorized into three types based on spatial functions: production, living, and ecological. The land-use characteristics within different spatial types can be further subdivided. The selection of evaluation factors should align with the dominant land-use functions of the regional space. The detailed classification is shown in Table 3.

3.3.3. Improved Accessibility Evaluation Model

(1)
Main Process
The improved accessibility model is developed on the foundation of a single model, incorporating adaptation factors based on the characteristics of the dominant industries, making the accessibility indicators better reflect the transportation characteristics of the region. By integrating the existing basic accessibility model, the improved model combines four fundamental accessibility models into an algorithm library. Evaluation factors are input into the library, where corresponding algorithms are selected to calculate scores. The overall evaluation process is straightforward and intuitive, as illustrated in Figure 5.
(2)
Calculation of Factor Scores
Let the actual value of the m-th evaluation factor associated with planning unit  i  and destination  j  be  v i j m . The basic accessibility model used to calculate the score of the m-th evaluation factor is  f m , which can be one of the following: spatial–temporal impedance, opportunity accumulation, spatial interaction, or individual utility algorithms. After calculation and processing using  f m , the score of the m-th evaluation factor for planning unit  i  is as follows:
A i m = f m v i j m
Accessibility evaluation typically does not consider a single factor but instead integrates multiple factors to reflect the accessibility characteristics of travelers in specific scenarios. Due to the inconsistencies in the units and magnitudes of different factors, even after calculations using the four basic accessibility models, it remains difficult to standardize their units and scales.
To unify the dimensions of different factors for subsequent comprehensive accessibility calculations, the values of  A i m  across multiple planning units can be grouped and assigned corresponding scores. This dimensional standardization is achieved based on the intrinsic characteristics of  A i m . The grouping method for  A i m  is the natural breaks classification method. This data clustering method aims to determine the optimal arrangement for assigning values to different groups by minimizing the variance within groups while maximizing the deviation of group means. The specific grouping method is as follows:
I i m = 100 ε G m G m g + 1 + ε ,   A g m m i n < A i m A g m m a x ,   g = 1 , 2 , , G m
where  g    represents the group number,  G  denotes the total number of groups for the m-th evaluation factor, and  A g m m i n    and  A g m m a x  are the lower and upper bounds of the g-th grouping interval for the m-th evaluation factor, respectively. When  A i m  falls within the interval  A g m m i n , A g m m a x , the m-th evaluation factor of planning unit  i  will be assigned the group score  I i m , which will be used for subsequent accessibility value calculations.
ε  represents the lowest grade score set as needed. Certain evaluation factors may exhibit situations where the accessibility values of most planning units are relatively low. When the proportion of such factors with special distributions becomes significant compared to the total number of factors, it may affect the calculation of accessibility values. For example, in urban areas where most regions lack rail transit stations, the rail transit station density or count in these regions is zero. During grouping, these areas would be assigned lower group scores, potentially leading to underestimated accessibility values. This issue can be mitigated by setting  ε  to avoid such occurrences. In cases where evaluation factors are sufficient or exhibit normal distributions, such a situation is highly unlikely, and  ε  is set to 0. Although altering group scores through  ε  changes the absolute values, it does not affect the relative ranking among planning unit evaluation results.
(3)
Accessibility Value Calculation
For accessibility value calculation, methods such as the entropy method and expert scoring method are first used to determine the weight  β s m  of evaluation factor  m  under the predefined evaluation factor combination  s . After calculating  I i m , a weighted average of  I i m  is performed based on the determined weight  β s m  to obtain the comprehensive accessibility value  C s i . Let the set of evaluation factors selected under the predefined evaluation factor combination  s  be  M s . The formula for calculating the accessibility value  C s i  of planning unit  i  under evaluation factor combination  s  is as follows:
C s i = m M S β s m I i m m M S β s m
In planning applications, it is sometimes necessary to consider accessibility values over a larger area. In such cases, the accessibility values of sub-planning units within a larger unit can be recalculated through a weighted average, using the area of each planning unit as the weight. This process yields the accessibility value for the aggregated unit:
C s n = i Z n C s i D i i Z n D i
where  n  represents the aggregated unit number,  Z n  denotes the set of planning units contained within the aggregated unit  n , and  D i  is the area of the planning unit.
(4)
Accessibility Grade Classification
After obtaining the accessibility value  C s i  for each planning unit  i  or the accessibility value  C s n  for each aggregated unit  n C s i  or  C s n  can be classified into specific grades. This classification allows each planning unit  i  or aggregated unit  n  to possess not only an exact accessibility value but also a corresponding accessibility grade, which facilitates inter-unit comparisons and visualization. According to the corresponding intervals of  C s i  or  C s n  specified in Table 4, the accessibility grade  r s i  for planning unit  i  or  r s n  for aggregated unit  n  can be determined.

3.3.4. Algorithm for Measuring R&D Coordination

(1)
Main Process
The construction of the R&D coordination measurement algorithm must not only address the deficiencies of the node–place model but also meet three key principles: simplicity in computation, intuitive representation, and optimization convenience. Complex data preparation processes should be handled in the background, while appropriate technical methods are used to transform multidimensional factors and indicators into a one-dimensional form.
The territorial spatial planning system is divided into “five levels and three categories,” with different scenarios at each level or within each category. In certain macro- and meso-level scenarios, it is sufficient to understand the overall degree of development between spatial utilization and transportation, as well as whether an imbalance exists. However, as the focus shifts from macro and meso levels toward micro-level scenarios, it becomes necessary to further analyze the precise matching degree between spatial utilization and transportation, as well as to propose countermeasures for addressing imbalances.
Considering the application scenarios and corresponding workloads, coordination is refined into two types: single coordination and composite coordination. The construction process is illustrated in Figure 6.
(2)
Single Coordination Calculation
Single coordination is used to evaluate the development scale and progress of an evaluation unit or a specific region. The larger the scale of transportation facilities and spatial utilization in a region, the higher the single coordination of that region. The comprehensive values of the spatial utilization system factor and the transportation facility system factor for evaluation unit  i  can be represented as  P i  and  Q i , respectively. Single coordination  D i  represents the distance of the scatter point  P i , Q i  of any unit from the benchmark, and the calculation formula is as follows:
D i = P i 2 + Q i 2
(3)
Composite Coordination Calculation
To quantitatively evaluate the precise coordination degree between transportation and spatial utilization, the Data Envelopment Analysis (DEA) method is introduced. In this approach, transportation facilities or spatial utilization are regarded as the input and output of the “transportation–space” system. By measuring the “cost-effectiveness” of transportation facilities or spatial utilization, the degree of alignment and matching efficiency between the two can be determined.
The alignment degree and matching efficiency are represented by the evaluation index “coordination  E i ”, which reflects the amount of land-use activity served by unit transportation facilities or the amount of transportation facilities occupied by unit land-use activity. The calculation formula is as follows:
E i = V i T Y i U i T X i = k = 1 K v i k y i k m = 1 M u i m x i m
In the formula, the input factor vector and output factor vector of evaluation unit  n  are denoted as  X i = x i 1 , x i 2 , , x i M    and  Y i = y i 1 , y i 2 , , y i K , respectively, with their corresponding importance vectors represented as  U i = u i 1 , u i 2 , , u i M  and  V i = v i 1 , v i 2 , , v i K ; the variable  y i k  represents the value of the k-th output factor for evaluation unit  i  and  K  denotes the total number of output factors. The variables  u i m  and  v i k  indicate the importance of  x i m  and  y i k , respectively.
In the practical measurement and evaluation of transportation and land use, traffic zones are typically used as carriers to represent production–living–ecological space. However, a single traffic zone may contain multiple types of industries or spatial functions, making it insufficiently accurate to represent the entire zone with only one type of spatial function. When evaluating the same traffic zone, multiple combinations of input factors can be used to emphasize different aspects, thereby reflecting the coordination between transportation and production, living, and ecological spaces.

3.3.5. Constructing a Synergy Measurement Framework for Transportation and Production–Living–Ecological Space

At different stages of development, land development has varying transportation needs, making it unsuitable to evaluate the coordination level between transportation and land use using a single standard or fixed factors. To address this, based on the input factors for measuring the coordination between transportation and production–living–ecological space, this study introduces an improved accessibility evaluation model and a coordination measurement algorithm grounded in the supply–demand ratio. Together, these components establish a comprehensive evaluation mechanism for transportation and land-use coordination, which encompasses development potential assessment, service efficiency diagnosis, and resource allocation optimization, as illustrated in Figure 7.
In terms of development potential assessment, accessibility evaluation is used to calculate the accessibility level of different spaces, identify low-accessibility areas, and exclude them from development boundaries, while high-accessibility areas are designated as key zones for urban development potential. Furthermore, coordination evaluation is applied to calculate the comprehensive coordination value between transportation facilities and land use, which is then used to classify coordination-level zones, providing support for the division of urban spatial structures.
For service efficiency diagnosis, the coordination evaluation analyzes the degree of matching between transportation facilities and land-use demands, identifying areas where production–living–ecological space and transportation facilities are imbalanced. On this basis, recommendations are made for adjustments to spatial development or facility allocation, enabling precise alignment between the development needs of production and living spaces and the carrying capacity of transportation facilities. This approach minimizes premature development and resource waste, enhances the utilization efficiency of existing resources, and ultimately achieves resource allocation optimization.
The supply–demand ratio, accessibility, and coordination are progressively linked in this framework, with their specific application stages and scenarios illustrated in Figure 8.

4. Results

4.1. Application of the Improved Accessibility Evaluation Model

4.1.1. Assisting in the Delimitation of Urban Development Boundaries

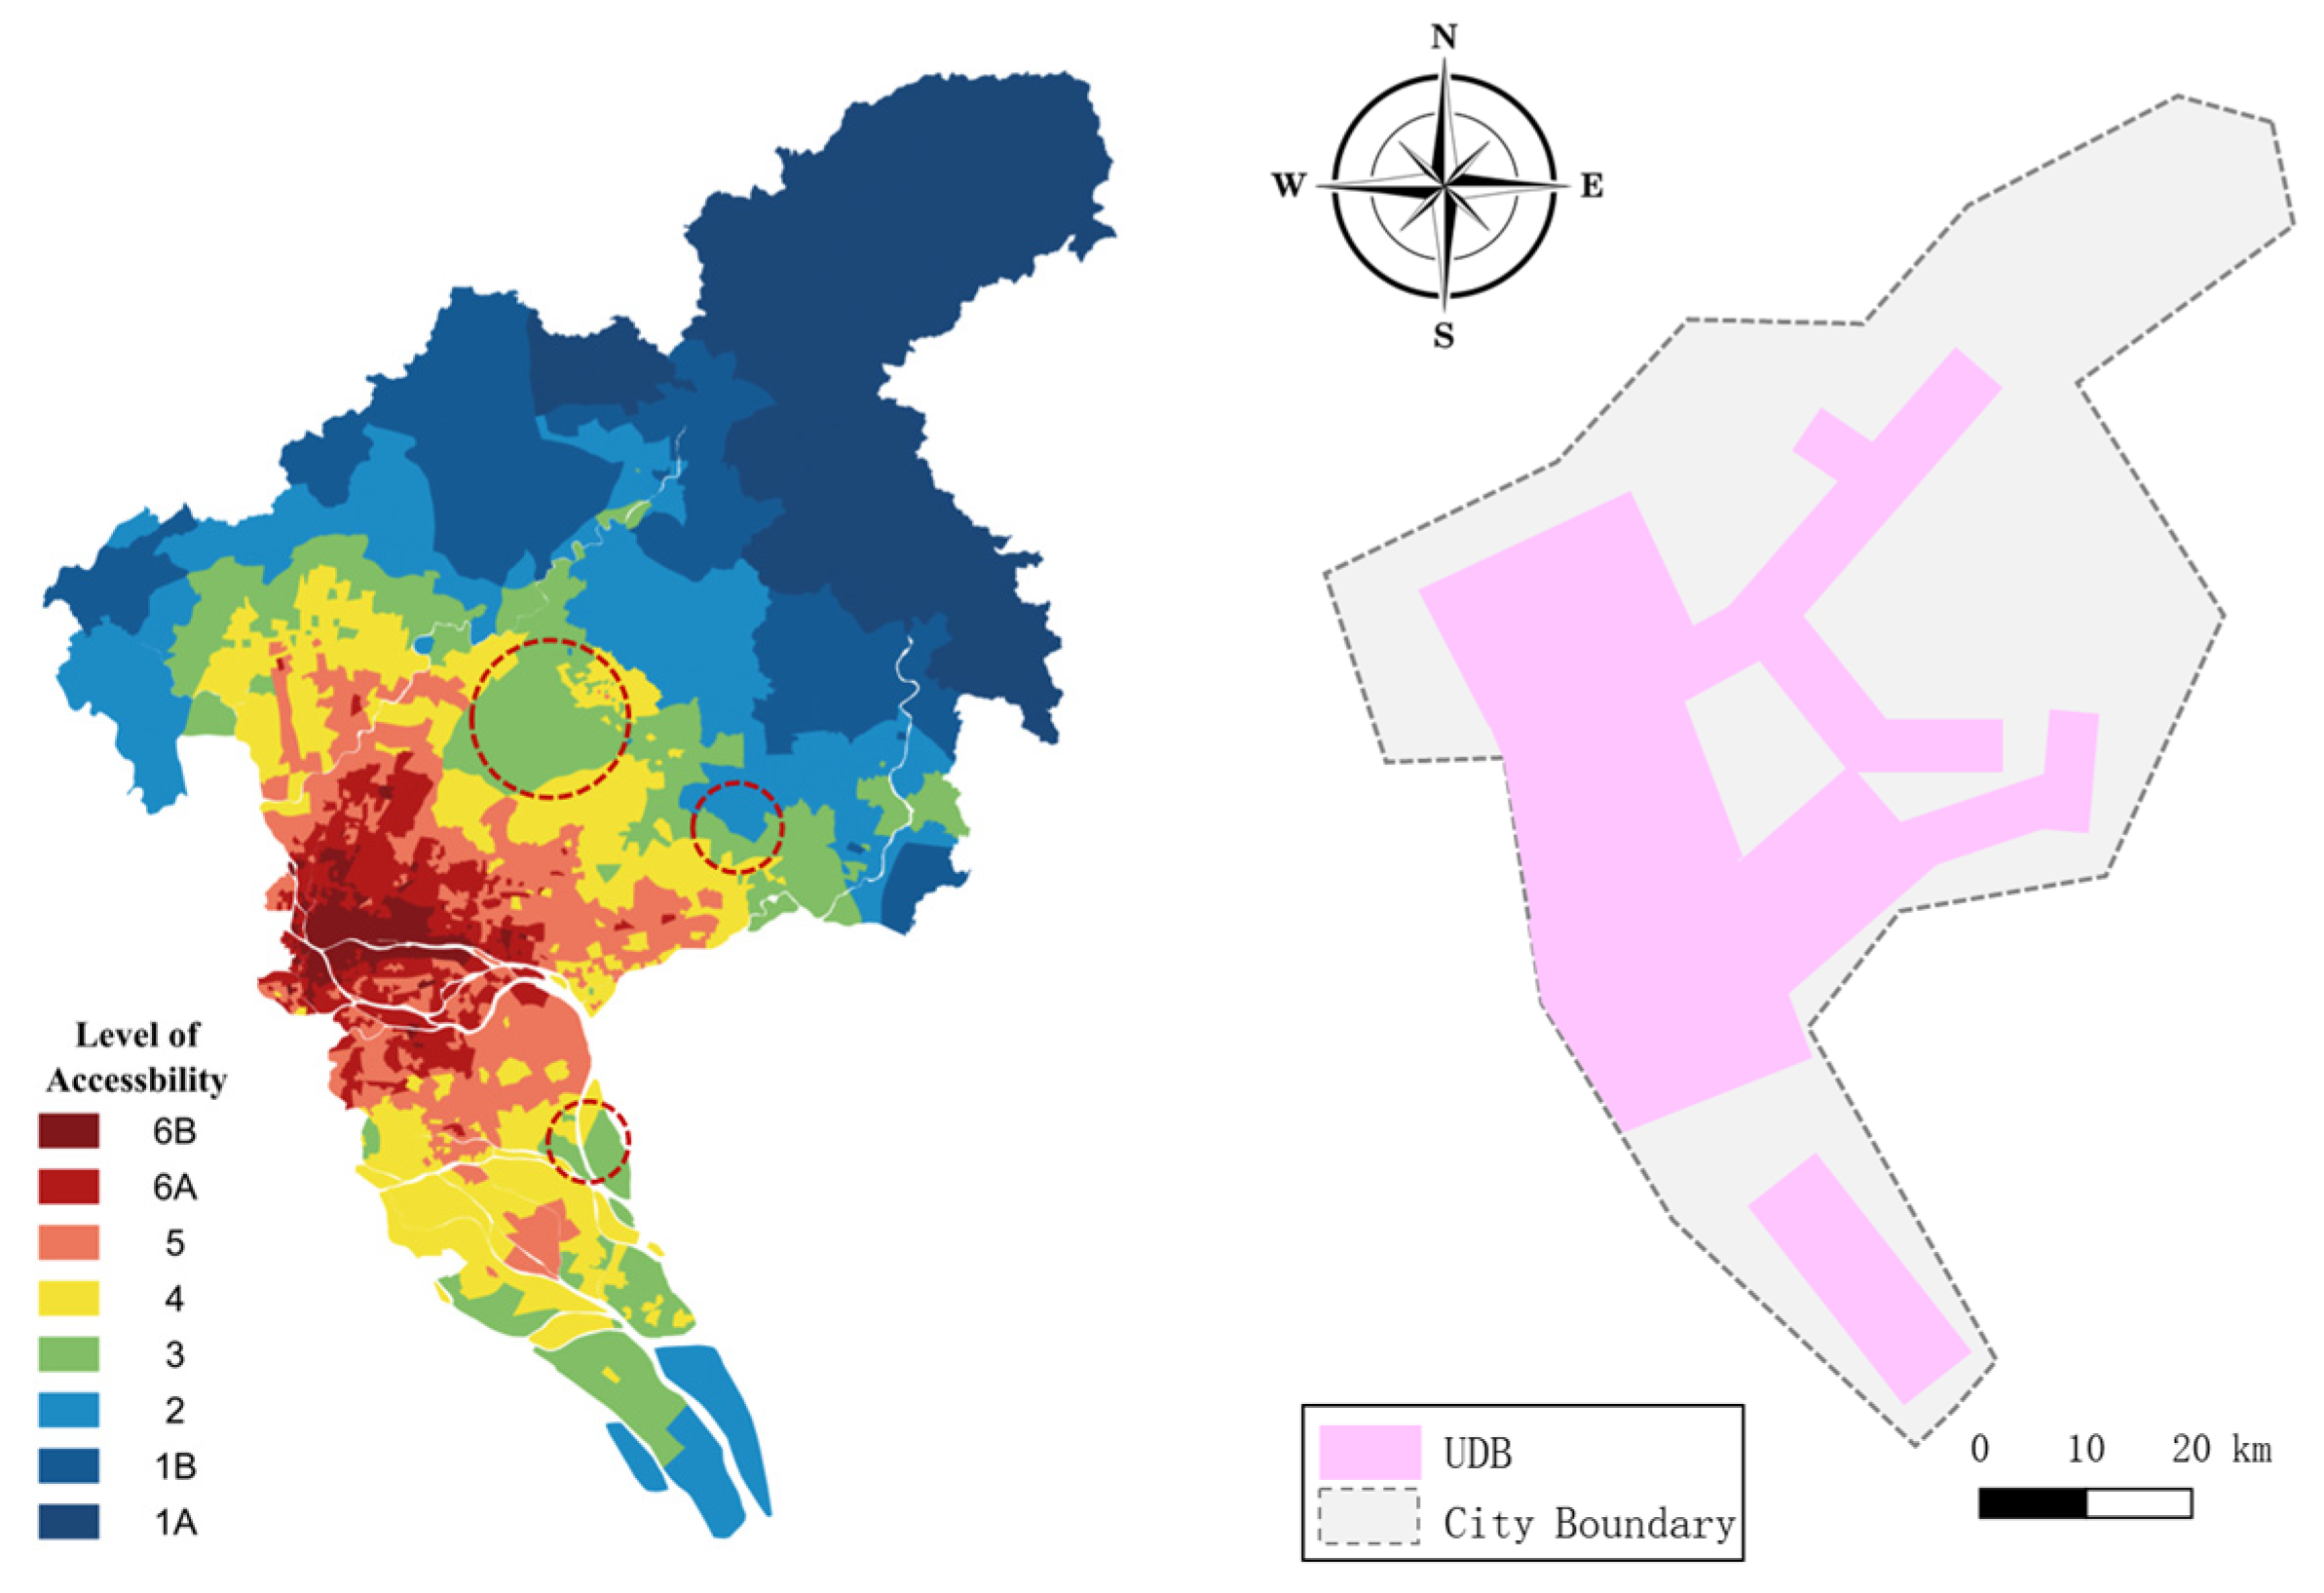
Transportation infrastructure serves as the foundation for supporting development and generating travel activities. Based on existing and planned major transportation infrastructure, the accessibility of various spaces is comprehensively evaluated using factors that reflect the carrying capacity and travel advantages of transportation facilities. These factors include the travel time to urban- or regional-level hubs such as airports and high-speed rail stations, the density of high-grade road networks, the density of pedestrian networks, and travel costs. Combined with local natural geographic characteristics and the results of the “dual evaluation” (evaluating resource and environmental carrying capacity as well as territorial spatial development suitability), low-accessibility areas are excluded from the urban development boundary.
As shown in Figure 9, the areas marked with red circles have relatively low comprehensive accessibility levels, indicating that these regions lack sufficient transportation infrastructure to support urban functions. The existing transportation system cannot sustain extensive land development in these areas. If large-scale urban development were to be carried out in such regions, significant resource investments would be required in advance. Therefore, these areas should be cautiously included within the development boundary.

4.1.2. Guiding the Optimization of Urban Spatial Structure

Based on well-established transportation infrastructure and sufficient surrounding land development conditions, such as airports, ports, and high-speed rail stations, transportation accessibility across the city is quantified using factors such as the number of jobs or residents reachable by transportation and the weighted average travel time. This serves as an important reference for optimizing the spatial layout of major urban cores, poles, or clusters.
As shown in Figure 10, the central urban area of Guangzhou has the highest accessibility level, with most areas achieving levels between 1 and 3, solidifying its role as the city’s core. Following this are the eastern region and Nansha New Area, where accessibility levels are concentrated between levels 4 and 5, with some areas reaching level 3. This highlights that the accessibility of the eastern region and Nansha New Area has become prominent within the city.
By further incorporating the spatial distribution of the city’s population, industries, and other factors, it is recommended to adjust the urban spatial structure from the existing “one core and six sub-centers” to a “three-core and four-pole” layout. Under this adjustment, the eastern center and Nansha New Area would be upgraded from their previous status as sub-centers to form part of the new three-core structure.

4.2. Practice of the Coordination Measurement Algorithm

4.2.1. Citywide Evaluation

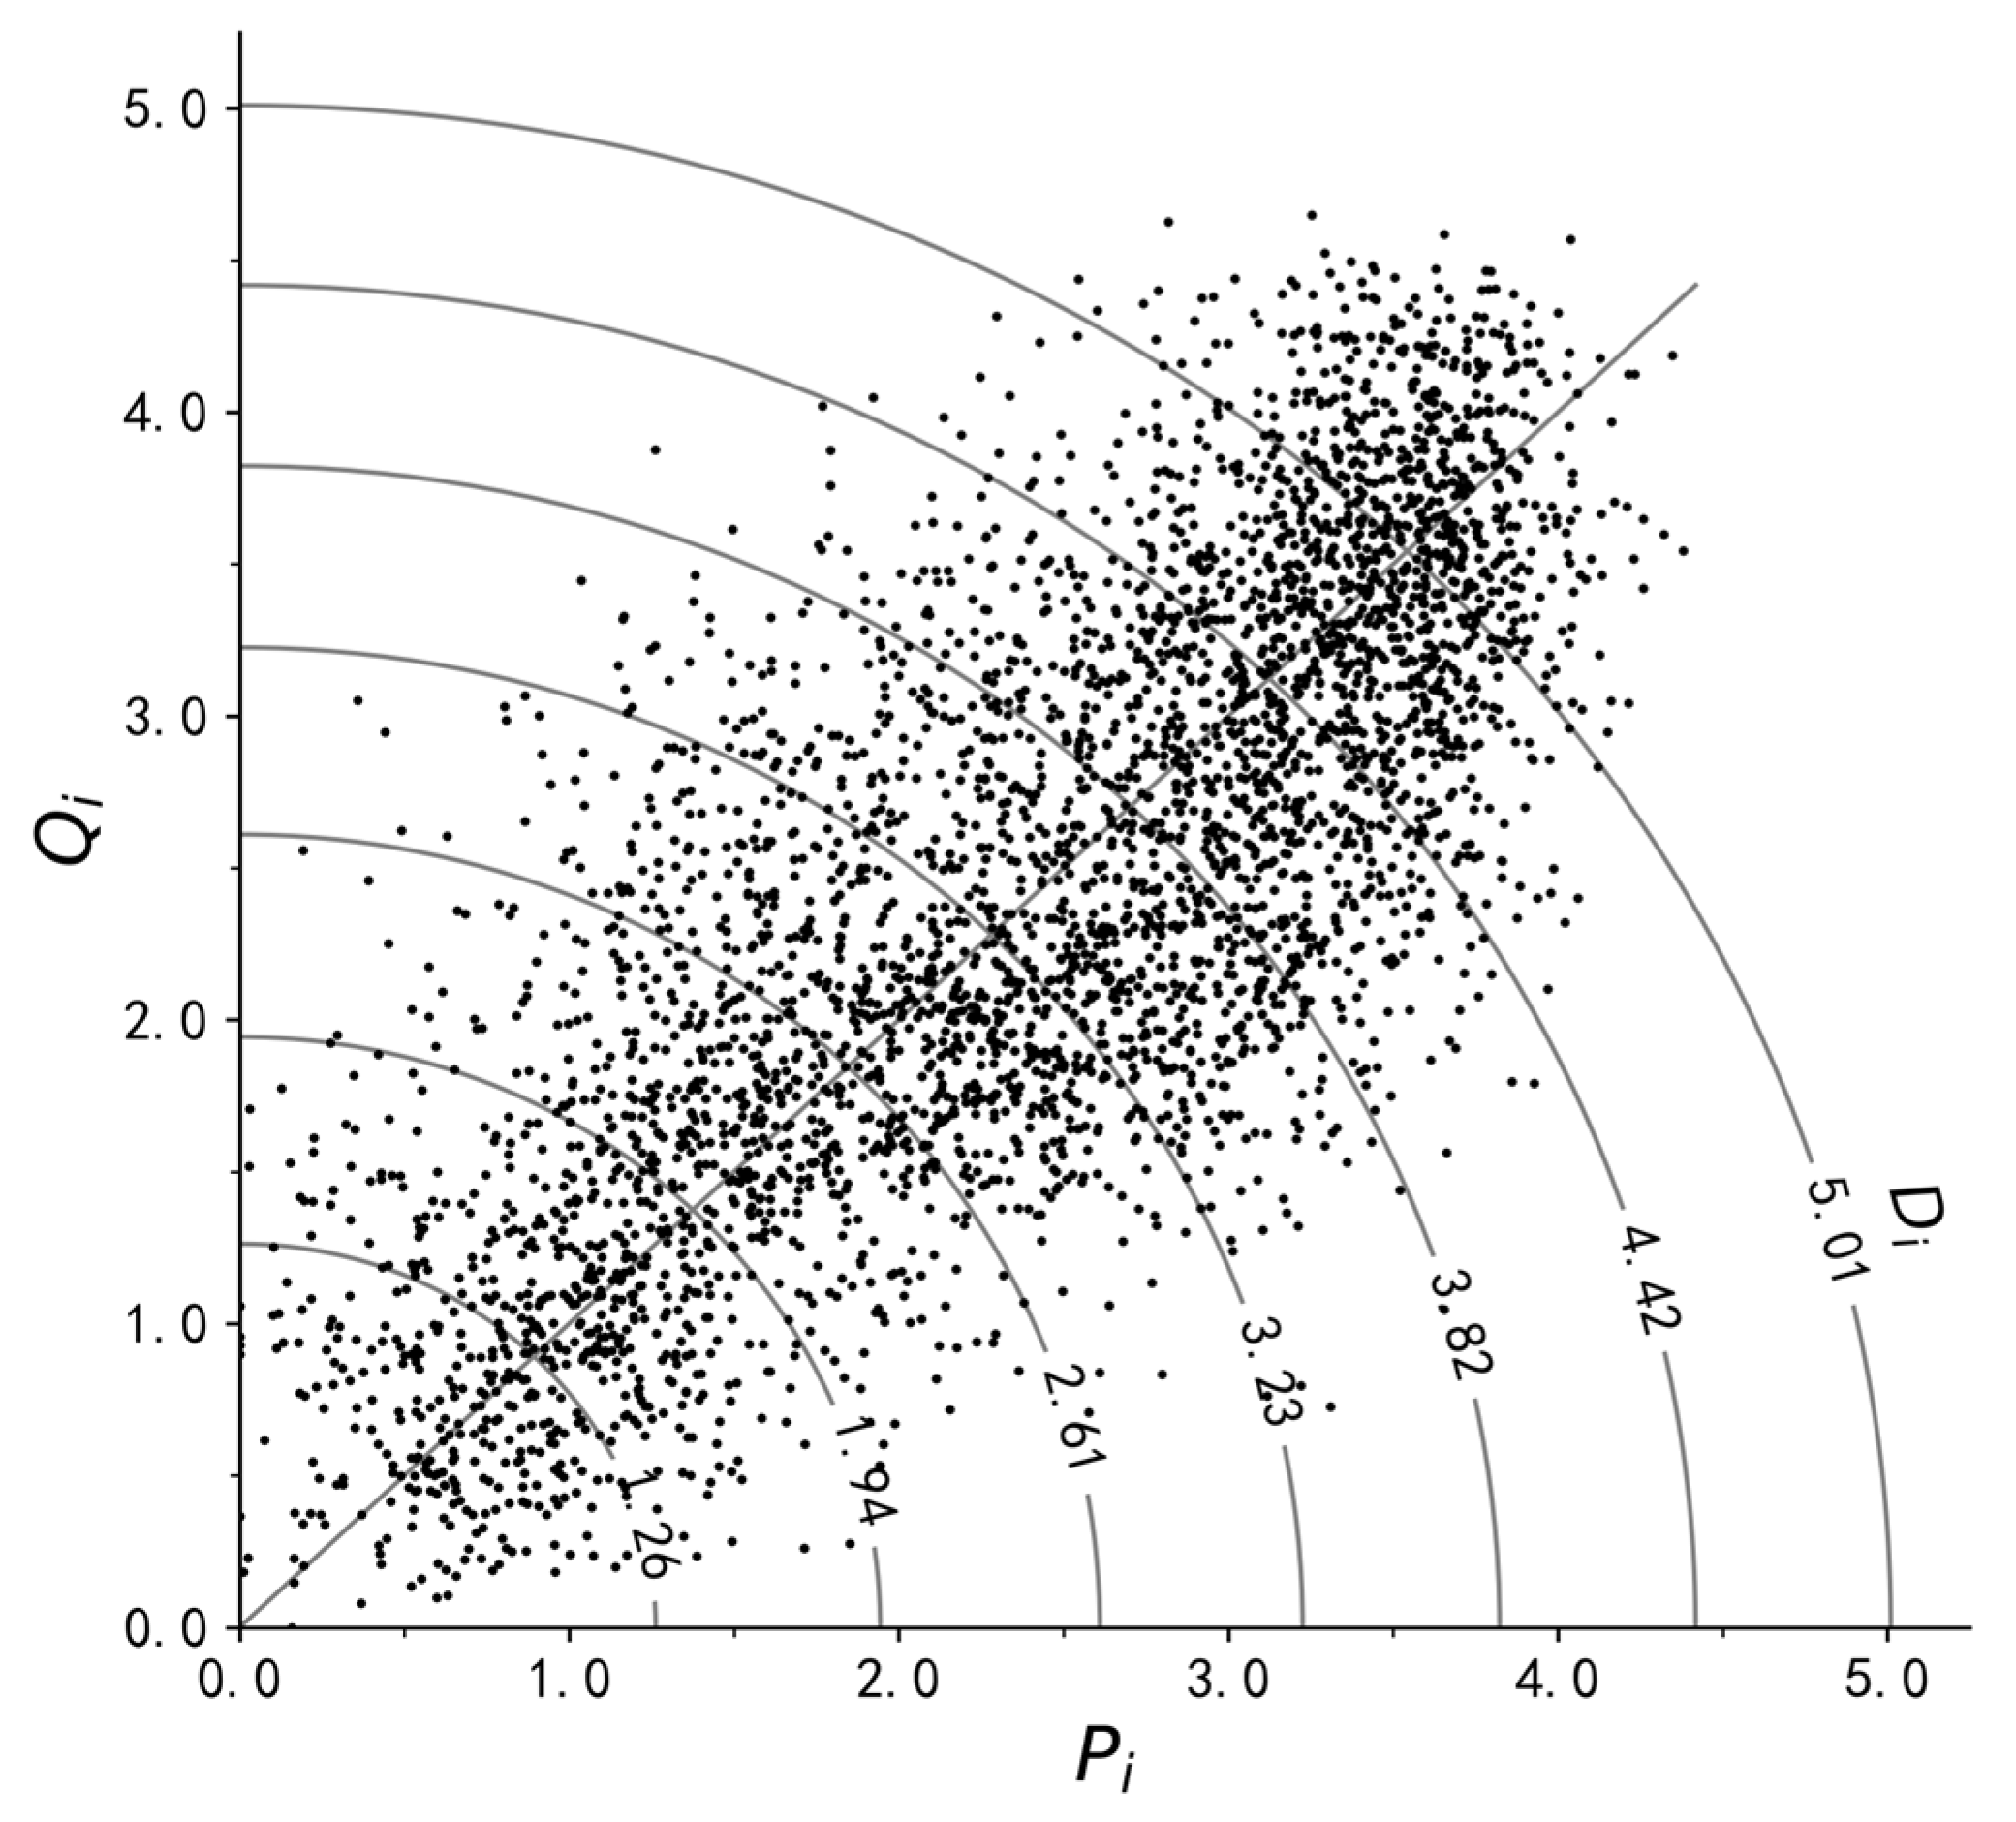
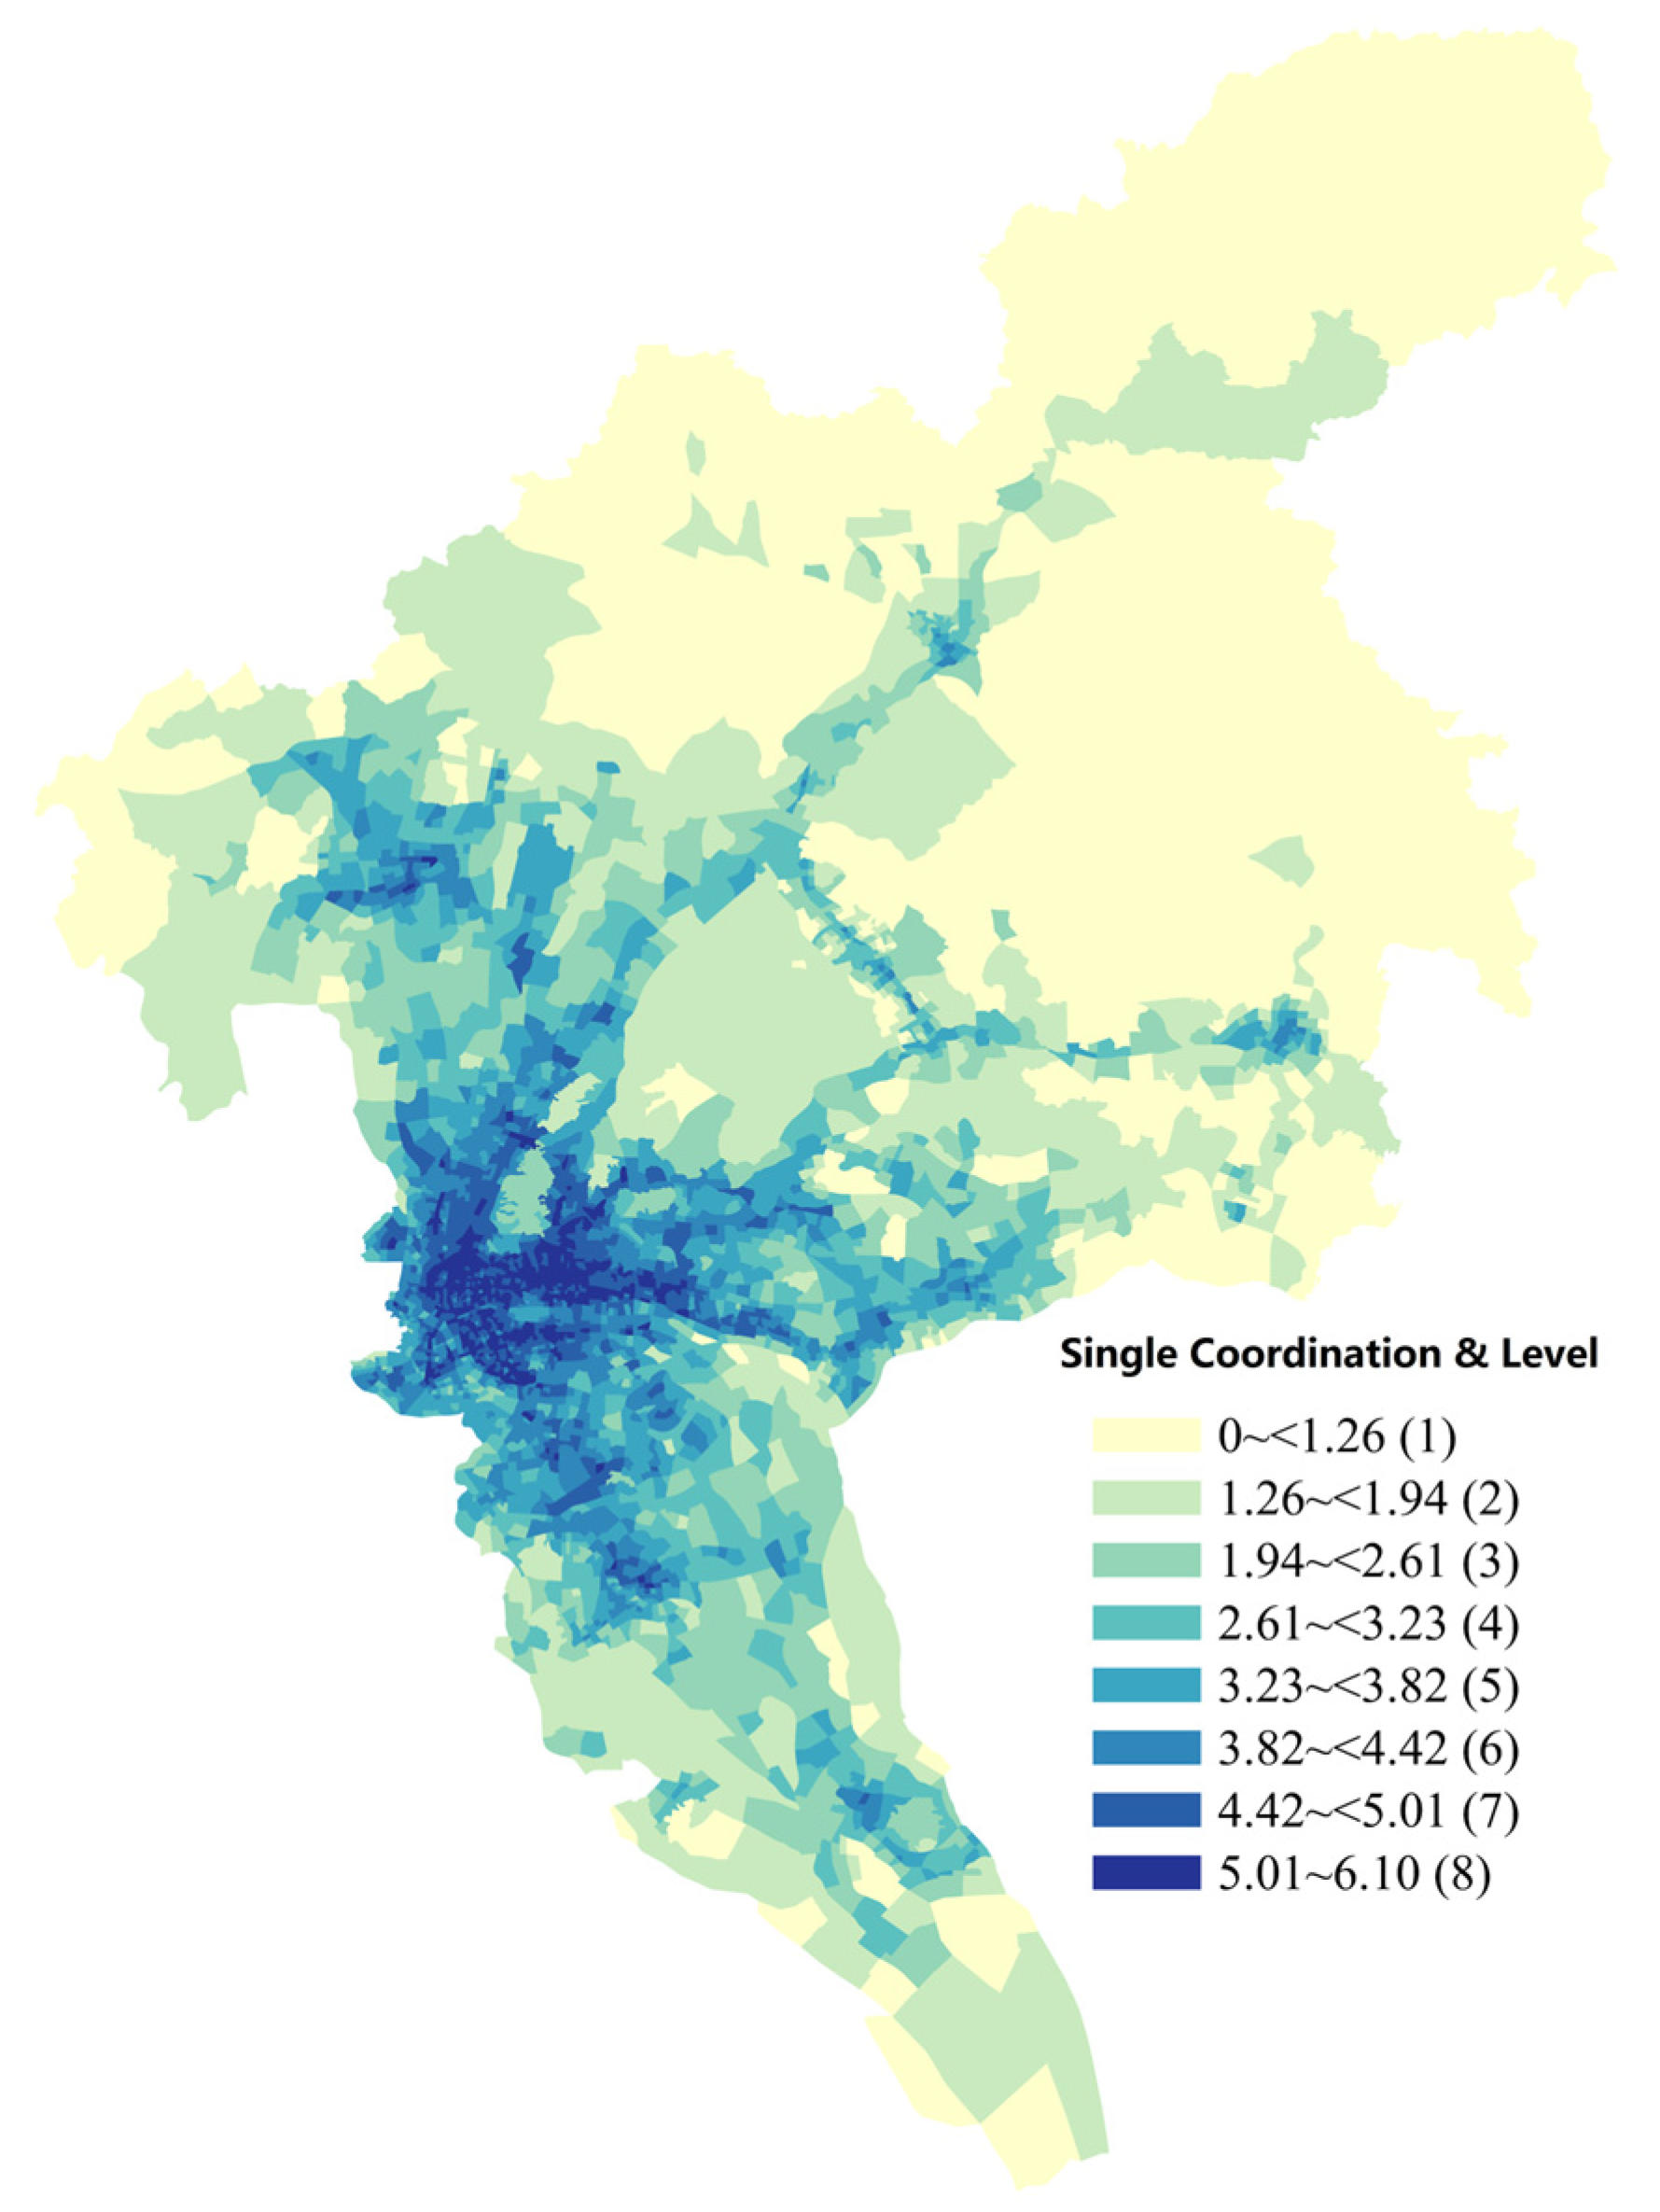
The evaluation covers the entire current administrative area of Guangzhou, with a total area of 7434.4 km2 and 3989 traffic zones serving as the evaluation units. By applying selected factors for each region, the first-level coordination is calculated, and the results are shown in Figure 11 and Figure 12.
Assuming the desired number of classification levels is eight, the natural breaks classification method is used to divide the zones into eight categories, with classification thresholds set at 1.26, 1.94, 2.61, 3.23, 3.82, 4.42, and 5.01. In Figure 11, the vertical and horizontal axes of the scatter plot represent the combined values of transportation infrastructure and land-use factors for each zone, respectively. By comparing the relative distances from each zone’s coordinate values to the origin, the first-level coordination between zones is assessed.
The slope of the coordinate values in Figure 11 provides a rough and approximate indication of the relative scale of transportation infrastructure and land development; however, it is not precise enough to offer optimization measures or reference recommendations. Additionally, it cannot address subtle mismatches between transportation infrastructure and land use. Zones farther from the origin have a higher first-level coordination. As shown in Figure 11, zones with a higher first-level coordination are primarily concentrated in the urban center, as depicted in Figure 12. Moving outward toward the suburban areas, the first-level coordination of the zones gradually decreases, and the combined scale of transportation infrastructure and land development also declines accordingly.
Based on the first-level coordination classification, the eight levels divide the city into multiple zones, which are closely correlated with the distribution of transportation infrastructure and the intensity of land development. These zones serve as a foundation for determining the urban spatial structure. Threshold values can be set as boundaries to separate high-development areas from low-development areas, and low-development areas can be excluded from the urban development boundary. For example, regions classified as levels 1 and 2 (i.e., with first-level coordination values below 1.94) can be removed from the urban development boundary. The remaining boundary will primarily focus on areas within the urban fringe and certain distant suburban areas along transit lines.

4.2.2. Optimization of Urban Renewal Areas

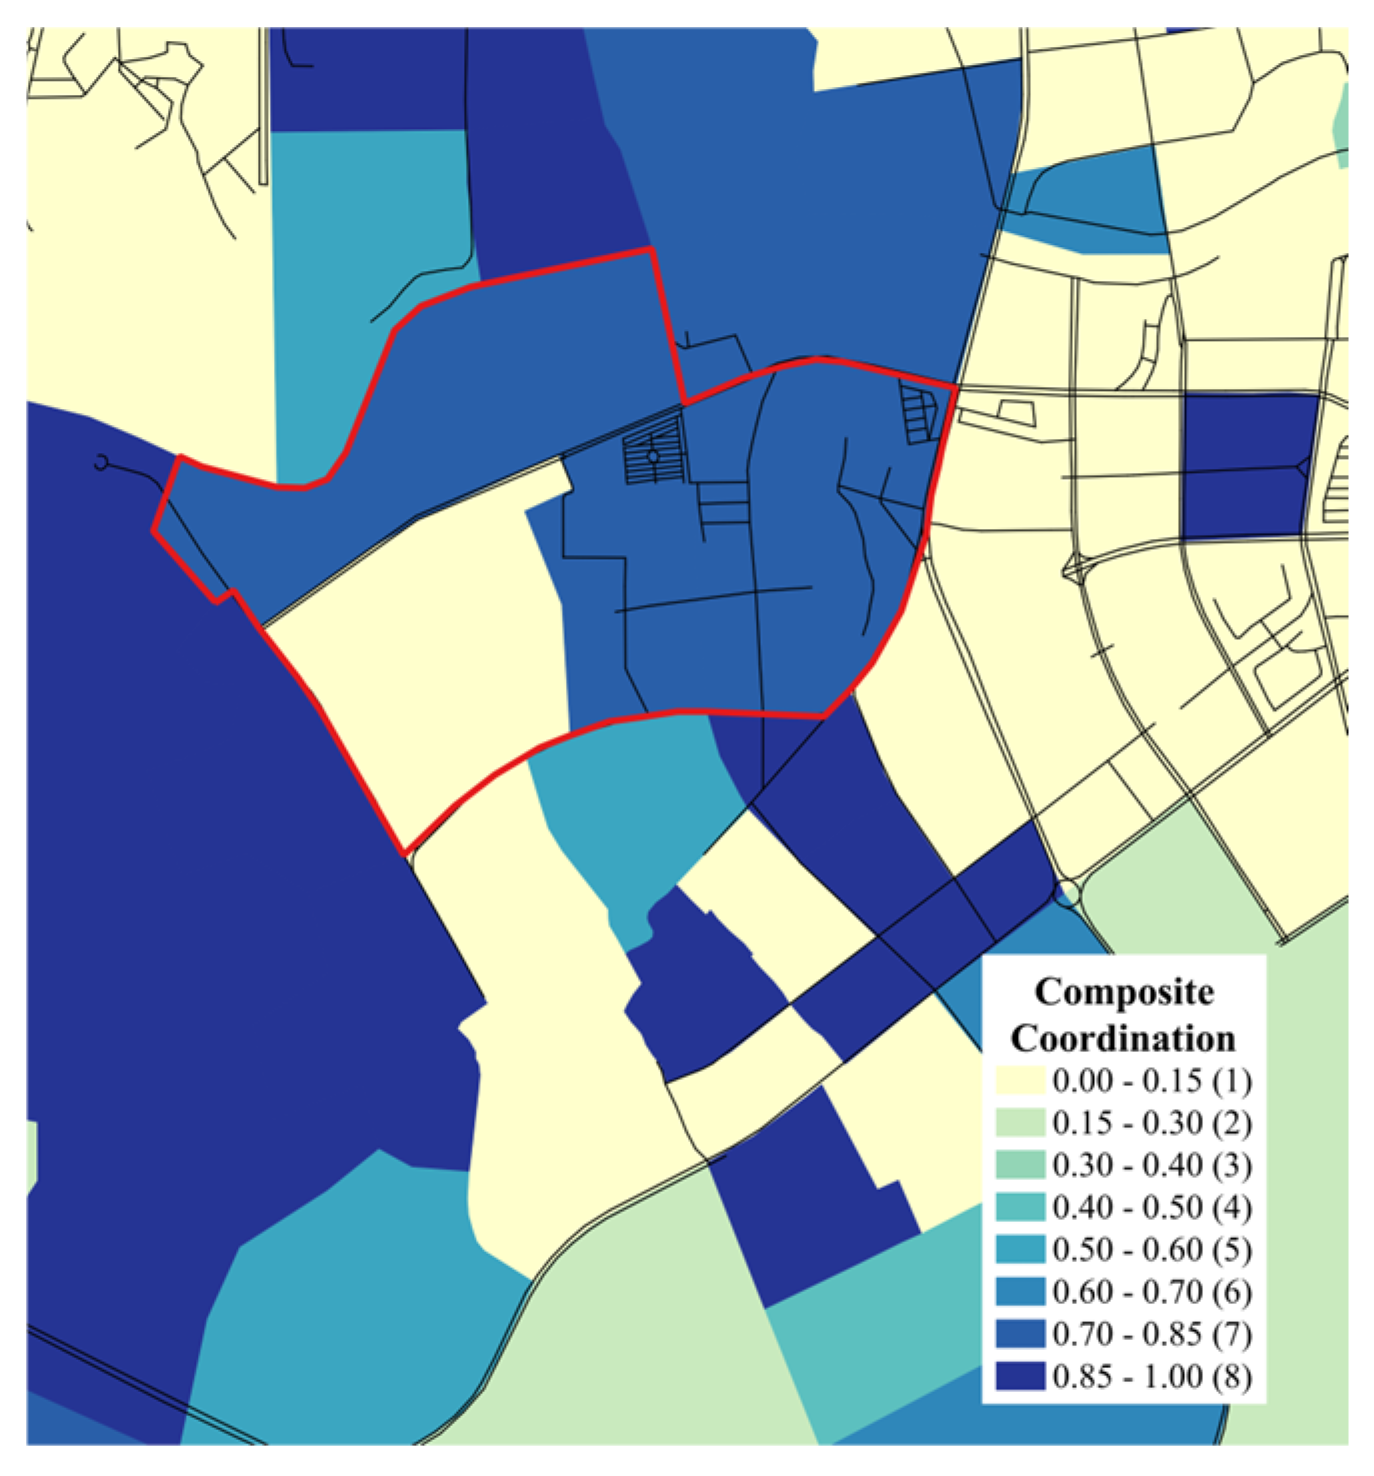
In urban villages where living spaces and transportation are uncoordinated, the renewal of Guangzhou’s FY village serves as an example. By utilizing data on the renewal unit’s planned boundaries, land-use types, and planned transportation infrastructure, the single and composite coordination levels of the renewal unit and its surrounding areas are calculated. The optimization of the renewal plan is then carried out based on the evaluation results to enhance spatial utilization efficiency.
As shown in Figure 13 and Figure 14, except for the southwestern part of the FY village renewal unit, the composite coordination levels in other areas are relatively high. This indicates that the transportation infrastructure in these areas can adequately accommodate the travel demands generated by land use. The southwestern part of the renewal unit mainly consists of commercial and business land, as well as land for primary and secondary schools, which generate a higher travel demand per unit of land. However, the surrounding transportation infrastructure only includes a single planned arterial road, which is highly likely to lead to congestion.
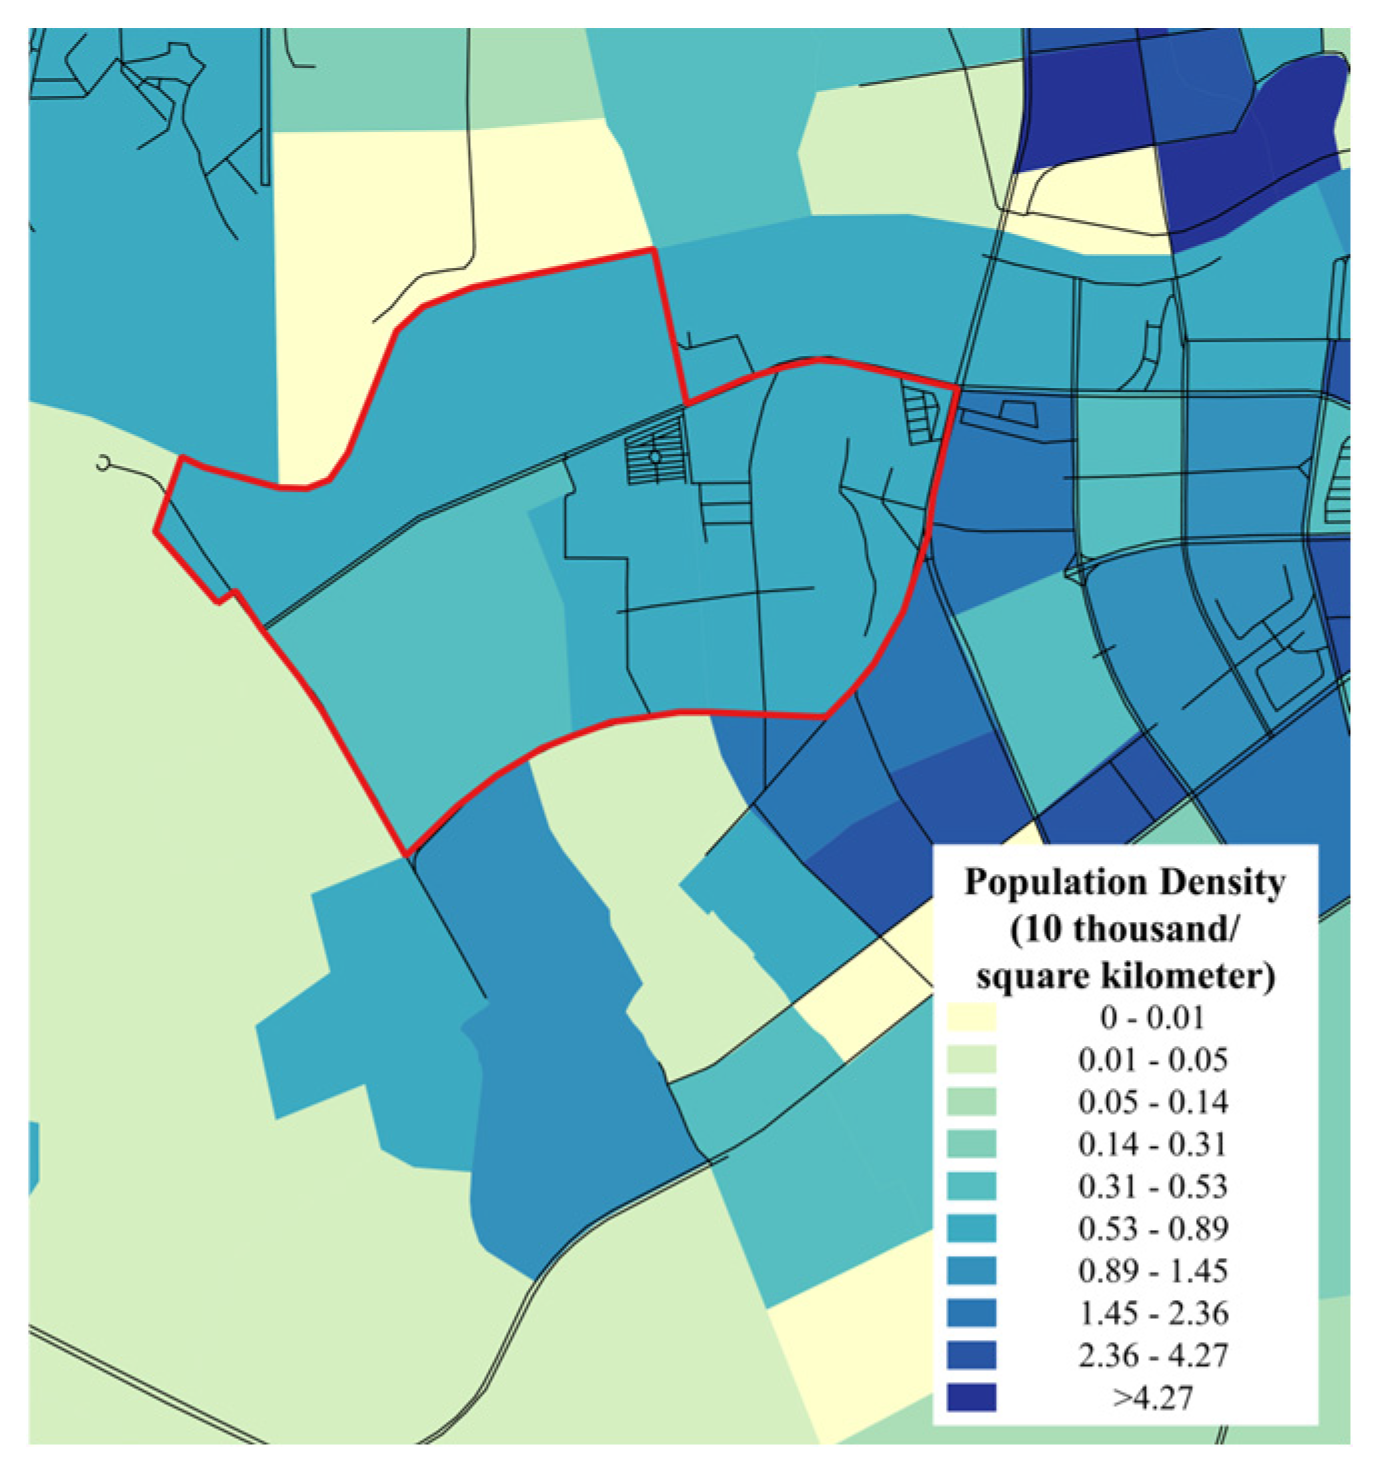
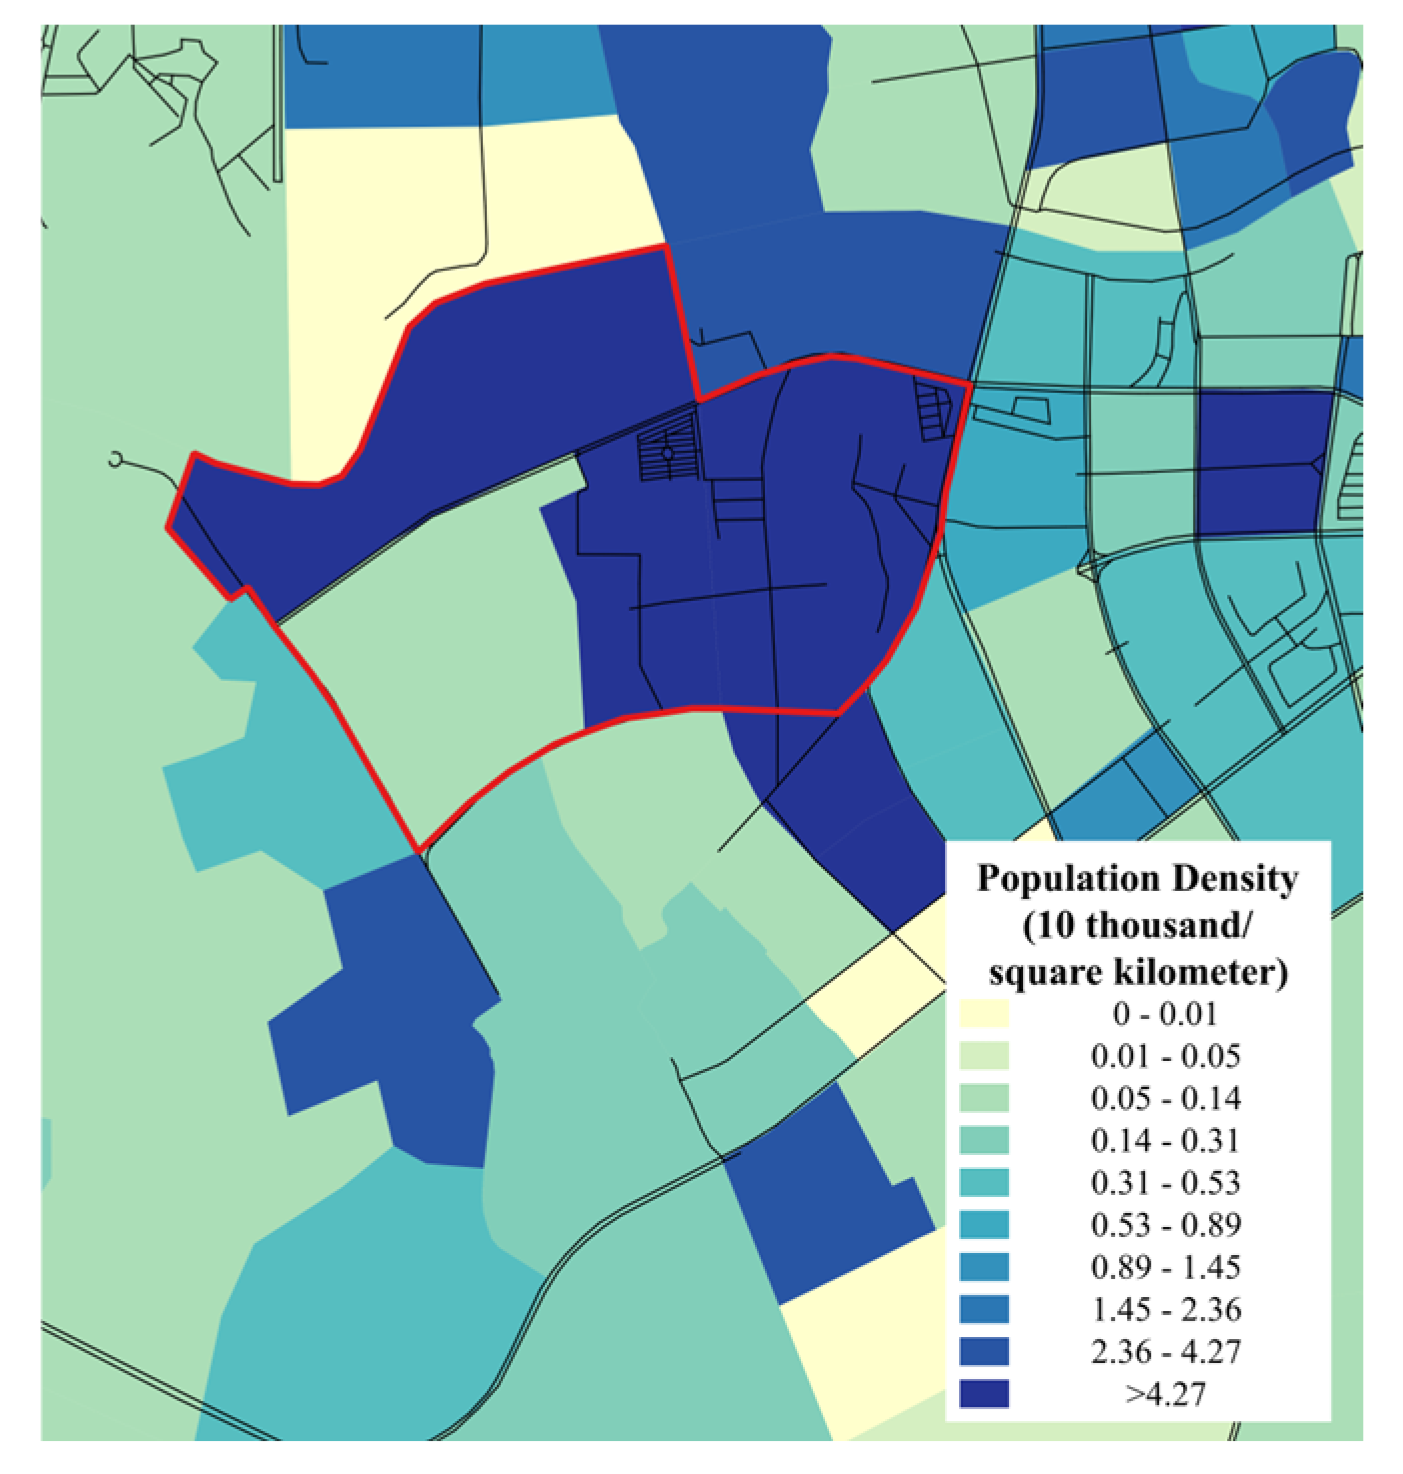
As shown in Figure 15 and Figure 16, using the planned residential population density as an example, the composite coordination evaluation suggests that areas outside the southwestern part of the renewal unit have a limited comprehensive scale. To significantly increase the development demand in these areas, transportation infrastructure factors must be optimized to continuously improve composite coordination.
For the southwestern part, however, due to insufficient transportation infrastructure and low composite coordination levels, the population density should be reduced to decrease the scale or intensity of land development. This adjustment ensures compatibility with the limited transportation infrastructure.
After optimizing accessibility, the current population and employment densities are recommended to be adjusted to 27,400 people/km2 and 86,500 jobs/km2, respectively, while the floor area ratio (FAR), representing development intensity, needs to be increased to 1.04. To support the corresponding travel activities, transportation infrastructure such as urban rail transit lines, conventional bus stops, and high-grade roads needs to be raised to 0.47 km/km2, 11.65 stops/km2, and 7.07 km/km2, respectively. Accessibility optimization only considers the proportional scale of land use and transportation infrastructure. In contrast, coordination optimization further balances land use and transportation infrastructure to provide optimization strategies.
After coordination optimization, the recommended adjustments for population density, employment density, and FAR are 21,000 people/km2, 27,700 jobs/km2, and 0.27, respectively. For transportation infrastructure, urban rail transit lines, conventional bus stops, and high-grade roads are recommended to be adjusted to 0.00 km/km2, 2.03 stops/km2, and 6.85 km/km2, respectively. Compared to the results of accessibility optimization, these adjustments are more suitable for the renewal needs of residential-dominated areas, requiring fewer additional resources, avoiding over-investment in infrastructure, and preventing overly high population or employment targets. The specific results are shown in Table 5.

5. Discussion

The key findings demonstrate that the improved accessibility method accurately identifies the transportation locational value of regional functional cores, while the composite coordination index deconstructs the spatiotemporal matching characteristics of “transportation infrastructure–spatial functions.” Empirical research in Guangzhou confirms these methods are practical and effective for coordinated measurement and bidirectional feedback, with transportation feedback to spatial planning increasing land-use intensity and value by several times in urban renewal areas.
This study addresses challenges of traditional supply–demand ratio analysis paradigms by overcoming limitations of the node–place model and resolving shortcomings of existing accessibility evaluations. The results are presented in a concise and comparable format through methodological innovations. The differences stem from subdividing territorial space into three major categories and nine functional subcategories with refined transportation/spatial evaluation factors. The innovative introduction of DEA develops bidirectional feedback coordination measurement to overcome node–place model limitations, while integrating existing accessibility models converts initial calculated values into dimensionless numbers using natural breaks classification.
The aforementioned measurement methods have already been applied in scenarios such as the delimitation of urban development boundaries, guidance for urban spatial structure optimization, citywide evaluation, and optimization of urban renewal areas in Guangzhou. Of course, there are detailed discussions regarding the application of the two measurement methods in different scenarios. When the selected evaluation factors remain unchanged, measurements across different cities, regions, and time points can be compared. These comparative results can help assess the measurement levels of different cities and regions as well as the changes in measurements across different time nodes. However, measurements calculated using different evaluation factors are not comparable.

6. Conclusions

The key findings of this study confirm the practicality and effectiveness of the proposed methods for coordinated measurement and bidirectional feedback between transportation and production–living–ecological space. The improved accessibility method and the composite coordination index provide new tools for identifying transportation locational value and evaluating spatiotemporal matching characteristics. Empirical research in Guangzhou demonstrates the methods’ success in increasing land-use intensity and value in urban renewal areas.
Methodologically, this study contributes an improved accessibility evaluation model through weighted calculations for concise and comparable outputs and develops a coordination measurement algorithm integrating node–place and DEA for bidirectional feedback. Empirically, it provides cross-scale technical tools for territorial spatial planning reform and clarifies stages, dimensions, and scenarios for applying measurement methods to improve quantitative analysis mechanisms.
In the future, there are more key areas that require attention for the coordinated measurement of transportation and production–living–ecological space: mechanisms for value capture in the coordinated development of rail transit and surrounding spaces, and the construction of AI-powered dynamic coordination simulation systems, among others.

Author Contributions

Conceptualization, X.M. and M.L.; data curation, H.H.; formal analysis, R.H.; funding acquisition, X.M.; methodology, J.H.; supervision, X.M. and M.L.; visualization, H.H.; writing—original draft, X.M. and M.L.; writing—review and editing, J.H., R.H., and H.H. All authors have read and agreed to the published version of the manuscript.

Funding

This work was funded by the science and technology fund project of Guangzhou Transportation Planning Research Institute Co., Ltd. (KYHT-2025-02).

Data Availability Statement

The data used to support the fndings of this study are available from the corresponding author on request. If some readers need the data, contact the corresponding author via the e-mail listed in this paper.

Conflicts of Interest

All of the authors were employed by the company Guangzhou Transport Planning Research Institute Co., Ltd. The all authors declare that the research was conducted in the absence of any commercial or financial relationships that could be construed as a potential conflict of interest.

References

  1. Gao, S.S.; Yuan, Z.Z. Models and Evaluation for Urban Traffic Carrying Capacity. Appl. Mech. Mater. 2013, 409, 1258–1261. [Google Scholar] [CrossRef]
  2. Yuan, Z.; Deng, N.; Yan, X. Coupling coordination between traffic carrying capacity and environment carrying capacity. J. Beijing Jiaotong Univ. 2017, 41, 6. [Google Scholar]
  3. Bai, T.; Liu, X.; Li, X. Discussions on Transportation Capacity as a Constraint for Urban Development: Taking Beijing as an Example Urban Transportation; Tongfang Knowledge Network Technology Co., Ltd.: Beijing, China, 2019; Volume 17, pp. 91–98. [Google Scholar] [CrossRef]
  4. Hansen, W.G. How accessibility shapes land use. J. Am. Inst. Plan. 1959, 25, 73–76. [Google Scholar] [CrossRef]
  5. Ingram, D.R. The concept of accessibility: A search for an operational form. Reg. Stud. 1971, 5, 101–107. [Google Scholar] [CrossRef]
  6. Black, J.; Conroy, M. Accessibility measures and the social evaluation of urban structure. Environ. Plan. A Econ. Space 1977, 9, 1013–1031. [Google Scholar] [CrossRef]
  7. Wachs, M.; Kumagai, T.G. Physical accessibility as a social indicator. Socio-Econ. Plan. Sci. 1973, 7, 437–456. [Google Scholar] [CrossRef]
  8. Shen, Q. Location characteristics of inner-city neighborhoods and employment accessibility of low-wage workers. Environ. Plan. B Plan. Des. 1998, 25, 345–365. [Google Scholar] [CrossRef]
  9. Holloway, T. A micro-level approach to measuring the accessibility of footways for wheelchair users using the Capability Model. Transp. Plan. Technol. 2013, 36, 636–649. [Google Scholar] [CrossRef]
  10. Delafons, J. Reforming the British planning system 1964-5: The Planning Advisory Group and the genesis of the Planning Act of 1968. Plan. Perspect. 1998, 13, 373–387. [Google Scholar] [CrossRef]
  11. Vanka, S.; Handy, S.; Kockelman, K.M. State-local coordination in managing land use and transportation along state highways. J. Urban Plan. Dev. 2005, 131, 10–18. [Google Scholar] [CrossRef]
  12. Yang, L.Y.; Shao, C.F. Data envelopment analysis model of harmonious relationship between urban traffic and land use. J. Traffic Transp. Eng. 2007, 7, 6. [Google Scholar]
  13. Wang, Y.; Hao, J.; Huang, H.; Liu, L. A Measure Model for Synergic Development in Multimode Regional Rail Transit. China Transp. Rev. 2019, 41, 26–31. [Google Scholar]
  14. Wu, B.; Jin, X.; Li, D.; Wang, B. Spatial-Temporal Evolution of Coupling Coordination Development between Regional Highway Transportation and New Urbanization: A Case Study of Heilongjiang, China. Sustainability 2023, 15, 16365. [Google Scholar] [CrossRef]
  15. Jia, H.; Li, W.; Tian, R. Spatio-Temporal Influencing Factors of the Coupling Coordination Degree Between China’s New-Type Urbanization and Transportation Carbon Emission Efficiency. Land 2025, 14, 623. [Google Scholar] [CrossRef]
  16. Suryani, E.; Hendrawan, R.A.; Adipraja, P.F.E. System Dynamics Simulation Model for Urban Transportation Planning: A Case Study. Int. J. Simul. Model. 2020, 19, 5–16. [Google Scholar] [CrossRef]
  17. Davies, K.; Hart, E.; Galloway, S. Quantifying impacts of sustainable transport interventions in Scotland: A system dynamics approach. Transp. Res. Part D Transp. Environ. 2024, 133, 104311. [Google Scholar] [CrossRef]
  18. Hosen, M.Z.; Hossain, M.A.; Tanimoto, J. Traffic model for the dynamical behavioral study of a traffic system imposing push and pull effects. Phys. A Stat. Mech. Appl. 2024, 645, 129816. [Google Scholar] [CrossRef]
  19. Wang, N.; Wu, M.; Yuen, K.F. Modelling and assessing long-term urban transportation system resilience based on system dynamics. Sustain. Cities Soc. 2024, 109, 105548. [Google Scholar] [CrossRef]
  20. Baghestani, A.; Najafabadi, S.; Salem, A.; Jiang, Z.; Tayarani, M.; Gao, O. An Application of the Node-Place Model to Explore the Land Use-Transport Development Dynamics of the I-287 Corridor. Urban Sci. 2023, 7, 21. [Google Scholar] [CrossRef]
  21. Shi, J.; Wang, S.; Liu, S.; Zhou, C. Unveiling Transportation Socio-Economic Adaptability Using a Node-Place Model: A Case from Zhejiang Province, China. Sustainability 2024, 16, 4009. [Google Scholar] [CrossRef]
  22. Yang, W.; Xu, Q.; Yi, S.; Shankar, R.; Chen, T. Enhancing transit-oriented development sustainability through the integrated node-place-ecology (NPE) model. Transp. Res. Part D Transp. Environ. 2024, 136, 104456. [Google Scholar] [CrossRef]
  23. Hu, C.P. Urban Land-Use Allocation with Resilience: Application of the Lowry Model. Sustainability 2022, 14, 15927. [Google Scholar] [CrossRef]
  24. Channavar, A.; Patil, L. Lowry Model: Study on the Relationship between Urban Transport and Land Use. J. Res. Sci. Eng. 2023, 5, 93–98. [Google Scholar]
  25. Pönkänen, M.; Tenkanen, H.; Mladenović, M. Spatial accessibility and transport inequity in Finland: Open source models and perspectives from planning practice. Comput. Environ. Urban Syst. 2025, 116, 102218. [Google Scholar] [CrossRef]
  26. Niu, J.; Wang, J. Model checking spatial reachability specifications of public transport networks. Simul. Model. Pract. Theory 2025, 138, 103033. [Google Scholar] [CrossRef]
  27. Zhuang, S.; Xia, N.; Gao, X.; Zhao, X.; Liang, J.; Wang, Z.; Li, M. Coupling coordination analysis between railway transport accessibility and tourism economic connection during 2010–2019: A case study of the Yangtze River Delta. Res. Transp. Bus. Manag. 2024, 55, 101134. [Google Scholar] [CrossRef]
  28. Jiang, X.; Zhai, S.; Liu, H.; Chen, J.; Zhu, Y.; Wang, Z. Multi-scenario simulation of production-living-ecological space and ecological effects based on shared socioeconomic pathways in Zhengzhou, China. Ecol. Indic. 2022, 137, 108750. [Google Scholar] [CrossRef]
  29. Dabagh, S.; Miristice, L.M.B.; Gentile, G. Accessibility Via Public Transport Through Gravity Models Based on Open Data. Transp. Telecommun. J. 2024, 25, 359–369. [Google Scholar] [CrossRef]
Figure 1. Illustration of node–place model.
Land 14 01495 g001
Figure 2. Schematic illustration of the degree of synergy between transportation and land use.
Land 14 01495 g002
Figure 3. Evaluation result of traditional node–place model.
Land 14 01495 g003
Figure 4. Classification of “Three Types of Functional Space” (production–living–ecological space) and their correspondence with land-use types.
Land 14 01495 g004
Figure 5. Accessibility model construction process.
Land 14 01495 g005
Figure 6. Coordination research model building process.
Land 14 01495 g006
Figure 7. Evaluation mechanism of transportation and land-use coordination from the perspective of production–living–ecological spaces.
Land 14 01495 g007
Figure 8. Evaluation index system for transportation and land-use coordination from the perspective of production–living–ecological spaces.
Land 14 01495 g008
Figure 9. Accessibility-assisted delineation of urban development boundaries in Guangzhou (left: accessibility levels; right: indicative urban development boundary).
Land 14 01495 g009
Figure 10. Accessibility-guided optimization of urban spatial structure in Guangzhou (left: accessibility levels; right: schematic diagram of spatial structure optimization at the metropolitan scale).
Land 14 01495 g010
Figure 11. The comprehensive values of traffic zones.
Land 14 01495 g011
Figure 12. The single coordination of traffic zones.
Land 14 01495 g012
Figure 13. FY village renewal unit and surrounding single coherence.
Land 14 01495 g013
Figure 14. FY village renewal unit and surrounding composite coordination.
Land 14 01495 g014
Figure 15. Planned population density in and around the FY village renewal unit.
Land 14 01495 g015
Figure 16. Optimized population density in and around the FY village renewal unit.
Land 14 01495 g016
Table 1. Comparison of accessibility algorithms’ features.
ScaleMethodTransport Factors (Time/Distance, Individual Factors)Land-Use Factors (Opportunity/Demand)OperabilityInterpretabilityTypical Applications
MacroSpace–Time ConstraintsModeratePoorHighHighAccessibility evaluation of multiple facilities at small to medium scales (e.g., parcels, neighborhoods)
Cumulative OpportunitiesModerateModerateHighHighAccessibility evaluation of a single major facility at small to medium scales (e.g., parcels, neighborhoods)
Spatial InteractionHighModerateHighModerateAccessibility evaluation and opportunity-demand distribution at larger scales (e.g., regions, cities)
MicroIndividual UtilityHighHighLowHighAccessibility evaluation based on detailed individual travel behavior data
Table 2. The traffic system indicators and adapted accessibility algorithms.
Factor TypeEvaluation Indicators and Units
Private TransportDensity of arterial roads (km/km2)
Density of pedestrian network (km/km2)
Number of parking spaces (units)
Number of bicycle/e-bike parking spaces (units)
Average travel time by private transport to city-level core areas (min)
Average travel time by private transport to district-level core areas (min)
Average travel time by private transport (min)
Travel time by private transport to airport hubs (min)
Average travel time by private transport to railway hubs (min)
Average travel cost by private transport (CNY)
Public TransportNumber of conventional bus stops (units)
Number of rail transit stations (units)
Density of conventional bus routes (km/km2)
Density of rail transit routes (km/km2)
Average travel time by public transport to city-level core areas (min)
Average travel time by public transport to district-level core areas (min)
Average travel time by public transport (min)
Travel time by public transport to airport hubs (min)
Average travel time by public transport to railway hubs (min)
Average travel cost by public transport (CNY)
Table 3. The land-use indicators.
Factor CategoryLand-Use TypeEvaluation Indicators and Units
ProductionAgriculture
Industry
Transportation
Number of airports, high-speed rail stations, and ports within a defined range (units)
Number of expressway entrances/exits within a defined range (units)
Number of jobs related to corresponding land use within a defined range (10,000 persons)
Number of employees in corresponding land use in the region (10,000 persons)
Area of corresponding land use in the region (km2)
ServicesNumber of permanent residents covered within a defined range (10,000 persons)
Land area coverage ratio of bus stops (%)
Land area coverage ratio of rail transit stations (%)
Number of employees in corresponding land use in the region (10,000 persons)
Area of corresponding land use in the region (km2)
LivingCommunity Services
Consumer Services
Public Services
Land area coverage ratio of bus stops (%)
Land area coverage ratio of rail transit stations (%)
Number of service facilities within a defined range (units)
Number of permanent residents in the region (10,000 persons)
Area of corresponding land use in the region (km2)
EcologicalUrban Ecology
Suburban Ecology
Number of airports, high-speed rail stations, and ports within a defined range (units)
Number of expressway entrances/exits within a defined range (units)
Number of permanent residents covered within a defined range (10,000 persons)
Area of corresponding land use in the region (km2)
Table 4. The ranking criteria of regional accessibility.
Accessibility   Value   ( C s i   or   C s n ) Accessibility   Level   ( r s i   or   r s n )
  90 , 100 1
  80 , 90 2
  65 , 80 3
  50 , 65 4
  35 , 50 5
  20 , 35 6
  10 , 20 7
  0 , 10 8
Table 5. Optimization results for different important land use and transportation facility indicators.
Indicator CategoryIndicatorCurrent ValueAccessibility OptimizationCoordination Optimization
Land Use IndicatorsPopulation Density (10,000 persons/km2)1.182.742.10
Employment Density (10,000 jobs/km2)0.518.652.77
Floor Area Ratio (FAR)0.041.040.27
Transport Infrastructure IndicatorsUrban Rail Transit Line Density (km/km2)00.470
Bus Stop Density (stops/km2)2.1511.652.03
Road Network Density (km/km2)7.077.556.85
Disclaimer/Publisher’s Note: The statements, opinions and data contained in all publications are solely those of the individual author(s) and contributor(s) and not of MDPI and/or the editor(s). MDPI and/or the editor(s) disclaim responsibility for any injury to people or property resulting from any ideas, methods, instructions or products referred to in the content.