Article

Rock Exposure-Driven Ecological Evolution: Multidimensional Spatiotemporal Analysis and Driving Path Quantification in Karst Strategic Areas of Southwest China

1
School of Design and Art, Henan University of Technology, Zhengzhou 450001, China
2
School of Architecture and Urban Planning, Guizhou University, Guiyang 550025, China
*
Author to whom correspondence should be addressed.
Land 2025, 14(7), 1487; https://doi.org/10.3390/land14071487
Submission received: 13 June 2025 / Revised: 7 July 2025 / Accepted: 15 July 2025 / Published: 18 July 2025

Abstract

Southwest China, with typical karst, is one of the 36 biodiversity hotspots in the world, facing extreme ecological fragility due to thin soils, limited water retention, and high bedrock exposure. This fragility intensifies under climate change and human pressures, threatening regional sustainable development. Ecological strategic areas (ESAs) are critical safeguards for ecosystem resilience, yet their spatiotemporal dynamics and driving mechanisms remain poorly quantified. To address this gap, this study constructed a multidimensional ecological health assessment framework (pattern integrity–process efficiency–function diversity). By integrating Sen’s slope, a correlated Mann–Kendall (CMK) test, the Hurst index, and fuzzy C-means clustering, we systematically evaluated ecological health trends and identified ESA differentiation patterns for 2000–2024. Orthogonal partial least squares structural equation modeling (OPLS-SEM) quantified driving factor intensities and pathways. The results revealed that ecological health improved overall but exhibited significant spatial disparity: persistently high in southern Guangdong and most of Yunnan, and persistently low in the Sichuan Basin and eastern Hubei, with 41.47% of counties showing declining/slightly declining trends. ESAs were concentrated in the southwest/southeast, whereas high-EHI ESAs increased while low-EHI ESAs declined. Additionally, the natural environmental and human interference impacts decreased, while unique geographic factors (notably the rock exposure rate, with persistently significant negative effects) increased. This long-term, multidimensional assessment provides a scientific foundation for targeted conservation and sustainable development strategies in fragile karst ecosystems.

1. Introduction

Global ecosystems face unprecedented threats from intensified human activities and climate change, manifesting as biodiversity loss, deforestation, soil degradation, and altered hydrological cycles [1]. In response, ecological conservation has ascended to a paramount global priority, underscored by frameworks like the UN Sustainable Development Goals and China’s national “Ecological Civilization” and “Beautiful China” initiatives (MEE, 2023; State Council, 2021). These policies mandate the identification and protection of ecological strategic areas (ESAs)—key zones essential for maintaining critical ecosystem services, biodiversity, and regional ecological security [2]. China’s rapid urbanization and industrial growth, while driving economic development, exert severe pressure on ecosystems, particularly in ecologically fragile regions [3]. Southwest China’s karst region exemplifies this challenge [4]. Similar to the karst areas in Southwest China, karstic regions around the world also encounter significant ecological challenges. For instance, in the Yucatán Peninsula of Mexico, a well-known karst area, human activities such as agricultural expansion and tourism development have led to habitat fragmentation and water pollution, threatening the unique biodiversity of the region [5]. In the karst regions of Southeast Asia, including parts of Vietnam and Laos, deforestation for logging and shifting cultivation has accelerated soil erosion and rock desertification, disrupting the local ecological balance [6]. In Europe, the karst areas of the Dinaric Alps face issues like over-extraction of groundwater due to increasing water demands, which affects the stability of the karst ecosystem [7] As a globally recognized biodiversity hotspot harboring exceptional species richness, its ecosystem is intrinsically vulnerable: thin soil layers, rapid water infiltration through fractured bedrock, and high susceptibility to erosion and rocky desertification make it exceptionally sensitive to both climate variability (e.g., altered precipitation patterns) and human interventions (e.g., land conversion, overgrazing) [4,5]. Protecting this region is not only vital for China’s ecological security but also for global biodiversity conservation.
Current approaches to ESA identification, however, face critical limitations. Many methods rely on single ecosystem traits or composite indices derived from weighted environmental factors [6], such as ecological indicators (EIs) and remotely sensed ecological indicators (RSEIs), which are often two-dimensional in nature and fail to comprehensively capture the vertical and temporal variations within ecosystems. These traditional methods typically focus on static snapshots of ecosystem conditions, often failing to capture the integrated dynamics of pattern, process, and function within complex ecosystems [7,8]. Crucially, these approaches frequently overlook essential dimensions like biodiversity and long-term functional stability, which are fundamental to true ecological health. Moreover, assessments are often static, neglecting the temporal dynamics essential for understanding ESAs’ resilience under ongoing climate change and anthropogenic pressures [9,10]. Consequently, critical knowledge gaps persist in understanding: First, the spatiotemporal evolution of ecological health and ESAs’ distribution in Southwest China’s karst region under coupled climate–human pressures remains unquantified [11]. Second, the dominant drivers (natural, anthropogenic, and geographic) and their interaction pathways governing ESAs dynamics—particularly the role of inherent karst fragility factors like bedrock exposure—are poorly understood [12].
To address these gaps, this study (1) introduces a three-dimensional ecological health assessment framework, contrasting with traditional flat models, that integrates pattern integrity, process efficiency, and function diversity to reflect ecosystem complexity; (2) conducts a long-term (2000–2024), multidimensional analysis of ecological health trends and ESA spatiotemporal differentiation using robust statistical methods (Sen’s slope, CMK, the Hurst index, FCM), providing a more dynamic and comprehensive perspective compared to static assessments; and (3) quantifies the intensity and interaction pathways of driving factors (climate, human, and geography) on ESA dynamics using OPLS-SEM. Our findings provide actionable insights for optimizing ESA delineation, guiding ecological restoration priorities, and supporting the sustainable development goals of China’s national ecological security strategy within this critical, yet fragile, global biodiversity hotspot.

2. Materials and Methods
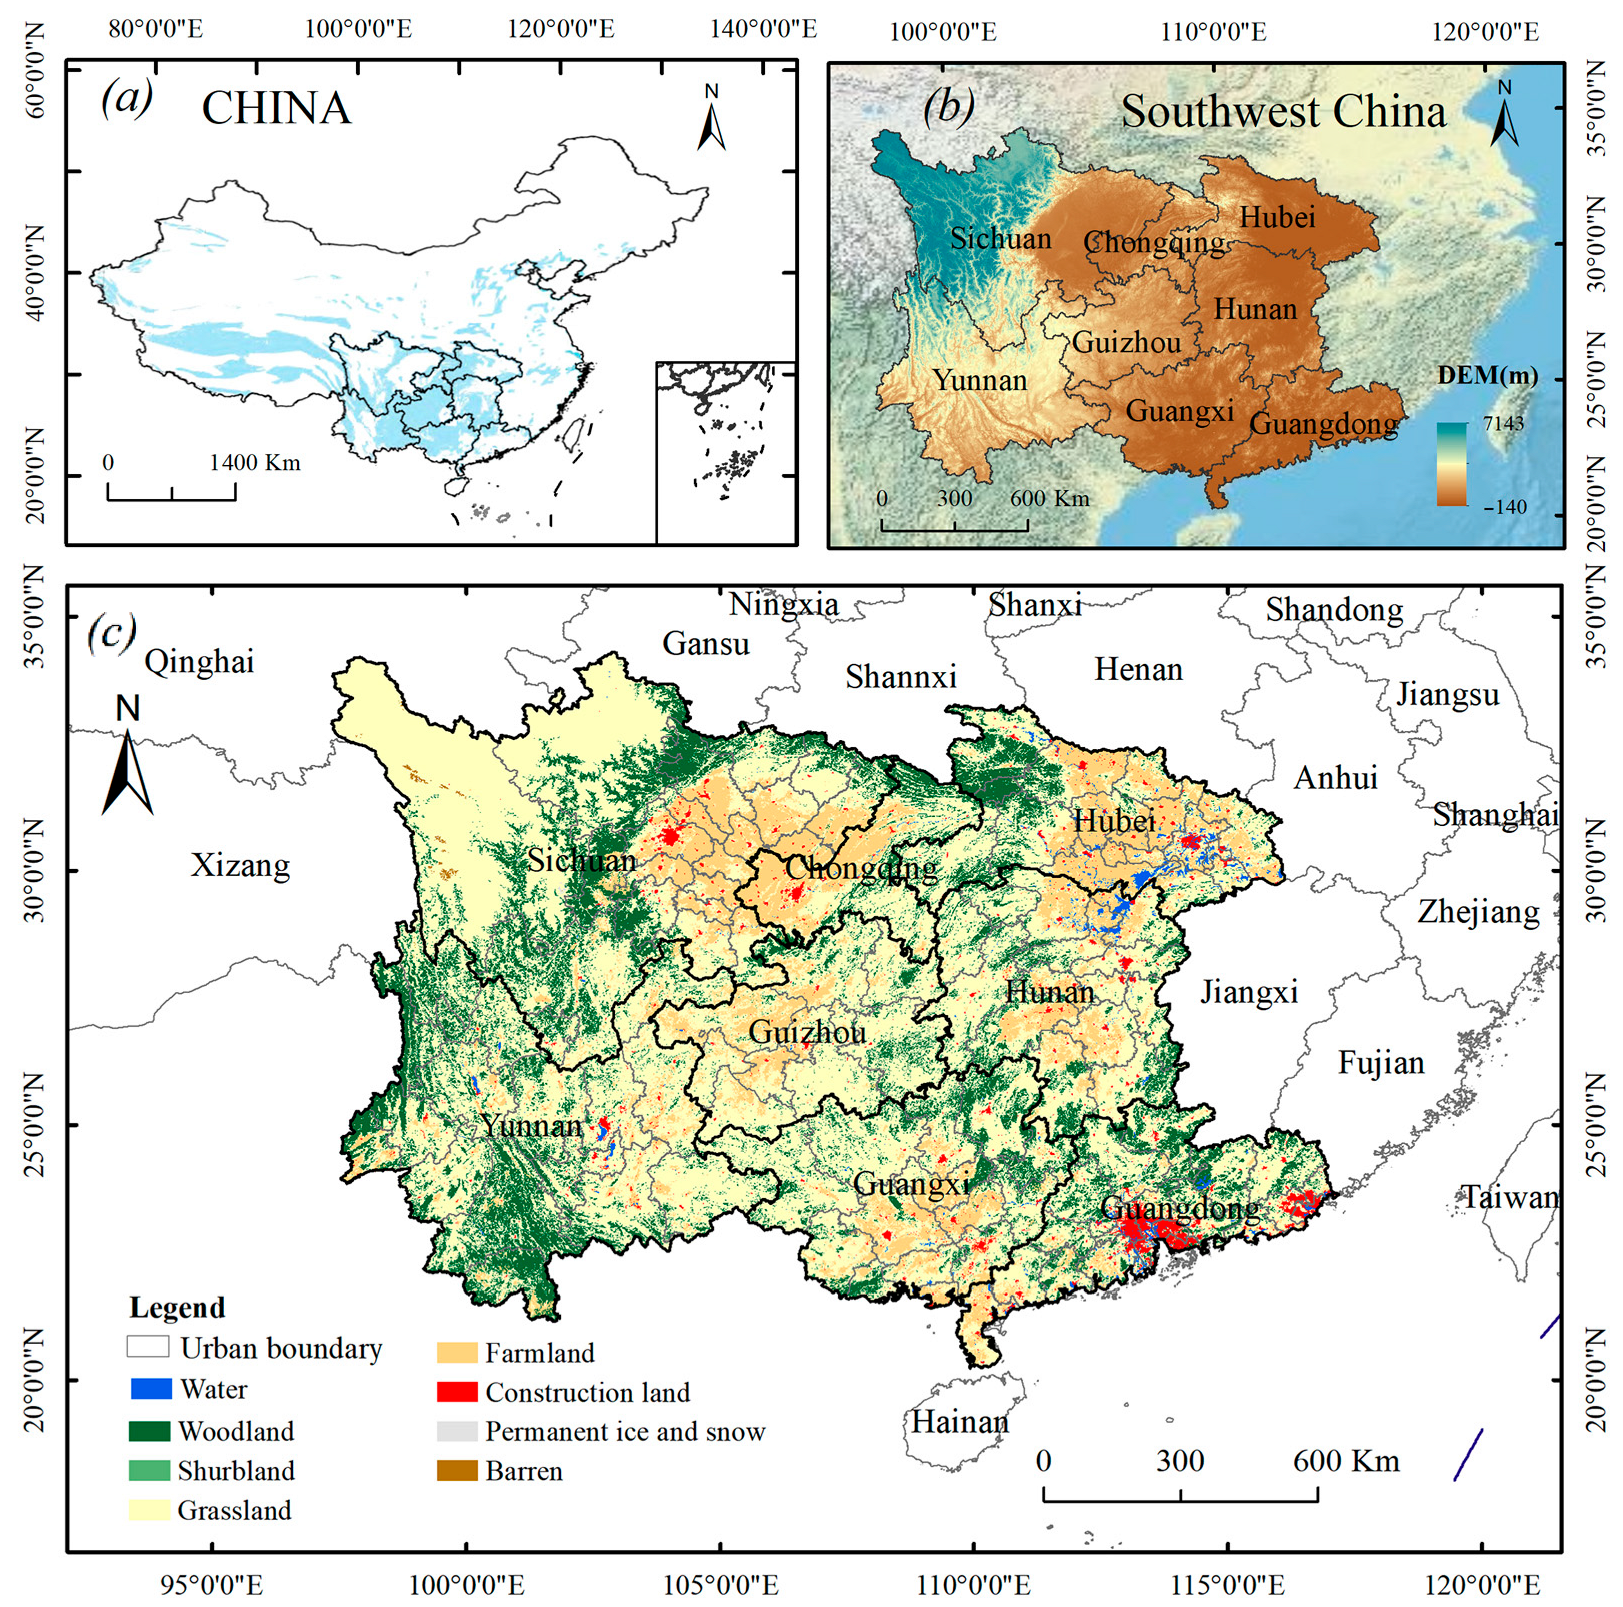
2.1. Study Area

Southwest China, with typical karst (20°09′ N~34°19′ N, 97°21′ E~117°19′ E), is centered on the Yunnan–Guizhou Plateau [9]. It is the water supply area of the Pearl River and the Yangtze River, the water source of the South-to-North Water Diversion, and the Three Gorges Reservoir Area; the geographic and ecological location is very important. This area includes the Guizhou, Yunnan, Sichuan, Chongqing, Guangdong, Guangxi, Hunan, and Hubei Provinces [13,14]. It has a subtropical monsoon climate, with an average annual temperature of 18 °C and annual precipitation of more than 900 mm. Most of the area is located in the subtropical evergreen broad-leaved forest belt, and the vegetation types are rich and diversified [15]. The average altitude is 800~1000 m, and the terrain is complex and diverse, including mountains, plateaus, basins, and tablelands [16]. The region’s inherent environmental fragility, characterized by thin soils (often <30 cm), high bedrock exposure, and rapid subsurface drainage, combined with unsustainable human activities such as steep-slope cultivation, overgrazing, and deforestation, has led to prominent ecological problems [9] (Figure 1).

2.2. Data Collection

In this study, multisource datasets were utilized to identify the spatiotemporal dynamics of ESAs and their driving mechanisms. Our data primarily included (1) land use remote sensing data (30 m resolution), obtained through radiation correction, FLAASH atmospheric calibration, image fusion, masking, and land use classification using support vector machines combined with visual interpretation; (2) climate and environmental data comprising the average annual precipitation, the average annual temperature, biodiversity data, soil data, rock exposure rate data, and digital elevation model (DEM) data, from which the elevation and slope were derived; and (3) socioeconomic data including highways, railroads, water bodies, population density, and night light intensity. The data sources are detailed in Table 1. All datasets were preprocessed in ArcGIS 10.2, Google Earth Engine, and R 4.2.1 through merging, clipping, reprojecting, and resampling. The resolution of all datasets was standardized to 1 km.

2.3. Methods

The framework mainly comprised three parts: (1) establishing a three-dimensional ecological health assessment model (pattern integrity, process efficiency, and function diversity) based on karst ecosystem characteristics; (2) employing Sen’s slope and a correlated Mann–Kendall (CMK) test, the Hurst index, and fuzzy C-means clustering to comprehensively reveal ESAs’ spatiotemporal differentiation from 2000 to 2024; and (3) applying the OPLS-SEM integrated model to identify the intensity and pathways of driving factors influencing ESAs patterns. This sequence ensures outputs from prior steps directly structure inputs for subsequent analyses. The framework of the study is presented in Figure 2.

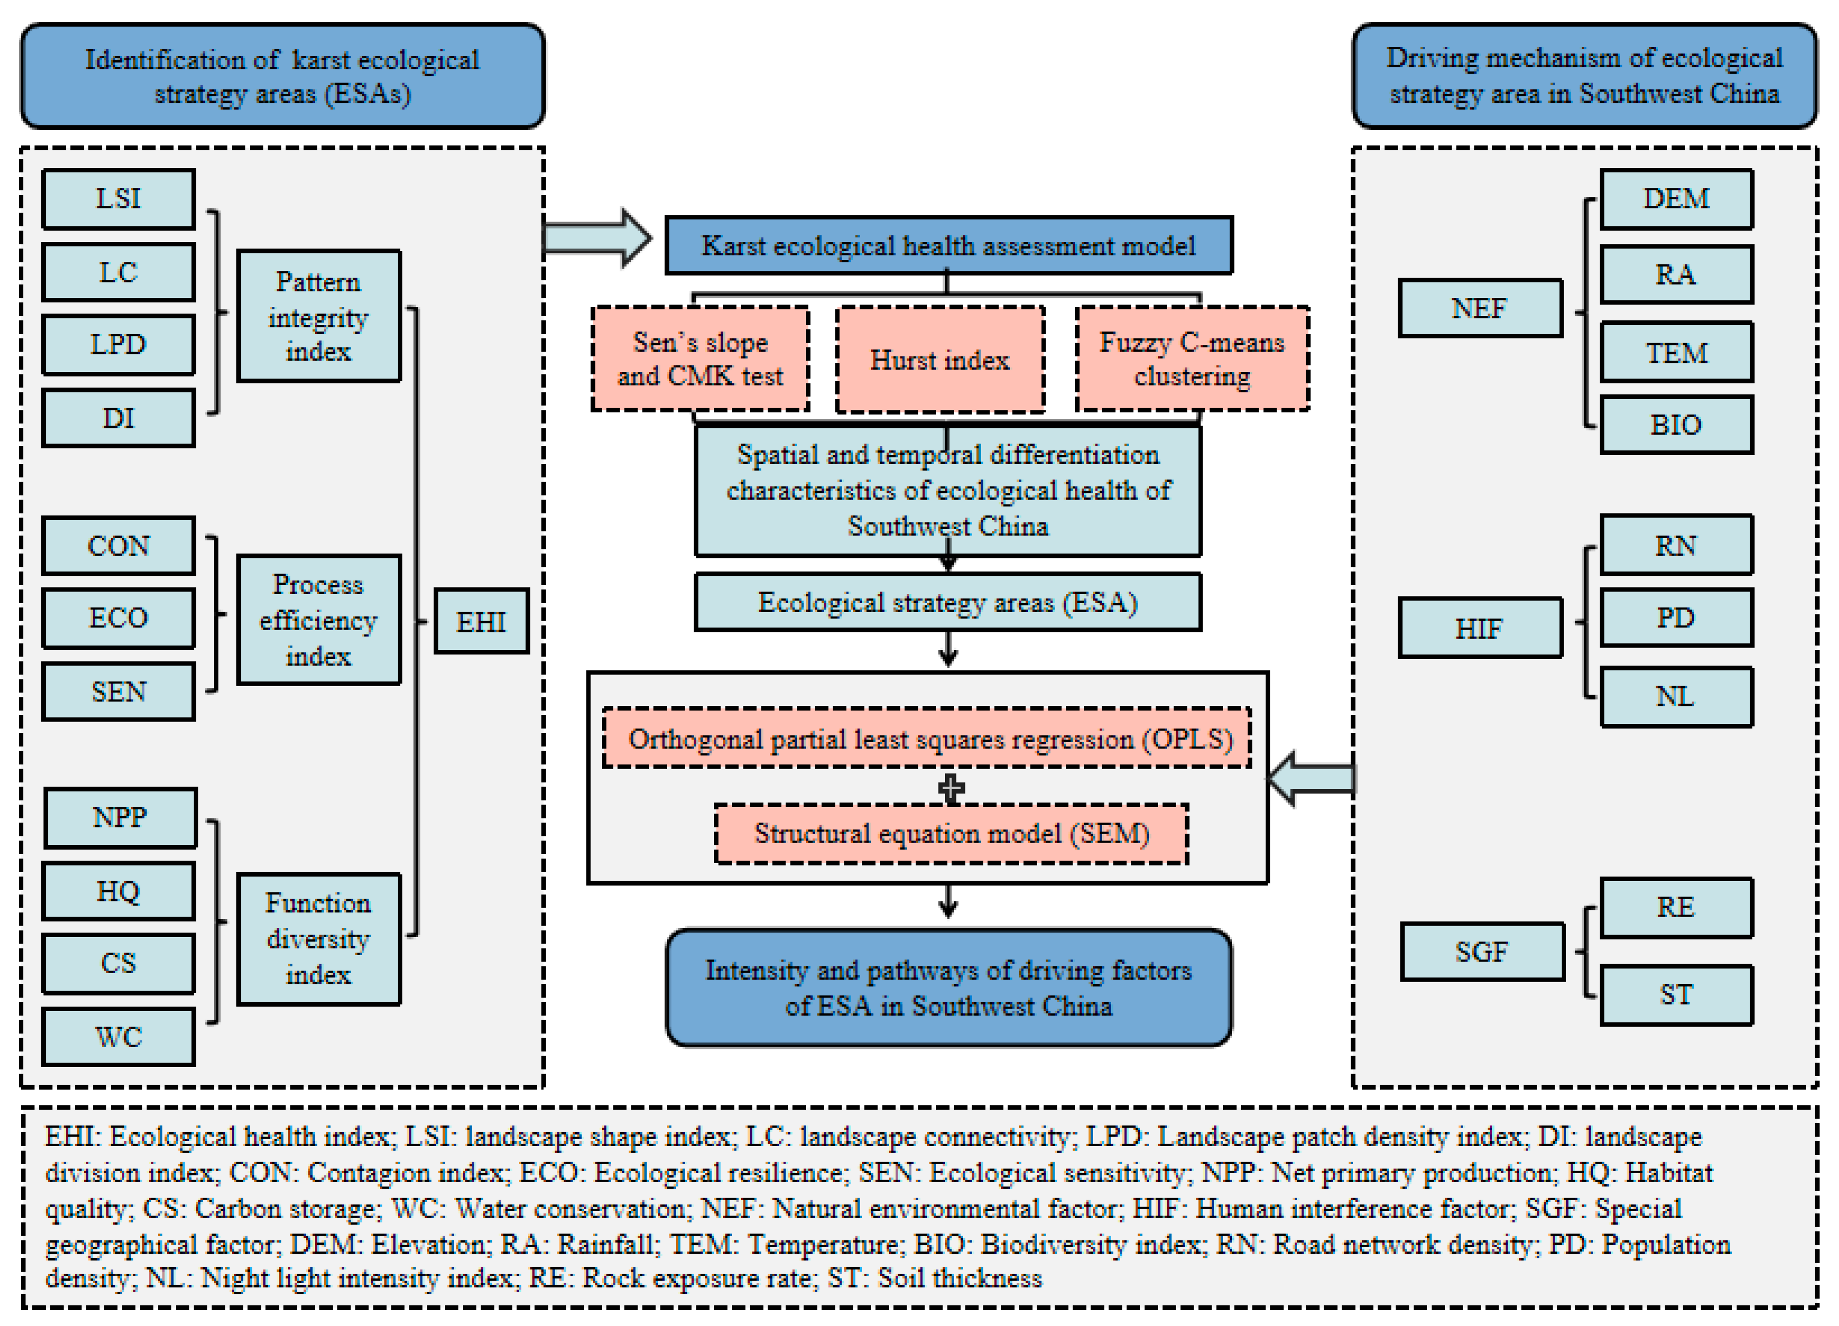
2.3.1. Ecological Health Assessment

(1)
Pattern integrity
In fragile karst environments, pattern integrity assessment should account for unique geological sensitivities, such as thin soils, high porosity, and heightened vulnerability to fragmentation from human activities like rocky desertification [16]. Adapting landscape ecology principles, this study selected the patch shape index (LSI) to reflect edge effects on soil erosion in irregular karst patches [3]; landscape patch density (LPD) to quantify habitat subdivision risks associated with bedrock exposure [17]; landscape connectivity (LC) to assess species mobility and hydrological connectivity across porous terrains [14,18]; and the division index (DI) to measure habitat isolation exacerbating ecological instability [10]. These metrics collectively capture karst-specific fragmentation processes and connectivity degradation, providing a holistic assessment of pattern integrity under urbanization pressures. The calculation formula is as follows:
P I I = ( 1 f ( L S I ) ) α 1 + ( 1 f ( L P D ) ) α 2 + f ( L C ) α 3 + ( 1 f ( D I ) ) α 4
where P I I is the pattern integrity index, f ( x ) is the normalization. α 1 , α 2 , α 3 , and α 4 are the metrics weights. These metrics were quantified using Fragstats V4.2 with a sliding window of 1 km at the landscape scale.
(2)
Process efficiency
The assessment of ecosystem processes in karst areas should prioritize rapid recovery, structural stability, and low sensitivity to human activities. The Contagion index (CON) quantifies landscape connectivity, reflecting habitat fragmentation risks within karst topography [19]. Ecological resilience (ER) measures rebound capacity post-disturbance, crucial for slow-regenerating karst systems prone to irreversible degradation [16]. Ecological sensitivity (ES) evaluates susceptibility to stressors, directly quantifying karst’s extreme vulnerability to erosion and pollution using the soil erosion modulus [20,21]. This study selected these metrics to evaluate the process efficiency of karst ecosystems to maintain function and order under conventional land use. The calculation formulas are as follows:
E R = g ( K e n d a l l τ ( A R ( 1 , N D V I ) , t )
E S = R K L S C P
P E I = f ( C O N ) β 1 + f ( E C O ) β 2 + ( 1 f ( E S ) ) β 3
where A R ( 1 , x ) is the autoregressive coefficient of x via a sliding window, E R = K e n d a l l τ ( n , t ) is the temporal trend of n , the pixels are categorized into a significantly decreasing trend (ER = 1), a nonsignificant change (ER = 2), and a significantly increasing trend (ER = 3), g(x) is the formulation for assigning ER values (1–3), R is the rainfall erosivity, K is the soil erodibility, C is the vegetation cover and management parameter, P is the support practice parameter, L and S are the slope length and steepness, respectively, P E I is the process efficiency index, f ( x ) is the normalization, and β 1 ,   β 2 , and β 3 are the metrics weights. CON was quantified using Fragstats V4.2 with a sliding window of 1 km at the landscape scale.
(3)
Function diversity
This study assessed ecosystem function diversity by integrating vegetation net primary productivity (NPP) quantification with model-based evaluations of three key urbanization-sensitive ecosystem services [2]: NPP provides a direct measure of ecosystem energy capture and carbon fixation capacity, which is critically limited by soil resources in karst ecosystems [4]. Habitat quality (HQ) was chosen as karst landscapes support unique biodiversity that is highly susceptible to habitat fragmentation from human activities like land conversion [12]. Carbon storage (CS) is essential in karst due to significant sequestration occurring in both vegetation and extensive carbonate rock pools [22]; this storage is vulnerable to land-use changes. Water conservation (WC) is prioritized because rapid infiltration through karst aquifers makes water retention and regulation particularly challenging yet vital for downstream users and ecosystem stability [20]. The NPP was obtained by CASA model analysis, the maximum light energy utilization efficiency was determined based on the localization research of parameters of typical Chinese ecosystems. The values for broad-leaved forests, coniferous forests, grasslands, and farmlands were set at 0.389, 0.476, 0.542, and 0.542 g C·MJ−1, respectively [23]. The HQ, CS, and WC were calculated with the InVEST model. For the HQ module, the weights of threat sources (cultivated land, construction land) and the attenuation function were based on research on habitat degradation in China. In the CS module, the carbon pool density values were assigned according to the meta-analysis of the carbon density of Chinese ecosystems. The soil carbon density values for forests, grasslands, and farmlands were 143.6, 99.2, and 110.8 Mg·hm−2, respectively. For the WC module, the Plant Available Water Content (PAWC) was calculated based [24] on the Soil Texture Map of China (HWSD v1.2), and the evapotranspiration coefficient was based on the FAO Crop Coefficient Manual. The calculation formula is as follows:
F D I = f ( k m e a n s ( N P P , H Q , C S , W C ) )
where F D I is the function diversity index, f is the normalization, and kmeans represents the kmeans clustering analysis used for mapping ecosystem multifunctionality. It identifies n ecosystem service bundles (ESBs) with similar ES aggregations; f represents the formulation for assigning multifunctionality index values to ESBs. The ESB with the highest average level of all ecosystem functions among all ESBs was given the highest ecosystem multifunctionality index (EMI = n), whereas the ESB with the lowest average level of all ecosystem functions among all ESBs was assigned an EMI = 1. Since ecosystem functions interact in complex and nonlinear ways, cluster analysis can preserve these interdependencies and avoid the drawbacks of traditional weighted summation methods, which force linear relationships and may mask key synergies or trade-offs.

2.3.2. Identification of ESAs

This study employed the entropy weight method to assign weights to ecological health indicators in the study area, yielding the environmental health index (EHI) [23]. To characterize ecological health changes, this study classified the EHI into five levels using the natural breaks method: Poor (V), Fair (IV), Good (III), Excellent (II), and Very Excellent (I). This method identifies inherent breakpoints in the data distribution by maximizing inter-class variance, enabling optimal grouping, and minimizing subjectivity to enhance result comparability [24].
The National Outline of Territorial Spatial Planning (2021–2035) stipulates that the terrestrial ecological conservation area should exceed 30% of the total terrestrial area [7]. Moreover, 196 countries agreed to conserve and manage 30% of land and water effectively by 2030 under the Kunming–Montreal Global Biodiversity Framework in 2022 [1]. Therefore, in this study, the top 30% of high-value zones of the EHI were designated as ESAs. The calculation formulas are as follows:
E H I = α f ( P I I ) + β f ( P E I ) + χ f ( F D I )
E S A s i = T o p 30 % ( E H I )
where α , β , and χ are the weights of P I I , P E I , and F D I , respectively, E S A s i represents the ecological strategy area in year i , and f represents the normalization.

2.3.3. Temporal Evolution Pattern Recognition

Karst regions, characterized by fragile and highly heterogeneous ecosystems, often exhibit complex, nonlinear temporal patterns in ecological health dynamics, which may include noise and anomalies such as extreme weather events and sudden disturbances [25,26]. To accurately capture and quantify these spatiotemporal dynamics, the following approaches were integrated:
(1)
Sen’s slope and Correlated Mann–Kendall (CMK) test
Due to its computational simplicity and high robustness, Sen’s slope is widely used to analyze trends, particularly in datasets containing noise and outliers [25]. This method robustly estimates the rate of change, mitigating excessive influence from individual extremes—a crucial advantage for studies in karst regions where data quality can be inconsistent [27]. The trend magnitude and direction are quantified by the Sen inclination β ( β > 0 upward; β < 0 downward). The correlated Mann–Kendall (CMK) test enhances trend detection accuracy by accounting for data autocorrelation [27]. It effectively addresses the false positive tendency of the traditional MK test in autocorrelated data, providing more reliable assessments of long-term trend significance [28]. The sign of the test statistic S indicates trend direction, while its absolute value determines significance (|S| > 1.96 indicates statistical significance at p < 0.05). Combining Sen’s slope and the CMK test enables the precise identification of monotonic trends and their statistical significance in ecological health indicators over time in karst areas. This study implemented the CMK test using the IDRISI TerrSet 18.2 software. The CMK formula is as follows:
S ¯ n = 1 n i = 1 n S i
In the formula: n = 9 , includes the center cell and 8 surrounding cells, and S i is the statistic S of the neighboring cell i .
(2)
Hurst index
Karst ecosystems exhibit prolonged recovery periods and strong dependence on historical conditions [29]. The Hurst exponent (H) can reveal the future inertia or reversal potential of ecological health trends. Its value ranges from 0 to 1 (0 < H < 1), When 0 < H < 0.5, it indicates that the data series has anti-persistence, that is, the future trend is opposite to the past; H = 0.5 indicates that the data series is a random sequence; and 0.5 < H < 1 indicates that the data series has persistence [30]. This provides valuable guidance for assessing the difficulty of karst ecological restoration and formulating long-term management strategies.
(3)
Fuzzy C-means (FCM) clustering
FCM clustering is a soft clustering algorithm based on membership degree, and it is particularly suitable for characterizing such complex spatial patterns [31]. It accurately captures the continuous spatial variation and mixed types of karst ecosystem health status, avoiding artificial discontinuities inherent in hard clustering [32]. The core process of FCM involves iteratively minimizing an objective function to achieve the final clustering result, defined as follows:
J m ( U , C ) = i = 1 N j = 1 C u i j m | | x i c j | | 2
where N is the number of sample points, C is the number of clusters, u i j is the degree of affiliation of the sample point x i to cluster j , c j is the center of the cluster j , | | x i c j | | 2 is the Euclidean distance from the sample point x i to the center of the cluster c j , and m is the fuzzy factor. In this study, the FCM clustering algorithm was accomplished using the R language package “Mfuzz”.

2.3.4. Driving Factor Analysis Model

Karst ecosystem health dynamics result from complex interactions between natural geographical environments and human activities. This study focuses on three key driver categories, selected based on the sensitivity and vulnerability characteristics of karst ecosystems [21,33]: (1) Natural environmental factors (NEFs): These characterize fundamental environmental elements. These factors directly govern critical ecological processes like hydrothermal conditions and habitat distribution. (2) Human interference factors (HIFs): These represent human activity intensity and spatial distribution. These are the primary sources of stressors that cause vegetation destruction and soil erosion in karst regions. (3) Special geographical factors (SGFs): These highlight core karst landscape features. These factors profoundly influence ecosystem resilience to natural variations and anthropogenic disturbances. Specific factors are shown in Figure 2.
To address significant multicollinearity and complex interactions among factors, this study coupled OPLS with SEM to investigate their driving mechanisms. This integrated approach overcomes the limitations of single models [9,34]: OPLS enhances the efficiency of driver screening through dimension reduction and multicollinearity removal, while SEM elucidates the complex interactions among “natural-geographic-anthropogenic” factors via path analysis [35,36]. Their combination thus enables the model to (1) filter out noise and collinearity to focus on ecologically relevant drivers (via OPLS) and (2) disentangle the intricate, multi-layered relationships among these drivers (via SEM). This synergy allows for more accurate, mechanistically grounded insights into ESA evolution drivers, avoiding the oversimplification of standalone OPLS (which lacks causal interpretation) or SEM (which struggles with high multicollinearity). Ultimately, this integration provides a highly interpretable scientific basis for regional ecological conservation.
(1)
Orthogonal partial least squares (OPLS) regression
OPLS maximizes data utilization to identify the intensity of driving factors by recombining rather than eliminating variable information, while addressing the collinearity issue between variables [36]. The model fitting performance is evaluated using cross-validation value Q2 (Q2 > 0.5 indicates a robust model) and model predictive explanatory power R2Y (R2Y > 50% signifies good predictive ability) [37]. Variable importance is measured by VIP, where VIP > 1.0 is generally considered to indicate that the variable makes significant contributions to explaining the dependent variable [35]. The relevant formulas are as follows:
Q 2 = 1 ( Y i Y i ) 2 ( Y i Y ¯ i ) 2 , i ( k , k )
V I P = p R d ( y ; t 1 , t 2 · · · , t m ) h = 1 m R d ( y ; t h ) w h i 2 ( i = 1 , 2 · · · p )
where Y i , Y i , and Y ¯ i are the measured value, predicted value, and average value of the dependent variable Y, respectively. w h i is the ith component of axis w h , which measures the marginal contribution of xi to component t h ; R d ( y ; t h ) is the explanatory power of t h for y; R d = ( y ; t 1 , t 2 · · · , t m ) is the cumulative explanatory power of t1, t2,…, tm for y; and m the number of orthogonal components.
(2)
Structural equation modeling
The structural equation model (SEM) combines the advantages of path analysis and factor analysis and can consider both the causal effects among variables and the composition of latent variables [38]. It is particularly suitable for longitudinal data or long-term tracking data, and can accurately analyze the dynamic relationship between latent variables and observed variables over time.

3. Results

3.1. Spatiotemporal Evolution Characteristics of Ecological Health

From 2000 to 2024, the EHI in the study area exhibited an upward trend with an average annual growth rate of 0.00167, indicating gradual improvement in ecological environment quality (Figure 3). When segmented temporally, the EHI increased most rapidly from 2000 to 2003, rising from 0.462 to 0.477 at 0.005 annually. During 2003–2007, it declined from 0.477 to 0.474. A rebound occurred from 2007 to 2011, reaching 0.491. Subsequently, the EHI decreased (2011–2014), followed by an immediate rise and eventual stabilization, peaking at 0.504 in 2022.
Spatially, the highest EHI values occur in southern Guangdong and most of Yunnan, followed by eastern Guangxi and local areas in Sichuan. In contrast, the northern and central regions, including the Sichuan Basin and eastern Hubei, exhibit comparatively low values (Figure 4). Regarding temporal changes in EHI levels, during 2000–2005, levels V and IV transitioned to levels III and II, with areas decreasing by 3991 km2 and 34,979.76 km2, respectively; the level I area increased by 12,734.15 km2, indicating rapid ecological health improvement. From 2005 to 2010, levels V and IV continued transitioning to level III, with areas declining by 29,121.33 km2 and 51,967.02 km2, respectively. During 2010–2015, transitions primarily occurred from level II to level III. Between 2015 and 2024, levels V and IV areas decreased by 34,504.51 km2 and 1703.87 km2, respectively. Overall, the area increase for levels I and II exceeded the decrease, while level V declined significantly—particularly in northwestern Sichuan—throughout the study period.
The combination of Sen’s slope and the CMK test effectively reflects the spatial change trend of the EHI from 2000 to 2024 (Figure 5a). The spatial change trend of the EHI showed a clear nucleus-periphery structure. There was a clear overlap between the areas with a significant decrease in the EHI and the areas with concentrated urban development, while the downward trend in the surrounding areas was less obvious, with most of them presenting a significant improvement in the EHI. The Hurst analysis showed (Figure 5b) that the EHI in the study area showed a long-term pattern of superior development in Guangdong and Yunnan provinces, while most low-EHI areas showed no persistent trend.

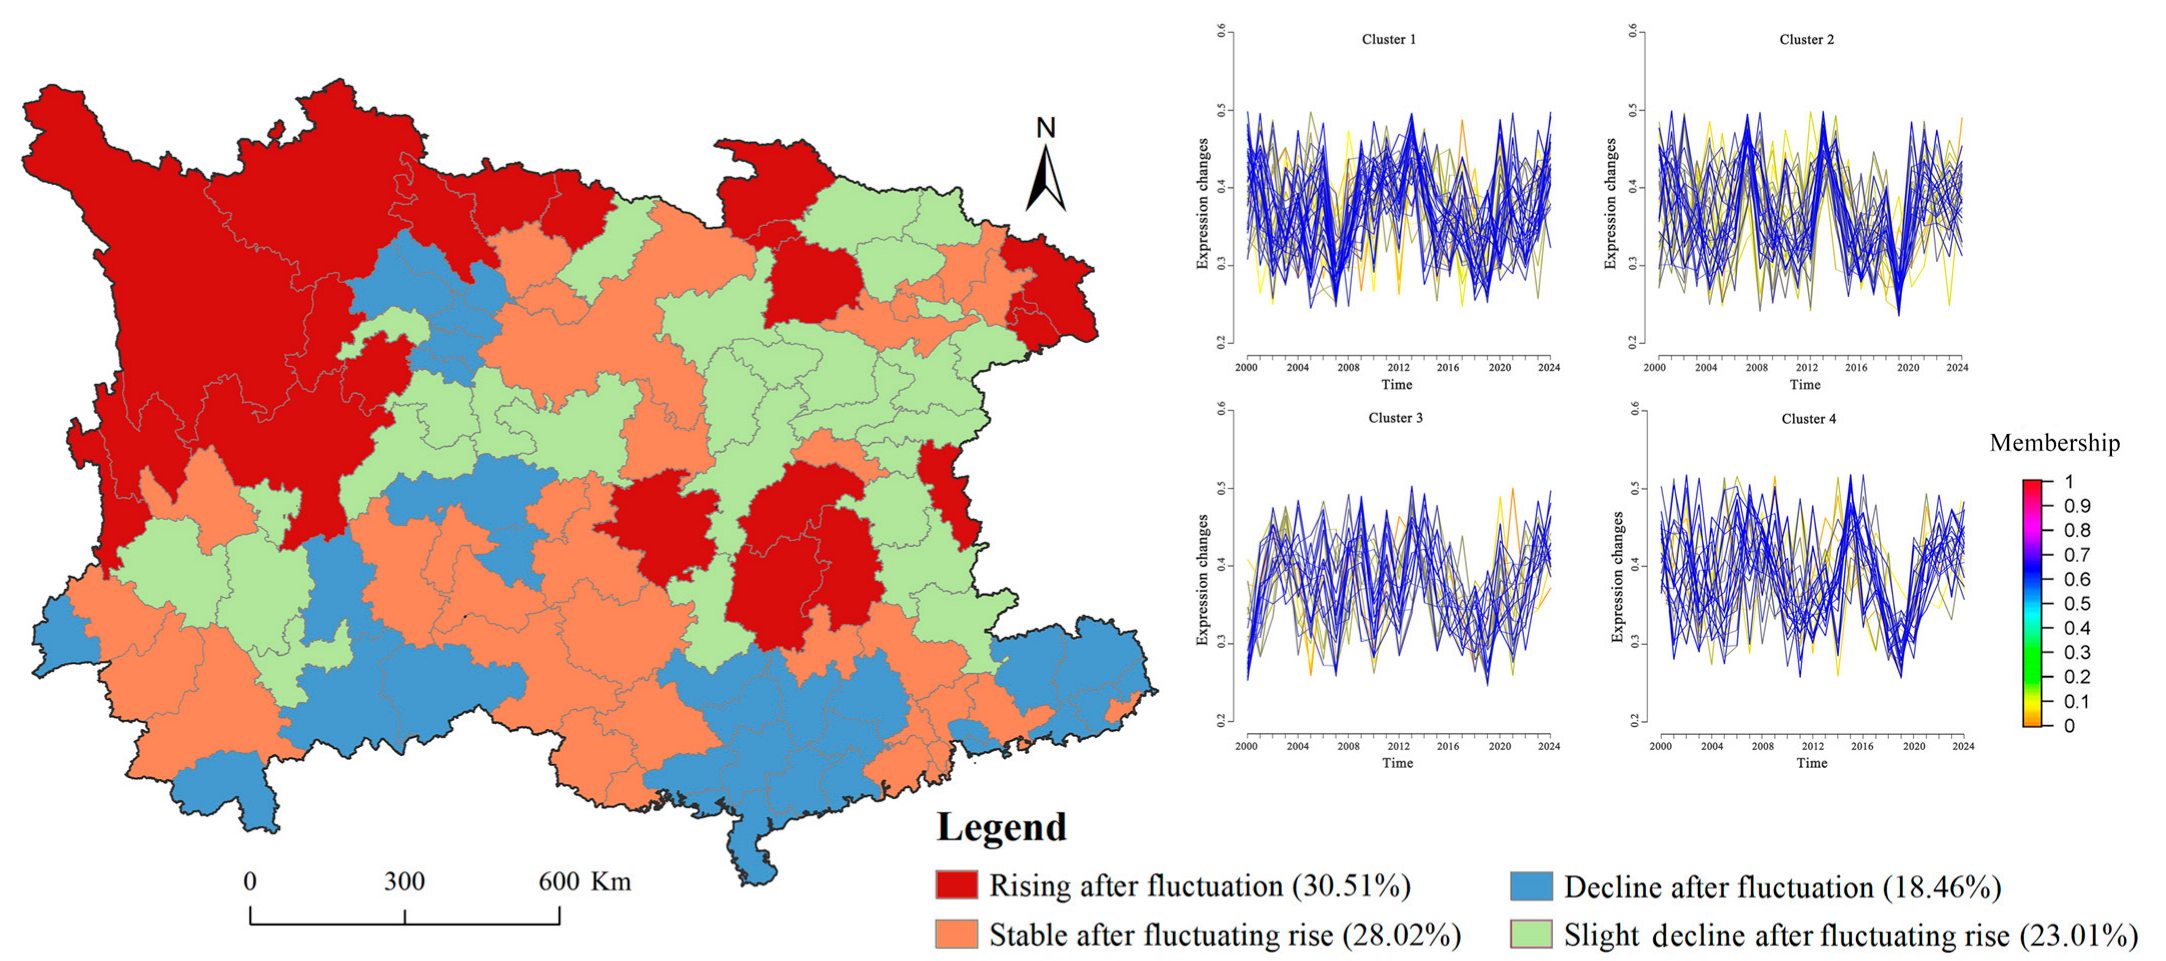
3.2. Temporal Evolution Pattern

To address potential analytical biases arising from spatial dependence in geographical data (Tobler’s First Law of Geography), this study employed the Global Moran’s I index for spatial autocorrelation diagnostics. The spatial weight matrix was defined as a binary matrix with a distance threshold of 10 km (set according to the median sample spacing to cover typical spatial interaction scales). Using Geoda 1.18, the calculated Moran’s I value was 0.15 (p = 0.12), indicating weak positive spatial autocorrelation that was not statistically significant (p > 0.05). Since the spatial autocorrelation did not pass the significance test, standard non-spatial methods were used for subsequent clustering and trend analysis, as their statistical assumptions were deemed acceptable.
The FCM clustering analysis revealed that the Silhouette Coefficient (SC) reached its maximum value of 0.652 when the number of clusters (k) was set to four, suggesting the tightest intra-cluster cohesion and optimal inter-cluster separation. Concurrently, the Xie–Beni (XB) index achieved its minimum value of 0.123 at k = 4, further validating the superior combined performance of intra-cluster compactness and inter-cluster distinctiveness. Ultimately, the temporal evolutionary pattern of the EHI at the urban scale within the study area was identified. (Figure 6), revealing four primary clusters comprising 21, 33, 33, and 28 cities, respectively. Cluster 1 (30.51% of the study area) exhibited a fluctuating rise followed by an increase, primarily distributed across Sichuan, Hubei, and Hunan. Its ecological environment fluctuated during economic transformation but gradually improved as the region achieved a transition from a resource-led to an investment-driven economy through active industrial restructuring. Cluster 2 (28.02%) stabilized after an initial fluctuating rise and was concentrated in Chongqing, Guangxi, and Guizhou. Characterized by plains with predominant arable land use, advancements in agricultural technology and sustainable practices led to gradual ecological improvement. However, ecological development was constrained by an inherent threshold in the ecological effects of arable land. Cluster 3 (18.46%) declined after fluctuations and was mainly distributed in Guangdong, Guangxi, and Yunnan. Despite ecological protection policies, financial, technological, and management limitations prevented these measures from fundamentally curbing ecological deterioration. Cluster 4 (23.01%), distributed mainly across Hunan with occurrences in other provinces, showed a slight decline after a fluctuating rise. While high-quality forest resources experienced minimal anthropogenic disturbance before 2020, recent mineral extraction and infrastructure development have damaged the original ecological environment, causing a slight decline in ecological quality.

3.3. Identification and Classification of ESAs

The dynamic pattern of ESAs in the study area from 2000 to 2024 is shown in Figure 7a–f. ESAs were concentrated primarily within the Hengduan Mountains and Lancang River Basin (Yunnan and Sichuan provinces), and the Nanling Mountains, Xuefeng Mountains, and Pearl River Basin (Guangdong and Guangxi provinces). Throughout the study period, ESAs predominantly comprised woodland (78.21% to 82.67%) and grassland (16.43% to 20.96%). In 2000, the level I and II EHI within ESAs accounted for 18.86% and 11.14% of the area, respectively; by 2024, these proportions changed to 19.90% and 10.10%. These changes indicate an increase in high-EHI ESAs and a decrease in low-EHI ESAs, the latter concentrated mainly in the Daba Mountains and Wushan Mountains (Hubei and Chongqing provinces).

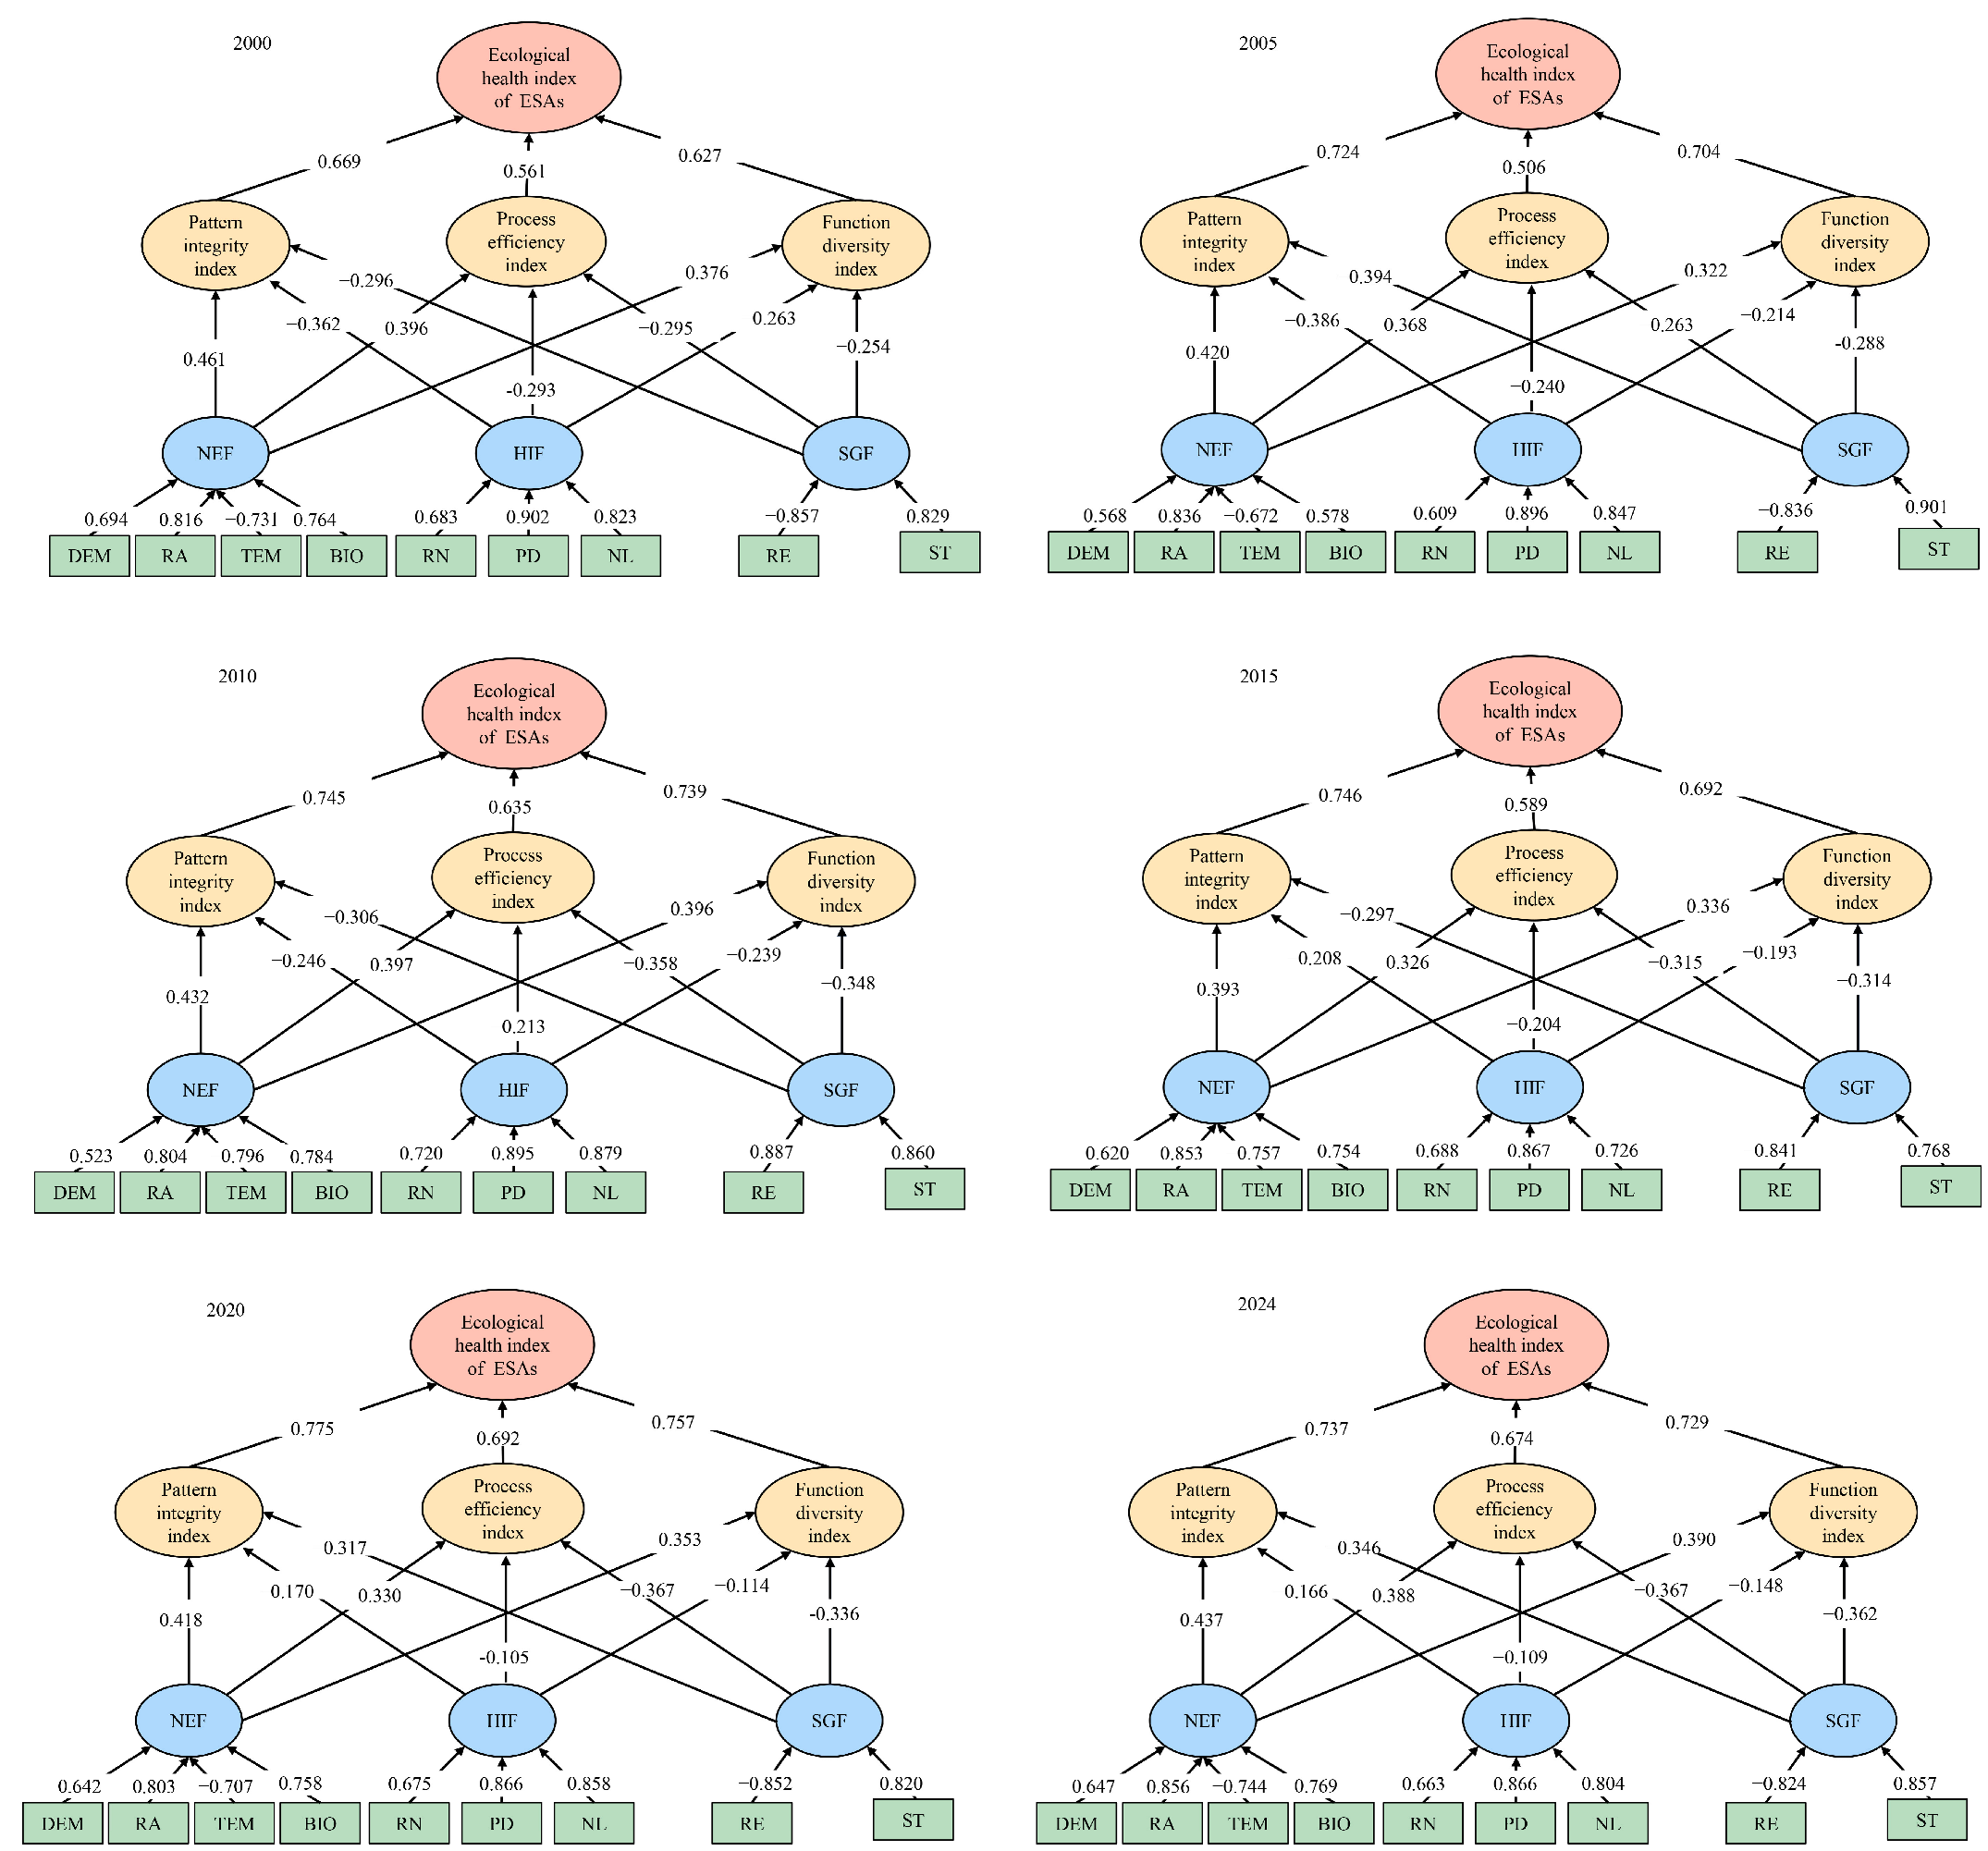
3.4. The Intensity and Pathways of the Driving Factors of the ESA Patterns

This study employed the OPLS model to identify primary drivers of ESAs’ dynamic patterns in the study area from 2000 to 2024 (Figure 8). Model validation confirmed robustness (Q2 and R2Y > 0.5), indicating a statistically sound regression model and sufficient precision for driving mechanism analysis. These results demonstrate that the nine selected factors comprehensively explain ESAs’ dynamics. At the 95% confidence interval, the ranges of explanatory power for these factors are as follows: the rock exposure rate (1.209–1.933), night light intensity (1.322–2.126), the biodiversity index (1.526–1.892), soil thickness (0.765–1.401), and population density (0.598–1.651). Notably, the rock exposure rate and night light intensity exerted pronounced and persistent effects on ESA patterns. Conversely, elevation, rainfall, and temperature exhibited comparatively lower explanatory power.
In this study, we extracted independent and dependent variable data for the SEM based on 1 km × 1 km grids, and randomly selected 1250 samples for analysis each year. The goodness-of-fit of the SEM model indicated that the chi-square to degrees of freedom ratio for each year ranged from 1.862 to 2.181, the Root Mean Square Error of Approximation (RMSEA) was between 0.035 and 0.046, and the Comparative Fit Index (CFI), the Incremental Fit Index (IFI), and the Normed Fit Index (NFI) were 0.921–0.965, 0.903–0.967, and 0.937–0.973, respectively. These statistics fell within acceptable ranges, suggesting a good match between the constructed model and the empirical data, thus confirming the model’s structural validity and explanatory power. At the 95% confidence interval, interactions among multiple drivers and impact pathways for ESAs (2000–2024) are shown in Figure 9. The SEM demonstrated reliable explanatory power for ESAs’ patterns, accounting for 86.2–90.6% of variance. ESAs’ patterns were driven by multiple factors with varying intensities and mechanisms. Notably, natural environmental factors generally exerted positive effects, while special geographical and human interference factors consistently negatively impacted ESAs. Path coefficients of natural environmental factors on pattern integrity and function diversity indexes remained consistently high during 2000–2024, underscoring their importance for ecosystem integrity and multifunctionality. Special geographical factors showed higher path coefficients for pattern integrity and process efficiency indexes, indicating greater impacts on ecosystem stability and efficiency. Overall, human interference’s negative impact gradually declined, whereas special geographical factors became the dominant negative driver, posing the greatest threat to ecosystems. In addition, the pattern integrity pathway most strongly influenced ESAs’ patterns.

4. Discussion

4.1. The Advantages of the Multi-Dimensional Ecological Health Assessment Framework Constructed

The high-precision measurement of ecological health is fundamental for identifying spatial and temporal variability in ESAs and serves as a prerequisite for reconciling conflicting interests in regional development while formulating efficient landscape planning [39]. However, prevailing ecological health assessments primarily focus on the rationality of existing landscape patterns or the observable outcomes of ecosystem services, neglecting underlying ecological mechanisms and thus yielding inconsistent evaluations. This study established a multidimensional ecological health assessment framework—pattern integrity–process efficiency–function diversity—based on elucidating the characteristics and mechanisms of ecosystem evolution. This approach enhances the scientific rigor and theoretical foundation for ecological restoration in karst environments. For indicator selection, the core dimensions of pattern integrity, process efficiency, and functional diversity specific to karst regions are rigorously defined. Targeted parameters and ecological model-based metrics that accurately capture the attributes of each dimension are then identified. Concurrently, information retention is maximized while the simplicity of indicator formulations is optimized to ensure practical utility and efficiency. To evaluate the robustness of the EHI and validate the stability of the weights derived from the entropy weight method, this study conducted a sensitivity analysis using Monte Carlo simulation. Under the constraint that the sum of all weights remained 1, uniform random perturbations within a 10% range were applied to the original entropy weights of each indicator, generating 5000 sets of random weights. The coefficient of variation (CV) of the EHI values for each region across the 5000 simulations was calculated. Additionally, the Spearman’s rank correlation coefficient ( ρ ) between the baseline EHI rankings (derived from the original entropy weight method) and the rankings after each perturbation was computed to assess the stability of regional rankings. The sensitivity analysis revealed that (1) the CV of EHI values for all regions was below 5% (mean = 3.2%), indicating that the EHI values were insensitive to weight fluctuations; and (2) the ρ between the baseline and perturbed rankings exceeded 0.9 (p < 0.001), confirming a high degree of stability in regional rankings. These results supported the robustness of the weight configuration generated by the entropy weight method. Although Jenks Natural Breaks Optimization effectively identified natural data clusters for classification, its results could be influenced by specific data distributions and lacked statistical significance testing. To assess the validity of EHI classification thresholds derived via this methodology, a one-way analysis of variance (ANOVA) was performed, followed by Tukey’s Honestly Significant Difference (HSD) post-hoc tests. The ANOVA results revealed highly significant differences in mean EHI values across classification levels (p < 0.001). Post-hoc testing further confirmed statistically significant differences in the mean EHI between all adjacent levels (all p < 0.05). This indicated that the five-level thresholds established in this study effectively distinguished areas with significantly different EHI values. Consequently, the resulting assessment will provide a scientific basis for precisely delineating ESAs, supporting practical conservation efforts.

4.2. Spatiotemporal Dynamics of Ecological Health Based on Long-Term Assessment

From 2000 to 2024, the mean EHI across the study area exhibited an increasing trend, with improved spatial distribution balance. Hurst index analysis suggested that, under current development patterns, EHI trends are likely to persist long-term in most regions. This trajectory aligns with China’s intensified ecological policies since 2000, including natural forest protection, farmland-to-forest/grassland conversion, grassland subsidy awards, southwestern water resource governance, and ecological red line delineation. Subsequent initiatives, notably the 2015 Ecological Civilization concept and green poverty alleviation policy, further prioritized sustainable development [40]. Collectively, these measures have significantly reduced soil erosion and desertification, enhanced forest coverage and water conservation, and fostered broad ecological recovery.
High-EHI regions were clustered predominantly in the Hengduan Mountains and the Nanling Range. Critically, time-series cluster analysis classified most of these zones as exhibiting “decline after fluctuation”, signaling emerging vulnerability. While complex topography and biodiversity historically fostered resilient ecosystems supporting rare species, recent large-scale mining and mountainous terraced agriculture in Yunnan, Guizhou, and Guangxi have degraded native habitats. This fluctuation-then-decline trajectory suggests a delayed implementation of conservation measures at local levels, where economic pressures intensify conservation-development conflicts despite national policies [41]. The institutional gap effectively creates a “discount” on policy efficacy, permitting ongoing ecological degradation. Stricter enforcement and optimized development models are urgently needed to counteract this trend.
Conversely, low-EHI regions in the Daba Mountains showed sustained improvement via Sen’s slope and CMK tests. This recovery correlates with a regional socioeconomic shift: economies transitioned from resource dependency toward green development, diversifying local incomes and reducing overexploitation pressure. Concurrently, heightened environmental awareness and broader societal engagement in conservation have reinforced ecological gains [42,43]. Thus, the synergy of structural economic transformation and societal value shifts has collectively facilitated environmental remediation in these areas.

4.3. Drivers of ESAs in Karst Landscapes: Natural Benefits, Mitigating Human Impact, and Intensifying Geographic Challenges

Natural environmental conditions, particularly rainfall and temperature, fundamentally shape ecosystem composition, structure, and distribution. Our OPLS-SEM coupled model analysis revealed that natural factors exert a dominant positive influence on ESAs’ dynamics, with rainfall emerging as the strongest driver. This prominence likely reflects the study area’s significant monsoon climate influence. Adequate rainfall provides essential moisture for plant growth, enhancing vegetation cover and biodiversity, while also replenishing water resources and maintaining watershed ecosystem stability [21]. However, the region’s karst geology critically modifies water-related benefits [15]. Enhanced surface water–groundwater interactions in karst systems facilitate pollutant migration and diffusion. Furthermore, deep karst reservoirs exhibit stratification structures and pollution dynamics distinct from natural shallow lakes [28]. These systems demonstrate poor self-purification capacity and are highly susceptible to seepage. Consequently, effective water pollution control is paramount for ESAs’ integrity, given karst’s inherent vulnerability.
The analysis further identified human interference factors, primarily mediated through landscape pattern integrity degradation, as negatively impacting ESAs. Construction land expansion (increasing by 6951.45 km2 between 2000 and 2015) intensified resource and spatial demands, driving landscape fragmentation [14]. Notably, the negative influence of anthropogenic disturbance has diminished since 2015. This trend underscores the importance of strengthening and maintaining robust land use management policies to further mitigate human impacts on ESAs.
By contrast, the negative impact of special geographic factors—notably, widespread rocky desertification and a complex geological background—exhibits a persistent increase. These factors create negative feedback loops, constraining regional economic development and heightening the urgency for integrated socio-ecological sustainability. Current rocky desertification management faces a critical challenge: overly ambitious ecological construction initiatives outpace foundational scientific research [15]. Failure to shift from traditional, single-factor ecological governance toward systematic and comprehensive regulation risks undermining both karst ecological restoration goals and the broader national “Beautiful China” strategy. This necessitates a paradigm shift in managing Southwest China’s karst landscapes [14].

4.4. Management Recommendations for Ecological Conservation in Southwestern China

Building on recent updates to global ecological assessments, approximately 60% of the ecosystem services evaluated by the Millennium Ecosystem Assessment (MEA) remain in a state of degradation or unsustainable use, underscoring the escalating risks to human welfare posed by ecosystem decline [13]. This study illuminates the spatiotemporal patterns of ESAs in Southwest China’s karst regions, identifying two primary clusters: the Hengduan Mountain Range and Lancangjiang, alongside the Nanling and Xuefeng Mountain Ranges and Pearl River. These geographically distinct hotspots demand heightened protection to prevent anthropogenic disruptions that could exacerbate service losses. With the spatial overlay of the EHI, low-EHI ESAs concentrate in the Daba–Wushan mountainous corridor of the study area’s northern tier. This spatial mismatch—where ecologically vulnerable zones coincide with essential service provision—highlights the urgency for targeted interventions. Such areas, characterized by marginal ecological resilience, should be prioritized in regional planning frameworks, particularly within China’s ecological red-line policy, to prevent degradation and facilitate systematic restoration.
Mechanistic analysis uniquely identifies the rock exposure rate as the most significant negative driver—a finding that underscores the distinctive ecological dynamics of karst systems and represents a key departure from conventional assessments. This reflects the core, karst-specific desertification challenge: soil formation rates are substantially lower than erosion rates [12]. Traditional erosion risk assessments—which assume that low soil loss equates to low risk—have inadvertently exacerbated degradation in karst areas. Consequently, region-specific soil erosion classification standards and risk evaluation methodologies, calibrated to local pedogenic rates, are urgently needed, such as implementing a three-tier risk matrix (high/medium/low) based on rock exposure thresholds (e.g., >30% exposure designating high risk). Furthermore, neglecting the ecological compensation role of rock weathering carbon sinks (CO2, 57.79–64.52 Mt in China) and soil formation processes in sustaining vegetation photosynthetic carbon sinks (CO2, 0.70–0.95 Mt/a−1) critically aggravates rocky desertification [12,41]. To address this, we propose establishing a carbon sink monitoring network that integrates ground-based LiDAR for rock weathering measurements and satellite remote sensing for vegetation NPP estimation, with the goal of enhancing combined sink capacity by 15% within a 5-year period. These interconnected sinks are essential for achieving carbon neutrality.
Critically, successful desertification management must transcend singular metrics like vegetation cover. Holistic ecosystem recovery requires the integration of multi-dimensional effectiveness indicators, such as combining vegetation biomass (e.g., >1.5 kg/m2), the soil organic carbon content (>2%), and rock surface stability indices (e.g., using GPS-based microtopography monitoring) to avoid unintended consequences from overemphasizing vegetation expansion or area reduction. Rocky desertification involves complex soil–rock–water sphere interactions [16]. Thus, it is advocated to implement a cross-sphere management framework comprising (1) targeted soil reinforcement through bioengineering techniques (e.g., vetiver grass barriers) in high-exposure zones; (2) adaptive water management via karst aquifer recharge modeling; and (3) policy incentives for integrated land use, such as carbon credit schemes linking rock weathering and vegetation restoration efforts—precisely managing cross-sphere feedbacks to enhance restoration capacity.

4.5. Limitations and Future Research Directions

This study provides a long-term, multidimensional assessment framework that quanitifes ESAs’ spatiotemporal dynamics and driving mechanisms in fragile karst ecosystems. However, there were still some limitations. Firstly, hydrological–geological data deficiency, especially for subsurface systems, constrains the comprehensiveness of process efficiency evaluation. Secondly, the OPLS-SEM model, while robust, simplifies the complex, non-linear feedback loops between ecological components and drivers—particularly transient thresholds under extreme climate events—and is constrained by recognized gaps in subsurface hydrological data. Future studies should integrate proxy parameters (e.g., the bedrock exposure rate, sinkhole distribution, spring discharge variability) to mitigate data limitations. Finally, priority must be given to developing coupled rock–water–bio-atmosphere models to enhance ESA resilience prediction and management effectiveness.

5. Conclusions

Characterizing the spatiotemporal differentiation of ESAs and identifying the strengths and pathways of their drivers is fundamental to ecological conservation and management. In this study, a multidimensional ecological health assessment was constructed in Southwest China with typical karst. Based on this, ESAs in the study area were identified, and OPLS-SEM was used to determine the strengths and pathways of ESAs’ drivers. The main conclusions are as follows: (1) From 2000 to 2024, the ecological quality of the study area gradually improved, with a high EHI in southern Guangdong and most of Yunnan, showing a long-term pattern of superiority, and a low EHI in the Sichuan Basin and eastern Hubei without a long-term trend, which suggests that through the scientific management of ecosystems, the ecological environment can be improved. (2) At the county scale, the EHI development pattern consisted of four clusters: rising after fluctuation, stable after fluctuating rise, decline after fluctuation, and slight decline after fluctuating rise. (3) The ESAs were mainly concentrated in the Hengduan Mountains and Lancang River Basin (Yunnan and Sichuan provinces), and the Nanling Mountains, Xuefeng Mountains, and Pearl River Basin (Guangdong and Guangxi provinces), with the proportion of high-EHI ESAs increasing while low-EHI ESAs constantly declined, and low-level ESAs, which should be prioritized for conservation. (4) The ESAs in the study area were mainly determined by natural environmental factors, with the negative impact of human interference factors decreasing, but the negative impact of special geographic environmental factors gradually increasing, and the rock exposure rate becoming the most dominant negative driving factor. (5) The development of targeted soil erosion classification and grading standards and risk assessment methods, the establishment of techniques for accurate measurement and capacity enhancement of rock weathering carbon sinks and vegetation photosynthesis carbon sinks, and the development of new indicators for assessing the effectiveness of karst desertification management are effective strategies for improving the quality of ESAs and the regional ecological environment.

Author Contributions

Y.G.: software, validation, writing—original draft, and writing—review and editing. S.S.: validation, software, project administration, and funding acquisition. X.Z.: conceptualization and resources. All authors have read and agreed to the published version of the manuscript.

Funding

This research was funded by the Guizhou Provincial Basic Research Program (Natural Science) (Qiankehe Basic-zk [2025] general 588), the Youth Guidance Project of Guizhou Basic Research Program (Natural Sciences) (Guizhou Science Foundation [2024] Youth 134), and the Guizhou University Introduced Talents Scientific Research Project (Guizhou University Renjihezi (2023) 34 Natural Science).

Data Availability Statement

The datasets used and analyzed in this study are available from the corresponding author upon reasonable request.

Conflicts of Interest

The authors declare that they have no known competing financial interests or personal relationships that could have appeared to influence the work reported in this paper.

References

  1. Choi, C.-Y.; Shi, X.; Shi, J.; Gan, X.; Wen, C.; Zhang, J.; Jackson, M.V.; Fuller, R.A.; Gibson, L. China’s Ecological Conservation Redline policy is a new opportunity to meet post-2020 protected area targets. Conserv. Lett. 2022, 15, e12853. [Google Scholar] [CrossRef]
  2. Ni, Y.; Wei, J.; Wu, T.; Guo, M.; Han, Q.; Zhang, M. Mapping and assessing ecosystem service supply-demand to identify critical areas: A case study of a waterside area in Shanghai metropolitan area. Front. Earth Sci. 2022, 10, 943910. [Google Scholar] [CrossRef]
  3. Liu, M.; Liu, X.; Huai, H.; Tang, X. Evaluation of the Potential for Territorial Ecological Restoration: A Case Study of Zhaoping County, China. Land 2023, 12, 1966. [Google Scholar] [CrossRef]
  4. Zhao, Y.; Xing, L.; Mao, X.; Huang, S.; Duan, K. Biomass burning in Peninsular Southeast Asia intensifies meteorological drought in Southwest China. Sci. Total Environ. 2024, 951, 175788. [Google Scholar] [CrossRef] [PubMed]
  5. Ma, D.; Tian, J.; Fu, S.; Liang, Q.; Li, J. Geological Environment and Controlling Factors of Panlongdong Karst Cave in Northeastern Sichuan Basin. Energies 2023, 16, 5514. [Google Scholar] [CrossRef]
  6. Jia, L.; Meng, Y.; Li, L.; Yin, R. A multidisciplinary approach in cover-collapse sinkhole analyses in the mantle karst from Guangzhou City (SE China). Nat. Hazard. 2021, 108, 1389–1410. [Google Scholar] [CrossRef]
  7. Li, C.; Yang, H.; Wang, Z.; Yan, S. Evaluating the Implementation of Ecological Control Line Planning (ECLP): A Case Study of Wuhan Metropolitan Development Zone. Land 2024, 13, 926. [Google Scholar] [CrossRef]
  8. Huang, X.; Ye, Y.; Zhao, X.; Guo, X.; Ding, H. Identification and stability analysis of critical ecological land: Case study of a hilly county in southern China. Ecol. Indic. 2022, 141, 109091. [Google Scholar] [CrossRef]
  9. Li, J.; Liu, Y.; Gani, A.A.; Wu, J.; Dai, Y. Identification of Ecological Security Patterns for the Qiandongnan Ecotourism Area in Southwest China Using InVEST and Circuit Theory. Forests 2023, 14, 1316. [Google Scholar] [CrossRef]
  10. Pandey, S.; Mohapatra, G.; Arora, R. Groundwater quality, human health risks and major driving factors in arid and semi-arid regions of Rajasthan, India. J. Clean. Prod. 2023, 427, 139149. [Google Scholar] [CrossRef]
  11. Shahfahad; Naikoo, M.W.; Talukdar, S.; Das, T.; Rahman, A. Identification of homogenous rainfall regions with trend analysis using fuzzy logic and clustering approach coupled with advanced trend analysis techniques in Mumbai city. Urban. Clim. 2022, 46, 101306. [Google Scholar] [CrossRef]
  12. Zeng, C.; Liu, Z.; Yang, J.; Yang, R. A groundwater conceptual model and karst-related carbon sink for a glacierized alpine karst aquifer, Southwestern China. J. Hydrol. 2015, 529, 120–133. [Google Scholar] [CrossRef]
  13. Bai, G.; Deng, Y.; Chen, M.; Zhu, L.; Tuo, Y.; Nie, M.; Zhu, J.; Wang, X. Spatiotemporal evolution of runoff and sediment and their dominant driving factors in the Lower Jinsha River basin. Sci. Total Environ. 2024, 951, 175484. [Google Scholar] [CrossRef] [PubMed]
  14. Ma, T.; Chen, W.; Cai, Q.; Dong, Z.; Wang, L.; Hu, P.; Gao, L.; Garfinkel, C.I. Attribution analysis of the persistent and extreme drought in southwest China during 2022–2023. Environ. Res. Lett. 2024, 19, 114056. [Google Scholar] [CrossRef]
  15. Li, C.; Zhang, C.; Yu, T.; Liu, X.; Xia, X.; Hou, Q.; Yang, Y.; Yang, Z.; Wang, L. Annual net input fluxes of cadmium in paddy soils in karst and non-karst areas of Guangxi, China. J. Geochem. Explor. 2022, 241, 107072. [Google Scholar] [CrossRef]
  16. Kan, Y.; Shao, H.; Du, C.; Guo, Y.; Dai, X. Comparison of the Distribution of Evapotranspiration on Shady and Sunny Slopes in Southwest China. Remote Sens. 2024, 16, 4310. [Google Scholar] [CrossRef]
  17. Pan, L.; Gan, W.; Chen, J.; Ren, K. An Integrated Model for Constructing Urban Ecological Networks and Identifying the Ecological Protection Priority: A Case Study of Wujiang District, Suzhou. Sustainability 2023, 15, 4487. [Google Scholar] [CrossRef]
  18. Wang, F.; Gao, H.; Liu, J.; Fu, T.; Qi, F.; Gao, Y.; Zhao, L. Study on the Characteristics of Ecological Network and Critical Areas of Ecological Restoration in Hebei-Tianjin Coastal Wetlands. Wetlands 2024, 44, 1–13. [Google Scholar] [CrossRef]
  19. Zhang, Y.; Zhao, Z.; Zhu, J.; Wang, Y.; Wang, H.; Fu, B.; Lue, Y.; Jiang, W.; Hu, Y.; Wu, X. The dynamic patterns of critical ecological areas in the Yellow River Basin are driven primarily by climate factors but threatened by human activities. J. Environ. Manag. 2024, 371, 123282. [Google Scholar] [CrossRef] [PubMed]
  20. Rani, A.; Sinha, N.K.; Jyoti, B.; Kumar, J.; Kumar, D.; Mishra, R.; Singh, P.; Mohanty, M.; Jayaraman, S.; Chaudhary, R.S.; et al. Spatiotemporal Variations in Near-Surface Soil Water Content across Agroecological Regions of Mainland India: 1979–2022 (44 Years). Remote Sens. 2024, 16, 3108. [Google Scholar] [CrossRef]
  21. Cao, X.; Xu, Y.; Li, M.; Fu, Q.; Xu, X.; Zhang, F. A modeling framework for the dynamic correlation between agricultural sustainability and the water-land nexus under uncertainty. J. Clean. Prod. 2022, 349, 131270. [Google Scholar] [CrossRef]
  22. Chen, T.; Zou, L.; Xia, J.; Liu, H.; Wang, F. Decomposing the impacts of climate change and human activities on runoff changes in the Yangtze River Basin: Insights from regional differences and spatial correlations of multiple factors. J. Hydrol. 2022, 615, 128649. [Google Scholar] [CrossRef]
  23. Li, W.; Kang, J.; Wang, Y. Integrating ecosystem services supply-demand balance into landscape ecological risk and its driving forces assessment in Southwest China. J. Clean. Prod. 2024, 475, 143671. [Google Scholar] [CrossRef]
  24. He, K.; Jia, Y.; Chen, W.; Wang, R.; Luo, H. Evaluation of karst collapse risks induced by over-pumping and karst groundwater resource protection in Zaozhuang region, China. Environ. Earth Sci. 2014, 71, 3443–3454. [Google Scholar] [CrossRef]
  25. Shi, X.; Zhao, X.; Pu, J.; Huang, P.; Gu, Z.; Chen, Y. Evolution Modes, Types, and Social-Ecological Drivers of Ecologically Critical Areas in the Sichuan-Yunnan Ecological Barrier in the Last 15 Years. Int. J. Environ. Res. Public Health 2022, 19, 9206. [Google Scholar] [CrossRef] [PubMed]
  26. Shi, R. Ecological Environment Problems of the Three Gorges Reservoir Area and countermeasures. In Proceedings of the 2011 3rd International Conference on Environmental Science and Information Application Technology ESIAT, Beijing, China, 18–19 June 2011; pp. 1431–1434. [Google Scholar]
  27. Chu, X.F.; Yu, S.; Wei, K.X. Analysis of the influence of stratum on karst development features: Taking Longtan river basin in Youyang County as an example. In Proceedings of the 6th International Conference on Water Resource and Environment, Tokyo, Japan, 23–26 August 2020. [Google Scholar]
  28. Dong, H.; Dan, Y.; Liang, J.; Liang, B.; Nie, G.; Ji, S. A Hypogene Karst Development Pattern Controlled by the Deep-Cycle of Groundwater in the Syncline in Huanjiang, Guangxi, China. Water 2021, 13, 199. [Google Scholar] [CrossRef]
  29. Galeana-Pizana, J.M.; Morales-Martinez, G.; Perevochtchikova, M. Forest fates: Unraveling the peri-urban social-ecological trajectories in Mexico City’s conservation land. Ambio 2024, 53, 1768–1782. [Google Scholar] [CrossRef] [PubMed]
  30. Hou, L.; Su, Z.; Wei, L.; Wei, X.; Zhang, C.; Fu, S.; Han, Y.; Ren, J.; Chen, H. Residual carbonate karst reservoir reconstructed by karst planation: A case study of Ordovician paleokarst reservoir characterization in Ordos Basin, North China. Geoenergy Sci. Eng. 2024, 233, 212508. [Google Scholar] [CrossRef]
  31. Zhao, W.; Ma, J.; Liu, Q.; Song, J.; Tysklind, M.; Liu, C.; Wang, D.; Qu, Y.; Wu, Y.; Wu, F. Comparison and application of SOFM, fuzzy c-means and k-means clustering algorithms for natural soil environment regionalization in China. Environ. Res. 2023, 216, 114519. [Google Scholar] [CrossRef] [PubMed]
  32. Zhang, Y.; Wang, Y.; Fu, B.; Lu, Y.; Liang, X.; Yang, Y.; Ma, R.; Yan, S.; Wu, X. Identification of critical ecological areas using the ecosystem multifunctionality-stability-integrity framework: A case study in the Yellow River basin, China. J. Environ. Manag. 2023, 348, 119296. [Google Scholar] [CrossRef] [PubMed]
  33. Wang, D.; Huang, X.; Shi, L.; Yang, H.; Sun, W. The identification and efficiency evaluation of industrial parcels by integrating multi-source spatial data in Shenzhen, South China. GISci. Remote Sens. 2024, 61, 1–22. [Google Scholar] [CrossRef]
  34. Jiang, X.; Lei, M.; Zhao, H. Review of the advanced monitoring technology of groundwater-air pressure (enclosed potentiometric) for karst collapse studies. Environ. Earth Sci. 2019, 78, 701. [Google Scholar] [CrossRef]
  35. Liu, Y.; Weng, Q. Impacts of 2D/3D building morphology on vegetation greening trends in Hong Kong: An urban-rural contrast perspective. Urban. For. Urban. Green. 2025, 104, 128624. [Google Scholar] [CrossRef]
  36. Ma, J.; Li, L.; Jiao, L.; Zhu, H.; Liu, C.; Li, F.; Li, P. Identifying Ecological Security Patterns Considering the Stability of Ecological Sources in Ecologically Fragile Areas. Land 2024, 13, 214. [Google Scholar] [CrossRef]
  37. Shao, S.; Yang, Y. Identification of ecological improvement zones in different ecological functional zones in northwest Hubei, China. Ecol. Indic. 2023, 155, 111032. [Google Scholar] [CrossRef]
  38. Mondal, S.; Das, S.; Vrana, V.G. Exploring the Role of Artificial Intelligence in Achieving a Net Zero Carbon Economy in Emerging Economies: A Combination of PLS-SEM and fsQCA Approaches to Digital Inclusion and Climate Resilience. Sustainability 2024, 16, 10299. [Google Scholar] [CrossRef]
  39. Tian, G.; Lin, T.; Li, W.; Gao, Y.; Xu, T.; Zhu, W. Spatial-temporal characteristics and transfer modes of rural homestead in China. Habitat Int. 2025, 155, 103230. [Google Scholar] [CrossRef]
  40. Zhang, F.; Xie, C.; Liu, H.; Zhou, T.; Shan, B.; Chen, J. Ecological conservation redline delineation in flood detention areas: A case study in Anxiang County, Yangtze River Basin, China. J. Clean. Prod. 2024, 462, 142662. [Google Scholar] [CrossRef]
  41. Wu, Y.; Song, S.; Chen, X.; Shi, Y.; Cui, H.; Liu, Y.; Yang, S. Source-specific ecological risks and critical source identification of PPCPs in surface water: Comparing urban and rural areas. Sci. Total Environ. 2023, 854, 158792. [Google Scholar] [CrossRef] [PubMed]
  42. Xin, Y.; Zhao, C.; Li, B.; Liu, X.; Gao, Y.; Lou, J. Activation of Ms 6.9 Milin Earthquake on Sedongpu Disaster Chain, China with Multi-Temporal Optical Images. Remote Sens. 2024, 16, 4003. [Google Scholar] [CrossRef]
  43. Xu, Y.; Liao, Z.; Liu, J.; Liu, C.; Li, Y. Unirrigated extensive green roofs in humid subtropics-Plant selection and substrate design for low maintenance and climate resilience. Urban. For. Urban. Green. 2024, 101, 128554. [Google Scholar] [CrossRef]
Figure 1. Schematic of study area. (a) Spatial distribution of karst in China; (b) elevation of study area; and (c) land use/cover in 2020.
Land 14 01487 g001
Figure 2. A flowchart of the present research.
Land 14 01487 g002
Figure 3. Analysis of EHI temporal evolution from 2000 to 2024.
Land 14 01487 g003
Figure 4. Spatial distribution of EHI levels from 2000 to 2024.
Land 14 01487 g004
Figure 5. (a) The changing trends of the EHI from 2000 to 2024; (b) the spatial distribution of the Hurst index from 2000 to 2024.
Land 14 01487 g005
Figure 6. Spatial distribution of different evolution patterns of EHI.
Land 14 01487 g006
Figure 7. Spatial and temporal dynamics of ecological strategic areas in southwest China from 2000 to 2024.
Land 14 01487 g007
Figure 8. The explanatory power of driving factors of the ecological health index in the ecological strategy areas (DEM: elevation; RA: rainfall; TEM: temperature; BIO: biodiversity index; RN: road network density; PD: population density; NL: night light intensity index; RE: rock exposure rate; ST: soil thickness).
Land 14 01487 g008
Figure 9. The relationship between the variables and the ecological health index of the ecological strategic area from 2000 to 2024 (all paths p ≤ 0.01).
Land 14 01487 g009
Table 1. Details of the data.
Date TypeSourceRemark
Land use remote sensing data from 2000 to 2024Geospatial Data Cloudhttps://www.gscloud.cn/
Digital elevation model (DEM)
Boundaries of administrative districtsResource and Environmental Science Data Center, Chinese Academy of Scienceshttp://www.resdc.cn
Net primary productivity of vegetation (NPP) from 2000 to 2024
Population density data from 2000 to 2024
DMSP-OLS night light data
Rock exposure rateGuizhou Province Stone Desertification Survey DatabaseGuizhou Provincial Forestry Bureau
Soil dataHarmonized World Soil Database (HWSD)https://data.tpdc.ac.cn/zh-hans/ (accessed on 1 August 2024)
Hydrological data from 2000 to 2024National Meteorological Science Data Centerhttps://data.cma.cn/
Road dataOpen Street Maphttp://www.Openstreetmap.org/
Biodiversity dataProvincial biodiversity assessment reports and Bentai Wan et al.http://www.biodiversity-science.net
Disclaimer/Publisher’s Note: The statements, opinions and data contained in all publications are solely those of the individual author(s) and contributor(s) and not of MDPI and/or the editor(s). MDPI and/or the editor(s) disclaim responsibility for any injury to people or property resulting from any ideas, methods, instructions or products referred to in the content.

