
Multi-Scenario Simulation of Ecosystem Service Value in Xiangjiang River Basin, China, Based on the PLUS Model


Abstract
1. Introduction
1.1. An Overview of the Study Area and Data Sources
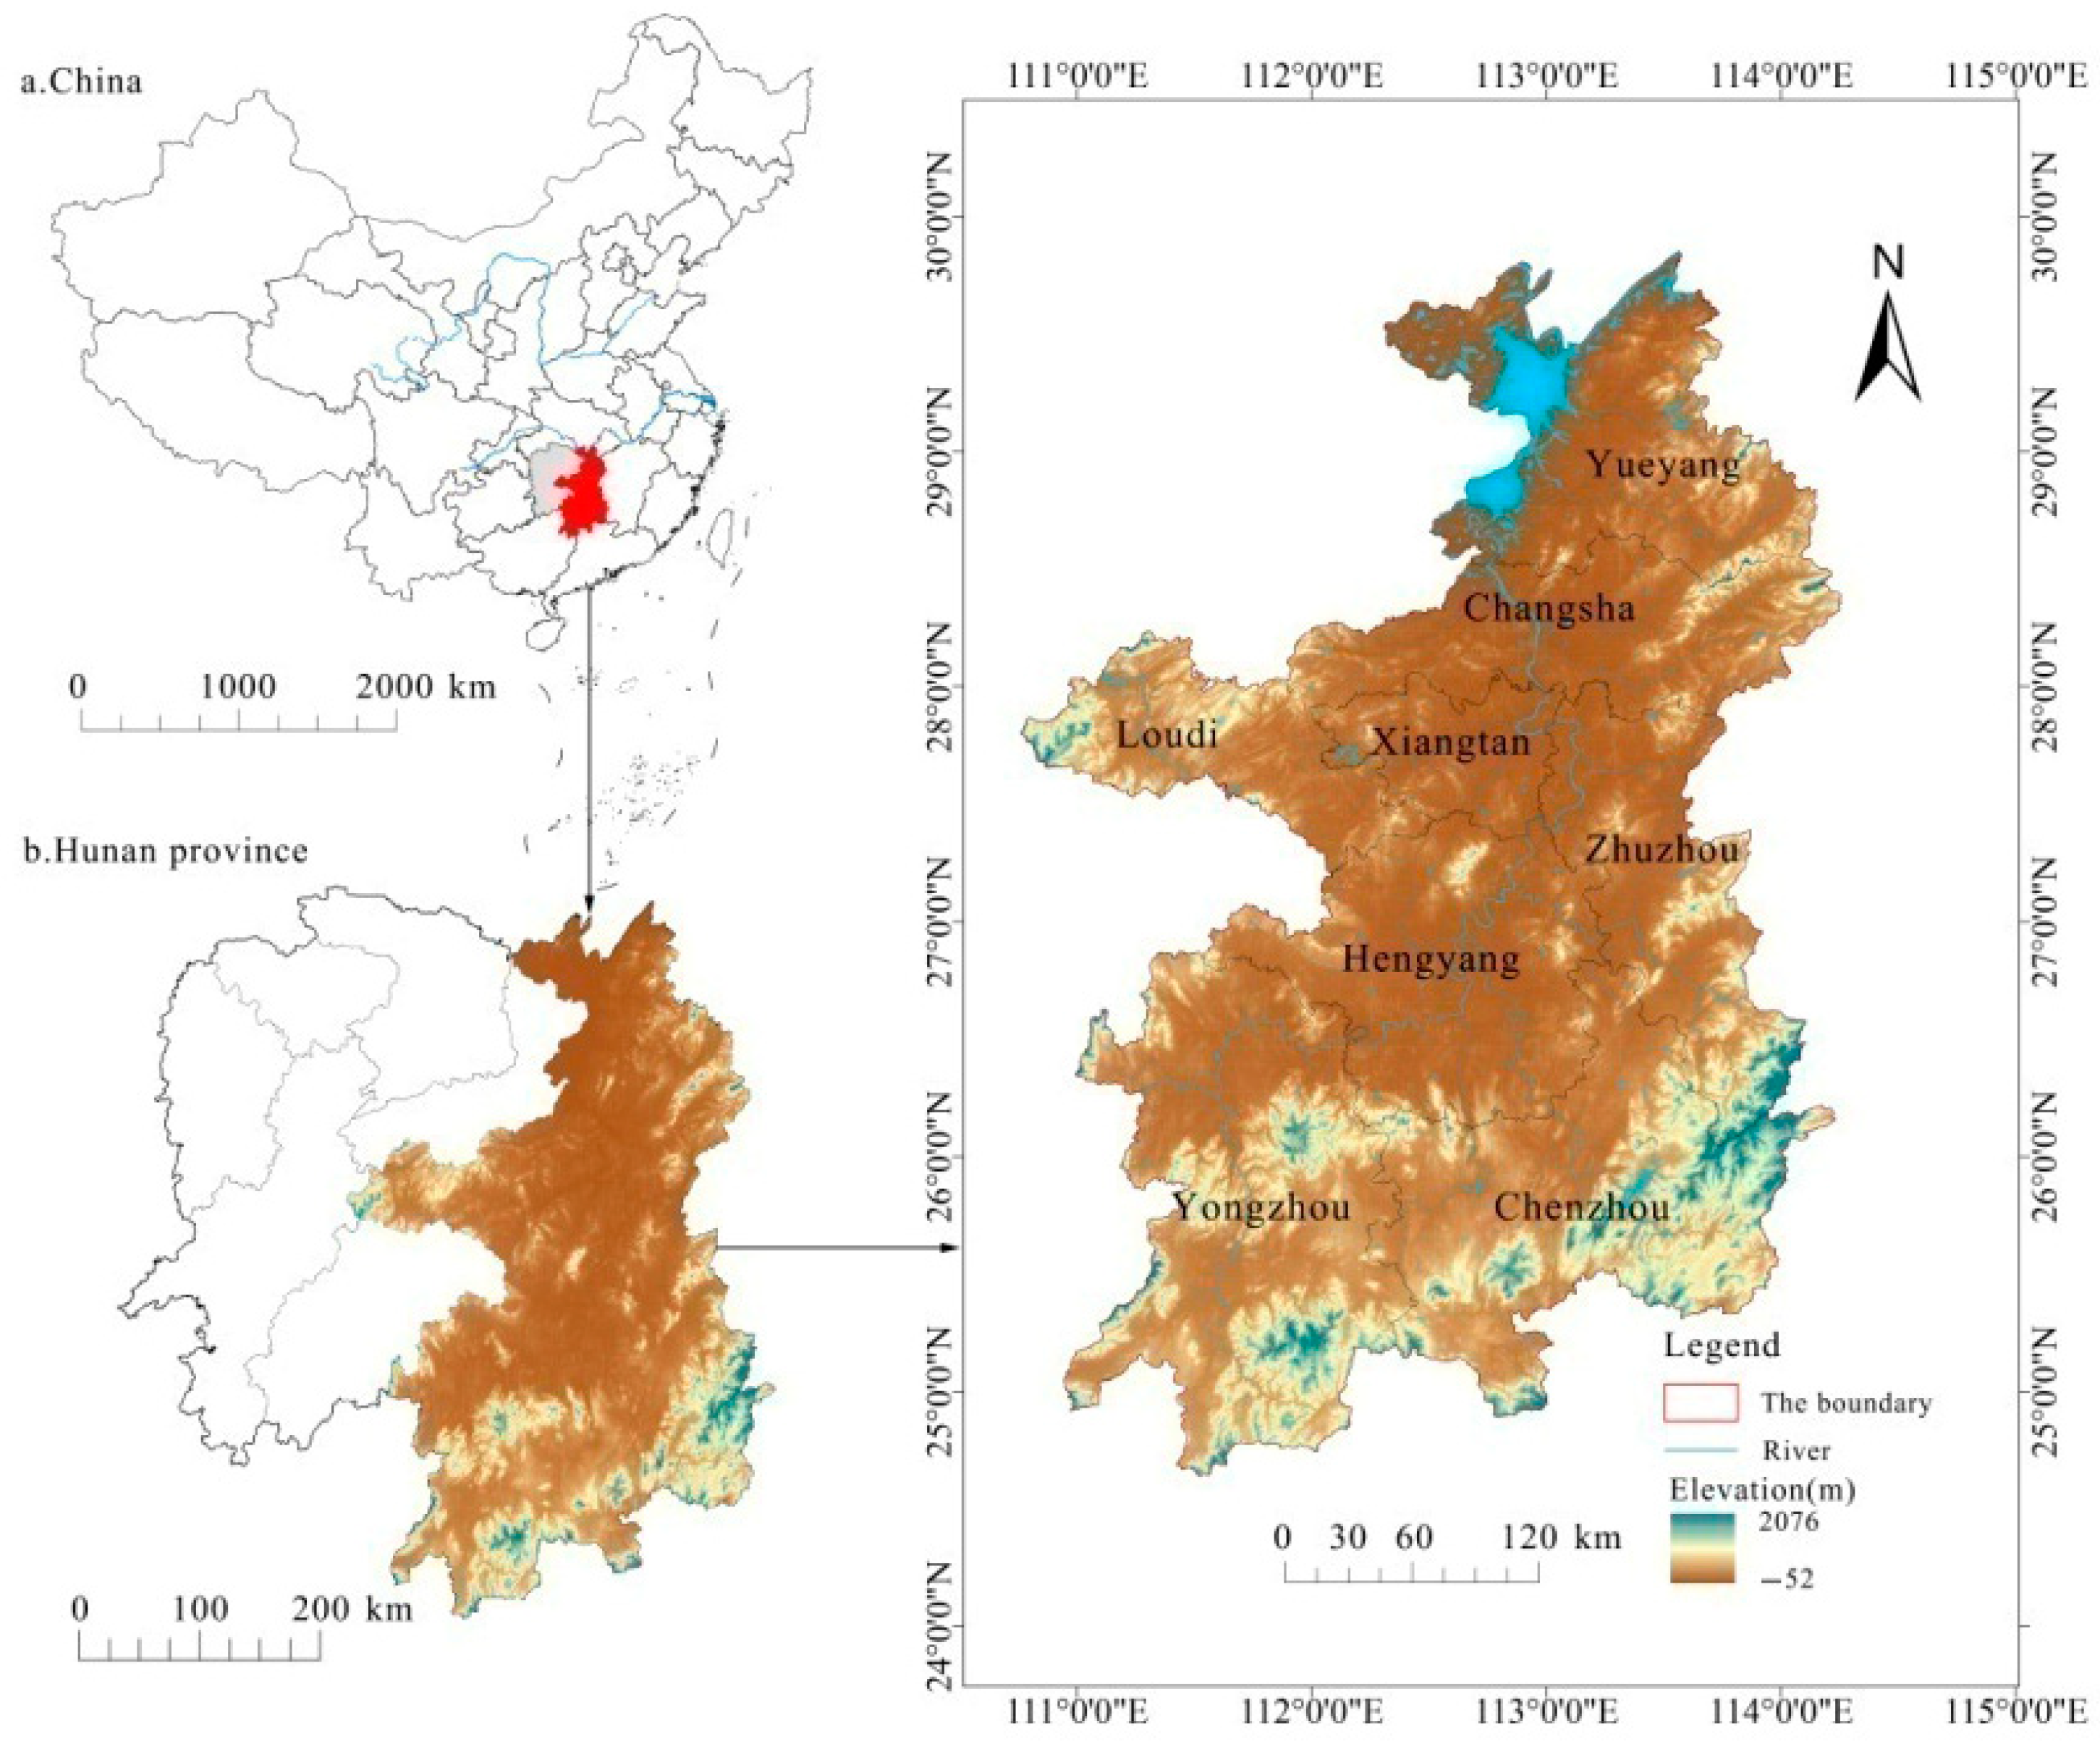
1.1.1. An Overview of the Study Area
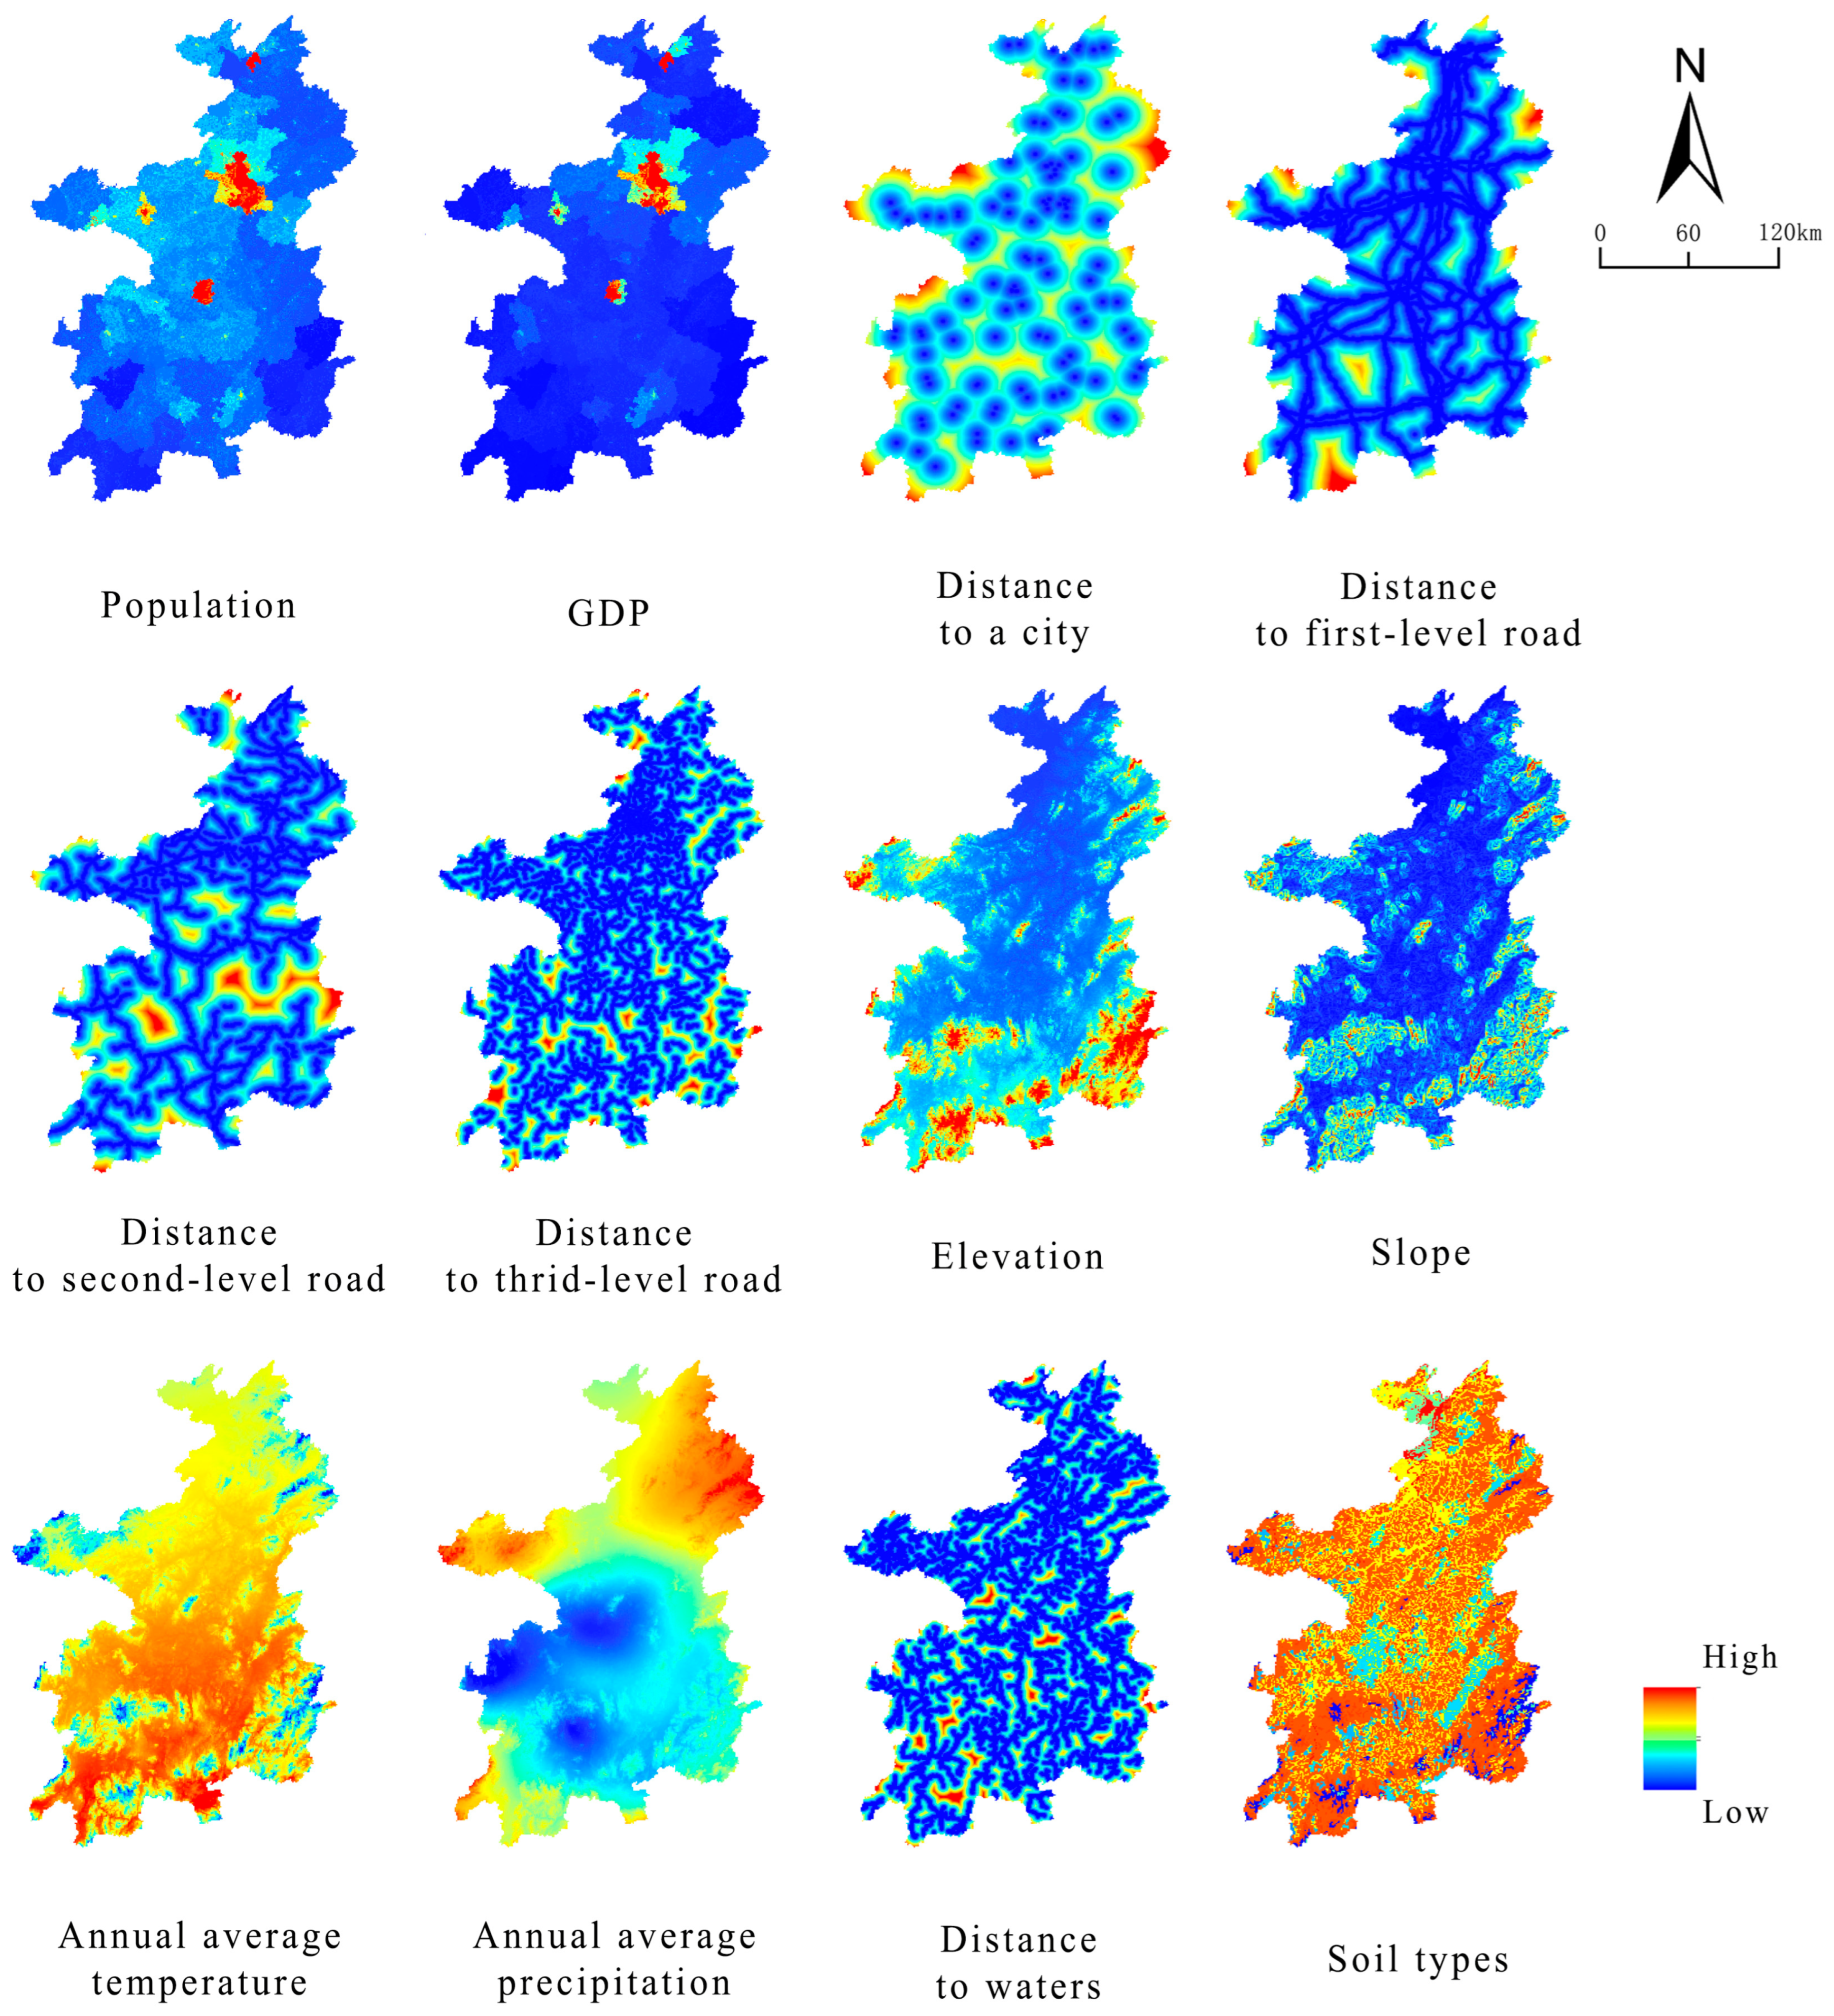
1.1.2. Data Sources
2. Study Methods
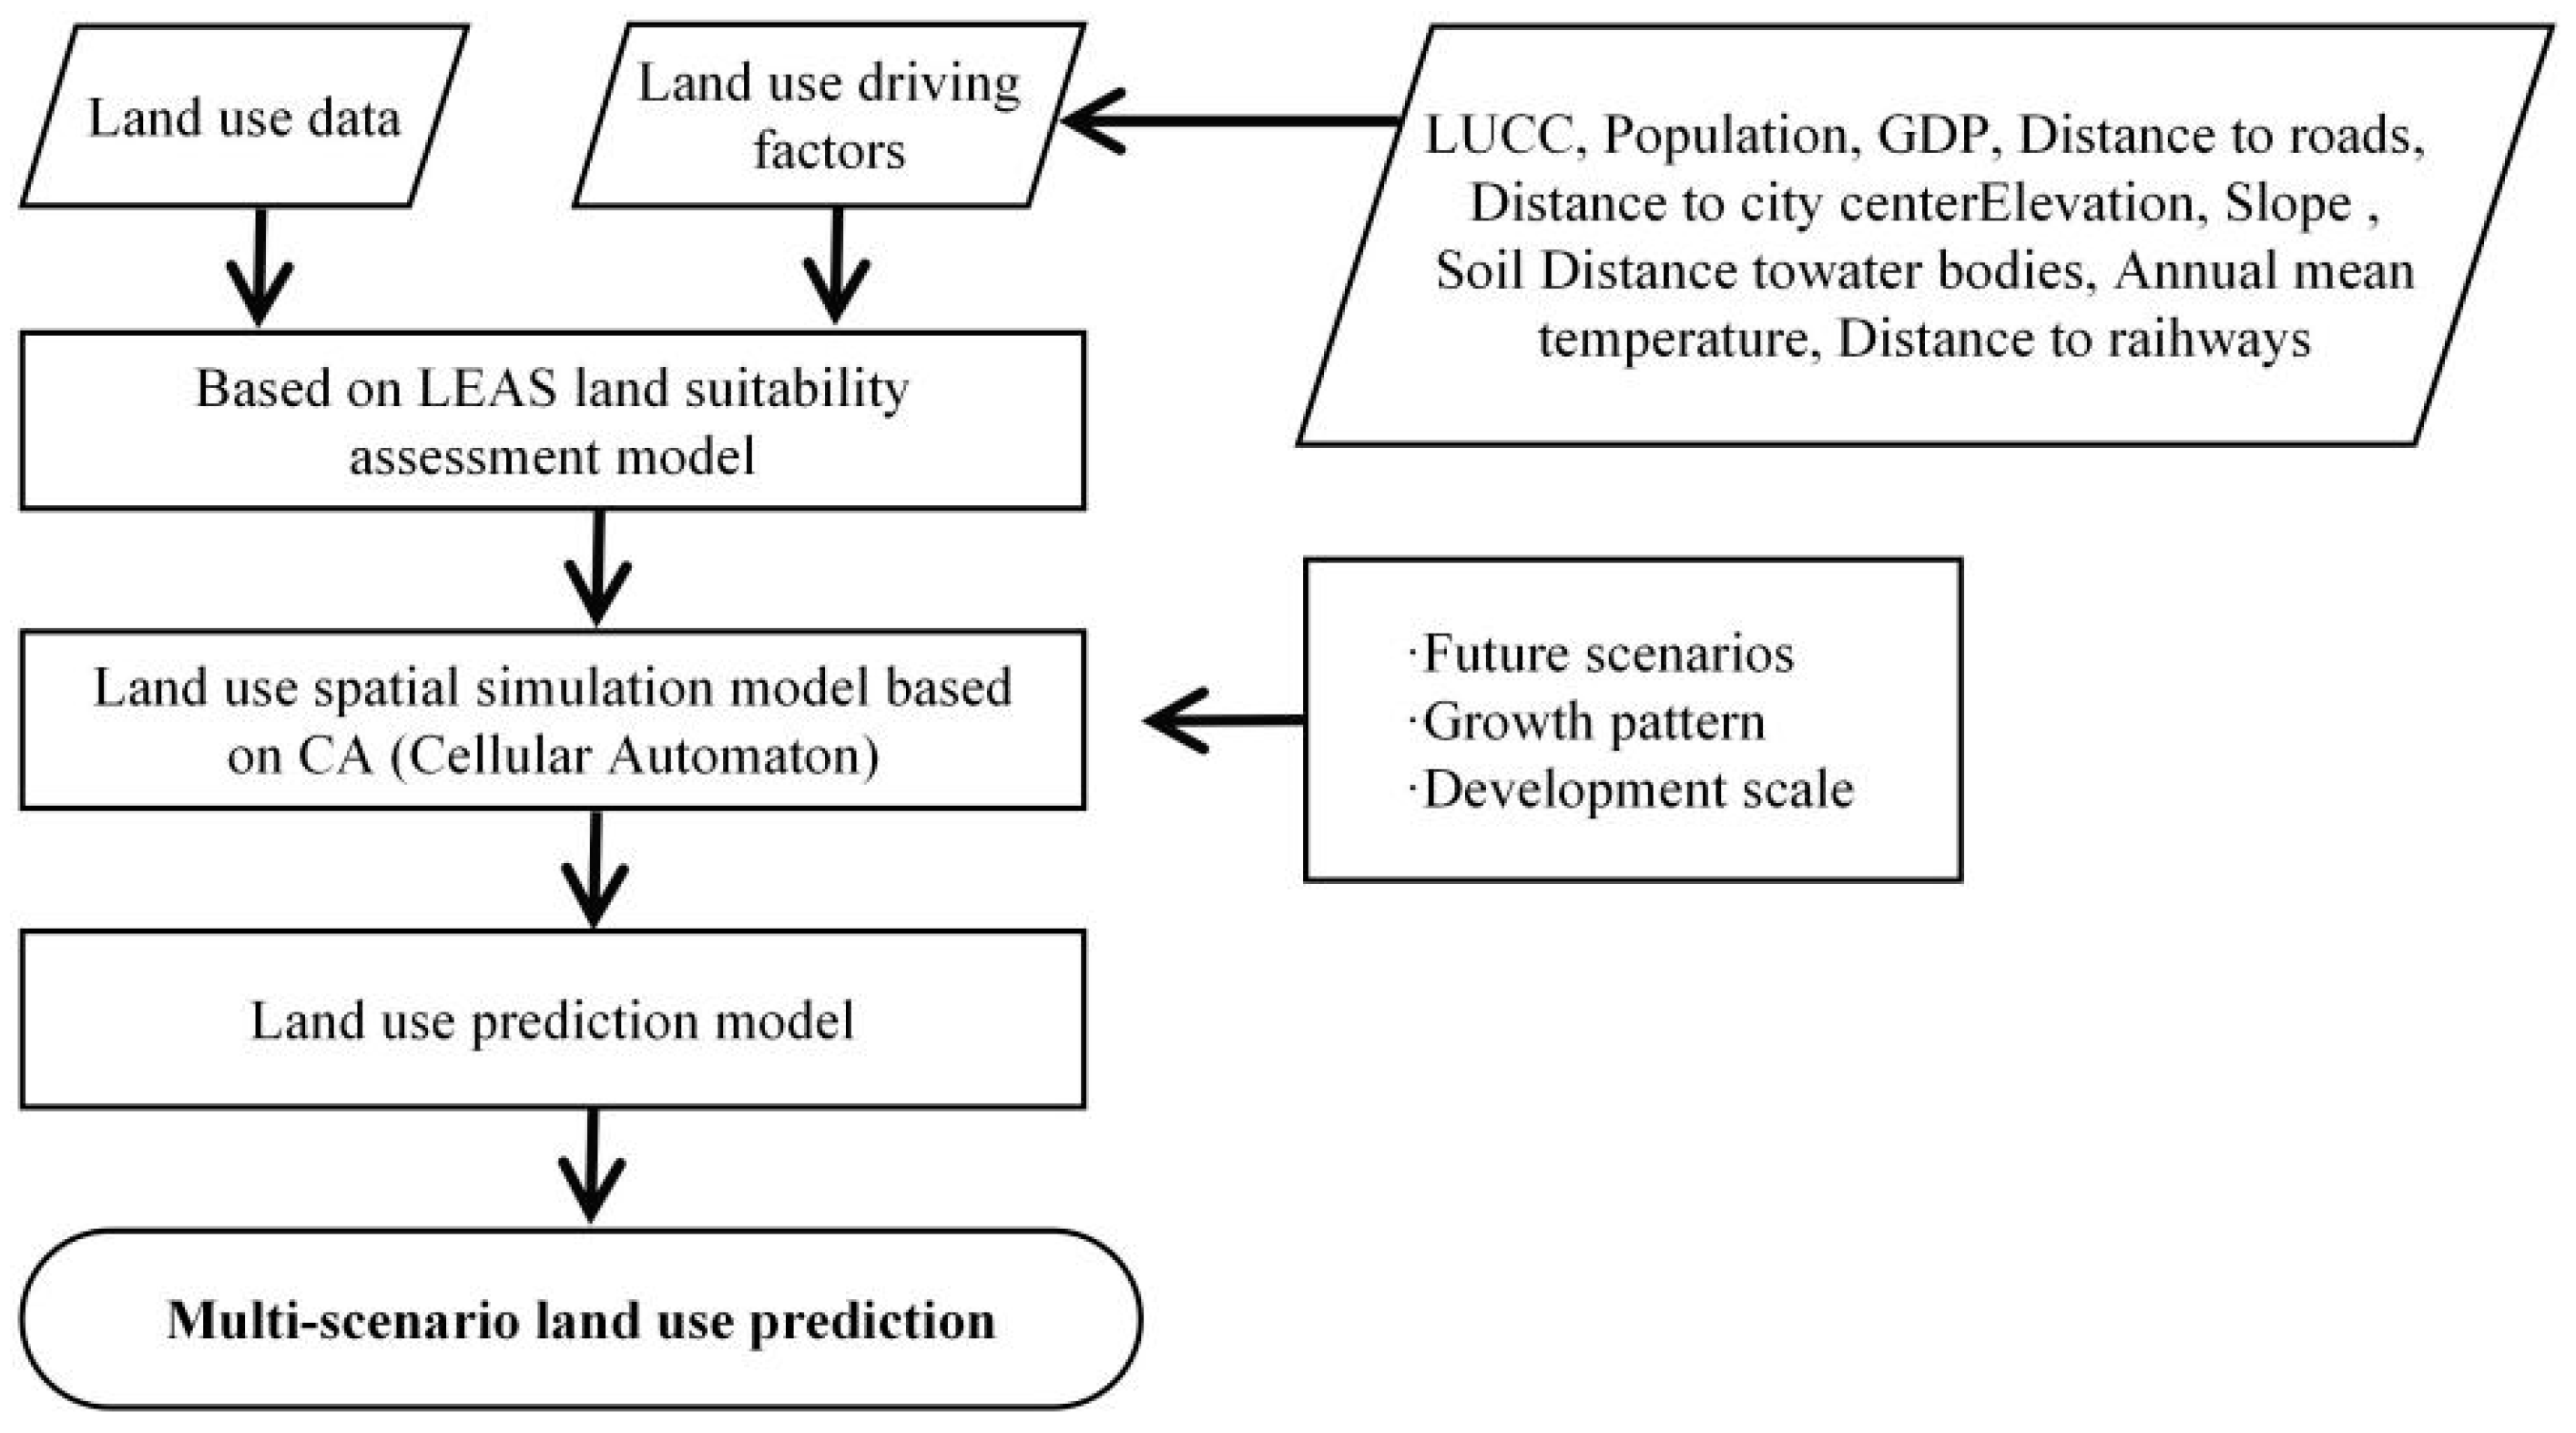
2.1. PLUS Model Prediction
2.2. Evaluation of ESVs
2.2.1. Ecosystem Service Equivalent Table
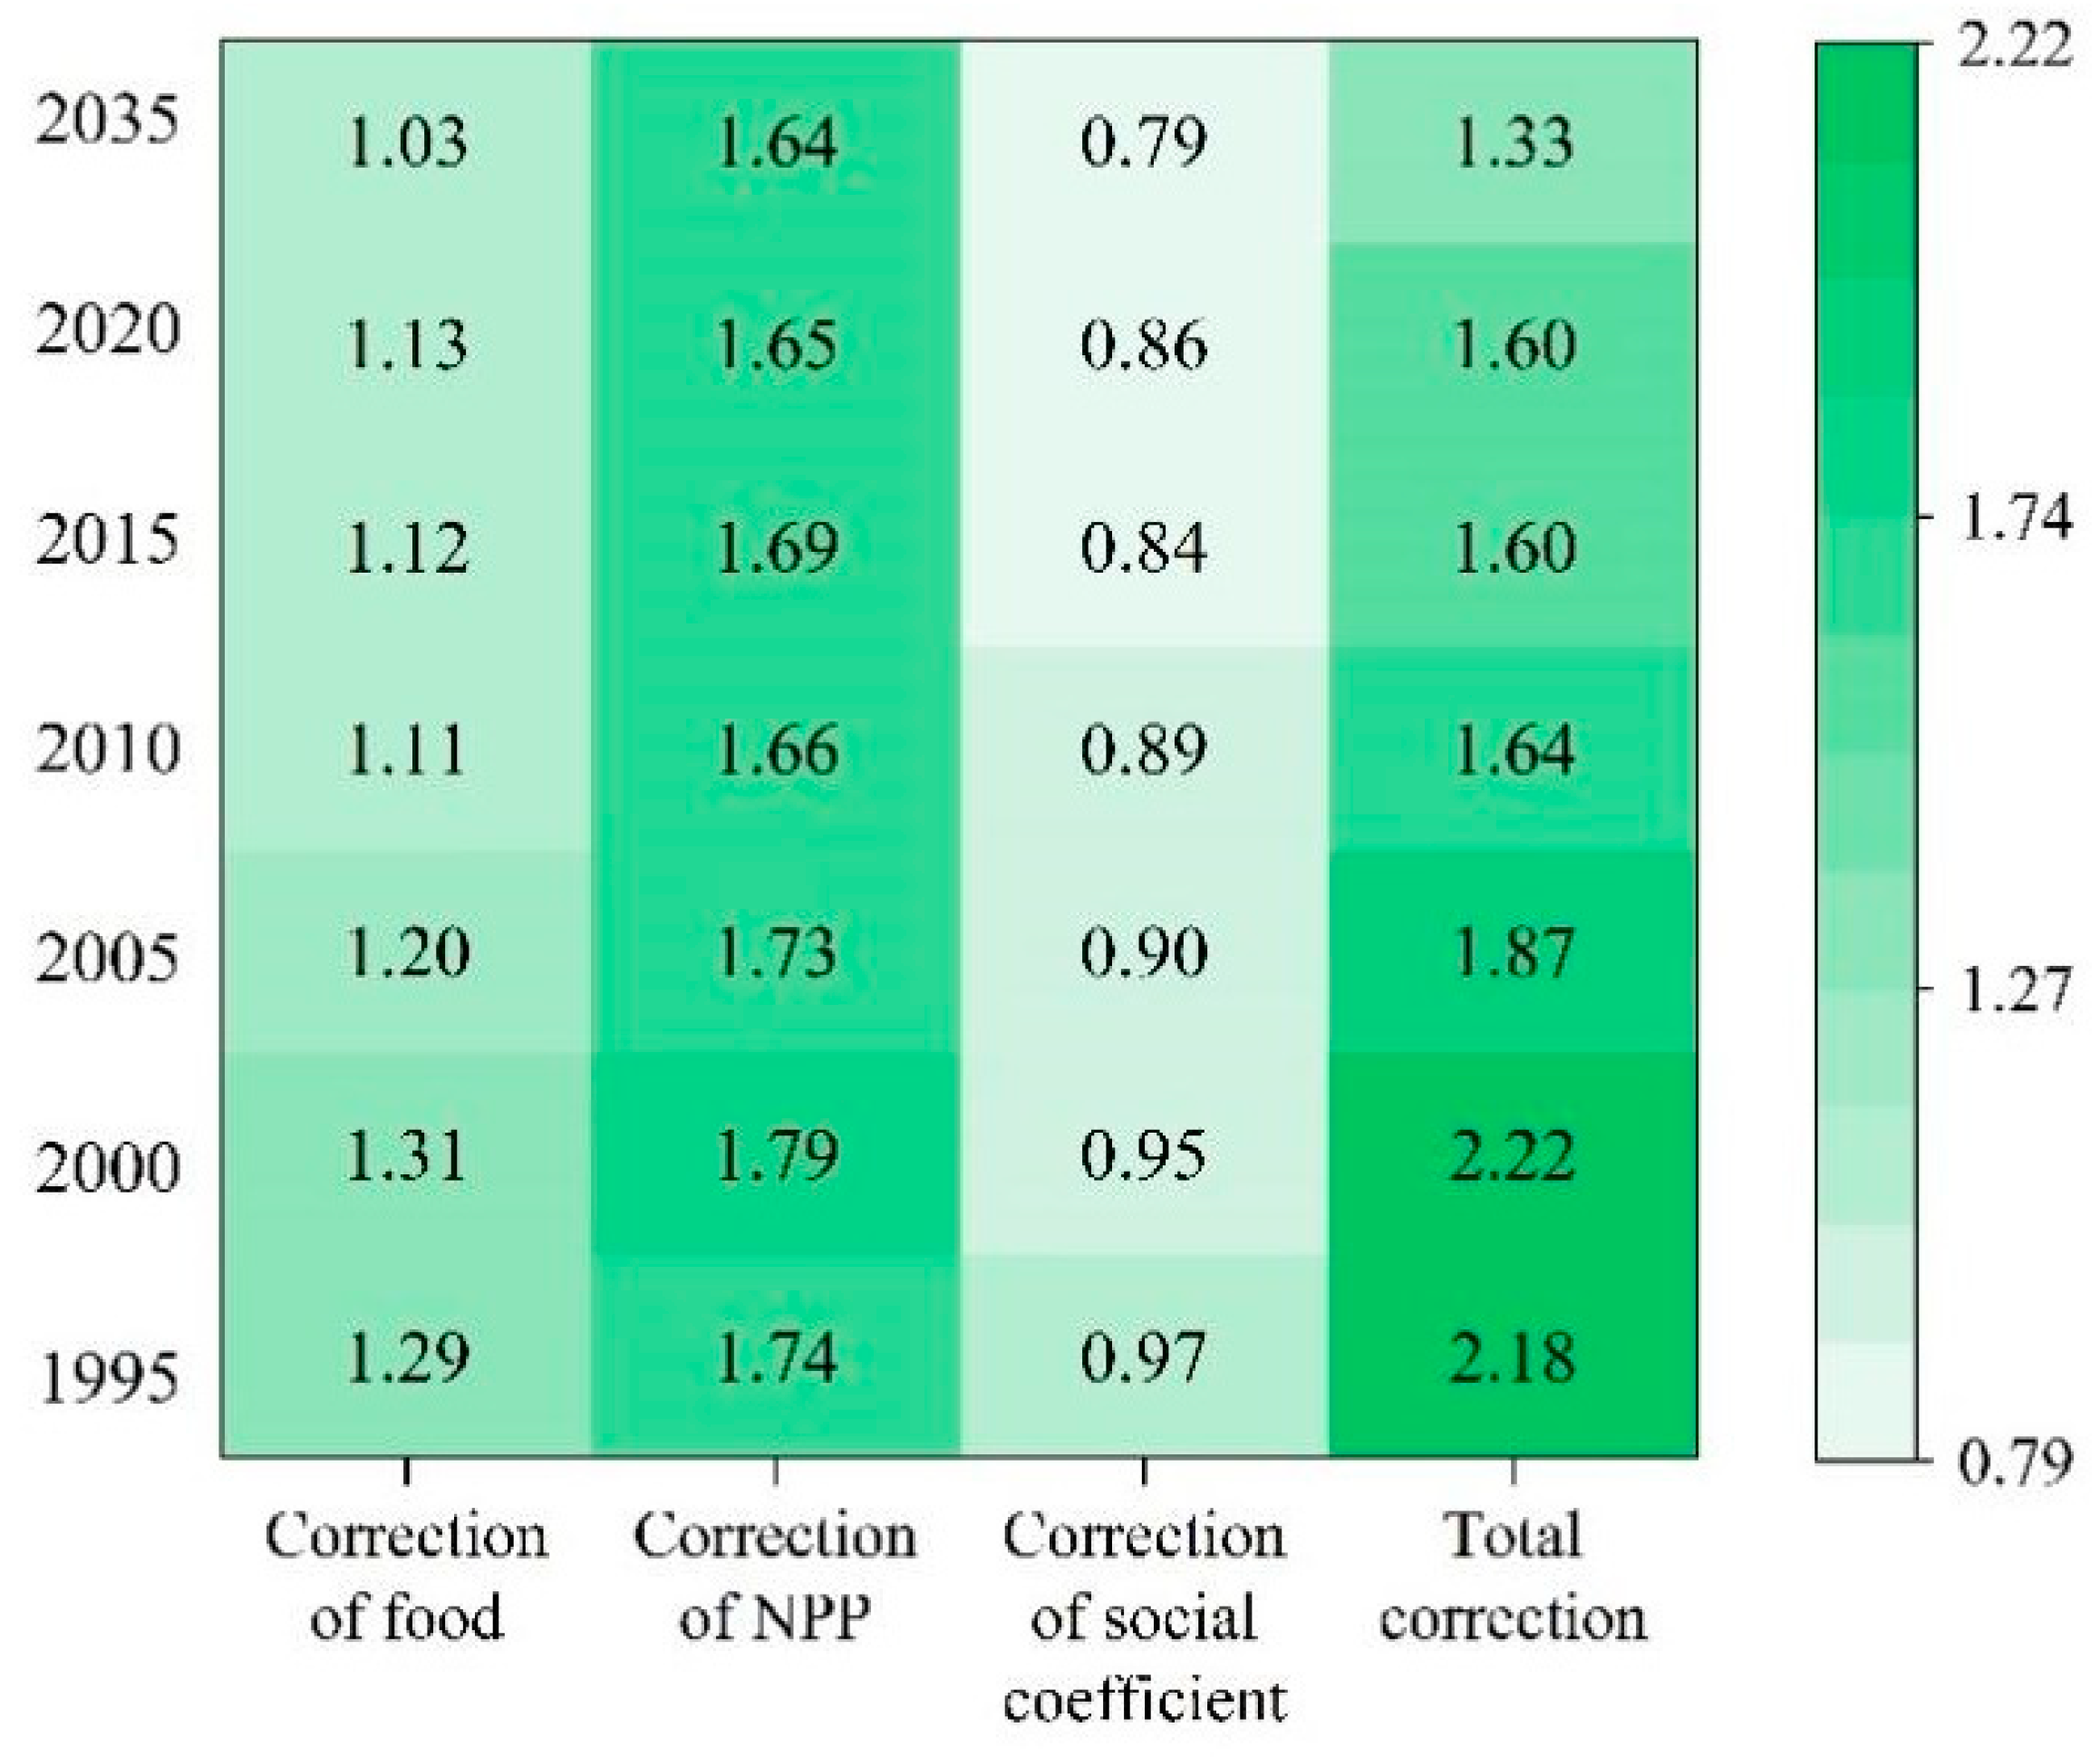
2.2.2. Correction of Coefficient
- (1)
- Food coefficient
- (2)
- Social development coefficient
- (3)
- Regional difference coefficient
2.2.3. Calculation of ESVs
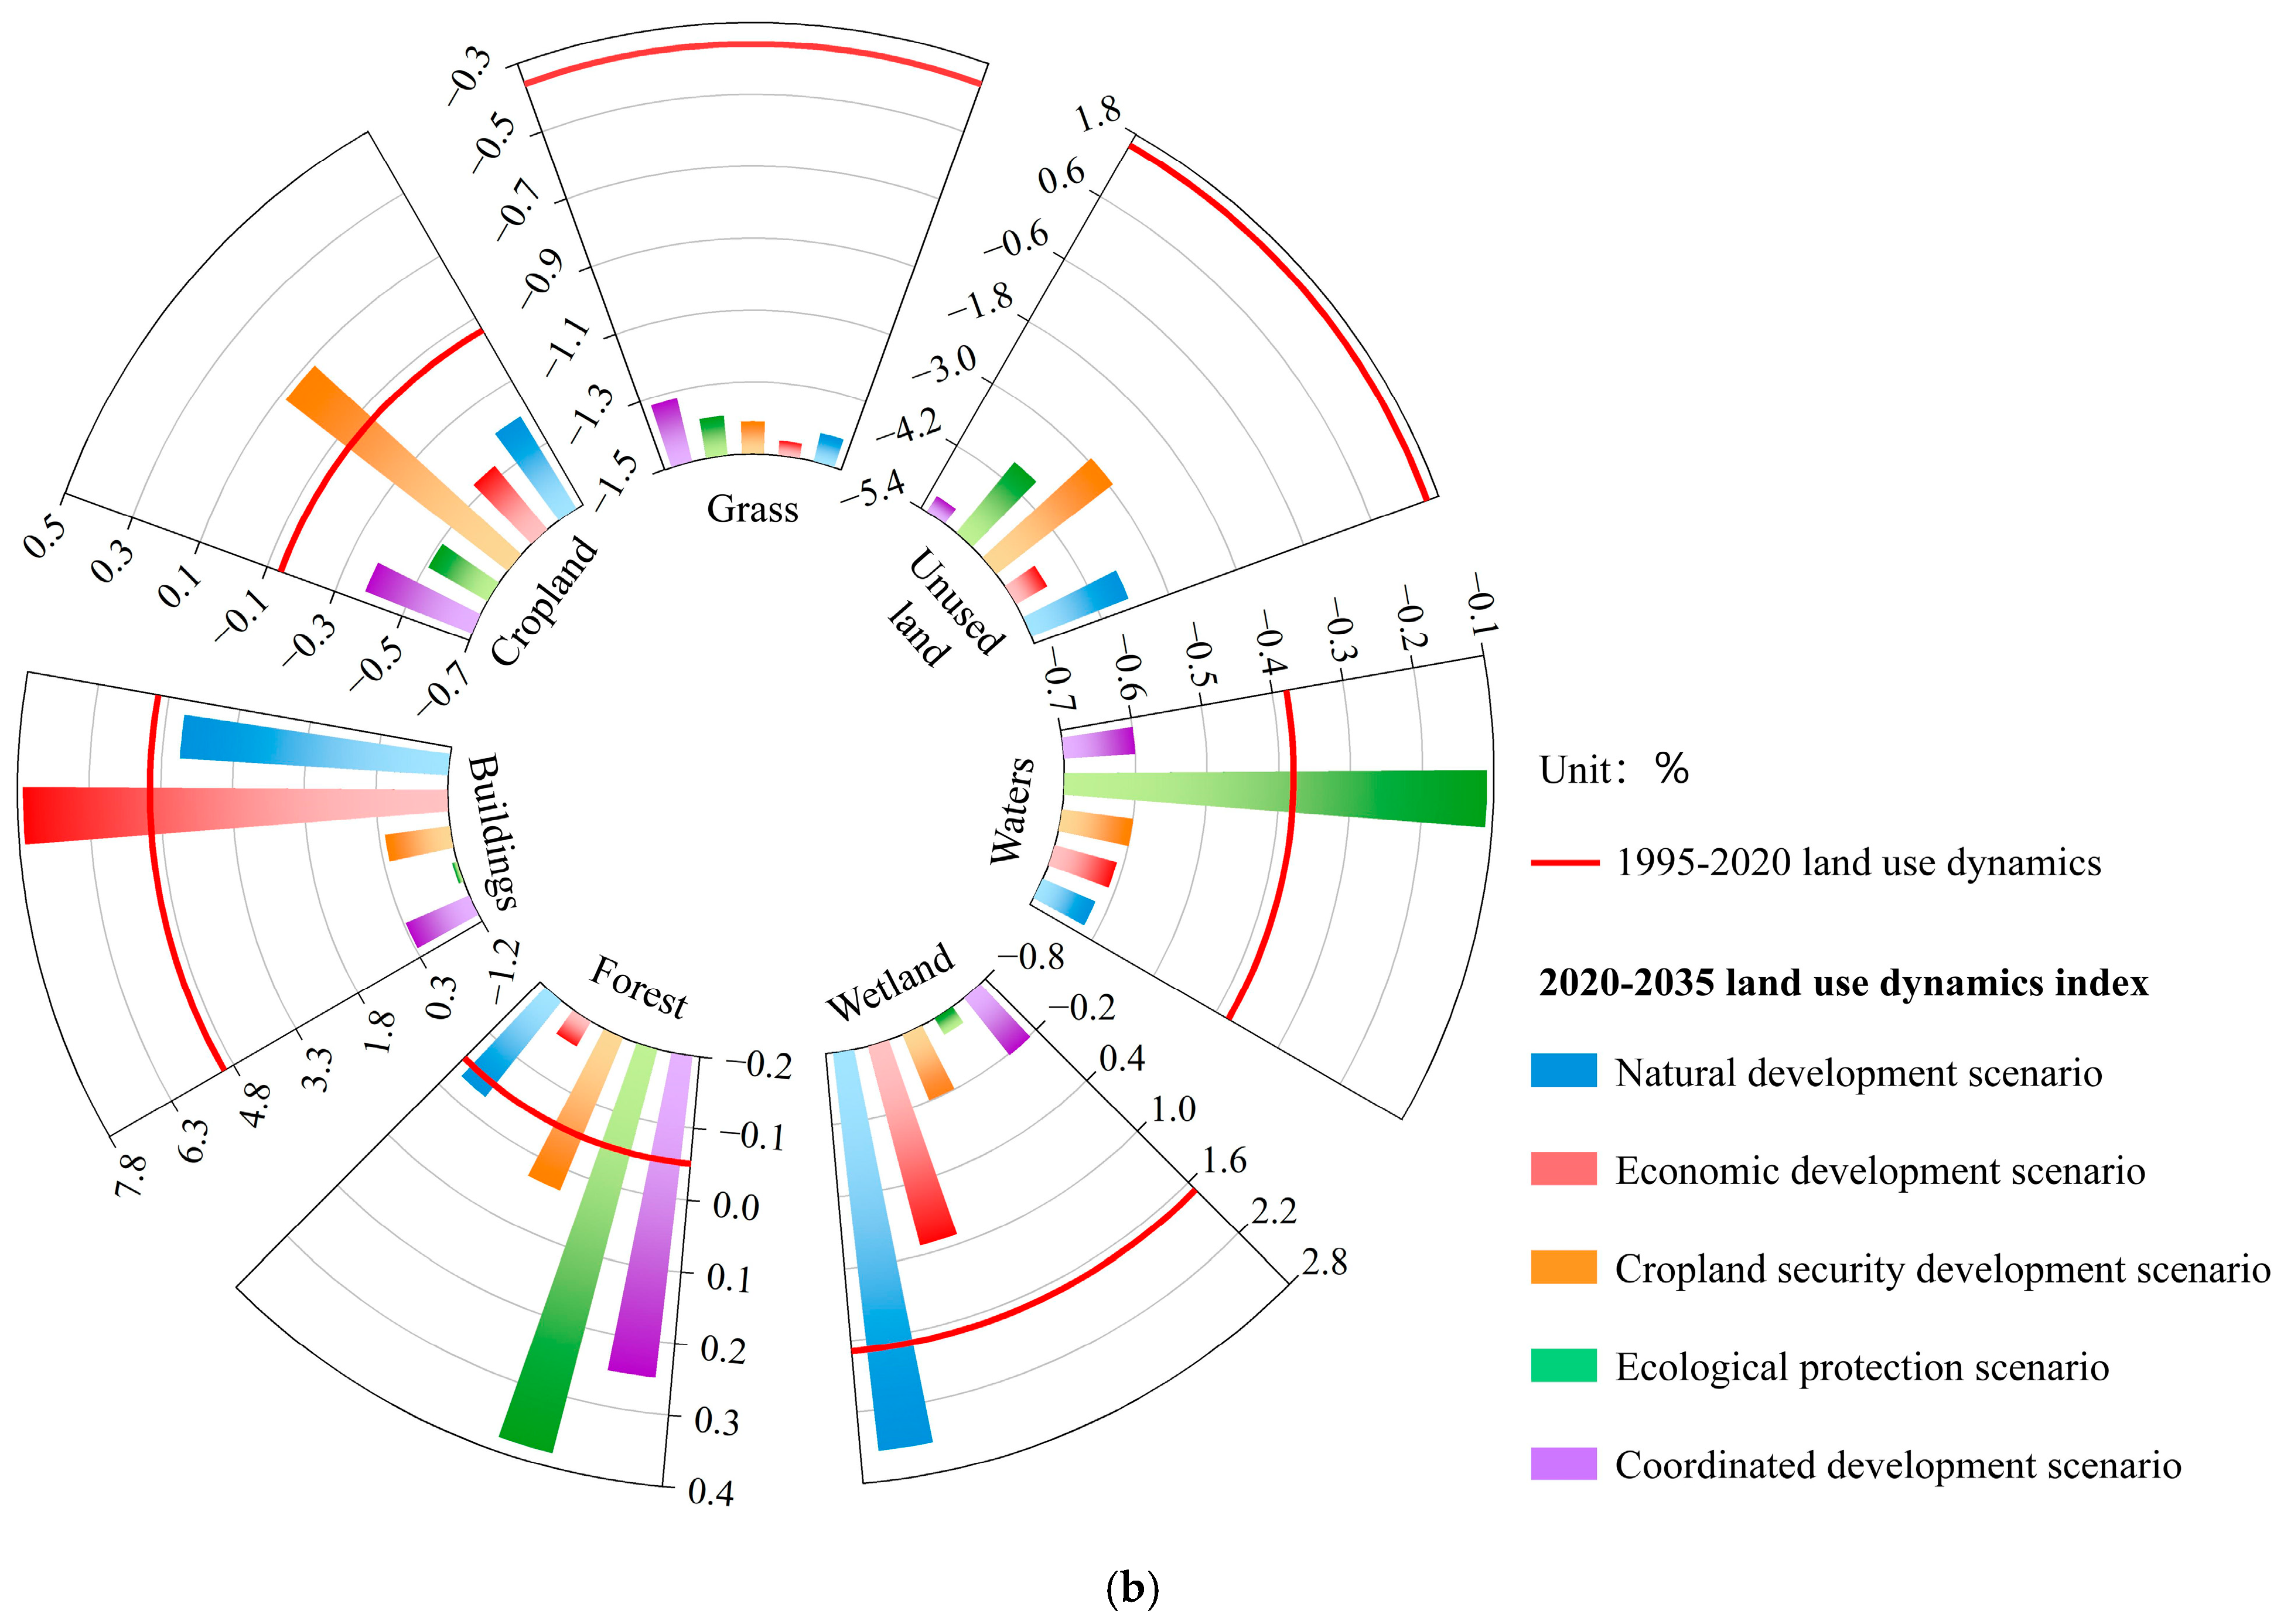
2.3. Land Use Dynamics
3. Results and Analysis
3.1. Changes in Land Use 1995–2020
3.2. Prediction of Multiple Land Use Scenarios
3.3. ESV Estimations Based on Land Use Predictions
3.3.1. Data Prediction and Its Change
- (1)
- Prediction of equivalent coefficient
- (2)
- Quantitative change characteristics
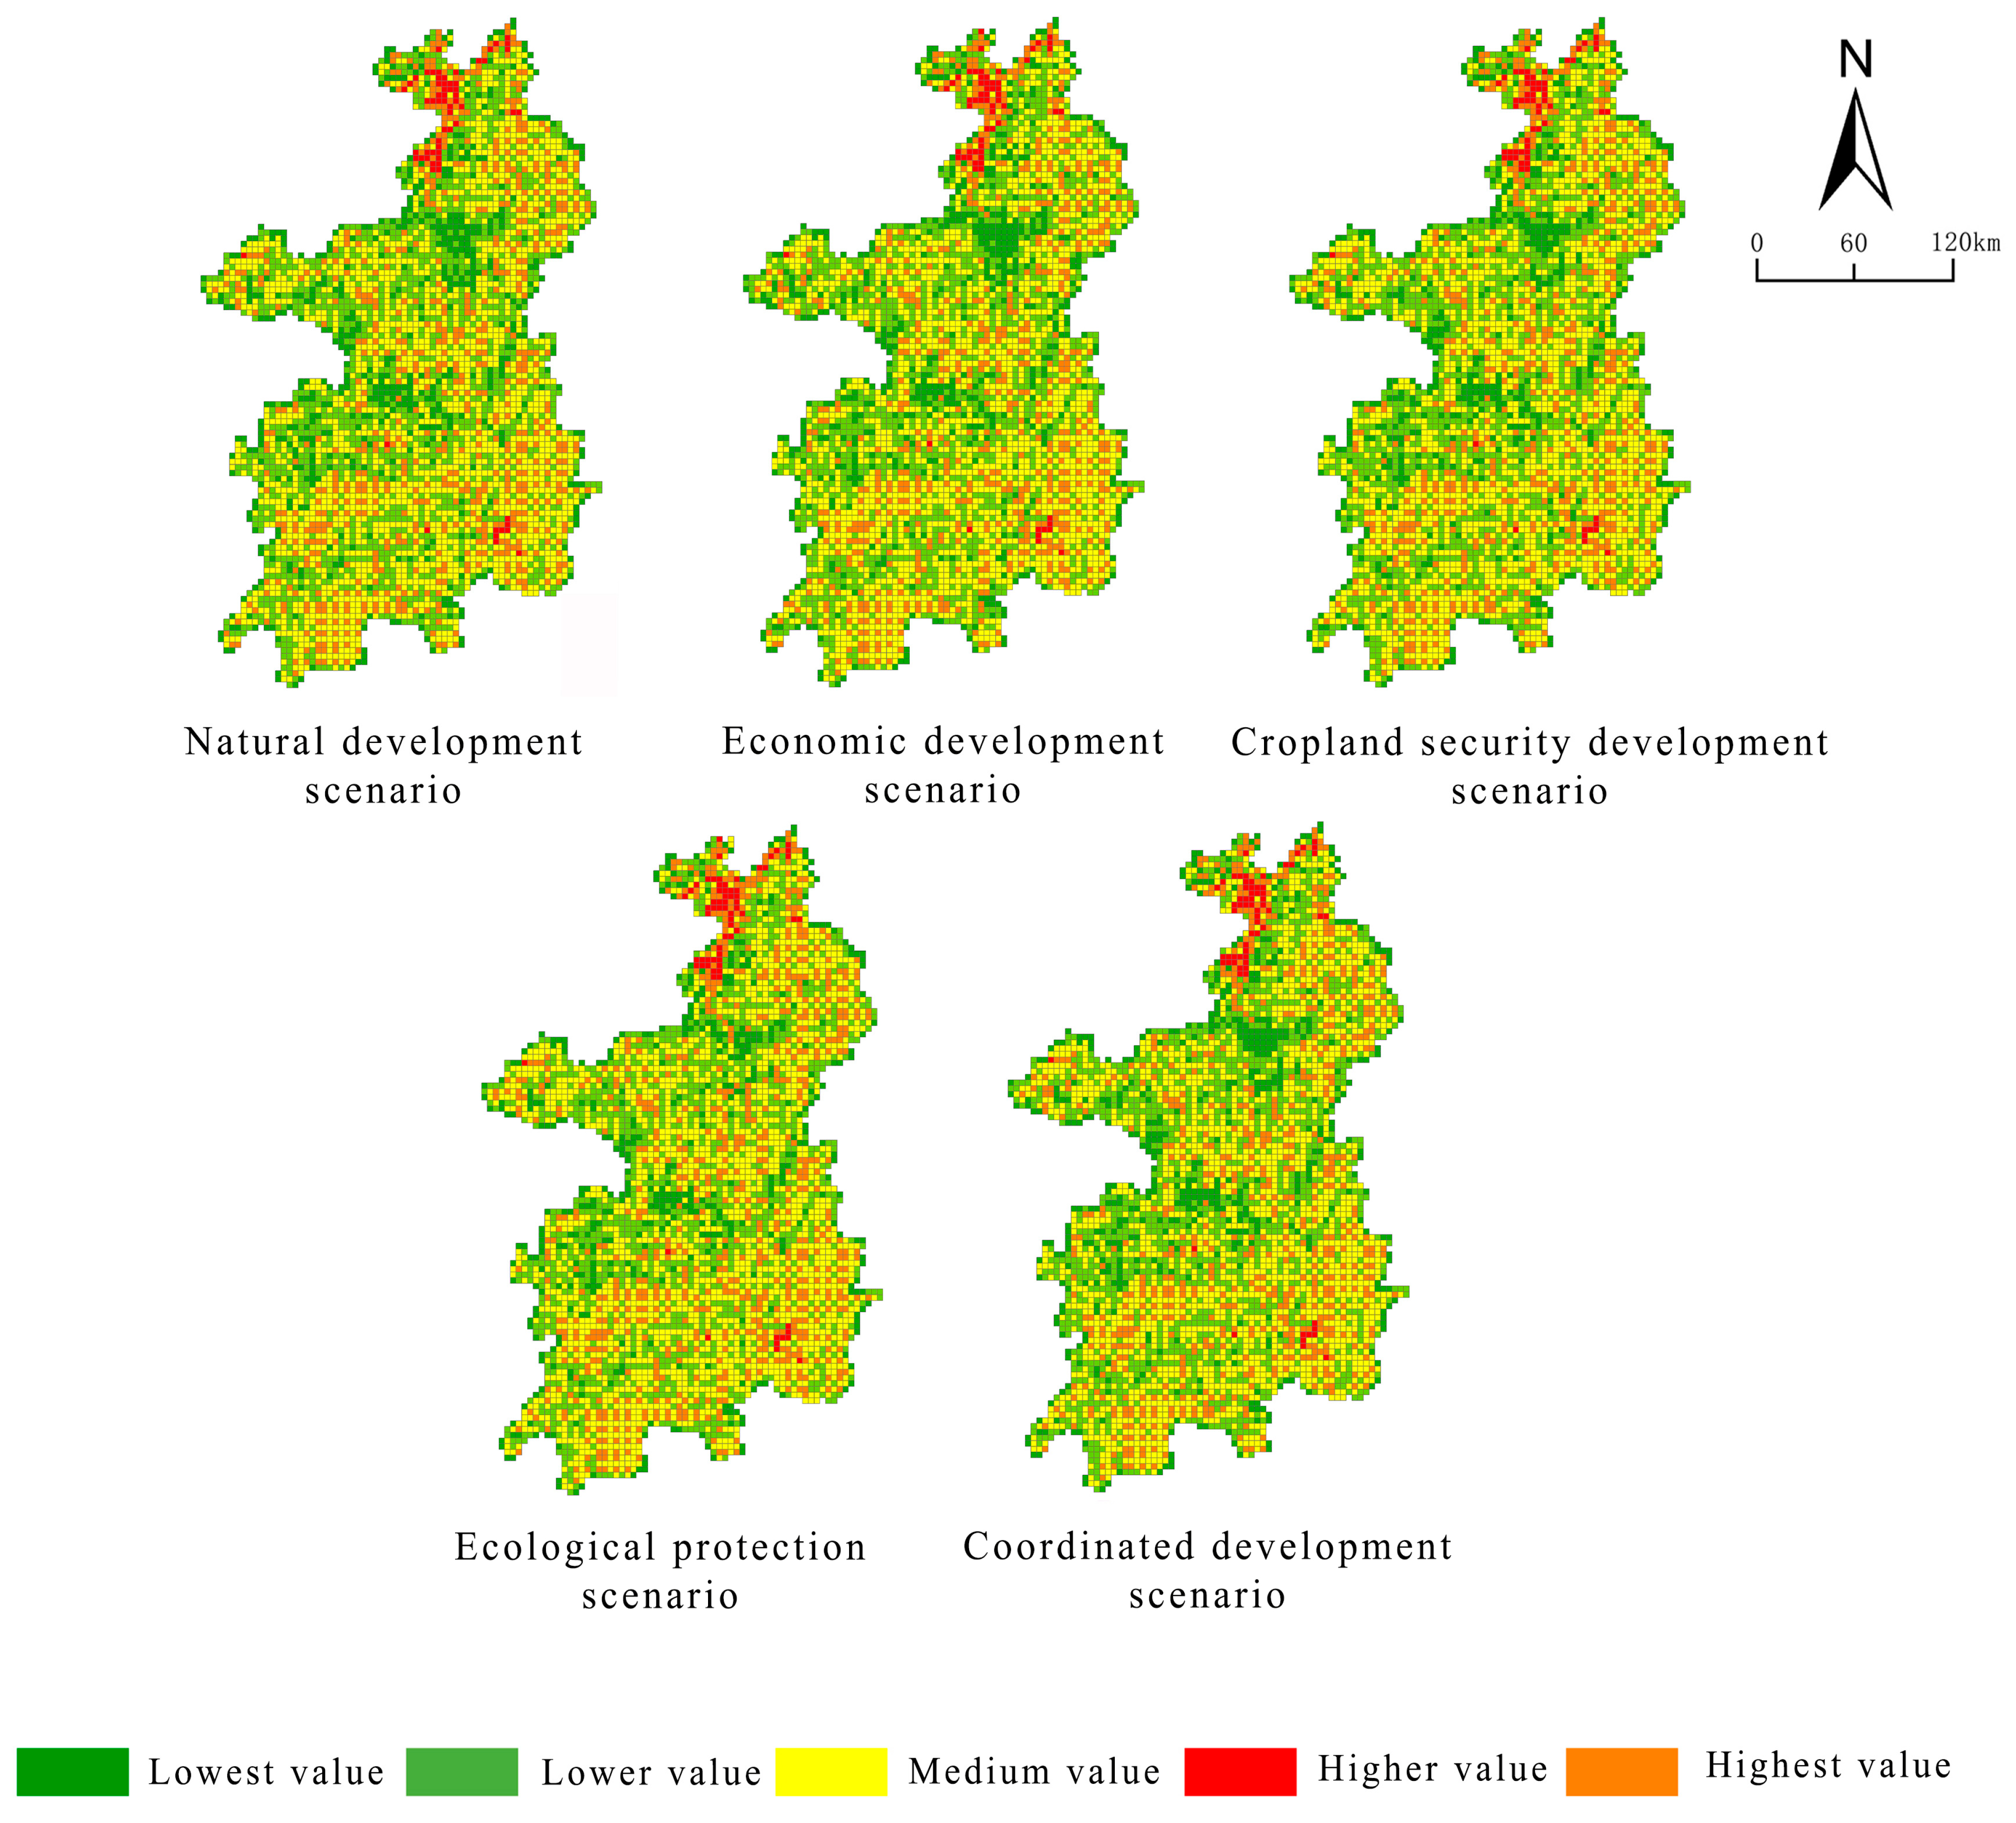
3.3.2. Space Prediction and Its Change
4. Discussion
4.1. Land Use Strategies
4.1.1. Strengthen Farmland Protection and Optimize Land Use Patterns
4.1.2. Strengthening the Construction of Ecological Origins and Improving ESVs
- (1)
- Protect existing forests and grasslands and increase their area.
- (2)
- Protect water and wetlands to maximize their ecological functions.
4.1.3. Establishing a Mechanism for Achieving the Value of Ecological Products and Optimizing Regional Economic Structures
4.1.4. The Need for Refined Spatial Governance
4.2. Problems and Shortcomings
5. Conclusions
- (1)
- Dynamic Characteristics of Land Use: From 1995 to 2020, the construction land in the Xiangjiang River Basin experienced rapid expansion, with an average annual growth rate exceeding 0.5%, primarily encroaching upon farmland and forests. The wetland area exhibited periodic fluctuations because of the transformation of waters, while unused land significantly increased because of ecological degradation, reflecting the substantial impact of human activities on ecosystem structures.
- (2)
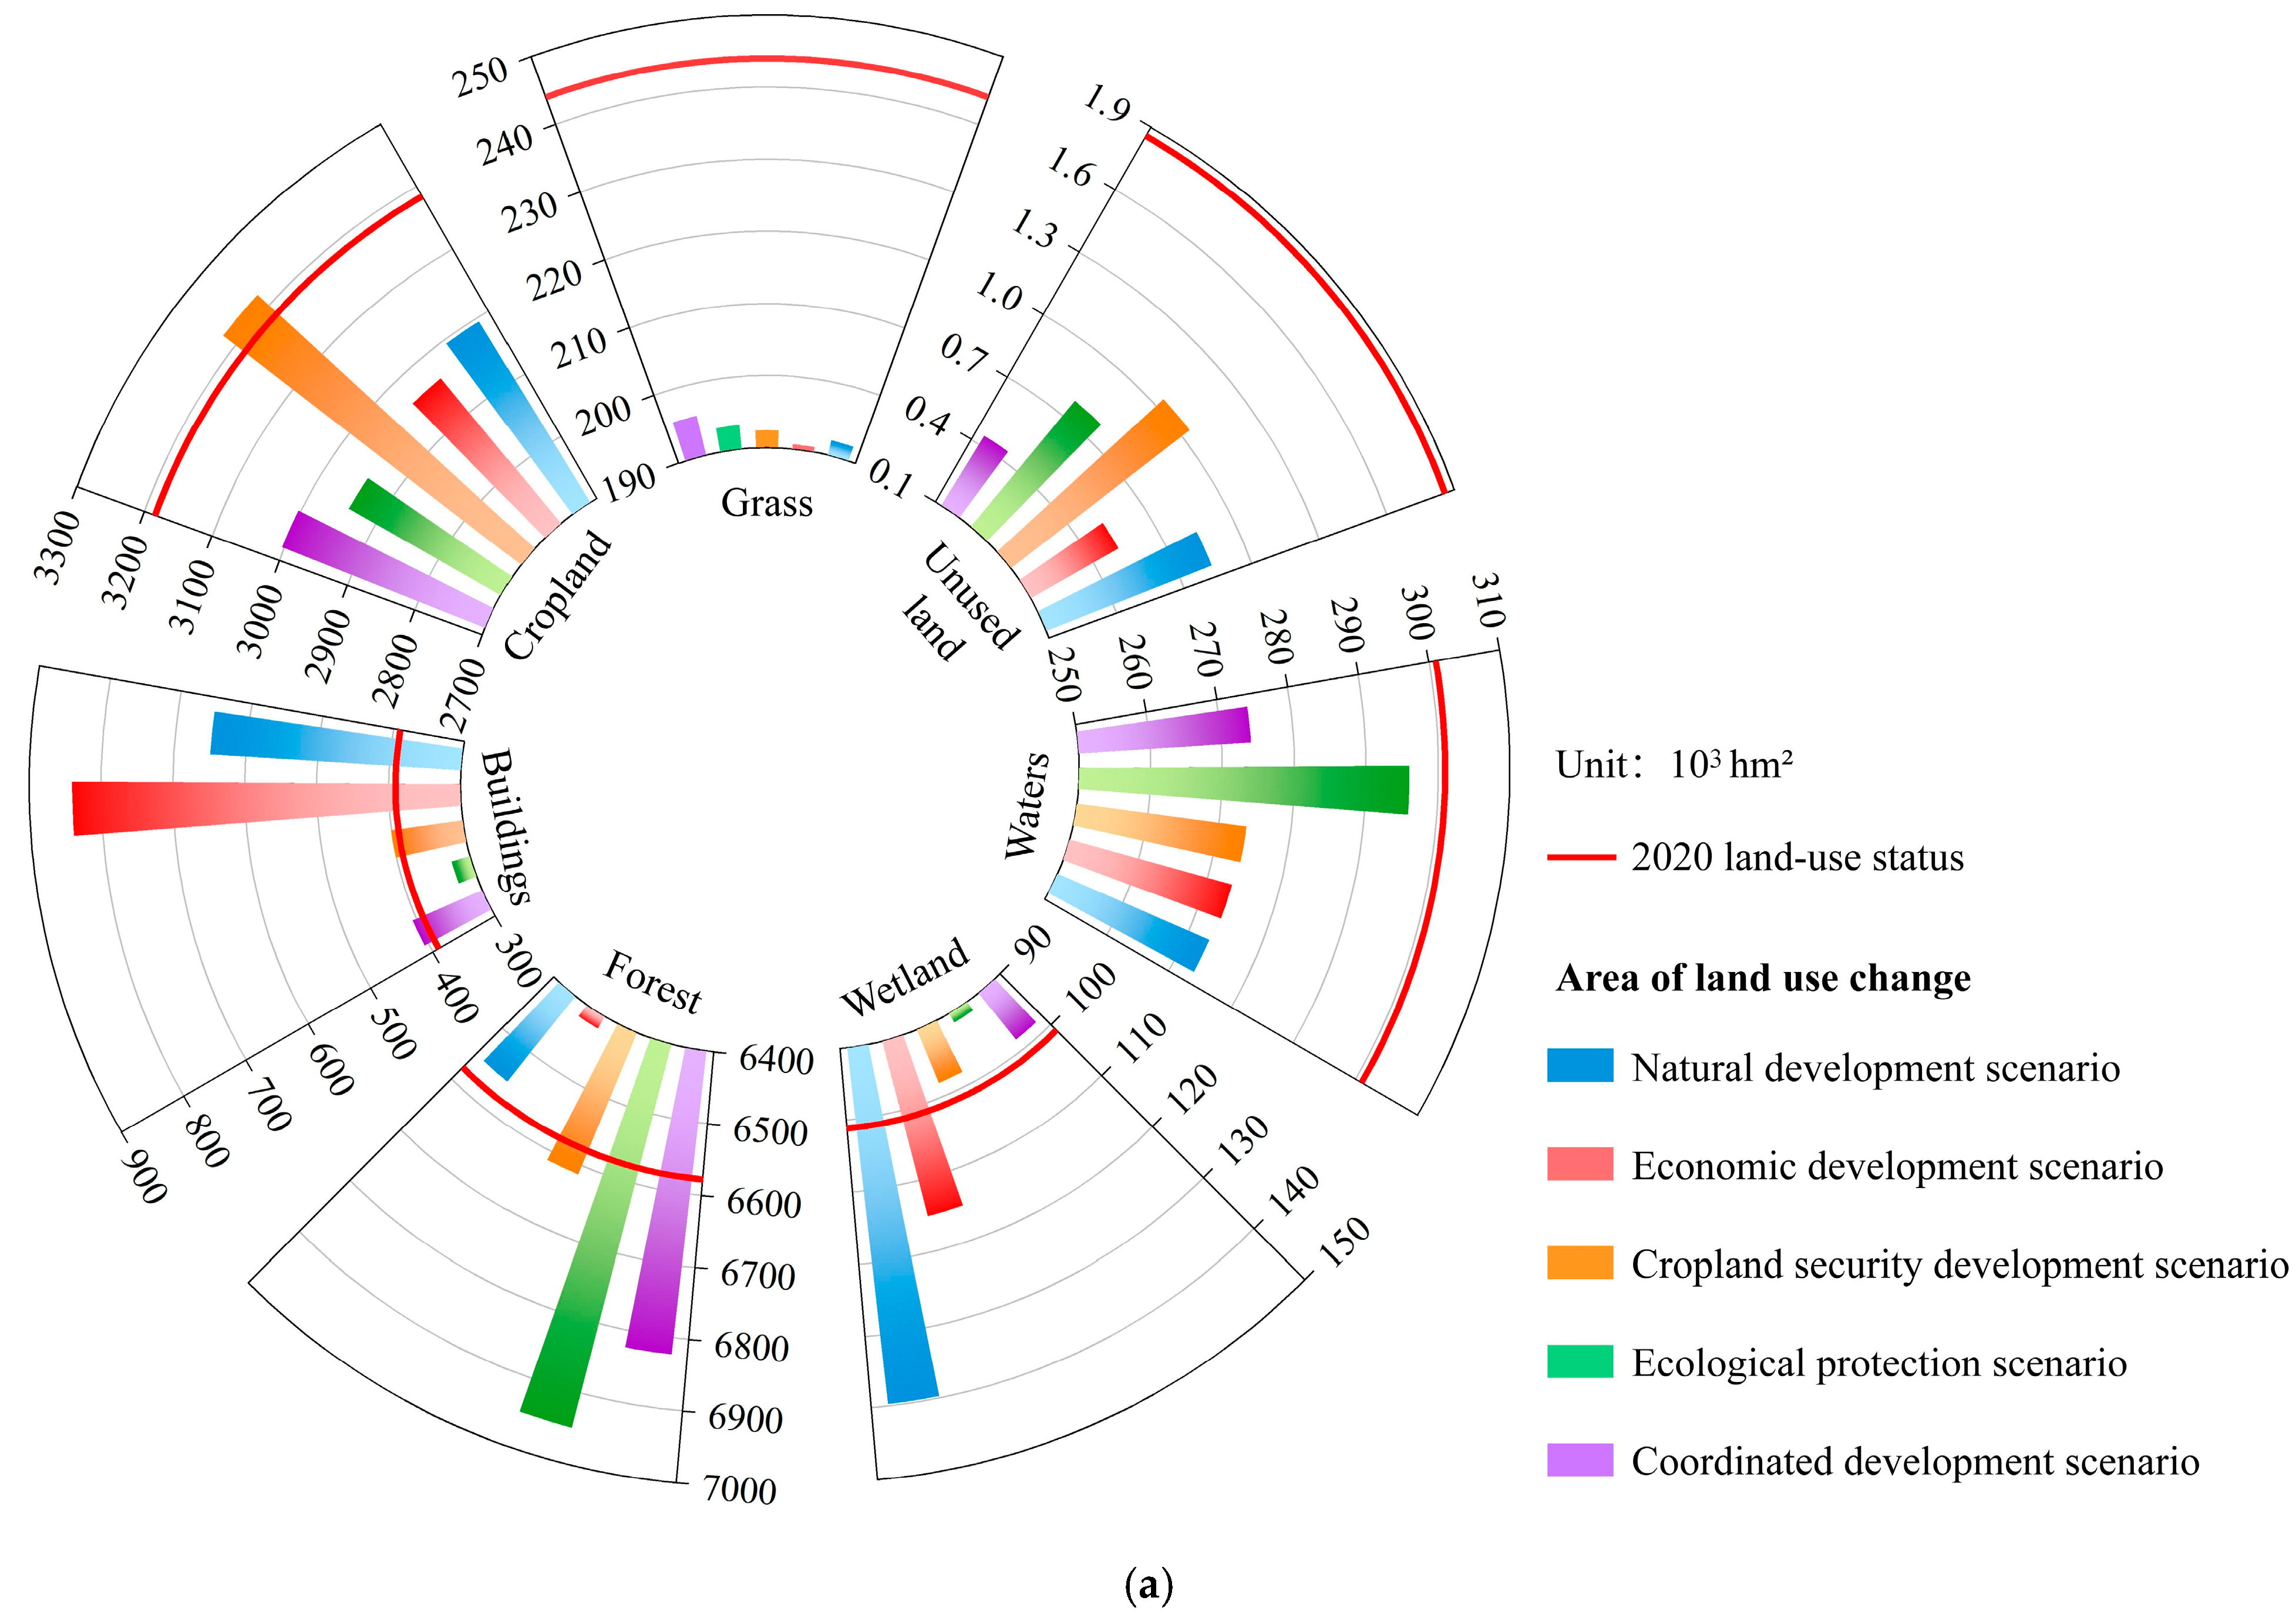
- Differences in Multi-Scenario Predictions: By 2035, under the natural development scenario, construction land continues to expand, increasing to 649.16 × 10³ hectares, while the ecological protection scenario restricts the conversion of ecological land, leading to increases in forest and water areas by 5.6% and 9.8% respectively, with the smallest decline in ESV, a 12.6% reduction compared with 2020. The coordinated development scenario balances ecological and land use needs, resulting in a 3.7% increase in forest area and an ESV higher than other non-ecological priority scenarios. Under the economic development scenario, construction land expansion grows by 115.2% compared with 2020, with an ESV decline of 18.8%, indicating the significant negative effects of extensive growth on ecosystems. In the ecological protection scenario, by limiting the conversion of ecological land, forests and water areas increase to 6949.09 × 103 hectares and 296.00 × 10³ hectares, respectively, increases of 6.1% and 8.4%, compared with the natural scenario, with the smallest ESV decline (12.6%), validating the effectiveness of the ecological priority strategy. Under the coordinated development scenario, the growth rate of construction land decreases to 3.8%, a 38.2% reduction compared with the natural scenario; the forest area increases by 4.2%, and the ESV of 568.201 billion CNY is higher than the farmland protection and natural development scenarios, demonstrating the feasibility of the “growth–protection” synergistic pathway.
- (3)
- Spatial Heterogeneity of ESV: The distribution of ESVs across the basin exhibits heterogeneity. High-value areas are predominantly concentrated in the western and northern regions that are characterized by extensive forests and water areas. In contrast, low-value areas are primarily located in urban centers, reflecting the negative impact of urbanization on ecosystem services.
Author Contributions
Funding
Data Availability Statement
Acknowledgments
Conflicts of Interest
References
- Long, H.L. Theorizing land use transitions: A human geography perspective. Habitat Int. 2022, 128, 102669. [Google Scholar] [CrossRef]
- Luo, J.Q.; Ma, W.J.; An, S.; Zhang, Z.N.; Fu, Y.C.; Huang, H.J.; Chang, G.Y. Coupling analysis of multi-systems urbanization: Evidence from China. Ecol. Indic. 2025, 170, 112977. [Google Scholar] [CrossRef]
- Liu, Y.S.; Li, Y.H. Revitalize the World’s Countryside. Nature 2017, 548, 275–277. [Google Scholar] [CrossRef] [PubMed]
- Li, J.Y.; Chen, X.; Maeyer, P.D.; Voorde, T.V.; Li, Y.M. Investigating the supply–demand gap of farmland ecosystem services to advance sustainable development goals (SDGs) in Central Asia. Agric. Water Manag. 2025, 312, 109419. [Google Scholar] [CrossRef]
- Xu, Z.H.; Peng, J.; Liu, Y.X.; Qiu, S.J.; Zhang, H.B.; Dong, J.Q. Exploring the Combined Impact of Ecosystem Services and Urbanization on SDGs Realization. Appl. Geogr. 2023, 153, 102907. [Google Scholar] [CrossRef]
- Costanza, R.; Arge, R.; Groot, R.; Farber, S.; Grasso, M.; Hannon, B.; Limburg, K.; Naeem, S.; Neill, R.V.; Paruelo, J.; et al. value of the world’s ecosystem services and natural capital. Ecol. Econ. 1998, 25, 3–15. [Google Scholar] [CrossRef]
- Li, L.; He, C.Y.; Li, J.W.; Zhang, J.X.; Li, J. The supply and demand of water-related ecosystem services in the Asian water tower and its downstream area. Sci. Total Environ. 2023, 887, 164205. [Google Scholar] [CrossRef] [PubMed]
- Eger, A.M.; Marzinelli, E.M.; Luna, R.B.; Blain, C.O.; Laura, K.B.; Jarrett, E.K.B.; Carnell, P.E.; Choi, C.G.; Hessing-Lewis, M.; Kim, K.Y.; et al. The Value of Ecosystem Services in Global Marine Kelp Forests. Nat. Commun. 2023, 14, 1894. [Google Scholar] [CrossRef] [PubMed]
- Rasheed, S.; Venkatesh, P.; Singh, D.R.; Renjini, V.R.; Jha, G.K.; Sharma, D.K. Ecosystem Valuation and Eco-Compensation for Conservation of Traditional Paddy Ecosystems and Varieties in Kerala, India. Ecosyst. Serv. 2021, 49, 101272. [Google Scholar] [CrossRef]
- Teoh, S.H.S.; Symes, W.S.; Sun, H.; Pienkowski, T.; Carrasco, L.R. A global meta-analysis of the economic values of provisioning and cultural ecosystem services. Sci. Total Environ. 2019, 649, 1293–1298. [Google Scholar] [CrossRef] [PubMed]
- Ali, H.; Aysan, A.F. Macroeconomic asymmetries and their influence on fintech ecosystem growth: A global and regional perspective. J. Econ. Asymmetries 2025, 31, e00399. [Google Scholar] [CrossRef]
- Sun, L.; Yu, H.J.; Sun, M.X.; Wang, Y.T. impacts of climate and land use changes on regional ecosystem services. J. Environ. Manag. 2023, 326, 116753. [Google Scholar] [CrossRef] [PubMed]
- Pan, T.; Du, G.M.; Dong, J.W.; Kuang, W.H.; Maeyer, P.D.; Kurban, A. Divergent changes in cropping patterns and their effects on grain production under different agro-ecosystems over high latitudes in China. Sci. Total Environ. 2019, 659, 314–325. [Google Scholar] [CrossRef] [PubMed]
- Dang, L.Y.; Zhao, F.; Teng, Y.M.; Teng, J.; Zhan, J.Y.; Zhang, F.; Liu, W.; Wang, L.Q. Scale dependency of trade-offs/synergies analysis of ecosystem services based on Bayesian Belief Networks: A case of the Yellow River Basin. J. Environ. Manag. 2025, 375, 124410. [Google Scholar] [CrossRef] [PubMed]
- Liu, X.Y.; Li, Y.F.; Lu, J.; Song, T.Y.; Zhang, S. Urban growth simulation guided by ecosystem service trade-offs in Wuhan metropolitan area: Methods and implications for spatial planning. Ecol. Indic. 2024, 167, 112687. [Google Scholar] [CrossRef]
- Zhang, B.T.; Li, Z.X.; Feng, Q.; Lu, Z.X.; Zhang, B.J.; Cheng, W. Evolution of ecosystem service values in Qilian Mountains based on land-use change from 1990 to 2020. Acta Ecol. Sin. 2024, 44, 4187–4202. [Google Scholar]
- Wei, Y.L.; Zhou, P.Y.; Zhang, L.Q.; Zhang, Y. Spatio-temporal evolution analysis of land use change and landscape ecological risks in rapidly urbanizing areas based on Multi-Situation simulation—A case study of Chengdu Plain. Ecol. Indic. 2024, 166, 112245. [Google Scholar] [CrossRef]
- Xiao, J.; Zhang, Y.F.; Xu, H.J. Response of ecosystem service values to land use change, 2002–2021. Ecol. Indic. 2024, 160, 111947. [Google Scholar] [CrossRef]
- Yang, X.X.; Zhang, J.Y.; Qiu, D.E.; Zhang, F.T. Spatio-temporal evolution and influencing factors of cultivated land use eco-efficiencyin Chengdu-Chongqing economic circle based on ecosystem services and emergy analysis. Acta Ecol. Sin. 2025, 8, 1–18. [Google Scholar]
- Li, J.L.; Lei, Q.H.; Hu, D.W.; Li, Y.; Yin, H.W. Characterization of Spatial and Temporal Correlation Between Human Activity Intensity and Ecosystem Service Value in the Yangtze River Economic Zone. Resour. Environ. Yangtze Basin 2024, 9, 1992–2003. [Google Scholar]
- Arsanjani, J.J.; Helbich, M.; Kainz, W.; Boloorani, A.D. Integration of Logistic Regression, Markov Chain and Cellular Automata Models to Simulate Urban Expansion. Int. J. Appl. Earth Obs. Geoinf. 2012, 21, 265–275. [Google Scholar] [CrossRef]
- Wang, L.X.; Li, Z.W.; Wang, D.Y.; Chen, J.; Liu, Y.J.; Nie, X.D.; Zhang, Y.T.; Ning, K.; Hu, X.Q. Unbalanced Social-Ecological Development Within the Dongting Lake Basin: Inspiration from Evaluation of Ecological Restoration Projects. J. Clean. Prod. 2021, 315, 128161. [Google Scholar] [CrossRef]
- Xie, H.L.; He, Y.F.; Choi, Y.; Chen, Q.R.; Cheng, H. Warning of Negative Effects of Land-Use Changes on Ecological Security Based on GIS. Sci. Total Environ. 2019, 704, 135427. [Google Scholar] [CrossRef] [PubMed]
- Xie, L.L.; Xu, J.L.; Zhang, J.M.; Huang, T.N. Simulation and Prediction of Land Use Change in Guangxi Based on Markov-FLUS Model. Res. Soil Water Conserv. 2022, 2, 249–254. [Google Scholar]
- Tian, L.; Tao, Y.; Fu, W.; Li, T.; Ren, F.; Li, M. Dynamic simulation of land use/cover change and assessment of forest ecosystem carbon storage under climate change scenarios in Guangdong Province, China. Remote Sens. 2022, 14, 2330. [Google Scholar] [CrossRef]
- Liang, X.; Guan, Q.F.; Clarke, K.C.; Liu, S.S.; Wang, B.Y.; Yao, Y. Understanding the Drivers of Sustainable Land Expansion Using a Patch-Generating Land Use Simulation (PLUS) Model: A Case Study in Wuhan, China. Comput. Environ. Urban Syst. 2020, 85, 101569. [Google Scholar] [CrossRef]
- Zhang, C.; Wang, Z.Q.; Du, H.W.; Li, H.Y. Response of Ecosystem Service Value to LULC Under Multi-Scenario Simulation Considering Policy Spatial Constraints: A Case Study of an Ecological Barrier Region in China. Land 2025, 14, 601. [Google Scholar] [CrossRef]
- Asghar, M.; Ayaz, M.; Ali, S. Ecological resilience in crisis: Analyzing the role of urban land use and institutional policies. Land Use Policy 2025, 151, 107492. [Google Scholar] [CrossRef]
- Tang, L.S.; Huang, Y.Q.; Jiang, Y.F.; Feng, D.D. The spatial association of rural human settlement system resilience with land use in Hunan Province, China, 2000–2020. Land 2023, 12, 1524. [Google Scholar] [CrossRef]
- Xiao, R.; Yin, H.Y.; Liu, R.X.; Zhang, Z.H.; Chinzorig, S.; Qin, K.; Tan, W.F.; Wan, Y.; Gao, Z.; Xu, C.; et al. Exploring the relationship between land use change patterns and variation in environmental factors within urban agglomeration. Sustain. Cities Soc. 2024, 108, 105447. [Google Scholar] [CrossRef]
- Zhang, Q.Y.; Liu, R.Z.; Luan, C.X. Analysis of driving force and multi-scenario simulation of land use in a typical agro-pastoral ecotone based on the PLUS model. Res. Soil Water Conserv. 2025, 1, 368–378. [Google Scholar]
- Xie, G.D.; Zhang, C.X.; Zhang, L.M.; Chen, W.H.; Li, S.M. Improvement of the Evaluation Method for Ecosystem Service Value Based on Per Unit Area. J. Nat. Resour. 2015, 30, 1243–1254. [Google Scholar]
- Zhang, R.; Chen, S.; Gao, L.; Hu, J.J. Spatiotemporal evolution and impact mechanism of ecological vulnerability in the Guangdong–Hong Kong–Macao Greater Bay Area. Ecol. Indic. 2023, 157, 111214. [Google Scholar] [CrossRef]
- Gomes, E.; Inácio, M.; Bogdzevič, K.; Kalinauskas, M.; Karnauskaitė, D.; Pereira, P. Future scenarios impact on land use change and habitat quality in Lithuania. Environ. Res. 2021, 197, 111101. [Google Scholar] [CrossRef] [PubMed]
- Ouyang, X.; Tang, L.; Wei, X.; Li, Y.F. Spatial Interaction between Urbanization and Ecosystem Services in Chinese Urban Agglomerations. Land Use Policy 2021, 109, 105587. [Google Scholar] [CrossRef]
- Wang, W.J.; Hu, S.Y.; Zhao, Z.K.; Wand, W.L. Spatiotemporal Characteristics of Ecosystem Service Value in Henan Province under Different Land Use Scenarios. Geogr. Geo-Inf. Sci. 2024, 5, 42–50. [Google Scholar]
- Tang, L.S.; Long, H.L. Simulating the Development of Resilient Human Settlement in Changsha. J. Geogr. Sci. 2022, 32, 1513–1529. [Google Scholar] [CrossRef]
- Domingo, D.; Palka, G.; Hersperger, A.M. Effect of Zoning Plans on Urban Land-Use Change: A Multi-Scenario Simulation for Supporting Sustainable Urban Growth. Sustain. Cities Soc. 2021, 69, 102833. [Google Scholar] [CrossRef]


| Data | Resource |
|---|---|
| Landsat TM/EMT | Data Center for Resources and Environmental Sciences, Chinese Academy of Sciences |
| Meteorological data: Elevation, Slope, Temperature, Precipitation, Soil types, Distance to waters. | Hunan Water Resources Bulletin |
| Socio-economic data: Population, GDP, Distance to a city; Distance to first-level road; Distance to second-level road; Distance to third-level road. | China Statistical Yearbook Hunan Statistical Yearbook Statistical Yearbook of prefecture-level cities in Hunan Province Data Compilation of National Agricultural Products Cost and Income Geo-spatial data cloud |
| Type of Ecosystem | Provisioning | Regulating | Supporting | Cultural | ||||||||
|---|---|---|---|---|---|---|---|---|---|---|---|---|
| First-Level Classification | Second-Level Classification | Food | Materials | Water | Air | Climate | Environmental Purification | Hydrological Regulation | Soil Conservation | Nutrient Cycling | Biodiversity | Aesthetic Value |
| Farmland | Paddy field | 1.36 | 0.09 | −2.63 | 1.11 | 0.57 | 0.17 | 2.72 | 0.01 | 0.19 | 0.21 | 0.09 |
| Dry land | 0.85 | 0.4 | 0.02 | 0.67 | 0.36 | 0.1 | 0.27 | 1.03 | 0.12 | 0.13 | 0.06 | |
| Forest | Coniferous | 0.22 | 0.52 | 0.27 | 1.7 | 5.07 | 1.49 | 3.34 | 2.06 | 0.16 | 1.88 | 0.82 |
| Mixed forest | 0.31 | 0.71 | 0.37 | 2.35 | 7.03 | 1.99 | 3.51 | 2.86 | 0.22 | 2.6 | 1.14 | |
| Broadleaf | 0.29 | 0.66 | 0.34 | 2.17 | 6.5 | 1.93 | 4.74 | 2.65 | 0.2 | 2.41 | 1.06 | |
| Grassland | Shrub forest | 0.19 | 0.43 | 0.22 | 1.41 | 4.23 | 1.28 | 3.35 | 1.72 | 0.13 | 1.57 | 0.69 |
| Shrubland | 0.38 | 0.56 | 0.31 | 1.97 | 5.21 | 1.72 | 3.82 | 2.4 | 0.18 | 2.18 | 0.96 | |
| Meadow | 0.22 | 0.33 | 0.18 | 1.14 | 3.02 | 1 | 2.21 | 1.39 | 0.11 | 1.27 | 0.56 | |
| Grassland | 0.1 | 0.14 | 0.08 | 0.51 | 1.34 | 0.44 | 0.98 | 0.62 | 0.05 | 0.56 | 0.25 | |
| Wetland | Swamp | 0.21 | 0.25 | 1.3 | 0.95 | 1.8 | 1.8 | 12.12 | 1.2 | 0.09 | 3.94 | 2.37 |
| Intertidal zone | 0.3 | 0.25 | 1.29 | 0.95 | 1.8 | 1.8 | 12.11 | 1.11 | 0.09 | 3.93 | 2.36 | |
| Desert | Bare land | 0.01 | 0.03 | 0.02 | 0.11 | 0.1 | 0.31 | 0.21 | 0.13 | 0.01 | 0.12 | 0.05 |
| Other | 0 | 0 | 0 | 0.02 | 0 | 0.1 | 0.03 | 0.02 | 0 | 0.02 | 0.01 | |
| Waters | Waterway | 0.4 | 0.12 | 8.36 | 0.72 | 2.12 | 4.57 | 87.5 | 0.41 | 0.04 | 2.05 | 1.58 |
| Lake | 0.8 | 0.23 | 8.29 | 0.77 | 2.29 | 5.55 | 102.24 | 0.93 | 0.07 | 2.55 | 1.89 | |
| Reservoir | 0.4 | 0.11 | 2.09 | 0.23 | 0.71 | 1.14 | 21.87 | 0.52 | 0.03 | 0.51 | 0.4 | |
| Building/ Construction Land | Urban land | 0 | 0 | 0 | 0 | −1.29 | 0 | −1.51 | 0.55 | 0 | 0 | 0.69 |
| Rural settlement | 0 | 0 | 0 | 0 | −1.29 | 0 | −1.5 | 0.55 | 0 | 0 | 0.7 | |
| Other | 0 | 0 | 0 | 0 | −1.29 | 0 | −1.51 | 0.55 | 0 | 0 | 0.69 | |
| First-Level Classification | Second-Level Classification |
|---|---|
| Cropland | Paddy fields and dry land |
| Forest | Coniferous forest, mixed forest, broadleaf, and shrub forest |
| Grass | Scrubland, meadow, and grassland |
| Waters | Waterways, lakes, and reservoirs |
| Building | Urban land, rural settlement, and other |
| Wetland | Swamps and intertidal zones |
| Unused land | Bare land and other |
| Land Use Types | 1995–2000 | 2000–2005 | 2005–2010 | 2010–2015 | 2015–2020 | |||||
|---|---|---|---|---|---|---|---|---|---|---|
| Change | Dynamics | Change | Dynamics | Change | Dynamics | Change | Dynamics | Change | Dynamics | |
| Grassland | 7.51 | 0.56 | −0.51 | −0.04 | −25.27 | −1.83 | −1.82 | −0.15 | −4.39 | −0.35 |
| Farmland | 1.52 | 0.01 | −19.02 | −0.12 | −35.04 | −0.21 | −23.21 | −0.14 | −36.61 | −0.23 |
| Construction land | 4.38 | 0.51 | 25.44 | 2.87 | 83.24 | 8.21 | 41.86 | 2.93 | 62.54 | 3.81 |
| Forest | −9.85 | −0.03 | −7.74 | −0.02 | −21.08 | −0.06 | −17.82 | −0.05 | −22.72 | −0.07 |
| Wetland | 6.66 | 1.88 | 2.18 | 0.56 | −5.36 | −1.34 | 27.88 | 7.68 | −1.29 | −0.25 |
| Waters | −10.3 | −0.62 | −0.18 | −0.01 | 2.47 | 0.15 | −26.89 | −1.67 | 2.91 | 0.20 |
| Unused land | 0.01 | 0.15 | −0.11 | −1.51 | 1.06 | 17.10 | 0.01 | 0.11 | −0.44 | −3.88 |
| Comprehensive land use dynamics | 0.18 | 0.12 | 0.33 | 0.31 | 0.55 | |||||
| Pattern | Description |
|---|---|
| Natural development scenario | Simulate land use change patterns from 1995 to 2020. |
| Economic development scenario | Primarily expand construction land while appropriately increasing the conversion probability of other land uses to construction. |
| Farmland security development scenario | Prohibit the conversion of arable land to other uses while appropriately increasing the probability of converting other land uses to arable land. |
| Ecological protection scenario | Prohibit the conversion of water bodies and forest land to other uses while increasing the probability of converting other land uses to water bodies and forest land. |
| Coordinated development scenario | Increase the probability of converting other land uses to arable and forest land while decreasing the probability of conversion to construction land. |
| Land Use Types | 1995–2020 Land Use Dynamics | 2020–2035 Land Use Dynamics (%) | ||||
|---|---|---|---|---|---|---|
| Natural Development Scenario | Economic Development Scenario | Farmland Protection Development Scenario | Ecological Protection Scenario | Coordinated Development Scenario | ||
| Grassland | −0.36 | −1.42 | −1.46 | −1.41 | −1.39 | −1.32 |
| Farmland | −0.14 | −0.40 | −0.47 | 0.08 | −0.51 | −0.38 |
| Construction | 5.03 | 4.42 | 7.68 | 0.17 | −1.09 | 0.25 |
| Forest | −0.05 | −0.03 | −0.16 | 0.03 | 0.38 | 0.25 |
| Wetland | 1.69 | 2.54 | 0.92 | −0.21 | −0.64 | −0.19 |
| Waters | −0.38 | −0.62 | −0.61 | −0.60 | −0.11 | −0.60 |
| Unused land | 1.59 | −3.66 | −4.80 | −2.94 | −3.87 | −5.09 |
| Land Use Types | Ecosystem Service Value/Hundred Million CNY | |||||
|---|---|---|---|---|---|---|
| 2020 | Natural Development Scenario | Economic Development Scenario | Cropland Security Development Scenario | Ecological Protection Scenario | Coordinated Development Scenario | |
| Grassland | 175.99 | 75.46 | 74.90 | 75.60 | 75.96 | 76.84 |
| Cropland | 488.45 | 385.27 | 381.06 | 414.51 | 378.63 | 386.41 |
| Construction land | −23.75 | −32.85 | −42.52 | −20.25 | −16.52 | −20.50 |
| Forest | 4837.13 | 4203.19 | 4118.64 | 4243.07 | 4458.82 | 4377.91 |
| Wetland | 102.89 | 118.35 | 97.50 | 83.02 | 77.50 | 83.28 |
| Water | 1072.26 | 775.25 | 776.44 | 777.43 | 840.44 | 778.06 |
| Unused land | 0.07 | 0.02 | 0.01 | 0.02 | 0.02 | 0.01 |
| Total | 6653.03 | 5524.68 | 5406.03 | 5573.41 | 5814.84 | 5682.01 |
Disclaimer/Publisher’s Note: The statements, opinions and data contained in all publications are solely those of the individual author(s) and contributor(s) and not of MDPI and/or the editor(s). MDPI and/or the editor(s) disclaim responsibility for any injury to people or property resulting from any ideas, methods, instructions or products referred to in the content. |
© 2025 by the authors. Licensee MDPI, Basel, Switzerland. This article is an open access article distributed under the terms and conditions of the Creative Commons Attribution (CC BY) license (https://creativecommons.org/licenses/by/4.0/).
Share and Cite
Tang, L.; Li, J.; Xie, C.; Wang, M. Multi-Scenario Simulation of Ecosystem Service Value in Xiangjiang River Basin, China, Based on the PLUS Model. Land 2025, 14, 1482. https://doi.org/10.3390/land14071482
Tang L, Li J, Xie C, Wang M. Multi-Scenario Simulation of Ecosystem Service Value in Xiangjiang River Basin, China, Based on the PLUS Model. Land. 2025; 14(7):1482. https://doi.org/10.3390/land14071482
Chicago/Turabian StyleTang, Lisha, Jingzhi Li, Chenmei Xie, and Miao Wang. 2025. "Multi-Scenario Simulation of Ecosystem Service Value in Xiangjiang River Basin, China, Based on the PLUS Model" Land 14, no. 7: 1482. https://doi.org/10.3390/land14071482
APA StyleTang, L., Li, J., Xie, C., & Wang, M. (2025). Multi-Scenario Simulation of Ecosystem Service Value in Xiangjiang River Basin, China, Based on the PLUS Model. Land, 14(7), 1482. https://doi.org/10.3390/land14071482