


Urban Heat Islands and Land-Use Patterns in Zagreb: A Composite Analysis Using Remote Sensing and Spatial Statistics


Abstract
1. Introduction
1.1. UHI Drivers and Vegetation Mitigation
1.2. Spatial-Statistical Methods
1.3. Regional Research Gap
2. Materials and Methods
2.1. Study Area and Climatic Context
2.2. Data Sources and Spatial Layers
2.3. Remote Sensing Preprocessing
2.4. Zonal Statistics and Variable Derivation
2.5. Regression Models and Hypothesis Assessment
3. Results
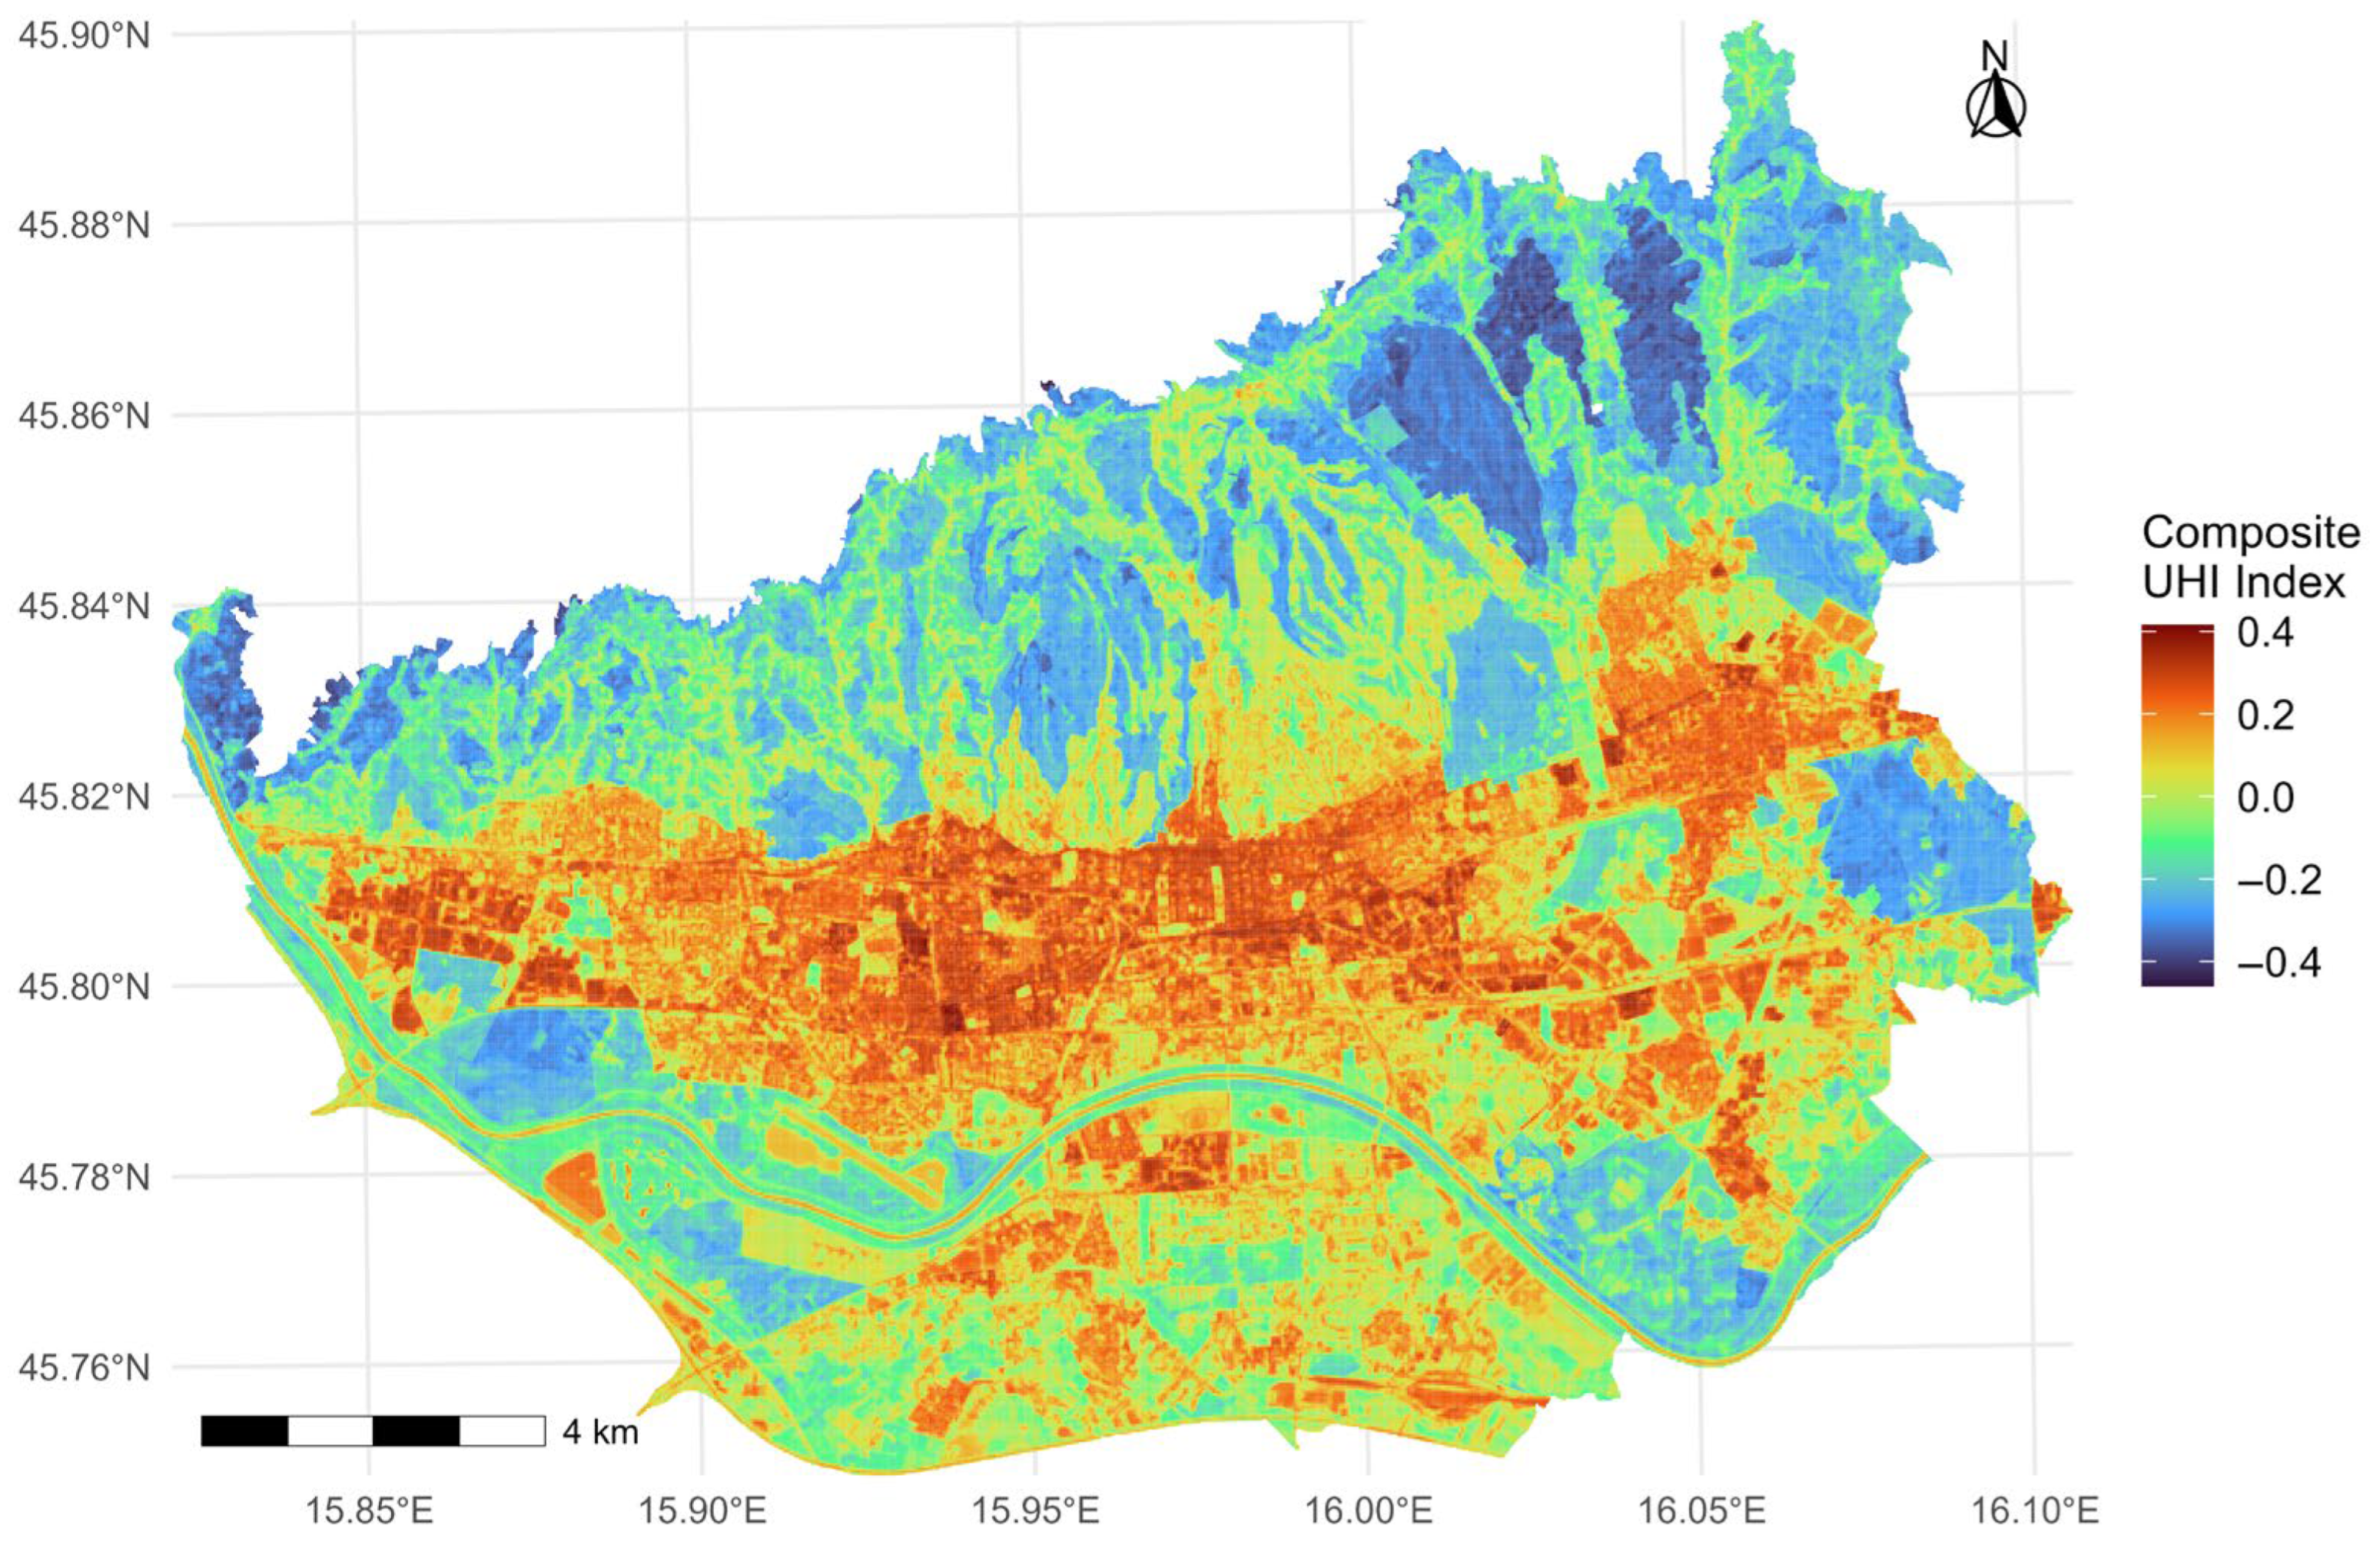
3.1. Spatial and Thermal Characterization of the Urban Environment
3.2. Statistical Validation of Hypotheses
3.3. Analytical Objectives
3.4. Synthesis of Analytical Objectives and Key Findings
4. Discussion
5. Conclusions
Author Contributions
Funding
Data Availability Statement
Conflicts of Interest
Appendix A

| Script Name | Packages | Purpose | Key Inputs | Key Outputs |
|---|---|---|---|---|
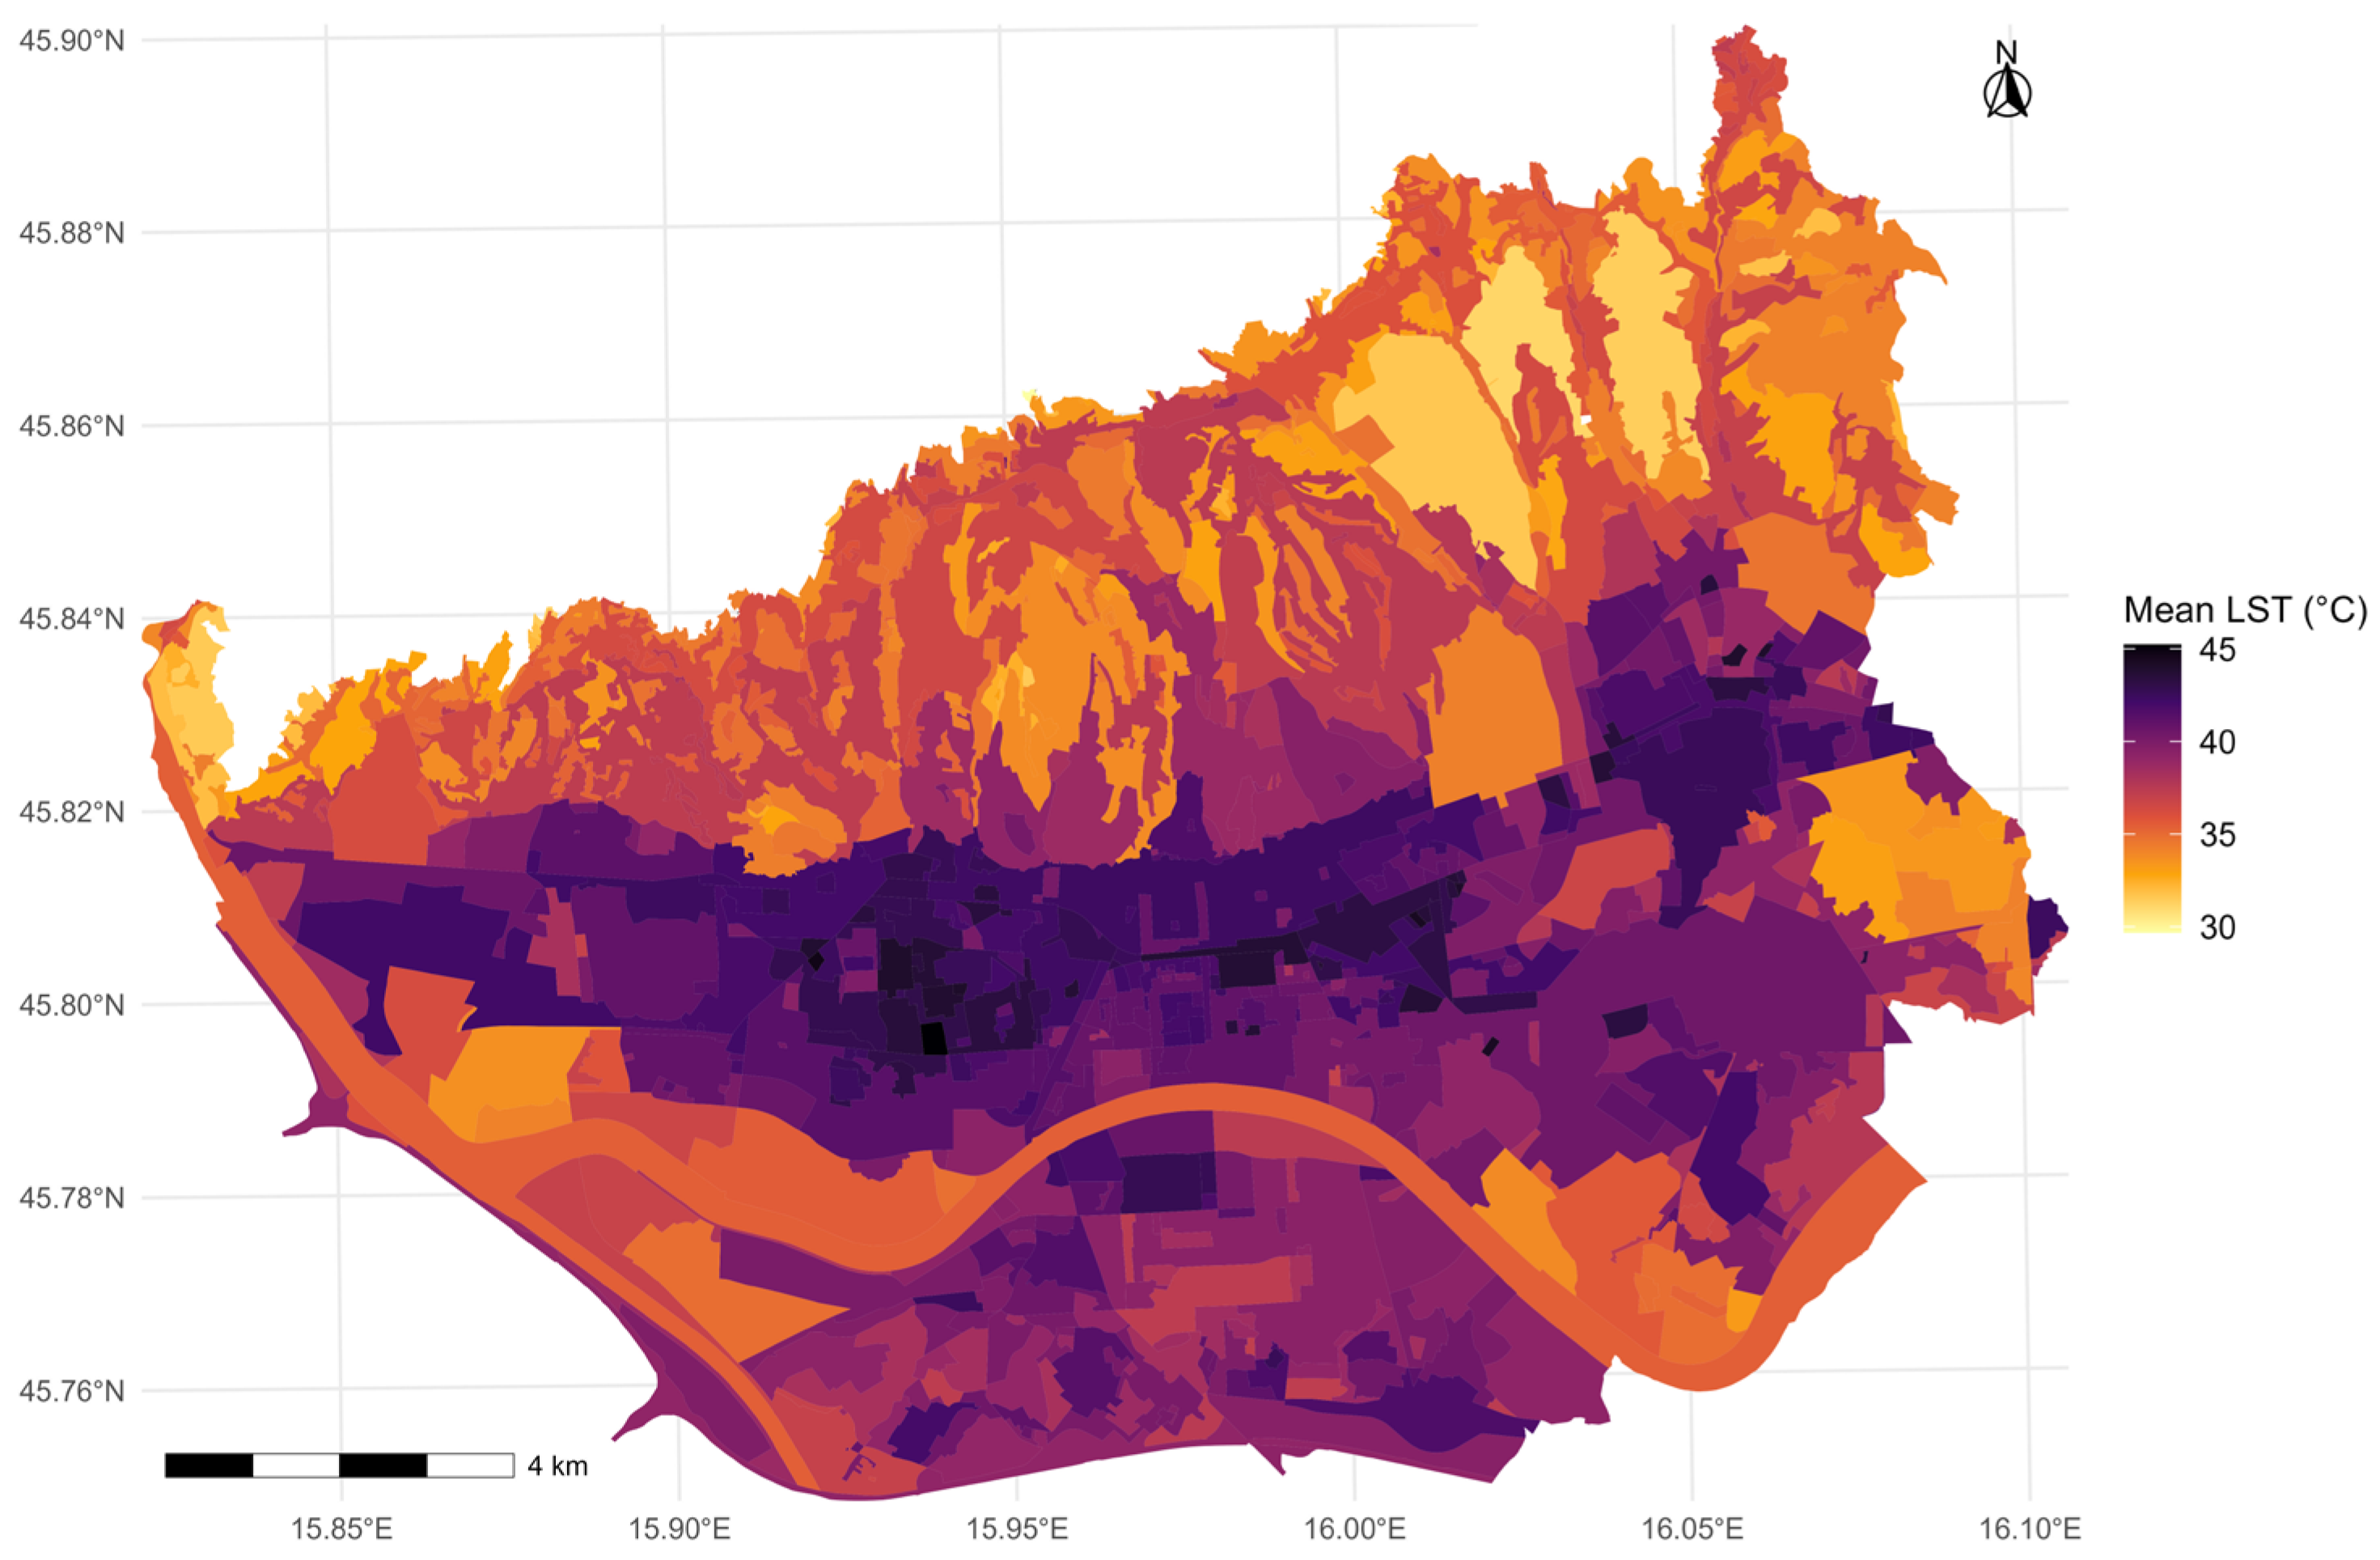
| prepare_LST.R | raster, sf, ggplot2 | Convert thermal bands to Land Surface Temperature (LST) and generate summer composite | Thermal infrared satellite bands (Landsat Band 10); Urban planning boundary | Raster of composite mean surface temperature (LST) |
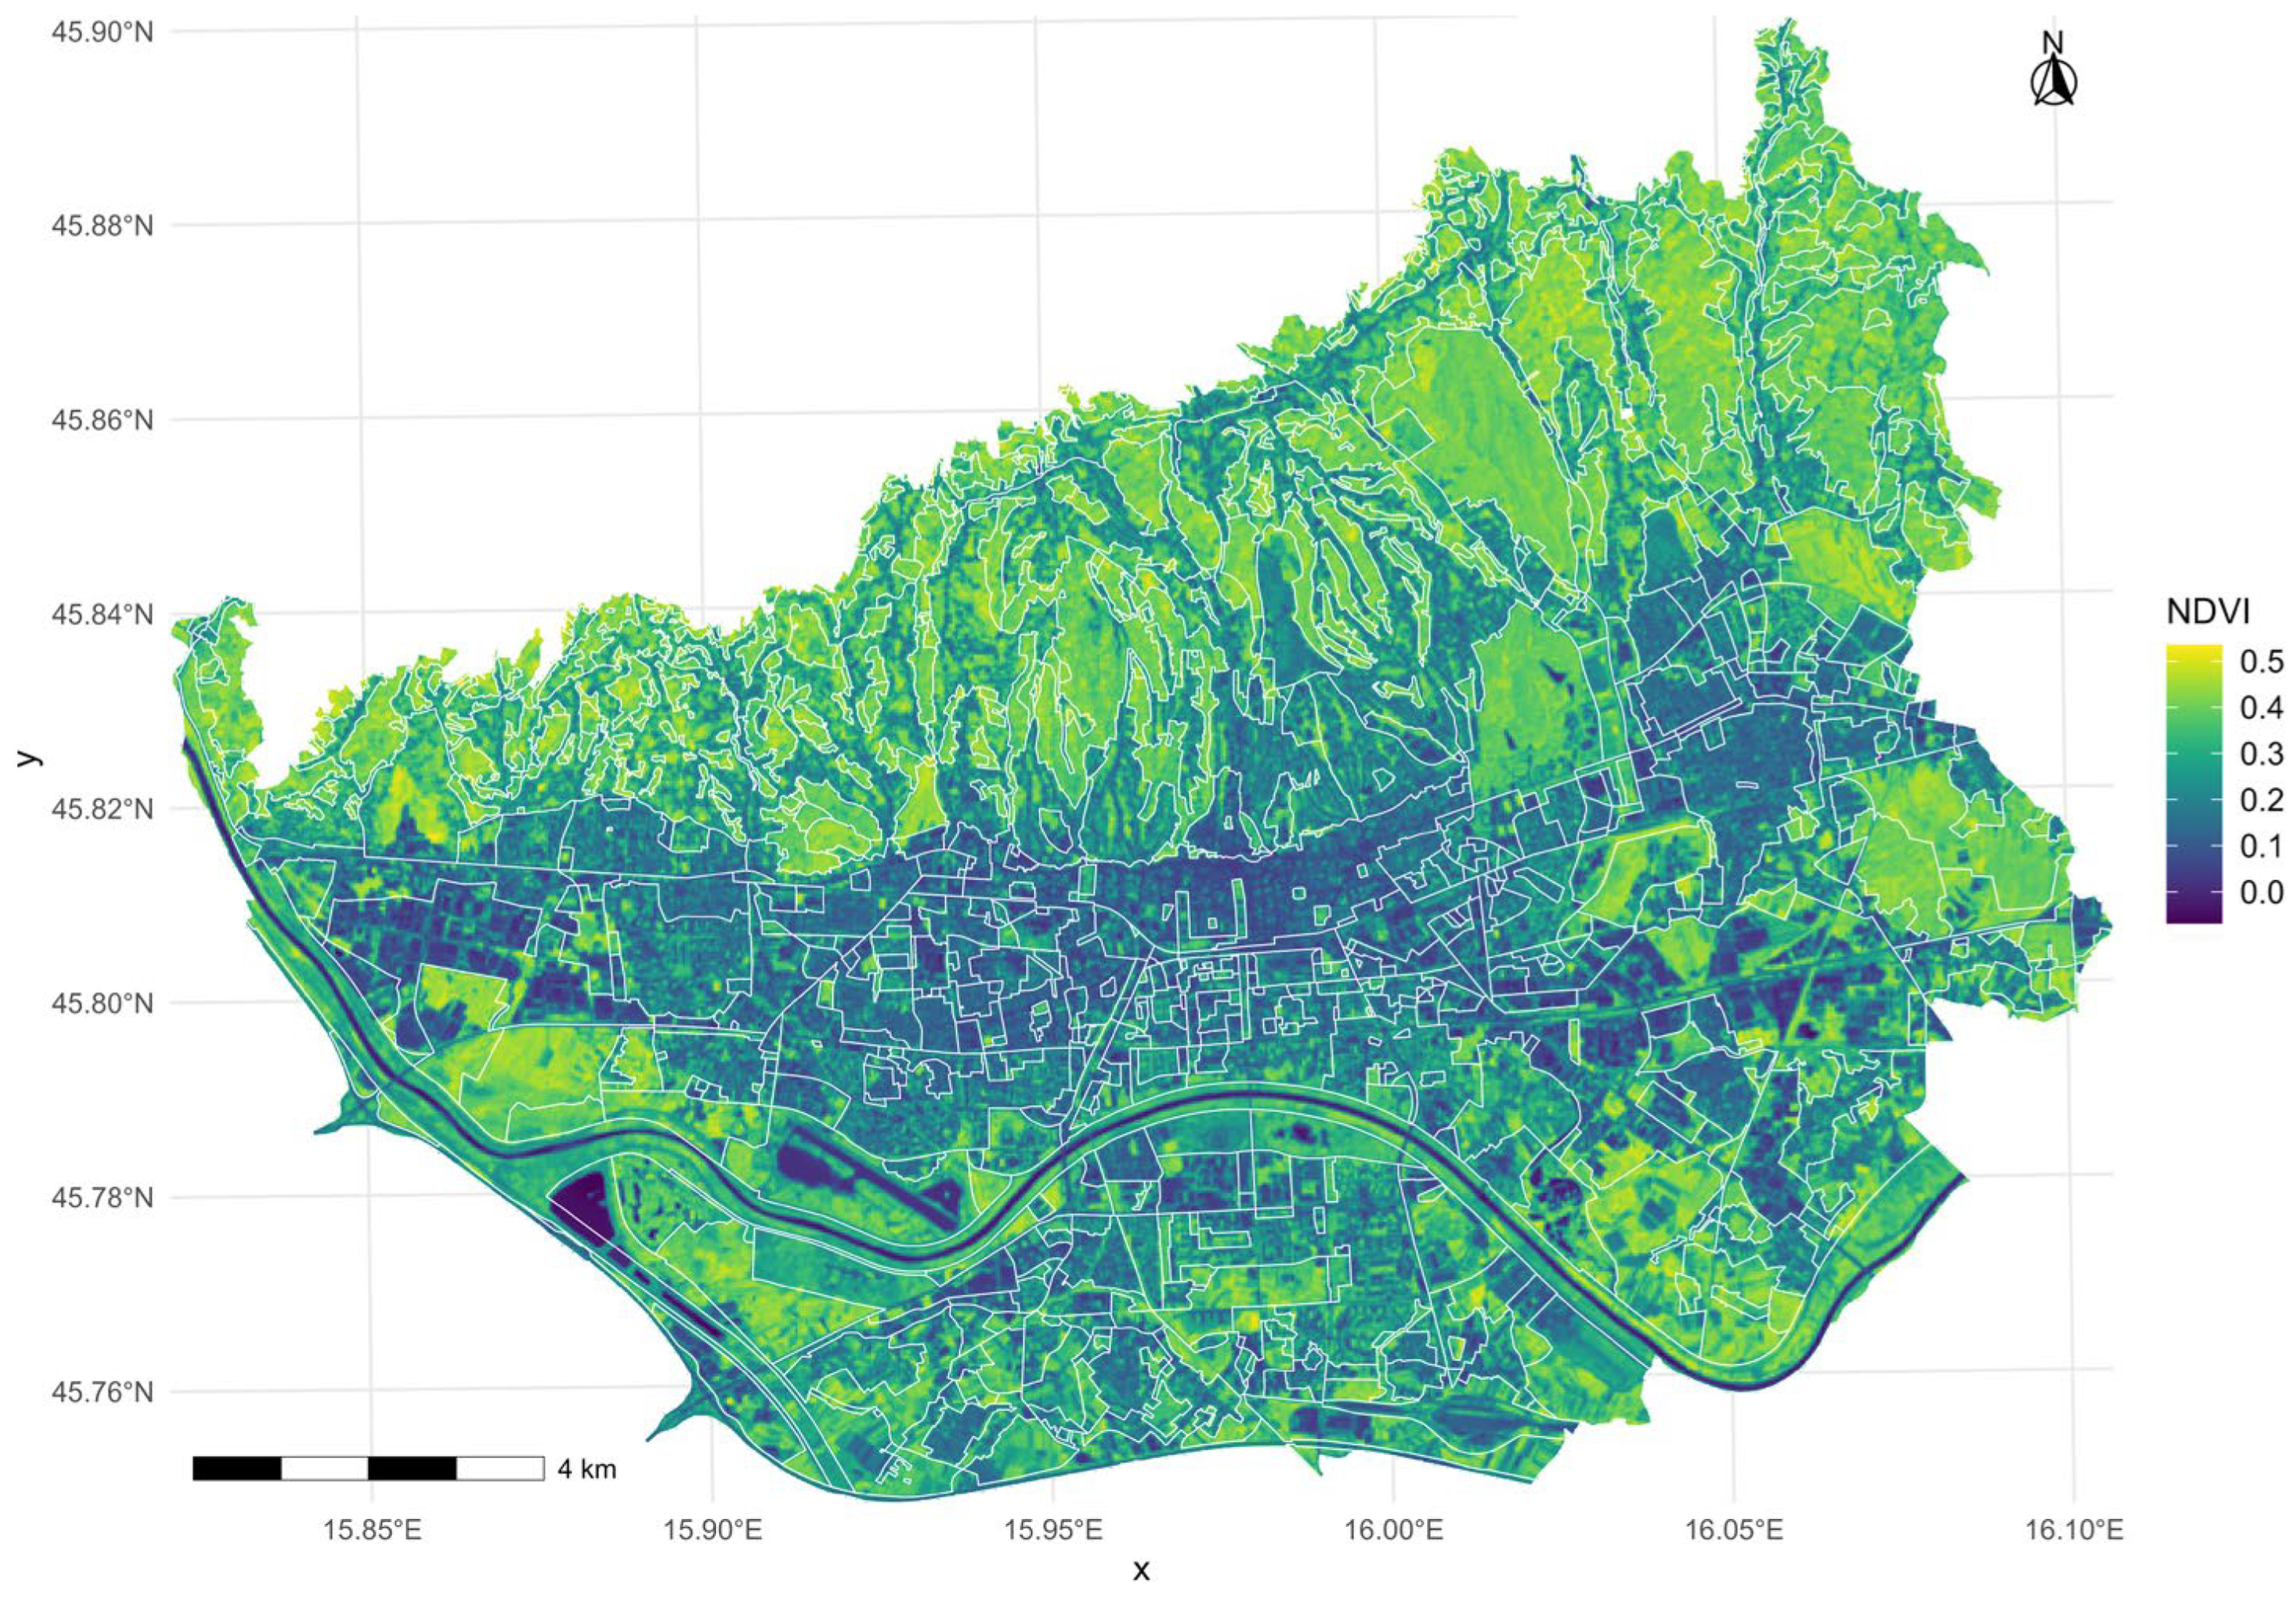
| prepare_NDVI.R | raster, sf, ggplot2 | Calculate NDVI from multispectral bands and generate composite vegetation index | Multispectral bands (Landsat Red and NIR); Urban planning boundary | Raster of composite mean NDVI (Normalized Difference Vegetation Index) |
| zonal_stats.R | sf, raster, dplyr, tidyr | Derive mean LST per planning unit; compute green surface area and built-up ratio indicators | Composite LST raster; Planning units; GUP land-use polygons | Shapefile with mean temperature and regulatory indicators per planning unit |
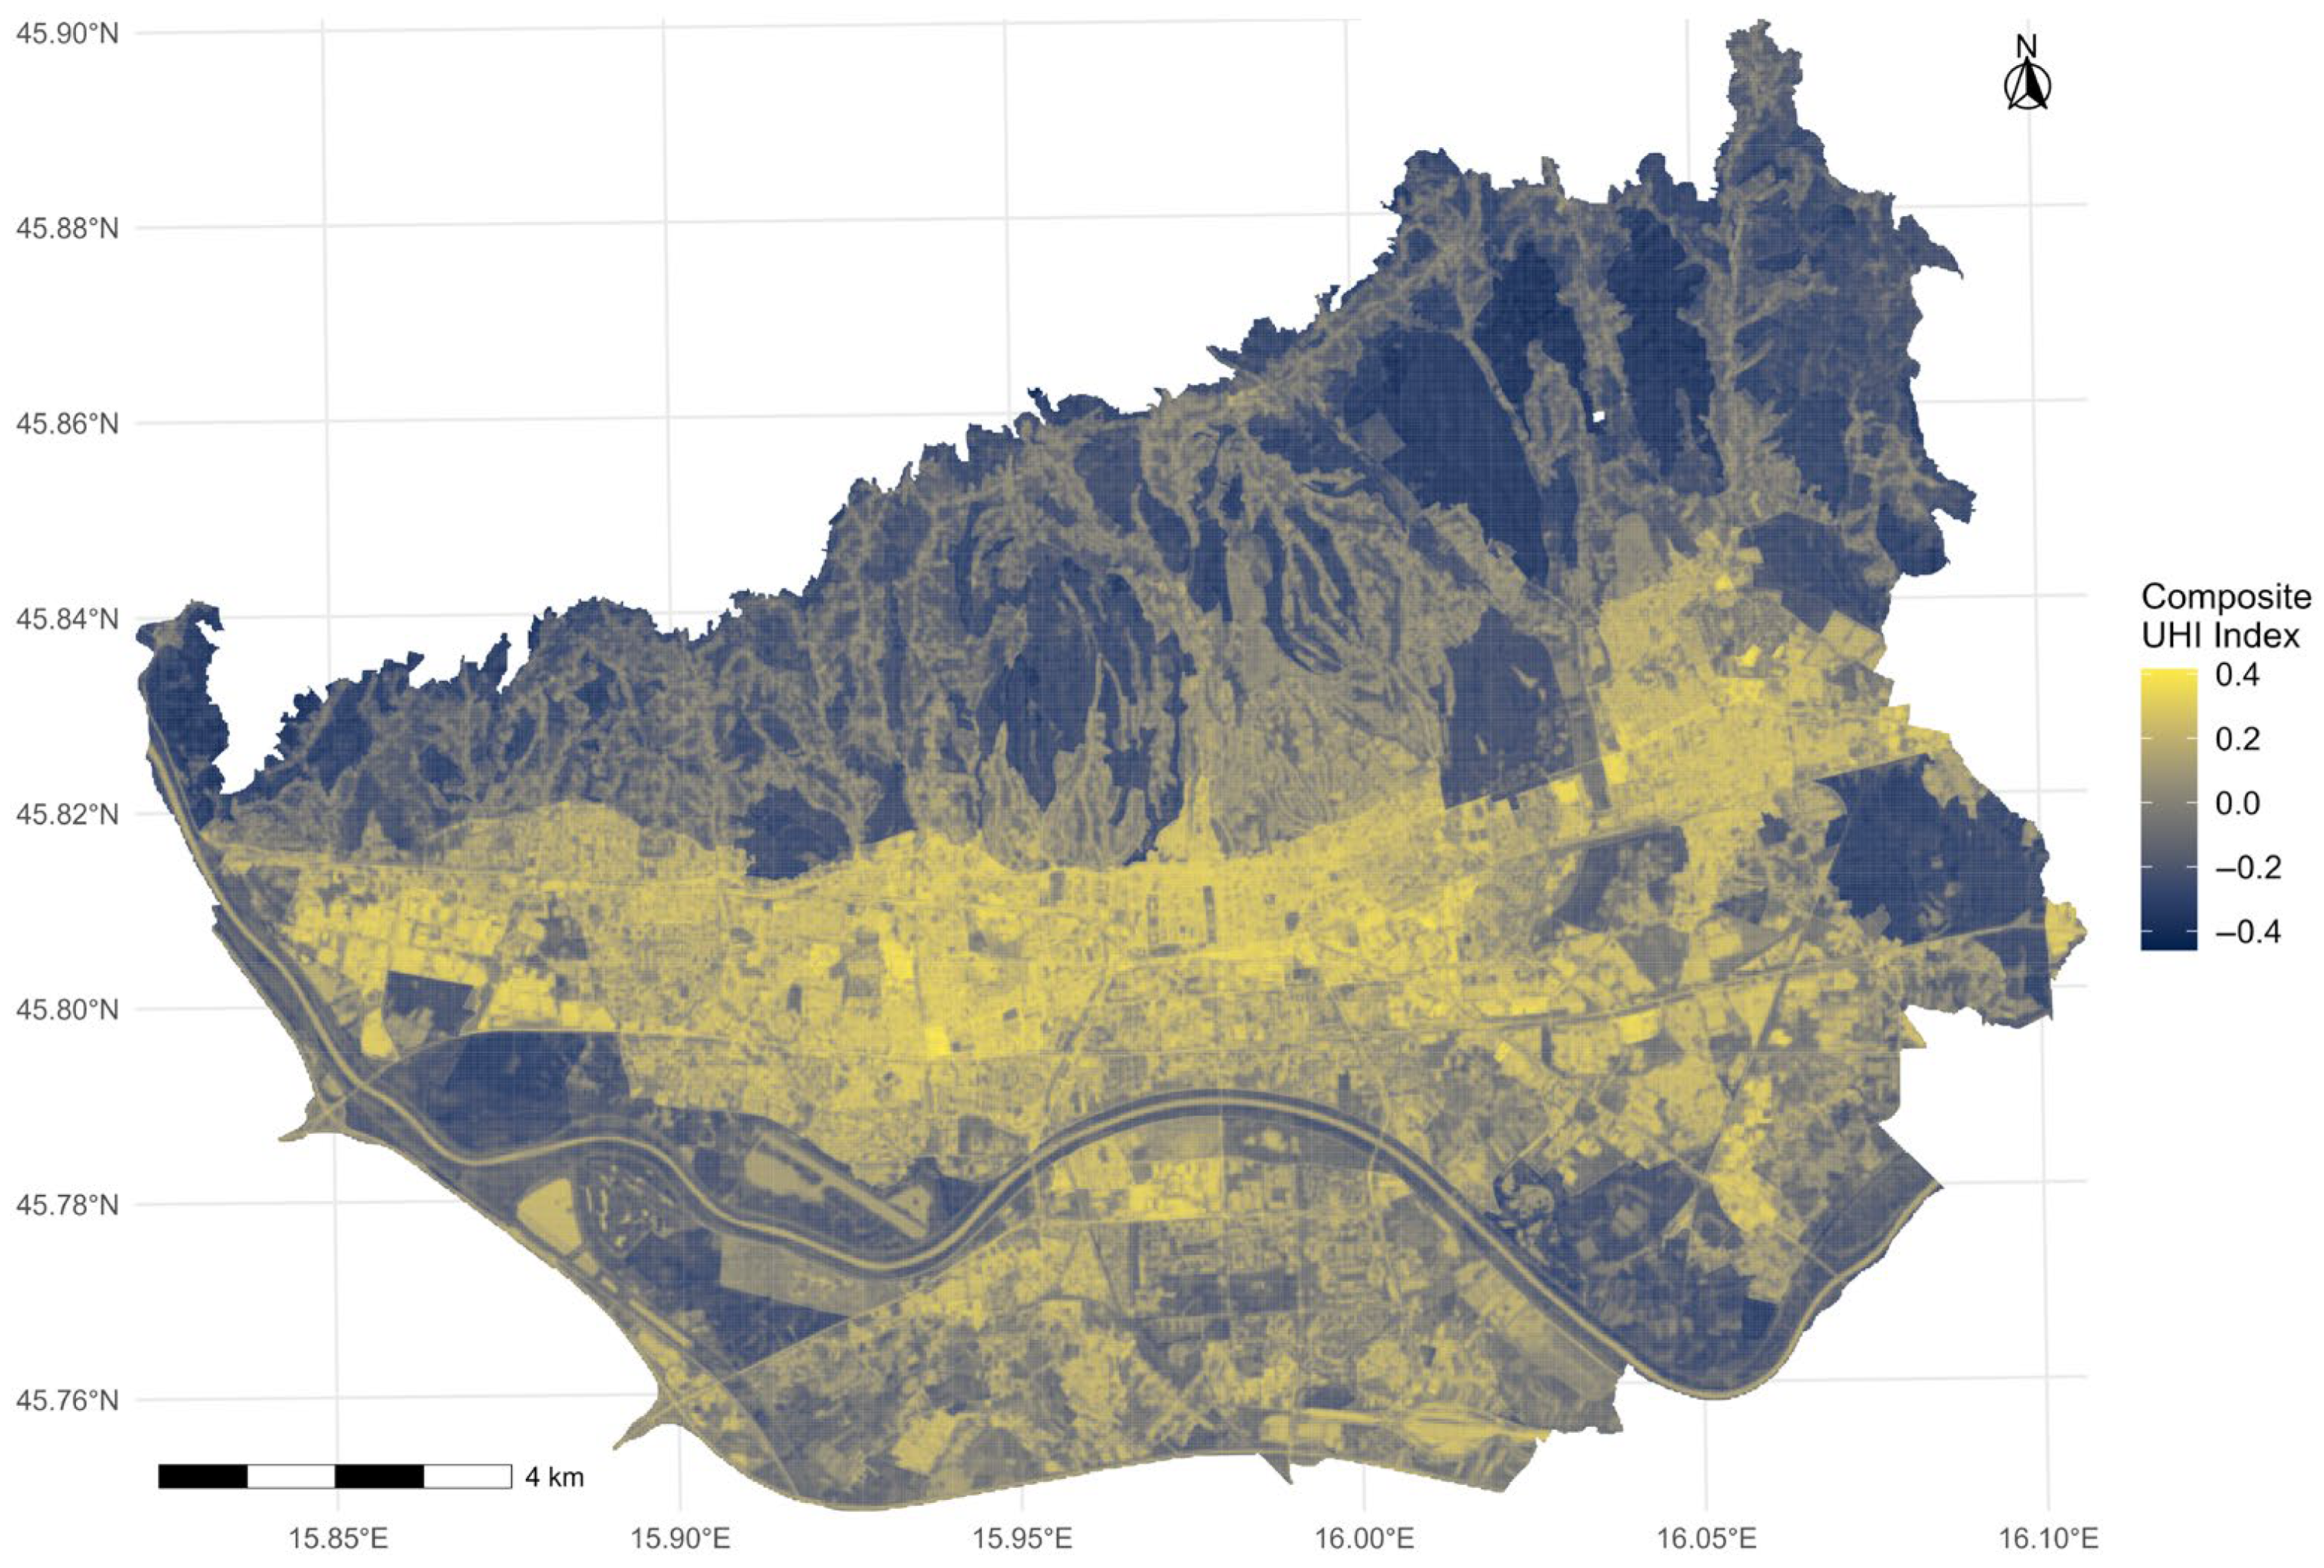
| uhi_composite.R | sf, dplyr, ggplot2, viridis | Construct composite UHI index from normalized LST and NDVI values | NDVI polygons; Planning unit temperature values | Polygon layer with composite UHI index and categorized thermal zones |
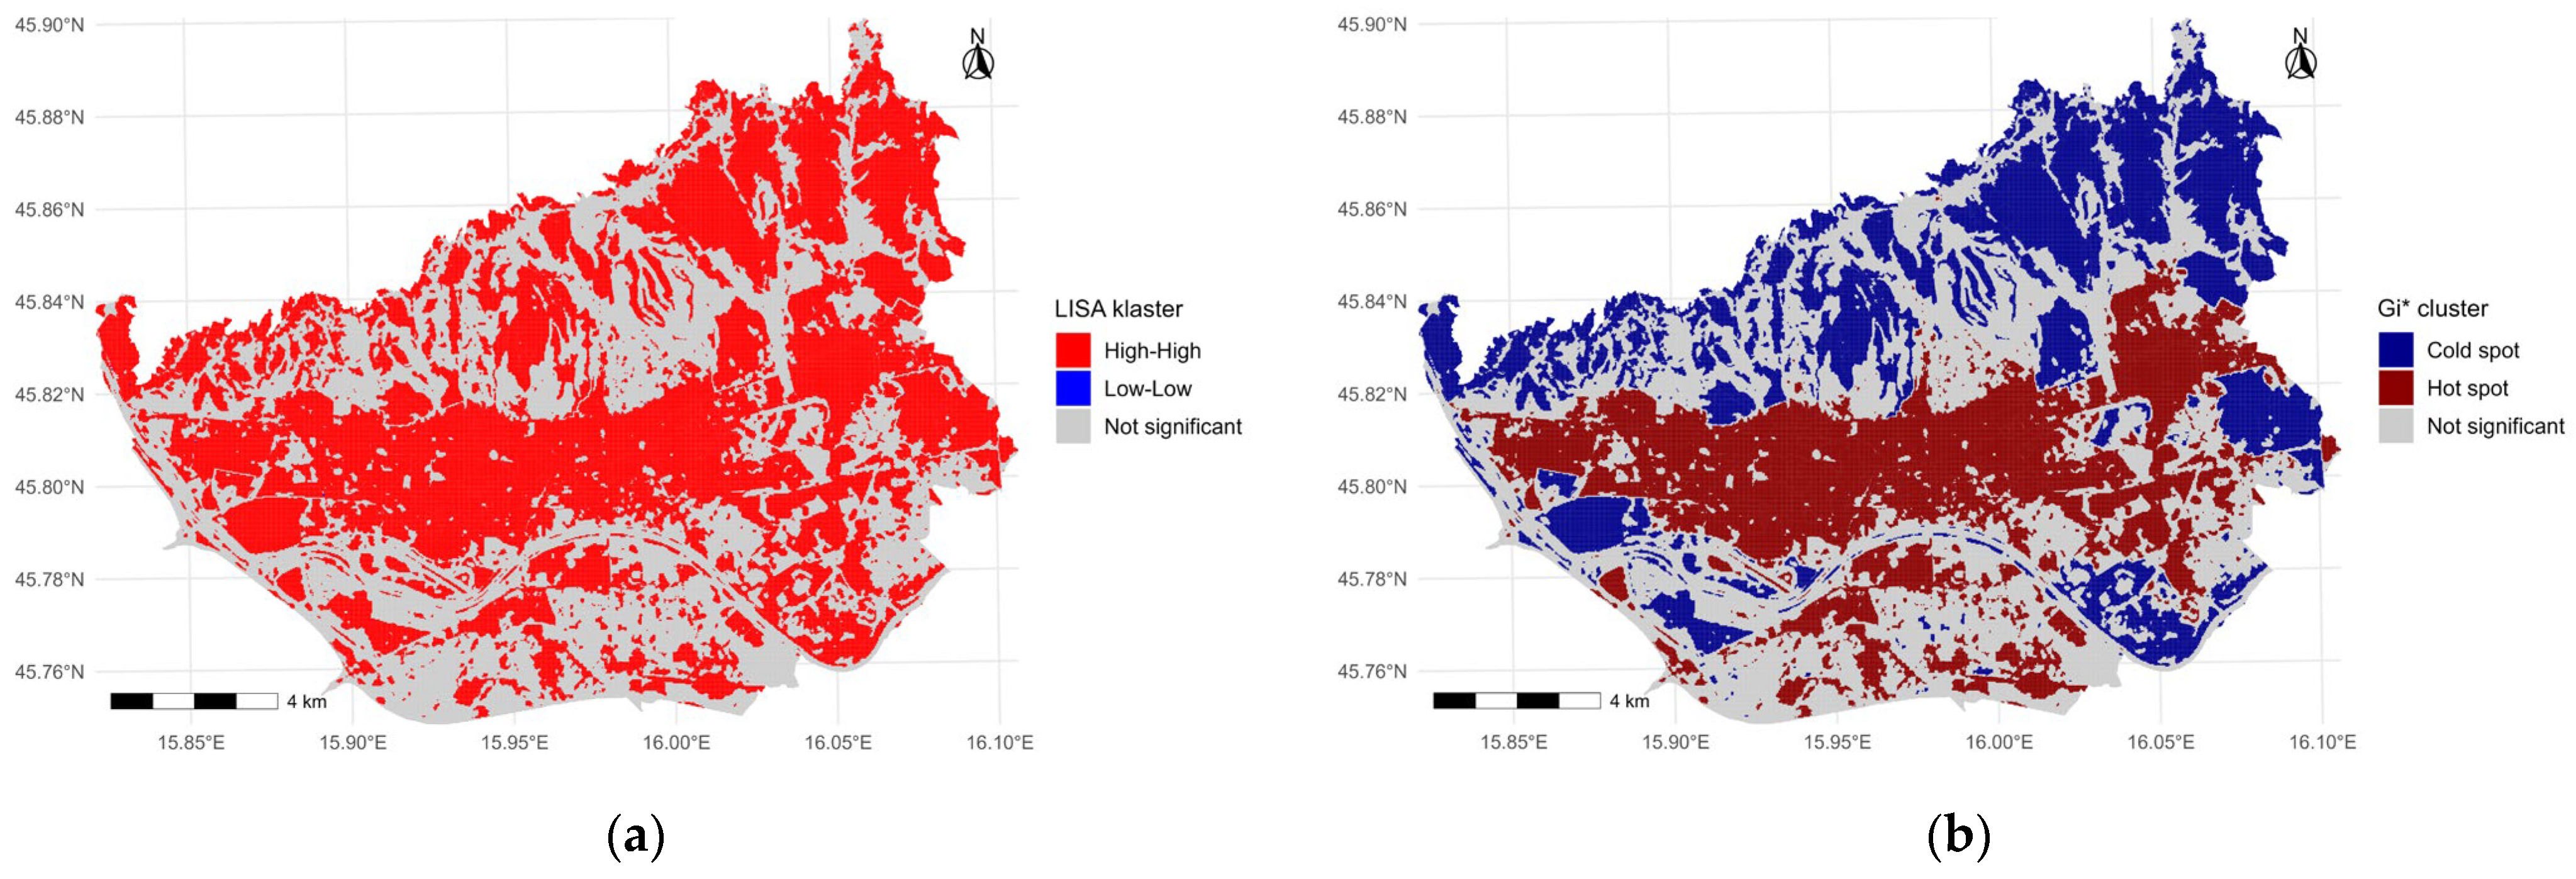
| uhi_autocorrelation.R | sf, spdep, dplyr, ggplot2 | Assess spatial clustering of UHI values using Moran’s I and Getis-Ord Gi* | Composite UHI index polygon layer | Shapefile with LISA and Gi* cluster classifications; Maps of spatial autocorrelation |
| hypotheses_uhi.R | sf, raster, dplyr, stats | Test multiple regression and correlation hypotheses linking planning indicators, LST, and NDVI | Shapefile with UHI, NDVI, LST, and planning attributes | Model outputs for hypotheses Regression and correlation statistics |
| uhi_key_visuals.R | ggplot2, sf, raster, viridis | Generate visuals for hypothesis validation and key results presentation | All previously derived layers and model outputs | Figures illustrating hypotheses and Objectives |
Appendix B
| Code | Description | Method | Key Inputs | Key Outputs |
|---|---|---|---|---|
| H1 | Higher built-up density is associated with increased surface temperatures. | Univariate linear regression | Planning unit shapefile with built-up ratio + LST | Model coefficients, R2, correlation |
| H2 | Greater planned green area is associated with lower surface temperatures. | Univariate linear regression | Planning unit shapefile with green area metrics + LST | Model coefficients, R2, correlation |
| H3 | NDVI and LST values are negatively correlated at the pixel level. | Pixel-wise correlation analysis | NDVI raster, LST raster (pixel alignment) | Pearson r (NDVI vs. LST) |
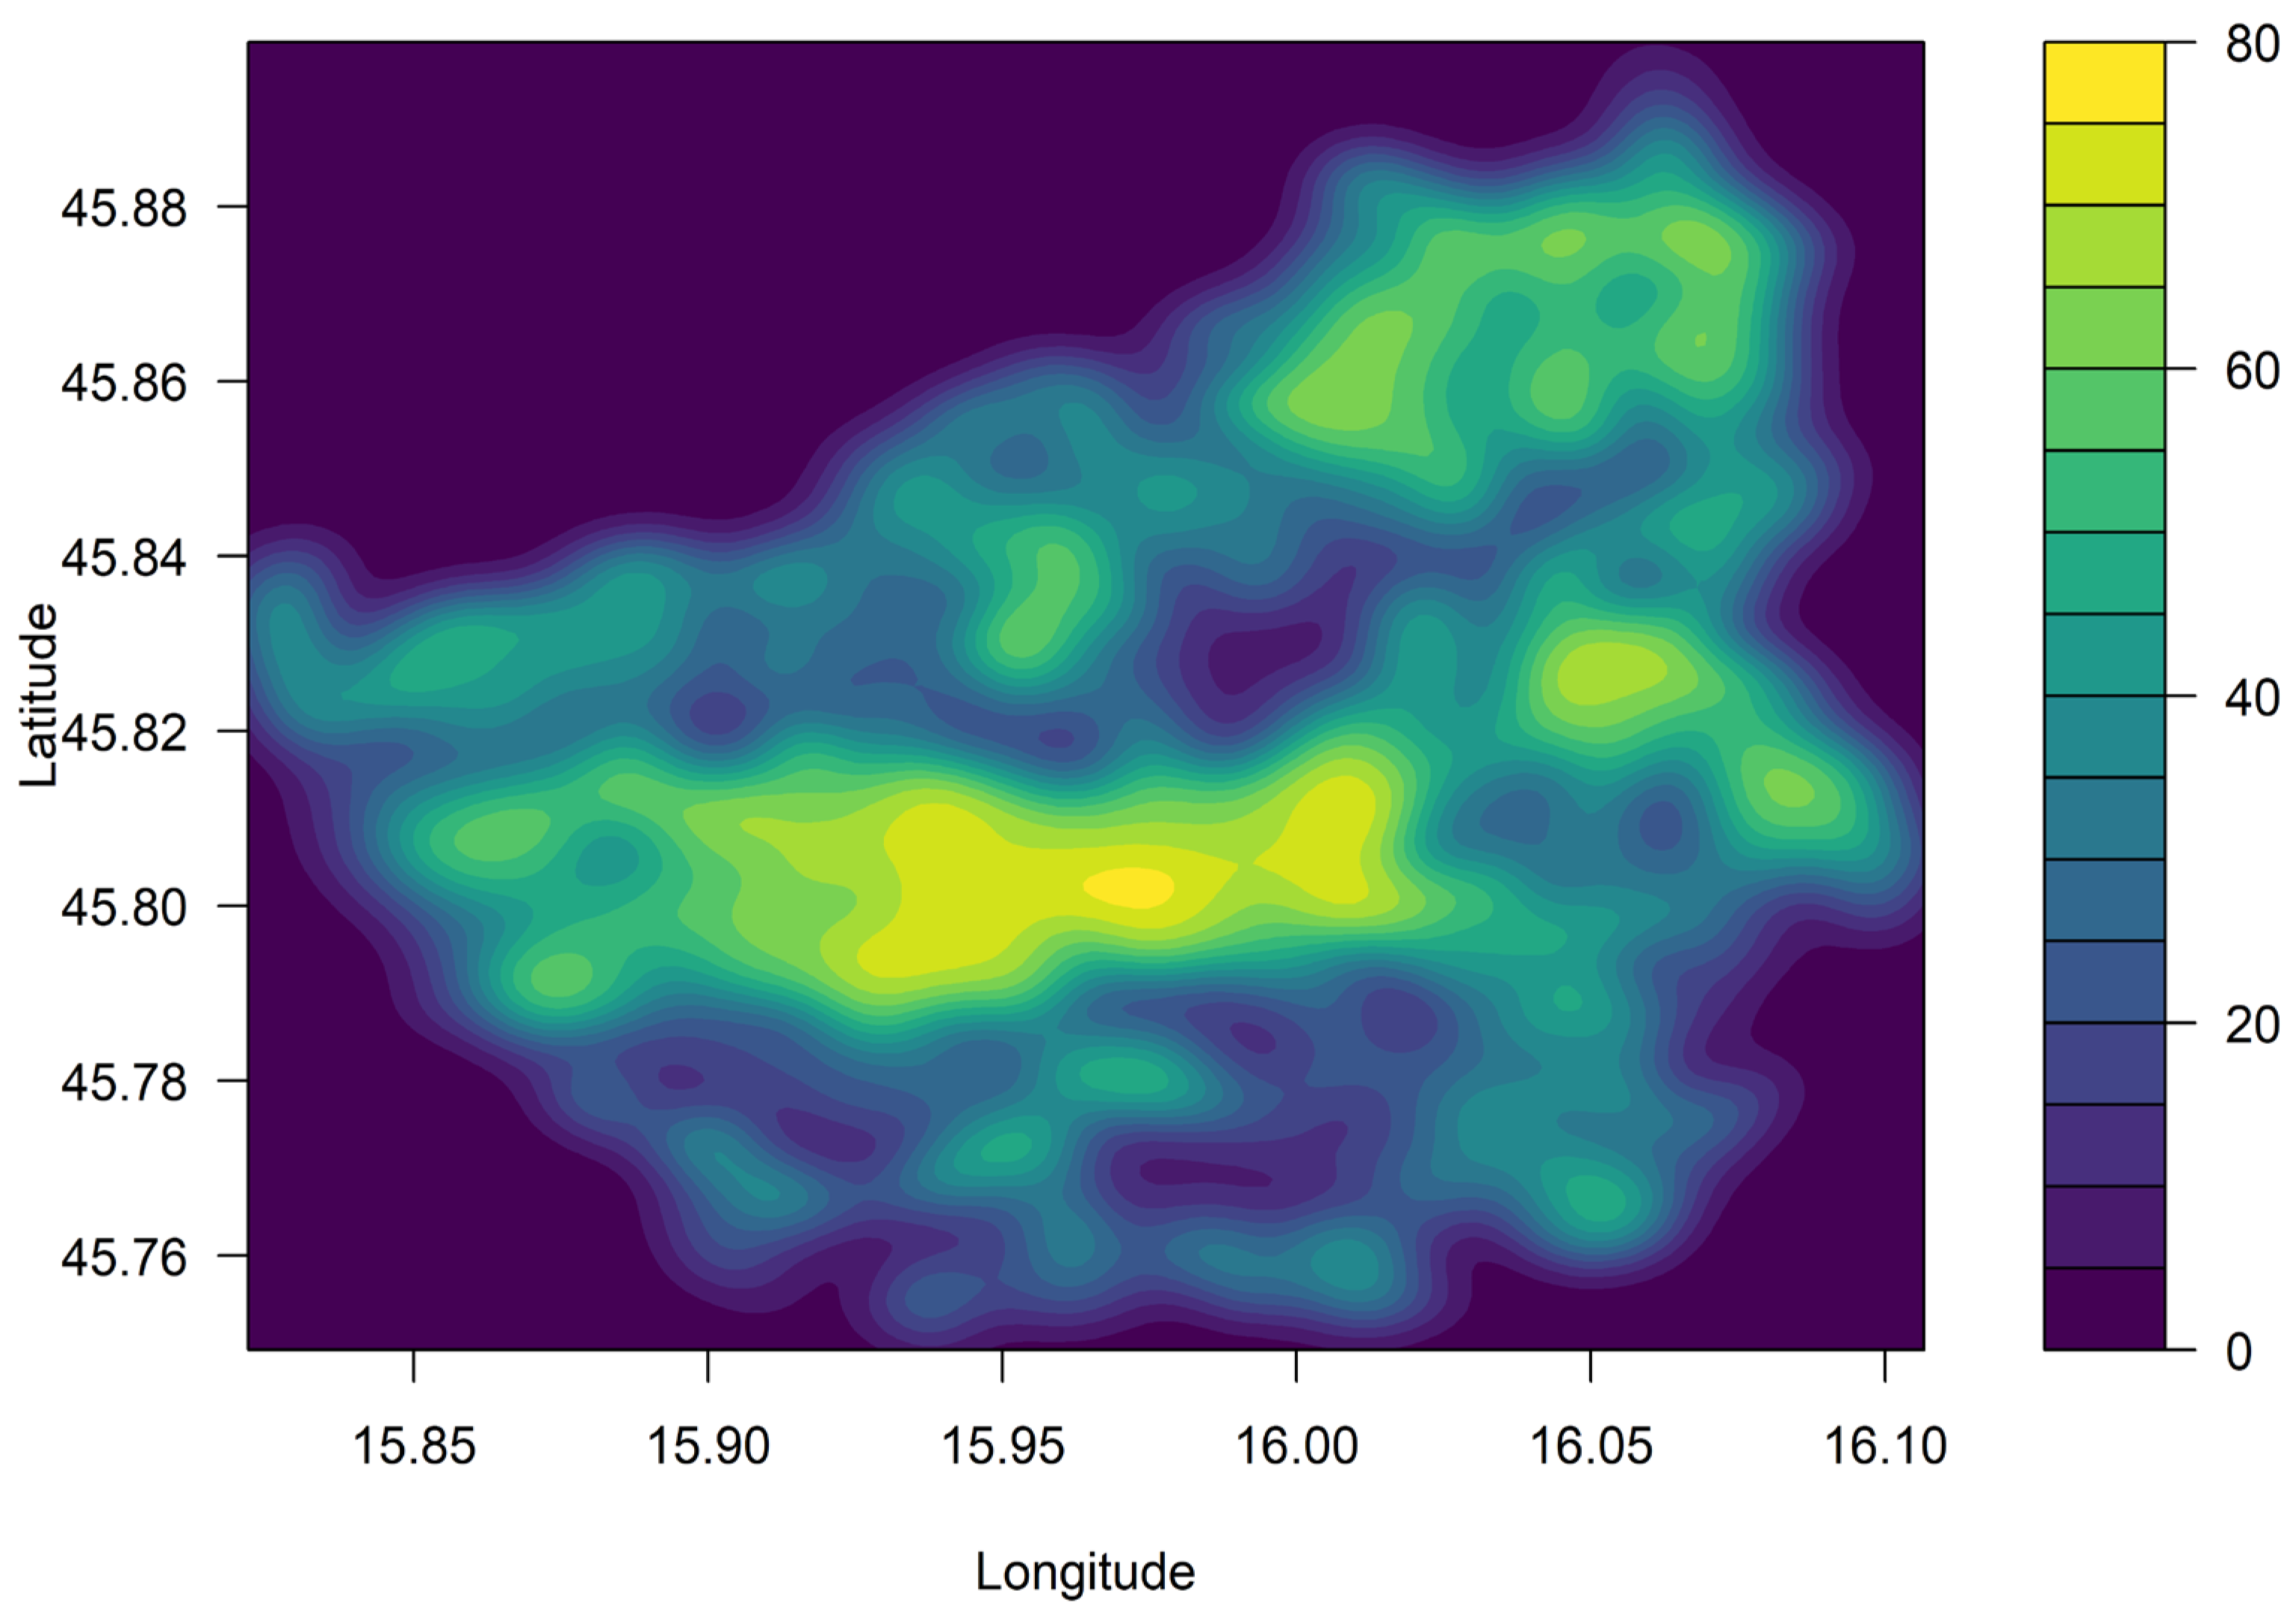
| H4 | UHI intensity exhibits spatial clustering (hot/cold spots). | LISA (Local Morans’I), Getis-Ord Gi* | Composite UHI index shapefile | Cluster maps (LISA, Gi*) |
| O1 | Identify whether priority thermal zones intersect with residential land use. | Spatial intersection (priority zones/residential zones) | Priority zone mask, residential land-use polygons | Map overlap metrics (counts, visualizations) |
| O2 | Construct composite UHI index from normalized LST and NDVI. | Index construction: normalized LST and NDVI | Normalized LST and NDVI rasters intersected with planning units | Composite UHI raster/polygons |
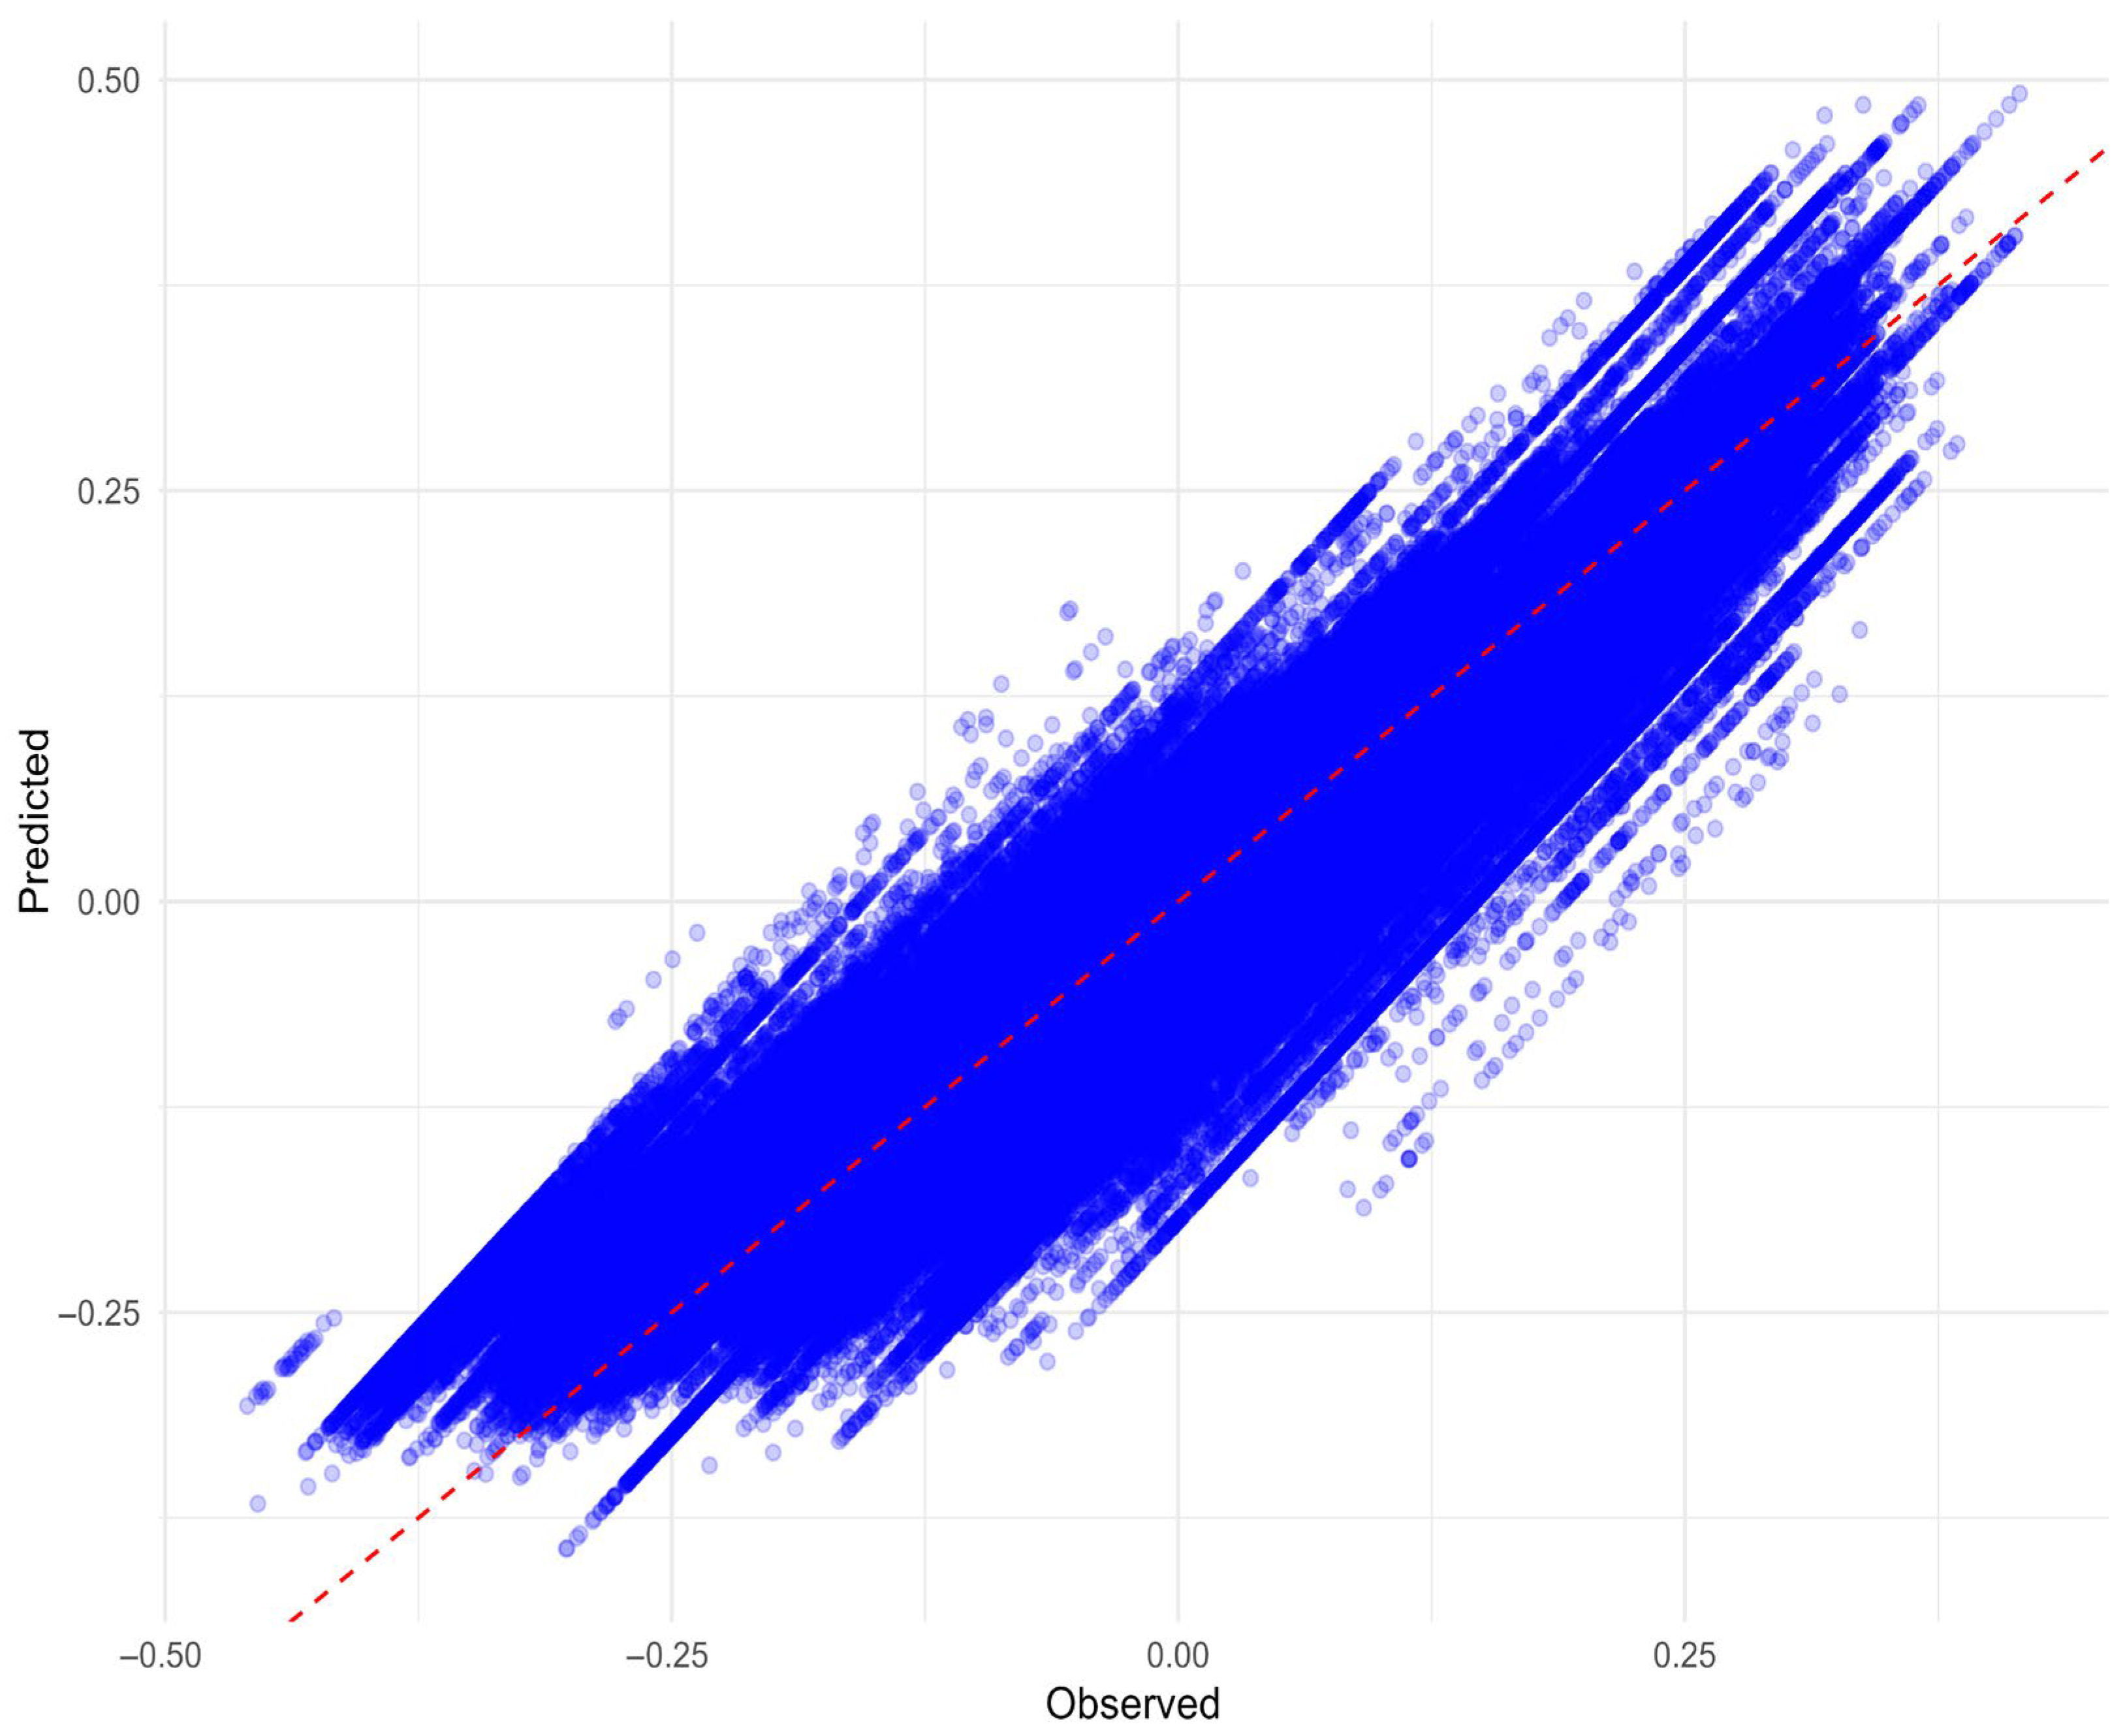
| O3 | Assess predictors of UHI index using regression on planning and vegetation data. | Multiple linear regression (Composite UHI ~ urban variables) | Composite UHI index and planning indicators | Regression model summary (coefficients, RMSE, MAE) |
References
- Lu, Y.; Yue, W.; Huang, Y. Effects of land use on land surface temperature: A case study of Wuhan, China. Int. J. Environ. Res. Public Health 2021, 18, 9987. [Google Scholar] [CrossRef] [PubMed]
- Erdem, U.; Cubukcu, K.M.; Sharifi, A. An analysis of urban form factors driving Urban Heat Island: The case of Izmir. Environ. Dev. Sustain. 2021, 23, 7835–7859. [Google Scholar] [CrossRef]
- Yin, C.; Yuan, M.; Lu, Y.; Huang, Y.; Liu, Y. Effects of urban form on the urban heat island effect based on spatial regression model. Sci. Total Environ. 2018, 634, 696–704. [Google Scholar] [CrossRef] [PubMed]
- Chen, Y.; Yang, J.; Yang, R.; Xiao, X.; Xia, J. Contribution of urban functional zones to the spatial distribution of urban thermal environment. Build. Environ. 2022, 216, 109000. [Google Scholar] [CrossRef]
- Dugord, P.-A.; Lauf, S.; Schuster, C.; Kleinschmit, B. Land use patterns, temperature distribution, and potential heat stress risk—The case study Berlin, Germany. Comput. Environ. Urban Syst. 2014, 48, 86–98. [Google Scholar] [CrossRef]
- Ünal, Y.S.; Sonuç, C.Y.; Incecik, S.; Topcu, H.S.; Diren-Üstün, D.H.; Temizöz, H.P. Investigating urban heat island intensity in Istanbul. Theor. Appl. Climatol. 2020, 139, 175–190. [Google Scholar] [CrossRef]
- Krtalić, A.; Kuveždić Divjak, A.; Čmrlec, K. Satellite-driven assessment of surface urban heat islands in the City of Zagreb, Croatia. ISPRS Ann. Photogramm. Remote Sens. Spat. Inf. Sci. 2020, 3, 757–764. [Google Scholar] [CrossRef]
- Krsnik, G. Is Zagreb green enough? Influence of urban green spaces on mitigation of urban heat island: A satellite-based study. Earth 2024, 5, 604–622. [Google Scholar] [CrossRef]
- Schmidt, P.; Lawrence, B.T. Association between land surface temperature and green volume in Bochum, Germany. Sustainability 2022, 14, 14642. [Google Scholar] [CrossRef]
- Hidalgo García, D. Evaluation and analysis of the effectiveness of the main mitigation measures against surface urban heat islands in different local climate zones through remote sensing. Sustainability 2023, 15, 10410. [Google Scholar] [CrossRef]
- Kaplan, G.; Avdan, U.; Avdan, Z.Y. Urban Heat Island Analysis Using the Landsat 8 Satellite Data: A Case Study in Skopje, Macedonia. Proceedings 2018, 2, 358. [Google Scholar] [CrossRef]
- Guha, S.; Govil, H.; Dey, A.; Gill, N. Analytical study of land surface temperature with NDVI and NDBI using Landsat 8 OLI and TIRS data in Florence and Naples city, Italy. Eur. J. Remote Sens. 2018, 51, 667–678. [Google Scholar] [CrossRef]
- Boras, M.; Herceg-Bulić, I.; Žgela, M.; Nimac, I. Temperature characteristics and heat load in the City of Dubrovnik. Geofizika 2022, 39, 259–279. [Google Scholar] [CrossRef]
- Morabito, M.; Crisci, A.; Guerri, G.; Messeri, A.; Congedo, L.; Munafò, M. Surface urban heat islands in Italian metropolitan cities: Tree cover and impervious surface influences. Sci. Total Environ. 2021, 751, 142334. [Google Scholar] [CrossRef] [PubMed]
- Karakuş, C.B. The impact of land use/land cover (LULC) changes on land surface temperature in Sivas city center and its surroundings and assessment of urban heat island. Asia-Pac. J. Atmos. Sci. 2019, 55, 669–684. [Google Scholar] [CrossRef]
- Halder, B.; Karimi, A.; Mohammad, P.; Bandyopadhyay, J.; Brown, R.D.; Yaseen, Z.M. Investigating the relationship between land alteration and the urban heat island of Seville city using multi-temporal Landsat data. Theor. Appl. Climatol. 2022, 150, 613–635. [Google Scholar] [CrossRef]
- Dushi, M.; Berila, A. Determining the influence of population density on the land surface temperature based on remote sensing data and GIS techniques: Application to Prizren, Kosovo. Sci. Rev. Eng. Environ. Sci. 2022, 31, 47–62. [Google Scholar] [CrossRef]
- Zhao, X.; Yang, S.; Shen, S.; Fang, Y. Analyzing the relationship between urban heat island and land use/cover changes in Beijing using remote sensing images. Proc. SPIE Int. Soc. Opt. Eng. 2009, 7454. [Google Scholar] [CrossRef]
- Bokaie, M.; Zarkesh, M.K.; Arasteh, P.D.; Hosseini, A. Assessment of urban heat island based on the relationship between land surface temperature and land use/land cover in Tehran. Sustain. Cities Soc. 2016, 23, 94–104. [Google Scholar] [CrossRef]
- Çetin, M.; Özenen Kavlak, M.; Şenyel Kürkçüoğlu, M.A.; Öztürk, G.B.; Çabuk, S.N.; Çabuk, A. Determination of land surface temperature and urban heat island effects with remote sensing capabilities: The case of Kayseri, Türkiye. Nat. Hazards 2024, 120, 5509–5536. [Google Scholar] [CrossRef]
- Lin, X.; Cui, Y.; Hao, S.; Zhu, C.; Zhang, P.; Zhao, H. Influence of urban landscape pattern on summer surface temperature and its spatial scale effects. Geocarto Int. 2024, 40, 2441370. [Google Scholar] [CrossRef]
- Zhou, D.; Xiao, J.; Bonafoni, S.; Berger, C.; Deilami, K.; Zhou, Y.; Sobrino, J.A. Satellite remote sensing of surface urban heat islands: Progress, challenges, and perspectives. Remote Sens. 2019, 11, 48. [Google Scholar] [CrossRef]
- Hidalgo García, D.; Arco Díaz, J. Mitigation and resilience of local climatic zones to the effects of extreme heat: Study on the city of Barcelona (Spain). Urban Sci. 2023, 7, 102. [Google Scholar] [CrossRef]
- Amindin, A.; Pouyan, S.; Pourghasemi, H.R.; Yousefi, S.; Tiefenbacher, J.P. Spatial and temporal analysis of urban heat island using Landsat satellite images. Environ. Sci. Pollut. Res. 2021, 28, 41439–41450. [Google Scholar] [CrossRef] [PubMed]
- Ćesić, M.; Rogulj, K.; Krtalić, A. Combined thermal index development for urban heat island detection in area of Split, Croatia. Land 2025, 14, 175. [Google Scholar] [CrossRef]
- Marando, F.; Heris, M.P.; Zulian, G.; Udías, A.; Mentaschi, L.; Chrysoulakis, N.; Parastatidis, D.; Maes, J. Urban heat island mitigation by green infrastructure in European functional urban areas. Sustain. Cities Soc. 2022, 77, 103564. [Google Scholar] [CrossRef]
- Yunita, R.; Wibowo, A.; Supriatna; Rais, A.F. Urban heat island mitigation strategy based on local climate zone classification using Landsat 8 satellite imagery. IOP Conf. Ser. Earth Environ. Sci. 2022, 1039, 012013. [Google Scholar] [CrossRef]
- Sheng, L.; Tang, X.; You, H.; Gu, Q.; Hu, H. Comparison of the urban heat island intensity quantified by using air temperature and Landsat land surface temperature in Hangzhou, China. Ecol. Indic. 2017, 72, 738–746. [Google Scholar] [CrossRef]
- Raj, S.; Yun, G.Y. Exploring the role of strategic urban planning and greening in decreasing surface urban heat island intensity. J. Asian Archit. Build. Eng. 2025, 24, 866–879. [Google Scholar] [CrossRef]
- Anselin, L. Local indicators of spatial association—LISA. Geogr. Anal. 1995, 27, 93–115. [Google Scholar] [CrossRef]
- Getis, A.; Ord, J.K. Local spatial autocorrelation statistics: Distributional issues and an application. Geogr. Anal. 1995, 27, 286–306. [Google Scholar] [CrossRef]
- Chen, Y. An analytical process of spatial autocorrelation functions based on Moran’s index. PLoS ONE 2021, 16, e0249589. [Google Scholar] [CrossRef] [PubMed]
- Seletković, A.; Kičić, M.; Ančić, M.; Kolić, J.; Pernar, R. The urban heat island analysis for the City of Zagreb in the period 2013-2022 utilizing Landsat 8 satellite imagery. Sustainability 2023, 15, 3963. [Google Scholar] [CrossRef]
- Copernicus. Summer 2024—Hottest on Record Globally and in Europe. Copernicus Climate Change Service. Copernicus Climate Change Service. 2024. Available online: https://climate.copernicus.eu/copernicus-summer-2024-hottest-record-globally-and-europe (accessed on 15 May 2025).
- Copernicus. Observer: Europe’s Warmest Year on Record—Striking Climate Contrasts in 2024. Copernicus.eu. 2024. Available online: https://www.copernicus.eu/en/news/news/observer-europes-warmest-year-record-striking-climate-contrasts-2024 (accessed on 28 May 2025).
- DHMZ. Ocjena mjeseca Kolovoza 2024. Državni Hidrometeorološki Zavod 2024. Available online: https://meteo.hr/klima.php?section=klima_pracenje¶m=ocjena&el=msg_ocjena&MjesecSezona=8&Godina=2024 (accessed on 28 May 2025).
- Li, X.; Zhou, Y.; Asrar, G.R.; Imhoff, M.; Li, X. The surface urban heat island response to urban expansion: A panel analysis for the conterminous United States. Sci. Total Environ. 2019, 695, 133780. [Google Scholar] [CrossRef] [PubMed]
- Zhou, B.; Rybski, D.; Kropp, J.P. The role of city size and urban form in the surface urban heat island. Sci. Rep. 2017, 7, 4791. [Google Scholar] [CrossRef] [PubMed]
- Zhao, L.; Oppenheimer, M.; Zhu, Q.; Baldwin, J.W.; Ebi, K.L.; Bou-Zeid, E.; Liu, X. Interactions between urban heat islands and heat waves. Environ. Res. Lett. 2018, 13, 034003. [Google Scholar] [CrossRef]
- Buyantuyev, A.; Wu, J. Urban heat islands and landscape heterogeneity: Linking spatiotemporal variations in surface temperatures to land-cover and socioeconomic patterns. Landsc. Ecol. 2010, 25, 17–33. [Google Scholar] [CrossRef]
- Deilami, K.; Kamruzzaman, M.; Liu, Y. Urban heat island effect: A systematic review of spatio-temporal factors, data, methods, and mitigation measures. Int. J. Appl. Earth Obs. Geoinf. 2018, 67, 30–42. [Google Scholar] [CrossRef]
- Yuan, F.; Bauer, M.E. Comparison of impervious surface area and normalized difference vegetation index as indicators of surface urban heat island effects in Landsat imagery. Remote Sens. Environ. 2007, 106, 375–386. [Google Scholar] [CrossRef]
- Weng, Q.; Lu, D.; Schubring, J. Estimation of land surface temperature–vegetation abundance relationship for urban heat island studies. Remote Sens. Environ. 2004, 89, 467–483. [Google Scholar] [CrossRef]


| Objective | Hypothesis | Analytical Approach | Key Metrics | Key Results |
|---|---|---|---|---|
| O1 | H1 | Bivariate correlation and linear regression at the planning unit level | r = 0.68, R2 = 0.46, p < 0.001 | Strong positive correlation between built-up share and mean LST |
| O2 | H2 | Bivariate correlation and linear regression at the planning unit level | r = –0.32, R2 = 0.10, p < 0.01 | Weak but significant negative correlation between green space and LST |
| O3 | H3 | Raster-based Pearson correlation | r = –0.69, p < 0.001 | Strong negative correlation between NDVI and LST |
| O4 | H4 | Local Moran’s I and Getis-Ord Gi* on composite UHI index | Moran’s I = 0.94, z = 12.9, p < 0.001 | Significant spatial clustering of high and low UHI index values |
Disclaimer/Publisher’s Note: The statements, opinions and data contained in all publications are solely those of the individual author(s) and contributor(s) and not of MDPI and/or the editor(s). MDPI and/or the editor(s) disclaim responsibility for any injury to people or property resulting from any ideas, methods, instructions or products referred to in the content. |
© 2025 by the authors. Licensee MDPI, Basel, Switzerland. This article is an open access article distributed under the terms and conditions of the Creative Commons Attribution (CC BY) license (https://creativecommons.org/licenses/by/4.0/).
Share and Cite
Bečić, D.; Gašparović, M. Urban Heat Islands and Land-Use Patterns in Zagreb: A Composite Analysis Using Remote Sensing and Spatial Statistics. Land 2025, 14, 1470. https://doi.org/10.3390/land14071470
Bečić D, Gašparović M. Urban Heat Islands and Land-Use Patterns in Zagreb: A Composite Analysis Using Remote Sensing and Spatial Statistics. Land. 2025; 14(7):1470. https://doi.org/10.3390/land14071470
Chicago/Turabian StyleBečić, Dino, and Mateo Gašparović. 2025. "Urban Heat Islands and Land-Use Patterns in Zagreb: A Composite Analysis Using Remote Sensing and Spatial Statistics" Land 14, no. 7: 1470. https://doi.org/10.3390/land14071470
APA StyleBečić, D., & Gašparović, M. (2025). Urban Heat Islands and Land-Use Patterns in Zagreb: A Composite Analysis Using Remote Sensing and Spatial Statistics. Land, 14(7), 1470. https://doi.org/10.3390/land14071470