Article

Landslide Susceptibility Level Mapping in Kozhikode, Kerala, Using Machine Learning-Based Random Forest, Remote Sensing, and GIS Techniques

by
Pradeep Kumar Badapalli
1,
Anusha Boya Nakkala
2,
Raghu Babu Kottala
2,
Sakram Gugulothu
1,*,
Fahdah Falah Ben Hasher
3,
Varun Narayan Mishra
4 and
Mohamed Zhran
5,*
1
CSIR-National Geophysical Research Institute, Hyderabad 500007, Telangana, India
2
Department of Geology, Yogi Vemana University, Kadapa 516005, Andhra Pradesh, India
3
Department of Geography and Environmental Sustainability, College of Humanities and Social Sciences, Princess Nourah Bint Abdulrahman University, P.O. BOX 84428, Riyadh 11671, Saudi Arabia
4
Amity Institute of Geoinformatics & Remote Sensing (AIGIRS), Amity University, Sector-125, Noida 201313, Uttar Pradesh, India
5
Public Works Engineering Department, Faculty of Engineering, Mansoura University, Mansoura 35516, Egypt
*
Authors to whom correspondence should be addressed.
Land 2025, 14(7), 1453; https://doi.org/10.3390/land14071453 (registering DOI)
Submission received: 11 May 2025 / Revised: 29 June 2025 / Accepted: 9 July 2025 / Published: 12 July 2025

Abstract

Landslides are among the most destructive natural hazards in the Western Ghats region of Kerala, driven by complex interactions between geological, hydrological, and anthropogenic factors. This study aims to generate a high-resolution Landslide Susceptibility Level Map (LSLM) using a machine learning (ML)-based Random Forest (RF) model integrated with Geographic Information Systems (GIS). A total of 231 historical landslide locations obtained from the Bhukosh portal were used as reference data. Eight predictive factors—Stream Order, Drainage Density, Slope, Aspect, Geology, Land Use/Land Cover (LULC), Normalized Difference Vegetation Index (NDVI), and Moisture Stress Index (MSI)—were derived from remote sensing and ancillary datasets, preprocessed, and reclassified for model input. The RF model was trained and validated using a 50:50 split of landslide and non-landslide points, with variable importance values derived to weight each predictive factor of the raster layer in ArcGIS. The resulting Landslide Susceptibility Index (LSI) was reclassified into five susceptibility zones: Very Low, Low, Moderate, High, and Very High. Results indicate that approximately 17.82% of the study area falls under high to very high susceptibility, predominantly in the steep, weathered, and high rainfall zones of the Western Ghats. Validation using Area Under the Curve–Receiver Operating Characteristic (AUC-ROC) analysis yielded an accuracy of 0.890, demonstrating excellent model performance. The output LSM provides valuable spatial insights for planners, disaster managers, and policymakers, enabling targeted mitigation strategies and sustainable land-use planning in landslide-prone regions.

1. Introduction

Landslides are among the most devastating natural hazards, significantly impacting human lives, infrastructure, and the environment [1,2]. These geomorphological processes are triggered by natural and anthropogenic factors, including intense rainfall, earthquakes, deforestation, and unplanned construction activities [3]. Globally, landslides cause substantial economic losses and fatalities, particularly in mountainous and hilly terrains of Asia, South America, and Europe [4]. In India, landslides predominantly occur in the Himalayan region, Western Ghats, and Northeastern states, affecting thousands of people annually [5,6]. The increasing frequency of extreme weather events due to climate change has further exacerbated landslide occurrences, highlighting the urgent need for effective landslide susceptibility mapping (LSM) and risk mitigation strategies [7,8].
In India, the Western Ghats, one of the eight “hottest” biodiversity hotspots, is highly susceptible to landslides due to its steep slopes, heavy monsoon rains, and human interventions [9]. Kerala, a state with a rugged terrain and high population density, has witnessed frequent landslides, particularly during the monsoon season. Kozhikode district, located in northern Kerala, is highly prone to landslides due to its complex geological setting, high annual rainfall, and land-use changes [10,11,12]. Recent landslide events in the district, particularly in Wayanad and nearby highland areas, have resulted in severe casualties and infrastructure damage. The increasing vulnerability of Kozhikode to landslides underscores the necessity for scientific assessment and early warning systems to mitigate risks and ensure sustainable land-use planning [13,14].
Remote Sensing (RS) and Geographic Information Systems (GIS) have emerged as indispensable tools for landslide susceptibility mapping (LSM), enabling the generation of accurate spatial datasets crucial for hazard prediction and mitigation [15,16]. In recent years, the adoption of advanced machine learning (ML) algorithms—particularly the random forest (RF) classifier—has significantly improved LSM outcomes due to their capacity to model complex and nonlinear relationships among diverse environmental variables [17]. The interaction of RS, GIS, and ML enhances the predictive accuracy of LSM by incorporating a wide array of predictive factors, including topographic, hydrological, geological, and anthropogenic factors [18]. Several recent studies across various districts in Kerala, such as Idukki, Wayanad, and Pathanamthitta, have successfully demonstrated the application of GIS-integrated ML models for landslide prediction and risk zoning. These studies typically utilized terrain parameters derived from high-resolution DEMs, satellite indices like NDVI and MSI, and categorical inputs such as land use, lithology, and soil type to train classifiers like RF, SVM, and ANN [19,20,21]. Despite these advancements, a noticeable gap persists in the systematic application of such integrated approaches to the Kozhikode district, which has also experienced frequent landslide events in recent decades. Therefore, this study aims to fill this regional gap by employing a robust data-driven methodology that combines the RF algorithm with high-resolution satellite imagery and GIS-based spatial analysis to delineate landslide-prone zones in Kozhikode. This integrated approach is expected to offer actionable regional disaster preparedness and risk reduction insights.
This research aims to develop a comprehensive landslide susceptibility map for Kozhikode, Kerala, by integrating ML-based RF methodology with remote sensing and GIS techniques. This study utilizes multiple predictive factors, including geology, slope, drainage, drainage density, and spectral indices such as NDVI, SAVI, and LULC. Additionally, historical landslide data has been collected and incorporated into the model to enhance its predictive accuracy by providing insights into past landslide occurrences and their spatial distribution. By leveraging high-resolution remote sensing data, geospatial analysis, and historical landslide records, the study aims to identify and classify landslide-prone areas with greater precision. The application of RF, a robust ensemble ML algorithm, improves the model’s reliability by analyzing complex spatial relationships between landslide-controlling factors. The findings of this research will contribute to improved landslide hazard assessment, early warning systems, and sustainable land management practices in the region.

2. Study Area

Kozhikode district, located in northern Kerala, spans approximately 2270 km2, with diverse topography ranging from coastal plains to steep highlands in the Western Ghats (Figure 1). The Arabian Sea borders the district to the west and hilly terrains to the east, where landslides are a significant concern. The region experiences a tropical monsoon climate, receiving an average annual rainfall of 3266 mm, primarily during the Southwest Monsoon (June–September). The combination of intense rainfall, steep slopes, and deforestation makes Kozhikode highly vulnerable to landslides, especially in areas like Kuttiady, Koduvally, and Thamarassery. Geologically, the district comprises Precambrian crystalline rocks, including charnockites, khondalites, and laterites, widespread in the midland and highland regions [22,23]. The lateritic soil formations and deeply weathered rock layers make the terrain highly unstable, particularly on steep slopes. The district has a well-defined drainage network, with major rivers such as the Kuttiady, Korapuzha, and Chaliyar contributing to erosion and sediment transport. Drainage density and slope variations are crucial in landslide occurrences, as poorly drained or highly erodible areas are more prone to slope failures. Kozhikode has witnessed several landslide incidents, particularly in the hilly eastern regions. Heavy monsoon rainfall, unregulated land-use changes, deforestation, and infrastructure development have increased landslide susceptibility. With the increasing frequency of extreme weather events, scientific landslide susceptibility mapping is crucial to mitigate risks and develop effective disaster management strategies [24]. The region has a rich cultural and economic history, contributing significantly to Kerala’s development. However, rapid urbanization and infrastructure expansion in landslide-prone zones have heightened the need for scientific assessments.

3. Materials and Methodology

3.1. Data Used

The present study integrates multiple predictive factors of raster layers and historical landslide inventory data to assess landslide susceptibility using an RF-ML approach. The input variables were selected based on their geomorphological, geological, and hydrological relevance in influencing landslide occurrences. Table 1 shows the datasets used for the LSLM.

3.2. Database Preparation and Analysis

To facilitate landslide susceptibility mapping using the RF model, all predictive factor datasets were preprocessed to maintain consistency in spatial resolution, projection system, and data structure. The workflow was executed primarily in ArcGIS 10.8, and the following steps were undertaken (Figure 2).

3.2.1. NDVI and MSI

These indices were derived from cloud-free Landsat 8 OLI imagery using the Raster Calculator. NDVI was calculated as (NIR − Red)/(NIR + Red), while MSI was computed using the formula (SWIR/NIR), which serves as an indicator of soil moisture conditions and vegetation stress [25,26,27,28].

3.2.2. Slope and Aspect

Slope and aspect layers were derived from the 30 m resolution Shuttle Radar Topography Mission (SRTM) Digital Elevation Model (DEM) using the “Slope” and “Aspect” tools available in the Spatial Analyst extension of ArcGIS 10.8 [29]. The slope layer measures the rate of elevation change per unit distance and is a critical factor in landslide susceptibility, with steeper slopes generally being more prone to failure. The aspect layer indicates the compass direction of slope faces, influencing microclimatic conditions such as sunlight exposure and moisture retention, which affect vegetation and soil stability.

3.2.3. Drainage Density and Stream Order

The drainage network was extracted from the DEM using a hydrological modeling workflow that included “Fill”, “Flow Direction”, and “Flow Accumulation” tools. Streams were delineated based on a threshold value applied to the flow accumulation raster. Stream Order was classified using Strahler’s method, which assigns numerical values to the stream hierarchy, indicating flow magnitude and stream branching complexity. Drainage Density was calculated using the “Line Density” tool, which computes the total length of streams per unit area (km/km2). High drainage density reflects higher surface runoff potential and possible slope instability, thus influencing landslide occurrence [30].

3.2.4. Geology

Geological maps were obtained from the Geological Survey of India (GSI) and converted into raster format using the “Polygon to Raster” tool after digitization, assigning unique IDs to lithological units [31].

3.2.5. LULC

Land use/land cover classes were extracted through visual interpretation of Landsat images using the supervised classification technique. The map was classified into dense vegetation, hilly areas with dense vegetation, river streams, wet soils, and river/water bodies.

3.2.6. Standardization of Raster Layers

All layers were resampled to a uniform 30 m resolution and projected to WGS 84 UTM 43N to maintain spatial compatibility.

3.2.7. Integration of Historical Landslide Data

Historical landslide locations for model training and validation were obtained from the Bhukosh portal of the Geological Survey of India (https://bhukosh.gsi.gov.in “10 November 2024”). A total of 231 landslide points were collected for the study area. These points were verified for spatial accuracy and overlaid on the predictive factors to ensure their alignment with terrain features. Each landslide point was assigned a value of 1 (presence). To represent stable areas, an equivalent number of non-landslide points were randomly generated across locations with no visible signs of slope instability, and these were labeled as 0 (absence) [32,33].

3.2.8. Sample Extraction and Data Stacking

The values from each predictive factor of the raster layer were extracted at the locations of both landslide and non-landslide points using the “Extract Multi Values to Points” tool in ArcGIS. An equal number of non-landslide points were randomly generated across stable regions to balance the dataset (i.e., a 50:50 ratio of landslide to non-landslide points). This balanced sampling approach helps reduce class imbalance, which can otherwise bias the classifier towards the majority class. However, we acknowledge that while balancing improves class representation, it may introduce sampling bias if not handled carefully.

3.2.9. Attribute Table Preparation

The final training dataset included the landslide class (1 for landslide, 0 for non-landslide) and corresponding values of all predictive factors. This dataset was exported to a .csv format for use in the RF model in Weka [34,35].

3.3. Preprocessing of Data

Preprocessing is critical in ensuring the integrity and consistency of input data used for ML classification. For this study, spatial and tabular datasets were preprocessed using ArcGIS 10.8 and Microsoft Excel. The key steps involved are as follows:

3.3.1. Handling of Missing or Null Values

After extracting raster values for all 231 landslide and corresponding non-landslide points, the attribute table was examined for missing or null values. Records with incomplete data were removed to maintain model reliability.

3.3.2. Categorical to Numerical Conversion

Certain predictive factors, such as LULC, Geology, and Stream Order, were categorical. These were encoded with unique integer values representing each class (e.g., Forest = 1, Agriculture = 2, etc.) to ensure compatibility with the RF algorithm, which requires numerical input.

3.3.3. Normalization (If Required)

Although RF is relatively insensitive to the scale of variables, optional normalization was tested using min–max scaling to ensure uniformity, especially for continuous indices like NDVI, MSI, Slope, and Drainage Density. However, the final model was built on unscaled data after performance comparison showed negligible differences.

3.3.4. Preparation of Final Input Dataset

The cleaned and encoded attribute table was exported as a .csv file, with each row representing a sample point and columns representing predictive factor variable values and the landslide occurrence class (0 or 1). This tabular dataset served as input for the RF model in Weka.

3.4. Historical Landslide Data Collection and Analysis

Accurate and comprehensive historical landslide data are essential for developing reliable landslide susceptibility models. This study obtained the landslide inventory from the Bhukosh portal of the GSI, a national geospatial repository providing standardized and verified geological information across India. The dataset comprises 231 verified landslide point locations, each representing previously recorded landslide occurrences within the study area. These points were mapped with associated geographic coordinates and event details. The Bhukosh database is considered reliable due to its official validation and expert curation; however, it primarily reflects reported and accessible landslide events, which may introduce spatial bias, especially in remote or less monitored regions [36]. To minimize such potential bias, all landslide points were visually cross-verified using high-resolution satellite imagery in ArcGIS 10.8 to assess their spatial accuracy and alignment with terrain features. Points found outside the study boundary or in anomalous locations were excluded.

3.4.1. Landslide Inventory Preparation

A total of 231 landslide point locations were extracted for the study area. These points represent verified past landslide events, including their geographic coordinates and occurrence details. The dataset was downloaded in shapefile format and imported into ArcGIS 10.8 for spatial integration with other layers.

3.4.2. Data Verification

All landslide points were overlaid on high-resolution satellite images and predictive factor maps to verify positional accuracy. Points falling outside the study boundary or those showing inconsistent terrain context were excluded to avoid noise in the dataset.

3.4.3. Non-Landslide Point Generation

An equal number of non-landslide (stable) points were generated randomly across the study area, explicitly avoiding regions with known landslide occurrences and buffer zones around them. These stable points were assigned a class value of 0, while historical landslide locations were assigned a value of 1. The 1:1 ratio was initially chosen to maintain class balance and reduce potential model bias during training, especially considering the limited availability of high-confidence landslide data.

3.4.4. Final Dataset Compilation

Both landslide and non-landslide points were merged into a single shapefile. Using the “Extract Multi Values to Points” tool in ArcGIS, attribute values from all eight predictive factors (NDVI, MSI, LULC, Slope, Aspect, Stream Order, Drainage Density, and Geology) were extracted for each point. The resulting attribute table formed the base training dataset for ML classification. This inventory was then exported in .csv format and used in the training and validation of the RF model.

3.5. Justification and Implementation of the RF Algorithm

The RF algorithm is a powerful ensemble-based machine learning (ML) method that builds a multitude of decision trees and aggregates their outputs for classification or regression tasks. It has gained prominence in geospatial applications such as landslide susceptibility mapping due to its strong performance in handling high-dimensional, nonlinear, and heterogeneous datasets [37,38].
RF offers several advantages over other ML algorithms: it is less prone to overfitting, handles missing or imbalanced data effectively, and provides variable importance metrics that help identify key contributing factors. RF is computationally efficient and relatively easier to implement than models like Support Vector Machines (SVM), which require parameter tuning and may not generalize well to noisy or complex terrain data. Its ability to model intricate relationships between terrain attributes and landslide occurrence makes it well-suited for regional-scale susceptibility assessments. These characteristics justify its selection in the present study.

3.5.1. Implementation of RF Using Weka

Since ArcGIS 10.8 does not have a built-in ML module, the RF classification was performed using Weka 3.8, an open-source data mining software [39]. Weka offers a user-friendly interface for implementing machine learning algorithms, including tree-based models like RF. The steps involved are as follows:
Step 1: Importing the Dataset: The dataset in .csv format, containing both landslide (class = 1) and non-landslide (class = 0) points, along with values for eight conditioning factors—NDVI, MSI, LULC, Slope, Aspect, Drainage Density, Stream Order, and Geology—was imported into Weka using the “Explorer” interface.
Step 2: Defining the Class Attribute: The column indicating the presence or absence of landslides was set as the target variable (class attribute). All other columns were treated as input features.
Step 3: Choosing the RF Classifier: From the “Classify” tab, the RF algorithm was selected under the tree-based classifiers. Default settings were retained for the number of trees (100) and maximum depth, as they provided stable results.
Step 4: Training and Validation: Model training was conducted using 10-fold cross-validation to reduce overfitting and improve generalizability. Evaluation metrics such as the Kappa coefficient, True Positive Rate, Precision, and the Area Under the ROC Curve (AUC) were computed to assess performance. The output of the RF model includes a probability estimate of landslide occurrence at each sample location. This probability is calculated based on the proportion of decision trees voting for the landslide class, as represented by the following equation:
P y = 1 | x = 1 T t = 1 T h t X
  • P( y = 1 | x ) = probability of landslide occurrence for input vector x
  • T = total number of decision trees in the forest
  • ht(x) = Prediction made by the tth decision tree for input x, where ht(x) ∈ {0, 1}
  • y = the target class variable (landslide = 1, no landslide = 0)
  • x = the vector of input features (e.g., slope, NDVI, geology)
Step 5: Exporting Prediction Results:
The trained model was used to classify the input dataset, and the predicted landslide susceptibility scores (probabilities) were exported as a .csv file. These probability scores were then joined back to the sample point shapefile in ArcGIS for spatial mapping.

3.5.2. Post-Processing in ArcGIS

The final prediction probabilities were spatially interpolated using the IDW (Inverse Distance Weighted) method to generate a continuous LSLM. The susceptibility map was reclassified into five categories: Very High, High, Moderate, Low, and Very Low, using natural breaks (Jenks) classification in ArcGIS.

3.6. Model Validation Using AUC-ROC

Area Under the Curve–Receiver Operating Characteristic (AUC-ROC) was used to evaluate the random forest model’s performance. This metric provides a quantitative measure of the model’s ability to distinguish between landslide and non-landslide locations, with values closer to 1.0 indicating higher predictive accuracy.

4. Results and Discussion

4.1. Importance and Contribution of Predictive Factor Variables

The RF model utilized in this study incorporated eight predictive factors as conditioning factors to map landslide susceptibility across the study area. These included Slope, Aspect, Geology, Drainage Density, Stream Order, Land Use and Land Cover (LULC), Moisture Stress Index (MSI), and Normalized Difference Vegetation Index (NDVI). Each variable is critical in landslide initiation and propagation, directly influencing terrain stability or indirectly modifying surface runoff and infiltration. In RF classification, the model assigns relative importance to each input based on how frequently and effectively it contributes to decision-tree splits in the classification process. While exact importance values could not be extracted from Weka due to technical limitations, predictive factor understanding and empirical knowledge were used to infer variable influence. Generally, Slope, Geology, and Drainage Density are among the most dominant factors, as they directly control surface movement, soil saturation, and gravitational energy. Stream Order and MSI reflect hydrological behavior, while NDVI and LULC represent surface vegetation and land cover stability. Aspect contributes by influencing microclimate and weathering patterns on specific slopes.

4.1.1. Stream Order and Its Influence on Landslide Susceptibility

Stream order reflects the hierarchical arrangement of streams within a drainage basin and is closely tied to geomorphological processes influencing slope stability [40]. In the Western Ghats’ rugged terrain, lower-order streams (such as first- and second-order) typically occur in steep headwater regions, which are more prone to landslides due to concentrated overland flow, toe erosion, and shallow soil depth (Figure 3a and Table 2). Stream orders were extracted from the DEM-derived stream network and classified using Strahler’s method into five categories. The analysis revealed that the first- and second-order streams are strongly associated with landslide activity, primarily due to their location in high-relief areas where concentrated flow initiates shallow slips and debris flows. These zones often exhibit active erosion, undercutting, and rapid hydrological response during intense rainfall. The RF model effectively captured this relationship, with lower stream orders consistently contributing higher to landslide classification. Conversely, fourth- and fifth-order streams are generally located in flatter terrain and floodplains, with minimal landslide incidence.

4.1.2. Drainage Density and Its Influence on Landslide Susceptibility

Drainage density (DD), defined as the total length of streams per unit area, is a key indicator of surface runoff behavior, terrain dissection, and subsurface infiltration capacity [41]. In the Western Ghats region, high drainage density typically signifies steep slopes, impermeable bedrock, and intense rainfall–runoff interactions all of which can exacerbate slope instability and landslide occurrences. In this study, drainage density was derived from stream networks using the line density tool in ArcGIS and classified into five categories (Figure 3b and Table 2): Areas with high drainage density (above 3.33 km/km2) exhibited a strong correlation with landslide events, particularly in steep, forested catchments where surface runoff rapidly concentrates. The intersecting network of streams also contributes to undercutting and toe erosion, triggering slope failures. The RF model assigned substantial weight to drainage density, frequently selecting it as a decision node in classification trees. High-density stream zones, especially along concave valley flanks and escarpments, were strongly associated with past landslide occurrences.

4.1.3. Slope and Its Influence on Landslide Susceptibility

Slope is a primary terrain factor in landslide occurrences as it directly affects the gravitational force acting on slope materials [42]. In this study, the slope was derived from a high-resolution DEM and classified into five classes (Figure 3c and Table 2): slope classification and associated landslide susceptibility levels. Areas with slopes greater than 50% were observed to be the most susceptible to landslides due to the high gravitational stress acting on soil and weathered rock materials. These zones typically correspond to hilly terrains, escarpments, and deeply incised valleys. Conversely, gently sloping and nearly flat areas showed minimal landslide activity due to stable terrain and minimal gravitational force. The RF model recognized slope as a key factor, frequently used in decision trees to separate landslide and non-landslide zones, reflecting its dominant influence. Areas with steep slopes also coincided with low vegetation cover and poorly drained soil, increasing landslide potential.

4.1.4. Aspect and Its Influence on Landslide Susceptibility

Aspect, or the directional orientation of a slope, significantly affects local microclimates, solar radiation, wind exposure, and soil moisture, all of which can influence slope stability [43] (Figure 3d and Table 2). This study derived aspect from the DEM and classified into ten directional categories, including flat terrain. Slopes facing south and southeast generally receive more intense solar radiation, leading to increased weathering, desiccation of soils, and reduced cohesion, all of which enhance susceptibility to landslides. These aspects also support sparser vegetation cover, which further reduces slope stability. In contrast, north-facing slopes tend to be cooler and retain more moisture and vegetation, reducing landslide likelihood. The RF model captured this variability, with south- and southeast-facing slopes contributing more prominently to the model’s classification of landslide-prone zones. Flat and gently sloping areas, regardless of direction, were found to be relatively stable.

4.1.5. Geology and Its Influence on Landslide Susceptibility

The geology of the Western Ghats region in Kerala significantly influences landslide dynamics due to ancient crystalline rock formations undergoing intensive weathering under high rainfall conditions. The study area comprises four major lithological units: In the Western Ghats, even geologically competent rocks such as Charnockites and Migmatites become vulnerable to landslides due to intense chemical weathering, fracturing, and water infiltration resulting from persistent monsoonal precipitation [44]. Charnockites, al-though considered strong, are often deeply jointed and altered along slopes, making them prone to failure when saturated. Migmatites and Felsic Granophyres, with foliated structures and altered mineral zones, also exhibit susceptibility, particularly on steep slopes and areas with inadequate vegetation anchoring (Figure 3e and Table 2). The Coastal and Sedimentary units have limited or no spatial presence in the study area and, thus, were not significant contributors to the RF model. The model’s output reflects the high landslide susceptibility in regions underlain by weathered charnockite and migmatite formations, particularly along escarpments and steeply inclined valleys where hydrological triggers accentuate structural weaknesses.

4.1.6. Land Use/Land Cover (LULC) and Its Influence on Landslide Susceptibility

Land use and land cover (LULC) are vital in modulating slope stability by affecting infiltration capacity, vegetation anchoring, runoff velocity, and erosion rates [45]. In the Western Ghats region of Kerala, which is ecologically sensitive and experiences intense monsoonal precipitation, changes in LULC directly influence landslide susceptibility. The LULC map was prepared using multi-temporal satellite data and classified into the following five categories (Figure 3f and Table 2): Among these, “Hilly Areas with Dense Vegetation” showed a higher landslide susceptibility despite the vegetative cover, primarily due to steep slopes, unstable underlying geology, and water saturation during rainfall events. While dense vegetation in low to moderate slopes tends to stabilize slopes by binding the soil, vegetation on steeper terrain may not fully mitigate landslide risk, especially when root systems are shallow or soil layers become saturated. Conversely, river/stream areas are less prone to landslides but can indirectly contribute to instability by undercutting banks and increasing erosion at the base of slopes. The RF model assigned moderate to high importance to LULC, particularly flagging transition zones between hilly vegetated terrain and developed/agricultural lands as critical susceptibility areas.

4.1.7. Moisture Stress Index (MSI) and Its Influence on Landslide Susceptibility

The MSI, derived from remote sensing data, is an essential hydrological indicator reflecting the moisture content in surface soil and vegetation. In landslide-prone environments like the Western Ghats, high MSI values generally correspond to low moisture, while low MSI values reflect areas with high soil moisture, which may be more susceptible to failure due to increased pore-water pressure and loss of soil cohesion [46,47]. For this study, MSI was classified into five ranges (Figure 3g and Table 2). The analysis showed that areas with low MSI values (0.48–0.77), indicating high surface moisture, coincide with many historical landslide locations. These zones are often located on mid- to upper slopes, where water accumulation due to rainfall and slow drainage leads to saturation of the weathered soil/rock layer, increasing the risk of slope failure. In contrast, higher MSI values, representing dry or well-drained areas (such as ridge tops or flat terrain), were less associated with landslide occurrences. The RF model ranked MSI as a significant predictor, particularly in combination with slope and geology, indicating that moisture retention capacity and its interaction with terrain factors is crucial in landslide generation.

4.1.8. NDVI and Its Influence on Landslide Susceptibility

The NDVI is a widely used remote sensing indicator quantifying vegetation density and health. NDVI values range from negative to positive, where positive values indicate healthy, dense vegetation and negative values represent bare soil, water bodies, or non-vegetated areas. In landslide studies, NDVI is used to assess vegetative cover, which plays a crucial role in stabilizing slopes, enhancing soil cohesion, and mitigating erosion [48,49]. For this study, NDVI was classified into five categories (Figure 3h and Table 2): In the Western Ghats, the areas with very dense vegetation (NDVI > 0.35) are typically found in forested regions that play an essential role in stabilizing slopes and preventing landslides. These areas are often located in the lower and mid-slope zones, where thick root systems help maintain soil structure and resist erosion. On the other hand, regions with sparse vegetation or bare soil (NDVI < 0.22) are more vulnerable to landslides due to the absence of root structures, which would otherwise help in soil retention and water absorption. These zones tend to be found on steep slopes and disturbed landscapes (e.g., agricultural land, road cuts, or deforested regions). The RF model heavily weighted NDVI as a predictive factor, recognizing that vegetation cover acts as a protective layer, especially in areas with steep slopes and high rainfall.

4.2. Data Preprocessing for RF Classification

Data preprocessing is crucial in preparing the input data for the RF classification. It involves transforming and standardizing the predictive factors, preparing training and testing datasets, and ensuring that the data is correctly formatted for input into the Weka software (Version 3.8.6). This section outlines the steps followed for preprocessing the data before running the RF classification.

4.2.1. Predictive Factor Standardization

The predictive factors (Stream Order, Drainage Density, Slope, Aspect, Geology, LULC, MSI, and NDVI) were initially obtained from various sources (Table 3). These layers were processed and standardized to ensure consistency and compatibility for analysis in Weka. The main preprocessing tasks involved reclassifying, normalizing, and ensuring that all layers had the same resolution and alignment.
These reclassifications were implemented using the Reclassify tool in ArcGIS 10.8. All predictive factors layers were resampled to a uniform spatial resolution (30 m) and projected consistently using a common coordinate system.

4.2.2. Landslide Inventory and Sampling Strategy

A total of 231 landslide locations were collected from Bhukosh (GSI portal), representing past landslide events in the study area. For training the RF model, an equal number of 231 non-landslide points were randomly generated from regions with no known landslide activity. This balanced dataset approach enhances model accuracy and prevents classification bias. A total of 462 points formed the base of the attribute table for training and testing the RF classifier.

4.2.3. Data Formatting for Weka

The combined dataset was exported as a .CSV file from ArcGIS. This .CSV file was then converted into an ARFF file using Weka’s built-in file loader or a simple text editor. Each row represented a point, and each column corresponded to a predictive factor or the target class (1 for landslide, 0 for non-landslide) (Table 4). Missing data, including any data point with null or missing values, was inspected and removed to maintain the integrity of the training data. However, care was taken to retain class balance. Training and testing split to validate the model’s performance: 70% of the dataset (323 points) was used for training; 30% of the dataset (139 points) was used for testing. This division ensured that the RF model was both trained on sufficient data and tested robustly on unseen data.

4.3. RF Classification Using Weka and Model Performance Evaluation

The RF algorithm was implemented using the open-source ML platform Weka, due to its robustness, ease of use, and suitability for classification problems involving both categorical and continuous data. RF is an ensemble learning method based on constructing a multitude of decision trees during training and outputting the class that is the mode of the classes (classification) of the individual trees.

4.3.1. RF Model Setup in Weka

After preparing the ARFF file from the sampled dataset (as described in the previous section), the classification process was carried out in Weka using the following steps: Classifier Used: RF from the “trees” group in Weka. Number of Trees (Iterations): 100 (default, which provides stable performance). Attributes Considered at Each Split: √n (square root of total attributes, where n = 8 predictive factor variables). Random Seed: Set to 1 for reproducibility.

4.3.2. Training and Testing Process

The model was trained on 70% of the dataset (323 samples) and tested on the remaining 30% (139 samples). Weka automatically handled the randomization and stratified sampling to maintain class balance in both sets (Table 5). Upon completion of the classification, Weka generated several performance indicators. The key performance metrics are provided below:
Accuracy indicates the proportion of correctly classified instances. The Kappa statistic assesses the model performance over random chance, with values > 0.8 considered excellent. Precision and Recall measure the balance between false positives and false negatives. AUC-ROC (Area Under the Curve–Receiver Operating Characteristic) measures the model’s capability to distinguish between the classes, where values close to 1 denote high discrimination power.

4.3.3. Importance of Predictive Factors Variables

Weka also outputs the relative importance of input variables based on their contribution to tree splits. In this study, variables such as slope, geology, MSI, and NDVI had higher importance values, highlighting their stronger influence on landslide occurrences in the study area (Table 6). The following weights can be visualized or normalized to produce a landslide susceptibility map using a raster calculator in ArcGIS.
The fallowing weights can be visualized or normalized to produce a landslide susceptibility map using a raster calculator in ArcGIS.

4.4. Generation of Landslide Susceptibility Index (LSI)

The landslide susceptibility levels were generated by integrating the predictive factor variables with their corresponding importance weights derived from the RF model. Following the classification process in Weka, the relative importance values assigned to each variable were utilized to construct a spatially explicit prediction model in ArcGIS 10.8. All predictive factors, initially prepared and reclassified into categorical raster formats, were standardized to a common resolution and projection to ensure spatial consistency across the dataset. To derive the landslide susceptibility level map, the relative importance of each predictive factor variable, as determined from the RF output, was used as a weight in a raster-based multi-criteria integration. These weights were normalized so that their cumulative sum equaled 1 (or 100%). Each predictive factor of the raster was then multiplied by its respective normalized weight using the Raster Calculator in ArcGIS. This overlay analysis resulted in a continuous Landslide Susceptibility Index (LSI), where each pixel value represented the cumulative weighted contribution of all influencing factors.

4.5. Generating the Composite Susceptibility Index

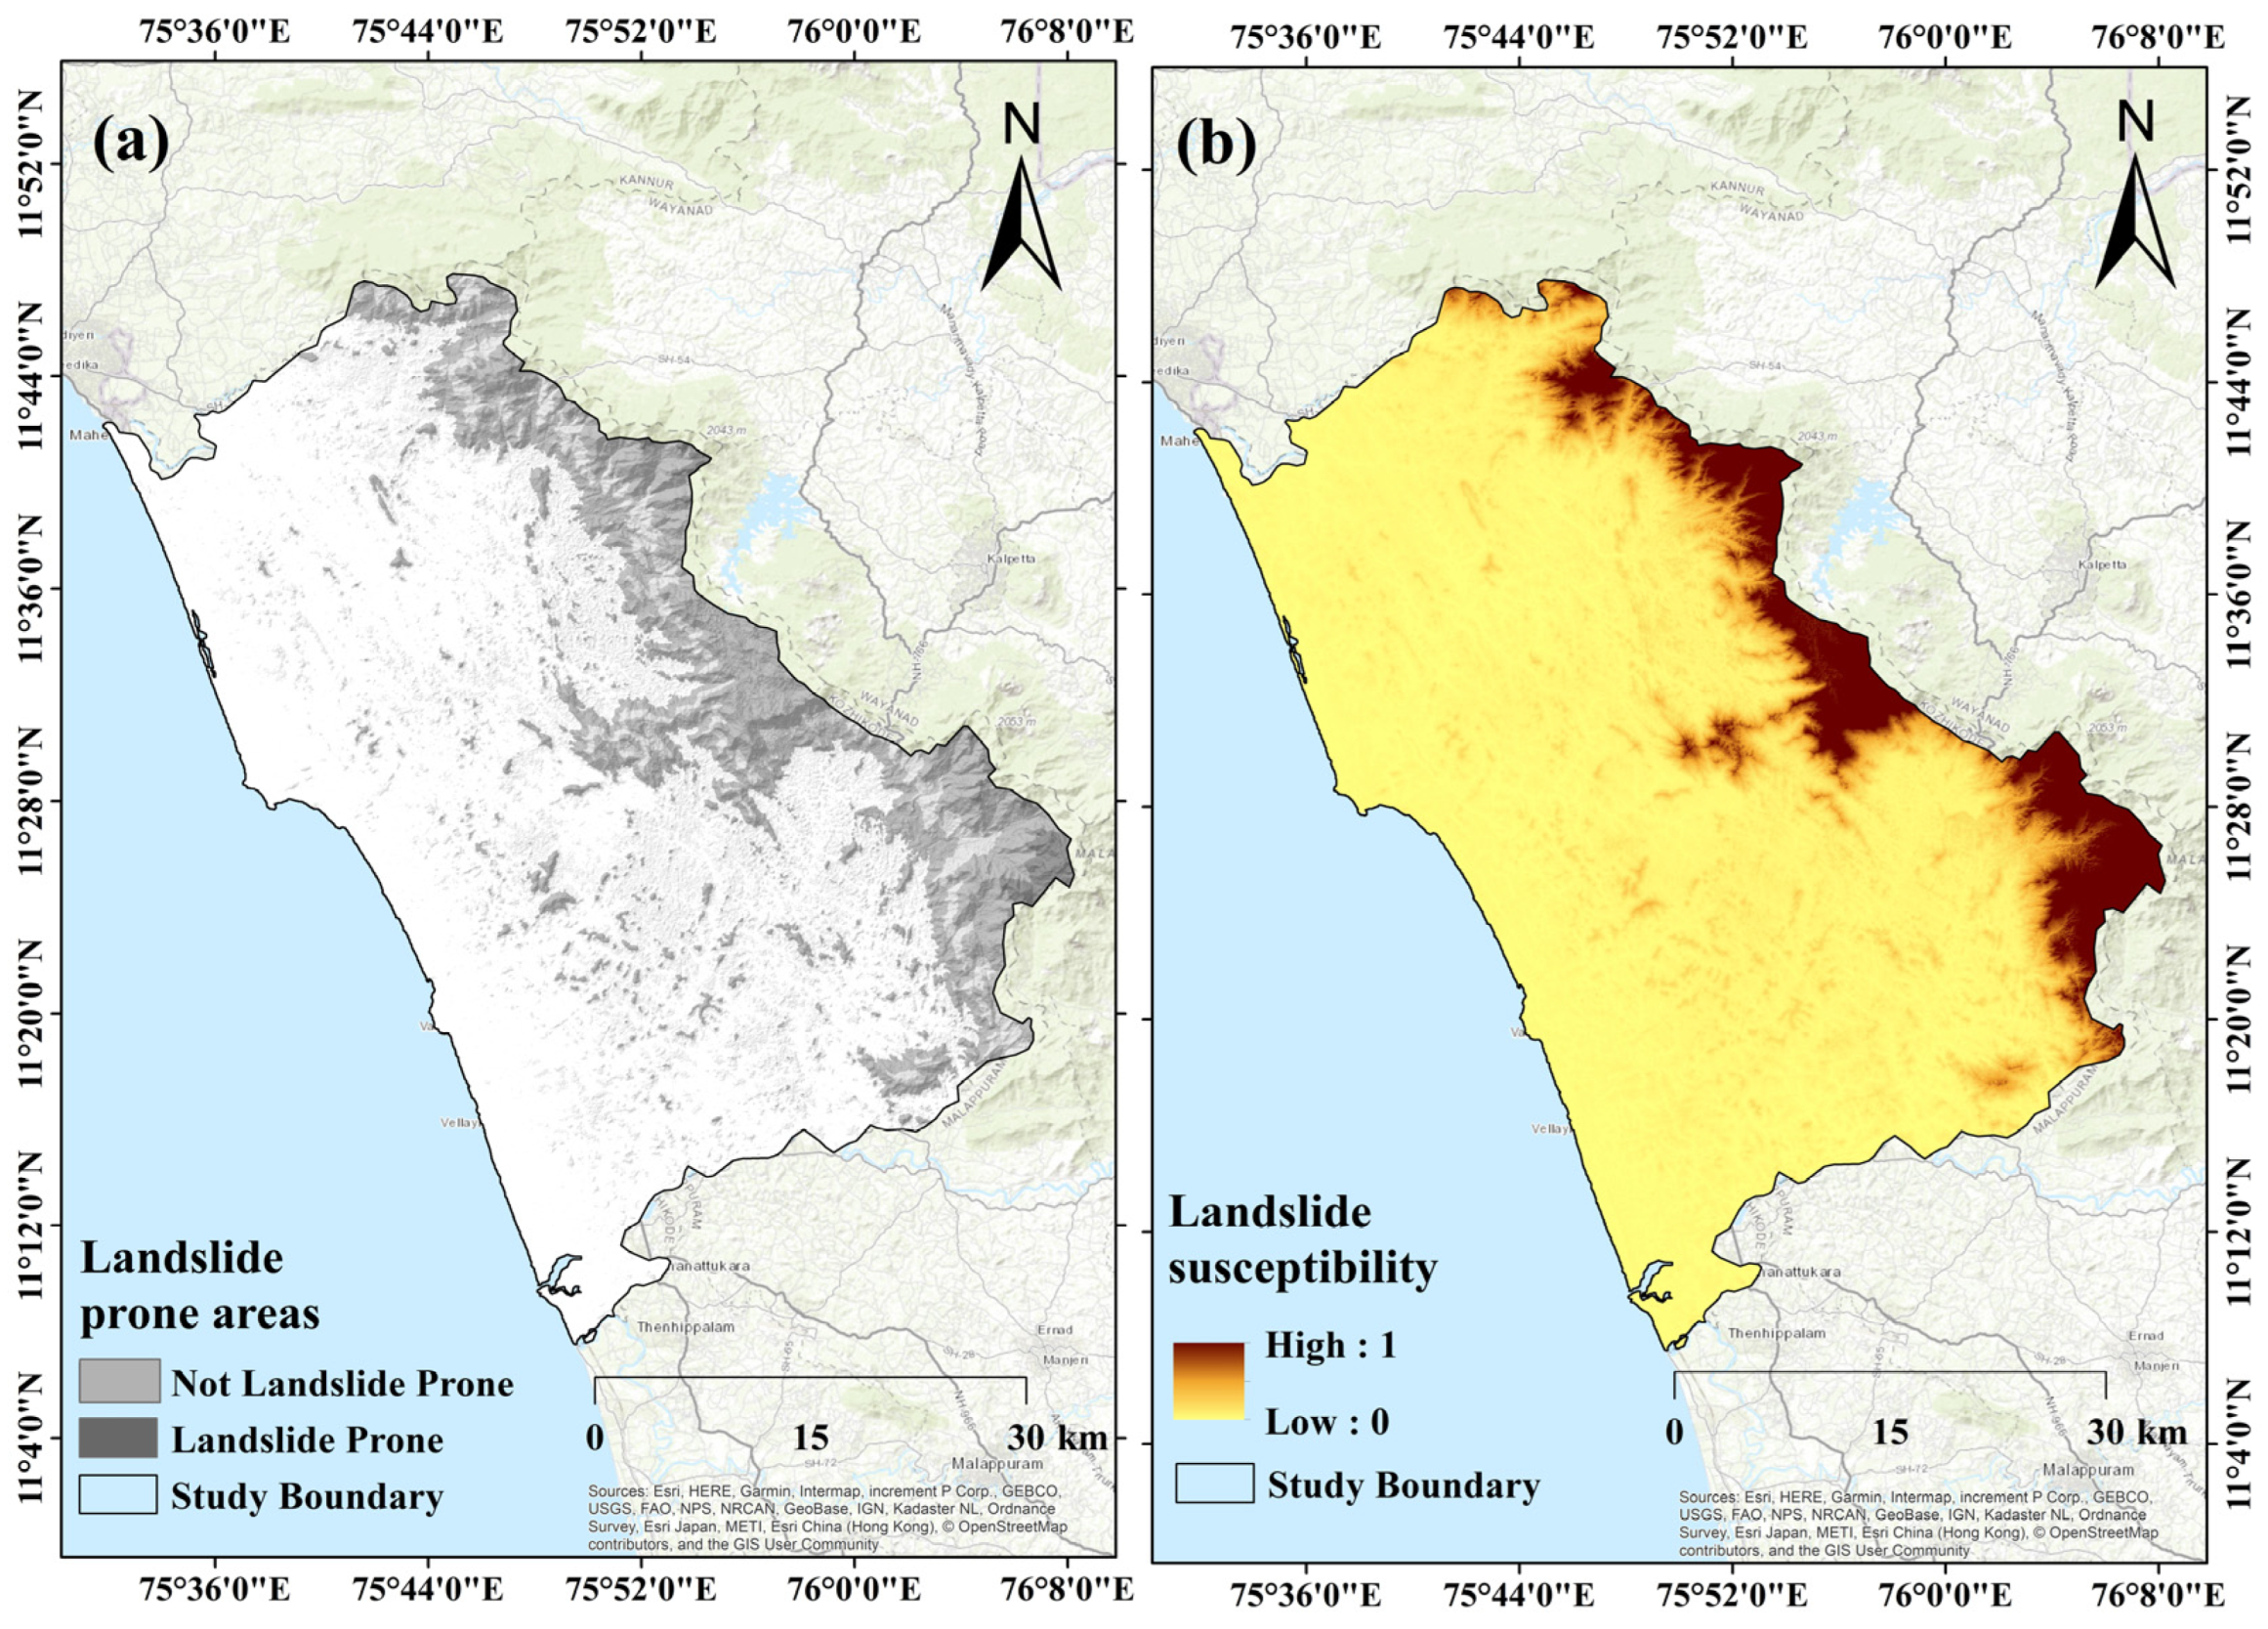
The output generated using the Raster Calculator in ArcGIS 10.8 represents the LSI, where each pixel holds a continuous value between 0 and 1. These values indicate the relative likelihood of landslide occurrence, with higher values corresponding to areas of greater susceptibility. The Landslide Susceptibility Maps (LSMs) derived from the RF model are presented in Figure 4. Figure 4a illustrates a binary classification map, categorizing the study area into landslide-prone zones (assigned a value of 1 and shown in dark shade) and non-landslide zones (assigned a value of 0 and shown in light shade), based on the RF model’s classification output. On the other hand, Figure 4b displays a continuous susceptibility surface generated from the RF model’s probability estimates. This map visualizes the spatial distribution of landslide susceptibility across the landscape, with pixel values ranging from low to high. In the context of the Western Ghats region of Kerala, the highest susceptibility values are predominantly observed in the rugged and steep terrain of the northern and southwestern parts of the study area. These areas are characterized by heavy monsoonal rainfall, deeply weathered complex rock formations, and dense vegetation cover, all contributing significantly to slope instability. In contrast, lower susceptibility values are found in the relatively flat, less dissected, and geologically stable regions toward the central and coastal portions of the study area.

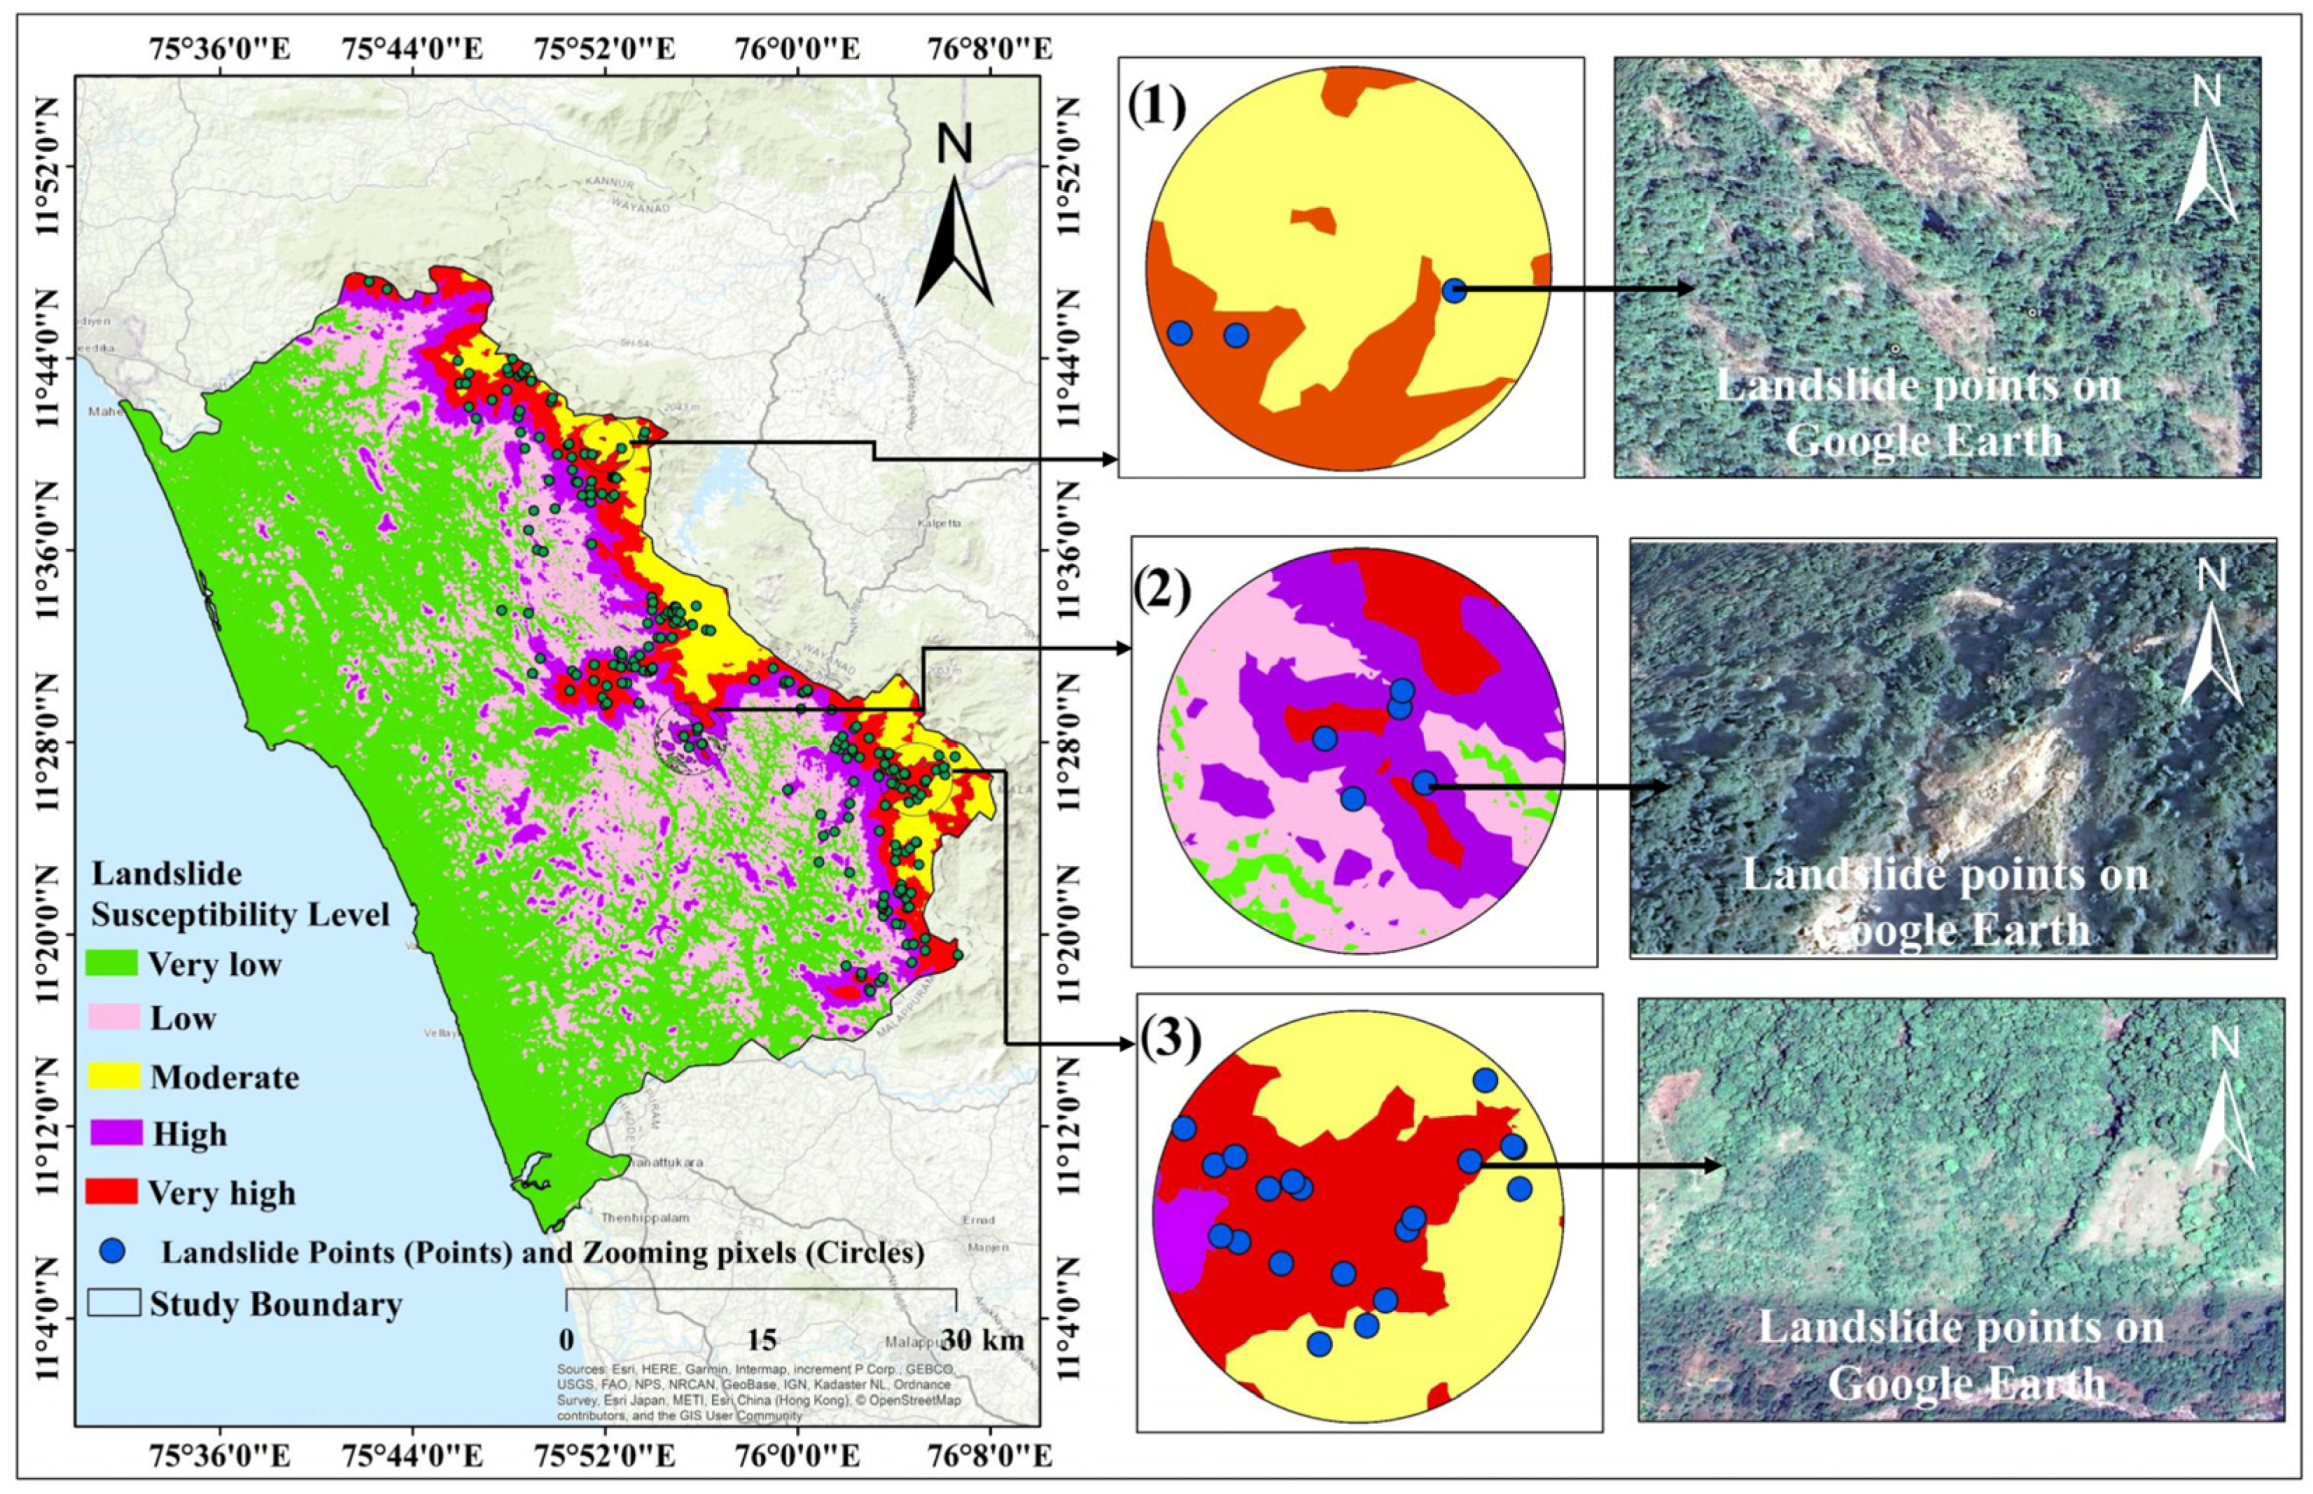
4.6. Reclassifying the LSI into Landslide Susceptibility Levels

The Landslide Susceptibility Index (LSI) derived from the RF model was classified into five susceptibility zones to interpret spatial risk variation across the study area. The final Landslide Susceptibility Map (LSM) highlights the relative likelihood of landslides, ranging from very low to very high susceptibility levels (Figure 5 and Table 7). The analysis reveals that the majority of the area (49.57%) falls under the Very Low Susceptibility category, covering approximately 1125.42 km2, indicating stable terrain with minimal landslide risk. The Low Susceptibility zone constitutes 602.97 km2, or 26.56%, primarily located in the gently undulating plains and coastal borderlands where slope and geomorphic activity are minimal. On the other end of the spectrum, the High and Very High Susceptibility zones account for 9.84% (223.52 km2) and 7.99% (181.34 km2) of the area, respectively. These zones are concentrated along the rugged, steeply sloping terrains of the Western Ghats, where factors such as deeply weathered rocks, high rainfall intensity, and dense vegetation significantly increase landslide risk. The Moderate Susceptibility zone covers 136.75 km2 (6.02%), forming transitional areas between lowland stability and upland vulnerability.

4.7. Practical Implications of Landslide Susceptibility Level

The Landslide Susceptibility Map generated in this study offers critical insights that can be directly applied in land-use planning, infrastructure development, and disaster risk reduction strategies. High and very high susceptibility zones identified through the RF model should be prioritized for detailed geotechnical investigations, slope stabilization measures, and early warning systems. Urban planners and policymakers can use this map to avoid high-risk zones for future construction and development projects, thereby minimizing human and economic losses. Furthermore, the LSLM can assist disaster management authorities in identifying vulnerable areas, optimizing evacuation routes, and allocating resources more effectively during emergencies.

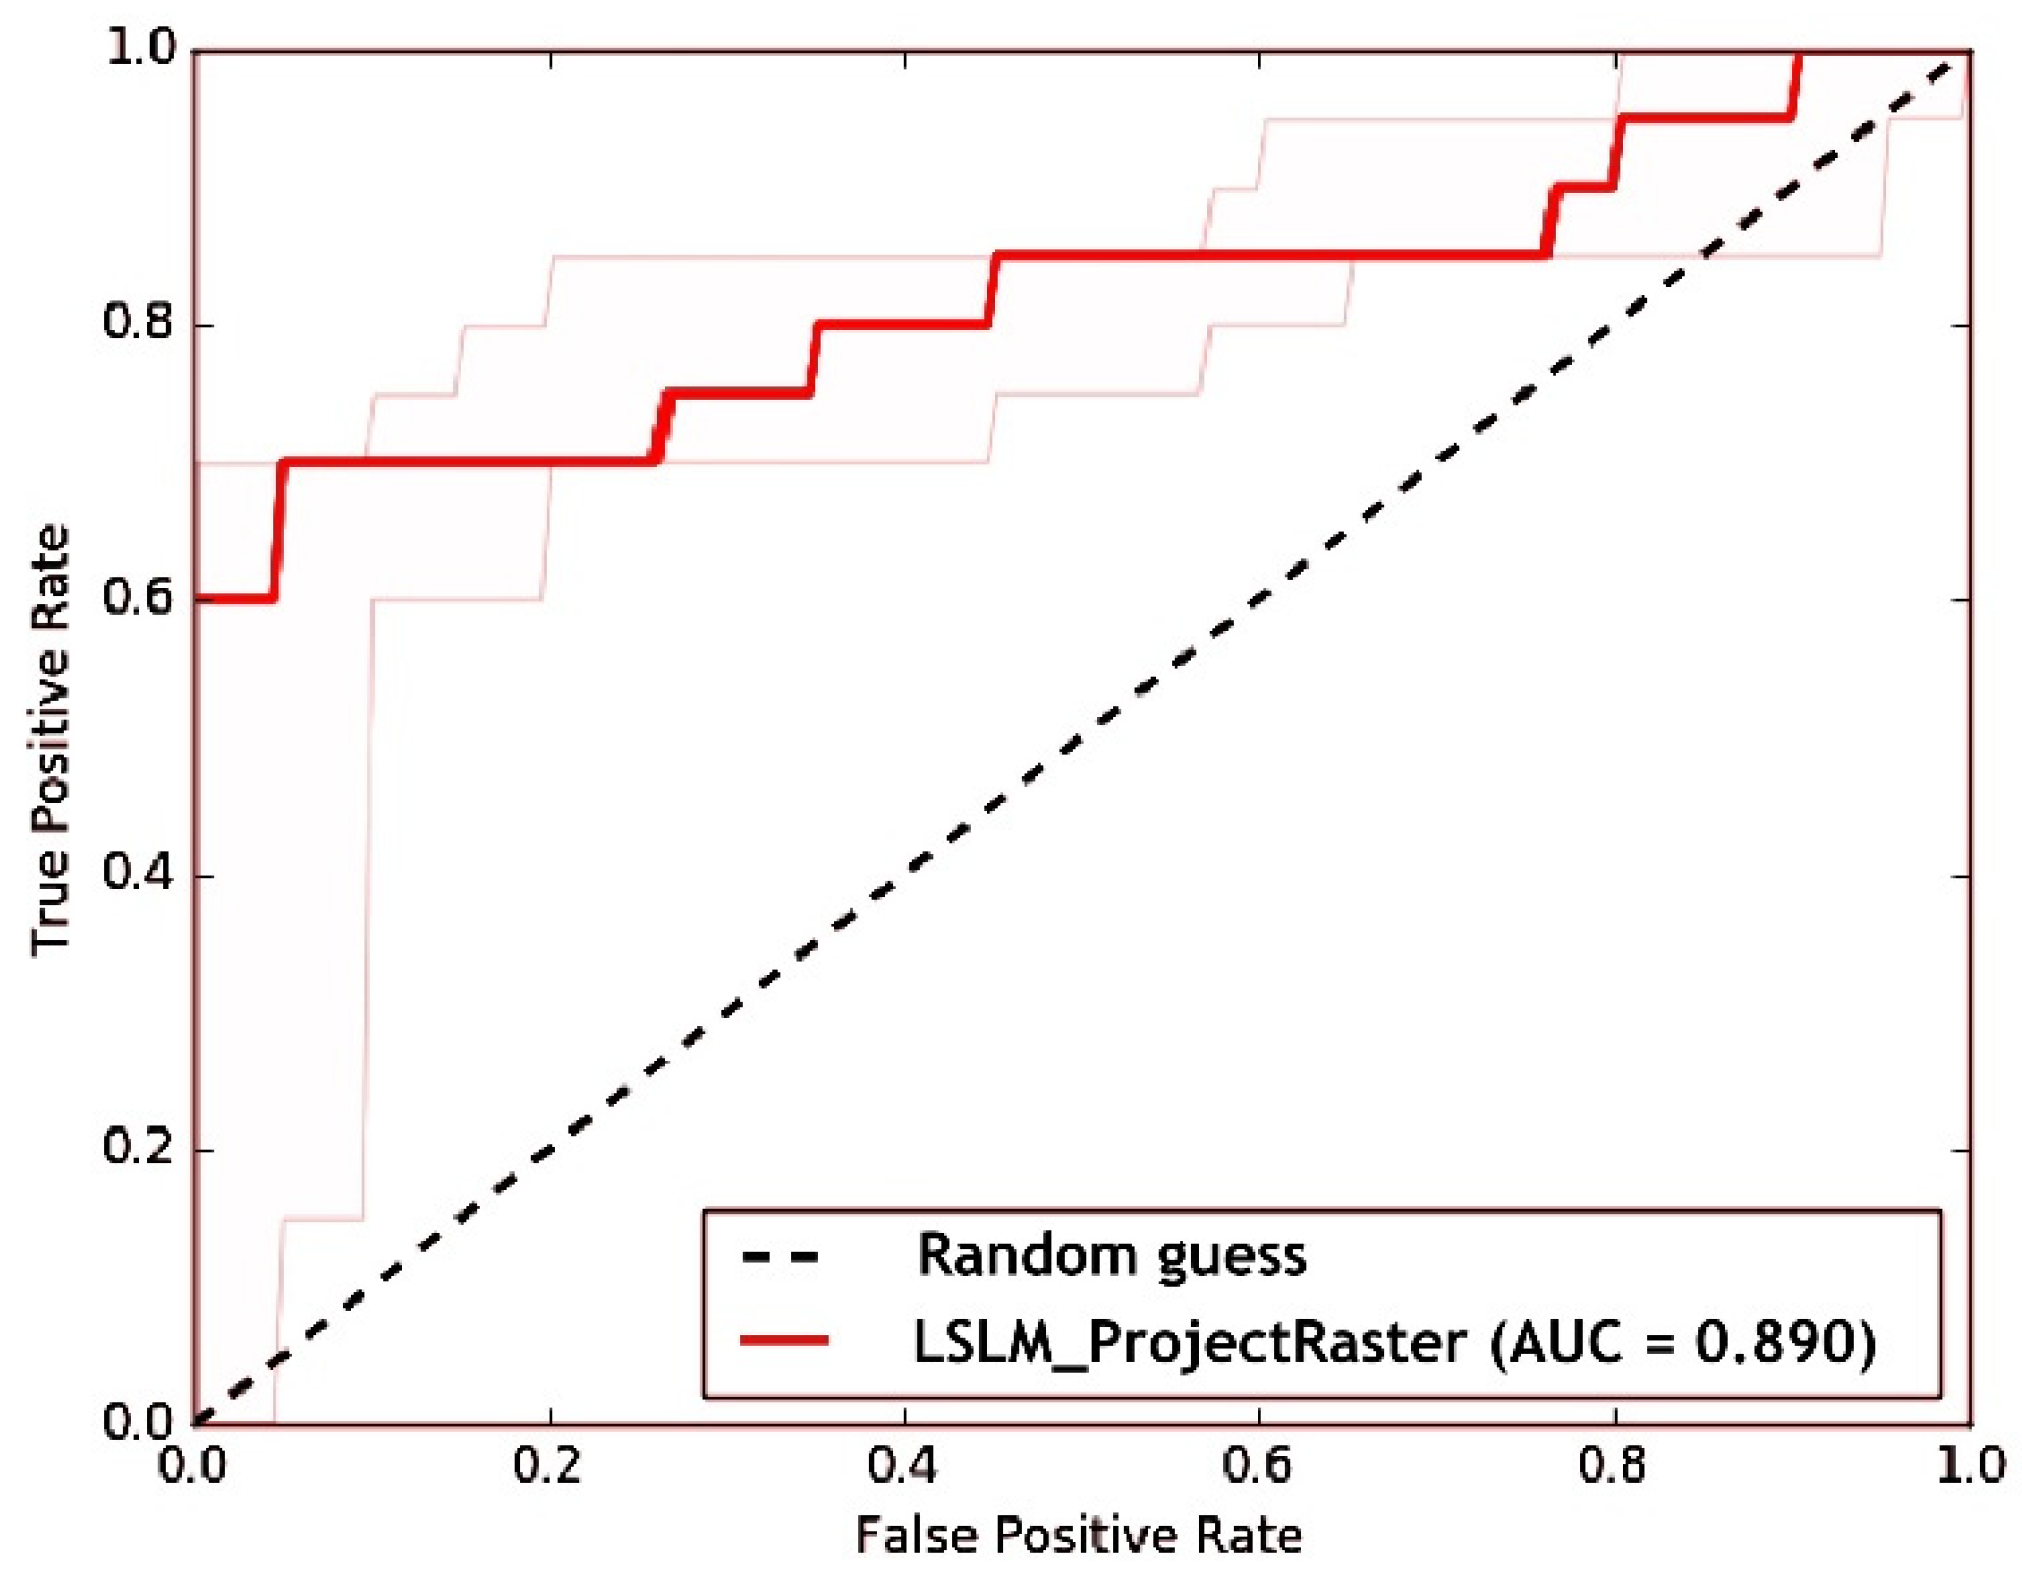
4.8. Validation Using Landslide Points

To assess the predictive performance of the Landslide Susceptibility Level Map (LSLM) generated using the RF model, a validation was carried out using the 231 historical landslide points obtained from the Bhukosh portal. These points, which represent known landslide occurrences within the study area, were spatially overlaid on the classified LSM. The validation employed both visual comparison and quantitative assessment. Spatial overlay analysis revealed that a substantial proportion of the landslide events were located within the High and Very High Susceptibility zones, indicating strong agreement between observed events and model predictions. To quantify the model’s predictive accuracy, a Receiver Operating Characteristic (ROC) curve was generated, and the Area Under the Curve (AUC) was calculated (Figure 6). The AUC-ROC analysis is a widely accepted statistical method for evaluating classification model performance, particularly in binary classification problems like landslide prediction [50,51,52,53]. The model achieved an AUC value of 0.890, signifying excellent predictive capability and high discriminatory power between landslide-prone and stable areas. The bold red line represents the main ROC curve with an Area Under the Curve (AUC) value of 0.890, indicating high model accuracy. The dashed diagonal line denotes the line of no-discrimination (random guess). The two faint red lines represent additional curves automatically generated by the software, likely from resampling or internal validation iterations. While not confidence intervals, they provide a visual indication of model variability. The figure demonstrates the model’s ability to effectively distinguish between landslide and non-landslide areas. The high AUC score, coupled with the spatial concentration of known landslide points within higher susceptibility zones, confirms the robustness and reliability of the RF-based landslide susceptibility model in capturing spatial patterns of landslide occurrence in the Western Ghats region.

5. Discussion

The present study demonstrates the effectiveness of integrating multi-predictive factors, geospatial variables, and ML algorithms for landslide susceptibility mapping (LSM) in the ecologically sensitive and geomorphologically complex terrain of the Western Ghats, Kerala. The application of the RF algorithm in this study has yielded a highly accurate prediction model, as indicated by the Area Under the ROC Curve (AUC) value of 0.92, suggesting a strong agreement between predicted susceptible zones and actual landslide occurrences. Unlike conventional statistical models such as Logistic Regression or the Bivariate Frequency Ratio, which are limited by linearity and variable independence assumptions, the RF model is non-parametric and can handle nonlinear relationships and complex interactions among multiple predictive factors variables. This strength is evident in the model’s ability to identify subtle patterns of terrain instability influenced by a combination of slope, aspect, drainage density, geological conditions, and vegetation cover (NDVI), all of which are highly heterogeneous across the study area.
The predictive factor importance ranking derived from the RF model highlights slope, geology, and drainage density as the most influential predictors of landslide occurrence, which aligns with previous findings from similar terrain settings in the Western Ghats and the Himalayan regions [54,55,56,57,58,59,60]. However, this study differs in its inclusion of moisture-sensitive indices such as MSI and vegetation greenness (NDVI), which provided added insights into hydrological triggers and terrain cover conditions, both critical to understanding the landslide dynamics in monsoon-influenced terrains. The spatial pattern of landslide susceptibility indicates a high concentration of susceptible areas in the northern and southwestern sectors of the study region, which are characterized by steep slopes, deeply weathered hard rock formations, and high annual precipitation. These findings confirm that not just slope angle, but the weathering profile of underlying geology, particularly Charnockites and Migmatites, and rain-induced saturation of topsoil contribute significantly to slope failures. Notably, the coastal plains and central zones, with their flatter gradients and sedimentary formations, showed very low to low susceptibility, reinforcing the geomorphic control over landslide occurrences.
In comparison with earlier studies in Kerala, which predominantly relied on knowledge-driven approaches like the Analytical Hierarchy Process (AHP), this data-driven RF approach provides a more objective and replicable method of classification. Moreover, by using only freely available tools such as ArcGIS 10.8 and Weka, this methodology is accessible to local planners and disaster managers who may not have access to commercial or advanced platforms. The LSM produced here is statistically robust and spatially relevant, providing actionable insights for land-use planning, infrastructure development, and risk mitigation strategies. Future research may benefit from incorporating temporal rainfall intensity, soil depth, and landslide velocity data, which could further improve the temporal resolution of predictions and support early warning systems.

5.1. Model Transferability and Regional Comparisons

While the RF-based LSM model demonstrated high accuracy in the Western Ghats region, its performance may vary when applied to areas with different geomorphic, climatic, and land-use characteristics. For instance, studies in the Eastern Himalayas and the Nilgiris have also employed RF models with comparable AUC scores ranging from 0.87 to 0.94 [61,62], affirming the robustness of RF across diverse terrains. However, variations in lithology, rainfall regimes, and anthropogenic influences may alter the importance ranking of input variables. This underlines the importance of local calibration before applying the model to different regions. The transferability requires contextual adaptation. While slope and geology were dominant in this study, other areas may exhibit stronger control from land use changes, seismicity, or hydrological parameters. Therefore, stakeholders must ensure localized model validation. Future multi-regional comparative studies could further evaluate the generalizability of the RF framework and support the development of region-specific susceptibility models for broader disaster risk management applications.

5.2. Limitations and Future Scope

Despite the high accuracy achieved by the RF model, the study is limited by the availability of high-resolution temporal rainfall and soil depth data, which are crucial for capturing short-term triggering factors. The landslide inventory used, although comprehensive, is spatially constrained to recorded events and may not reflect all historical or unreported occurrences. The absence of dynamic parameters such as land use changes over time and anthropogenic disturbances (e.g., road cuts, quarrying) might underrepresent certain high-risk areas. Another key limitation is the absence of rainfall intensity–duration thresholds, critical in accurately modeling landslide triggers in monsoon-dominated regions like Kerala. To address this, future work should focus on integrating near-real-time satellite-based rainfall data and ground-based weather station data to improve temporal prediction accuracy. Real-time monitoring using remote sensing platforms could also be incorporated to enable early warning capabilities.
Furthermore, evaluating and comparing the performance of advanced machine learning algorithms such as XGBoost, Support Vector Machines, or deep learning models may provide additional insights into model robustness and transferability. Ultimately, coupling susceptibility models with early warning systems, temporal change detection, and on-ground validation will enhance the practical applicability of landslide risk reduction strategies for planners, disaster managers, and policymakers.

6. Conclusions

This study successfully demonstrates the application of the RF-ML algorithm to map landslide susceptibility in a geologically complex and rainfall-prone Western Ghats, Kerala region. Eight significant predictive factor variables—Stream Order, Drainage Density, Slope, Aspect, Geology, LULC, NDVI, and MSI—were used as predictors in the model. The RF classifier effectively captured these variables’ nonlinear relationships, producing a high predictive accuracy LSI map. The resulting map was reclassified into five susceptibility levels, revealing that approximately 17.82% of the study area falls under high to very high susceptibility classes, primarily in steep, weathered, and high-rainfall terrains. Validation using 231 landslide inventory points from Bhukosh and AUC-ROC analysis yielded an accuracy of 0.890, indicating strong model performance. This research highlights the potential of RF-based models integrated with GIS for reliable landslide hazard zonation in data-limited mountainous regions. The findings can aid local authorities and planners in prioritizing high-risk zones for mitigation strategies, infrastructure planning, and early warning system development.

Author Contributions

Conceptualization, M.Z.; methodology, P.K.B.; software, A.B.N.; formal analysis, A.B.N. and R.B.K.; investigation, M.Z.; resources, M.Z.; data curation, P.K.B.; writing—original draft preparation, P.K.B.; writing—review and editing, P.K.B., F.F.B.H., V.N.M., and M.Z.; visualization, A.B.N. and S.G.; supervision, S.G.; project administration, M.Z. All authors have read and agreed to the published version of the manuscript.

Funding

This research was funded by Princess Nourah bint Abdulrahman University Researchers Supporting Project number (PNURSP2025R675), Princess Nourah bint Abdulrahman University, Riyadh, Saudi Arabia.

Data Availability Statement

The landslide inventory data were obtained from the publicly accessible Bhukosh Geological Survey of India (GSI) portal. The geospatial analysis was conducted using ArcGIS 10.8, and the machine learning model was developed using the open-source Weka software. All data layers used in the study are available upon reasonable request. The code used for random forest classification is available upon request from the corresponding author. No proprietary or confidential data were used in this study.

Acknowledgments

The authors extend their appreciation to Princess Nourah bint Abdulrahman University Researchers Supporting Project number (PNURSP2025R675), Princess Nourah bint Abdulrahman University, Riyadh, Saudi Arabia. The first author expresses sincere gratitude to the Science and Engineering Research Board-National Post-Doctoral Fellowship (SERB-NPDF) for their invaluable support, with Fellowship reference no. PDF/2023/000774, during my tenure as a fellow at NGRI, Hyderabad. The authors extend their heartfelt appreciation to the Director of the CSIR-National Geophysical Research Institute for granting permission to publish the paper. Special thanks are extended to the Editor-in-Chief/Handling Editor of the journal for their unwavering support. The authors also express gratitude to the anonymous reviewers for their constructive feedback and valuable suggestions, which significantly enhanced the manuscript’s quality. The manuscript Reference No. Is NGRI/Lib/2025/Pub-54.

Conflicts of Interest

The authors declare no conflict of interest.

List of Abbreviations

AcronymFull Form
AHPAnalytical Hierarchy Process
ANNArtificial Neural Network
AUC-ROCArea Under the Curve–Receiver Operating Characteristic
DEMDigital Elevation Model
GCPGround Control Point
GISGeographic Information System
GPSGlobal Positioning System
GWPZGroundwater Potential Zone
LSILandslide Susceptibility Index
LSMLandslide Susceptibility Mapping
LSLMLandslide Susceptibilty Level Map
LULCLand Use/Land Cover
MSIMoisture Stress Index
NDVINormalized Difference Vegetation Index
NDWINormalized Difference Water Index
NIRNear-Infrared
OLIOperational Land Imager
RFRandom Forest
RSRemote Sensing
SAVISoil Adjusted Vegetation Index
SPIStandardized Precipitation Index
SVMSupport Vector Machine
SWIRShort-Wave Infrared
USGSUnited States Geological Survey
WGS84World Geodetic System 1984

References

  1. Chaudhary, M.T.; Piracha, A. Natural disasters—Origins, impacts, management. Encyclopedia 2021, 1, 1101–1131. [Google Scholar] [CrossRef]
  2. Emberson, R.; Kirschbaum, D.; Stanley, T. New global characterisation of landslide exposure. Nat. Hazards Earth Syst. Sci. 2020, 20, 3413–3424. [Google Scholar] [CrossRef]
  3. Singh, S. Changing perspectives in Geomorphology. J. Indian Geomorphol. 2019, 7, S1–S11. [Google Scholar]
  4. Haque, U.; Da Silva, P.F.; Devoli, G.; Pilz, J.; Zhao, B.; Khaloua, A.; Wilopo, W.; Andersen, P.; Lu, P.; Lee, J.; et al. The human cost of global warming: Deadly landslides and their triggers (1995–2014). Sci. Total Environ. 2019, 682, 673–684. [Google Scholar] [CrossRef]
  5. Petley, D.N.; Dunning, S.A.; Rosser, N.J. The analysis of global landslide risk through the creation of a database of worldwide landslide fatalities. In Landslide Risk Management; CRC Press: Boca Raton, FL, USA, 2005; pp. 377–384. [Google Scholar]
  6. Gariano, S.L.; Guzzetti, F. Landslides in a changing climate. Earth-Sci. Rev. 2016, 162, 227–252. [Google Scholar] [CrossRef]
  7. Shabbir, W.; Omer, T.; Pilz, J. The impact of environmental change on landslides, fatal landslides, and their triggers in Pakistan (2003–2019). Environ. Sci. Pollut. Res. 2023, 30, 33819–33832. [Google Scholar] [CrossRef] [PubMed]
  8. Sim, K.B.; Lee, M.L.; Wong, S.Y. A review of landslide acceptable risk and tolerable risk. Geoenviron. Disasters 2022, 9, 3. [Google Scholar] [CrossRef]
  9. Pragya; Kumar, M.; Tiwari, A.; Majid, S.I.; Bhadwal, S.; Sahu, N.; Verma, N.K.; Tripathi, D.K.; Avtar, R. Integrated spatial analysis of forest fire susceptibility in the Indian Western Himalayas (IWH) using remote sensing and GIS-based fuzzy AHP approach. Remote Sens. 2023, 15, 4701. [Google Scholar] [CrossRef]
  10. Naga Kumar, K.C.V.; Deepak, P.M.; Basheer Ahammed, K.K.; Rao, K.N.; Gopinath, G.; Dinesan, V.P. Coastal vulnerability assessment using Geospatial technologies and a Multi-Criteria Decision Making approach–a case study of Kozhikode District coast, Kerala State, India. J. Coast. Conserv. 2022, 26, 16. [Google Scholar] [CrossRef]
  11. Nishara, V.P.; Sruthi Krishnan, V.; Firoz, C.M. Geo-intelligence-based approach for sustainable development of peri-urban areas: A case study of Kozhikode City, Kerala (India). In Geo-Intelligence for Sustainable Development; Springer: Singapore, 2021; pp. 35–52. [Google Scholar]
  12. Viswanath, N.C.; Kumar, P.D.; Ammad, K.K. Statistical analysis of quality of water in various water shed for Kozhikode City, Kerala, India. Aquat. Procedia 2015, 4, 1078–1085. [Google Scholar] [CrossRef]
  13. Yadawa, S.K. Landslide mitigation and sustainable management and policies. In Landslides in the Himalayan Region: Risk Assessment and Mitigation Strategy for Sustainable Management; Springer: Singapore, 2024; pp. 423–447. [Google Scholar]
  14. Upadhyay, V. Landslide Hazard Risk and Vulnerability Monitoring—GIS Based Approach. In Landslide: Susceptibility, Risk Assessment, and Sustainability: Application of Geostatistical and Geospatial Modeling; Springer: Cham, Switzerland, 2024; pp. 53–86. [Google Scholar]
  15. Barman, J.; Ali, S.S.; Nongrem, T.; Biswas, B.; Rao, K.S.; Pramanik, M.; Falah Ben Hasher, F.; Zhran, M. Comparing the effectiveness of landslide susceptibility mapping by using the frequency ratio and hybrid MCDM models. Results Eng. 2024, 24, 103205. [Google Scholar] [CrossRef]
  16. Barman, J.; Biswas, B.; Das, J.; Falah Ben Hasher, F.; Zhran, M. Least cost path analysis for alternative road network assessment of landslide-prone NH-2, Mizoram, NE India. Geocarto Int. 2025, 40, 2490268. [Google Scholar] [CrossRef]
  17. Lokesh, P.; Madhesh, C.; Mathew, A.; Shekar, P.R. Machine learning and deep learning-based landslide susceptibility mapping using geospatial techniques in Wayanad, Kerala state, India. HydroResearch 2025, 8, 113–126. [Google Scholar]
  18. Badola, S.; Pandey, M.; Mishra, V.N.; Parkash, S.; Zhran, M. Landslide Susceptibility Mapping in Complex Topo-Climatic Himalayan Terrain, India Using Machine Learning Models: A Comparative Study of XGBoost, RF and ANN. Geol. J. 2025; Early View. [Google Scholar]
  19. Bhagya, S.B.; Sumi, A.S.; Balaji, S.; Danumah, J.H.; Costache, R.; Rajaneesh, A.; Gokul, A.; Chandrasenan, C.P.; Quevedo, R.P.; Johny, A.; et al. Landslide susceptibility assessment of a part of the Western Ghats (India) employing the AHP and F-AHP models and comparison with existing susceptibility maps. Land 2023, 12, 468. [Google Scholar] [CrossRef]
  20. Abraham, M.T.; Satyam, N.; Lokesh, R.; Pradhan, B.; Alamri, A. Factors affecting landslide susceptibility mapping: Assessing the influence of different machine learning approaches, sampling strategies and data splitting. Land 2021, 10, 989. [Google Scholar] [CrossRef]
  21. Jones, S.; Kasthurba, A.K.; Bhagyanathan, A.; Binoy, B.V. Landslide susceptibility investigation for Idukki district of Kerala using regression analysis and machine learning. Arab. J. Geosci. 2021, 14, 838. [Google Scholar] [CrossRef]
  22. Karuppusamy, S. Physiography and Climatology of the Western Ghats. In Biodiversity Hotspot of the Western Ghats and Sri Lanka; Apple Academic Press: Waretown, NJ, USA, 2024; pp. 5–23. [Google Scholar]
  23. Joseph, A.; Jayamohan, J.; Kolathayar, S. Kerala. In Geotechnical Characteristics of Soils and Rocks of India; CRC Press: Boca Raton, FL, USA, 2021; pp. 355–374. [Google Scholar]
  24. Saravanabavan, V.; Lekha, C.A.; Aparna, T.; Nisha, R.R.; Balaji, K.K.; Kanna, S.V. Spatio-temporal variation of dengue in Kozhikode District, Kerala: A medico geographical study. Int. J. Mosq. Res. 2021, 8, 130–140. [Google Scholar]
  25. Badapalli, P.K.; Nakkala, A.B.; Gugulothu, S.; Kottala, R.B. Dynamic land degradation assessment: Integrating machine learning with Landsat 8 OLI/TIRS for enhanced spectral, terrain, and land cover indices. Earth Syst. Environ. 2025, 9, 315–335. [Google Scholar] [CrossRef]
  26. Bhattacharya, O.; Sinha, S.; Mishra, V.N.; Kumari, M.; Hasher, F.F.B.; Barman, J.; Zhran, M. Harnessing geospatial tools to map the forest fire: Risk zonation in Pauri Garhwal, Uttarakhand. Results Eng. 2025, 25, 103694. [Google Scholar] [CrossRef]
  27. Fiorucci, F.; Ardizzone, F.; Mondini, A.C.; Viero, A.; Guzzetti, F. Visual interpretation of stereoscopic NDVI satellite images to map rainfall-induced landslides. Landslides 2019, 16, 165–174. [Google Scholar] [CrossRef]
  28. Niraj, K.C.; Singh, A.; Shukla, D.P. Effect of the normalized difference vegetation index (NDVI) on GIS-enabled bivariate and multivariate statistical models for landslide susceptibility mapping. J. Indian Soc. Remote Sens. 2023, 51, 1739–1756. [Google Scholar] [CrossRef]
  29. Çellek, S. Effect of the slope angle and its classification on Landslide. Nat. Hazards Earth Syst. Sci. Discuss. 2020, 2020, 1–23. [Google Scholar]
  30. Lin, Z.; Oguchi, T. Drainage density, slope angle, and relative basin position in Japanese bare lands from high-resolution DEMs. Geomorphology 2004, 63, 159–173. [Google Scholar] [CrossRef]
  31. India, N. Geological Society of India. GAILLARD C 1996, 231–245. [Google Scholar]
  32. Taalab, K.; Cheng, T.; Zhang, Y. Mapping landslide susceptibility and types using Random Forest. Big Earth Data 2018, 2, 159–178. [Google Scholar] [CrossRef]
  33. Catani, F.; Lagomarsino, D.; Segoni, S.; Tofani, V. Landslide susceptibility estimation by random forests technique: Sensitivity and scaling issues. Nat. Hazards Earth Syst. Sci. 2013, 13, 2815–2831. [Google Scholar] [CrossRef]
  34. Shahabi, H.; Hashim, M. Landslide susceptibility mapping using GIS-based statistical models and Remote sensing data in tropical Environment. Sci. Rep. 2015, 5, 9899. [Google Scholar] [CrossRef]
  35. Nhu, V.H.; Mohammadi, A.; Shahabi, H.; Ahmad, B.B.; Al-Ansari, N.; Shirzadi, A.; Clague, J.J.; Jaafari, A.; Chen, W.; Nguyen, H. Landslide susceptibility mapping using machine learning algorithms and remote sensing data in a tropical environment. Int. J. Environ. Res. Public Health 2020, 17, 4933. [Google Scholar] [CrossRef]
  36. Ghosh, T.; Bhowmik, S.; Jaiswal, P.; Ghosh, S.; Kumar, D. Generating substantially complete landslide inventory using multiple data sources: A case study in Northwest Himalayas, India. J. Geol. Soc. India 2020, 95, 45–58. [Google Scholar] [CrossRef]
  37. Kutlug Sahin, E.; Colkesen, I. Performance analysis of advanced decision tree-based ensemble learning algorithms for landslide susceptibility mapping. Geocarto Int. 2021, 36, 1253–1275. [Google Scholar] [CrossRef]
  38. Zhang, Y.; Liu, J.; Shen, W. A review of ensemble learning algorithms used in remote sensing applications. Appl. Sci. 2022, 12, 8654. [Google Scholar] [CrossRef]
  39. Hall, M.; Frank, E.; Holmes, G.; Pfahringer, B.; Reutemann, P.; Witten, I.H. The WEKA data mining software: An update. ACM SIGKDD Explor. Newsl. 2009, 11, 10–18. [Google Scholar] [CrossRef]
  40. Chorley, R.J. The drainage basin as the fundamental geomorphic unit. In Introduction to Physical Hydrology; Routledge: London, UK, 2019; pp. 37–59. [Google Scholar]
  41. Pappaka, R.K.; Nakkala, A.B.; Badapalli, P.K.; Gugulothu, S.; Anguluri, R.; Hasher, F.F.B.; Zhran, M. Machine Learning-Driven Groundwater Potential Zoning Using Geospatial Analytics and Random Forest in the Pandameru River Basin, South India. Sustainability 2025, 17, 3851. [Google Scholar] [CrossRef]
  42. McColl, S.T. Landslide causes and triggers. In Landslide Hazards, Risks, and Disasters; Elsevier: Amsterdam, The Netherlands, 2022; pp. 13–41. [Google Scholar]
  43. Singh, S. Understanding the role of slope aspect in shaping the vegetation attributes and soil properties in Montane ecosystems. Trop. Ecol. 2018, 59, 417–430. [Google Scholar]
  44. Kuriakose, S.L.; Sankar, G.; Muraleedharan, C. History of landslide susceptibility and a chorology of landslide-prone areas in the Western Ghats of Kerala, India. Environ. Geol. 2009, 57, 1553–1568. [Google Scholar] [CrossRef]
  45. Aldileemi, H.; Zhran, M.; El-Mewafi, M. Geospatial Monitoring and Prediction of land Use/Land Cover (LULC) Dynamics Based on the CA-Markov Simulation Model in Ajdabiya, Libya. Int. J. Geoinform. 2023, 19, 15–29. [Google Scholar]
  46. Zhao, B.; Dai, Q.; Han, D.; Dai, H.; Mao, J.; Zhuo, L.; Rong, G. Estimation of soil moisture using modified antecedent precipitation index with application in landslide predictions. Landslides 2019, 16, 2381–2393. [Google Scholar] [CrossRef]
  47. Tajudin, N.; Ya’acob, N.; Ali, D.M.; Adnan, N.A. Soil moisture index estimation from Landsat 8 images for prediction and monitoring landslide occurrences in Ulu Kelang, Selangor, Malaysia. Int. J. Electr. Comput. Eng. 2021, 11, 2101–2108. [Google Scholar] [CrossRef]
  48. Doan, V.L.; Nguyen, B.Q.V.; Pham, H.T.; Nguyen, C.C.; Nguyen, C.T. Effect of time-variant NDVI on landside susceptibility: A case study in Quang Ngai province, Vietnam. Open Geosci. 2023, 15, 20220550. [Google Scholar] [CrossRef]
  49. Pradhan, B.; Sezer, E.A.; Gokceoglu, C.; Buchroithner, M.F. Landslide susceptibility mapping by neuro-fuzzy approach in a landslide-prone area (Cameron Highlands, Malaysia). IEEE Trans. Geosci. Remote Sens. 2010, 48, 4164–4177. [Google Scholar] [CrossRef]
  50. Cui, Y.; Yang, W.; Xu, C.; Wu, S. Distribution of ancient landslides and landslide hazard assessment in the Western Himalayan Syntaxis area. Front. Earth Sci. 2023, 11, 1135018. [Google Scholar] [CrossRef]
  51. Mallick, J.; Alqadhi, S.; Talukdar, S.; AlSubih, M.; Ahmed, M.; Khan, R.A.; Ben Kahla, N.; Abutayeh, S.M. Risk assessment of resources exposed to rainfall induced Landslide with the development of GIS and RS based ensemble metaheuristic machine learning algorithms. Sustainability 2021, 13, 457. [Google Scholar] [CrossRef]
  52. Riaz, M.T.; Basharat, M.; Brunetti, M.T. Assessing the effectiveness of alternative landslide partitioning in machine learning methods for landslide prediction in the complex Himalayan terrain. Prog. Phys. Geogr. Earth Environ. 2023, 47, 315–347. [Google Scholar] [CrossRef]
  53. Costache, R.; Ali, S.A.; Parvin, F.; Pham, Q.B.; Arabameri, A.; Nguyen, H.; Crăciun, A.; Anh, D.T. Detection of areas prone to flood-induced landslides risk using certainty factor and its hybridization with FAHP, XGBoost and deep learning neural network. Geocarto Int. 2022, 37, 7303–7338. [Google Scholar] [CrossRef]
  54. Sajinkumar, K.S.; Anbazhagan, S.; Pradeepkumar, A.P.; Rani, V.R. Weathering and landslide occurrences in parts of Western Ghats, Kerala. J. Geol. Soc. India 2011, 78, 249–257. [Google Scholar] [CrossRef]
  55. Rai, N.K.; Singh, P.K.; Shankar, R.; Singh, D. A Comparative Analysis of Landslide Characteristics of the Himalayan and Western Ghat Mountain Belts. In Landslides: Analysis, Modeling and Mitigation; Springer: Cham, Switzerland, 2025; pp. 77–100. [Google Scholar]
  56. Sajinkumar, K.S.; Anbazhagan, S. Geomorphic appraisal of landslides on the windward slope of Western Ghats, Southern India. Nat. Hazards 2015, 75, 953–973. [Google Scholar] [CrossRef]
  57. Patil, A.S.; Panhalkar, S.S. Remote sensing and GIS-based landslide susceptibility mapping using LNRF method in part of Western Ghats of India. Quat. Sci. Adv. 2023, 11, 100095. [Google Scholar] [CrossRef]
  58. Kulkarni, J.R.; Kulkarni, S.S.; Inamdar, M.U.; Tamhankar, N.M.; Waghmare, S.B.; Thombare, K.R.; Mhetre, P.S.; Khatavkar, T.; Panse, Y.; Patwardhan, A.; et al. “satark”: Landslide prediction system over Western Ghats of India. Land 2022, 11, 689. [Google Scholar] [CrossRef]
  59. Youssef, A.M.; Pourghasemi, H.R. Landslide susceptibility mapping using machine learning algorithms and comparison of their performance at Abha Basin, Asir Region, Saudi Arabia. Geosci. Front. 2021, 12, 639–655. [Google Scholar] [CrossRef]
  60. Aslam, B.; Maqsoom, A.; Khalil, U.; Ghorbanzadeh, O.; Blaschke, T.; Farooq, D.; Tufail, R.F.; Suhail, S.A.; Ghamisi, P. Evaluation of different landslide susceptibility models locally in the Chitral District, Northern Pakistan. Sensors 2022, 22, 3107. [Google Scholar] [CrossRef]
  61. Saha, S.; Roy, J.; Pradhan, B.; Hembram, T.K. Hybrid ensemble machine learning approaches for landslide susceptibility mapping using different sampling ratios at East Sikkim Himalayan, India. Adv. Space Res. 2021, 68, 2819–2840. [Google Scholar] [CrossRef]
  62. Rahaman, A.; Dondapati, A.; Gupta, S.; Raj, R. Leveraging artificial neural networks for robust landslide susceptibility mapping: A geospatial modeling approach in the ecologically sensitive Nilgiri District, Tamil Nadu. Geohazard Mech. 2024, 2, 258–269. [Google Scholar] [CrossRef]
Figure 1. Location map of the study area. The figure shows the geographic location of Kerala within India (highlighted by a rectangle), and Kozhikode within Kerala (highlighted by another rectangle). The map also displays the stream network and spatial distribution of recorded landslide points across the study boundary.
Land 14 01453 g001
Figure 2. Methodology flowchart illustrating the step-by-step procedure adopted for landslide susceptibility mapping. It includes data collection, preprocessing, extraction of predictive variables, model training using the random forest algorithm, and validation.
Land 14 01453 g002
Figure 3. Topographic and hydrological predictive variables used in the model. (a) Stream Order classified using Strahler’s method; (b) Drainage Density representing stream concentration per unit area; (c) Slope map derived from SRTM DEM; (d) Aspect indicating the direction of slope faces. These layers provide essential geomorphic inputs for landslide analysis. Geological and environmental predictive variables used in the study. (e) Geological formations in the study area. (f) Land Use and Land Cover (LULC); (g) Moisture Stress Index (MSI); (h) Normalized Difference Vegetation Index (NDVI); These variables reflect both anthropogenic and natural terrain characteristics.
Land 14 01453 g003aLand 14 01453 g003b
Figure 4. Landslide susceptibility of the piedmont. (a) Binary classification: Not Landslide-Prone or Landslide-Prone; (b) Probability of Landslide.
Land 14 01453 g004
Figure 5. Landslide Susceptibility Level Map showing the spatial distribution of susceptibility classes ranging from Very Low to Very High. Insets 1 to 3 present zoomed-in circular views highlighting landslide-prone areas, overlaid with validated landslide points and corresponding pixel-level locations visualized on Google Earth.
Land 14 01453 g005
Figure 6. AUC-ROC curve for the RF model used in LSLM.
Land 14 01453 g006
Table 1. Data sources and their description.
S. No.Predictive FactorsData SourceSpatial ResolutionDescription
1Normalized Difference Vegetation Index (NDVI)Landsat 8 OLI (USGS Earth Explorer)
(Derived using NIR and Red bands)
30 mIndicates vegetation health and coverage.
2Moisture Stress Index (MSI)Landsat 8 OLI (Derived using NIR and SWIR bands)30 mReflects soil moisture and vegetation stress levels.
2Land Use/Land Cover (LULC)Bhuvan (ISRO)/Digitized from Landsat30 mReflects surface cover types influencing runoff.
4SlopeDerived from SRTM DEM (USGS)30 mRepresents terrain steepness.
5AspectDerived from SRTM DEM30 mIndicates slope direction, influencing solar radiation and moisture retention.
6Drainage DensityDerived from the digitized drainage layerVector to RasterMeasures stream frequency per unit area.
7Stream OrderDerived using Strahler’s method from DEMVector to RasterReflects hydrological hierarchy of streams.
8GeologyGeological Survey of India (GSI)/BhuvanVector to RasterLithological units influence weathering, permeability, and slope failure potential.
9Historical Landslide PointsGeological Survey Reports/Field SurveysPoint ShapefileKnown landslide occurrences used for training and validation.
Table 2. Various predictive factors and classifications for RF.
Predictive FactorsClassificationDescriptionLandslide Susceptibility
Stream Order1st OrderHeadwater channels, steep slopesVery High
2nd OrderNear ridges, upper slopesHigh
3rd OrderMid-slope valleysModerate
4th OrderLower valley areasLow
5th OrderMain drainage trunkVery Low
Drainage Density0.01 to 1.22 km/km2Low drainage density areasLow
1.22 to 1.91 km/km2Moderate drainage densityModerate
1.91 to 2.57 km/km2Higher drainage densityHigh
2.57 to 3.33 km/km2Very high drainage densityVery High
3.33 to 5.51 km/km2Extremely high drainage densityVery High
Slope0 to 10%Shallow, gentle slopesLow
10 to 25%Moderately steep slopesModerate
25 to 50%Steep slopesHigh
50 to 100%Very steep slopesVery High
>100%Extremely steep slopesVery High
AspectFlat (−1)No slope, flat areasVery Low
North (0–22.5)Northern-facing slopesLow
Northeast (22.5–67.5)Northeast-facing slopesModerate
East (67.5 to 112.5)East-facing slopesModerate
Southeast (112.5 to 157.5)Southeast-facing slopesHigh
South (157.5–202.5)South-facing slopesVery High
Southwest (202.5–247.5)Southwest-facing slopesVery High
West (247.5–292.5)West-facing slopesHigh
Northwest (292.5–337.5)Northwest-facing slopesModerate
North (337.5–360)Northern-facing slopesLow
GeologyCharnockiteHard, crystalline rock formationHigh
GranophyreMedium-hard rockModerate
Coastal and SedimentsLoose sediments and coastal formationsModerate
MigmatiteHighly weathered, foliate rock formationVery High
LULCDense VegetationForested areas with dense canopyVery Low
River/StreamRiver or stream areas, water bodiesLow
VegetationSparse vegetation or cultivated landModerate
Hilly Area with Dense VegetationSteep, forested hillsHigh
Wet Soils/River/Water BodiesWetlands, flooded areasHigh
MSI0.48 to 0.70High soil moistureVery High
0.70 to 0.77Moderate moistureHigh
0.77 to 0.87Moderate soil moistureModerate
0.87 to 0.99Low soil moistureLow
0.99 to 1.96Very low moisture (dry areas)Very Low
NDVI−0.16 to 0.11Bare soil or water bodiesVery High
0.11 to 0.22Sparse vegetation or disturbed landHigh
0.22 to 0.29Moderate vegetationModerate
0.29 to 0.35Dense vegetationLow
0.35 to 0.54Very dense vegetation (forests)Very Low
Table 3. Predictive factors and their classification ranges.
Predictive Factors Classification Range Normalization Method
Stream Order1st to 5th OrderReclassified into 5 classes
DD0.01 to 5.51 km/km2Normalized into 5 ranges
Slope0 to >100%Reclassified into 5 slope classes
AspectFlat, N, NE, E, SE, S, SW, W, NWConverted into 10 directional classes
GeologyCharnockite, Granophyre, Coastal Sediments, Migmatite4 classes based on geological types
LULCDense Vegetation, River, Wet Soils, etc.Reclassified into 5 land-use classes
MSI0.48 to 1.96Normalized into 5 ranges
NDVI−0.16 to 0.54Reclassified into 5 vegetation classes
Table 4. Splitting of landslide and non-landslide dataset points.
Dataset Split Landslide Points Non-Landslide Points Total
Training Set162161323
Testing Set6970139
Table 5. Weka based model evaluation metrics.
MetricValue
Overall Accuracy (%)91.37
Kappa Statistic0.827
Precision (Landslide)0.89
Recall (Landslide)0.9
F-Measure (Landslide)0.895
AUC-ROC0.94
Table 6. RF based predictive factor variables and their relative importances.
Predictive Factors VariableRelative Importance (%)
Slope24.3
Geology18.7
MSI16.5
NDVI12.9
Drainage Density10.4
Stream Order7.8
LULC6.1
Aspect3.3
Table 7. Resultant LSLM.
Landslide Susceptibility LevelArea in sq. kmArea in %
Moderate136.756.02
High223.529.84
Very high181.347.988
Low602.9726.56
Very Low1125.4249.57
total2270100
Disclaimer/Publisher’s Note: The statements, opinions and data contained in all publications are solely those of the individual author(s) and contributor(s) and not of MDPI and/or the editor(s). MDPI and/or the editor(s) disclaim responsibility for any injury to people or property resulting from any ideas, methods, instructions or products referred to in the content.

