1. Introduction
The degradation of grassland ecological functions, exacerbated by climate change and shifts in land use practices, has become a widespread challenge in arid and semi-arid regions worldwide. This process significantly disrupts the balance between forage supply and livestock demand and threatens the livelihood security of pastoral communities. China’s northwestern pastoral zones face similar pressures. In recent years, national-level policies—such as “grazing prohibition” [
1,
2] and “forage–livestock balance” [
3,
4]—have partially mitigated ecological stress but have also led to substantial contraction of available grazing land, intensifying the spatial and temporal mismatches between grassland resources and livestock needs.
On a global scale, ecologically fragile and resource-scarce areas often encounter the dual dilemma of low agricultural productivity and the difficulty of reconciling pastoral livelihoods with ecological protection. These tensions have prompted the exploration of agro-pastoral complementarity as a strategy for adaptive management. Two dominant models of this strategy are observed: (1) policy-driven approaches, such as the ECOWAS transhumance framework [
5] and grassland transfer systems on the Qinghai–Tibet Plateau [
6]; and (2) community-based self-organizing practices, including transhumant grazing in Greece [
7], seasonal migration in France [
8], and ecological livelihood strategies in Kenya [
9]. Research suggests that cross-regional livestock mobility and feed redistribution can alleviate forage shortages [
10], restore ecological functions, and improve overall sustainability [
11].
Although existing studies offer valuable insights into the structural diversity of agro-pastoral systems, most focus either on large-scale ecological effects or on case-specific community-level narratives. There remains a lack of integrated evaluation combining ecological and social indicators to systematically assess the overall performance of such systems in terms of sustainability, resilience, and adaptability. In China—particularly in the arid northwest—pastoral adaptation processes are strongly shaped by shifts in policy, ecological zoning, and land use restructuring. This has given rise to institutionally embedded practices such as “borrowed pasture”, which urgently require specialized analysis within a coupled institutional–ecological framework.
In China, the continuous reduction in local grazing areas has led herders in regions such as the Hexi Corridor and the northern Qilian Mountains to adopt a self-initiated production practice known as off-site grazing through farmland rental. This approach involves leasing crop residue fields in oasis agricultural areas during autumn and winter, allowing herders to shift their livestock out of alpine grasslands into these lowland zones. This practice eases forage–livestock pressure, reduces feed costs, and constructs a dynamic land–livelihood coupled system between high-altitude pastoral zones and oasis farming regions. This off-site grazing practice reflects herders’ adaptive responses to both ecological degradation and institutional constraints, while also significantly altering patterns of grassland coverage and land use intensity. However, the actual impact pathways of this practice on land system evolution and herders’ livelihood remain insufficiently quantified and poorly understood.
To address this, we introduce the land use dynamic degree (LUDD) indicator, which captures both the rate and direction of land use change. Widely applied in arid and semi-arid regions [
12], the LUDD supports sensitivity analyses of ecosystem services and future land use simulations [
13,
14], while multi-dimensional metrics reveal land use trends, directions, and stability—enhancing our understanding of the coupled mechanisms between ecological degradation and human activities [
15,
16]. Recent studies have further embedded the LUDD into evaluations of the “production–living–ecology” functional nexus, combining remote sensing data and land transfer matrices within the CCDM to assess multi-functional coordination and ecological pattern shifts [
17]. In ecologically sensitive regions like the Qilian Mountains, the CCDM demonstrates strong potential for representing human–land interactions and spatial transitions [
18]. However, current research remains overly focused on ecological simulations, with limited attention paid to how herders’ livelihood strategies—particularly agro-pastoral complementarity—interact with land use and land cover change (LUCC). The feedback mechanisms between such self-organized practices and land system dynamics are not yet well understood. Addressing this gap requires tools capable of simultaneously quantifying land system transformation and social adaptive behavior.
The CCDM offers such potential, providing a means to evaluate the interactive states of multiple subsystems. The CCDM has been widely used to assess linkages between land use and ecosystem services in both regional and urban contexts, employing frameworks such as “land use–ecosystem services” [
19] or “land use–carbon emissions–economic development” [
20]. It enables diagnosis of synergies and conflicts within regional sustainability strategies [
21]. The refinement of CCDM applications has led to the integration of complex indicators—such as the integrated value of ecosystem services [
22], green land use efficiency [
23], and land use intensity [
24]—into multi-dimensional evaluation systems, facilitating the analysis of spatiotemporal heterogeneity and guiding differentiated governance [
25,
26].
In grassland ecosystems, the CCDM has also been used to characterize subsystem interactions during degradation and restoration processes, such as soil–vegetation–livestock couplings. It supports the evaluation of different management regimes (e.g., enclosure, rotational grazing) [
27,
28] and the visualization of dynamic grazing intensity and ecological carrying capacity using quadrant analysis [
29], providing an empirical basis for precision grassland restoration and pastoral policy design [
30]. Collectively, the CCDM now forms a comprehensive analytical path encompassing ecosystem function assessment, human activity intensity, and spatial zoning for ecological management. While the CCDM has opened new avenues for quantifying social–ecological interactions, further integration of international agro-pastoral complementarity experiences is needed to understand how self-organized grazing systems operate under varying socio-ecological conditions.
Existing research on land use change in arid pastoral regions has largely focused on top–down policy interventions and ecological pattern dynamics, while paying limited attention to the agency of herders and farmers as land users and their adaptive livelihood strategies. In particular, there remains a gap in quantitatively understanding how individual-level behaviors—such as cross-regional grazing, farmland leasing, and forage redistribution—interact with broader land system transformations. To address this gap, this study investigates the self-organized off-site grazing practice emerging in the Qilian Mountain pastoral zone, a distinctive form of agro-pastoral complementarity between alpine grasslands and oasis agricultural areas. Utilizing the LUDD and the CCDM, we systematically examine the interaction between adaptive grazing strategies and land use transitions. The objectives of this study are fourfold: (1) to examine the spatiotemporal characteristics of land use change under the influence of self-organized grazing practices; (2) to develop and apply the CCDM to reveal the coupling intensity and coordination evolution between the land use system (L) and the off-site grazing system (B) from 2018 to 2023; (3) to investigate the bridging role of grassroot social networks and digital herder–farmer matchmaking platforms during COVID-19 in mitigating cross-regional grazing uncertainties, promoting institutional innovation, and improving off-site pasture utilization efficiency; and (4) to identify institutional gaps—such as fragmented subsidy and insurance schemes and weak inter-departmental coordination—and propose policy recommendations, including standardized rental contract templates, an integrated subsidy framework, and dynamic monitoring and evaluation mechanisms, to support the sustainable, scaled development of off-site grazing. By integrating social behavioral perspectives with remote sensing-based land system metrics, this study deepens our understanding of human–land interactions and offers practical insights for promoting adaptive governance strategies that enhance both ecological sustainability and livelihood security in arid and semi-arid pastoral regions.
In this study, we distinguish between two closely related yet analytically distinct concepts in social–ecological systems, i.e., adaptive capacity and resilience. Adaptive capacity refers to the proactive ability of individual herders when facing environmental and institutional pressures to adjust through self-organizing strategies such as transhumance (borrowing grazing rights elsewhere), livelihood diversification, and resource complementation. It emphasizes agency and behavioral flexibility. By contrast, resilience denotes the capacity of the coupled land–livelihood system to maintain or restore its core functions in the face of disturbances (e.g., the COVID-19 pandemic). It relies on social networks, coordination mechanisms, and institutional arrangements, and thus focuses on system-level stability. Although closely interlinked, these two concepts operate at different levels. Adaptive capacity is at the actor level while resilience is at the system level. Therefore, they are treated separately in this study so as to reveal response mechanisms across multiple scales.
2. Materials and Methods
2.1. Study Area
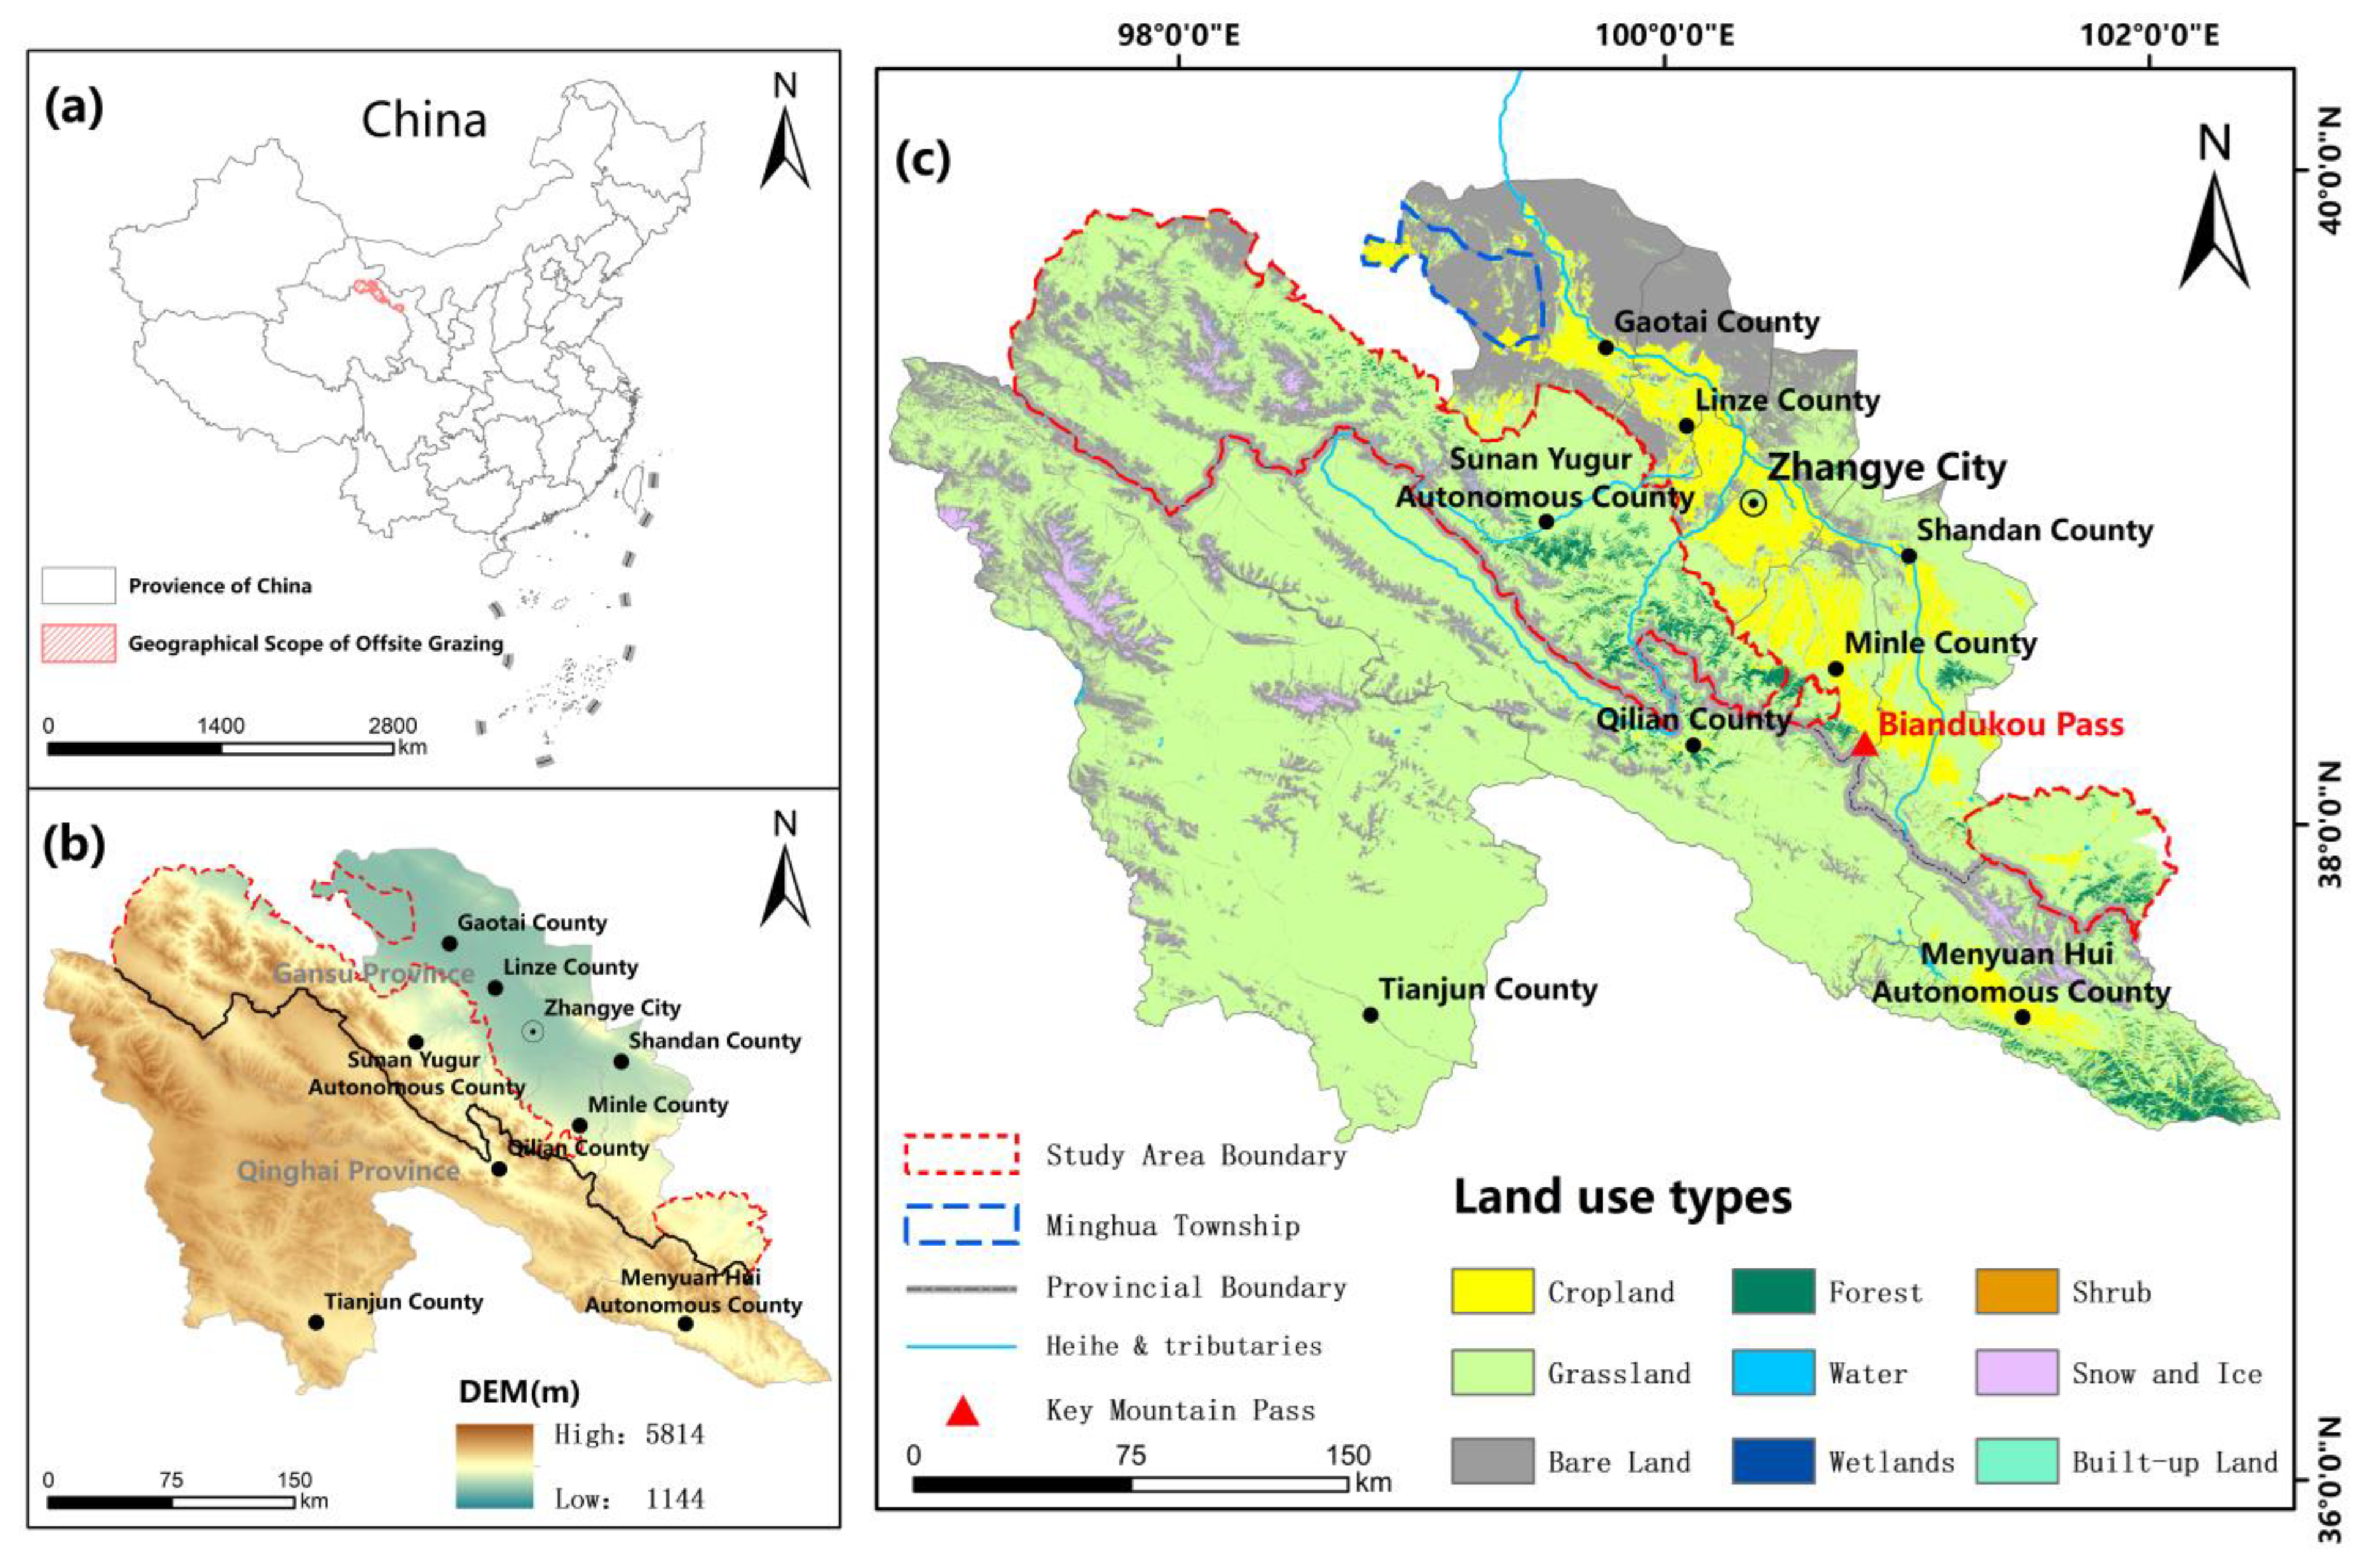
Sunan Yugur Autonomous County (hereafter referred to as Sunan County) is located in central Gansu Province, along the southern edge of the Hexi Corridor and on the northern slope of the Qilian Mountains (
Figure 1a). The county is composed of four non-contiguous areas (outlined by the red dashed line in
Figure 1b), covering a total area of approximately 24,000 square kilometers and housing a population of about 39,400. The terrain slopes from south to north, with an average elevation of around 3200 m. The region is characterized by a high-altitude, semi-arid climate.
Sunan County is rich in grassland resources, with a total grassland area of 2.6775 million mu (approximately 1.79 million hectares), accounting for about 70% of its total land area. The dominant grassland types include alpine meadows, temperate steppes, and desert steppes, making the county an integral part of the Qilian Mountains Nature Reserve. With a solid ecological foundation for grassland-based production, Sunan has developed a livestock-dominated economic structure, focusing on the breeding of grazing herbivores such as alpine fine-wool sheep and yaks. It is recognized as a representative county for high-altitude ecological animal husbandry in China.
It is important to note that Minghua Township, a subordinate township of Sunan County, is primarily agriculture-based and has a land use structure that differs significantly from the grassland–pastoral system targeted in this study. Moreover, official statistics on off-site grazing do not include data from Minghua. Therefore, in the empirical analysis, the term “Sunan County” specifically refers to the areas excluding Minghua Township, as indicated by the red dashed line in
Figure 1c.
2.2. Off-Site Grazing Through Farmland Rental
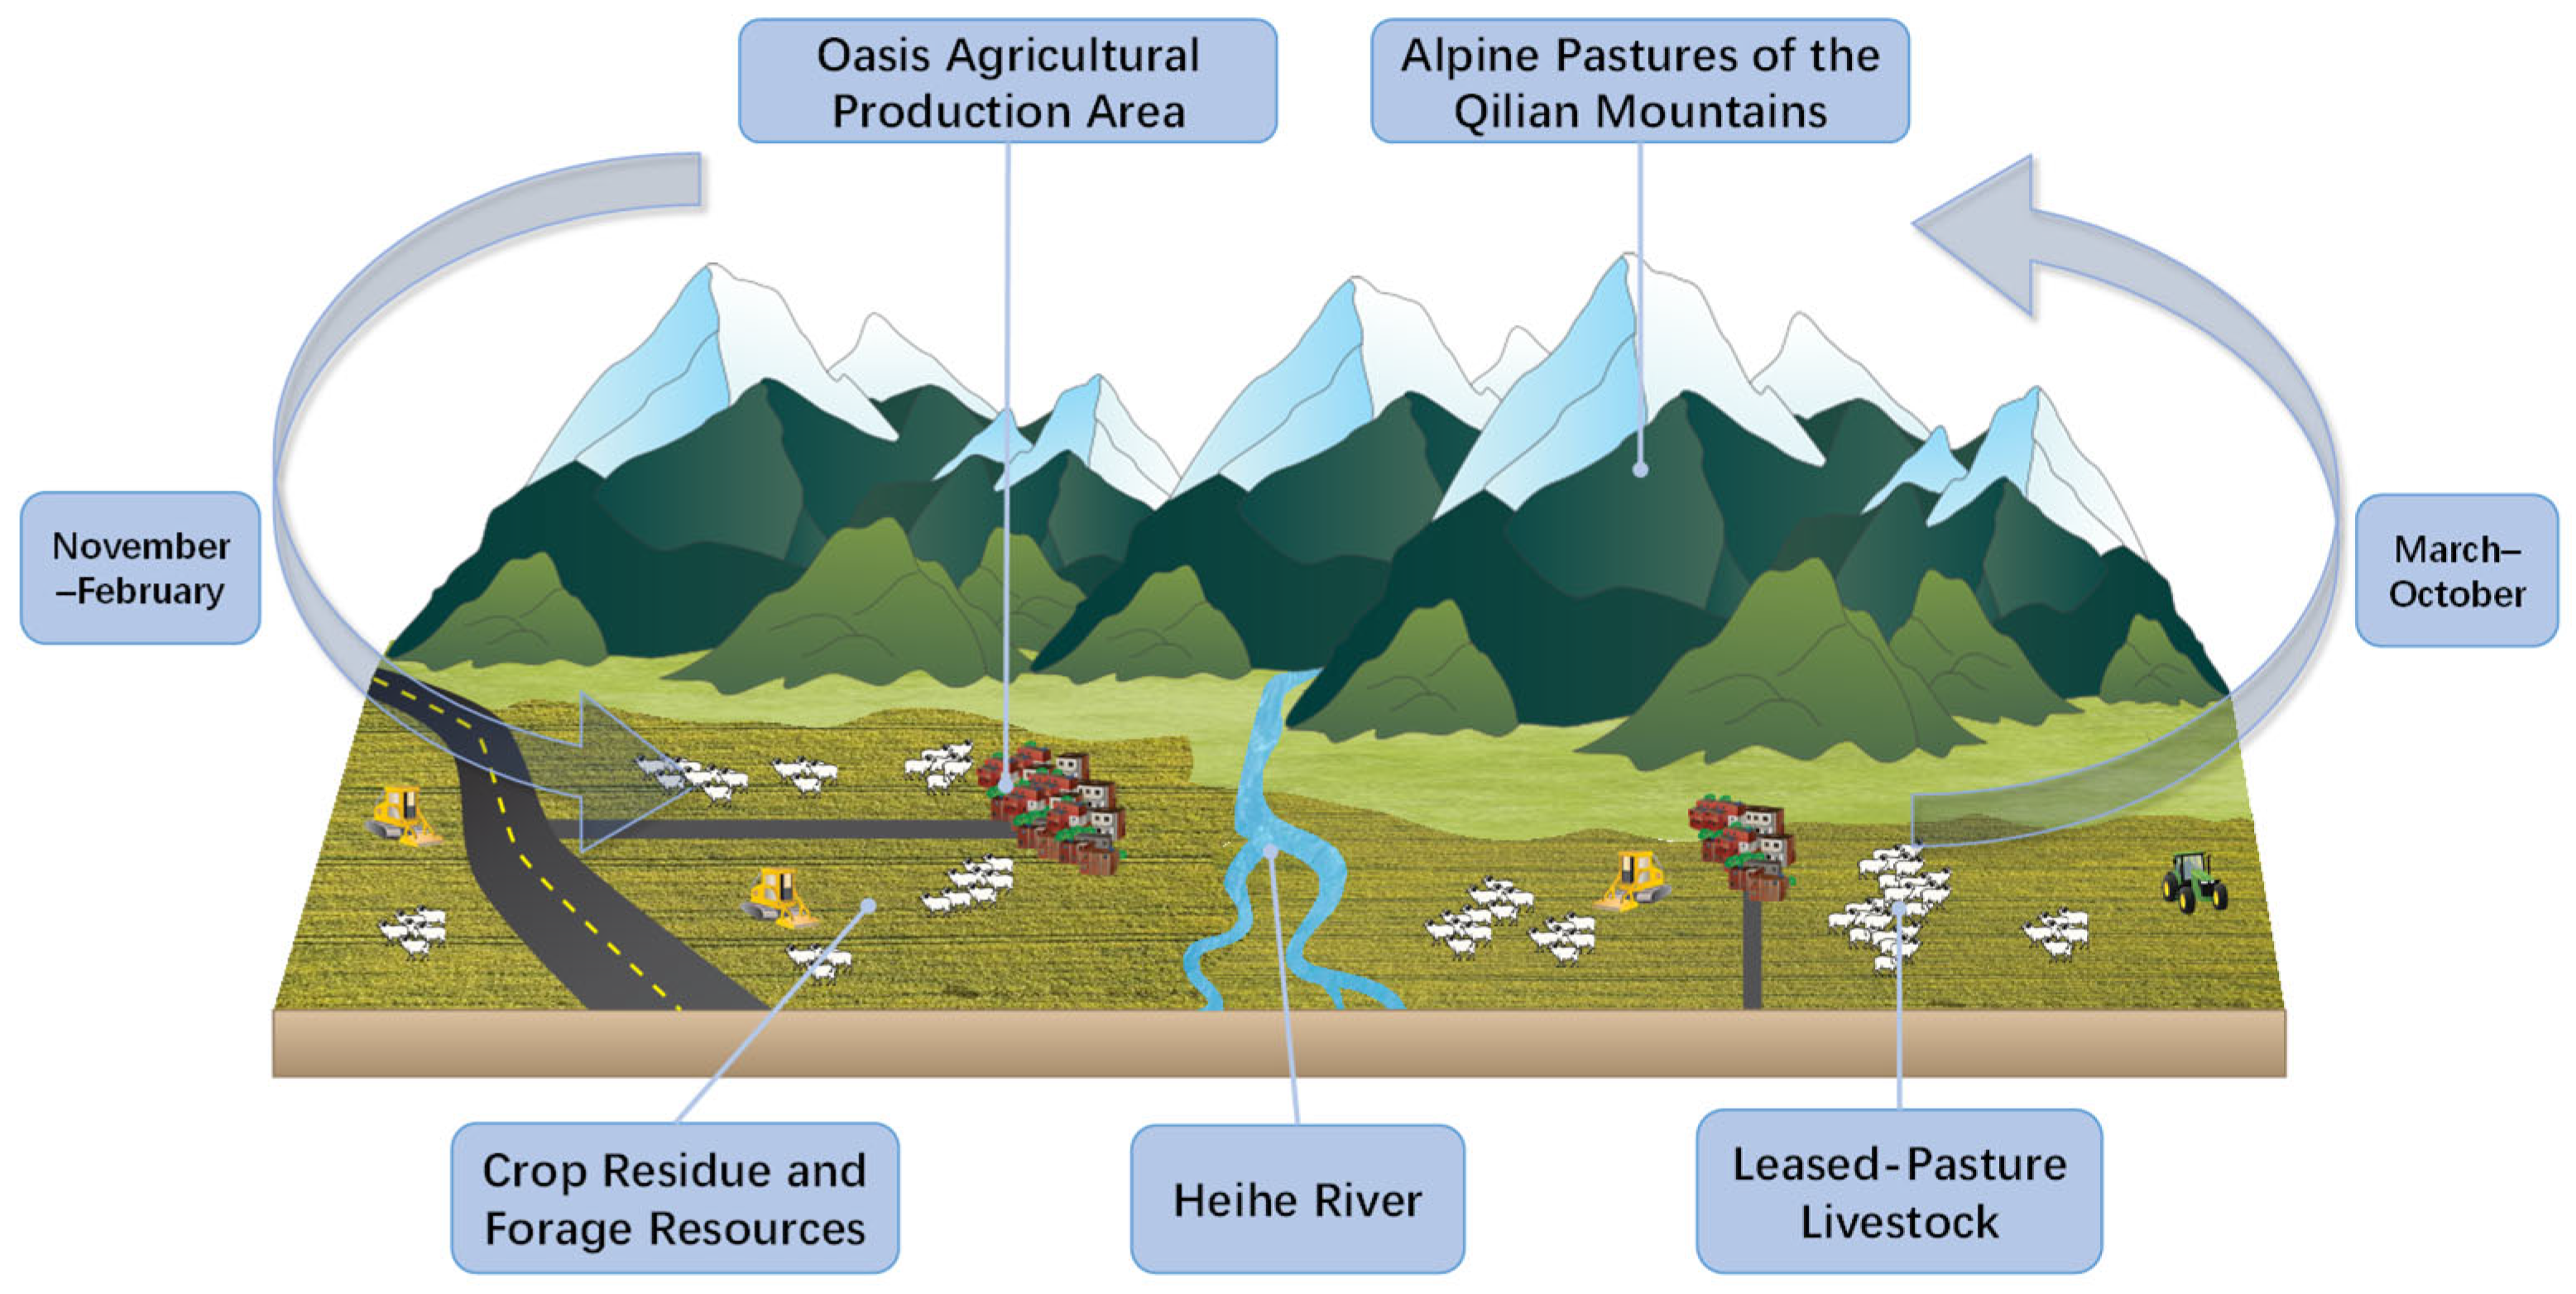
In the late 1990s, some herders in Sunan County began experimenting with short-term livestock fattening by renting multi-cut alfalfa fields in adjacent agricultural areas, aiming to improve livestock sale readiness. These scattered and informal practices represent the early prototypes of what would later become known as off-site grazing through farmland rental. Around 2010, some local farmers started informally sharing maize straw with familiar herders to alleviate winter forage shortages; however, these interactions remained limited to temporary mutual aid at the individual level.
It was not until 2017 that a more structured and large-scale winter grazing model—centered on renting post-harvest maize straw fields—began to emerge and expand rapidly. By 2018, this model was officially incorporated into the county’s livestock statistical system and became a formal component of pastoral management in Sunan. Each year, following the maize harvest in November, herders move their livestock into the crop residue fields for concentrated winter grazing. This period typically lasts until the onset of spring plowing in March of the following year, spanning approximately five months. Afterward, both herders and livestock return to the alpine pastures on the northern slopes of the Qilian Mountains. The middle reaches of the Heihe River, as one of China’s key maize seed production bases, generate a large amount of maize straw in autumn, providing substantial forage resources for winter feeding. This practice has gradually evolved into a cross-regional resource complementarity mechanism characterized by livestock reduction in pastoral areas and efficient forage use in agricultural zones—a system locally known as off-site grazing (
Figure 2).
2.3. Data Sources and Fieldwork Methods
The administrative boundary data used in this study were obtained from the 2024 county-level vector dataset (provincial, municipal, and county level) released by the National Geomatics Center of China (
http://www.ngcc.cn/). The Digital Elevation Model (DEM) data were derived from the SRTM DEM with 90 m resolution, provided by the Geospatial Data Cloud platform (
https://www.gscloud.cn/). The land cover dataset was developed by Jie Yang and Xin Huang’s team at Wuhan University based on Google Earth Engine, representing the first publicly available annual China land cover dataset at Landsat scale. Utilizing 335,709 Landsat TM/ETM+/OLI images, spectral–temporal indices, and terrain factors, the dataset was generated using a Random Forest model, followed by spatial–temporal consistency filtering and logical rule-based post-processing. It provides annual land cover classification from 1990 to 2019 (with an additional supplementary year of 1985) at 30 m resolution, covering nine land cover classes. The dataset achieves an overall accuracy of 79.31%, with a maximum F1 score per class reaching up to 87%. Updated versions now extend coverage through 2023, enabling research on land use changes, ecosystem dynamics, and evaluations of policy effectiveness across China [
31].
To gain an in-depth understanding of the off-site grazing practice, the research team conducted systematic interviews and participatory observations over a four-year period (2021–2025), visiting target areas annually following the relocation of herders to agricultural zones. The field team, composed of two researchers, focused on households that had continuously participated in off-site grazing since 2018. The team systematically collected information on grazing motivations, operational practices, and social interactions between herders and local farmers.
The team conducted interviews with 26 key respondents (
Table 1), selected to balance regional representativeness and experiential diversity across core pastoral areas of Sunan County, such as Dahe, Kangle, Baiyin, Huangcheng, and Qifeng Townships. Respondents included both traditional pastoralists experienced in off-site grazing and younger households recently adopting the practice. Variables such as gender, age, grazing experience, and livestock management scale were considered to capture the primary trends and issues associated with off-site grazing. Most respondents were recognized community pastoral leaders, long-term practitioners, or large-scale livestock managers with direct insights into grazing practices, institutional perceptions, and ecological impacts. Despite the limited sample size, the targeted selection provided robust interpretative value, effectively capturing micro-level processes and institutional perceptions beyond the reach of statistical data.
In addition to formal interviews, the researchers conducted participant observations in 11 off-site grazing households, selected through random sampling (2–3 households per field visit). During these visits, the researchers embedded themselves in household settings to observe daily practices, including livestock management, forage procurement, and labor division during the grazing period. This participatory approach not only enhanced the authenticity of the collected data but also helped bridge the potential gap between reported narratives and actual behavior.
2.4. Indicator System of Land Use System
Land use dynamic degrees are used for the indicator system of the land use system to evaluate the sustainability of the land use system. This study adopts a two-stage research design: In the first stage, we use the LUCC dynamic degree from 1996 to 2017 to characterize the long-term evolution of grassland degradation and grazing pressure, thereby establishing the ecological and policy background for the emergence of off-site grazing practices. In the second stage, we apply the CCDM to the period from 2018 to 2023, during which both complete LUCC data and 14 officially reported off-site grazing indicators are available.
To ensure temporal consistency across datasets, all annual data from the off-site grazing system are aligned with the terminal years of LUCC change intervals, thus establishing a unified temporal reference framework for the composite scoring and coupling analysis. Using the ArcGIS 10.8 platform, we performed vectorization, mask extraction, and other spatial analysis techniques to extract and identify land use changes in the study area from 1996 to 2023. Based on the classified land use datasets, we systematically analyzed the trends and spatial–temporal patterns of different land use types, calculated LUDD indicators, and constructed a land use transfer matrix to reveal the conversion relationships between various types of land cover. The LUDD primarily reflects the intensity and rate of land use change, as well as spatial differences in these changes. It includes both single land use dynamic degree and comprehensive land use dynamic degree metrics. The single land use dynamic degree is denoted as L and is calculated using the following formula:
where
is the area of the land use type at the beginning of the study period;
is the area of the land use type at the end of the study period;
is the initial year of the study period;
is the final year of the study period.
The comprehensive land use dynamic degree (
) is used to assess the overall rate and intensity of land use change across all categories within a given time period. It reflects the magnitude of land conversion among different land use types. The calculation is as follows:
where
represents the comprehensive land use dynamic degree (%);
is the area of land use type
at the beginning of the study period;
refers to the area converted from land use type
to land use type
;
and
are the initial and final years of the study period, respectively.
The land use transfer matrix is employed to describe the spatial conversion of different land use types within the study area across two time points. It reveals the extent and direction of land use transformation during the study period. The matrix is defined as follows:
where
is area;
is the number of land use types.
2.5. Indicator System of the Borrowed Pasture System
To comprehensively assess the sustainability of off-site grazing practices from multiple perspectives, this study establishes a set of indicators spanning economic, social, and ecological dimensions. Within this tri-dimensional framework [
32] (p. 3), and based on the Pressure–State–Response (PSR) model and data availability [
33] (p. 5), we constructs a comprehensive indicator system consisting of 13 variables (
Table 2):
Economic dimension: maize straw field rental price (−), net income increase per off-site grazing household (+), net income increase per sheep unit during the grazing period (+), and per capita disposable income of agro-pastoral residents in the county (+);
Social dimension: number of off-site grazing households (+) and net income contribution rate of off-site grazing (+);
Ecological dimension: suitable carrying capacity at year-end (+), number of livestock engaged in off-site grazing (+), total area of leased grazing land (+), livestock reduction achieved through off-site grazing (+), volume of maize straw converted into forage (+), amount of manure converted into organic fertilizer applied to fields (+), and grazing pressure index (−).
All data were obtained from the official records of the Sunan County Animal Husbandry and Veterinary Service Center, specifically the “Statistical Tables on External Grazing Livestock in Sunan County” from 2018 to 2023, as well as the corresponding annual government work reports. These provide a reliable and authoritative basis for sustainability assessment.
2.6. Indicator Robustness Test
To assess the validity and stability of our 13-indicator system under the entropy weight framework, we conducted a Leave-One-Out (LOO) deviation analysis as follows:
First, for each year 2018–2023, we computed the composite score
(as a baseline) using all 13 indicators. Subsequently, for each indicator,
was removed from the dataset before recomputing entropy weights and the revised composite scores
. Then, for each year and indicator, the deviation was calculated as
. Lastly, we summarized these deviations over T = 6 (2018–2023) years using a standardized metric, the relative percentage rate (RPR), which was calculated as follows:
In the RPR, denotes the six-year average of the composite scores. The RPR is classified into three levels: RPR ≤ 5% ⇒ high robustness, 5% < RPR ≤ 15% ⇒ medium robustness, and RPR > 15% ⇒ low robustness.
As shown in
Table 3, among the 13 selected indicators, one was identified as low robustness (RPR > 15%), three as medium robustness (5% < RPR ≤ 15%), and the remaining nine as high robustness (RPR ≤ 5%). Overall, the average relative percentage rate (RPR) of the 13 indicators was 5.31%, which is well below the commonly adopted 10% robustness threshold in the literature. This indicates that the indicator system maintained a high degree of consistency and stability over the 2018–2023 period. These results further validate the applicability of the system for entropy weight-based comprehensive evaluation and provide a solid data foundation for the subsequent coupling coordination analysis with the borrowed pasture system.
2.7. Composite Scoring of Land Use System and Borrowed Pasture System
In this study, the indicator system constructed based on the land use dynamic degree is used to represent the land use system (L), with its boundary defined by the observable and quantifiable structural changes of various land use types. To more accurately capture the overall evolution of the regional land use system, the L system incorporates two tiers of dynamic indicators: the single-type land use dynamic degree (LUDD) and the composite land use dynamic degree (CLUDD). The LUDD measures the annual average rate of change for specific land use categories—such as grassland, cropland, and bare land—over the study period, thus characterizing the intensity of their individual dynamics; the CLUDD aggregates the magnitudes of change across all categories to reflect the system’s overall level of activity. After standardization, these indicators are jointly integrated into the entropy method to compute a comprehensive score for the land use system, which then serves as a key input variable for the L system in the coupling coordination model.
Meanwhile, a second indicator system is developed to represent the off-site grazing system, i.e., the borrowed pasture system (B), based on the practical characteristics and statistical data of off-site grazing activities. The boundary of this system is confined to the economic, social, and ecological effects observed within a specific spatiotemporal scope.
To evaluate the composite performance of each system, the original indicators were standardized to eliminate unit discrepancies and ensure comparability. Based on variable characteristics, positive and negative indicators were normalized using appropriate min-max transformations. A small constant was added post-normalization to avoid computational errors in the entropy calculation. Subsequently, the entropy weight method was applied to objectively determine the relative importance of each indicator. The resulting weights and standardized values were used to calculate composite scores for each subsystem, serving as the basis for further analysis.
2.7.1. Data Standardization
For the land use dynamic degree system, all indicators are positive variables representing area or intensity-based measurements. For the off-site grazing system, the indicator set includes both positive and negative variables.
For positive indicators (where higher values indicate better performance), min-max normalization is applied. The formula is as follows:
where
is the original value of the
indicator in the
year (or sample);
denotes the column vector of all values for the
indicator across the full sample;
is the normalized value after standardization.
For negative indicators (where lower values indicate better performance, e.g., grazing pressure), reverse min-max normalization is used.
To avoid undefined values in the logarithmic operation
during entropy calculation, a small constant
is uniformly added to all standardized data values after normalization. The adjusted values are computed as follows:
where
is the final value after normalization and non-zero adjustment;
is the non-zero constant added to prevent errors caused by
in the entropy calculation.
2.7.2. Entropy Weight Method and Adjustment
To determine the objective weights of each indicator, the entropy method is applied following a standardized and non-zero-adjusted data preprocessing procedure. The specific steps are as follows:
- (1)
Proportion calculation:
where
is the total number of samples (years);
is the proportion of the
indicator in the
sample based on the adjusted value
.
where
is the entropy value of indicator
;
is a constant ensuring
. If
, then
is defined as 0.
- (3)
Redundancy degree calculation:
where
represents the redundancy degree of indicator
, indicating the amount of useful information it provides.
where
is the objective entropy weight of indicator
;
is the total number of indicators.
- (5)
Composite score calculation:
where
is the composite score of the system (e.g., land use system or off-site grazing system);
is the adjusted standardized value of the
indicator;
is the entropy-based weight of the
indicator.
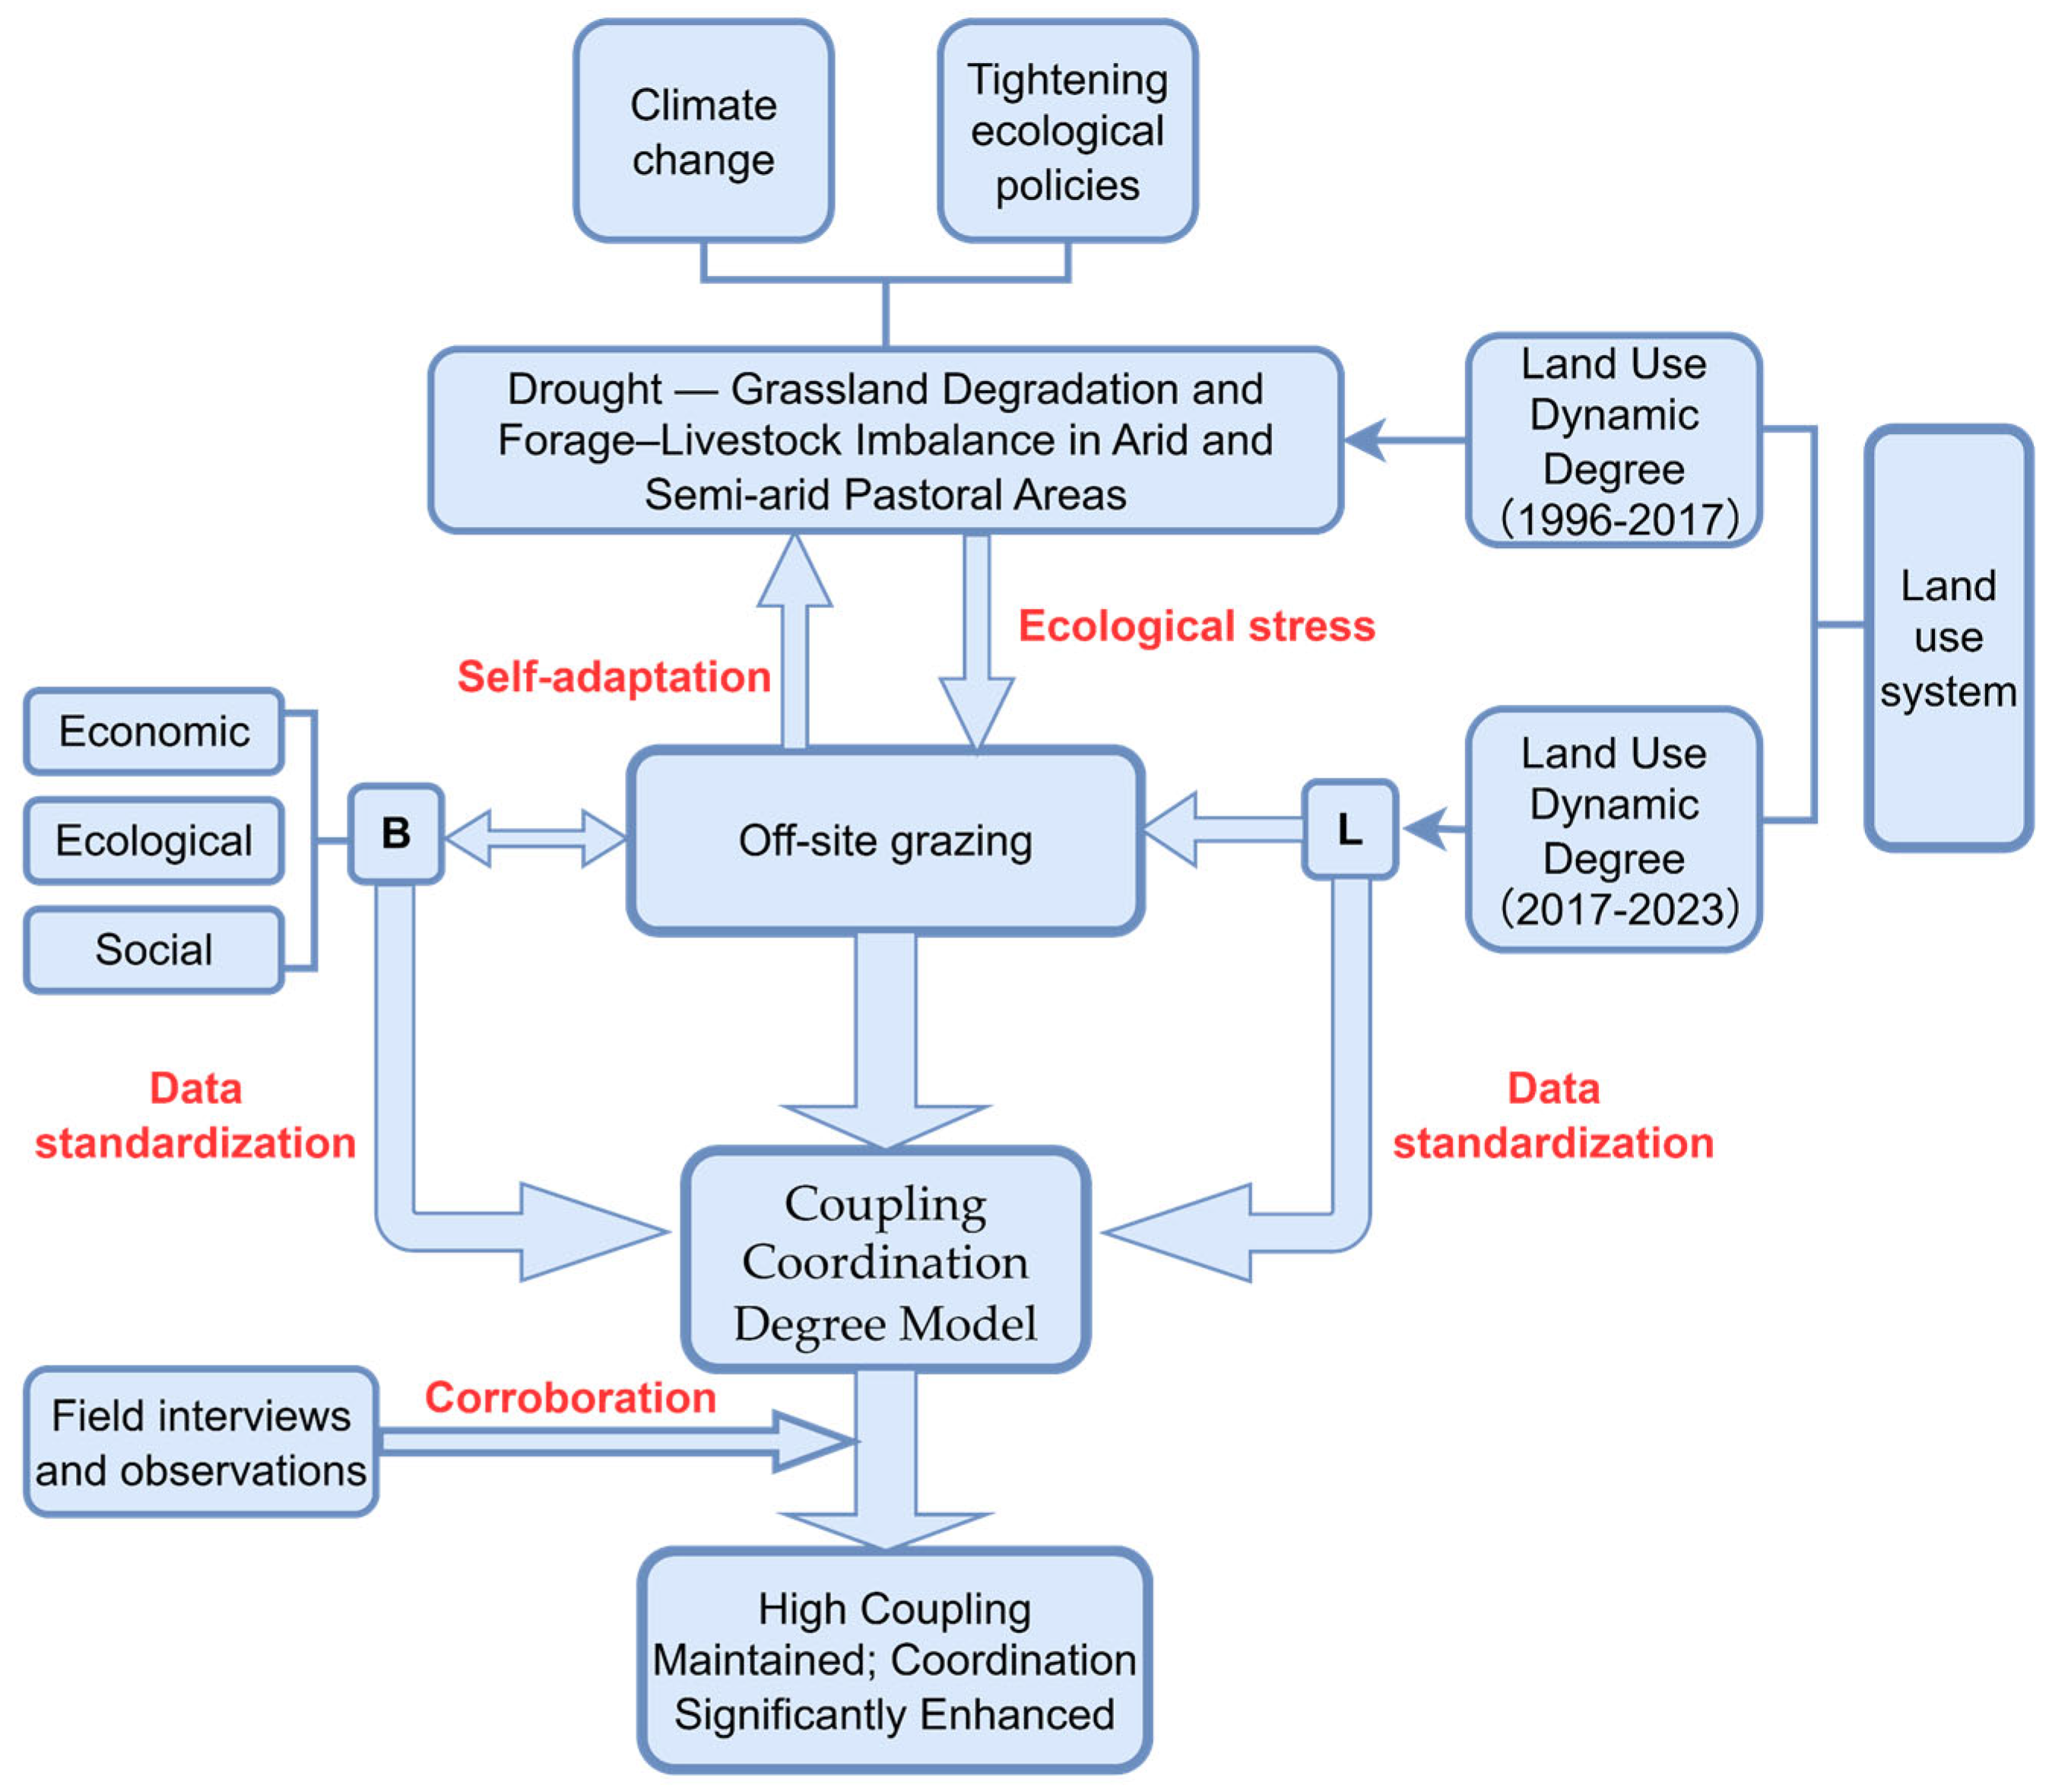
2.8. Coupling Coordination Degree Model
The calculated composite scores for the L and B systems are used to calculate the coupling coordination degree of both systems. In regional studies, the coupling degree is widely used to measure the intensity of interaction between subsystems, reflecting their structural linkages and dynamic feedback mechanisms [
34]. However, a high coupling degree does not necessarily imply coordinated development. To address this, the coordination degree is introduced to evaluate the adaptability and equilibrium state of the systems during their interaction process. By integrating these two metrics, the CCDM offers a comprehensive framework for assessing the synergistic development level between multiple systems (
Figure 3). It provides a robust quantitative basis for analyzing the sustainability and interactive dynamics of regional human–environment systems [
35].
The CCDM consists of three main components: the coupling degree (), the coordination index (), and the final coupling coordination degree (). The formulas and parameter definitions are as follows:
where
measures the degree of interaction and structural correlation between systems;
is the composite development index of the
subsystem, i.e., the L or B system;
is the number of subsystems considered in the model (in this study,
= 2: L and B systems).
- (2)
Coordination Index (T)
where
is the weight assigned to the
subsystem (often assumed equal, e.g.,
= 0.5 for two systems);
is the composite score of subsystem
;
reflects the overall coordination and balanced development among subsystems.
- (3)
Coupling Coordination Degree (D)
The coupling coordination degree
synthesizes the interaction strength and the coordinated development status of the systems. It provides a comprehensive assessment of how well subsystems evolve together over time. The coupling coordination degree
is used to evaluate the level of coordinated development between subsystems. The classification criteria for
values are shown in
Table 4.
3. Results
3.1. Land Use Change Characteristics (1996–2023)
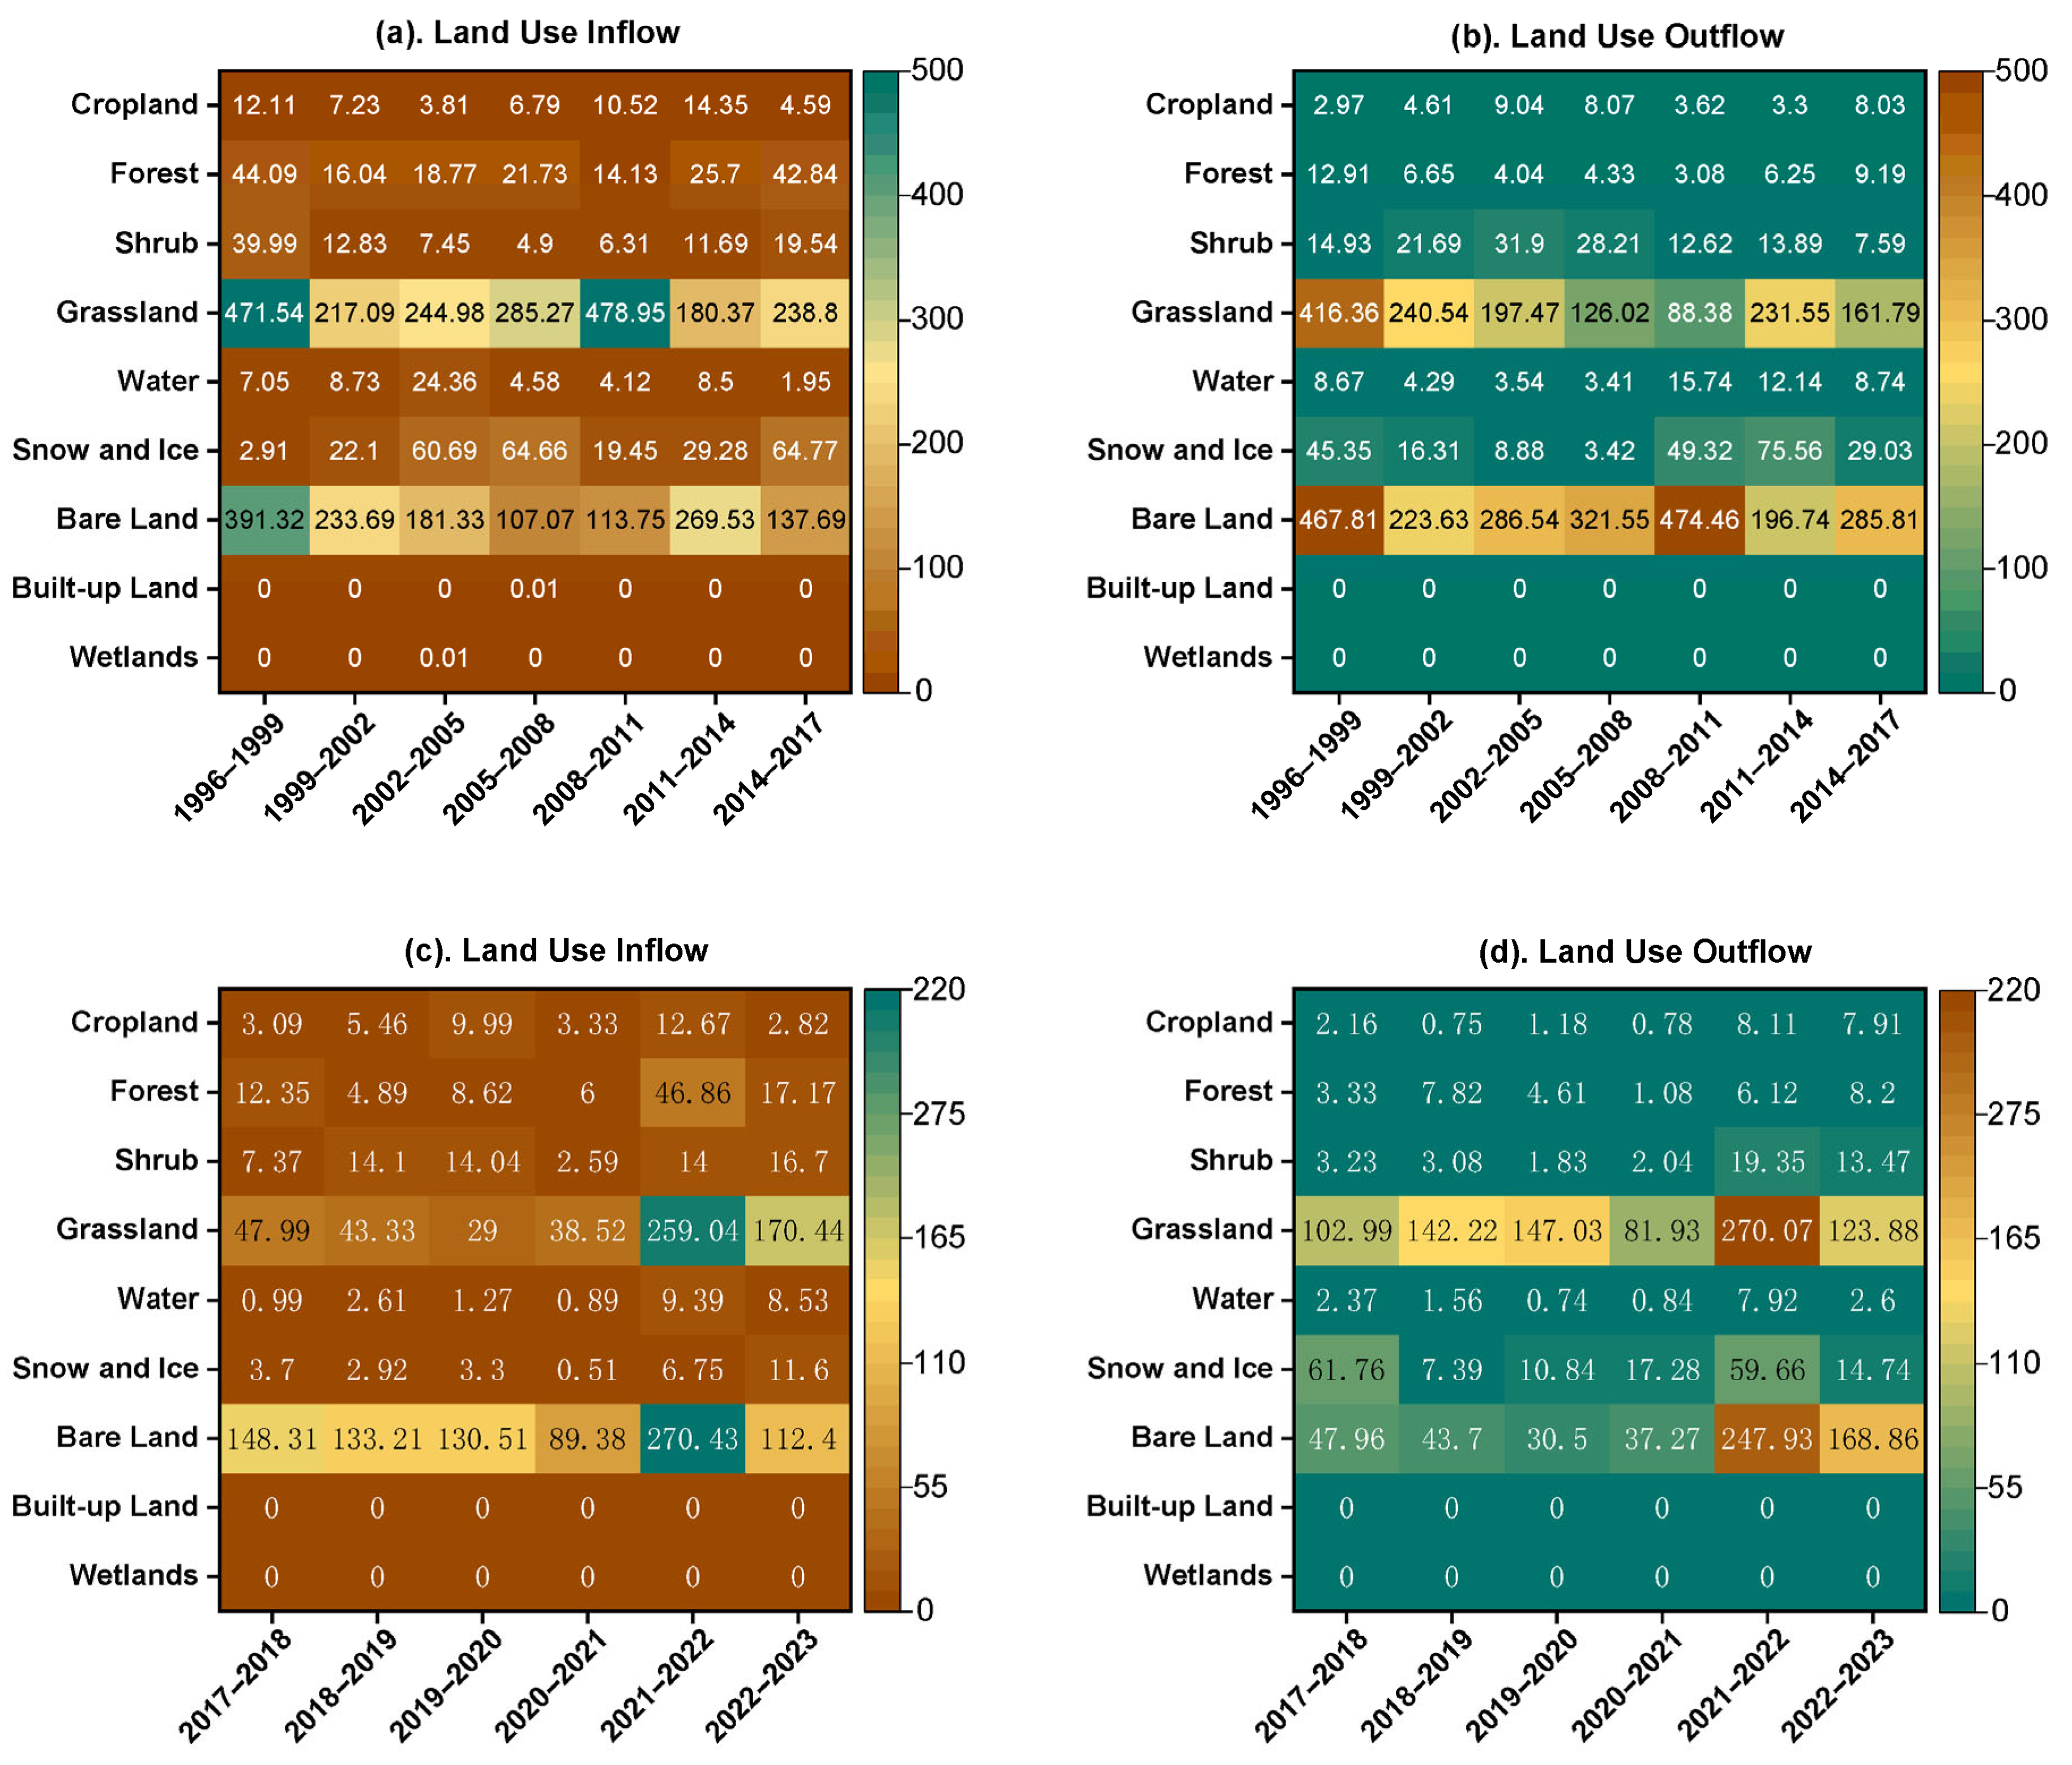
From 1996 to 2017, the total land use conversion in the study area reached 4219.96 km
2, primarily driven by two-way transformations between grassland and bare land (
Figure 4). Grassland was the most dynamic category, with a total inflow of 2117.00 km
2 (50.17%) (
Figure 4a) and a total outflow of 1462.12 km
2 (34.65%) (
Figure 4b), resulting in a net inflow trend. In contrast, bare land exhibited a net outflow trend, with a total inflow of 1434.37 km
2 (33.99%) and a total outflow of 2256.54 km
2 (53.47%). These two land types constituted the core axis of land use transitions during this period. Other land types remained relatively stable. Forest land showed a slight expansion, with a total inflow of 183.26 km
2 (4.34%) and an outflow of 46.45 km
2 (1.10%). Changes in shrubland, water bodies, ice/snow cover, and cropland were minimal. Between 2017 and 2023, grassland and bare land continued to dominate land use dynamics, acting as the primary drivers of landscape evolution (
Figure 4). During this period, grassland showed a reversal of its previous trend, with a higher outflow area of 868.12 km
2 (50.27%) (
Figure 4c) and a lower inflow of 588.33 km
2 (34.07%) (
Figure 4d), indicating a net loss. Much of this outflow converted to bare land, forest land, and shrubland, reflecting an ongoing pattern of grassland degradation coupled with partial land replacement. Compared to 1996–2017, the post-2017 dynamics suggest an intensification of grassland loss and a shift toward more complex land use transitions.
From 1996 to 2017, land use dynamics in the study area exhibited distinct type-specific patterns and stage-based fluctuations (
Table 5). Forest land showed steady expansion, with dynamic rates of 1.15% (1996–1999) and 1.11% (2014–2017), driven by reforestation efforts. Grassland experienced recovery in 2005–2008 (0.40%) and 2008–2011 (0.97%), but declined in 2011–2014 (−0.12%), highlighting its sensitivity to climate and policy shifts. Bare land showed a general decline (−1.76%, −3.13% in 2005–2011), with a brief rebound (0.70%) in 2011–2014, indicating gradual vegetation restoration. Shrubland fluctuated markedly, while water bodies expanded (16.05% in 2002–2005) then contracted (−4.53% in 2014–2017). Ice/snow cover peaked at 5.48% (2005–2008) and later stabilized. Overall, forest, grassland, and bare land changes reflected a regional trend of ecological recovery. From 2017 to 2023, land use dynamics were relatively stable, with dynamic degrees ranging from 0.59% to 0.60%. Grassland showed slight fluctuations and a weak contraction trend (−0.40% to 0.35%), while bare land alternated between expansion and contraction, notably shrinking in 2022–2023 (−1.50%). Forest land maintained steady growth, with its peak dynamic rate reaching 3.86% in 2021–2022. Water bodies and wetlands showed pronounced variability, peaking at 13.21% and 33.33%, respectively. Ice/snow cover exhibited consistent shrinkage (−6.05%), while shrubland grew moderately. Cropland and built-up land remained largely unchanged.
Land use dynamics between 1996 and 2017 and between 2017 and 2023 showed distinct contrasts. From 1996 to 2016, grassland expanded (net +654.9 km2), bare land contracted (net −822.2 km2), and forest land steadily increased, reflecting the positive impacts of ecological restoration and landscape stabilization. Since 2017, however, warming-induced drought has altered this trajectory. Grassland experienced a net loss of 279.79 km2, while bare land expanded by 308.01 km2. Correspondingly, grassland’s dynamic degree shifted from positive to negative, and bare land from negative to positive, indicating rising ecological stress and a transition toward an unstable ‘grassland retreat–bare land expansion’ cycle. Despite continued forest growth, heightened fluctuations in wetlands and water bodies point to increasing hydrological sensitivity. Overall, while long-term trends suggest gradual ecological recovery, emerging instability in grassland and bare land underscores the need for adaptive land management.
3.2. Analysis of the Borrowed Pasture System Data
The entropy-weighted analysis of economic, social, and ecological indicators (
Table 6) aims to systematically reveal how off-site grazing practices jointly affect regional livestock production and ecological regulation.
Economic indicators here show a relatively stable weight distribution. The entropy value of net income increase per grazing household is 0.8461, with a coefficient of variation of 0.1539 and a weight of 0.0563, indicating that income gains from off-site grazing are both widespread and consistent. Net income increase per sheep unit during the off-site grazing period has an entropy of 0.7495 and a higher coefficient of variation (0.2505), but its weight is 0.0917, highlighting its importance in the evaluation system. The maize straw field rental price carries a weight of 0.0675, showing that this cost component is also significant. Overall, the off-site grazing system, through extended pasturing and forage integration, effectively raises herders’ incomes and promotes the economic utilization of agricultural residues.
As for social indicators, the number of off-site grazing households has an entropy value of 0.8242 and a weight of 0.0644, reflecting broad and balanced participation. More notably, the net income contribution rate of off-site grazing (to total pastoral income) has an entropy of 0.8681 and a low coefficient of variation (0.1319). Although its weight is 0.0483, it is key for illustrating the share of grazing-derived income in overall pastoral earnings. This suggests that off-site grazing is evolving from an individual livelihood strategy into a vital regional support mechanism with strong socio-economic integration effects.
Considering ecological indicators, suitable carrying capacity at year-end stands out with an entropy of 0.3880, a coefficient of variation of 0.6120, and the highest weight of 0.2240, underlining the central role of ecological carrying capacity in the system’s evaluation. The grazing pressure index has an entropy of 0.8556 and a weight of 0.0528, indicating that ecological burden remains significant and must be moderated via off-site grazing strategies. Indicators for the number of livestock in off-site grazing and the leased off-site grazing area both have entropies of around 0.82 and weights of 0.0659, as does livestock reduction via off-site grazing (entropy 0.8205, weight 0.0658), showing that animal redistribution already helps alleviate local grassland pressure. Finally, the volume of maize straw converted into forage (entropy 0.8200, weight 0.0869) and the volume of manure converted into organic fertilizer (entropy 0.8200, weight 0.0659) provide positive pathways for closing regional agro-ecological loops.
The sustainability of the borrowed pasture system showed phased fluctuations followed by a steady upward trend from 2018 to 2023 (
Table 7). In terms of its overall composite score, the system hit two clear low points, 0.2675 in 2020 and 0.2507 in 2021, then recovered continuously, peaking at 0.6132 in 2023. This pattern suggests that, after experiencing disturbances or policy adjustments, the system gradually regained stability and optimized its performance.
Annual economic scores varied only slightly, remaining between 0.08 and 0.16, and climbed back to 0.1501 in 2023—almost matching the 2018 level of 0.1592. This indicates that while off-site grazing provides a stable boost to incomes, it is still sensitive to external factors like costs and market conditions. Social scores here fluctuated more dramatically. A score of 0 in 2018 reflects the immaturity of social mobilization and organizational mechanisms at the outset. By 2023, the score had risen to 0.1127, revealing marked improvements in herder participation, the fairness of resource distribution, and coordination among stakeholders. The ecological score has consistently been the system’s most heavily weighted and highest scoring dimension. In 2019 and 2023, ecological scores reached 0.3761 and 0.3505, respectively—both exceeding those of other years—demonstrating the sustained effectiveness of off-site grazing in relieving ecological pressure. Scores dipped to 0.1194 and 0.1139 in 2020 and 2021, likely due to temporary rebounds in ecological load. Overall, the coordination among the three dimensions has steadily strengthened, with ecological and social benefits rising in tandem in later years—evidence of enhanced system resilience and organizational capacity.
3.3. Coupling Coordination Calculation Results
The composite score of the L system remained relatively stable from 2018 to 2021, but rose significantly in 2022 and 2023, reaching 0.7101 and 0.5995, respectively (
Figure 5). This reflects a phase-based improvement in land use efficiency, driven by the scaling-up of off-site grazing practices. The B system performed well in 2018–2019, but experienced a decline in 2020–2021 due to the impact of the COVID-19 pandemic. As the pandemic eased, scores quickly rebounded in 2022–2023, with the 2023 score rising to 0.6132, the highest on record. This suggests that off-site grazing has gradually recovered and become more optimized under ecological pressures and adaptive policy responses.
The results indicate that from 2018 to 2023, both the L and B system exhibited fluctuating upward trends, with increasing coupling intensity and continuously improving coordination (
Table 8). The coupling degree (
) remained consistently high throughout the study period, rising from 2018 (0.9513) to 2023 (0.9999), indicating a strong interdependence between the L and B systems. In contrast, the coordination index (
) was relatively low from 2018 to 2021, reaching its lowest point in 2021 (0.2396), suggesting that despite high coupling, coordination was insufficient. Since 2022, however, the
value has increased significantly, reaching 0.6064 in 2023, implying enhanced synchronized development between the two systems, supported by internal optimizations in both.
Further examination of the coupling coordination degree (D value) shows that between 2018 and 2023, the L–B system underwent a “fluctuating decline followed by a rapid recovery” (
Table 8). In 2018, D = 0.5582, rising slightly to 0.6413 in 2019, then falling for two consecutive years to 0.5397 in 2020 and its lowest point of 0.4892 in 2021. This downward phase reflects a continuous weakening of system coordination and increasing functional mismatch: although coupling remained high, poor pastoral infrastructure, lagging grassland recovery, and an immature cross-region grazing mechanism created a significant gap between coupling and coordination levels.
From 2022 onward, the D value surged to 0.7644 and climbed further to 0.7787 in 2023, indicating that the system had developed a strong, internally responsive linkage mechanism. This rebound is closely associated with optimized grazing networks, the intervention of information platforms, and strengthened policy support. As institutional delays were gradually addressed and community network resilience grew, the L–B system achieved a higher level of coordinated development in resource allocation, spatial interaction, and functional complementarity. The marked improvement in the D value also corresponds with the earlier rebound in the comprehensive score (T value), demonstrating a transition from a “high coupling–low coordination” phase toward a “high coupling–moderate coordination” stage.
3.4. Herders’ Perceptions of Climate Stress and Grassland Responses
Table 9 summarizes surveyed herders’ feedback across multiple dimensions, including climate change perceptions, pasture conditions, economic outcomes, information channels, and infrastructure. This revealed the system’s multifaceted characteristics and practical challenges. This comprehensive analysis yielded five core findings.
- (1)
Among the respondents, 23 noted a marked decrease in precipitation and 15 observed rising temperatures. Commonly reported phenomena include reduced winter snowfall and insufficient early spring–summer rains, leading to delayed grass greening and heightened drought risk. These climate perceptions are already shaping herders’ decisions, such as preparing to borrow pasture in advance, staggering their use of summer and autumn grazing sites, and adjusting livestock composition and numbers, thereby altering traditional rotational grazing schedules to mitigate ecological pressure.
“In recent years, it hardly snows in winter, and there’s no rain in early spring. If there’s no snow in April and May, I know it’s time to go borrow land for grazing.”
- (2)
Before adopting off-site grazing, fifteen herders reported significant pasture degradation and only one saw no noticeable change, underscoring that ecological stress was a key driver of borrowing pastures. After the practice began, eight respondents observed some improvement in pasture conditions, nine felt that there was little change, and three were unsure, suggesting that while off-site grazing can foster ecological recovery, its benefits vary widely with factors such as pasture type, the timing of return migration, and the specific rotational grazing regime.
“We usually return home in early March. That way, we can stay longer on the winter pastures and delay the use of summer and autumn pastures. It also reduces our dependence on them.”
- (3)
Among the six farmers who had leased out their straw fields, five reported that rental income has risen markedly in recent years, while one said it has remained essentially stable. They generally agreed that renting straw land not only yields high economic returns but also offers a low-cost, low-risk way to repurpose land.
As one farmer put it, “Leasing out corn fields is like profit with no investment…burning straw only pollutes the environment and poses safety risks. Now the livestock manure left behind can be used as fertilizer, saving an entire year’s worth of chemical fertilizer.”
Additionally, nine respondents observed higher lamb survival rates, suggesting that off-site grazing has improved winter breeding conditions and reduced the risks that cold, dry climates pose to lamb rearing. However, due to factors like inadequate infrastructure, eleven farmers reported seeing no change.
- (4)
Thirteen respondents obtained grazing information through introductions by friends and relatives, and seven through organization by village cadres, indicating that access to off-site pastures is still heavily dependent on personal networks and grassroot village bodies rather than an institutionalized or market-driven land matching mechanism. This path dependence underscores serious information asymmetries and a lack of institutional integration, forming a key bottleneck for the expansion of off-site grazing.
- (5)
Among the respondents, only one herder reported that their leased pasture was equipped with both shelters and utilities; seventeen had utilities without shelters; two had shelters only; and none had neither—indicating that most off-site grazing areas remain only “semi-developed”. This infrastructure gap not only compromises the herd’s winter safety and disease control but also drives up grazing costs and undermines overall system efficiency.
The herders’ feedback in
Table 9 not only reveals proactive adaptation pathways driven by climate change but also highlights the ecological recovery potential, marginal economic returns, reliance on social networks, and institutional gaps within the borrowed pasture system. Institutionalizing and stabilizing off-site grazing will require sustained efforts to improve supporting infrastructure, optimize information platforms, and enhance institutional responsiveness.
4. Discussion
4.1. Drivers of Land Use Change and Pastoral Adaptation Under Climate and Policy Shifts
Between 1979 and 2017, the average annual temperature in the Qilian Mountains region increased at a rate of 0.47 °C per decade, with more significant warming during spring and summer—the primary growing seasons for pasture—compared to autumn and winter [
36]. Although annual precipitation showed a slow overall increase during the same period, the additional rainfall was mainly concentrated in the summer months (July–August), while spring precipitation increased only slightly, exacerbating the phenomenon of rain–heat asynchrony. This springtime imbalance in water and heat not only elevated regional drought risks but also delayed the timing of grassland greening. Concurrently, the frequency of extreme summer precipitation events increased [
37], further intensifying surface runoff and soil erosion processes.
Despite the backdrop of climate warming, the ecological quality of the Qilian Mountains National Nature Reserve showed an overall improvement from 2000 to 2022 [
38]. However, the regional glacier area has decreased by approximately 20.88% over the past five decades [
39], significantly reducing spring meltwater supply and further intensifying the compounded ecological stress of ‘warming-induced drought’ during early spring. The results in
Section 3.1 indicate that the dynamic degree of ice and snow cover remained consistently negative between 2017 and 2023, providing further evidence of ongoing glacier retreat. In the long term, continued glacier shrinkage, reduced meltwater availability, soil moisture deficits, and increasing asynchrony between temperature and precipitation are expected to jointly threaten normal grassland regrowth and ecosystem stability, thereby exacerbating ecological degradation trends.
In response to the expanding “hidden forage gap”, China’s central and local governments have successively implemented multiple rounds of ecological policies to actively address climate change and ecological degradation risks (
Table 10). From 1996 to 2023, the comprehensive land use dynamic degree in the northern foothills of the Qilian Mountains exhibited a three-stage evolution characterized by “policy-driven approaches—fluctuating adjustment—ecological restoration”. Between 1996 and 1999, the comprehensive dynamic degree once rose to 0.86%, primarily due to early trials of the Grain-for-Green policy and emergency adjustments following natural disasters. As early as 1994, the Chinese central government incorporated slope farmland management and ecological restoration into the national sustainable development strategy in “Agenda 21” [
40]. Following the 1998 flood, the issuance of the “8·5 Circular” and the Pilot Program for the Protection of Natural Forest Resources [
41] led to the closure of large areas of sloped farmland or their conversion to forest and grassland, resulting in intense land transitions between cropland and forest/grassland. Since 2000, with the institutionalized implementation of the Grain-to-Grassland Program and the Grassland Ecological Compensation Mechanism [
1], grazing intensity has declined, and the overall land use dynamic degree has stabilized (ranging from 0.44% to 0.57% during 2002–2014). During this period, the grassland area expanded steadily, bare land decreased annually, and the landscape exhibited a clear trend of ‘grassland expansion and bare land retreat’. In 2017, the launch of the Central Ecological and Environmental Inspection [
42] alongside the Qilian Mountains National Park pilot program [
43], compounded by extreme warming-induced drought events that year [
44], triggered a new wave of land reconfiguration. Notably, the land use dynamic degree surged to 1.64% during 2021–2022, reflecting a policy-driven restructuring of ecological elements. After 2022, under the guidance of the “Grassland Restoration Opinions” [
4], ecological projects shifted towards management and consolidation, leading to a decline in the dynamic degree. These key policy adjustments have strengthened ecological environmental governance while also compressing the grazing space available to local herders.
During 1996–2017, as grazing areas in the study region were progressively reduced, the number of large livestock (e.g., cattle) slightly increased from 47,000 heads [
45] (p. 328) to 64,400 heads [
46] (p. 399), while sheep numbers grew substantially by approximately 54.14%, from 482,600 heads [
45] (p. 328) to 743,900 heads [
46] (p. 399). This led to rising grazing pressure and an increasingly widening gap between grassland carrying capacity and livestock demand. Since 2017, trans-regional grazing has rapidly emerged in Sunan County, with herders relocating livestock to straw fields in the Hexi oasis agricultural areas during autumn and winter, thereby establishing a cross-regional “pastoral–agricultural” grass–livestock flow network. Between 2018 and 2023, the number of livestock involved in trans-regional grazing increased from 91,300 sheep units to 407,300 sheep units (
Table 2), a trend that coincided with the slowdown in grassland outflow. This indicates that trans-regional grazing, as a spatial livelihood adaptation strategy, is playing a buffering role in mitigating grassland–livestock pressure induced by the ongoing ‘grassland retreat–bare land expansion’ cycle.
4.2. Mechanism Vulnerability and Grassroot Adaptation
4.2.1. Institutional Disarticulation
Although the coupling degree (
) between the land use system (L) and the transhumance system (B) has remained above 0.95 since 2018, indicating a high spatial and developmental correlation, the coordination degree (
) has persistently been low, reflecting insufficient synergy under the coupling relationship. From 2018 to 2021, the L-B system exhibited a typical “high coupling, low coordination” characteristic. While spatial linkage mechanisms between grassland pressure and straw field grazing have been formed, the two systems still exhibit significant mismatches in resources, institutions, and technology: the L system’s comprehensive score has increased slowly, and the grassland dynamic degree has remained negative, indicating that local grasslands still bear significant pressure, with ecological and developmental functions not effectively integrated; the B system, although achieving steady growth in the number of transhumance households, livestock numbers, and grazing area, suffers from weak infrastructure in terms of shelters, water and electricity, and epidemic prevention, with rising straw field rental costs and an underdeveloped operational mechanism, leading to low system efficiency and limited coordinated development, making it difficult for its comprehensive score to improve synchronously. Essentially, transhumance involves cross-regional livestock movement and resource utilization. The observed “high coupling–low coordination” state in the study area does not stem from a lack of connection between the land and transhumance systems but from the asymmetry in internal development capacities—specifically, the “short board effect” between lagging ecological function restoration and weak social and technical support. Notably, similar phenomena of “high coupling strength, low synergy efficiency” have been observed in studies of grassland–livestock systems in northern China [
47], indicating that this issue has certain universality and structural causes.
As Timpong-Jones et al. (2023) noted in their assessment of cross-border pastoral governance within West Africa’s ECOWAS [
5], there is an inherent tension between traditional mobility-based adaptation mechanisms (e.g., the Fulani’s seasonal migration routes) and modern, state-enforced resource management structured around administrative borders. When institutional design disregards the logic of mobility, governance breakdowns, and border conflicts become almost inevitable. We observed likewise hinges on cross-region movement and considerable practical stability through the complementary “pasture borrowing by herders–land leasing by farmers for livestock” model in the Qilian Mountains, Hexi Corridor. However, its degree of institutionalization remains inadequate: government policies have yet to formally recognize its legality or clarify land use rights, and the system operates largely through local negotiations and long-standing customary practice rather than through explicit, top–down regulations. This lag in institutional adoption was further exacerbated and starkly revealed during the COVID-19 pandemic.
During 2020–2021, in response to the public health crisis caused by the COVID-19 pandemic, various regions implemented strict traffic management and cross-regional control measures, increasing barriers to cross-regional movement and temporarily disrupting the straw field leasing chain. This pandemic shock provided an extreme scenario test: considering pandemic risks, some herders voluntarily chose to graze locally, reducing cross-regional movement, but the spatial path and structural dependence of the “pastoral area borrowing grass, agricultural area leasing land for livestock” supply–demand chain remained unbroken, with the C value barely decreasing, confirming the inertia of spatial dependence between systems. This situation illustrates that this fragility arises from a misalignment between institutional design and local knowledge. Existing regulations neither absorb nor transform indigenous mobility practices. Instead, the grassland management framework is built on rigid boundaries and inflexible rules, offering no room for the negotiation-based, highly mobile methods of traditional herders. Without timely institutional support for these adaptive practices, the system’s own regulatory capacity is undermined. Similar patterns appear in other coupled human–environment systems: in parts of Inner Mongolia, delayed pasture controls have exacerbated livestock–grassland conflicts and slowed ecological recovery [
48]; in Kenya’s Baringo region, land privatization and shifts in education have undermined traditional rangeland management and knowledge transmission (Kimani et al., 2014) [
9]. Thus, institutional responsiveness not only affects resource allocation efficiency but also profoundly influences the overall coordination and knowledge integration capacity of human–environment systems.
4.2.2. Resilience of Community Networks
The rapid recovery of the L-B system in 2022–2023 was primarily due to grassroot networks’ “pre-emptive repair” of institutional delays and the breakthrough application of information platforms. The “decentralized grass–livestock mutual aid chain”, mediated by acquaintance networks and the internet, quickly evolved into a low-threshold, high-response information–resource–labor connection system between herders and farmers. This chain does not rely on a single platform but achieves cross-regional grassland pressure dispersion through weak connections and geographical trust among individuals, facilitating “grass–livestock complementarity” between livestock and agricultural waste, directly driving the D value to rise to 0.7787. This chain not only aligns with the judgment in network governance that “weak connections × high density” can enhance resource matching efficiency [
49] but also confirms the flexible advantages of “polycentric governance” in grassland protection in pastoral areas [
50]. In other words, the “speed advantage” of grassroot organizations effectively compensates for the “time disadvantage” of institutional responses, empirically validating an important judgment: the recovery resilience of highly coupled systems relies more on underlying network density than on single administrative rigidity, a viewpoint that aligns closely with the latest research conclusions of the coupling resilience parallel framework [
51]. Meanwhile, although transhumance has rapidly expanded since 2017, academic research and policy responses have generally lagged, with local governments still exploring subsidies, insurance, and management mechanisms, further confirming the critical substitutive adaptation capacity of grassroot networks in institutional gaps.
4.3. Limitations and Prospects
The current transhumance system has only gradually formed at scale since 2017, with official data recorded from 2018 onwards. The short time span and underdeveloped indicator system affect the measurement accuracy and result stability of the coupling coordination model. Moreover, the off-site grazing indicator data used in this study are drawn primarily from draft records of the Sunan County Animal Husbandry and Veterinary Service Center and have not yet been published in statistical yearbooks, government bulletins, or on any official website. Consequently, they remain in a “semi-public” state and can only be obtained through field surveys or formal data request letters. This limited accessibility partially inhibits independent verification of our results by other researchers and, given potential lags in data updates, may also compromise the precision of the model’s measurements. In the future, with the advancement of statistical work and data improvement, relevant indicators are expected to expand, laying the foundation for constructing more explanatory and predictive analytical frameworks.
There are still shortcomings in the spatial coverage of this study. The current analysis mainly focuses on Sunan County and has not fully incorporated regions such as Qilian County, Menyuan County, and Tianjun County, where transhumance activities are continuously expanding. Significant differences in data statistical standards, administrative support, and information disclosure mechanisms among these regions hinder comprehensive horizontal comparisons and regional collaborative research. As the scale of transhumance continues to expand and government attention increases, relevant statistical data are expected to become more abundant and standardized. On this basis, research dimensions can be further expanded to more systematically present the overall pattern and multi-scale evolutionary paths of transhumance practices in the Qilian Mountains region.
From a regional development perspective, the G227 highway, which herders from Qilian County, Menyuan County, and Tianjun County rely on to cross Biandukou for transhumance into the Hexi Corridor, was expanded based on the historical Xiping-Zhangye ancient road and has long served as an important channel for north–south exchanges in the Qilian Mountains. Future research can further focus on the impact mechanisms of transportation corridors on resource allocation efficiency, institutional adaptability, and ecological resilience, extending to cultural exchanges, economic mutual assistance, and social system coupling, providing more solid empirical support for cross-regional collaborative governance.
Although the CCDM framework constructed here demonstrates good applicability in the arid pastoral regions of northwest China, it might face technical and institutional challenges when applied to other arid areas such as the Mongolian Plateau or North Africa. Technically, differences across regions in land use classification schemes, the availability of remote sensing data, and grazing regimes may affect the comparability of indicators and the suitability of modeling approaches. Institutionally, variations in land tenure arrangements, governance structures, and the absence of cross-sectoral coordination mechanisms may undermine the feasibility of transplanting transhumance-based grazing practices. For instance, the off-site rental grazing arrangements in Sunan County rely primarily on informal, trust-based agreements; in target regions lacking similar social–capital foundations or customary law traditions, such mechanisms may be difficult to establish and sustain in practice. Therefore, future research should adapt the CCDM to the local ecological characteristics and institutional contexts of target regions, incorporating region-specific ecological indicators and policy variables to enhance its cross-regional adaptability and practical effectiveness.
5. Conclusions
Based on multi-temporal remote sensing imagery (2018–2023) and official statistics, this study developed a CCDM linking the land use system (L) and the off-site grazing system (B) to explore adaptive livelihood strategies and institutional resilience in Sunan County’s arid pastoral landscape. We found that ecological protection and land space planning policies (2017–2022) have strongly driven both grassland contraction during tightening phases and recovery during restoration initiatives. L and B remained tightly coupled (C > 0.95), while their coordination degree rose from 0.48 in 2018 to 0.78 in 2023 as institutional lags, infrastructural gaps, and rising rental costs were incrementally mitigated. Grassroot networks and digital matching platforms played a pivotal bridging role during COVID-19 by reducing cross-regional grazing uncertainties and fostering institutional innovation. Finally, fragmented subsidy and insurance schemes and weak inter-departmental coordination have constrained the scalable, long-term development of off-site grazing, underscoring the need for standardized rental contracts, a consolidated subsidy framework, and dynamic monitoring and evaluation mechanisms. Most herders observed increasing climatic dryness—characterized by reduced precipitation and rising temperatures—and linked it to grassland degradation. While views on post-grazing improvements varied, many acknowledged that off-site grazing helps alleviate grazing pressure by delaying the seasonal use of summer and autumn pastures, thus contributing to a more balanced grass–livestock temporal dynamic. By integrating quantitative remote sensing analysis with qualitative stakeholder insights, this study enriches social–ecological coupling theory and provides empirical guidance for optimizing cross-regional forage allocation and adaptive governance in arid pastoral zones.
To enhance the institutionalization and sustainable operation of off-site grazing, (1) local and national authorities should regulate the straw land leasing market by standardizing rental prices and contract procedures through a designed template and filing system to reduce transaction uncertainty. (2) In terms of infrastructure, local governments should shift from builders to coordinators. They should encourage cooperatives, village collectives, and businesses to take part in building pens, dormitories, and feed sheds. This creates a mixed supply model: market-led with government support. At major grazing hubs, mobile service points should be set up. These should offer water and power connections, disinfection and disease control, and emergency veterinary patrols. This will improve herders’ living and working conditions during grazing. (3) Biosecurity should be reinforced by installing mobile quarantine checkpoints along key transit routes and organizing pre-season training for herders on disease prevention and emergency response to mitigate public health risks.


