Article

Optimization and Benefit Assessment of LID Layout Based on the MCDA Approach at a Campus Scale

1
College of Architecture and Art, Taiyuan University of Technology, No. 79 West Street Yingze, Taiyuan 030024, China
2
Shanxi Academy of Social Sciences, No. 14, South Road Dachang, Taiyuan 030032, China
3
School of Architecture, Tianjin University, No. 92, Weijin Road, Nankai District, Tianjin 300072, China
4
College of Landscape Architecture, Zhejiang A&F University, Hangzhou 311300, China
*
Author to whom correspondence should be addressed.
Land 2025, 14(7), 1434; https://doi.org/10.3390/land14071434
Submission received: 25 May 2025 / Revised: 29 June 2025 / Accepted: 3 July 2025 / Published: 8 July 2025
(This article belongs to the Section Land Planning and Landscape Architecture)

Abstract

Low-impact development (LID) offers environmental, economic, and social benefits, yet research on optimizing facility combinations remains limited. This study evaluates four representative LID types—green roofs, sunken green spaces, permeable pavement, and rain gardens—using an integrated framework combining the Storm Water Management Model (SWMM), NSGA-II genetic algorithm, and Analytic Hierarchy Process (AHP) at Taiyuan University of Technology in Shanxi Province, China. Based on site constraints, each LID type was pre-assigned to suitable subareas, and optimization focused on determining proportional allocations within these areas. SWMM simulations revealed that permeable paving achieved the highest runoff reduction (up to 19.4% at 65% coverage) and strong cost-effectiveness (0.013 USD per % reduction). NSGA-II was used to generate a set of optimal solutions by minimizing construction costs and maximizing runoff and pollutant reductions. AHP then ranked these solutions according to their environmental, economic, and social benefits. In this case, the ideal mix—subject to site-specific constraints and model assumptions—includes 28.58% green roofs, 19.37% sunken green spaces, 48.68% permeable paving, and 3.37% rain gardens. The study proposes a sponge campus renewal strategy, offering theoretical and practical insights for sustainable urban development and precise environmental management.

1. Introduction

Low impact development (LID) is a nature-based approach to urban stormwater management, aiming to reduce runoff and control pollution while preserving pre-development stormwater conditions [1,2,3]. Numerous studies have evaluated individual LID facilities like sunken green spaces, bioretention facilities, wet ponds, rain gardens, green roofs, or permeable paving [4,5] for their effectiveness in reducing runoff volume [6,7], delaying peak flow [8,9], and improving water quality [10,11]. While these studies provide valuable data, they often focus on individual facilities and overlook the benefits of combining multiple LID measures (LIDs). However, most focus on isolated facilities under specific experimental conditions, limiting their generalizability and overlooking the potential synergies of combined LID systems [12,13]. Moreover, in practical retrofit projects such as campus renewals, the selection of LID types is subject to site-specific constraints, including structural capacity, surface layout, and lack of supporting infrastructure. In China, sponge cities have promoted integrated application in response to rapid urbanization [14,15,16].
Despite policy advances, optimizing LID layouts remains complex due to the need to balance flood control, water quality improvement, ecological restoration, and budgetary constraints [17,18,19]. This challenge is compounded by the varying regional structure construction costs and long-term operation and maintenance (O&M) expenses, which can influence investment priorities and lifecycle efficiency [20,21,22,23]. Urban planners must also address social factors, acceptability, user perception, and maintenance practicality [24,25,26,27], making LID planning a multi-objective optimization task that requires a comprehensive and integrated approach.
Hydrologic models are essential for simulating runoff behavior and assessing LID performance. Among them, the Storm Water Management Model (SWMM) is particularly well-suited for LID design [28], enabling simulations of urban runoff, pollutant loading, and hydrological responses to different LID combinations [29,30]. In addition to the SWMM simulation approach, analytical probabilistic and stochastic approaches have been applied to effectively quantifying the hydrologic performance of various LIDs, with the advantages of ease of use and computational efficiency [31,32,33,34]. However, while these approaches provide valuable insights and improve robustness, they often only address specific aspects and fall short of supporting full multi-objective LID layout optimization.
To address these limitations, multi-objective optimization algorithms such as Ant Colony Optimization (ACO) [9,35], Particle Swarm Optimization (PSO) [36], and the Genetic Algorithm (GA) [37] have been applied to LID layout problems [38]. GA, and particularly its variant NSGA-II, is well-suited for balancing trade-offs among runoff control, pollutant removal, and cost efficiency [24,37]. Several studies have demonstrated its use in minimizing lifecycle cost, mitigating overload, and integrating gray-green infrastructure [39,40]. However, many existing models rely on theoretical assumptions, lacking real-world constraints such as construction feasibility, long-term maintenance demands, and stakeholder priorities. These practical constraints—especially budget limitations and operation–maintenance trade-offs—are critical in campus renewal projects. Integrating GA with the Analytic Hierarchy Process (AHP) offers a promising way to include both quantitative and qualitative decision factors in LID planning [41,42]. Building on this integration, this study combines SWMM-based hydrologic simulation, NSGA-II multi-objective optimization, and AHP-based benefit evaluation to support layout decisions that address environmental, economic, and social dimensions. In particular, NSGA-II enables the exploration of trade-offs between hydrologic benefits and construction costs, while AHP incorporates stakeholder concerns—such as long-term maintenance costs—into the benefit evaluation process.
Unlike previous studies that rely on hypothetical conditions or single-objective design, this research evaluates practical LID combinations under real-world constraints, including site limitations, structural feasibility, and long-term sustainability, providing a holistic and implementable strategy for campus renewal. The specific objectives are 1. to quantify the hydrological impacts of individual LIDs on runoff reduction using SWMM simulations; 2. to optimize the spatial arrangement of LIDs to minimize construction costs and maximize runoff reduction using NSGA-II; and 3. to integrate AHP to rank LID facility combinations based on environmental, economic, and social benefits, selecting the optimal strategy for campus renewal.

2. Materials and Methods

2.1. Study Sites

The Yingxi Campus of Taiyuan University of Technology served as the study area for this research. The campus is located in Wanbailin District, Taiyuan City, Shanxi Province, China (Figure 1), within a warm-temperate continental monsoon climate zone. It receives an average annual rainfall of 456 mm, with 60% of this precipitation concentrated in the summer months, a critical factor for stormwater management on campus. Built in the 1950s, the campus covers 40.78 ha, with a topography that slopes from north to south and west to east. The dormitory area is situated in the northeast, the teaching area in the south, and green spaces, including Qingze Garden, are located centrally, along with various lawns and sparsely wooded meadows.
Currently, impervious surfaces such as parking lots, roads, and other paved areas cover 71.2% of the campus. These impervious surfaces primarily consist of asphalt, concrete, and marble paving, particularly in the campus squares (Figure 1). These materials significantly limit water infiltration and increase surface runoff. This proportion of impervious coverage is notably higher than the 28.8% of the campus covered by lawns, gardens, and other permeable areas, which help to mitigate runoff by allowing water to infiltrate the ground. The high percentage of impervious surfaces exacerbates stormwater management challenges, particularly during heavy rainfall events. Despite the completion of a stormwater diversion project aimed at mitigating runoff in the high-density urban context, the campus continues to experience stormwater pressures due to its extensive impervious surfaces, high building density, and outdated drainage system from its early construction.
On the positive side, as a self-contained system [43], the campus faces fewer challenges related to spatial scale, cross-sector collaboration, drainage load, and traffic management compared to larger urban developments. Therefore, using the Yingxi Campus as a case study to optimize LID facility layouts with multi-objective criteria can provide a scientific foundation for urban built-environment transformation, while also offering valuable insights for sponge city construction practices.

2.2. Research Methodology

In this study, a multi-objective optimization framework was developed integrating the SWMM model, the NSGA-II genetic algorithm, and AHP hierarchical analysis (Figure 2). First, a generalized SWMM model was established using CAD topography and pipe network data from the Yingxi Campus to simulate runoff changes under different single LID measure arrangements. Next, the SWMM model was coupled with NSGA-II to create a multi-objective optimization model. This model focused on minimizing construction costs while maximizing runoff reduction and pollutant removal rates, generating an optimal solution set for LID combination arrangements. Following this, the solution set derived from NSGA-II was evaluated using the AHP method, considering four key dimensions: environmental, economic, social, and technical benefits. This process helped identify the optimal LID layout scheme. Finally, the chosen scheme was verified through the SWMM model, leading to the proposal of a sponge construction strategy for Yingxi Campus. Additionally, we conducted 80 semi-structured stakeholder interviews with faculty and students from the School of Architecture and the School of Environmental Engineering. These interviews aimed to identify key indicators for the evaluation of campus LID retrofitting, covering topics such as environmental concerns, LID awareness, and perceived needs for improvement. The results of these interviews were used to construct the initial indicator hierarchy for the Analytic Hierarchy Process (AHP).

2.2.1. SWMM Stormwater Management Model

SWMM, developed by the U.S. Environmental Protection Agency, is a dynamic rainfall-runoff simulation tool that is widely used for urban stormwater and LID analysis [30,44,45]. SWMM 5.1 includes an LID module and supports integration with external programming software, offering flexibility and reliability validated by numerous studies.
  • Model setup
The model was constructed based on CAD topography and drainage network data from the study area. Sub-catchments were delineated using ArcGIS’s (https://www.esri.com/en-us/arcgis/products/arcgis-online/overview (accessed on 2 July 2025)) hydrological tools, considering land use, topography, building distribution, and the drainage network. A total of 47 sub-catchments were identified and simplified into a generalized drainage system comprising 31 pipes, 30 wells, and one outfall (Figure 2A). To represent realistic surface flow paths, drainage directions were assigned according to terrain slope and existing pipe alignments. Each sub-catchment was linked to specific drainage nodes to ensure accurate hydrologic routing. LID practices were assigned to eligible sub-catchments based on their surface characteristics: green roofs to building-based sub-catchments, permeable pavements to paved areas like walkways and plazas, and bioretention types (rain gardens, sunken green spaces) to vegetated zones.
Model parameters were derived from GIS and planning datasets, supplemented by guidelines from China’s sponge city standards [46,47], with final values presented in Table A1. The performance of each LID facility was influenced by its specific design parameters, such as berm height (ponding depth), vegetation fraction, and hydraulic conductivity. These parameters were set according to local design experiences and adjusted for cold-climate and loess-soil constraints, reflecting typical retrofit conditions in northern China.
It should be noted that clogging effects—such as performance decline due to sediment accumulation or filter media blockage—were not explicitly modelled. This simplification reflects the focus on the design-stage performance of newly constructed LID facilities. Due to the lack of long-term local monitoring data, infiltration decay functions could not be calibrated. Future studies are encouraged to integrate dynamic performance degradation or maintenance-responsive parameters to enhance prediction of long-term LID effectiveness.
2.
Model validation
The model continuity error accounts for errors in surface runoff and flow evolution and is calculated as follows:
Q C = 1 Q 0 Q 1
where Q 0 and Q 1 represent total outflow and inflow, respectively. A value below 10% indicates acceptable simulation accuracy [17]. Validation using observed rainfall from 19–20 July 2024 in Taiyuan [48] showed surface runoff and flow errors of –1.45% and –0.8%, respectively, confirming model reliability (Figure 2B).
A preliminary calibration procedure was also conducted using this single rainfall-runoff event. Parameters including imperviousness, Manning’s n, and depression storage were adjusted within ranges recommended by SWMM documentation and local design guidelines. The final model achieved a Nash–Sutcliffe efficiency (NSE) of 0.82 and a peak flow error of –6.7%. The root mean square error (RMSE) was also computed as 3.87 mm, indicating good predictive accuracy. Definitions and formulas for both NSE and RMSE are provided in Appendix B for reference.
However, this calibration remains limited by the use of only one rainfall event and the absence of long-term hydrological monitoring data. Consequently, the model’s robustness under varying climatic and operational conditions may be constrained. Future studies are encouraged to incorporate multi-event datasets to enable comprehensive calibration, sensitivity analysis, and uncertainty quantification.
3.
Rainfall determination
Following the Taiyuan Sponge City Construction Management Regulations [49], the Chicago rainfall pattern and corresponding intensity formula were used:
q = 10491.942 1 + 1.627 l g   T t + 23.651 1.229
where q is rainfall intensity (mm/min), T is the return period, and t is rainfall duration (min). Return periods of 10, 20, 50, and 100 years were selected at a 2 h duration, reflecting the region’s intense summer rainfall and runoff safety needs. The total rainfall depths were 61.52 mm (p = 10), 72.98 mm (p = 20), 88.15 mm (p = 50), and 99.61 mm (p = 100).

2.2.2. LID Settings

  • LID Selection and Parameter Setting
In retrofit projects such as campus renewal, the selection of LID types is subject to site-specific constraints, including structural capacity, surface layout, and lack of supporting infrastructure. In this study, the campus is located in North China’s Loess Plateau, characterized by a cold climate and collapsible loess soil. These conditions and infrastructural conditions limit plant growth, make the soil highly sensitive to prolonged saturation, and restrict the feasibility of certain measures such as rainwater harvesting. Therefore, LID design prioritized rapid infiltration and drainage over long-term water retention, while also ensuring compatibility with the existing dense and functionally diverse campus layout.
Based on these considerations, four LIDs were selected. Green roofs incorporate drought-tolerant vegetation, lightweight growing media, and waterproofing layers, promoting efficient drainage while protecting roof structures under cold winter conditions. Permeable paving includes a porous surface, a high-permeability base, and a subgrade to support rapid infiltration and reduce runoff accumulation. Sunken green spaces use native vegetation, engineered soils, and drainage layers to filter runoff without causing prolonged saturation. Rain gardens, composed of minimally modified soils and vegetated depressions, allow temporary storage and gradual infiltration.
The maximum proportion of each LID type was determined through feasibility assessments conducted during the campus retrofit planning. About 50% of rooftops were identified as flat and structurally sound—suitable for green roof installation—while the remainder were excluded due to sloped structures or redevelopment plans. Approximately 65% of hardened surfaces, including walkways, parking lots, and low-traffic roads, were considered suitable for permeable pavement based on load conditions, subsurface utilities, and spatial layout. For rain gardens and sunken green spaces, a 50% cap was set based on available green space, soil infiltration potential, and functional integration. This proportion also aligns with benchmarks from sponge city demonstration projects and reflects a practical balance between ecological benefit and long-term maintenance feasibility. Excessive coverage could increase costs and complexity while offering limited hydrologic improvement. The detailed proportions are presented in Table 1.
The corresponding modeling parameters were derived from commonly used configurations in SWMM applications [50], regional sponge city pilot practices [51,52,53], and engineering guidelines for Shanxi, China [54]. These assumptions support early-stage optimization while remaining grounded in practical feasibility (Table 2).
2.
LID application scenarios
This study implemented both single and combined LID arrangement scenarios. For the single LID arrangement, the proportion of green roofs, sunken green spaces, and rain gardens ranged from 20% to 50%, adjusted in 10% increments, while the proportion of permeable paving ranged from 20% to 65%, adjusted in 15% increments. A total of 13 different scenarios were designed. For the combined LID arrangement, the four measures (green roofs, permeable paving, sunken green spaces, and rain gardens) were combined. The NSGA-II algorithm was used to calculate the optimal solution set, which was then further refined through AHP hierarchical analysis to determine the optimal arrangement ratio.

2.2.3. NSGA-II Genetic Algorithm

  • Algorithm setup
The fast non-dominated sorting algorithm (NSGA-II) is a genetic algorithm that optimizes multiple conflicting objectives simultaneously, based on the concept of Pareto optimality [55]. The algorithm begins by generating an initial population through non-dominated sorting. This is followed by generating an offspring population through selection, crossover, and mutation. Once the parent and offspring populations are merged, the new parent population is selected based on non-dominant relationships and individual crowding. The process continues iteratively until the maximum number of generations is reached, resulting in the Pareto solution set.
For this study, the initial parameters were set as follows: a population size of 100, 500 iterations, a crossover probability of 0.9, and a mutation probability of 0.1. The model was developed using the MATLAB R2023b, and the algorithm optimization flow is illustrated in Figure 2C. These parameter settings were selected based on best practices reported in prior studies applying NSGA-II to hydrological and infrastructure optimization problems, where similar values achieved a good balance between convergence and diversity [56]. A population size of 100 ensures sufficient solution diversity while avoiding excessive computational cost. A high crossover rate of 0.9 facilitates effective exploration of the search space by recombining superior traits, while a relatively low mutation rate of 0.1 helps maintain solution stability and prevents premature convergence. Trial runs confirmed that these settings yielded stable Pareto front solutions within 500 generations.
2.
Optimization objectives and decision variables
The multi-objective optimization in this study aimed to generate Pareto-optimal LID layout solutions by minimizing costs while maximizing hydrological and environmental benefits. The fitness function F x of the NSGA-II algorithm is defined as
m i n F x = F 1 x , F 2 x , F 3 x  
where F 1 x represents the total construction cost of LID layouts (USD), F 2 x represents the runoff reduction rate (dimensionless), and F 3 x represents pollutant removal efficiency (dimensionless). Negative signs for F 2 and F 3 were applied to align with the minimization framework of NSGA-II.
A. Economic Cost Minimization
F 1 x = i = 1 n C i · A i
where C i is the unit cost of LID type i , and A i is the assigned area (m2). Cost components were derived from national construction databases [57] (Table 3).
B. Runoff Reduction Maximization
F 2 x = φ 1 × S 1 + φ 2 × S 2 S
where φ 1 denotes the area-weighted average runoff coefficient for zones with LID deployment, which was calculated based on SWMM simulation outputs for different LID types and coverage ratios (see Table A2 for individual LID coefficients). φ 2 represents the runoff coefficient for impervious areas without LID interventions; S 1 , S 2 , and S represent the respective areas.
C. Pollutant Removal Maximization
F 3 x = V n i 1 V n i 2 V n i 1 × μ i × A i / S
where V n i 1 and V n i 2 are the pollutant concentrations before and after LID deployment, respectively, μ i is the weight of pollutant i , and A i is the LID areas. The removal rates of different pollutants by each LID measure are shown in Table A3.
D. Constraints
Each LID type was subject to site-specific area constraints (see Table 1):
T n × L n < A n < T n
where T n is the total usable area, and L n is the minimum ratio allowed for LID settings.

2.2.4. AHP Hierarchical Analysis

  • Construction of the indicator system
The implementation of LIDs impacts not only rainfall runoff and pollutant management, but also economic and social benefits. Studies have shown that LID promotes sustainable stormwater management by reducing investment in stormwater conveyance infrastructure and enhancing landscape value. Therefore, when selecting a combination of LID approaches, four key factors should be considered: environmental, economic, social, and technological. Based on random interviews and questionnaire surveys conducted with students and faculty at the university, a comprehensive evaluation system was developed (Figure 2D). This system incorporates environmental, economic, social, and technical benefits to reflect the runoff status while accounting for cost inputs.
2.
Determination of indicator values
Environmental and economic benefits were calculated using the SWMM model, while social and technical benefits were evaluated qualitatively due to the challenges of direct quantification. The weight of each indicator was determined based on the area used in different LID combination scenarios through AHP, and the corresponding indicator values were calculated. A detailed quantitative formula is provided in Table A4.
3.
Benefit calculation
Individual benefit value is calculated using the weighted sum of indicator values. The formula is as follows:
B i m = k W k i × X k m
where B i m is the value of the benefits i of the program m , W k i is the weight of the indicator k in the benefits i , and X k m is the value of the indicator after min-max normalization. The normalization formula is
X k m = X k m X m i n X m a x X m i n
where X k m is the initial indicator value k for the program m , and m is the LID program number (this program = 98). X m a x is the maximum value of the indicator in all programs, and   X m i n is the minimum value of the indicator. This method normalizes the indicator values, making them dimensionless, and facilitates subsequent comprehensive evaluation.
4.
Evaluation levels and criteria
In the process of evaluating the comprehensive benefits of LID, the relative importance of each indicator must be assessed and assigned values based on the differing weights of the evaluation criteria. To determine the relative importance of each tier factor, questionnaires were distributed to experts and students on campus. A total of 500 questionnaires were distributed to the teachers and students across the two colleges mentioned above, and participants were asked to perform pairwise comparisons of the factors using a numerical scale from 1 to 9. This allowed us to calculate the relative importance weightings for each tier factor. The survey covered the assessment of environmental, economic, social, and technical benefits of LIDs in campus settings. These weightings were then tested using the consistency ratio (CR) to ensure the reliability of the hierarchical analysis method. The formula for calculating the CR is
C R = C I R I
where C I is the consistency index, formulated as
C I = λ m a x n n 1
where λ m a x is the maximum eigenvalue, and n is the order of the square array. R I is the random consistency index. When the C R is less than 0.1, the matrix calculation is considered reliable, and the resulting weight values can be used for further evaluation.

3. Results and Discussion

3.1. Effectiveness of SWMM-Based Single LID Runoff Management

Using the SWMM model, we evaluated the runoff control and cost performance of individual LIDs under a 10-year return period (Table 4). The results show that, while construction costs increase with higher LID coverage, the runoff reduction rate begins to plateau. Permeable paving achieved the highest reduction at 65% coverage, with a cost of USD 2.70 million.
To ensure the reliability of the SWMM simulation results, a preliminary sensitivity analysis was conducted of key hydrological parameters, including impervious surface roughness, initial surface loss, and infiltration parameters. The analysis revealed that initial surface loss had the most significant impact on total runoff volume, while Manning’s coefficient for impervious areas moderately affected peak discharge. The full results and variation trends are provided in Appendix C. These findings help identify critical parameters for future calibration, supporting the robustness of the runoff management assessment presented in Table 4.
Among all LIDs, permeable paving was the most effective, followed by sunken green spaces and green roofs, with rain gardens showed the least impact. For example, Eckart et al. [58] demonstrated that permeable pavements significantly reduce both peak runoff and total runoff volume by enhancing infiltration through subgrade systems in SWMM-based multi-objective optimization. Similarly, Li et al. [59] showed that spatially optimized layouts of LID practices—particularly permeable pavements—can achieve higher environmental benefits and cost-efficiency in urban stormwater management. Rain gardens and sunken green spaces, with greater retention depth, performed better at bioretention and rainwater storage, especially per unit area [60,61]. Green roofs, however, showed limited effect due to site-specific structural limitations and the use of shallow substrate layers, consistent with observations in cold-climate retrofits [62,63].
In terms of cost-effectiveness, sunken green spaces provided the best performance, followed by permeable paving, especially in large open areas like playgrounds and plazas. Consequently, this study recommends prioritizing sunken green spaces and permeable paving as key components for the campus retrofit [64,65].

3.2. NSGA-II-Based LID Combination Optimization Results

3.2.1. Comparative Analysis of Cost-Runoff Curves at Different Return Periods

The NSGA-II algorithm (500 iterations in MATLAB) was used to generate optimal LID configuration sets across four rainfall return periods (p = 10, 20, 50, 100), as shown in Figure 3A. Increasing the return period has a limited effect on the runoff reduction range. For instance, when T = 10, the runoff reduction ranges from 6.85% to 43.68%, with costs between USD 481,182 and USD 6,205,587; at T = 100, the ranges narrows to 2.78–42.15%, with costs from USD 218,575 to USD 638,580,151.
A positive correlation exists between the costs and runoff reduction rates across return periods. As costs increase, so does runoff reduction, indicating a direct relationship between investment and LID performance. This aligns with prior findings that larger initial expenditures enhance stormwater management effectiveness, especially with extreme rainfall [2,66]. By comparing the cost–runoff curves under various return periods, stakeholders can assess the cost-effectiveness of LID planning for differently designed storms [67]. For example, achieving 40% runoff reduction requires USD 5.163 million at p = 10, USD 5.606 million at p = 20, and over USD 5.781 million at p = 50 or p = 100. While higher return periods provides more resilience, they demand careful investment trade-offs [68].
All four cost-runoff curves display similar growth trends, but with varying steepness, reflecting different growth rates of benefit versus cost [69]. Once rainfall exceeds an economic threshold, cost rises sharply for similar reduction targets, showing diminishing returns [37,39]. For example, exceeding USD 3.11 million at p = 10 offers minimal additional benefit, whereas this threshold shifts to USD 3.46 million at p = 50. Understanding such critical value helps stakeholders make informed decisions to mitigate flood risks effectively.

3.2.2. Pareto Frontier Analysis at p = 10

The Pareto curve for the LID combination scheme at p = 10 (Figure 3BI) presents optimal trade-offs among cost, total runoff reduction, and combined pollutant removal (Table A5). The results show a generally positive correlation among the three metrics. The most expensive solution (USD 6,195,044) achieves 43.68% runoff reduction and 24.1% pollutant removal, while the least costly (USD 68,078) yields only 7.37% runoff reduction and 0.42% removal. This confirms that greater investment generally leads to better hydrologic and water quality outcomes [44,70,71].
However, this relationship is not linear. Figure 3BII shows that runoff reduction and pollutant removal increase together within a limited investment range. Figure 3BIII highlights a sharp cost escalation after 32% runoff reduction––increasing from 10% to 20% requires USD 1.33 million, while increasing from 30% to 40% costs USD 159,926 more—illustrating diminishing returns. Figure 3BIV further illustrates that, although pollutant removal improves with higher cost, the rate of improvement slows. Runoff and pollutant reduction respond differently to cost increases, suggesting that benefits gained from further investment become marginal over time [37,39,67]. This pattern emphasizes the importance of strategic planning, where stakeholders must balance costs and environmental gain. Clear understanding of these dynamics enables efficient resource allocation, maximizing performance across runoff control and pollutant management to support resilient urban ecosystems [5,72,73].
To assess the reliability of these trade-offs under input uncertainty, we conducted a robustness analysis based on stochastic perturbations of SWMM outputs. The results demonstrate that the Pareto front remains stable across multiple simulation runs (see Appendix D for details).

3.3. Selection of Optimal Combination Arrangement Options Based on Comprehensive Benefit Evaluation

3.3.1. AHP-Integrated Benefit Evaluation System

Following indicator construction based on interviews, a structured questionnaire survey was conducted of 500 campus students and faculty to assess the relative importance of each indicator. The collected responses were used to compute the weights using the Analytic Hierarchy Process (AHP), forming a quantitative evaluation framework for campus LID renovation (Table 5). Social benefits received the highest weight (0.3476), reflecting the respondents’ emphasis on daily usability and educational value [1,44,70]. Among environmental indicators, total runoff reduction (0.1838) and biodiversity (0.2133) were prioritized, while economic (0.2656) and technical (0.1328) factors underscore the need for investment control and technological feasibility in LID selection.

3.3.2. Integrated Benefit Evaluation of LID Portfolios with Multi-Objectives

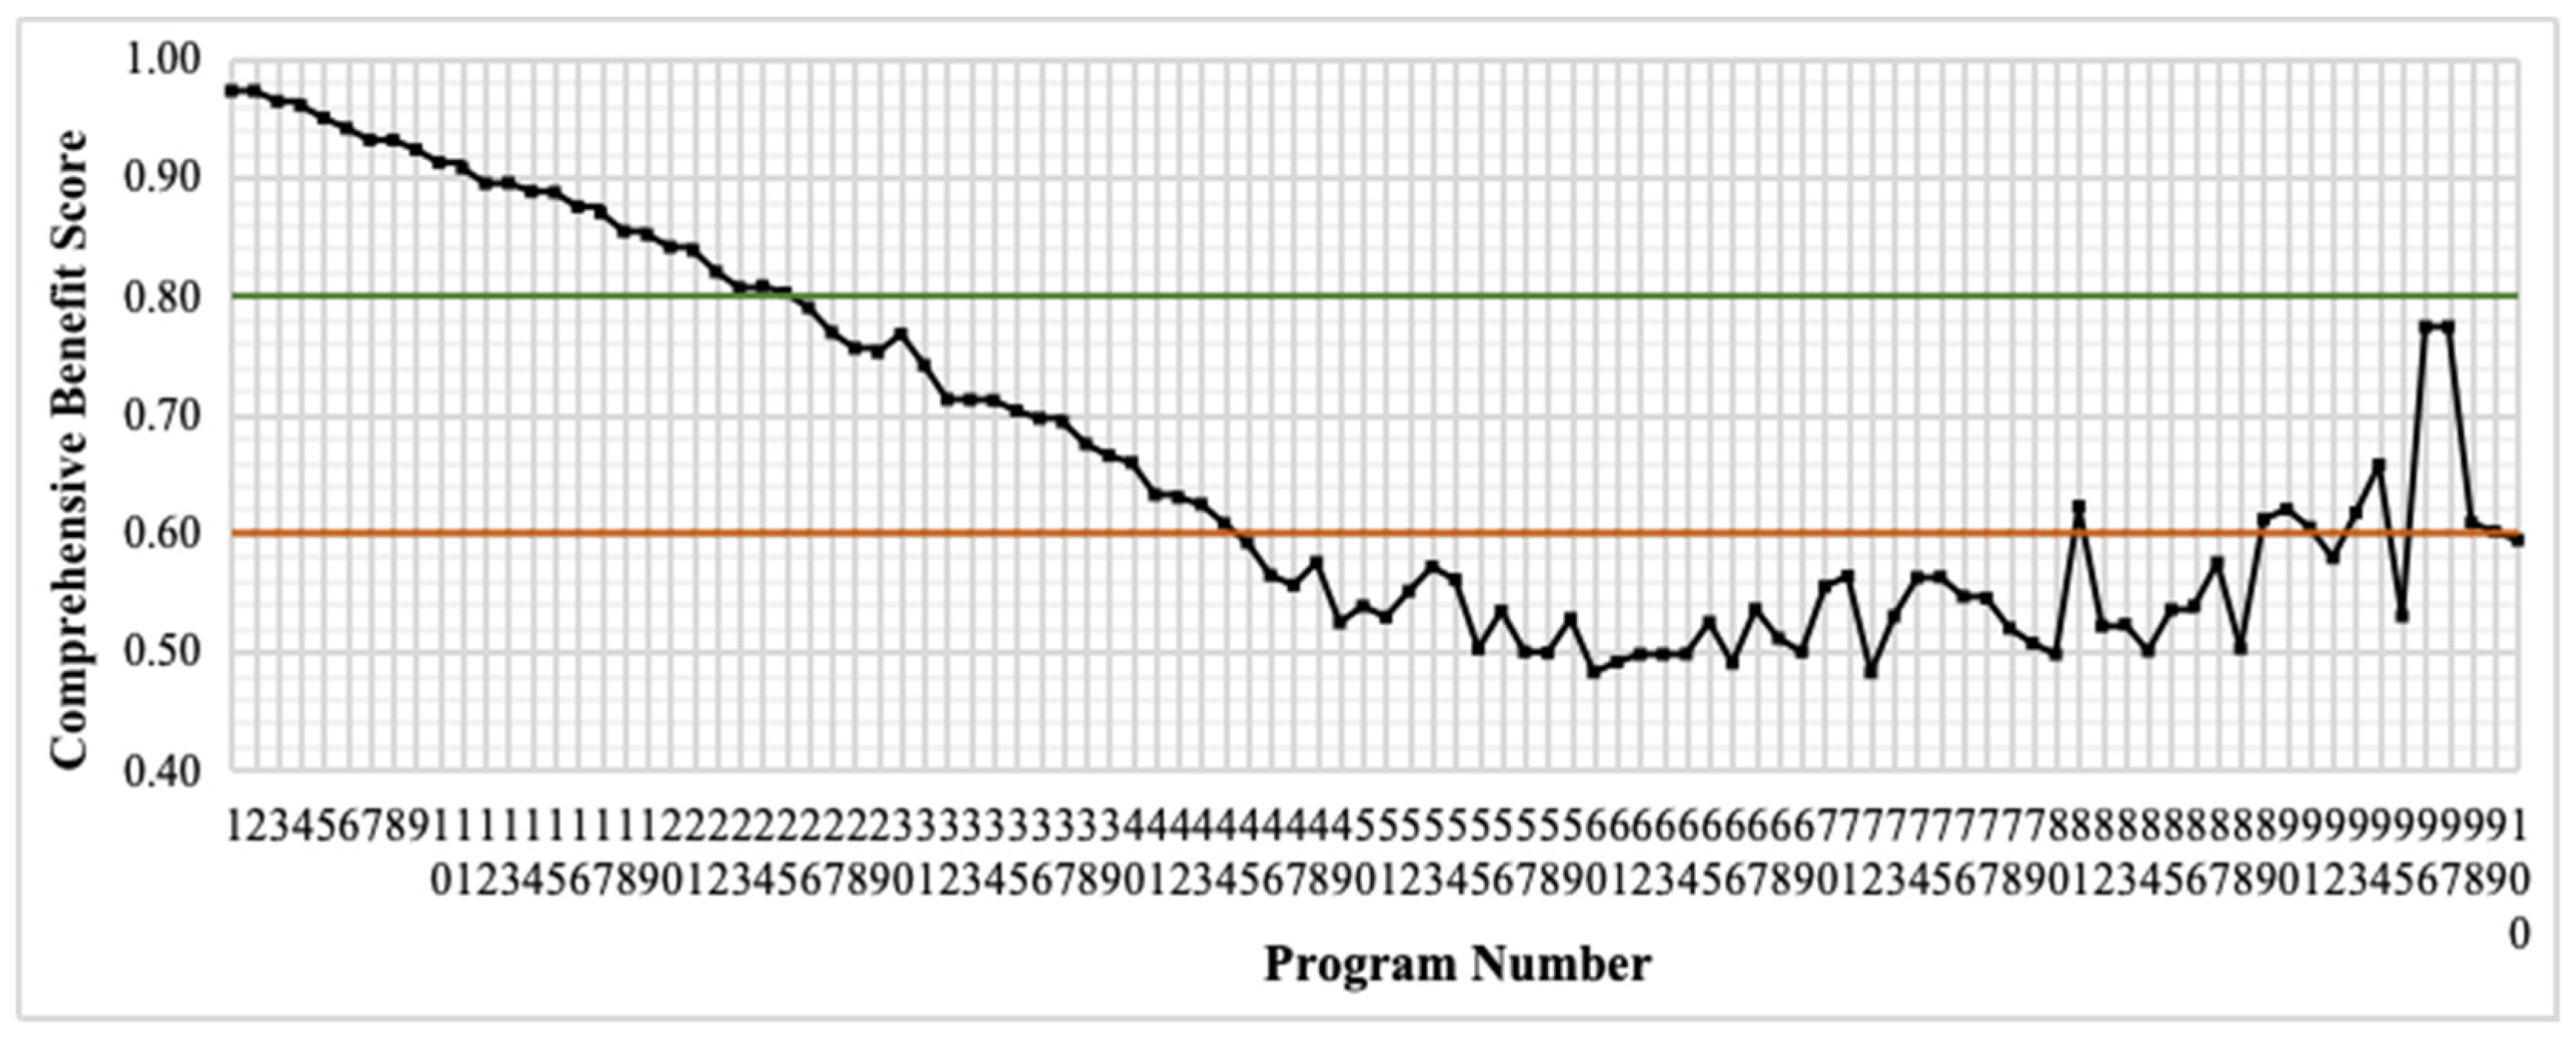
  • Comprehensive evaluation of LID portfolio optimization
Based on the 100 LID combination schemes generated by the NSGA-II algorithm, comprehensive benefit evaluation (Figure 4) revealed marked variations among the schemes. Environmental benefits varied considerably—with overall declines and notable drops around schemes 29–30—while social benefits were highest in the top 28, then peaked around schemes 29–30 before declining. Economic benefits remained relatively stable until fluctuations increased in lower-ranked schemes, and technical benefits exhibited greater volatility in lower-ranking options. Overall, the top-ranked combinations showed smoother benefit fluctuations, with individual benefit outcomes closely linked to both the total LID area and facility-specific allocations. For example, among schemes with similar total areas, those emphasizing larger green roof or rain garden areas demonstrated enhanced social benefits but somewhat lower environmental performance. In contrast, sunken green spaces and permeable paving proved more effective for runoff control and cost efficiency, confirming previous studies.
2.
Optimal program selection
After comparing the composite scores relative to investment costs (Figure 5), our analysis indicates that investments above USD 5.18 million yield composite scores above 80, indicating that higher spending generally improves overall benefits. However, when investments are decreased from approximately USD 5.18 million to USD 3.83 million (and further to USD 1.42 million), the benefits—especially runoff control and pollutant removal—deteriorate sharply. This is evident, as a nearly USD 1 million reduction in investment can lower runoff reduction and pollutant removal to only about 10% and 3%, respectively, thus compromising practical efficacy. Comprehensive analysis identifies Option 22 as optimal, requiring less than USD 4 million and demonstrating the best balance of runoff control and environmental performance, thereby offering high cost-effectiveness and practical feasibility.

3.4. Analysis of the Best Solution with LID Multi-Objective Optimization

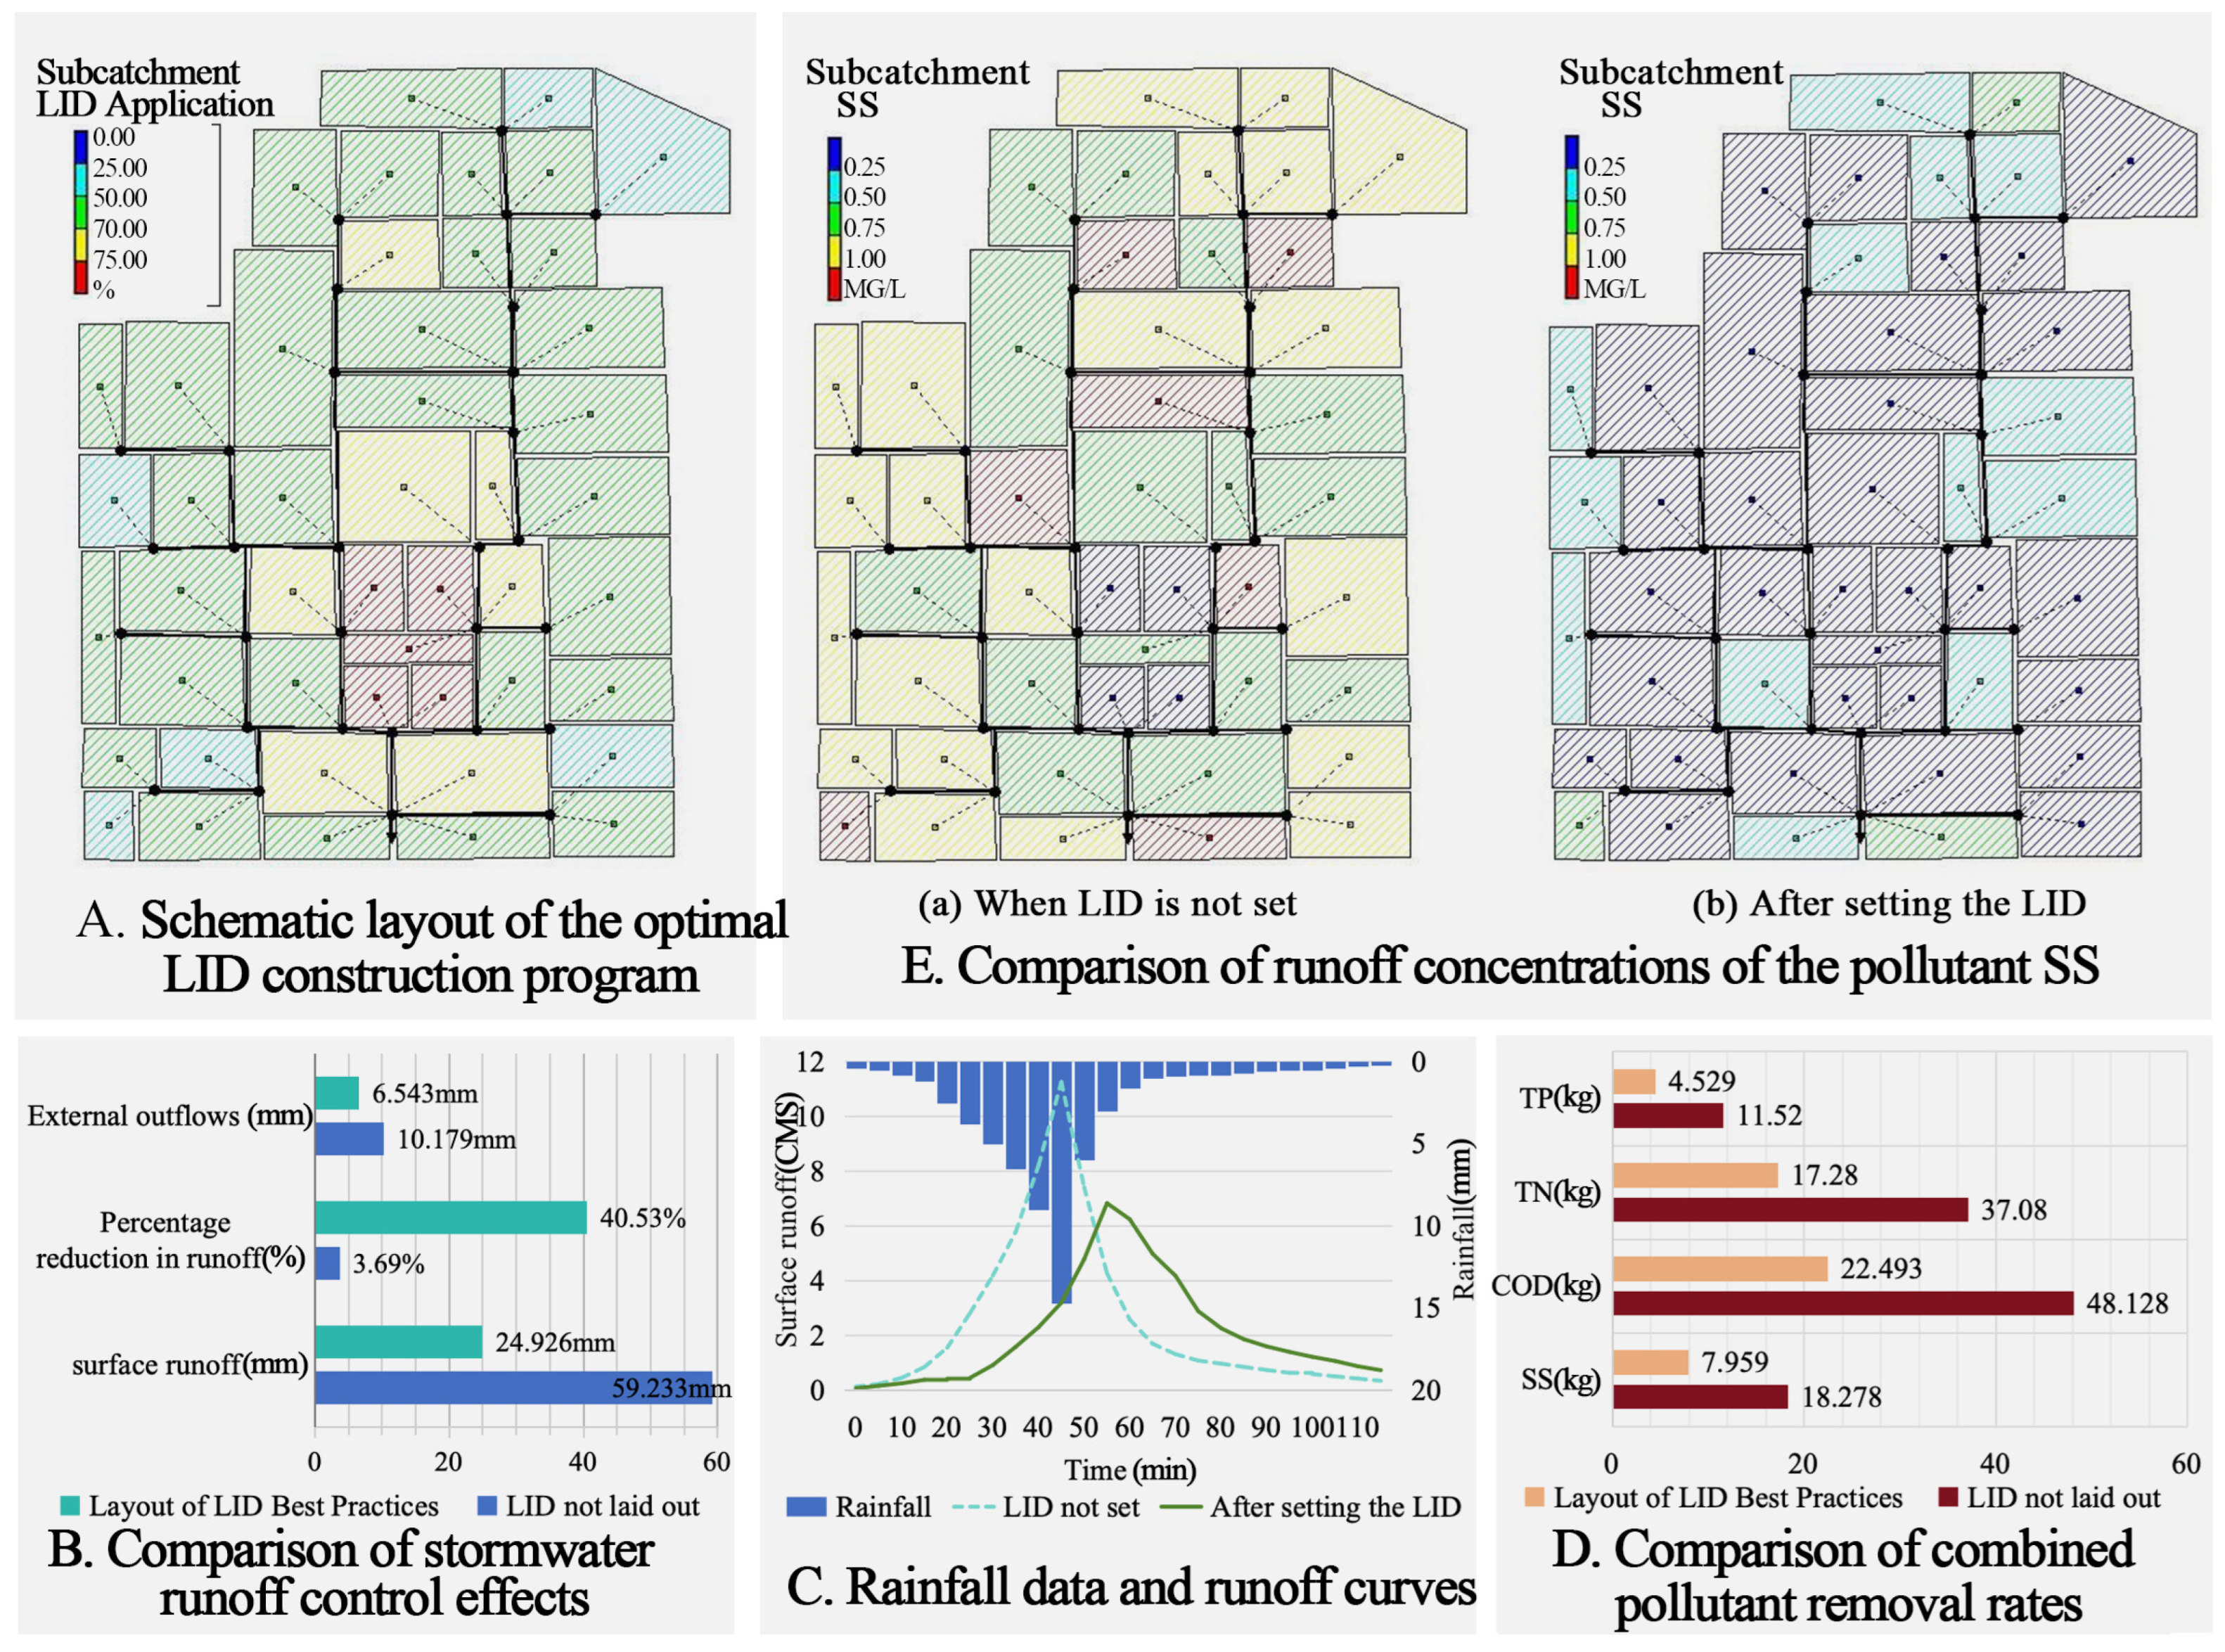
3.4.1. Evaluation of Optimal LID Solutions

Among the 100 solutions generated by NSGA-II and evaluated via AHP, Scheme 22 was selected as optimal. It includes green roofs (28.58%), sunken green spaces (19.37%), permeable paving (48.68%), and rain gardens (3.37%), collectively covering 45.37% of the study area. This allocation reflects both sponge city objectives and site-specific conditions (Figure 6A).
  • Stormwater reduction
SWMM simulations with a 10-year return period show that LID implementation reduces surface runoff by increasing the runoff reduction rate from 3.69% to 40.5% and external outflow by 35.72% (Figure 6B), effectively mitigating localized flooding risk.
2.
Peak runoff control
Peak rainfall occurred 45 min into the event. Without LIDs, runoff peaked immediately, while Scheme 22 delayed the peak by 10 min and reduced peak flow by 39.4% (Figure 6C), indicating increased retention capacity and relief for drainage systems.
3.
Pollutant reduction
The simulation results (see Figure 6D,E) reveal substantial pollutant removal: SS by 56.5%, COD by 53.3%, TN by 53.4%, and TP by 60.7%. This confirms the scheme’s strong capacity for water quality improvement through source control and infiltration-based filtration.

3.4.2. Countermeasures for Campus Landscape Improvement Based on the Best Option

Transforming Yingxi Campus into a sponge landscape is essential for addressing runoff, flood risk, and ecological sustainability. The following strategies are proposed based on optimization outcomes and real-site adaptation.
  • Construction of a sponge landscape complex
Yingxi Campus faces significant challenges, including low-lying areas, fragmented green spaces, and a high percentage of impermeable surfaces. To address these issues, a comprehensive rainwater management system integrating four types of LIDs—green roofs, rain gardens, sunken green spaces, and permeable paving—is proposed. This integrated approach aims not only to improve stormwater management, but also to enhance groundwater recharge and promote ecological sustainability. A shallow drainage system [65,74,75] will be established, designed to fit the campus’s topography, which allows for effective rainwater management while minimizing disruption to existing infrastructure.
Sunken green spaces will be strategically placed at the edges of roads and buildings, creating seamless connections to existing green areas and enhancing the aesthetic appeal of the campus. These spaces will not only function as essential elements in the stormwater management strategy, but also serve as recreational areas for students and faculty. Rain gardens will be established in larger green areas to improve runoff storage and purification functions, utilizing native plant species that are well-adapted to the local climate. This biodiversity not only enriches the campus environment, but also provides educational opportunities for students to engage with sustainable practices first hand. Additionally, green roofs will be constructed on flat-roofed buildings, such as cafeterias and teaching blocks, contributing to energy efficiency and effective rainwater management. For dormitory buildings with sloped roofs, innovative solutions will redirect roof runoff into gravel ditches, allowing it to flow into sunken green areas, rain gardens, or the drainage network. This “gray-green integration” strategy enhances the overall effectiveness of the stormwater management system while mitigating the urban heat island effect [76,77].
2.
Improve the campus financial system
Prioritizing sunken green spaces and permeable paving is essential for optimizing economic efficiency, as they demonstrate optimal performance in runoff reduction relative to their costs. While rain gardens are beneficial, their higher construction costs necessitate selective deployment in core landscape areas to maximize their impact. The construction of sponge campuses involves substantial investment, making it crucial to develop accurate estimates of both initial and lifecycle expenses. To address financial challenges, several strategies should be implemented.
First, regulatory improvements are necessary to enhance relevant laws and streamline project cooperation among stakeholders [78,79]. By minimizing conflicts of interest, these enhancements can facilitate collaboration among public entities, private developers, and local communities [80]. Second, conducting comprehensive cost–benefit analyses that encompass the construction, operation, and maintenance phases will provide insights into the overall benefits and risks of LID implementation. This thorough approach enables stakeholders to make informed financial decisions based on projected returns. Additionally, clarifying the relationship between return on investment and the benefits of LID systems can attract private enterprises to fund these projects. Offering tax incentives or grants for sustainable practices may further encourage investment [79,81]. Finally, establishing a comprehensive database that includes best practices, case studies, and financial models will support effective decision-making and foster knowledge sharing among stakeholders [82].
3.
Enhance public participation and experience
The sponge campus serves as a vital platform for promoting ecological knowledge and advocating for green development practices within the campus community. To maximize its educational potential, nature and environmental learning tools [83,84,85] should be established, showcasing rainwater management principles through informative signage at key nodes in the campus landscape. This initiative will deepen public understanding and engagement with the sponge city concept, fostering a sense of ownership and responsibility among students and faculty.
Moreover, to address the lack of practical experiences in traditional classroom settings, it is essential for colleges and universities to incorporate sponge construction-related courses into their curricula. Such integration provides students with hands-on opportunities to learn and apply ecological knowledge in real-world scenarios, enhancing their educational experience. Engaging students in projects that involve designing and implementing LID solutions on campus will deepen their understanding of sustainable practices and underscore their importance in urban environments [83]. Promoting educational reform in landscape architecture, landscape ecology [86], and related disciplines will equip future professionals with the skills needed to tackle the challenges of urban sustainability effectively. Ultimately, this comprehensive approach to enhancing public participation will not only improve the ecological environment, but also cultivate a culture of sustainability and community engagement throughout the campus.

3.5. Limitation

This study has several limitations. First, the SWMM model was validated with a single observed rainfall-runoff event. While this event is representative of local conditions, broader validation with multiple storms or continuous simulations would improve the model’s robustness and applicability. Second, the use of designed storms did not capture long-term hydrologic variability or seasonal dynamics. Future studies should adopt continuous simulation approaches to better evaluate cumulative LID performance and long-term impacts. Third, this study did not account for performance decline due to clogging, which can significantly affect the effectiveness of infiltration-based LIDs such as permeable paving, sunken green spaces, and rain gardens. Infiltration capacity and storage volume may decrease over time due to sediment accumulation, plant overgrowth, or insufficient maintenance. While this omission simplifies the model and aligns with the design-stage focus of the study, it may lead to an optimistic estimation of LID performance. Future work is recommended to incorporate dynamic performance decay functions or maintenance-responsive modelling to capture clogging impacts and enhance long-term reliability.
Additionally, although rainwater harvesting (RWH) is a typical and effective LID technique—particularly relevant for rooftop-dense campuses—it was not included in the optimization scenarios. This was primarily due to site-specific constraints, such as aging roof structures and the lack of storage infrastructure. Given that the simulations are based on hypothetical improvement scenarios, the omission of RWH is acknowledged as a modelling simplification rather than a technical oversight. Future studies could expand the LID palette to include RWH and explore its synergies with other facilities.
Finally, the AHP evaluation system integrated environmental, economic, social, and technical benefits based on stakeholder input. While operation and maintenance (O&M) costs were not explicitly modelled in the NSGA-II optimization stage, they were incorporated as a sub-criterion within the economic dimension of the AHP. This approach allowed us to qualitatively reflect stakeholder concerns about long-term cost-effectiveness. The choice of NSGA-II was primarily driven by its demonstrated robustness and flexibility in handling multi-objective problems, especially when balancing competing goals such as cost and runoff control in spatially constrained environments. Although algorithmic comparison was beyond the scope of this study, future research could consider benchmarking NSGA-II against other evolutionary algorithms (e.g., SPEA2 or MOEA/D) to further explore solution quality and computational efficiency. Meanwhile, the AHP-based evaluation remains limited by the lack of empirical tracking and quantitative validation. Future studies should consider integrating lifecycle cost modelling and longitudinal data to strengthen decision accuracy and real-world applicability.

4. Conclusions

This study proposed an integrated framework for optimizing LID facility layouts in a densely built campus setting, combining the SWMM model with NSGA-II multi-objective optimization and AHP-based benefit evaluation. Applied to the Yingxi Campus of Taiyuan University of Technology, the approach identified 100 optimal LID configuration schemes under site-specific constraints. The final selected layout, comprising green roofs, sunken green spaces, permeable paving, and rain gardens, achieved significant improvements in runoff reduction (up to 40.5%), peak flow control, and pollutant removal, demonstrating the practical effectiveness of the simulation-optimization-evaluation framework.
Unlike conventional SWMM applications that assess fixed LID schemes, this study advances a performance-driven, constraint-sensitive method that balances hydrological performance, economic cost, and multi-dimensional stakeholder priorities. The integration of genetic algorithm optimization and decision-weighted benefit analysis offers a replicable approach for urban campuses or similarly space-constrained environments.
Nonetheless, limitations remain regarding the long-term reliability of simulation results and the dynamic cost-effectiveness of LIDs under variable conditions. Future research should focus on continuous performance monitoring, improved lifecycle cost modelling, and policy-based funding strategies to support scalable sponge infrastructure development. In addition, future work could explore the use of machine learning for adaptive LID optimization and integrate socio-economic equity considerations into AHP weightings to enhance both technical robustness and inclusive decision-making. Comparative evaluation of different optimization algorithms could also be conducted to refine solution diversity and computational performance in complex decision scenarios.

Author Contributions

Conceptualization, Z.L. and L.L.; methodology, Z.L.; software, Z.L.; validation, Z.L., Y.W., and J.L.; formal analysis, Z.L.; investigation, Y.W. and W.Z.; resources, X.Z.; data curation, Z.L.; writing—original draft preparation, Z.L.; writing—review and editing, L.L. and X.Z.; visualization, Z.L.; supervision, L.L. and X.Z.; project administration, L.L.; funding acquisition, X.Z. All authors have read and agreed to the published version of the manuscript.

Funding

This study was supported by the Shanxi Province Science Foundation for Youths (funding Number 202203021222125).

Institutional Review Board Statement

Ethical review and approval were waived for this study due to the nature of the study involving non-sensitive, anonymous interview data collected from adult participants who provided informed consent. The interviews were conducted in a voluntary and non-invasive manner, with no involvement of vulnerable populations and no foreseeable risks to the participants.

Data Availability Statement

The raw data supporting the conclusions of this article will be made available by the authors on request.

Conflicts of Interest

The funders had no role in the design of the study; in the collection, analyses, or interpretation of data; in the writing of the manuscript; or in the decision to publish the results.

Appendix A

Table A1. SWMM model parameters.
Parameter NameParameter Value
permeable zoneinitial loss10 mm
initial percolation rate82 mm/h
stable permeability5 mm/h
infiltration attenuation coefficient2 h
Manning’s coefficient0.5
impervious areainitial loss3 mm
constant runoff coefficient8
Manning’s coefficient0.013
conduitconfluencedynamic wave method (physics)
roughness0.0013
Table A2. LID runoff coefficients.
LIDRunoff Coefficient
Green Roofs0.328
Sunken Green Space0.164
Permeable Paving0.455
Rain Gardens0.158
Table A3. Removal of different pollutants by LID.
LIDSS Removal RateTP Removal RateTN Removal RateCOD Removal Rate
sunken green space65%45%40%25%
green roof50%60%25%30%
permeable pavement75%55%30%30%
rain garden35%35%45%30%
Table A4. Indicator system.
NormFormulasAccount
Improvement in air quality E P M 2.5 = I × S × T
E P M 2.5 means P M 2.5 reduction, I refers to the retention factor, kg/(m2-yr), S refers to the area of the facility, m2, and T refers to the pollutant concentration, μg/m3
Retention factor:
Sunken green space: 0.001 kg/(m2-yr)
Green roofs: 0.010 kg/(m2-yr)
Rain gardens: 0.050 kg/(m2-yr)
The baseline PM2.5 concentration in the air is 50 μg/m3
Carbon sequestration G CO 2 = I \ t i m e s S
GCO2 carbon sequestration, kg CO 2 /yr, I refers to the carbon fixation factor, kg C O 2 /m2/yr. S Area covered by vegetation, m2
Carbon fixation factor:
Grassland: 0.5 kg C O 2 /m2/yr
Shrubs: 2.0 kg C O 2 /m2/yr
Trees: 10.0 kg C O 2 /m2/yr
Species diversity H = Σ P i × ln \ f u n c a p p l y P i H refers to the diversity indicator, a n d   P i refers to the area of each patch type
Temperature regulation K C = I C \ t i m e s S
KC means the coefficient of reduction of surface temperature, I C means the temperature reduction factor, °C/m2. S refers to the area of green space or water body, m2
Temperature reduction factor:
Grassland: 0.3 °C/m2
Shrubs: 0.5 °C/m2
Trees: 0.7 °C/m2
Humidity regulation H = E \ t i m e s h \ t i m e s S H refers to humidity increase, E refers to evapotranspiration, E = 4 mm/day, S refers to the area covered by trees, m2
h refers to the humidity regulation factor, h = 0.05%/m2-mm/day
Water cost savings Y = a \ t i m e s H Y refers to the cost of water conservation, a refers to the price of tap water, USD/m3, and H refers to the volume of rainwater harvesting, m3
Savings in input costsY = − ln F S Y refers to the input cost savings indicator, F refers to the economic construction cost, USD million, and S refers to the total area of the facility construction, m2
Facility maintenance costs Y = a \ t i m e s H
Y refers to facility maintenance costs, S refers to facility area, m2, and a refers to maintenance costs
Maintenance cost factor:
Sunken green space 2.75/m2/year
Permeable paving 4.13/m2/year
Roof garden 6.88/m2/year
Rain garden 3.44/m2/year
Table A5. Statistics of LID areas in the 100 best combination scenarios.
Scenario NumberArea (hm2)Scenario NumberArea (hm2)
Green RoofsSunken Green SpacePermeable PavementRainwater GardenGreen RoofsSunken Green SpacePermeable PavementRainwater Garden
13.71482.73503.41053.0569514.69372.71825.01262.7469
22.23452.73143.67273.0561524.69902.71632.62322.7424
34.14182.74194.25273.0368530.00002.74882.14722.7144
44.72212.70633.68463.0301544.97352.69264.24792.7099
55.43332.75064.30873.0104555.35602.74105.22552.7059
64.78042.71641.45382.9863565.43442.59023.79652.6905
70.00002.72314.40932.9807575.03502.74444.85652.6792
85.74142.73213.45432.9787585.82562.76344.31782.6645
95.78142.73474.42712.9687594.67972.73003.62722.6630
105.59770.00008.62392.9646602.91382.73184.77822.6554
115.32612.72954.26292.9634615.36242.77084.61942.6446
125.06552.72843.15542.9625625.93822.64202.34462.6370
135.49412.73114.75872.9620635.83442.75064.37642.6355
145.61712.72113.74692.9576644.89752.67894.10602.6341
152.89082.91104.06912.9548654.96642.71800.00002.6125
165.39472.73693.27372.9521664.00322.71004.73172.6097
175.64772.70974.06632.9518675.63222.58273.73862.6069
185.61462.71074.08492.9407682.86362.85224.56902.5863
195.50122.70304.05832.9366695.37642.65315.19572.5642
205.64372.90004.53082.9346705.04802.67432.69412.5564
215.15462.72974.32382.9296713.86522.72063.48172.5445
225.88682.75284.04802.9295724.96422.70274.61112.5135
235.98542.72161.61562.9274734.71582.80627.09562.4873
245.52962.70634.02722.9253744.94032.71555.55182.4351
255.97152.70863.97752.9223754.78142.70454.18522.3872
265.00552.85697.30102.9198764.82502.82632.40072.3180
275.47752.83687.05812.9107774.89492.71206.33012.2652
285.67942.66233.00962.8973785.08042.88846.66222.2480
295.85972.76024.04362.8956794.83872.82573.51242.2317
305.60742.77094.56372.8942804.84742.74328.57402.0713
315.40502.73683.65362.8881814.83982.74474.54671.9393
325.88812.76354.01252.8843823.77042.71352.64021.9158
334.81952.72474.65272.8797835.02772.85888.02831.8926
345.57622.80885.44312.8646840.80752.69193.54161.7147
355.48212.71192.92842.8592855.16783.03179.13871.7055
365.52522.74382.68822.8573863.87342.72404.64841.6578
375.50112.73424.32312.8420873.58972.70654.75341.5367
384.34752.74177.20322.8375884.82562.71644.63571.5351
395.70682.74184.33532.8352895.07802.70244.13321.4658
400.00003.08004.35752.8348903.23872.73664.67801.3549
410.00002.64953.63582.8276914.81332.71434.25841.2780
422.66112.70804.37922.8269924.10572.71735.06641.0018
434.99012.81603.50432.8080933.36802.73752.70220.7804
444.28512.69834.46422.7980943.43092.70755.20560.1395
455.50772.93023.26942.7880952.82773.04716.42550.1324
461.04292.93726.08202.7858962.38022.71955.19570.0000
473.66012.67023.87912.7843973.38502.71033.95013.0600
485.35932.71814.01382.7750986.12002.76383.84533.0538
495.75752.72864.15272.7715990.00003.08004.09772.8348
505.28902.73325.56542.74821005.75010.20149.27002.7880

Appendix B. Model Validation Metrics

Nash–Sutcliffe efficiency (NSE) and root mean square error (RMSE) were used to assess the model performance, defined as
N S E = 1 i = 1 n Q o b s , i Q s i m , i 2 i = 1 n Q o b s , i Q o b s ¯ 2
R M S E = 1 n i = 1 n Q o b s , i Q s i m , i 2
where Q o b s , i and Q s i m , i are the observed and simulated runoff values, respectively, at time i , and Q o b s   ¯ is the mean of the observed values. A higher NSE (closer to 1) and a lower RMSE indicate better model performance.

Appendix C. Sensitivity Analysis of the SWMM Model Parameters

To evaluate the influence of key hydrological parameters on model output reliability, a one-at-a-time (OAT) sensitivity analysis was conducted on four core SWMM parameters: Manning’s n for impervious area, initial loss for impervious surfaces, infiltration rate for pervious zones, and the decay coefficient.
The base values were derived from Table A1, and each parameter was varied by ±20% and ±40%, while keeping the others constant. The sensitivity was assessed in terms of changes in peak flow and runoff volume with a 10-year return rainfall event.
Table A6. Sensitivity of key SWMM parameters to peak flow and runoff volume.
ParameterBase Value±20% Change±40% ChangeSensitivity Trend
Impervious Manning’s n0.013−0.0104–+0.0156−0.0078–+0.0182Moderate
Initial loss (impervious)3 mm2.4–3.6 mm1.8–4.2 mmHigh
Initial infiltration rate82 mm/h65.6–98.4 mm/h49.2–114.8 mm/hModerate
Decay coefficient2/h1.6–2.4/h1.2–2.8/hLow
Among the parameters, initial surface loss showed the most pronounced influence on total runoff volume, suggesting that accurate characterization of initial abstraction is critical for stormwater simulation. Impervious surface roughness (Manning’s n) moderately affected peak discharge timing and intensity. The decay coefficient had relatively minimal impact, indicating lower sensitivity within the tested range.
These findings suggest that future calibration efforts should prioritize surface initial loss and Manning’s n, especially in dense urban surfaces where LID deployment targets imperviousness reduction.

Appendix D. Robustness Evaluation of the Pareto Frontier Under Input Uncertainty

To evaluate the stability of the Pareto front obtained from the NSGA-II optimization process, we performed a robustness analysis by introducing perturbations to model input variables. This test serves to assess the consistency of optimal trade-offs under moderate simulation uncertainties, thereby enhancing confidence in the decision-support applicability of the results.

Appendix D.1. Perturbation Method

A stochastic perturbation approach was adopted. Specifically, Gaussian noise (μ = 0, σ = 10%) was added to SWMM-simulated outputs—runoff volume and pollutant loads—that serve as input to the multi-objective fitness functions. Each perturbed dataset represents a plausible realization of parameter uncertainty commonly found in hydrological simulations.
To ensure statistical reliability, 30 independent runs of the NSGA-II algorithm were conducted using the perturbed inputs, while keeping the optimization parameters (population size, generations, crossover/mutation rates) constant.

Appendix D.2. Evaluation Indicators

Two widely used indicators for Pareto front robustness were employed:
  • Hypervolume (HV): Measures the volume in objective space dominated by the Pareto front and bounded by a reference point. A higher HV value indicates better diversity and quality.
  • Spacing (SP): Quantifies the spread (uniformity) of solutions on the Pareto front. A lower SP value reflects better convergence and even distribution.
Table A7. Robustness evaluation of Pareto fronts under perturbed inputs.
MetricMean ValueStandard DeviationInterpretation
HV0.7450.018Stable diversity across solutions
SP0.0240.005Low dispersion, indicating good convergence

Appendix D.3. Interpretation and Implications

The results demonstrate that the Pareto front remains stable in the face of moderate input perturbations. The low standard deviations of both HV and SP imply that solution diversity and convergence are not significantly degraded by input noise, thus confirming the robustness of the LID layout optimization outcomes.
This analysis suggests that the proposed optimization framework provides reliable guidance for investment decision-making, even in the presence of typical uncertainties associated with urban hydrological modeling.

References

  1. Liu, T.; Lawluvy, Y.; Shi, Y.; Yap, P.-S. Low impact development (LID) practices: A review on recent developments, challenges and prospects. Water Air Soil Pollut. 2021, 232, 344. [Google Scholar] [CrossRef]
  2. Chang, N.-B.; Lu, J.-W.; Chui, T.F.M.; Hartshorn, N. Global policy analysis of low impact development for stormwater management in urban regions. Land Use Policy 2018, 70, 368–383. [Google Scholar] [CrossRef]
  3. Batalini de Macedo, M.; Nobrega Gomes, M., Jr.; Pereira de Oliveira, T.R.; Giacomoni, M.H.; Imani, M.; Zhang, K.; Ambrogi Ferreira do Lago, C.; Mendiondo, E.M. Low impact development practices in the context of united nations sustainable development goals: A new concept, lessons learned and challenges. Crit. Rev. Environ. Sci. Technol. 2022, 52, 2538–2581. [Google Scholar] [CrossRef]
  4. Yang, W.; Zhang, J.; Krebs, P. Low impact development practices mitigate urban flooding and non-point pollution under climate change. J. Clean. Prod. 2022, 347, 131320. [Google Scholar] [CrossRef]
  5. Putri, F.K.; Hidayah, E.; Ma’ruf, M.F. Enhancing stormwater management with low impact development (LID): A review of the rain barrel, bioretention, and permeable pavement applicability in Indonesia. Water Sci. Technol. 2023, 87, 2345–2361. [Google Scholar] [CrossRef] [PubMed]
  6. Nowogoński, I. Runoff volume reduction using green infrastructure. Land 2021, 10, 297. [Google Scholar] [CrossRef]
  7. Si, S.; Li, J.; Jiang, Y.; Wang, Y.; Liu, L. The response of runoff pollution control to initial runoff volume capture in sponge city construction using SWMM. Appl. Sci. 2022, 12, 5617. [Google Scholar] [CrossRef]
  8. Yu, Y.; Zhou, Y.; Guo, Z.; van Duin, B.; Zhang, W. A new LID spatial allocation optimization system at neighborhood scale: Integrated SWMM with PICEA-g using MATLAB as the platform. Sci. Total Environ. 2022, 831, 154843. [Google Scholar] [CrossRef]
  9. Hou, X.; Qin, L.; Xue, X.; Xu, S.; Yang, Y.; Liu, X.; Li, M. A city-scale fully controlled system for stormwater management: Consideration of flooding, non-point source pollution and sewer overflow pollution. J. Hydrol. 2021, 603, 127155. [Google Scholar] [CrossRef]
  10. Kong, Z.; Shao, Z.; Shen, Y.; Zhang, X.; Chen, M.; Yuan, Y.; Li, G.; Wei, Y.; Hu, X.; Huang, Y.; et al. Comprehensive evaluation of stormwater pollutants characteristics, purification process and environmental impact after low impact development practices. J. Clean. Prod. 2021, 278, 123509. [Google Scholar] [CrossRef]
  11. Gao, Z.; Zhang, Q.; Li, J.; Wang, Y.; Dzakpasu, M.; Wang, X.C. First flush stormwater pollution in urban catchments: A review of its characterization and quantification towards optimization of control measures. J. Environ. Manag. 2023, 340, 117976. [Google Scholar] [CrossRef]
  12. Li, L.; Davis, A.P. Urban stormwater runoff nitrogen composition and fate in bioretention systems. Environ. Sci. Technol. 2014, 48, 3403–3410. [Google Scholar] [CrossRef] [PubMed]
  13. Fletcher, T.D.; Shuster, W.; Hunt, W.F.; Ashley, R.; Butler, D.; Arthur, S.; Trowsdale, S.; Barraud, S.; Semadeni-Davies, A.; Bertrand-Krajewski, J.-L.; et al. SUDS, LID, BMPs, WSUD and more—The evolution and application of terminology surrounding urban drainage. Urban Water J. 2015, 12, 525–542. [Google Scholar] [CrossRef]
  14. Xia, J.; Zhang, Y.; Xiong, L.; He, S.; Wang, L.; Yu, Z. Opportunities and challenges of the Sponge City construction related to urban water issues in China. Sci. China Earth Sci. 2017, 60, 652–658. [Google Scholar] [CrossRef]
  15. Li, X.; Li, J.; Fang, X.; Gong, Y.; Wang, W. Case studies of the sponge city program in China. In Proceedings of the World Environmental and Water Resources Congress 2016, West Palm Beach, FL, USA, 22–26 May 2016; pp. 295–308. [Google Scholar]
  16. Liang, C.; Zhang, X.; Xu, J.; Pan, G.; Wang, Y. An integrated framework to select resilient and sustainable sponge city design schemes for robust decision making. Ecol. Indic. 2020, 119, 106810. [Google Scholar] [CrossRef]
  17. Xu, Z.; Li, P.; Cheng, T. LID optimization layout facilities in sponge city: A case study of Huangtaiqiao catchment in Jinan City. South–North Water Transf. Water Sci. Technol. 2022, 20, 552–562. [Google Scholar]
  18. Tang, S.; Jiang, J.; Shamseldin, A.Y.; Shi, H.; Wang, X.; Shang, F.; Wang, S.; Zheng, Y. Comprehensive optimization framework for low impact development facility layout design with cost–benefit analysis: A case study in Shenzhen city, China. Acs EsT Water 2021, 2, 63–74. [Google Scholar] [CrossRef]
  19. Wang, H.; Zeng, P.; Liu, Z.; Li, W.; Zhou, J. Optimization of LID strategies for urban CSO reduction and cost efficiency: A beijing case study. Water 2024, 16, 965. [Google Scholar] [CrossRef]
  20. Liberalesso, T.; Cruz, C.O.; Silva, C.M.; Manso, M. Green infrastructure and public policies: An international review of green roofs and green walls incentives. Land Use Policy 2020, 96, 104693. [Google Scholar] [CrossRef]
  21. Houle, J.J.; Roseen, R.M.; Ballestero, T.P.; Puls, T.A.; Sherrard, J., Jr. Comparison of maintenance cost, labor demands, and system performance for LID and conventional stormwater management. J. Environ. Eng. 2013, 139, 932–938. [Google Scholar] [CrossRef]
  22. Liu, S.; Pan, R.; Chen, X.; Xue, Z.; Zhang, Y.; Cao, Z. A comprehensive evaluation method of cost-effectiveness of LID facilities in sponge city based on the life cycle. Water Conserv. Sci. Eng. 2024, 9, 84. [Google Scholar] [CrossRef]
  23. Eisenberg, B. Design, engineering, installation, and O&M considerations for incorporating stormwater low impact development (LID) practices in urban, suburban, rural, and brownfield sites. In Low Impact Development for Urban Ecosystem and Habitat Protection; ASCE: Reston, VA, USA, 2009; pp. 1–10. [Google Scholar]
  24. Xie, Y.; Wang, H.; Wang, K.; Ge, X.; Ying, X. The application and potential of multi-objective optimization algorithms in decision-making for LID facilities layout. Water Resour. Manag. 2024, 38, 5403–5417. [Google Scholar] [CrossRef]
  25. Liao, K.-H. The socio-ecological practice of building blue-green infrastructure in high-density cities: What does the ABC Waters Program in Singapore tell us? Socio-Ecol. Pract. Res. 2019, 1, 67–81. [Google Scholar] [CrossRef]
  26. Li, J.; Yao, Y.; Ma, M.; Li, Y.; Xia, J.; Gao, X. A multi-index evaluation system for identifying the optimal configuration of LID facilities in the newly built and built-up urban areas. Water Resour. Manag. 2021, 35, 2129–2147. [Google Scholar] [CrossRef]
  27. Li, Y.; Huang, J.J.; Hu, M.; Yang, H.; Tanaka, K. Design of low impact development in the urban context considering hydrological performance and life-cycle cost. J. Flood Risk Manag. 2020, 13, e12625. [Google Scholar] [CrossRef]
  28. Liu, Q.; Cui, W.; Tian, Z.; Tang, Y.; Tillotson, M.; Liu, J. Stormwater management modeling in “Sponge City” construction: Current state and future directions. Front. Environ. Sci. 2022, 9, 816093. [Google Scholar] [CrossRef]
  29. Behrouz, M.S.; Zhu, Z.; Matott, L.S.; Rabideau, A.J. A new tool for automatic calibration of the Storm Water Management Model (SWMM). J. Hydrol. 2020, 581, 124436. [Google Scholar] [CrossRef]
  30. Gironás, J.; Roesner, L.A.; Rossman, L.A.; Davis, J. A new applications manual for the storm water management model (SWMM). Environ. Model. Softw. 2010, 25, 813–814. [Google Scholar] [CrossRef]
  31. Maglia, N.; Raimondi, A. A new approach on design and verification of integrated sustainable urban drainage systems for stormwater management in urban areas. J. Environ. Manag. 2025, 373, 123882. [Google Scholar] [CrossRef]
  32. Wang, J.; Wang, J.; Cao, S.; Li, C.; Zhang, S.; Guo, Y. A framework for quantifying stormwater control measures’ hydrologic performance with analytical stochastic models. Water Resour. Manag. 2024, 38, 5385–5402. [Google Scholar] [CrossRef]
  33. Cao, S.; Jia, J.; Wang, J.; Diao, Y.; Liu, Y.; Guo, Y. Development of an analytical permeable pavement model for vehicular access areas. Sci. Total Environ. 2023, 883, 163686. [Google Scholar] [CrossRef] [PubMed]
  34. Zeng, J.; Huang, G.; Mai, Y.; Chen, W. Optimizing the cost-effectiveness of low impact development (LID) practices using an analytical probabilistic approach. Urban Water J. 2020, 17, 136–143. [Google Scholar] [CrossRef]
  35. Lord, S.A.; Ghasabsaraei, M.H.; Movahedinia, M.; Shahdany, S.M.H.; Roozbahani, A. Redesign of stormwater collection canal based on flood exceedance probability using the ant colony optimization: Study area of eastern Tehran metropolis. Water Sci. Technol. 2021, 84, 820–839. [Google Scholar] [CrossRef]
  36. Taghizadeh, S.; Khani, S.; Rajaee, T. Hybrid SWMM and particle swarm optimization model for urban runoff water quality control by using green infrastructures (LID-BMPs). Urban For. Urban Green. 2021, 60, 127032. [Google Scholar] [CrossRef]
  37. Huang, J.J.; Xiao, M.; Li, Y.; Yan, R.; Zhang, Q.; Sun, Y.; Zhao, T. The optimization of Low Impact Development placement considering life cycle cost using Genetic Algorithm. J. Environ. Manag. 2022, 309, 114700. [Google Scholar] [CrossRef]
  38. Zhang, X.; Jia, H. Low impact development planning through a comprehensive optimization framework: Current gaps and future perspectives. Resour. Conserv. Recycl. 2023, 190, 106861. [Google Scholar] [CrossRef]
  39. Wang, M.; Jiang, Z.; Zhang, D.; Zhang, Y.; Liu, M.; Rao, Q.; Li, J.; Tan, S.K. Optimization of integrating life cycle cost and systematic resilience for grey-green stormwater infrastructure. Sustain. Cities Soc. 2023, 90, 104379. [Google Scholar] [CrossRef]
  40. Ren, Y.; Zhang, H.; Wang, X.; Gu, Z.; Fu, L.; Cheng, Y. Optimized design of sponge-type comprehensive pipe corridor rainwater chamber based on NSGA-III algorithm. Water 2023, 15, 3319. [Google Scholar] [CrossRef]
  41. Ooi, J.; Promentilla, M.A.B.; Tan, R.R.; Ng, D.K.; Chemmangattuvalappil, N.G. A systematic methodology for multi-objective molecular design via analytic hierarchy process. Process Saf. Environ. Prot. 2017, 111, 663–677. [Google Scholar] [CrossRef]
  42. Gulshad, K.; Szydłowski, M.; Yaseen, A.; Aslam, R.W. A comparative analysis of methods and tools for low impact development (LID) site selection. J. Environ. Manag. 2024, 354, 120212. [Google Scholar] [CrossRef]
  43. Gu, Y.; Zhao, J.; Herzog, T.; Mao, Q.; Latz, P. Exploring the space use mechanism of high-density campus in urban Beijing. Habitat Int. 2019, 91, 102024. [Google Scholar] [CrossRef]
  44. Yang, B.; Zhang, T.; Li, J.; Feng, P.; Miao, Y. Optimal designs of LID based on LID experiments and SWMM for a small-scale community in Tianjin, north China. J. Environ. Manag. 2023, 334, 117442. [Google Scholar] [CrossRef] [PubMed]
  45. Elliott, A.; Trowsdale, S.A. A review of models for low impact urban stormwater drainage. Environ. Model. Softw. 2007, 22, 394–405. [Google Scholar] [CrossRef]
  46. Jia, H.; Wang, Z.; Zhen, X.; Clar, M.; Yu, S.L. China’s sponge city construction: A discussion on technical approaches. Front. Environ. Sci. Eng. 2017, 11, 18. [Google Scholar] [CrossRef]
  47. China Ministry of Housing and Urban-Rural Construction (MHURC). Technical Guidelines on Sponge City Construction—Low Impact Development STORMWATER Management System (Trial); China Ministry of Housing and Urban-Rural Construction: Beijing, China, 2014.
  48. Cui, T.; Long, Y.; Wang, Y. Choosing the LID for urban storm management in the south of taiyuan basin by comparing the storm water reduction efficiency. Water 2019, 11, 2583. [Google Scholar] [CrossRef]
  49. Taiyuan Municipal People’s Congress Standing Committee. Taiyuan Sponge City Construction Management Regulations. promulgated on 4 December 2019, effective from 1 January 2020. Available online: https://flk.npc.gov.cn/detail2.html?ZmY4MDgwODE2ZmJjNTdjMTAxNzEyOTZmZDI1ODNiNmI (accessed on 2 July 2025). (In Chinese)
  50. Rossman, L.A.; Simon, M. Storm Water Management Model (SWMM) User’s Manual; Version 5.2.; U.S. Environmental Protection Agency; Office of Research and Development; Center for Environmental Solutions and Emergency Response: Cincinnati, OH, USA, 2022.
  51. Mu, D.; Luo, P.; Lyu, J.; Zhou, M.; Huo, A.; Duan, W.; Nover, D.; He, B.; Zhao, X. Impact of temporal rainfall patterns on flash floods in Hue City, Vietnam. J. Flood Risk Manag. 2021, 14, e12668. [Google Scholar] [CrossRef]
  52. Cao, K. Optimization Design of a Sponge Campus Based on the SWMM Model: A Case Study of Shanxi Agricultural University. Master’s Thesis, Shanxi Agricultural University, Jinzhong, China, 2022. [Google Scholar]
  53. Mu, D. Runoff Response Characteristics of Urban LID Construction in the Gullied Region of the Loess Plateau. Master’s Thesis, Chang’an University, Xi’an, China, 2019. [Google Scholar]
  54. Shanxi Urban and Rural Planning and Design Institute Co., Ltd.; Beijing University of Civil Engineering and Architecture. Standard for Technology of Sponge City; Shanxi Provincial Department of Housing and Urban-Rural Development: Taiyuan, China, 2025.
  55. Shi, L.-M.; Zhou, Y.; Sun, T.-R.; Zhao, C.; Lu, Z.-S.; Zhou, H.; Liu, J. The spatial allocative optimization of LID facilities based on genetic algorithm. China Rural Water Hydropower 2024, 5, 105–112+121. [Google Scholar]
  56. Wang, Q.; Wang, L.; Huang, W.; Wang, Z.; Liu, S.; Savić, D.A. Parameterization of NSGA-II for the optimal design of water distribution systems. Water 2019, 11, 971. [Google Scholar] [CrossRef]
  57. The Ministry of Housing and Construction. Urban Public Facilities Cost Index Case; China Planning Press: Beijing, China, 2019; ISBN 978-7-5182-1013-8. [Google Scholar]
  58. Xu, J.; Dai, J.; Wu, X.; Wu, S.; Zhang, Y.; Wang, F.; Gao, A.; Tan, Y. Urban rainwater utilization: A review of management modes and harvesting systems. Front. Environ. Sci. 2023, 11, 1025665. [Google Scholar] [CrossRef]
  59. Kuruppu, U.; Rahman, A.; Rahman, M.A. Permeable pavement as a stormwater best management practice: A review and discussion. Environ. Earth Sci. 2019, 78, 327. [Google Scholar] [CrossRef]
  60. Tang, S.; Luo, W.; Jia, Z.; Liu, W.; Li, S.; Wu, Y. Evaluating retention capacity of infiltration rain gardens and their potential effect on urban stormwater management in the sub-humid loess region of China. Water Resour. Manag. 2016, 30, 983–1000. [Google Scholar] [CrossRef]
  61. Zhang, B.; Xie, G.; Zhang, C.; Zhang, J. The economic benefits of rainwater-runoff reduction by urban green spaces: A case study in Beijing, China. J. Environ. Manag. 2012, 100, 65–71. [Google Scholar] [CrossRef] [PubMed]
  62. Andenæs, E.; Kvande, T.; Muthanna, T.M.; Lohne, J. Performance of blue-green roofs in cold climates: A scoping review. Buildings 2018, 8, 55. [Google Scholar] [CrossRef]
  63. Stovin, V.; Vesuviano, G.; Kasmin, H. The hydrological performance of a green roof test bed under UK climatic conditions. J. Hydrol. 2012, 414, 148–161. [Google Scholar] [CrossRef]
  64. Rong, G.; Hu, L.; Wang, X.; Jiang, H.; Gan, D.; Li, S. Simulation and evaluation of low-impact development practices in university construction: A case study of Anhui University of Science and Technology. J. Clean. Prod. 2021, 294, 126232. [Google Scholar] [CrossRef]
  65. Ryan, R.L. Green infrastructure planning on campus: Case studies from university of Massachusetts–Amherst. J. Green Build. 2018, 13, 145–157. [Google Scholar] [CrossRef]
  66. Eckart, K.; McPhee, Z.; Bolisetti, T. Multiobjective optimization of low impact development stormwater controls. J. Hydrol. 2018, 562, 564–576. [Google Scholar] [CrossRef]
  67. Li, S.; Wang, Z.; Wu, X.; Zeng, Z.; Shen, P.; Lai, C. A novel spatial optimization approach for the cost-effectiveness improvement of LID practices based on SWMM-FTC. J. Environ. Manag. 2022, 307, 114574. [Google Scholar] [CrossRef]
  68. Parikh, P.; Taylor, M.A.; Hoagland, T.; Thurston, H.; Shuster, W. Application of market mechanisms and incentives to reduce stormwater runoff: An integrated hydrologic, economic and legal approach. Environ. Sci. Policy 2005, 8, 133–144. [Google Scholar] [CrossRef]
  69. Liao, Z.; Chen, H.; Huang, F.; Li, H. Cost–effectiveness analysis on LID measures of a highly urbanized area. Desalination Water Treat. 2015, 56, 2817–2823. [Google Scholar] [CrossRef]
  70. Zhang, X.; Chen, L.; Guo, C.; Jia, H.; Shen, Z. Two-scale optimal management of urban runoff by linking LIDs and landscape configuration. J. Hydrol. 2023, 620, 129332. [Google Scholar] [CrossRef]
  71. Lopes, M.D.; da Silva, G.B.L. An efficient simulation-optimization approach based on genetic algorithms and hydrologic modeling to assist in identifying optimal low impact development designs. Landsc. Urban Plan. 2021, 216, 104251. [Google Scholar] [CrossRef]
  72. Lee, H.; Kim, H.; Kim, J.; Jun, S.-M.; Hwang, S.; Song, J.-H.; Kang, M.-S. Analysis of the effects of low impact development practices on hydrological components using HSPF. J. Hydro-Environ. Res. 2023, 46, 72–85. [Google Scholar] [CrossRef]
  73. Pokhrel, S.R.; Chhipi-Shrestha, G.; Hewage, K.; Sadiq, R. Sustainable, resilient, and reliable urban water systems: Making the case for a “one water” approach. Environ. Rev. 2022, 30, 10–29. [Google Scholar] [CrossRef]
  74. Kaykhosravi, S.; Abogadil, K.; Khan, U.T.; Jadidi, M.A. The low-impact development demand index: A new approach to identifying locations for LID. Water 2019, 11, 2341. [Google Scholar] [CrossRef]
  75. Wiwoho, J.; Suryanto, S.; Murtanti, M.; Nugraha, S. The management of the water as an effort to realize a green campus in universitas sebelas maret surakarta. J. Sustain. Perspect. 2021, 1, 225–231. [Google Scholar] [CrossRef]
  76. de Oliveira, J.A.P.; Bellezoni, R.A.; Shih, W.; Bayulken, B. Innovations in urban green and blue infrastructure: Tackling local and global challenges in cities. J. Clean. Prod. 2022, 362, 132355. [Google Scholar] [CrossRef]
  77. Pauleit, S.; Hansen, R.; Rall, E.L.; Zölch, T.; Andersson, E.; Luz, A.C.; Szaraz, L.; Tosics, I.; Vierikko, K. Urban landscapes and green infrastructure. In Oxford Research Encyclopedia of Environmental Science; Oxford University Press: Oxford, UK, 2017. [Google Scholar]
  78. Turner, V.K. Obstacles to developing sustainable cities: The real estate rigidity trap. Ecol. Soc. 2017, 22, 1–14. [Google Scholar] [CrossRef]
  79. Li, L.; Collins, A.M.; Cheshmehzangi, A.; Chan, F.K.S. Identifying enablers and barriers to the implementation of the Green Infrastructure for urban flood management: A comparative analysis of the UK and China. Urban For. Urban Green. 2020, 54, 126770. [Google Scholar] [CrossRef]
  80. Ishaq, S.; Hewage, K.; Farooq, S.; Sadiq, R. State of provincial regulations and guidelines to promote low impact development (LID) alternatives across Canada: Content analysis and comparative assessment. J. Environ. Manag. 2019, 235, 389–402. [Google Scholar] [CrossRef]
  81. Novaes, C.; Marques, R. Attracting the private sector to urban stormwater: A feasible task or just a pipe dream? Water 2022, 14, 2164. [Google Scholar] [CrossRef]
  82. Nguyen, T.T.; Ngo, H.H.; Guo, W.; Wang, X.C.; Ren, N.; Li, G.; Ding, J.; Liang, H. Implementation of a specific urban water management-Sponge City. Sci. Total Environ. 2019, 652, 147–162. [Google Scholar] [CrossRef] [PubMed]
  83. Church, S.P. Exploring Green Streets and rain gardens as instances of small scale nature and environmental learning tools. Landsc. Urban Plan. 2015, 134, 229–240. [Google Scholar] [CrossRef]
  84. Echols, S.; Pennypacker, E. From stormwater management to artful rainwater design. Landsc. J. 2008, 27, 268–290. [Google Scholar] [CrossRef]
  85. Saeedi, I.; Goodarzi, M. Rainwater harvesting system: A sustainable method for landscape development in semiarid regions, the case of Malayer University campus in Iran. Environ. Dev. Sustain. 2020, 22, 1579–1598. [Google Scholar] [CrossRef]
  86. Wu, J.Y.L. Evolving landscape education: Reform measures for mixed teaching in ecological landscape design. Glob. J. Educ. Learn. 2022, 10, 17–23. [Google Scholar]
Figure 1. Scope of the study area.
Land 14 01434 g001
Figure 2. Technical route.
Land 14 01434 g002
Figure 3. Multi-period cost–runoff relationships and Pareto frontier analysis.
Land 14 01434 g003
Figure 4. Sub-benefits and comprehensive benefits evaluation of LID programs.
Land 14 01434 g004
Figure 5. Comparison and distributional characterization of different scenarios based on investment costs.
Land 14 01434 g005
Figure 6. Analysis of the best solution with LID multi-objective optimization.
Land 14 01434 g006
Table 1. Proportions of areas for individual LID settings.
Regional DivisionArea (hm2)LIDMaximum Percentage of LID SettingsLand Area (hm2)
Building roofs12.23green roof50%6.12
Hardened roads14.27permeable pavement65%9.27
public centerCentralized green space6.12rain garden50%3.06
Road greening and
decentralized green space
8.16sunken green space50%3.08
Table 2. LID parameters.
LayerParameterUnitGreen RoofPermeable PavementRain
Garden
Sunken Green Space
SurfaceBerm Heightmm5020200150
Vegetation Volume Fraction%0.1-0.30.2
Surface Roughness-0.150.010.40.3
Surface Slope%2121
PavementThicknessmm-100--
Permeabilitymm/h-500--
SoilThicknessmm100150300300
Porosity%0.450.350.40.35
Hydraulic Conductivity (k)mm/h15030050100
StorageThicknessmm----
Void Ratio%----
Seepage ratemm/h----
Table 3. LID cost breakdown.
LID (USDs/m2)Labor CostMaterial CostMachinery CostsComposite FeeTotal
green roof4.1120.183.358.4436.08
sunken green space3.097.133.397.0220.63
permeable pavement5.878.966.667.0028.49
rain garden5.6824.846.3819.3656.26
Table 4. Runoff reduction rates for single LID arrangements at different scales.
Type of LIDRatio
Setting (%)
Cost (USD Million)Reduction
Rate (%)
Cost-Effectiveness
Values
green roof2088.266.90.011
35154.511.9
50220.6514.7
permeable pavement2081.328.10.013
35142.3014.5
50203.3018.3
65264.2819.4
rain garden2068.862.80.005
35120.525.1
50172.167.2
sunken green space2033.377.30.029
3558.9314.7
5084.1815.6
Table 5. Integrated benefit evaluation system and its weights.
Indicator LayerWeightingFactor LevelWeighting
Combined
benefits
environmental
benefit
0.2540Total runoff reduction0.1838
Water quality improvement0.1671
Air quality improvement 0.1003
Carbon sequestration0.0468
Biodiversity0.2133
Temperature regulation0.1536
Humidity regulation0.1351
economic
benefit
0.2656Water cost savings0.2389
Input cost savings0.4412
Operation and maintenance costs0.3199
social
benefit
0.3476Contribution to research0.2113
Student health impacts0.4469
Effectiveness of public education0.3418
technical
benefits
0.1328Technical feasibility0.2180
Technical operability0.3751
Technology replicability0.4069
Disclaimer/Publisher’s Note: The statements, opinions and data contained in all publications are solely those of the individual author(s) and contributor(s) and not of MDPI and/or the editor(s). MDPI and/or the editor(s) disclaim responsibility for any injury to people or property resulting from any ideas, methods, instructions or products referred to in the content.

