Article

Parcel Segmentation Method Combined YOLOV5s and Segment Anything Model Using Remote Sensing Image

by
Xiaoqin Wu
1,2,
Dacheng Wang
2,
Caihong Ma
2,*,
Yi Zeng
1,
Yongze Lv
1,2,
Xianmiao Huang
1,2 and
Jiandong Wang
1,2
1
College of Information, Beijing Forestry University, Beijing 100091, China
2
Aerospace Information Research Institute, Chinese Academy of Sciences, Beijing 100094, China
*
Author to whom correspondence should be addressed.
Land 2025, 14(7), 1429; https://doi.org/10.3390/land14071429
Submission received: 21 April 2025 / Revised: 18 June 2025 / Accepted: 28 June 2025 / Published: 8 July 2025

Abstract

Accurate land parcel segmentation in remote sensing imagery is critical for applications such as land use analysis, agricultural monitoring, and urban planning. However, existing methods often underperform in complex scenes due to small-object segmentation challenges, blurred boundaries, and background interference, often influenced by sensor resolution and atmospheric variation. To address these limitations, we propose a dual-stage framework that combines an enhanced YOLOv5s detector with the Segment Anything Model (SAM) to improve segmentation accuracy and robustness. The improved YOLOv5s module integrates Efficient Channel Attention (ECA) and BiFPN to boost feature extraction and small-object recognition, while Soft-NMS is used to reduce missed detections. The SAM module receives bounding-box prompts from YOLOv5s and incorporates morphological refinement and mask stability scoring for improved boundary continuity and mask quality. A composite Focal-Dice loss is applied to mitigate class imbalance. In addition to the publicly available CCF BDCI dataset, we constructed a new WuJiang dataset to evaluate cross-domain performance. Experimental results demonstrate that our method achieves an IoU of 89.8% and a precision of 90.2%, outperforming baseline models and showing strong generalizability across diverse remote sensing conditions.

1. Introduction

Parcel segmentation is crucial for land resource management, agricultural planning, environmental monitoring, and urban development [1]. Accurate delineation of land parcels enables efficient land use analysis, supports precision agriculture, and facilitates sustainable resource allocation. Remote sensing technology, with advantages in capturing large-scale and high-resolution imagery, has become an essential tool for parcel segmentation [2]. Moreover, advanced image analysis techniques improve the accuracy of parcel boundary identification and the speed of aiding decision-making in agriculture, national defense, and ecological conservation. It provides robust support for land resource management, environmental monitoring, food security, and defense logistics [3,4].
Traditional methods for parcel segmentation in remote-sensing images are classified into two approaches: edge detection and region segmentation [5]. Edge detection-based methods utilize edge detection operators (such as research by Roberts [6] and Laplacian [7]) to detect discontinuities between pixels. However, these methods only consider gradient information within small, local windows, rendering it challenging to avoid noise and disconnected boundaries in edge detection. Region segmentation-based methods, such as watershed segmentation [8] and multi-resolution segmentation [9], merge pixels within farmland based on homogeneity criteria. These methods often result in over-segmentation and struggle to establish consistent merging criteria for complex scenes. Due to variations in parcel shape, image resolution, and other factors, parcels manifest in diverse forms in remote-sensing images. Therefore, sole reliance on shallow information such as gradients or similarity for segmentation and extraction has significant limitations and is inadequate for complex scenes.
Deep learning methods have emerged as the primary research direction for parcel segmentation in remote-sensing images in recent years due to their robust feature representation capabilities and end-to-end learning mechanisms [10], including Fully Convolutional Networks (FCNs) [11], encoder–decoder architectures such as U-Net [12] and SegNet [13], dilated convolution-based methods like the DeepLab series of models [14,15,16], and attention-mechanism-based methods [17]. By optimizing network architectures and enhancing feature representation, these methods are capable of learning spatial boundaries, texture continuity, and shape variations of land parcels, which are difficult to capture using manually designed rules. This data-driven approach improves the model’s ability to distinguish parcels from visually similar background elements in complex remote sensing scenes. However, these methods still face limitations in practical applications. For instance, edge detection-based models [18] pioneered the extraction of parcel boundaries before segmentation. These methods rely on the model’s general boundary detection capabilities but often extract numerous irrelevant boundaries due to a lack of learning specific to the semantic features of parcel boundaries, thereby interfering with the final results. Additionally, issues such as poor segmentation of small objects in the DeepLab series of models due to the scarcity of semantic segmentation datasets are also major concerns.
While parcel segmentation is technically a form of semantic segmentation, it has distinct characteristics in remote sensing applications. Standard semantic segmentation aims to assign a class label to every pixel in an image (e.g., road, building, vegetation), whereas parcel segmentation focuses specifically on delineating the precise boundaries of land management units—such as agricultural fields or cadastral parcels—which often lack consistent texture, have fuzzy or non-linear borders, and do not necessarily conform to semantic object categories. This distinction necessitates specialized methods that can address boundary sensitivity, shape irregularity, and multi-scale spatial distribution.
Despite the advantages of deep learning, parcel segmentation in remote sensing imagery presents domain-specific challenges that distinguish it from general-purpose semantic segmentation tasks. Studies such as Hadir et al. [1] and Xu et al. [2] highlight the impact of background heterogeneity, where vegetation, roads, and water bodies may exhibit spectral similarities with parcel interiors, leading to segmentation ambiguity. In many agricultural or mountainous regions, parcel boundaries are also irregular, blurred, or discontinuous, making it difficult for edge-based and region-growing models to produce coherent outputs. Furthermore, the scale variation among parcels—ranging from densely packed micro-plots to large expansive fields—exacerbates the difficulty for models lacking adaptive multi-scale mechanisms. Remote sensing data also present diverse acquisition conditions, including varying spatial resolutions and illumination, which limit the generalization of models trained on datasets with clean, object-centric structures (e.g., COCO, Cityscapes). Therefore, conventional segmentation models often fail to capture the structural and contextual nuances required for accurate delineation of land parcels in geospatial settings. All datasets used in this study were spatially standardized and radiometrically corrected to reduce confounding factors related to image resolution or acquisition variability.
To address these challenges, a new parcel segmentation method combined YOLOv5s and Segment Anything Model (SAM) (called YOLOv5s_SAM model) using remote sensing images was proposed to optimize both target detection and semantic segmentation in this study. The enhanced YOLOv5s improves detection accuracy for complex parcels through optimized feature fusion and attention mechanisms. Meanwhile, SAM leverages its zero-shot generalization capability to achieve fine-grained parcel boundary segmentation, ensuring more precise and consistent results. By combining the strengths of object detection and semantic segmentation, the new method enhances the accuracy of parcel delineation, providing reliable technical support for agricultural resource management, ecological conservation, urban planning, and national defense logistics in food production assessment.
The main contributions of this study can be summarized as follows:
  • A two-part dataset was constructed with data filtering, annotation, normalization, and augmentation to ensure diversity in resolution, land parcel types, and background complexity, providing a reliable foundation for experimental research.
  • To improve the accuracy and robustness of remote-sensing parcel segmentation, YOLOv5s was optimized for object detection, and SAM was refined for semantic segmentation. A dual-stage collaborative segmentation framework was developed to address challenges such as small-object detection, boundary ambiguity, and complex background interference.
This study systematically investigates parcel segmentation in remote sensing images, encompassing background analysis, technical implementation, experimental validation, and result evaluation. The dissertation is organized into five chapters: Section 1 introduces the research background, significance, related work, and key challenges; Section 2 details dataset construction and focuses on the network architectures and optimization of YOLOv5s and SAM models; Section 3 outlines the experimental setup and evaluation metrics; Section 4 conducted comparative experiments and ablation experiments, and analyzed the experimental results; Section 5 summarizes the main contributions, findings, and limitations.

2. Materials and Methods

2.1. Dataset Creation and Preprocessing

2.1.1. CCF BDCI Dataset and Preprocessing

The 2020 CCF BDCI Remote Sensing Image Land Parcel Segmentation Dataset (https://www.datafountain.cn, accessed on 3 March 2022), specifically designed for land parcel boundary detection and segmentation tasks in remote sensing images, was utilized. It was provided by the “Big Data Challenge and Innovation Competition” jointly organized by the China Computer Federation (CCF) and Big Data & Computational Intelligence (BDCI). This dataset contains 140,000 images with sizes ranging from 1024 × 1024 pixels to 4096 × 4096 pixels. It covers agricultural and land use regions across different areas and is widely applied in remote sensing image analysis, land cover classification, and agricultural monitoring.
However, there were still some issues for parcel segmentation: (1) image sizes in the dataset were inconsistent, (2) not all images contained land parcels, with a rough estimate showing that 71% of the images had a land parcel area ratio greater than 1%, and (3) annotation data did not match the sample set and were incomplete. To address these issues, a high-quality land parcel dataset based on CCF BDCI dataset was constructed for parcel segmentation including selecting remote sensing images with distinct land parcel features, removing duplicates, eliminating images with uniform backgrounds or irrelevant categories, and performing annotation, format conversion, pixel adjustment, data augmentation, and dataset partitioning. Then, the final dataset consisted of 12,000 images, which were split into training, validation, and test sets at a ratio of 6:2:2, with 9600 images in the training set and 1200 images each in the validation and test sets.

2.1.2. WuJiang Datasets Preprocessing and Creation

WuJiang District, Suzhou City, Jiangsu Province, was our experimental area in this study. A new WuJiang land parcel segmentation dataset that used high-resolution (0.5 m) remote sensing images based on the Google Earth Engine platform was created in order to maintain the accuracy of parcel segmentation. High-resolution remote sensing images from February to December 2023 were selected to ensure data timeliness and representativeness. The WuJiang datasets, stored in GeoTIFF format (5000 × 5000 pixels, covering approximately 2.5 km × 2.5 km per image), were manually annotated and preprocessed to facilitate accurate land parcel recognition and segmentation.
The dataset creation process included annotation, preprocessing, augmentation, and partitioning, as outlined below: (1) Annotation: Using the LabelMe tool, binary classification was performed to label regions as either “land parcel” or “non-land parcel.” Bounding boxes were manually drawn to enclose parcel boundaries, with each image typically containing from 5 to 10 parcels. For irregularly shaped parcels, multiple bounding boxes were used to ensure annotation precision. To maintain labeling accuracy, multiple rounds of verification were conducted. The annotated data were saved in JSON format and subsequently converted into binary mask images using a Python script to facilitate deep learning model training. (2) Preprocessing and augmentation: The raw images underwent a series of preprocessing steps, starting with geometric correction to correct for terrain-induced distortions and ensure accurate spatial alignment. Following this, the images were reprojected to the WGS84 geographic coordinate system (latitude–longitude format) to ensure spatial consistency across datasets. Radiometric correction was then applied to mitigate atmospheric effects and normalize spectral reflectance across different acquisition periods. After these geospatial corrections, additional preprocessing steps—including cropping, affine transformation, noise reduction, and linear normalization—were performed to enhance image quality, standardize pixel values, and prepare the data for model training. To improve model generalization, data augmentation was performed using the Albumentations library [19], applying transformations such as random rotation, contrast adjustment, and Gaussian noise addition. These techniques expanded the dataset size from 3000 to 6000 image–mask pairs. (3) Dataset partitioning: The processed dataset was divided into training (70%, 4200 images), validation (15%, 900 images), and test (15%, 900 images) sets, ensuring a balanced and high-quality dataset for model development. A representative sample image from the dataset is shown in Figure 1.
To evaluate cross-dataset generalization and robustness, we also conducted a comparative analysis between the WuJiang and CCF BDCI datasets based on parcel shape, density, background complexity, and segmentation challenges. Table 1 provides a comparative analysis of the key attributes of both datasets.
The comparison illustrates that each dataset presents distinct segmentation challenges. The WuJiang dataset contains diverse terrain textures and densely packed small parcels, making fine-grained boundary extraction more difficult in complex backgrounds. In contrast, the CCF BDCI dataset features higher target density and frequent boundary ambiguity, increasing the risk of over- or under-segmentation.
Pixel-level analysis reveals inherent class imbalance: “land parcel” pixels account for approximately 16.8% in WuJiang and 12.6% in CCF BDCI, with the remaining majority being background. This imbalance reflects the nature of remote sensing imagery. Although filtered images emphasized annotation quality and visual clarity, no preference was given to parcel size or shape, minimizing selection bias.
Overall, the differences between these datasets underscore the importance of structural diversity and class balance in designing robust and generalizable segmentation models.

2.2. Technical Route

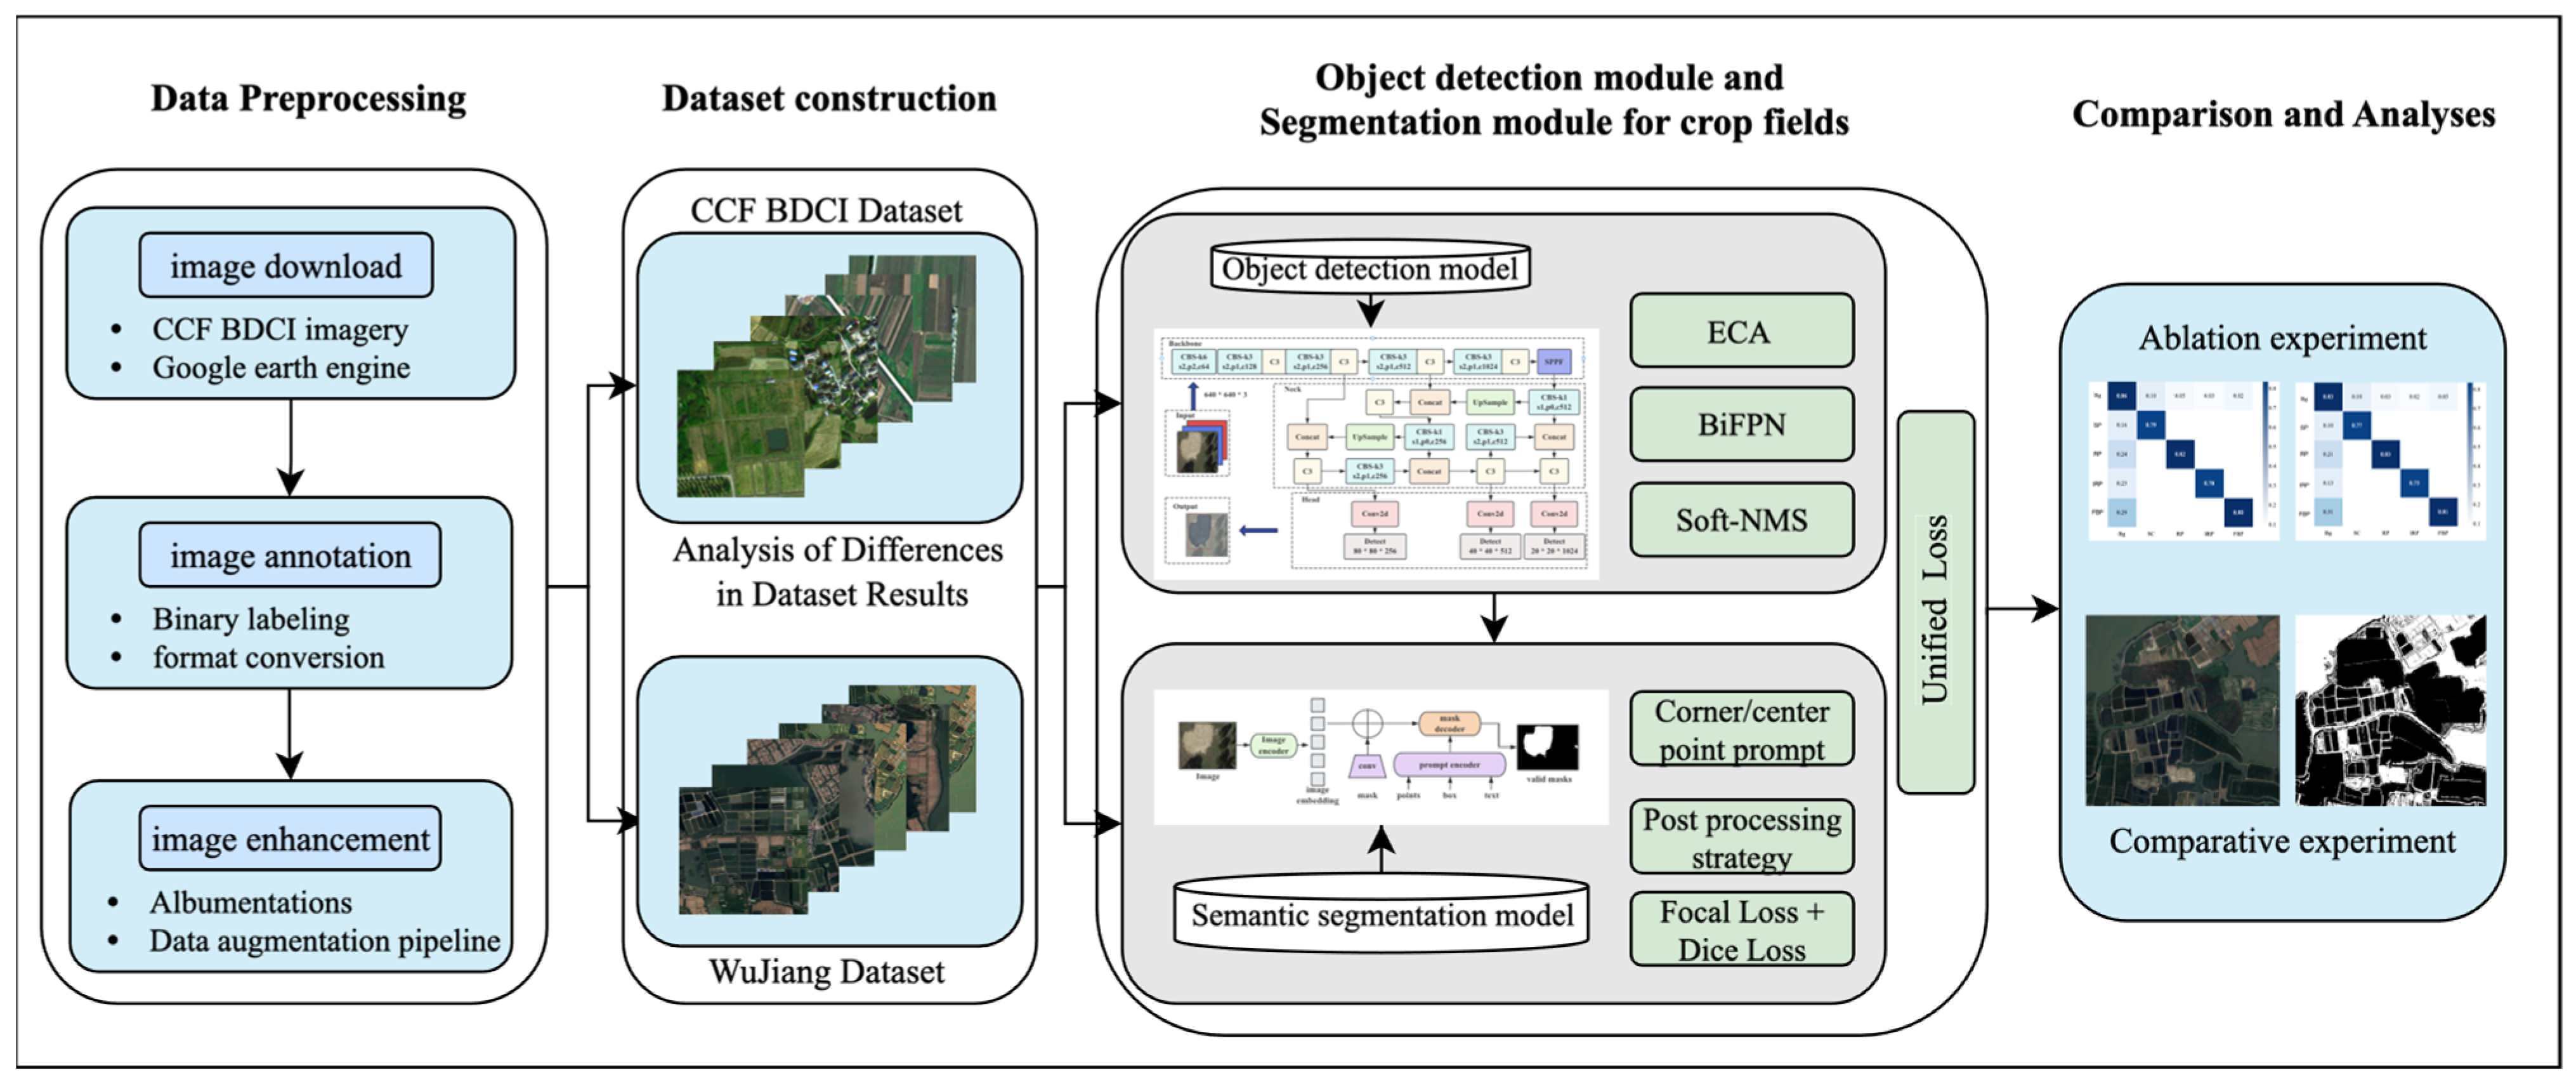
To improve the accuracy and robustness of remote sensing land parcel segmentation, this study develops the YOLOv5s_SAM model by optimizing YOLOv5s for object detection and SAM for semantic segmentation. A dual-stage collaborative segmentation framework is introduced to address key challenges, including small-object detection, boundary ambiguity, and complex background interference. It is mainly divided into the following three parts. Figure 2 shows the overall architecture diagram.
  • Data Preprocessing and Dataset construction: The improved YOLOv5s_SAM network was first trained using the constructed dataset and corresponding annotated labels. The training process focused on enhancing the model’s ability to detect and segment land parcels accurately in complex remote sensing images. To improve generalization and robustness, a series of stochastic augmentation strategies were applied during training. This comprehensive training strategy ensured that the YOLOv5s_SAM network achieved improved accuracy and stability across different datasets and real-world scenarios.
  • Object detection module and segmentation module for crop fields: A two-stage collaborative framework was adopted, integrating improvements in both the YOLOv5s and SAM components. First, the improved YOLOv5s module was optimized in terms of feature extraction, feature fusion, and the prediction phase with ECA, BiFPN, and soft-NMS algorithms based on YOLOv5s. These strategies enhanced the model’s ability to detect small land parcels and adapt to complex environments while maintaining its lightweight architecture. Then the improved SAM module was enhanced through refined input prompting and post-processing strategies. In combination with the detection module, it enabled fine-grained segmentation and accurate delineation of parcel boundaries. In addition, the model employs a specialized loss function composed of two parts: detection loss and segmentation loss. The total loss is calculated as a weighted sum of both components, ensuring balanced optimization during training. During the encoding process, feature representations were learned concurrently with lightweight object-level detection, enabling the extraction of high-level target features. This design allows the model to reduce its reliance on pixel-level annotated data while effectively leveraging object-level detection information to guide pixel-level segmentation. As a result, a hierarchical optimization is achieved—from object-level to pixel-level, and from macro-level structure to micro-level detail—enhancing the segmentation performance with improved efficiency and precision.
  • Comparison and analysis: Upon completing the segmentation process, the model produced pixel-level masks that accurately delineated land parcels. To further assess the effectiveness of the proposed method, both ablation studies and comparative experiments were conducted. The ablation study evaluated the impact of key components—such as the ECA attention module, BiFPN structure, and Soft-NMS—by progressively removing them from the model pipeline. Additionally, comparative experiments were performed against several state-of-the-art segmentation models, including DeepLabv3+, U-Net, and Mask R-CNN.

2.2.1. Improved YOLOV5s Module

YOLOv5s [20] is a lightweight single-stage object detection model that directly predicts bounding boxes and object categories from input images, eliminating the need for candidate region generation and classification. Its architecture consists of three key components: (1) Backbone Network—responsible for multi-level feature extraction using CBS (Convolution, Batch Normalization, and SiLU activation), C3 (local and global feature extraction via a dual-branch structure), and SPPF (Spatial Pyramid Pooling-Fast) to expand the receptive field through max pooling. (2) Neck Layer—enhances multi-scale feature fusion using the Feature Pyramid Network (FPN) and Path Aggregation Network (PAN). (3) Head Detection Layer—performs classification and regression, predicting object categories, bounding box coordinates, and confidence scores at multiple scales through three detection heads.
While YOLOv5s is designed to balance accuracy, speed, and computational efficiency, it faces several challenges, particularly in detecting small objects and adapting to complex scenes. To address these limitations, an improved Yolov5s model was proposed including three main enhancements in three key parts: (1) the Efficient Channel Attention (ECA) module was integrated to strengthen small-object perception and improve detection across different scales; (2) a Bi-directional Feature Pyramid Network (BiFPN) was adopted to enhance multi-scale feature fusion, improving the representation of small objects in cluttered backgrounds; and (3) Soft Non-Maximum Suppression (Soft-NMS) replaced traditional NMS to reduce incorrect suppression of bounding boxes, ensuring more accurate and stable detection results. The main flowcharts are shown in Figure 3.
  • Improvement of feature extraction using ECA algorithm
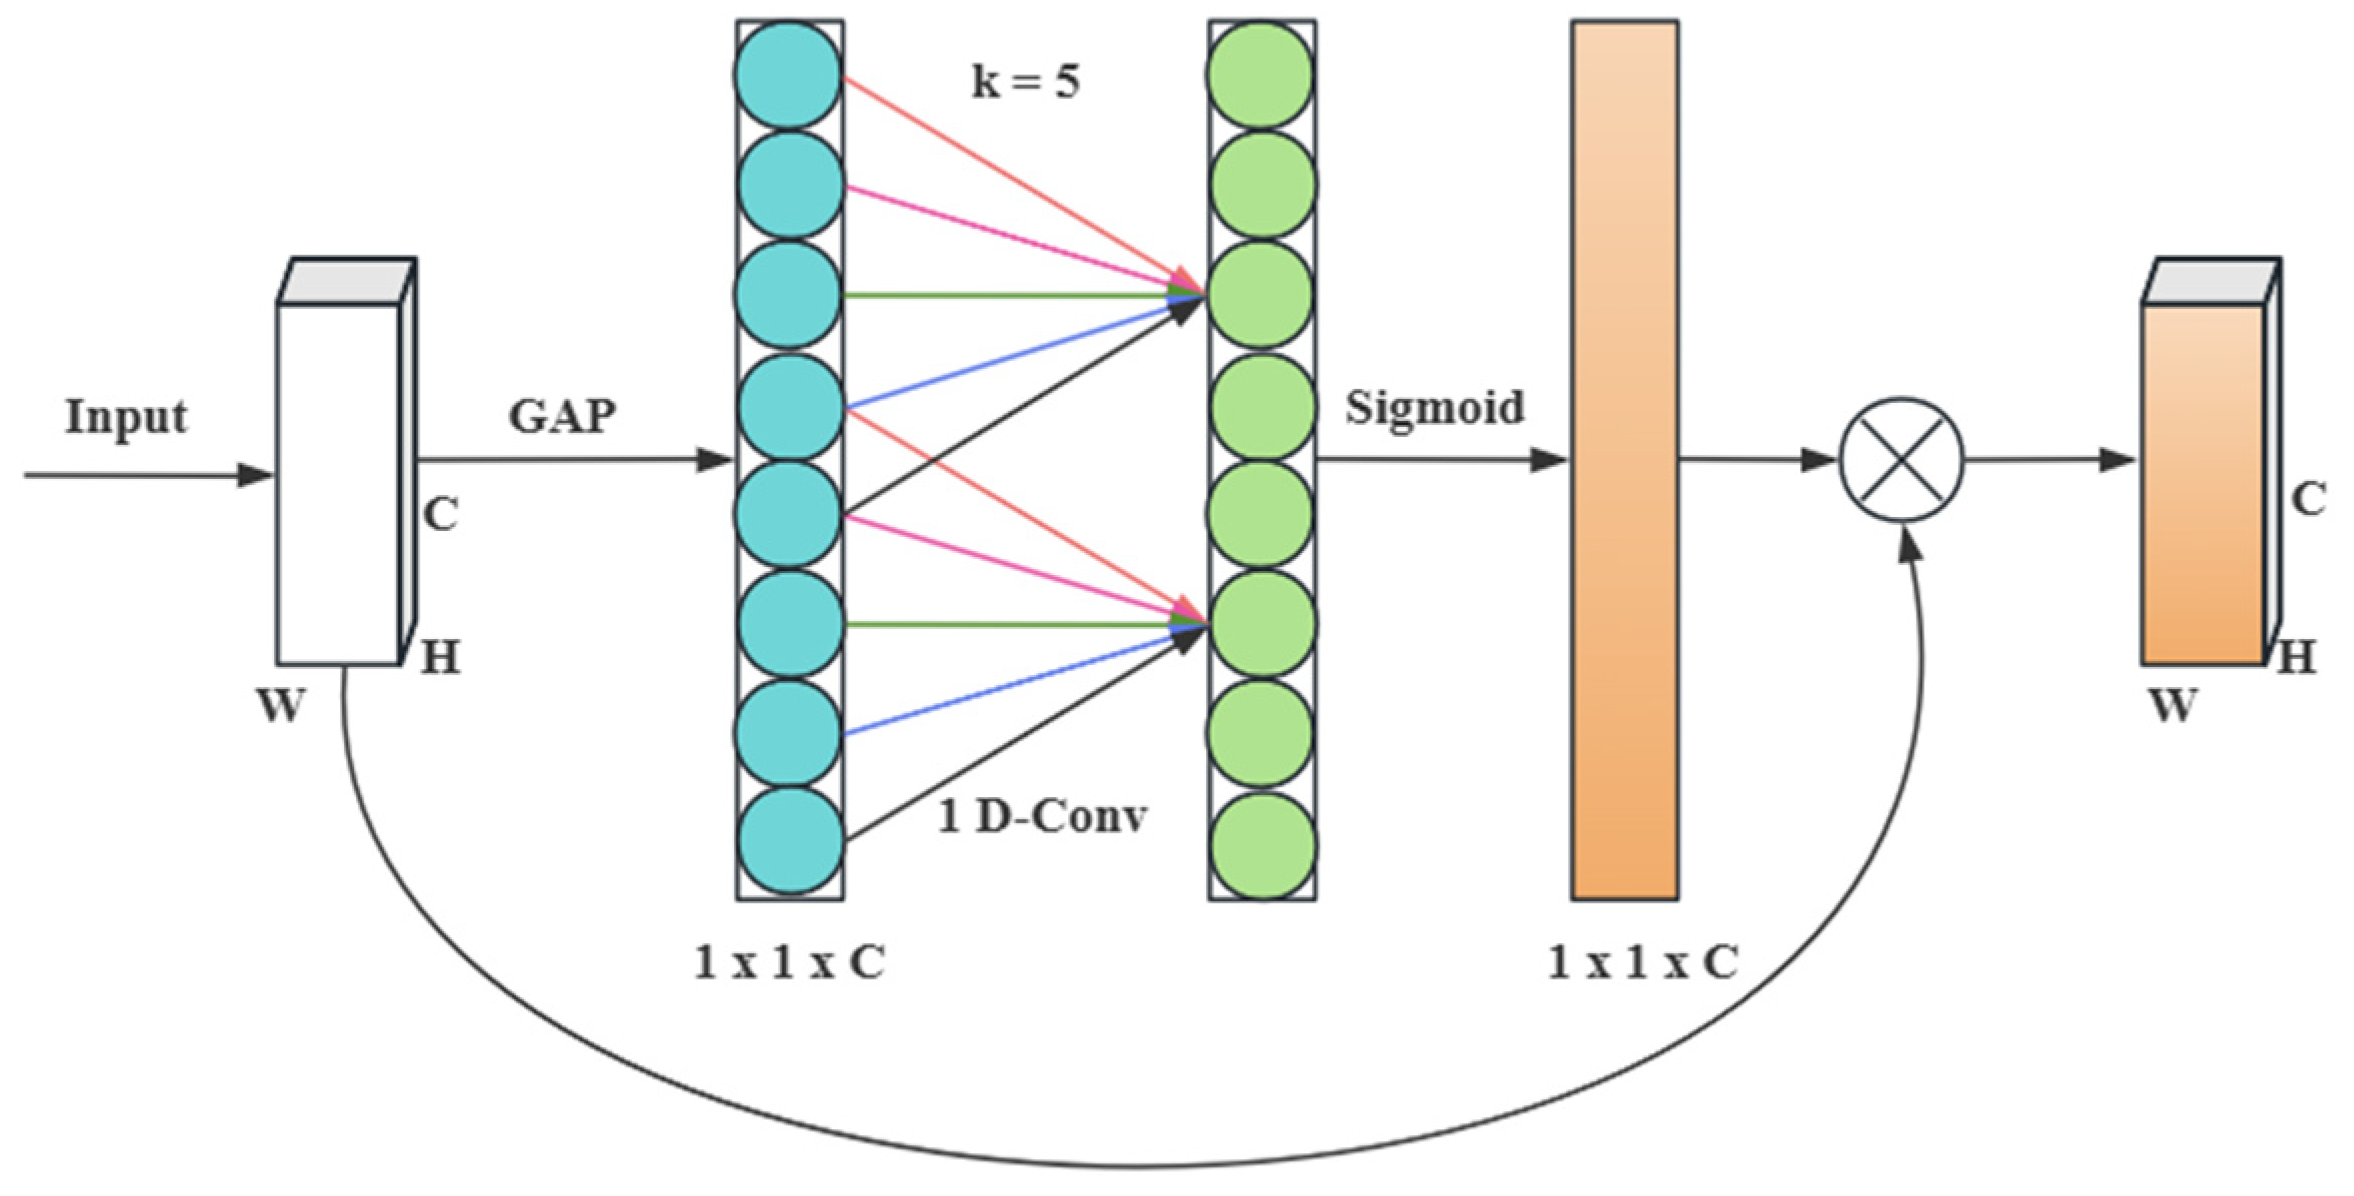
The features of plots in remote-sensing images are often subject to background complexity and irregular plot distribution. The original YOLOv5s model insufficiently utilizes channel features and has weak perception capabilities when capturing detailed features. To address this issue, the Efficient Channel Attention (ECA) [21] module is embedded. By adaptively allocating weights in the channel dimension, the module enhances the model’s ability to focus on significant features and capture critical details, particularly for small plot objects. Figure 4 shows the network structure of the ECA module.
In comparison to other attention mechanisms, such as Squeeze-and-Excitation Network (SE) [22] and Convolutional Block Attention Module (CBAM) [23], ECA achieves channel attention computation through a simple 1D convolution in a parameter-free and locally interactive manner. This approach neither significantly increases computational overhead nor affects inference speed, ensuring model efficiency while improving detection accuracy. Figure 2 illustrates the ECA module, which consists of four parts: a global average pooling layer, a 1D convolution layer, a Sigmoid activation layer, and a multiplication layer. The input has dimensions of (H, W, C). Through global average pooling, a band matrix of size k learns feature weights. Subsequently, the Sigmoid activation function outputs the weight matrix, which is multiplied by the input to yield the final result.
In the improved model, ECA is embedded after the shallow C3 module in the backbone network to enhance the capture of small objects and boundary information. Additionally, ECA is added after the SPPF module to expand the receptive field and redistribute channel weights, compensating for the dilution of channel information by pooling operations and ensuring the effective expression of key information in global features. These improvements enhance the model’s capabilities in multi-scale feature extraction and detailed feature capture.
2
Improvement feature fusion combined FPN and BiFPN algorithms
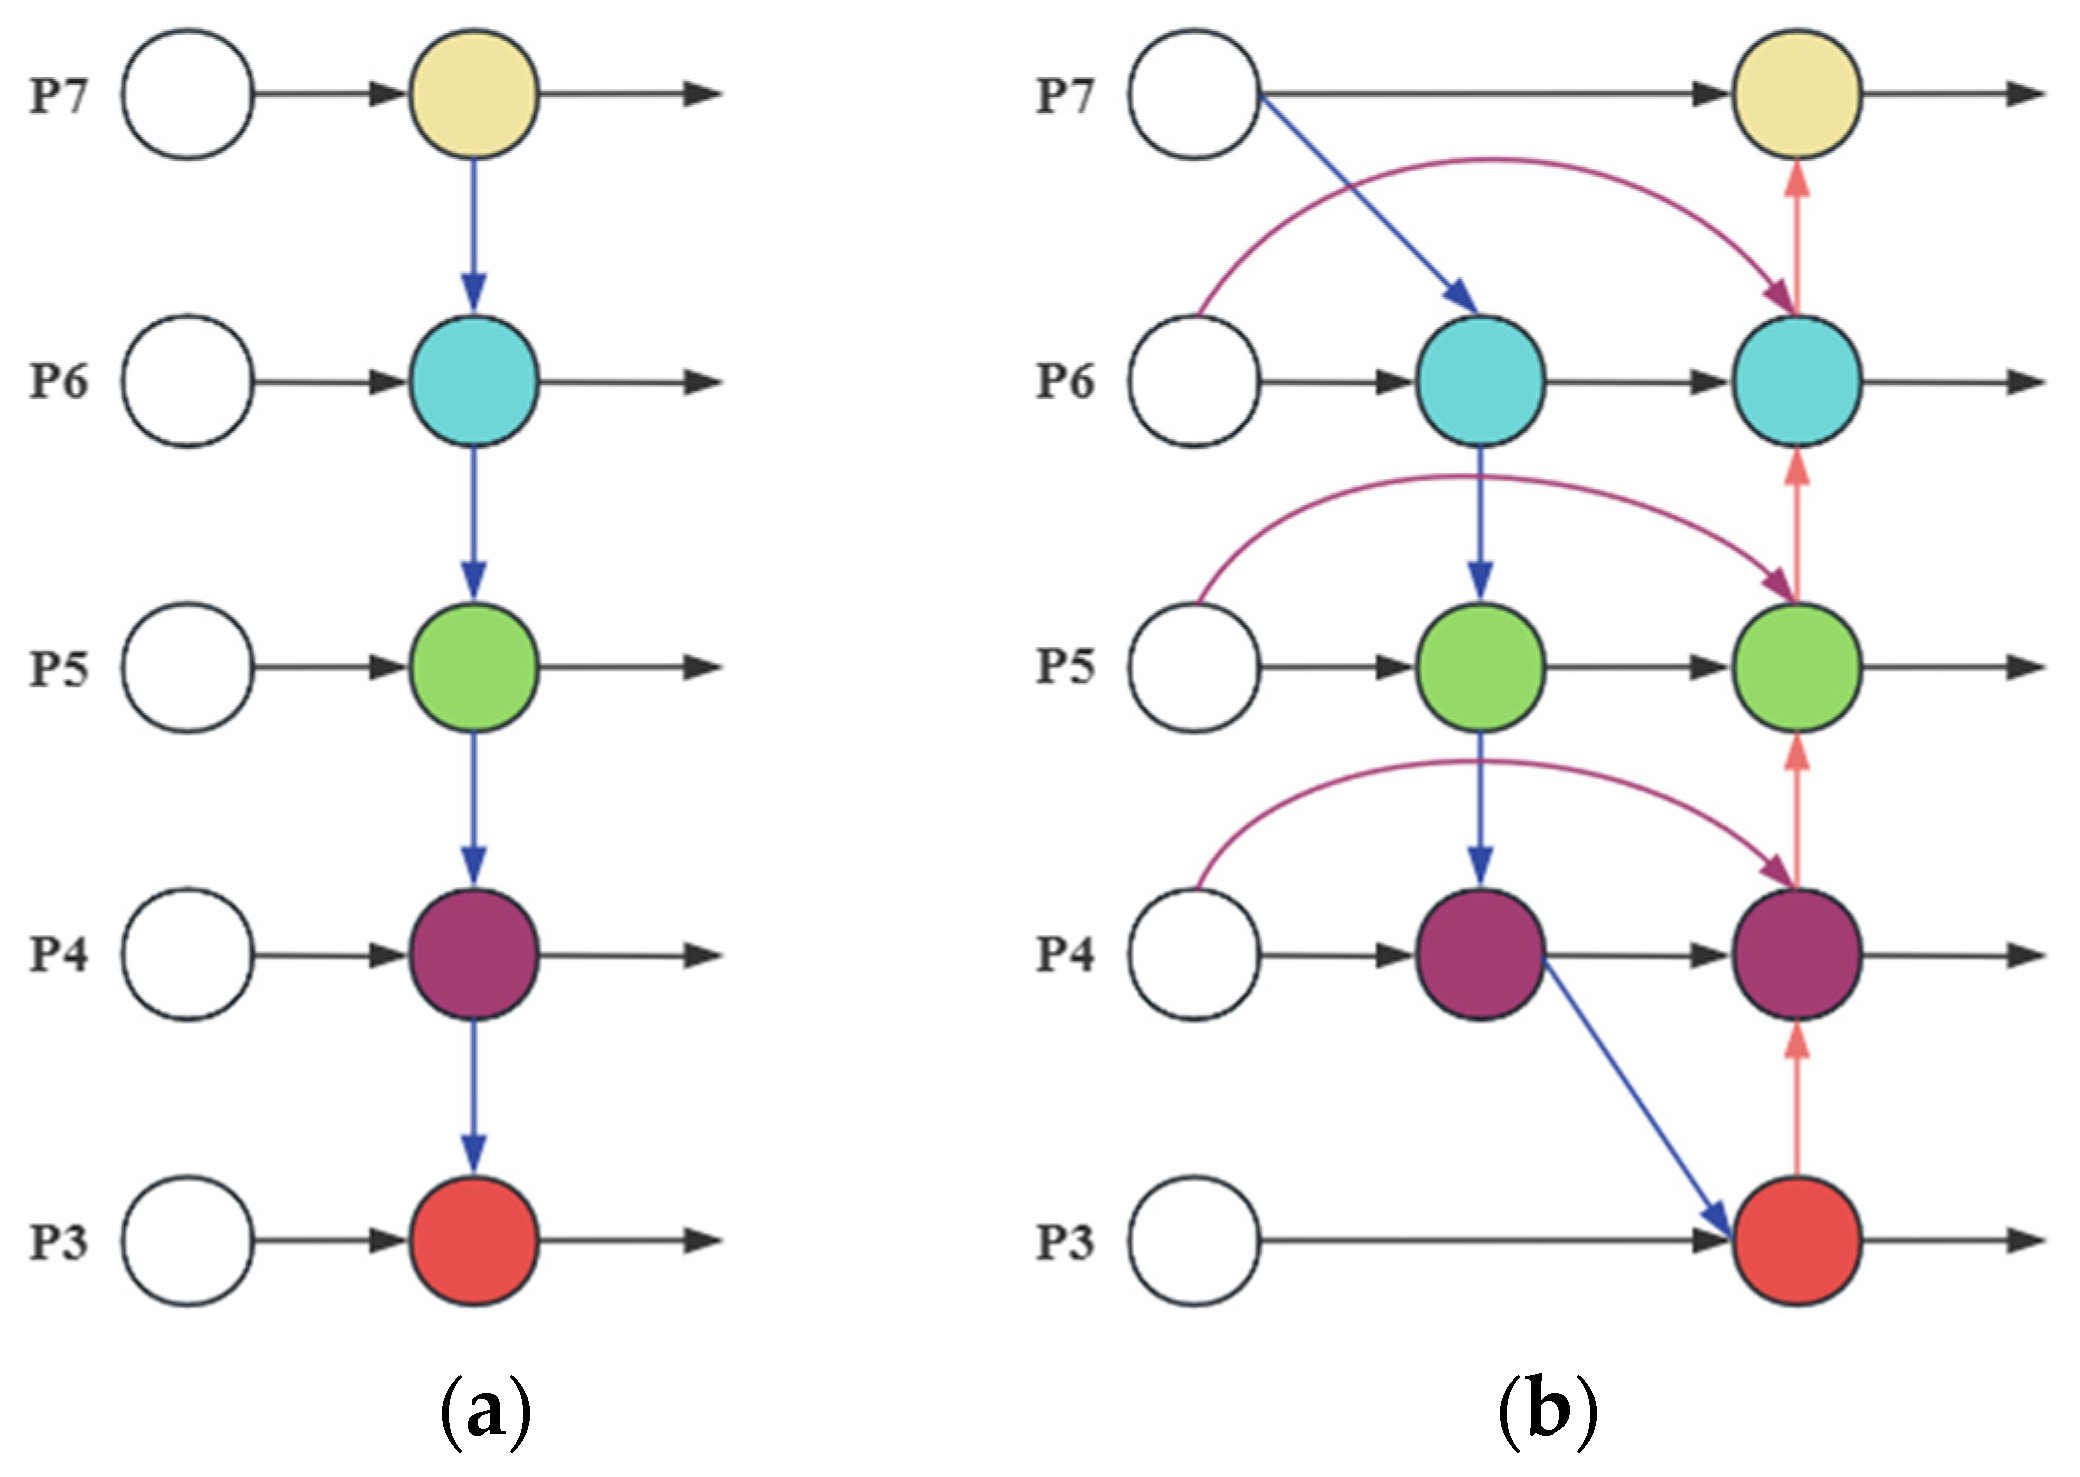
Enhancing a model’s ability to represent targets of various scales serves as a vital aspect of feature fusion. The original YOLOv5s model, during the feature fusion process, overly emphasizes the aggregation of high-resolution features, resulting in ineffective integration of shallow features. To address this issue, we have adjusted the feature fusion mechanisms of the Feature Pyramid Network (FPN) and Bidirectional Feature Pyramid Network (BiFPN) [24] on top of FPN. Figure 5 presents two types of feature fusion networks. The FPN structure, as shown in (a), conveys semantic information top-down, fusing deep-level features with shallow-level features. However, this unidirectional information transfer can lead to the loss of low-level feature information. The BiFPN structure, as shown in (b), includes both top-down and bottom-up feature fusion paths, enabling the interaction between high-level semantic features and low-level spatial detail features. This avoids the loss or dilution of low-level features in traditional FPN, thereby increasing the model’s adaptability to multi-scale targets.
In the improved model, we have added connection paths from deep features (P5) to shallow features (P3) within the feature pyramid. At the same time, we skip the feature fusion nodes of intermediate layers to strengthen the interaction between deep and shallow features while effectively controlling computational costs by reducing redundant calculations in intermediate layers. Finally, a dynamic weight allocation mechanism is adopted to optimize the weights of features of different scales, enhancing the balanced utilization of multi-level information and forming a more comprehensive and efficient feature fusion process.
3
Improving the prediction stage using Soft-NMS algorithm
The traditional Non-maximum Suppression (NMS) method employs a threshold to suppress bounding boxes with significant overlap. However, remote-sensing images feature complex terrain and considerable boundary overlap among land parcels. In such cases, traditional NMS can lead to the accidental removal of crucial small land parcels or edge areas, resulting in the loss of critical information. To mitigate this issue, we adopt the Soft-NMS algorithm [25], an improved version of NMS. In contrast to traditional NMS, Soft-NMS uses a weighted adjustment mechanism to gradually reduce the confidence of overlapping boxes rather than deleting them directly, thereby more accurately preserving target information.
Equations (1) and (2) represent the decay functions of traditional NMS and Soft-NMS, respectively, where M denotes the box with the highest score, B i denotes the box to be processed, 1 i o u M , B i denotes the weighted weight, and S i denotes the score before and after weighting. In Equation (1), boxes with high values of Iou are suppressed directly to zero. In Equation (2), with an increase in Iou, the confidence of the box undergoes a progressive decline.
S i =   S i , iou M , B i   <   N t 0 , iou M , B i     N t ,
S i = S i , iou M , B i   <   N t S i ( 1 iou M , B i ) ,   iou M , B i     N t ,
Soft-NMS alleviates the problem of suppressing too many boxes through this ad-justment, allowing multiple overlapping candidate boxes to coexist. This strategy enables more accurate preservation of target information when detecting small land parcels or complex boundaries, reducing false deletions. Especially when dealing with areas with ambiguous or overlapping boundaries, it further improves the accuracy of bounding box generation.

2.2.2. Improved SAM Module Based on Pre-Trained Weights

Introduced in April 2023, the Segment Anything Model (SAM) [26] represents a potent deep learning-based general segmentation model. Unlike conventional segmentation models, the SAM excels in efficiently segmenting objects within any image without requiring task- or domain-specific data annotations. This model has been trained on the SA-1B dataset, comprising millions of images and billions of masks. Its core strength lies in the integration of self-supervised learning methods, specifically Masked Autoencoders (MAE) [27], with pre-trained Transformer architectures [28]. This combination enables SAM to process various forms of input prompts, such as points, bounding boxes, and text cues, and generate pixel-level object segmentation masks.
Figure 6 illustrates the architecture of the SAM, consisting of three components: an image encoder, a prompt encoder, and a mask decoder. During image segmentation, the image encoder is responsible for extracting image features, while the prompt encoder analyzes these features based on different input prompts (e.g., bounding boxes, points, or text). Subsequently, the mask decoder generates high-precision segmentation masks based on the prompts. This modular, collaborative design allows SAM to adapt flexibly to diverse task requirements, making it widely applicable in fields such as remote sensing, image analysis, and land resource management.
In this study, the SAM was used with its publicly released pre-trained weights, trained on large-scale natural image datasets (SA-1B) with billions of segmentation masks. This choice is justified by the model’s original design as a prompt-driven, task-agnostic segmentation system with demonstrated cross-domain transferability. Instead of re-training, we focused on enhancing SAM’s segmentation accuracy via prompt engineering strategies—such as using YOLOv5s-derived bounding boxes and center/corner points—as well as post-processing steps like morphological operations and mask filtering. These enhancements allow SAM to better adapt to parcel segmentation tasks in remote sensing without the substantial data or computational cost associated with fine-tuning.
To enhance the adaptability and segmentation accuracy of SAM in parcel segmentation tasks for remote sensing images, several optimization strategies were implemented while preserving its original architecture. Specifically, (1) an input prompt enhancement strategy was developed, leveraging bounding box information from YOLOv5s alongside corner and center point prompts to improve segmentation precision; (2) post-processing techniques were introduced, including morphological operations to repair fragmented regions, mask stability scoring to filter out low-quality outputs, and abnormal mask removal based on target scale, all contributing to improved boundary continuity and overall mask quality; (3) A combined Focal Loss and Dice Loss function was employed to address sample imbalance and enhance segmentation performance for small objects.
  • Optimize input prompts through corner center point prompts
The SAM supports points, bounding boxes, and text as input prompts. The output format of YOLOv5s provides coordinate information for the top-left and bottom-right corners of bounding boxes, along with class labels and confidence scores. This coordinated information is directly used as box-type prompts for the Segment Anything Model (SAM) to define the spatial region of interest and guide its mask prediction process. To further enhance the input prompts and improve SAM’s segmentation capabilities in complex scenarios, we augment the bounding box prompts by incorporating corner points and center points, guiding SAM to more accurately focus on the target regions and generate fine-grained segmentation results.
Corner point prompts are generated based on the four corners (top-left, top-right, bottom-left, bottom-right) of the bounding box, providing more precise geometric information. Differing from the sole use of bounding boxes, explicitly adding corner point prompts aids the model in better attending to target boundaries, enhancing segmentation accuracy at finer details. Center point prompts are obtained by calculating the geometric center of the bounding box, as witnessed in Equation (3). Especially for larger target regions, center point prompts can further emphasize the core part of the target area, helping SAM focus on the internal features of the target, better guiding the segmentation process, and ensuring segmentation capability for complex targets.
C _ e n t e r   P _ o i n t = ( ( x _ m i n + x _ m a x ) / 2 , ( y _ m i n + y _ m a x ) / 2 ) ,
By combining these two types of input prompts—(1) the box-type prompts directly generated by YOLOv5s based on the predicted bounding box coordinates and (2) the point-type prompts derived from the corresponding corner and center points—we effectively compensate for SAM’s strong dependence on high-quality prompts. This multi-prompt strategy enables SAM to more accurately localize and segment land parcels, particularly in scenarios involving complex textures, dense object distributions, or small-scale targets.
2
Post-processing of segmentation masks through morphological operations
In the task of parcel segmentation in remote-sensing images, the segmentation masks generated by the SAM demonstrate high initial quality. However, some masks exhibit incomplete boundaries or contain small, noisy regions. Based on the characteristics of this task, we propose post-processing optimization strategies for the SAM-output masks:
Stability score filtering: The SAM output includes a stability score (ranging from 0 to 1) for each mask, which serves as a measure of its reliability. Masks with stability scores below the threshold of 0.4 are discarded to eliminate unreliable masks and ensure the reliability of subsequent segmentation results.
Morphological operation optimization: For masks with small holes or boundary disruptions, morphological closing operations are employed for repair. The closing operation consists of a sequence of dilation and erosion operations, primarily aimed at enhancing the integrity of the target morphology by filling small holes and eliminating fine noise. Dilation expands the boundary of the target region outward to fill small internal voids, while erosion contracts the expanded boundary inward on the basis of dilation to remove the noise introduced during dilation. The formulas are shown in Equation (4), where “ ” denotes the dilation operation, “ ” denotes the erosion operation, A is the input binary image, and B is the structuring element that defines the shape and size of the operation. In this case, an elliptical kernel is used as the structuring element, with a kernel size set to 3 × 3.
A · B = ( A     B ) B ,
Mask area adjustment: Since some masks in remote-sensing images may represent noise regions (due to their excessively small size), mask areas are filtered based on the typical scale of the target regions. Masks with areas smaller than 50 pixels are considered noise and are discarded directly. Masks with areas greater than 30,000 pixels are considered abnormal regions and require further inspection and processing. This strategy reduces meaningless regions in the segmentation results and improves the overall quality of the masks.
3
A combined Focal Loss and Dice Loss function
The segmentation loss is computed using a combination of Focal Loss and Dice Loss. Focal Loss is an improvement on binary cross-entropy loss, formulated in Equation (5).
L F o c a l = α ( 1 p t ) γ log ( p t ) ,
where p t represents the predicted probability of the correct class, α denotes the balancing factor, and γ indicates the modulating factor.
Dice Loss maximizes the negative Dice coefficient to better reflect the similarity between the model’s predictions and the true labels, as shown in Equation (6).
L D i c e = 1 2 p i t i p i + t i ,
where p i and t i denote the predicted and true values for the i-th pixel, respectively.
L s e g = λ F o c a l L F o c a l + λ D i c e L D i c e ,
Simply put, the segmentation loss is calculated using a linear combination of Focal Loss and Dice Loss. For the segmentation loss, we assign λ F o c a l = 0.5 and λ D i c e = 1.0 to balance between pixel-level classification (especially under class imbalance), which is essential for precise parcel boundary delineation.

2.2.3. Unified Loss for Detection and Segmentation

The loss function is divided into two primary components, corresponding to the object detection task and the semantic segmentation task, respectively. The object detection loss ( L o b j ) comprises localization loss ( L l o c ), classification loss ( L c l s ), and confidence loss ( L c o n f ).
The localization loss is calculated using the Complete Intersection over Union (CIoU) and is only applied to positive samples, as formulated in Equation (8).
L l o c = 1 i o u + p 2 b ,   b g t c 2 + α v ,
v = 4 π 2 ( a r c t a n w g t h g t arctan ( w h ) ) 2 ,
α = v 1 i o u + v ,
where IoU denotes the Intersection over Union between the predicted bounding box and the ground truth box; p 2 b ,   b g t represents the Euclidean distance between the centers of the predicted and ground truth boxes; c is the length of the diagonal of the smallest bounding box that encompasses both the predicted and ground truth boxes; v measures the aspect ratio difference between the predicted and ground truth boxes; and α refers to the weight factor.
Both the classification loss and the confidence loss are calculated using the Binary Cross-Entropy Loss (BCE), as formulated in Equation (11).
B C E p ,   t = t log p + 1 t log 1 p ,
The classification loss measures the discrepancy between the predicted and true categories, focusing on positive samples. The confidence loss assesses whether the predicted bounding box contains the target object, considering all samples, as illustrated in Equations (12) and (13).
L c l s = 1 N p o s i = 1 N p o s c = 1 c B C E p i , c ,   t i , c ,
L c o n f = 1 N i = 1 N B C E ( p i ,   t i ) ,
where N is denoted as the total number of samples, C as the number of categories, p i , c as the predicted probability of the i-th positive sample belonging to category C, and t i , c as the true label of the i-th positive sample for category C.
L o b j = λ c l s L c l s + λ l o c L l o c + λ c o n f L c o n f ,
The total loss for the object detection component is the weighted sum of these three parts, as indicated in Equation (14), where λ c l s , λ l o c , a n d   λ c o n f are the weight coefficients. We set λ c l s = 0.05, λ l o c = 1.0, and λ c o n f = 0.5. Given that the bounding boxes are mainly used as input prompts for downstream segmentation, the primary focus is on providing accurate region proposals rather than achieving high localization accuracy. Therefore, we down-weight the localization loss to reflect its secondary role in this dual-stage approach.
L t o t a l = λ o b j L o b j + λ s e g L s e g ,
The final combined loss function is given in Equation (15), where λ o b j   a n d   λ s e g are the weight coefficients. we emphasize segmentation performance by setting λ s e g = 2.0 and λ o b j = 1.0. This weighting strategy was validated on dataset and led to improved performance in both mask quality and training stability.

3. Results

3.1. Experimental Environment Configuration

Table 2 provides a detailed overview of the software and hardware environment configured for the experiments, including the operating system, development tools, deep learning frameworks, GPU specifications, and other key dependencies essential for model training and evaluation.
For model training, the AdamW optimizer is employed, combined with Warm-up and Cosine Annealing learning rate scheduling strategies. Reasonable hyperparameters are set based on the size and characteristics of the dataset. The specific settings are as follows: the number of epochs is set to 100, the batch size to 16, and the initial learning rate to 0.01. To ensure stable convergence of the model during the initial stages of training, the warm-up phase linearly increases the learning rate from 0.0001 to the initial learning rate of 0.01 over 20 epochs. Following this, the Cosine Annealing phase begins from the 21st epoch, where the learning rate gradually decreases according to a cosine function until it converges to a minimum value of 1 × 10⁻⁶.
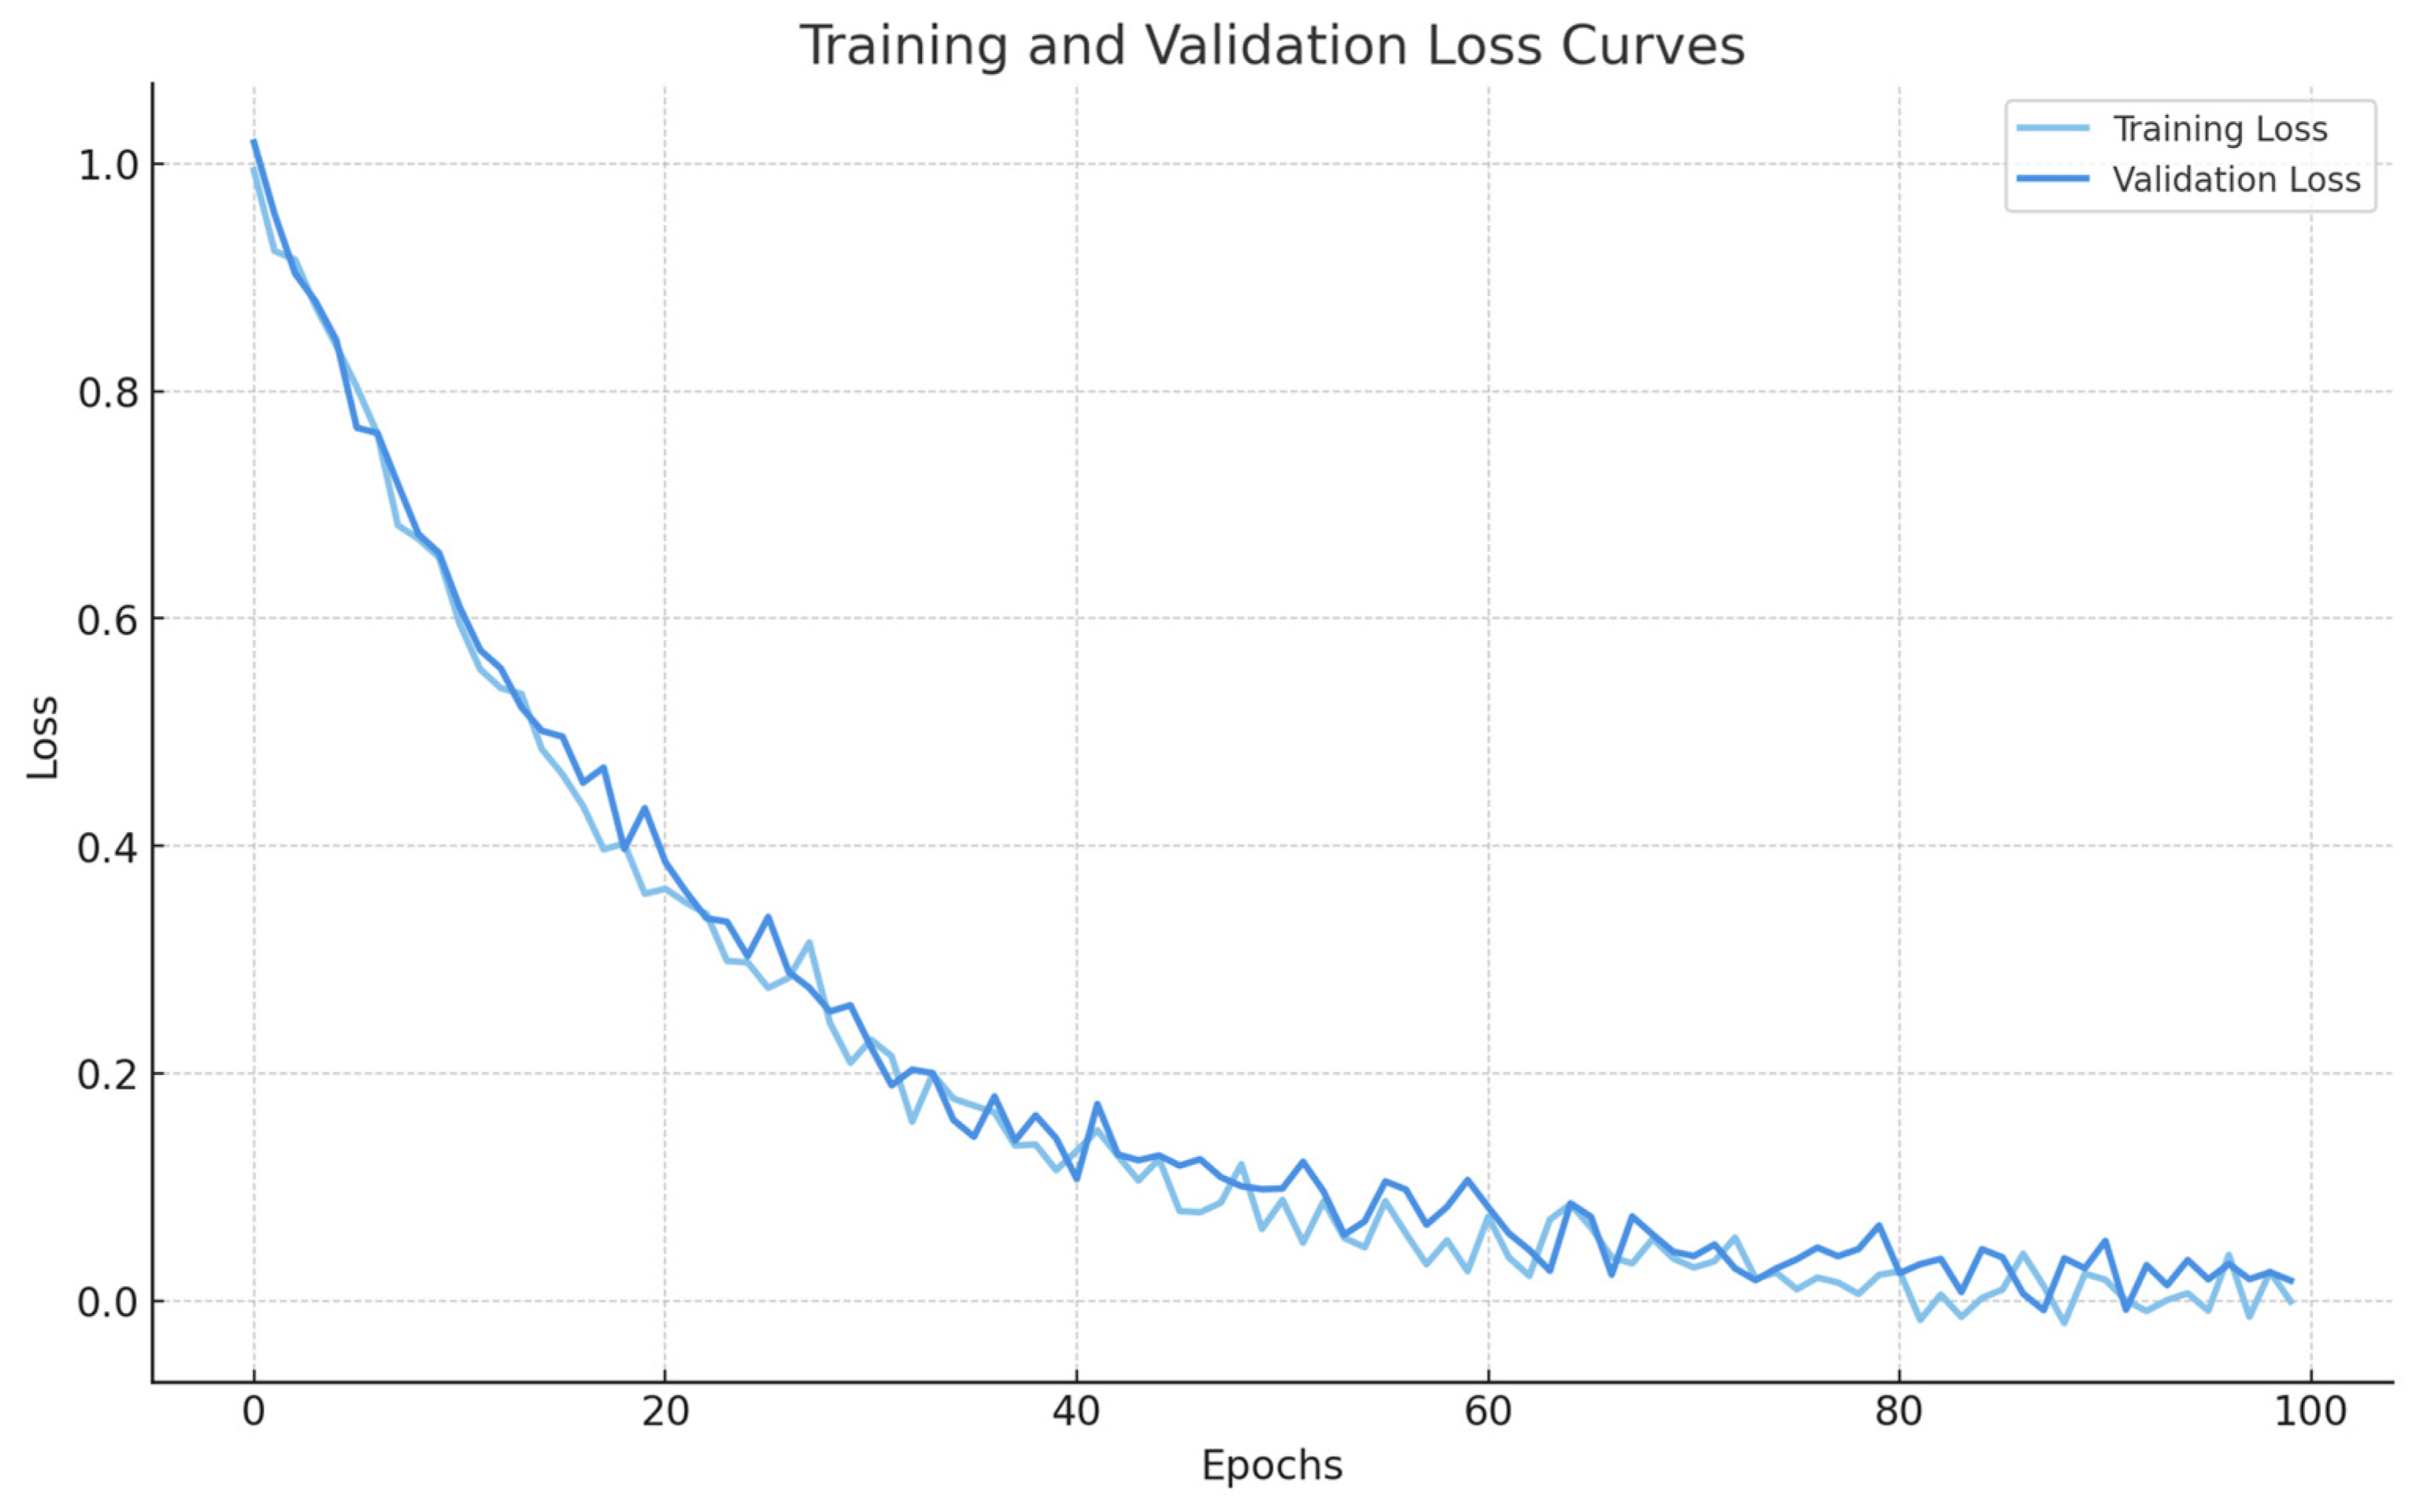
As evidenced by Figure 7, from the 60th epoch onwards, the decline in the loss curve slows down and trends towards stability, indicating that the model has learned most of the data features and that weight adjustments are stabilizing.

3.2. Experimental Evaluation Metrics

To comprehensively evaluate the performance of the model in the parcel segmentation task, Intersection over Union (IoU), Precision (P), Recall (R), and Frames Per Second (FPS) are selected as evaluation metrics to measure both the segmentation accuracy and operational efficiency of the model.
IoU assesses the degree of overlap between the model’s segmentation results and the true segmentation results; Precision evaluates the proportion of samples predicted by the model as positive that are actually positive; Recall assesses the proportion of actual positive samples that are correctly identified as positive. The formulas for these metrics are provided below:
I o U = T P T P + F P + F N ,
P = T P T P + F P ,
R = T P T P + F N ,
where TP stands for true positives, FP refers to false positives, TN represents true negatives, and FN represents false negatives.
FPS represents the inference speed of the model, i.e., the number of image frames processed by the model per second, as expressed in Equation. The formula for FPS is as follows:
F P S = N u m ( p i c t u r e ) T o t a l ( t i m e ) ,

3.3. Experimental Results

To ensure the fairness of the comparison, all models were trained and tested on the same dataset. Additionally, to verify the broad applicability of the proposed algorithm and its performance across different datasets, a comprehensive evaluation was conducted on the publicly available CCF BDCI dataset and WuJiang dataset, with all parameters uniformly configured. This series of validations provides an in-depth investigation into the effectiveness and generalization ability of the proposed method across different scenarios. Table 3 presents the segmentation results of the proposed YOLOv5s_SAM model on two datasets. As shown in Table 3, the new parcel segmentation method combined YOLOV5s and SAM can obtain good segmentation results on both datasets with higher scores than 80% on IoU, Precision, and Recall indexes.
In the WuJiang dataset, small parcels are densely distributed and exhibit diverse shapes. Despite the complex background, the relatively clear boundaries between targets enable the model to achieve more accurate detection and segmentation. In contrast, the CCF dataset is characterized by blurred boundaries, which often lead to mis-segmentation and missed detections, resulting in reduced Precision and Recall. Overall, the model performs better on the WuJiang dataset, mainly due to differences in target characteristics and the effectiveness of the optimization strategies in adapting to varying scenarios.

4. Discussion

4.1. Comparison with Other Parcel Segmentation Methods

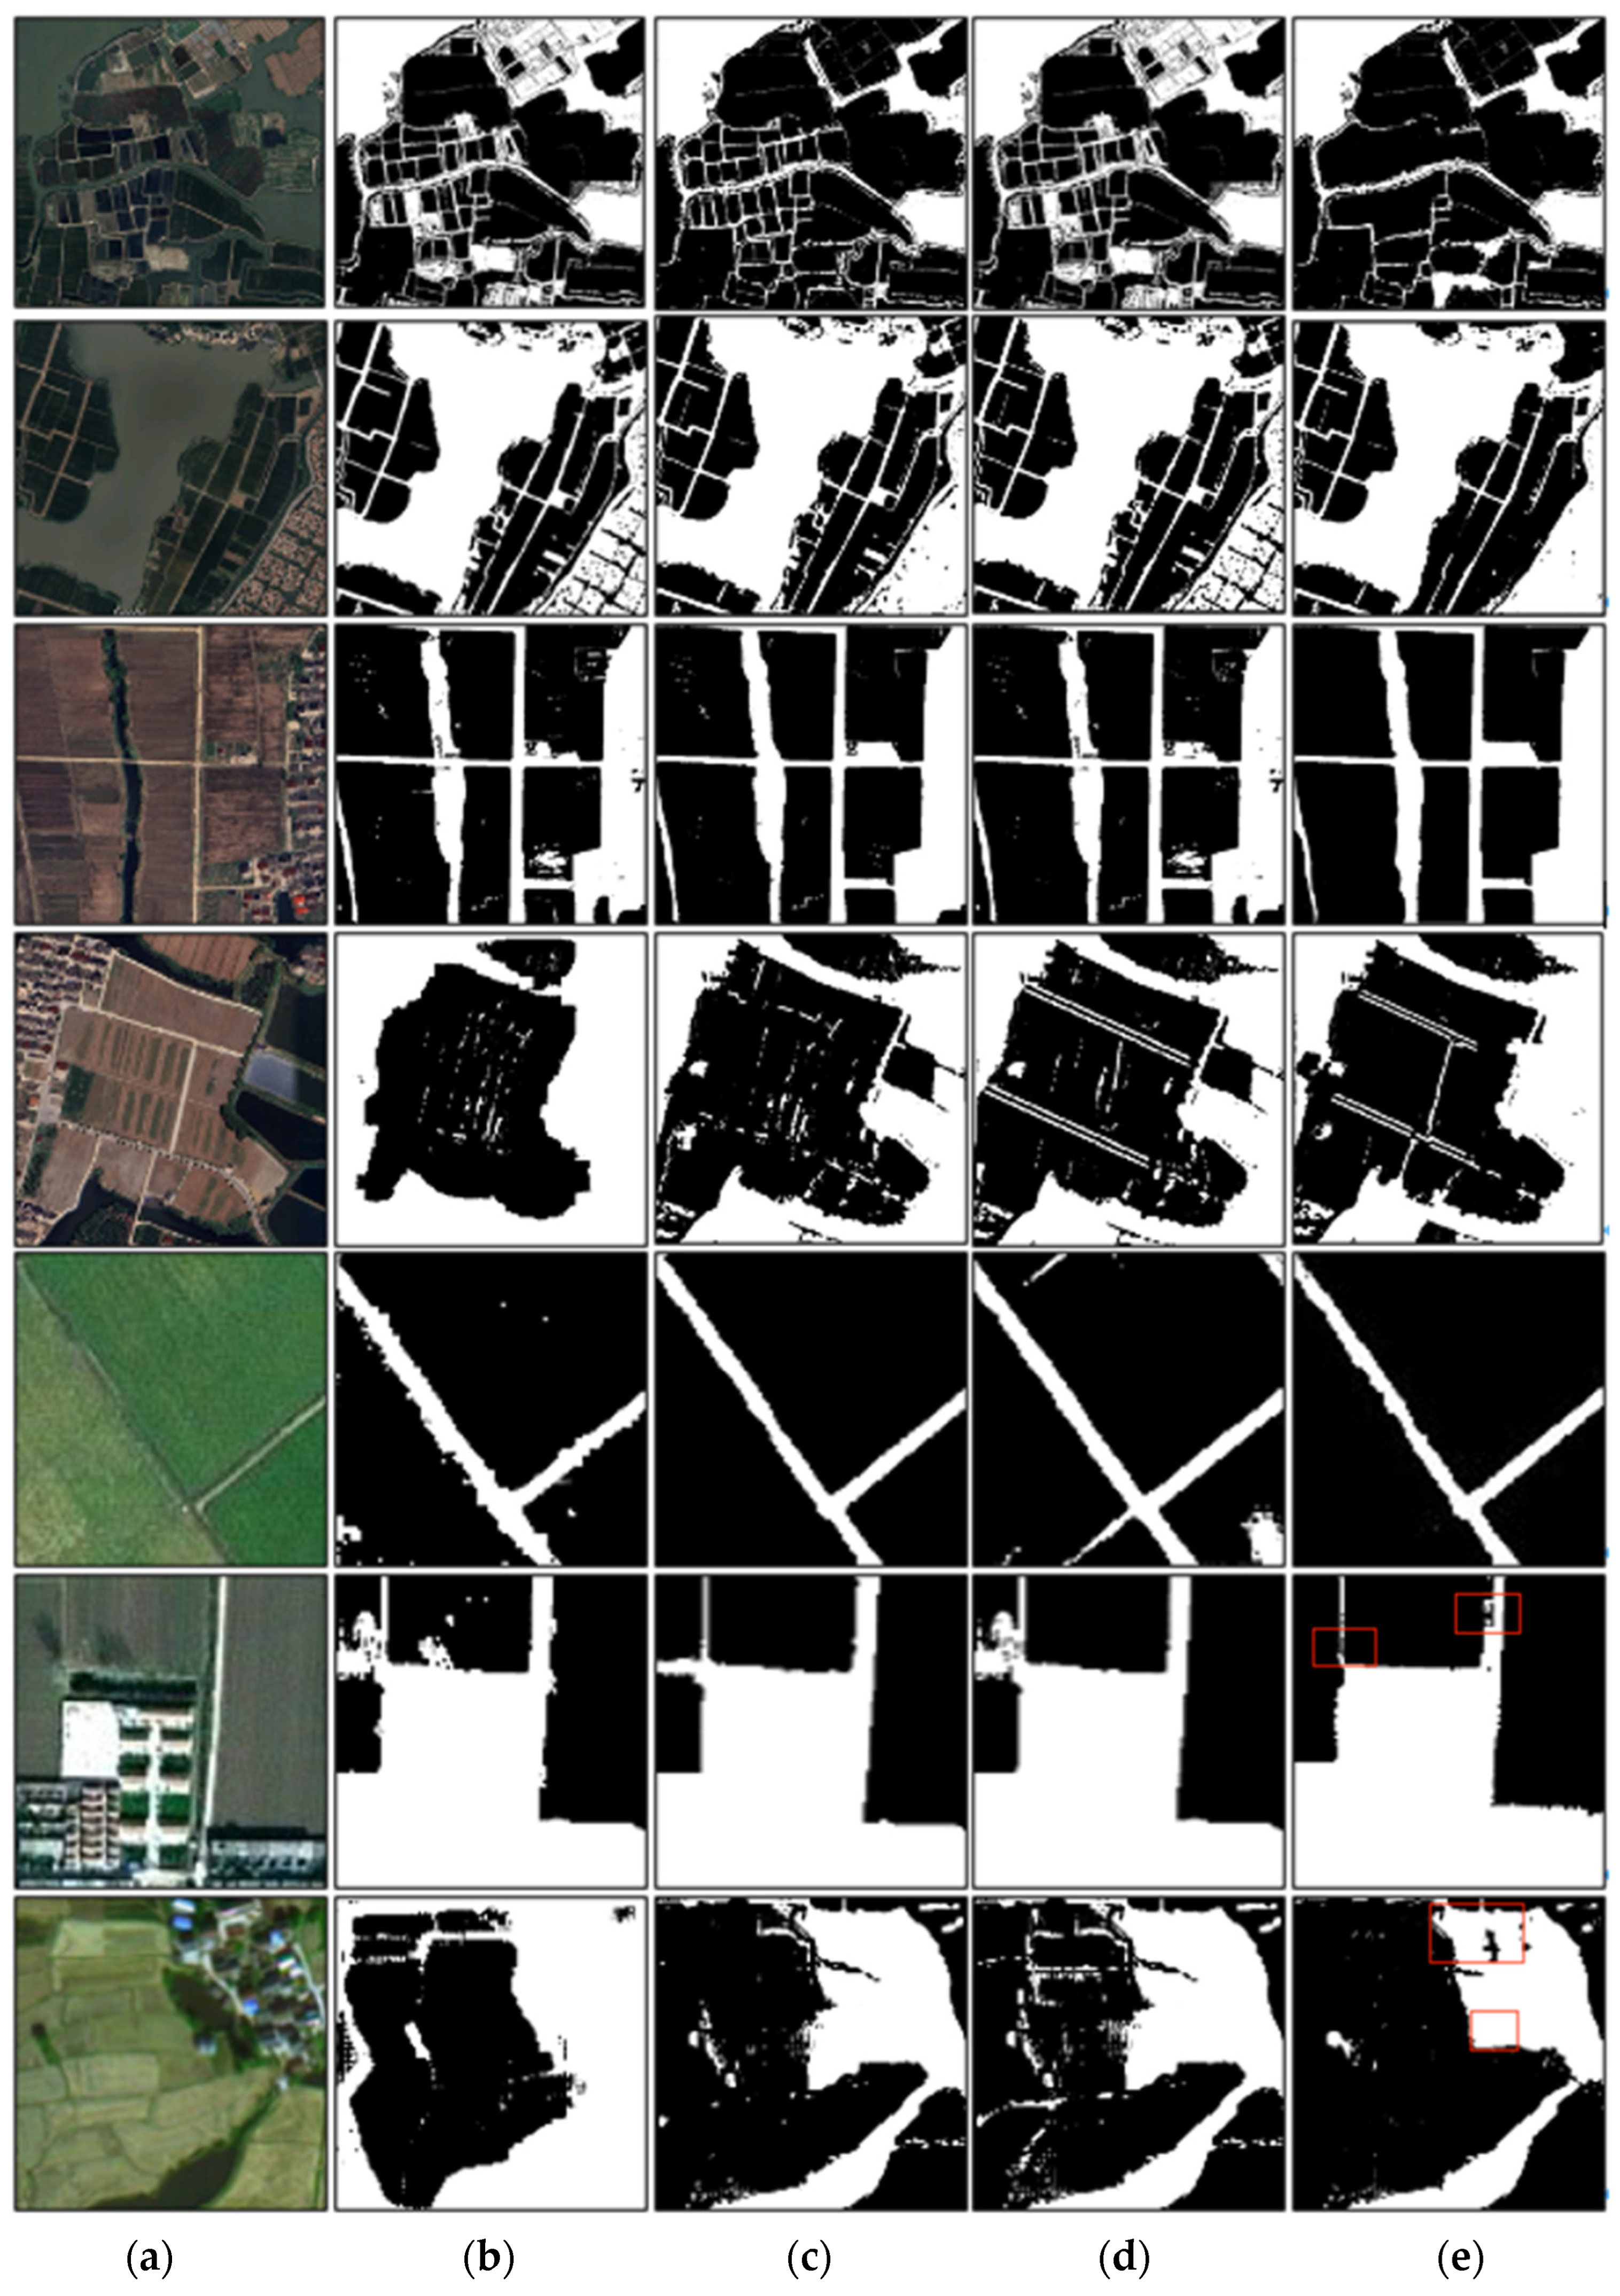
To comprehensively evaluate the performance of the proposed improved model, this study selected three mainstream image segmentation models—Deeplabv3+, SegNet, and Mask R-CNN—for comparative experiments. The experiments analyzed the detection accuracy and efficiency of each model based on multiple performance metrics. The segmentation results are shown in Table 4 and Figure 8.
As evident from Table 4, our improved model outperforms other models in terms of IoU, Precision, Recall, and other performance metrics. Although the model introduces a slight increase in parameters, it still achieves significantly higher FPS compared to Mask R-CNN, which also adopts a detection-then-segmentation strategy. This indicates that the improved model maintains high accuracy without a significant impact on computational efficiency, making it valuable for practical applications. The proposed method exhibits a slightly lower FPS on the WuJiang dataset (23.6) compared to the CCF BDCI dataset (27.6). This performance gap is primarily due to the significantly higher spatial resolution of WuJiang images (5000 × 5000 pixels), which increases the computational load during segmentation and post-processing. Additionally, the WuJiang dataset contains more densely distributed small parcels and richer background textures, leading to a greater number of detections by YOLOv5s. Consequently, more prompts are passed to the SAM module, which exhibits increased runtime with prompt quantity and complexity.
To further validate the robustness and statistical significance of the reported performance improvements, five independent experimental runs were conducted for each segmentation method. Table 5 presents the mean and standard deviation of key metrics (IoU, Precision, and Recall) across these runs. The proposed method demonstrates consistently higher average values and lower variances compared to baseline models, indicating strong robustness and reproducibility.
To validate the observed differences shown in Table 4, paired t-tests were performed between the proposed method and each baseline model based on the repeated experiments. The resulting p-values for comparisons with SegNet ( ρ = 0.0003 ), DeepLabv3+ ( ρ = 0.0011 ), and Mask R-CNN ( ρ = 0.0026 ) all fall below the 0.01 threshold, confirming that the observed improvements are statistically significant. These findings strongly support the effectiveness and reliability of the proposed segmentation framework.
These quantitative improvements are further supported by statistical validation and comparative visual analysis, offering more substantial evidence for the model’s practical value.
As shown in Figure 8, the segmentation results reveal noticeable differences in the performance of each model for land parcel segmentation:
Proposed Algorithm (Figure 8e): Compared to other models, the proposed method performs better in segmenting small targets, handling complex boundaries, and preserving fine details. It also effectively reduces noise in the segmentation results, producing clearer and more accurate final segmentation maps. In comparison, both DeepLabv3+ (Figure 8c) and Mask R-CNN (Figure 8d) demonstrate moderate performance. DeepLabv3+ offers relatively good boundary delineation but suffers from misclassification in complex terrains and visually similar regions. Mask R-CNN, although capable of distinguishing individual land parcels with higher granularity, struggles with blurred or irregular parcel shapes and tends to introduce more noise. SegNet (Figure 8b) performs the weakest overall; despite its ability to identify most land parcels, it produces blurry boundaries, lacks detail preservation, and is prone to noisy outputs due to limited contextual information integration. These comparisons highlight the robustness and effectiveness of the proposed method across diverse segmentation challenges.
In addition, the red boxes in the figure highlight some segmentation errors in the results. These failure cases are primarily caused by ambiguous or blurred boundaries between adjacent parcels, which lead the model to under-segment multiple parcels into a single region. The root causes of these failures may include limitations in prompt precision, insufficient boundary information, and the intrinsic challenges of the SAM module in handling tightly clustered targets. To address these issues, future work may explore enhancements such as edge-aware post-processing, adaptive prompt strategies focusing on boundary regions, or the integration of boundary refinement modules to improve segmentation quality in ambiguous regions.
In order to make the experimental results more complete, we also conducted pilot comparisons with two representative Transformer-based architectures—Swin-UNet [29]—to assess the potential advantages of global attention mechanisms in land parcel segmentation. Swin-UNet introduces a hierarchical vision Transformer with shifted windows, enabling efficient computation while preserving spatial locality.
To ensure a fair comparison, Swin-UNet was trained on a representative 30% subset of the WuJiang dataset using identical hyperparameter settings. While it achieved a commendable IoU of 85.9%, the model exhibited substantially higher computational overhead. Specifically, Swin-UNet consumed approximately 2.6 times more GPU memory and demonstrated 3.4 times slower inference speed when processing high-resolution images. Moreover, Swin-UNet, like many Transformer-based models, requires large-scale training datasets and longer convergence times, which can be prohibitive in resource-constrained agricultural applications.
Although Swin-UNet’s attention mechanism offered marginal accuracy gains in certain complex parcel structures, our proposed model—characterized by its lightweight architecture, fast inference, and effective prompt-guided segmentation via SAM—proved more suitable for real-world deployment in large-scale remote sensing scenarios.

4.2. Ablation Experiment

To further validate the individual contributions of the enhanced modules within the model, ablation experiments were conducted to analyze the impact of various modules on model performance, with the results presented in Table 6 and Table 7.
The optimization of the YOLOv5s model unfolded in three parts: “Extraction Optimization,” “Fusion Optimization,” and “Prediction Optimization.” Experiment (1): By incorporating the ECA module into the YOLOv5s model, Precision increased from 78.8% to 82.6%, Recall rose from 69.1% to 71.4%, but FPS decreased to 43.6. The ECA module enhanced the dependency among feature channels, thereby improving the model’s feature representation capability. However, this enhancement came at the cost of additional computational overhead, leading to a decline in inference speed. Experiment (2): Introducing the BiFPN module into the YOLOv5s model boosted Precision to 83.9% and Recall to 71.6%. The BiFPN module efficiently fused features of different scales through a bidirectional feature pyramid network, enhancing the model’s robustness in handling multi-scale objects and consequently improving detection accuracy. Experiment (3): Implementing Soft-NMS in the YOLOv5s model further elevated Precision to 85.6% and Recall to 72.4%, albeit with a decrease in FPS to 39.7. By refining the final predictions, this approach effectively addressed the challenges of detecting objects with ambiguous boundaries and small sizes. Notwithstanding the increased computational complexity, it struck a good balance between performance and speed.
The results of the ablation experiments for segmentation optimization are depicted in Table 7. The performance of the SAM was enhanced through optimizations in “Input Prompt Augmentation” and “Post-processing Strategy.” Experiment (1): Adding the “Input Prompt Augmentation” strategy to the model increased Precision from 80.5% to 82.1% and Recall from 81.9% to 82.4%, with a slight FPS drop to 30.9. This strategy effectively improved the model’s ability to focus on target areas, enhancing segmentation accuracy. Experiment (2): Further incorporating a “Post-processing Strategy” boosted Precision to 83.2% and Recall to 82.6%, with FPS decreasing to 23.5. By optimizing the quality of segmentation masks, this strategy improved the model’s ability to handle small objects and complex boundaries, further enhancing overall segmentation performance.
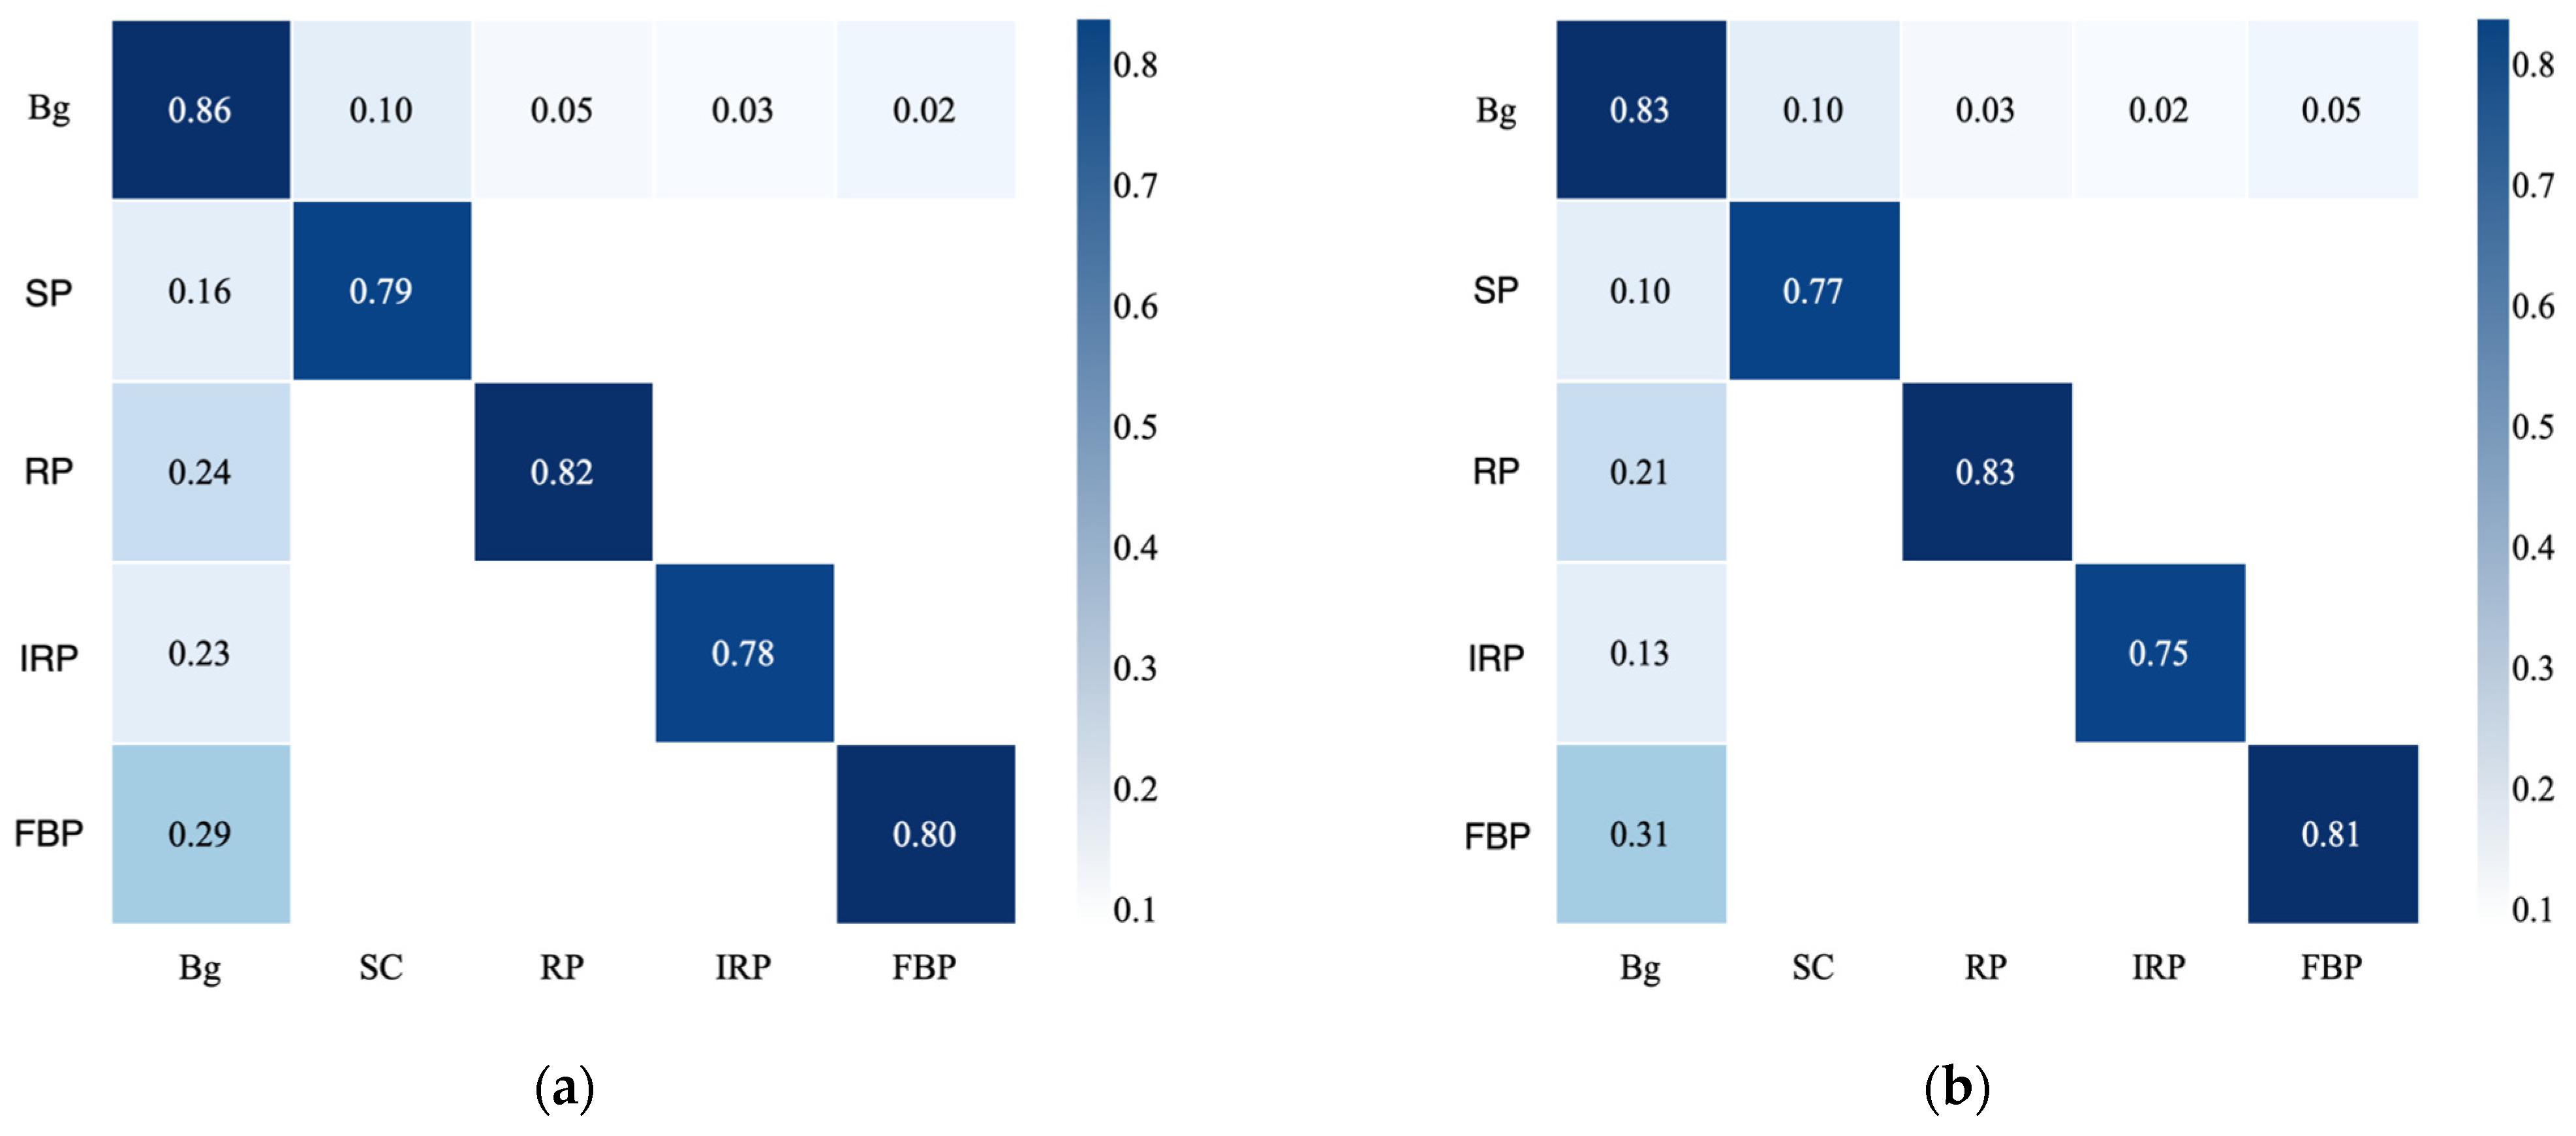
To evaluate model performance, a confusion matrix is commonly used as a tool to compare true labels with predicted labels, providing a visualization of the model’s prediction results. As shown in Figure 9a, the confusion matrix of the improved YOLOv5s model indicates that the recognition accuracy for background, regular land parcels, and blurred-boundary land parcels all exceed 0.80, with only some degree of confusion observed between scattered or irregular land parcels and the background. Figure 9b presents the confusion matrix of the improved SAM model. The SAM model performs well in segmenting background and regular land parcels, demonstrating high accuracy. However, its segmentation performance slightly declines when dealing with irregular and scattered land parcels. By integrating the improved YOLOv5s model, these limitations can be significantly mitigated, leading to substantial improvements in segmentation results.

5. Conclusions

Agricultural land parcels provide essential conditions for crop growth and serve as the foundation of agricultural development, playing a vital role in ensuring food security. However, segmentation of land parcels in remote sensing imagery remains challenging due to complex backgrounds, blurred boundaries, and significant object scale variations, particularly for small-object detection in heterogeneous environments. To address these issues, this study proposes a two-stage semi-supervised segmentation network combining YOLOv5s and the Segment Anything Model (SAM). The model integrates lightweight object detection with pixel-level feature extraction via an encoder-decoder architecture, effectively improving small-object recognition, boundary precision, and robustness against background interference. Evaluated on two datasets, the method achieved an IoU of 89.8% and a Precision of 90.2%, outperforming conventional approaches.
Despite these promising results, several limitations remain. Performance may decline under cloud occlusion or other atmospheric disturbances not seen during training. The model is currently limited to optical RGB imagery and has not been validated on other modalities such as SAR, which offer resilience under adverse conditions but pose new challenges. Additionally, the WuJiang dataset is geographically confined to Suzhou, China, which may limit generalizability. Some failure cases, such as under-segmentation in regions with ambiguous boundaries, also highlight the need for enhanced boundary refinement.
Future work will explore multi-modal learning with SAR or multispectral data and develop lightweight, adaptable segmentation frameworks for diverse environments. Further improvements will focus on edge-aware post-processing, adaptive prompt generation near parcel boundaries, and integration of boundary refinement modules to enhance accuracy in complex real-world scenarios.

Author Contributions

Conceptualization, X.W. and C.M.; methodology, X.W., C.M. and D.W.; validation, X.W.; formal analysis, D.W. and Y.Z.; investigation, J.W. resources, J.W.; data curation, X.H.; writing—original draft preparation, Y.L.; writing—review and editing, Y.L.; visualization, X.W.; supervision, X.H.; project administration, X.H. and J.W.; funding acquisition, C.M. and Y.L. All authors have read and agreed to the published version of the manuscript.

Funding

This research has been supported by Comprehensive Remote Sensing Dynamic Monitoring Services for Bare Lands and Contaminated Sites in the Environmental Renovation Project of Daxing District (No.11011524210200019449-XM001) and the Youth Innovation Promotion Association of the Chinese Academy of Science under Grant 2021126.

Data Availability Statement

Available from the corresponding author.

Conflicts of Interest

The authors declare no conflicts of interest.

Abbreviations

The following abbreviations are used in this manuscript:
BiFPNBidirectional Feature Pyramid Network
BCEBinary Cross-Entropy
BDCIBig Data & Computing Intelligence Competition
CBAMConvolutional Block Attention Module
CCFChina Computer Federation
ECAEfficient Channel Attention
FPSFrames Per Second
FCNFully Convolutional Network
IoUIntersection over Union
LiDARLight Detection and Ranging
MAEMasked Autoencoders
NMSNon-Maximum Suppression
PANPath Aggregation Network
SAMSegment Anything Model
SESqueeze-and-Excitation
SARSynthetic Aperture Radar

References

  1. Hadir, A.; Adjou, M.; Assainova, O.; Palka, G.; Elbouz, M. Comparative Study of Agricultural Parcel Delineation Deep Learning Methods using Satellite Images: Validation through Parcels Complexity. Smart Agric. Technol. 2025, 10, 100833. [Google Scholar] [CrossRef]
  2. Xu, L.; Ming, D.; Du, T.; Chen, Y.; Dong, D.; Zhou, C. Delineation of cultivated land parcels based on deep convolutional networks and geographical thematic scene division of remotely sensed images. Comput. Electron. Agric. 2022, 192, 106611. [Google Scholar] [CrossRef]
  3. Li, S.T.; Li, C.Y.; Kang, X.D. Development status and future prospects of multi-source remote sensing image fusion. Natl. Remote Sens. Bull. 2021, 25, 148–166. [Google Scholar] [CrossRef]
  4. Chen, Z.X.; Ren, J.Q.; Tang, H.J.; Shi, Y.; Leng, P.; Liu, J.; Wang, L.M.; Wu, W.B.; Yao, Y.M.; Hasituya. Progress and perspectives on agricultural remote sensing research and applications in China. J. Remote Sens. 2021, 20, 748–767. [Google Scholar]
  5. Evans, C.; Jones, R.; Svalbe, I.; Berman, M. Segmenting multispectral Landsat TM images into field units. IEEE Trans. Geosci. Remote Sens. 2002, 40, 1054–1064. [Google Scholar] [CrossRef]
  6. Wang, F.C.; Zhang, M.; Gong, L.M. Image edge detection algorithm of Roberts operator. J. Detect. Control 2016, 38, 88–92. [Google Scholar]
  7. Wang, X. Laplacian operator-based edge detectors. IEEE Trans. Pattern Anal. Mach. Intell. 2007, 29, 886–890. [Google Scholar] [CrossRef] [PubMed]
  8. Salman, N.H.; Liu, C.Q. Image segmentation and edge detection based on watershed techniques. Int. J. Comput. Appl. 2003, 25, 258–263. [Google Scholar] [CrossRef]
  9. Mueller, M.; Segl, K.; Kaufmann, H. Edge-and region-based segmentation technique for the extraction of large, man-made objects in high-resolution satellite imagery. Pattern Recognit. 2004, 37, 1619–1628. [Google Scholar] [CrossRef]
  10. Lv, J.; Shen, Q.; Lv, M.; Li, Y.; Shi, L.; Zhang, P. Deep learning-based semantic segmentation of remote sensing images: A review. Front. Ecol. Evol. 2023, 11, 1201125. [Google Scholar] [CrossRef]
  11. Long, J.; Shelhamer, E.; Darrell, T. Fully convolutional networks for semantic segmentation. In Proceedings of the IEEE Conference on Computer Vision and Pattern Recognition, Boston, MA, USA, 7–12 June 2015; pp. 3431–3440. [Google Scholar]
  12. Ronneberger, O.; Fischer, P.; Brox, T. U-net: Convolutional networks for biomedical image segmentation. In Proceedings of the Medical Image Computing and Computer-Assisted Intervention—MICCAI 2015: 18th International Conference, Munich, Germany, 5–9 October 2015; Proceedings, Part III 18. Springer International Publishing: Cham, Switzerland, 2015; pp. 234–241. [Google Scholar]
  13. Badrinarayanan, V.; Handa, A.; Cipolla, R. Segnet: A deep convolutional encoder-decoder architecture for robust semantic pixel-wise labeling. arXiv 2015, arXiv:1505.07293. [Google Scholar]
  14. Chen, L.C.; Papandreou, G.; Kokkinos, I.; Murphy, K.; Yuille, A.L. Deeplab: Semantic image segmentation with deep convolutional nets, atrous convolution, and fully connected CRFs. IEEE Trans. Pattern Anal. Mach. Intell. 2017, 40, 834–848. [Google Scholar] [CrossRef] [PubMed]
  15. Chen, L.C. Rethinking atrous convolution for semantic image segmentation. arXiv 2017, arXiv:1706.05587. [Google Scholar]
  16. Chen, L.C.; Zhu, Y.; Papandreou, G.; Schroff, F.; Adam, H. Encoder-decoder with atrous separable convolution for semantic image segmentation. In Proceedings of the European Conference on Computer Vision (ECCV), Munich, Germany, 8–14 September 2018; pp. 801–818. [Google Scholar]
  17. Li, T.; Ma, C.; Lv, Y.; Liao, R.; Yang, J.; Liu, J. An Approach to large-scale Cement Plant Detection Using Multisource Remote Sensing Imagery. Remote Sens. 2024, 16, 729. [Google Scholar] [CrossRef]
  18. Liu, Y.; Cheng, M.M.; Hu, X.; Wang, K.; Bai, X. Richer convolutional features for edge detection. In Proceedings of the IEEE Conference on Computer Vision and Pattern Recognition, Honolulu, HI, USA, 21–26 July 2017; pp. 3000–3009. [Google Scholar]
  19. Buslaev, A.; Iglovikov, V.I.; Khvedchenya, E.; Parinov, A.; Druzhinin, M.; Kalinin, A.A. Albumentations: Fast and flexible image augmentations. Information 2020, 11, 125. [Google Scholar] [CrossRef]
  20. Jocher, G.; Chaurasia, A.; Stoken, A.; Borovec, J.; NanoCode012; Kwon, Y.; Xie, T.; Michael, K.; Fang, J.; Imyhxy; et al. ultralytics/yolov5: v6.2—YOLOv5 Classification Models, Apple M1, Reproducibility, ClearML and Deci.ai Integrations; Zenodo: Geneva, Switzerland, 2022. [Google Scholar]
  21. Wang, Q.; Wu, B.; Zhu, P.; Li, P.; Zuo, W.; Hu, Q. ECA-Net: Efficient channel attention for deep convolutional neural networks. In Proceedings of the IEEE/CVF Conference on Computer Vision and Pattern Recognition, Seattle, WA, USA, 14–19 June 2020; pp. 11534–11542. [Google Scholar]
  22. Hu, J.; Shen, L.; Sun, G. Squeeze-and-excitation networks. In Proceedings of the IEEE Conference on Computer Vision and Pattern Recognition, Salt Lake City, UT, USA, 18–23 June 2018; pp. 7132–7141. [Google Scholar]
  23. Woo, S.; Park, J.; Lee, J.Y.; Kweon, I.S. Cbam: Convolutional block attention module. In Proceedings of the European Conference on Computer Vision (ECCV), Munich, Germany, 8–14 September 2018; pp. 3–19. [Google Scholar]
  24. Tan, M.; Pang, R.; Le, Q.V. Efficientdet: Scalable and efficient object detection. In Proceedings of the IEEE/CVF Conference on Computer Vision and Pattern Recognition, Seattle, WA, USA, 14–19 June 2020; pp. 10781–10790. [Google Scholar]
  25. Bodla, N.; Singh, B.; Chellappa, R.; Davis, L.S. Soft-NMS—Improving object detection with one line of code. In Proceedings of the IEEE International Conference on Computer Vision, Venice, Italy, 22–29 October 2017; pp. 5561–5569. [Google Scholar]
  26. Kirillov, A.; Mintun, E.; Ravi, N.; Mao, H.; Rolland, C.; Gustafson, L.; Xiao, T.; Whitehead, S.; Berg, A.C.; Lo, W.-Y.; et al. Segment anything. In Proceedings of the IEEE/CVF International Conference on Computer Vision, Paris, France, 1–6 October 2023; pp. 4015–4026. [Google Scholar]
  27. He, K.; Chen, X.; Xie, S.; Li, Y.; Dollár, P.; Girshick, R. Masked autoencoders are scalable vision learners. In Proceedings of the IEEE/CVF Conference on Computer Vision and Pattern Recognition, New Orleans, LA, USA, 18–24 June 2022; pp. 16000–16009. [Google Scholar]
  28. Dosovitskiy, A. An image is worth 16x16 words: Transformers for image recognition at scale. arXiv 2020, arXiv:2010.11929. [Google Scholar]
  29. Cao, H.; Wang, Y.; Chen, J.; Jiang, D.; Zhang, X.; Tian, Q.; Wang, M. Swin-unet: Unet-like pure transformer for medical image segmentation. In Proceedings of the European Conference on Computer Vision, Milan, Italy, 23–27 October 2022; Springer Nature: Cham, Switzerland, 2022; pp. 205–218. [Google Scholar]
Figure 1. WuJiang dataset example images: (a) representing regular land parcels; (b) representing irregular land parcels; (c) representing small target dense plots with complex backgrounds; (d) representing plots with fuzzy boundaries and buildings.
Land 14 01429 g001
Figure 2. Overall structure of the new parcel segmentation method combined with YOLOv5s and Segment Anything Model (SAM) using remote sensing images.
Land 14 01429 g002
Figure 3. Improved Yolov5s model structure.
Land 14 01429 g003
Figure 4. ECA network structure.
Land 14 01429 g004
Figure 5. Network structures of FPN and BIFPN. (a) Representing FPN structure; (b) representing the BiFPN structure.
Land 14 01429 g005
Figure 6. SAM network structure.
Land 14 01429 g006
Figure 7. Training and validating loss curves.
Land 14 01429 g007
Figure 8. Segmentation results of each model. The first four rows in Figure 8 present the segmentation results on the WuJiang dataset, while the last three rows show the results on the CCF BDCI dataset. (a) Represents the original remote sensing image, while (be) illustrate the segmentation results of SegNet, DeepLabv3+, Mask R-CNN, and our proposed improved algorithm, respectively. Red boxes indicate regions of segmentation failure.
Land 14 01429 g008
Figure 9. The confusion matrix of the improved model: (a) presents the confusion matrix of the improved YOLOv5s model; (b) presents the confusion matrix of the improved SAM model. Bg represents Background; SP represents Scattered Parcel; RP represents Regular Parcel; IRP represents Irregular Parcel; FBP represents Fuzzy Boundary Parcel.
Land 14 01429 g009
Table 1. Comparison of different datasets.
WuJiang DatasetCCF BDCI Dataset
Target ShapeDiverse shapes with some irregular parcelsDiverse shapes with some irregular parcels
Target DensityModerate density; some regions contain densely distributed small parcelsHigh density; significantly more parcels per unit area
Background ComplexityRich textures and diverse land cover categoriesModerate background texture, but adjacent and blurred parcel boundaries
ChallengesRich background textures and irregular parcel distribution; high density of small targetsClosely adjacent parcels with blurred boundaries; prone to under- and over-segmentation
Table 2. Details of the experimental environment configuration.
Configuration ItemVersion
HardwareGPUNVIDIA GeForceRTX2080Ti
Video memory11G
CPUIntel(R) i7-10875H
Memory16G
SoftwareOperation systemWindows 10
Programming languagePython 3.9
FrameworkPyTorch
CUDA11.1
Table 3. The segmentation results on two datasets.
IoU (%)Precision (%)Recall (%)FPS
WuJiang Datasets89.890.291.323.6
CCF BDCI Datasets85.788.589.227.6
Table 4. Experimental results produced by different models.
AlgorithmIoU (%)Precision (%)Recall (%)FPS
WuJiangCCF BDCIWuJiangCCF BDCIWuJiangCCF BDCIWuJiangCCF BDCI
Deeplabv3+80.179.780.981.281.280.617.219.4
SegNet76.175.177.276.475.476.524.524.5
Mask R-CNN76.175.875.877.277.378.54.95.6
Our Method89.885.790.288.591.389.223.627.6
Table 5. Mean ± standard deviation of performance metrics across five runs.
IoU (%)Precision (%)Recall (%)
WuJiang Datasets89.8 ± 0.2790.2 ± 0.3191.3 ± 0.29
CCF BDCI Datasets85.7 ± 0.3388.5 ± 0.3689.2 ± 0.34
Table 6. Ablation experiment of yolov5s model.
AlgorithmPrecision (%)Recall (%)FPS
Yolov5sECABiFPNSoft NMS
78.869.153.7
82.671.443.6
83.971.641.5
85.672.439.7
Table 7. Ablation experiment of SAM model.
AlgorithmPrecision (%)Recall (%)FPS
SAMInput Prompt AugmentationPost-Processing Strategy
80.581.931.2
82.182.430.9
83.282.630.2
Disclaimer/Publisher’s Note: The statements, opinions and data contained in all publications are solely those of the individual author(s) and contributor(s) and not of MDPI and/or the editor(s). MDPI and/or the editor(s) disclaim responsibility for any injury to people or property resulting from any ideas, methods, instructions or products referred to in the content.