2.2.1. Improved YOLOV5s Module
YOLOv5s [
20] is a lightweight single-stage object detection model that directly predicts bounding boxes and object categories from input images, eliminating the need for candidate region generation and classification. Its architecture consists of three key components: (1) Backbone Network—responsible for multi-level feature extraction using CBS (Convolution, Batch Normalization, and SiLU activation), C3 (local and global feature extraction via a dual-branch structure), and SPPF (Spatial Pyramid Pooling-Fast) to expand the receptive field through max pooling. (2) Neck Layer—enhances multi-scale feature fusion using the Feature Pyramid Network (FPN) and Path Aggregation Network (PAN). (3) Head Detection Layer—performs classification and regression, predicting object categories, bounding box coordinates, and confidence scores at multiple scales through three detection heads.
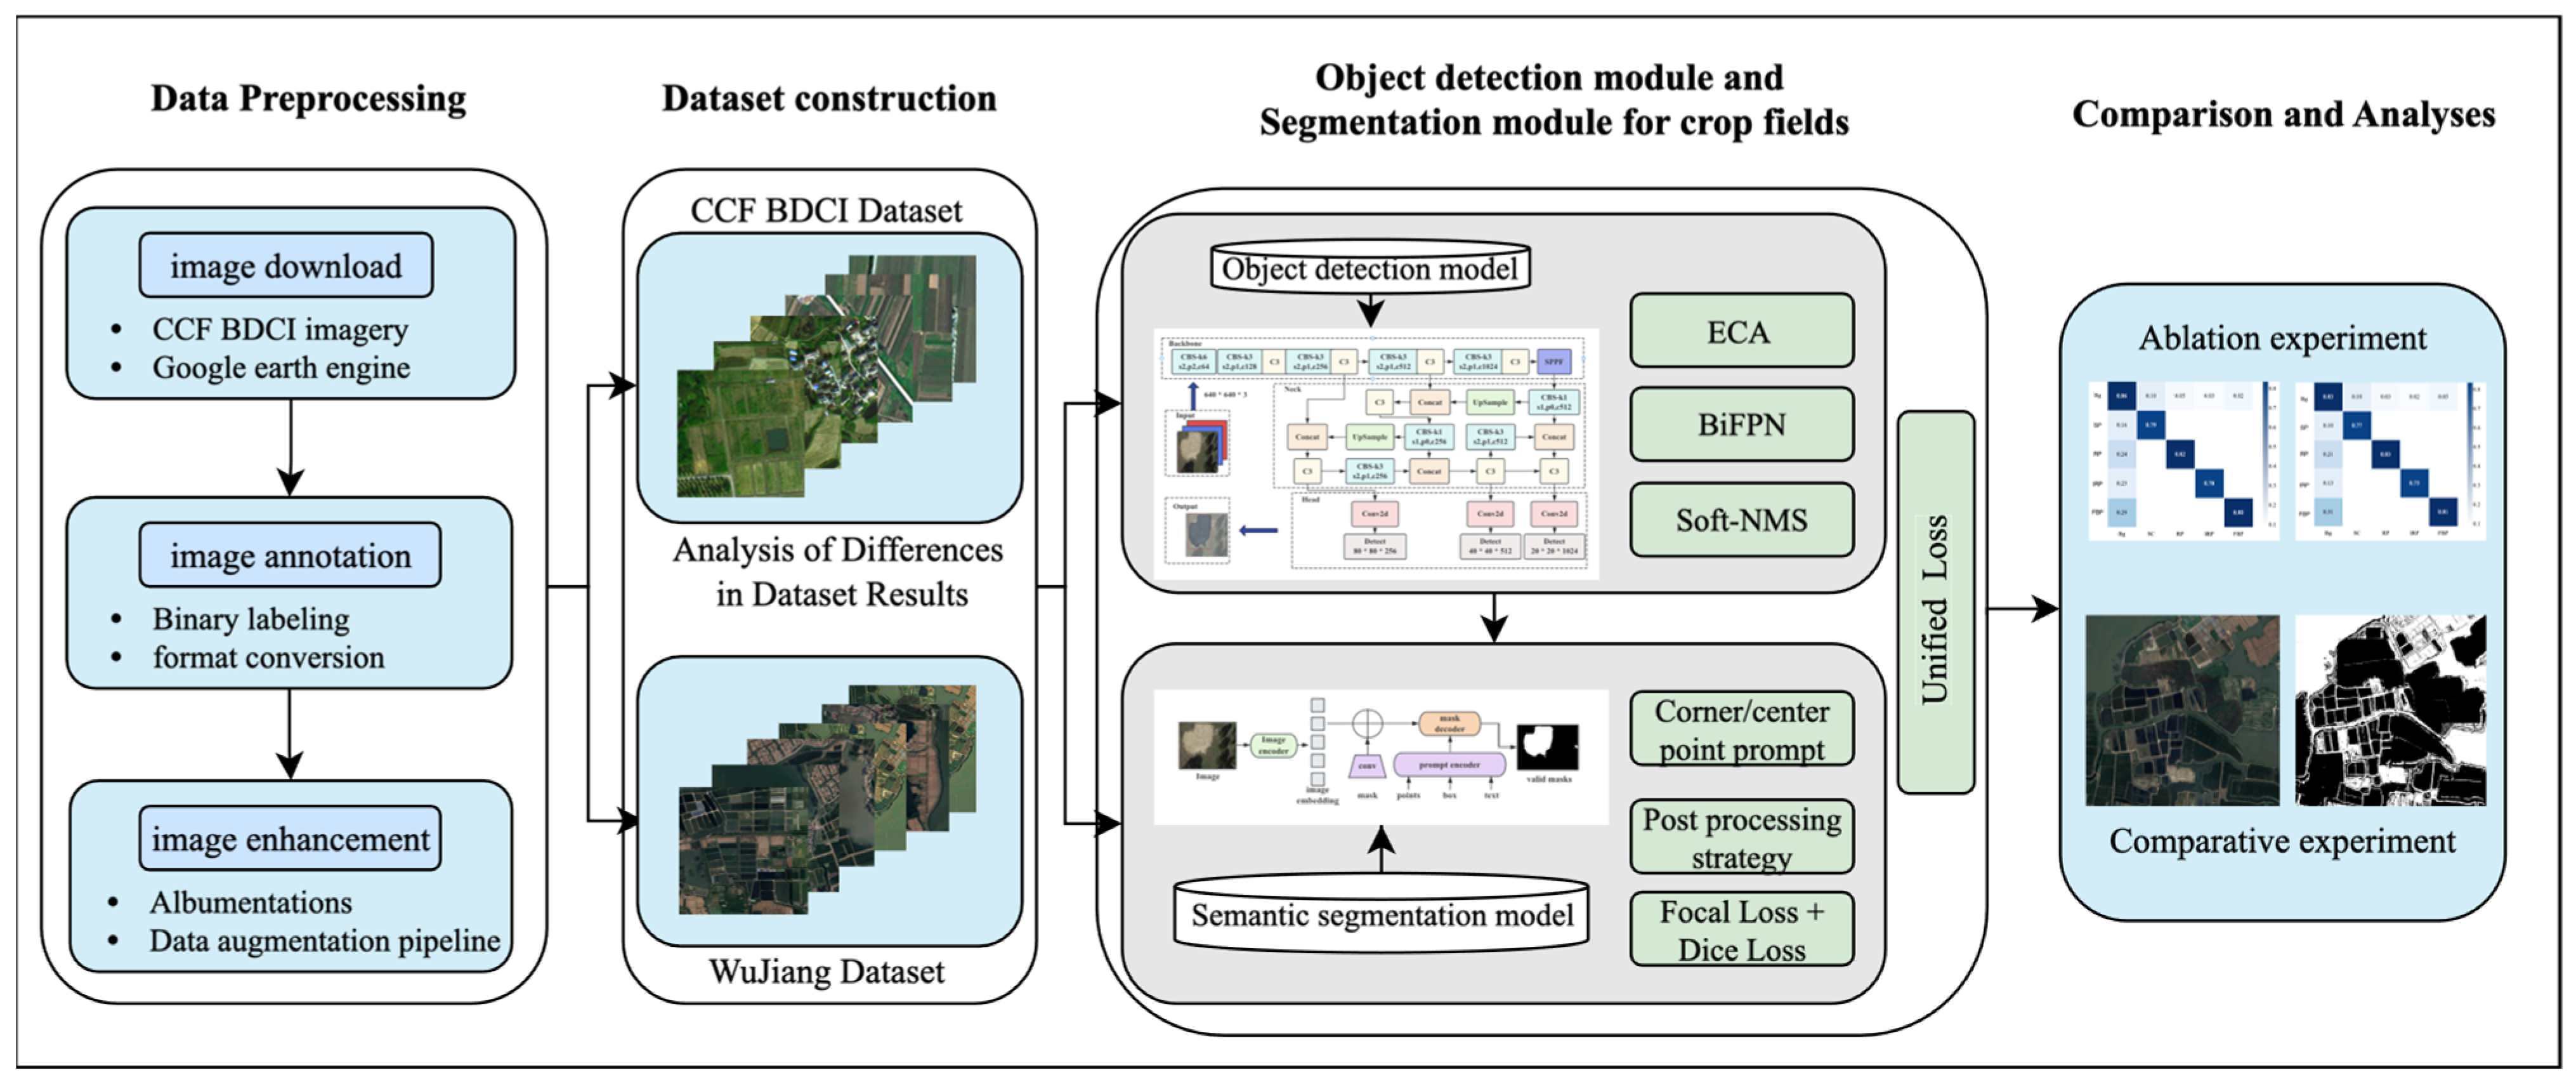
While YOLOv5s is designed to balance accuracy, speed, and computational efficiency, it faces several challenges, particularly in detecting small objects and adapting to complex scenes. To address these limitations, an improved Yolov5s model was proposed including three main enhancements in three key parts: (1) the Efficient Channel Attention (ECA) module was integrated to strengthen small-object perception and improve detection across different scales; (2) a Bi-directional Feature Pyramid Network (BiFPN) was adopted to enhance multi-scale feature fusion, improving the representation of small objects in cluttered backgrounds; and (3) Soft Non-Maximum Suppression (Soft-NMS) replaced traditional NMS to reduce incorrect suppression of bounding boxes, ensuring more accurate and stable detection results. The main flowcharts are shown in
Figure 3.
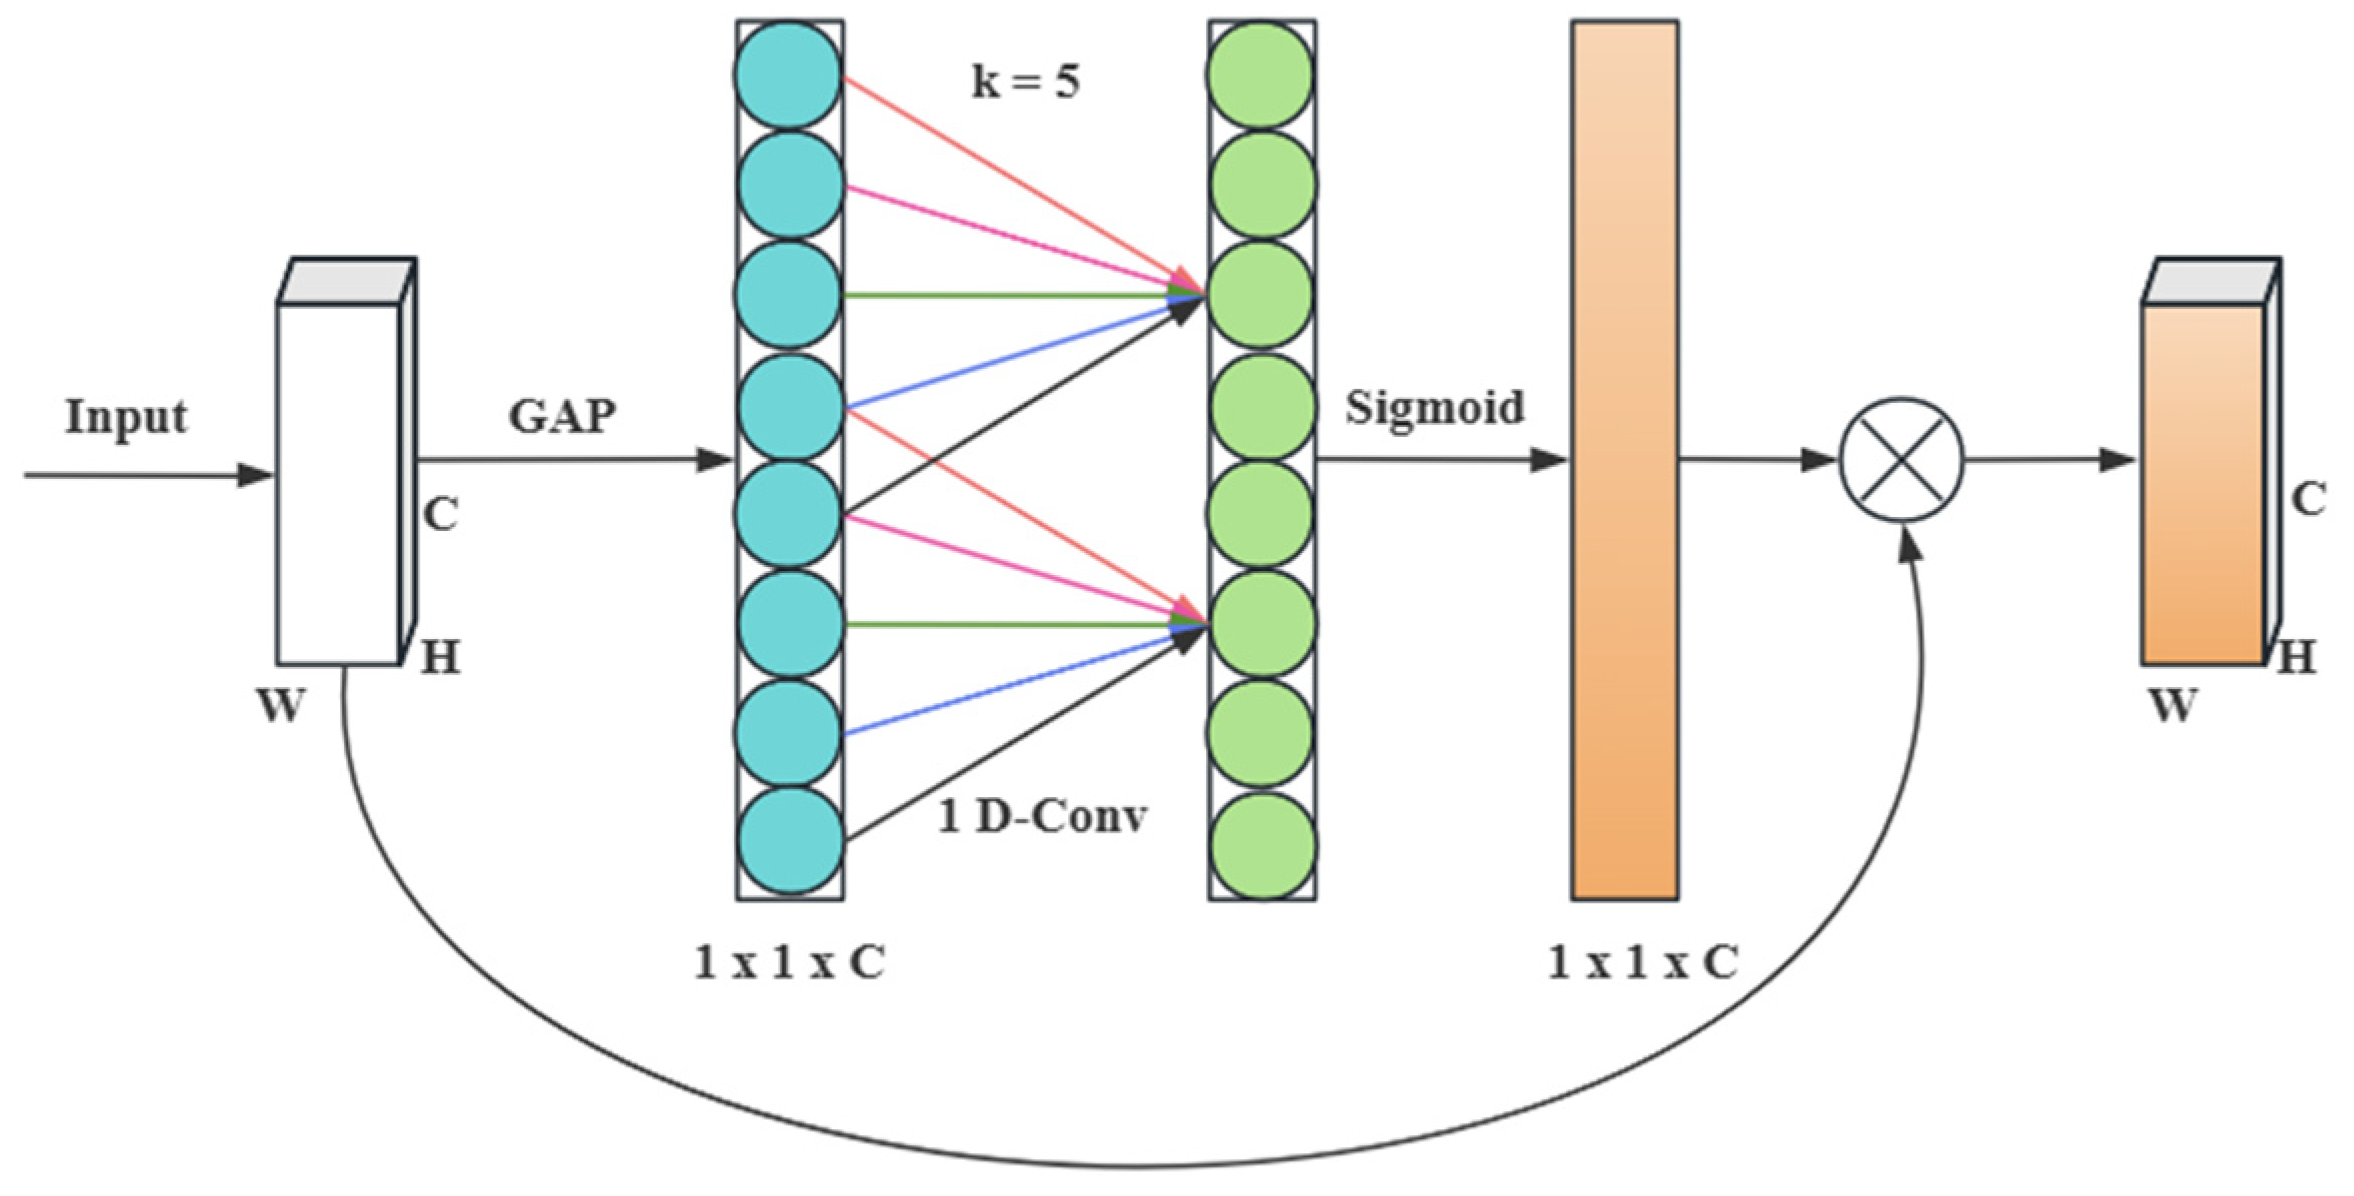
The features of plots in remote-sensing images are often subject to background complexity and irregular plot distribution. The original YOLOv5s model insufficiently utilizes channel features and has weak perception capabilities when capturing detailed features. To address this issue, the Efficient Channel Attention (ECA) [
21] module is embedded. By adaptively allocating weights in the channel dimension, the module enhances the model’s ability to focus on significant features and capture critical details, particularly for small plot objects.
Figure 4 shows the network structure of the ECA module.
In comparison to other attention mechanisms, such as Squeeze-and-Excitation Network (SE) [
22] and Convolutional Block Attention Module (CBAM) [
23], ECA achieves channel attention computation through a simple 1D convolution in a parameter-free and locally interactive manner. This approach neither significantly increases computational overhead nor affects inference speed, ensuring model efficiency while improving detection accuracy.
Figure 2 illustrates the ECA module, which consists of four parts: a global average pooling layer, a 1D convolution layer, a Sigmoid activation layer, and a multiplication layer. The input has dimensions of (H, W, C). Through global average pooling, a band matrix of size k learns feature weights. Subsequently, the Sigmoid activation function outputs the weight matrix, which is multiplied by the input to yield the final result.
In the improved model, ECA is embedded after the shallow C3 module in the backbone network to enhance the capture of small objects and boundary information. Additionally, ECA is added after the SPPF module to expand the receptive field and redistribute channel weights, compensating for the dilution of channel information by pooling operations and ensuring the effective expression of key information in global features. These improvements enhance the model’s capabilities in multi-scale feature extraction and detailed feature capture.
- 2
Improvement feature fusion combined FPN and BiFPN algorithms
Enhancing a model’s ability to represent targets of various scales serves as a vital aspect of feature fusion. The original YOLOv5s model, during the feature fusion process, overly emphasizes the aggregation of high-resolution features, resulting in ineffective integration of shallow features. To address this issue, we have adjusted the feature fusion mechanisms of the Feature Pyramid Network (FPN) and Bidirectional Feature Pyramid Network (BiFPN) [
24] on top of FPN.
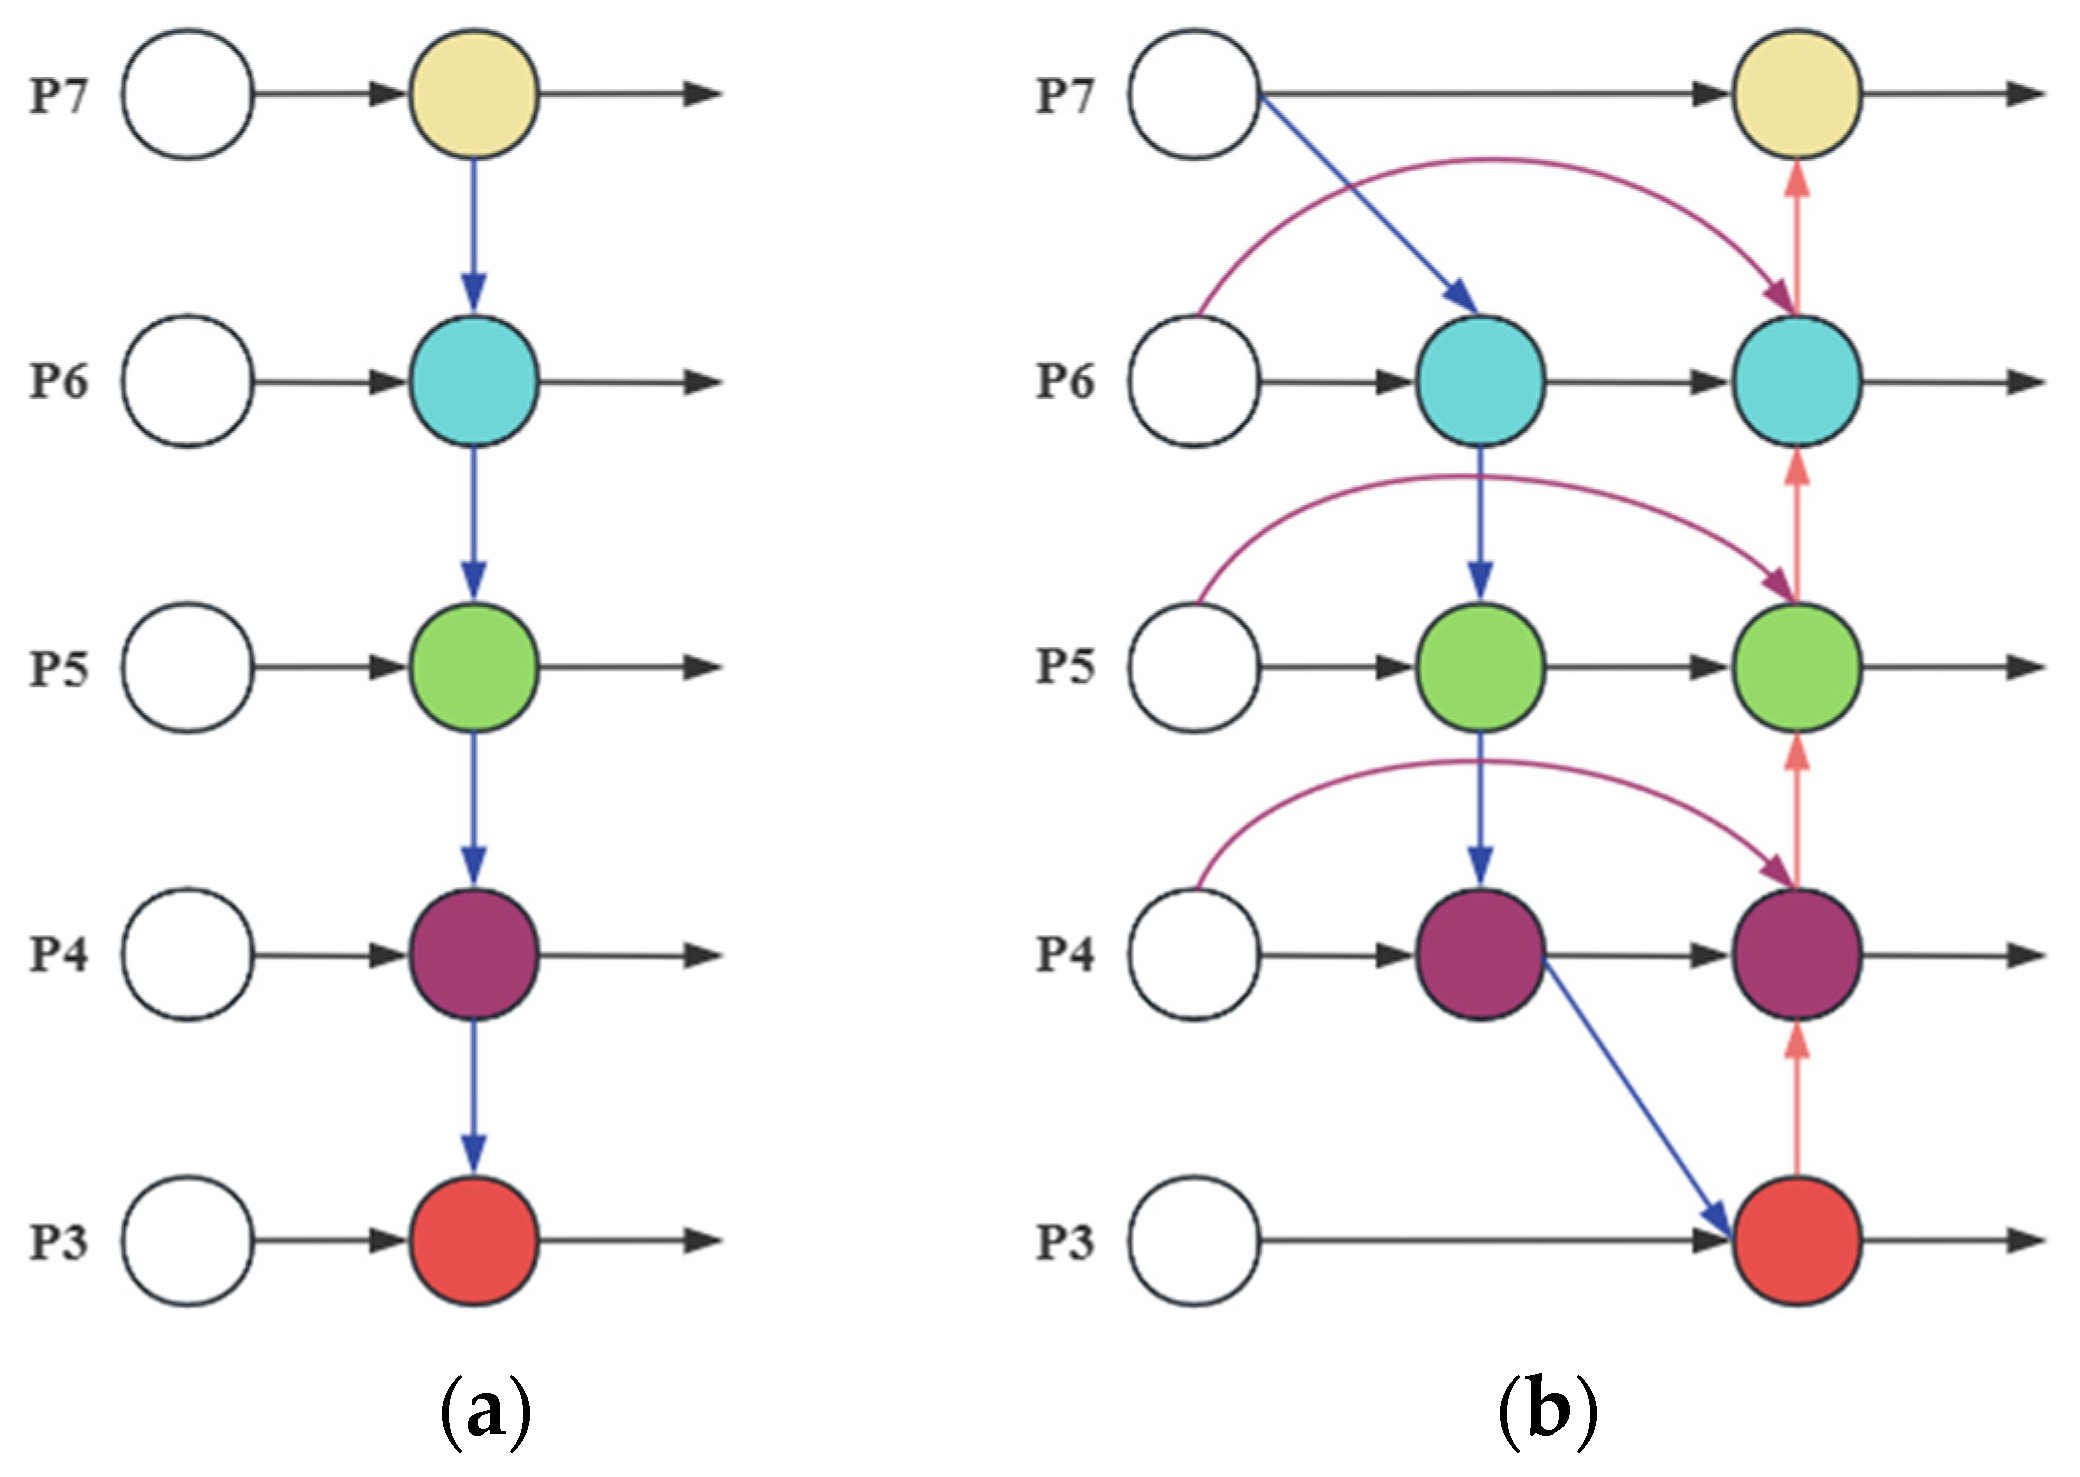
Figure 5 presents two types of feature fusion networks. The FPN structure, as shown in (a), conveys semantic information top-down, fusing deep-level features with shallow-level features. However, this unidirectional information transfer can lead to the loss of low-level feature information. The BiFPN structure, as shown in (b), includes both top-down and bottom-up feature fusion paths, enabling the interaction between high-level semantic features and low-level spatial detail features. This avoids the loss or dilution of low-level features in traditional FPN, thereby increasing the model’s adaptability to multi-scale targets.
In the improved model, we have added connection paths from deep features (P5) to shallow features (P3) within the feature pyramid. At the same time, we skip the feature fusion nodes of intermediate layers to strengthen the interaction between deep and shallow features while effectively controlling computational costs by reducing redundant calculations in intermediate layers. Finally, a dynamic weight allocation mechanism is adopted to optimize the weights of features of different scales, enhancing the balanced utilization of multi-level information and forming a more comprehensive and efficient feature fusion process.
- 3
Improving the prediction stage using Soft-NMS algorithm
The traditional Non-maximum Suppression (NMS) method employs a threshold to suppress bounding boxes with significant overlap. However, remote-sensing images feature complex terrain and considerable boundary overlap among land parcels. In such cases, traditional NMS can lead to the accidental removal of crucial small land parcels or edge areas, resulting in the loss of critical information. To mitigate this issue, we adopt the Soft-NMS algorithm [
25], an improved version of NMS. In contrast to traditional NMS, Soft-NMS uses a weighted adjustment mechanism to gradually reduce the confidence of overlapping boxes rather than deleting them directly, thereby more accurately preserving target information.
Equations (1) and (2) represent the decay functions of traditional NMS and Soft-NMS, respectively, where M denotes the box with the highest score,
denotes the box to be processed,
denotes the weighted weight, and
denotes the score before and after weighting. In Equation (1), boxes with high values of Iou are suppressed directly to zero. In Equation (2), with an increase in Iou, the confidence of the box undergoes a progressive decline.
Soft-NMS alleviates the problem of suppressing too many boxes through this ad-justment, allowing multiple overlapping candidate boxes to coexist. This strategy enables more accurate preservation of target information when detecting small land parcels or complex boundaries, reducing false deletions. Especially when dealing with areas with ambiguous or overlapping boundaries, it further improves the accuracy of bounding box generation.
2.2.2. Improved SAM Module Based on Pre-Trained Weights
Introduced in April 2023, the Segment Anything Model (SAM) [
26] represents a potent deep learning-based general segmentation model. Unlike conventional segmentation models, the SAM excels in efficiently segmenting objects within any image without requiring task- or domain-specific data annotations. This model has been trained on the SA-1B dataset, comprising millions of images and billions of masks. Its core strength lies in the integration of self-supervised learning methods, specifically Masked Autoencoders (MAE) [
27], with pre-trained Transformer architectures [
28]. This combination enables SAM to process various forms of input prompts, such as points, bounding boxes, and text cues, and generate pixel-level object segmentation masks.
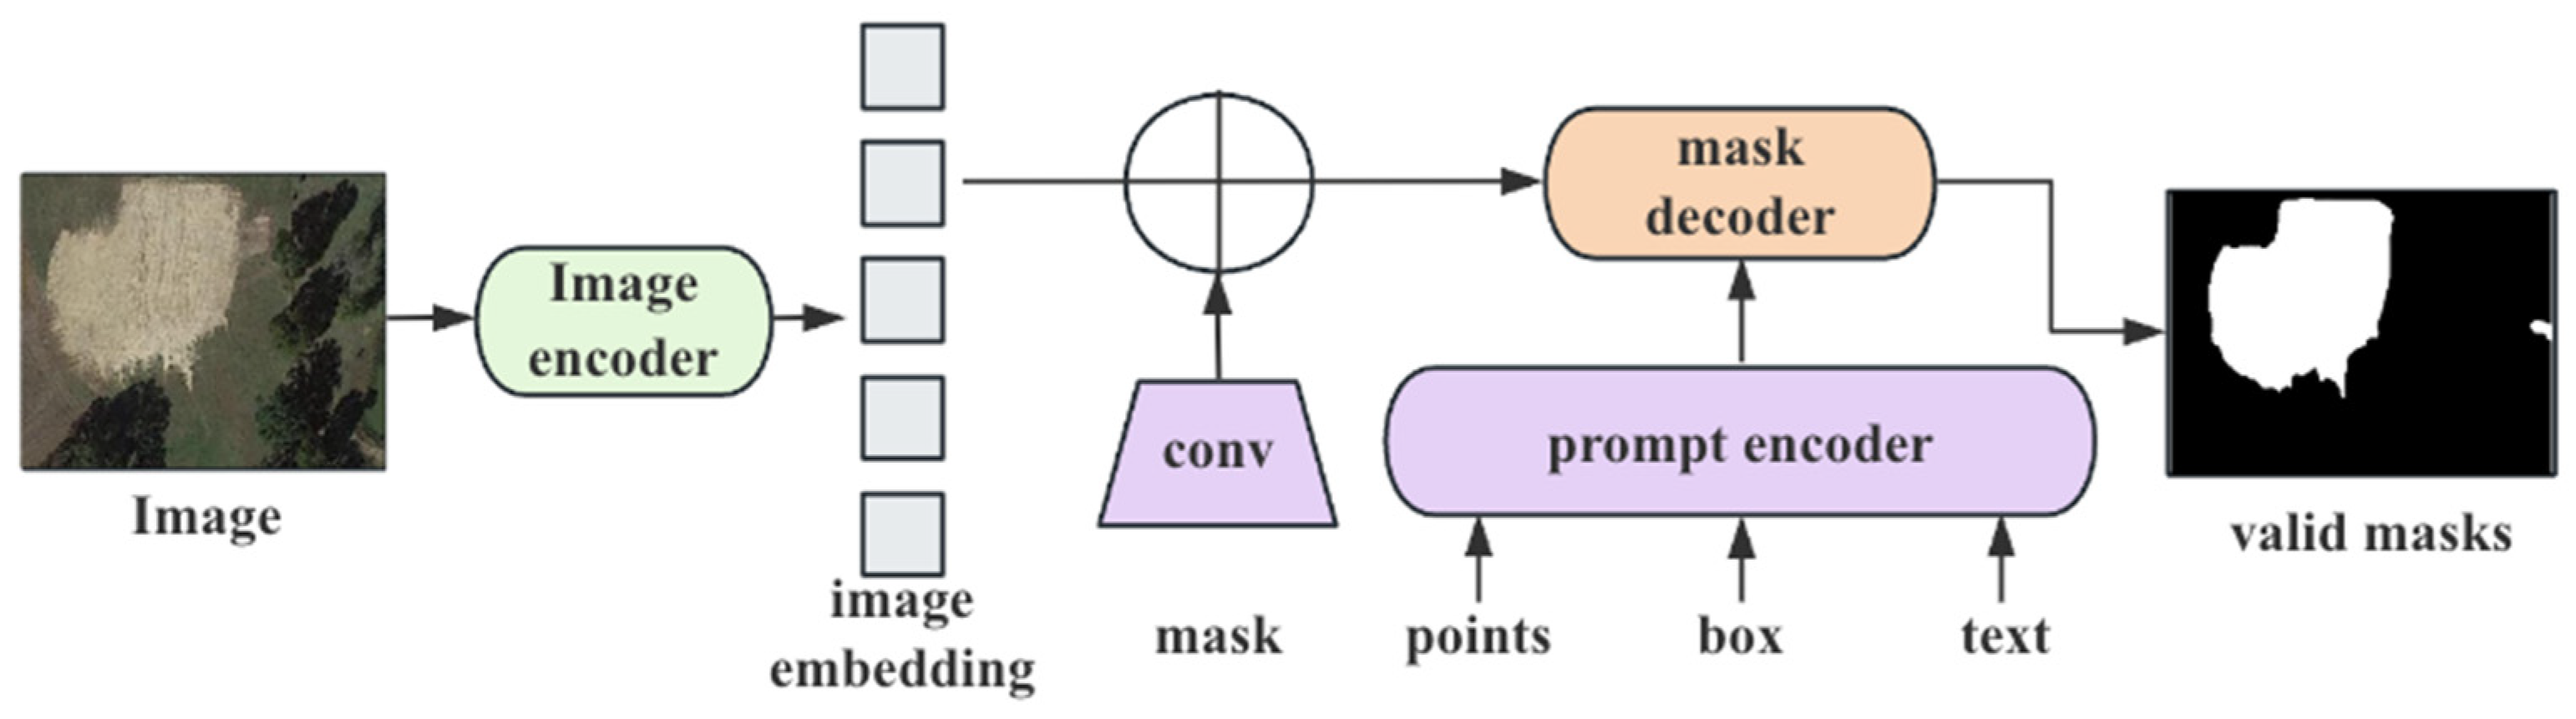
Figure 6 illustrates the architecture of the SAM, consisting of three components: an image encoder, a prompt encoder, and a mask decoder. During image segmentation, the image encoder is responsible for extracting image features, while the prompt encoder analyzes these features based on different input prompts (e.g., bounding boxes, points, or text). Subsequently, the mask decoder generates high-precision segmentation masks based on the prompts. This modular, collaborative design allows SAM to adapt flexibly to diverse task requirements, making it widely applicable in fields such as remote sensing, image analysis, and land resource management.
In this study, the SAM was used with its publicly released pre-trained weights, trained on large-scale natural image datasets (SA-1B) with billions of segmentation masks. This choice is justified by the model’s original design as a prompt-driven, task-agnostic segmentation system with demonstrated cross-domain transferability. Instead of re-training, we focused on enhancing SAM’s segmentation accuracy via prompt engineering strategies—such as using YOLOv5s-derived bounding boxes and center/corner points—as well as post-processing steps like morphological operations and mask filtering. These enhancements allow SAM to better adapt to parcel segmentation tasks in remote sensing without the substantial data or computational cost associated with fine-tuning.
To enhance the adaptability and segmentation accuracy of SAM in parcel segmentation tasks for remote sensing images, several optimization strategies were implemented while preserving its original architecture. Specifically, (1) an input prompt enhancement strategy was developed, leveraging bounding box information from YOLOv5s alongside corner and center point prompts to improve segmentation precision; (2) post-processing techniques were introduced, including morphological operations to repair fragmented regions, mask stability scoring to filter out low-quality outputs, and abnormal mask removal based on target scale, all contributing to improved boundary continuity and overall mask quality; (3) A combined Focal Loss and Dice Loss function was employed to address sample imbalance and enhance segmentation performance for small objects.
The SAM supports points, bounding boxes, and text as input prompts. The output format of YOLOv5s provides coordinate information for the top-left and bottom-right corners of bounding boxes, along with class labels and confidence scores. This coordinated information is directly used as box-type prompts for the Segment Anything Model (SAM) to define the spatial region of interest and guide its mask prediction process. To further enhance the input prompts and improve SAM’s segmentation capabilities in complex scenarios, we augment the bounding box prompts by incorporating corner points and center points, guiding SAM to more accurately focus on the target regions and generate fine-grained segmentation results.
Corner point prompts are generated based on the four corners (top-left, top-right, bottom-left, bottom-right) of the bounding box, providing more precise geometric information. Differing from the sole use of bounding boxes, explicitly adding corner point prompts aids the model in better attending to target boundaries, enhancing segmentation accuracy at finer details. Center point prompts are obtained by calculating the geometric center of the bounding box, as witnessed in Equation (3). Especially for larger target regions, center point prompts can further emphasize the core part of the target area, helping SAM focus on the internal features of the target, better guiding the segmentation process, and ensuring segmentation capability for complex targets.
By combining these two types of input prompts—(1) the box-type prompts directly generated by YOLOv5s based on the predicted bounding box coordinates and (2) the point-type prompts derived from the corresponding corner and center points—we effectively compensate for SAM’s strong dependence on high-quality prompts. This multi-prompt strategy enables SAM to more accurately localize and segment land parcels, particularly in scenarios involving complex textures, dense object distributions, or small-scale targets.
- 2
Post-processing of segmentation masks through morphological operations
In the task of parcel segmentation in remote-sensing images, the segmentation masks generated by the SAM demonstrate high initial quality. However, some masks exhibit incomplete boundaries or contain small, noisy regions. Based on the characteristics of this task, we propose post-processing optimization strategies for the SAM-output masks:
Stability score filtering: The SAM output includes a stability score (ranging from 0 to 1) for each mask, which serves as a measure of its reliability. Masks with stability scores below the threshold of 0.4 are discarded to eliminate unreliable masks and ensure the reliability of subsequent segmentation results.
Morphological operation optimization: For masks with small holes or boundary disruptions, morphological closing operations are employed for repair. The closing operation consists of a sequence of dilation and erosion operations, primarily aimed at enhancing the integrity of the target morphology by filling small holes and eliminating fine noise. Dilation expands the boundary of the target region outward to fill small internal voids, while erosion contracts the expanded boundary inward on the basis of dilation to remove the noise introduced during dilation. The formulas are shown in Equation (4), where “
” denotes the dilation operation, “
” denotes the erosion operation, A is the input binary image, and B is the structuring element that defines the shape and size of the operation. In this case, an elliptical kernel is used as the structuring element, with a kernel size set to 3 × 3.
Mask area adjustment: Since some masks in remote-sensing images may represent noise regions (due to their excessively small size), mask areas are filtered based on the typical scale of the target regions. Masks with areas smaller than 50 pixels are considered noise and are discarded directly. Masks with areas greater than 30,000 pixels are considered abnormal regions and require further inspection and processing. This strategy reduces meaningless regions in the segmentation results and improves the overall quality of the masks.
- 3
A combined Focal Loss and Dice Loss function
The segmentation loss is computed using a combination of Focal Loss and Dice Loss. Focal Loss is an improvement on binary cross-entropy loss, formulated in Equation (5).
where
represents the predicted probability of the correct class, α denotes the balancing factor, and
indicates the modulating factor.
Dice Loss maximizes the negative Dice coefficient to better reflect the similarity between the model’s predictions and the true labels, as shown in Equation (6).
where
and
denote the predicted and true values for the i-th pixel, respectively.
Simply put, the segmentation loss is calculated using a linear combination of Focal Loss and Dice Loss. For the segmentation loss, we assign = 0.5 and = 1.0 to balance between pixel-level classification (especially under class imbalance), which is essential for precise parcel boundary delineation.
2.2.3. Unified Loss for Detection and Segmentation
The loss function is divided into two primary components, corresponding to the object detection task and the semantic segmentation task, respectively. The object detection loss ( comprises localization loss (), classification loss (), and confidence loss ().
The localization loss is calculated using the Complete Intersection over Union (CIoU) and is only applied to positive samples, as formulated in Equation (8).
where IoU denotes the Intersection over Union between the predicted bounding box and the ground truth box;
represents the Euclidean distance between the centers of the predicted and ground truth boxes; c is the length of the diagonal of the smallest bounding box that encompasses both the predicted and ground truth boxes; v measures the aspect ratio difference between the predicted and ground truth boxes; and α refers to the weight factor.
Both the classification loss and the confidence loss are calculated using the Binary Cross-Entropy Loss (BCE), as formulated in Equation (11).
The classification loss measures the discrepancy between the predicted and true categories, focusing on positive samples. The confidence loss assesses whether the predicted bounding box contains the target object, considering all samples, as illustrated in Equations (12) and (13).
where N is denoted as the total number of samples, C as the number of categories,
as the predicted probability of the i-th positive sample belonging to category C, and
as the true label of the i-th positive sample for category C.
The total loss for the object detection component is the weighted sum of these three parts, as indicated in Equation (14), where
are the weight coefficients. We set
= 0.05,
= 1.0, and
= 0.5. Given that the bounding boxes are mainly used as input prompts for downstream segmentation, the primary focus is on providing accurate region proposals rather than achieving high localization accuracy. Therefore, we down-weight the localization loss to reflect its secondary role in this dual-stage approach.
The final combined loss function is given in Equation (15), where are the weight coefficients. we emphasize segmentation performance by setting = 2.0 and = 1.0. This weighting strategy was validated on dataset and led to improved performance in both mask quality and training stability.


 ,
, 

