1. Introduction
Oasis ecosystems are complex regional ecological systems formed under the constraints of limited water resources and are indispensable in arid and semi-arid regions. They provide conditions suitable for stable vegetation growth and human habitation [
1,
2]. As a unique geographical, ecological, and economic complex system in arid regions [
3], oases are directly linked to regional food security, ecological balance, and socio-economic stability [
4,
5]. The ecological vulnerability and economic importance of oases in the arid regions of northwest China are in sharp contrast: less than 4% of the land area accommodates over 90% of the population and more than 95% of social wealth, and this has made oases in arid regions become key challenging areas for sustainable development [
6,
7].
Despite their critical importance, oases are confronted with multiple and interrelated crises, including notably escalating water scarcity [
8], ecosystem degradation, and unsustainable agricultural practices [
9,
10,
11,
12]. Climate change projections exacerbate these challenges. According to the IPCC AR6, renewable water resources across arid regions of Central Asia are expected to decrease by 23–41% by 2050 [
13]. Recent studies further highlight the growing water insecurity in Central Asia; the conflict between limited water availability and expanding agricultural land has already triggered cascading ecological and economic crises [
14,
15], as illustrated by the 2020 seasonal drying of the Tarim River, which forced the abandonment of 170,000 hectares of farmland [
16]. Consequently, optimizing the allocation of water and land resources has emerged as a pivotal challenge for achieving sustainable oasis development.
In recent years, as research on oases has progressively deepened, scholars have increasingly acknowledged the central role of agricultural water use in shaping human–water interactions in arid regions [
17,
18,
19]. Studies have shown that agricultural water use in the oasis regions of northwest China’s arid zones represents more than 90% of total water consumption [
20]. The expansion of cultivated land and the reliance on flood irrigation practices have significantly increased water demand, often exceeding local supply capacities. Unsustainable water-use patterns have not only contributed to groundwater depletion and salinization but also exacerbated land degradation and desertification processes [
21,
22,
23,
24,
25,
26,
27]. Its precise quantification and efficient management have emerged as focal scientific challenges in ensuring the sustainable utilization of water resources in arid regions. However, although existing studies have primarily estimated and analyzed agricultural water resources in oases at the macro-scale, fine-scale investigations that uncover underlying patterns and system characteristics are still lacking in detail and depth [
28,
29,
30], and this limitation has significantly hindered the achievement of the optimized allocation and efficient use of water resources [
31].
The accurate extraction of crop structures and areas constitutes an essential foundation for the precise management of agricultural water resources [
32]. Although large-scale studies have achieved significant advances in crop structure mapping, the complex agricultural patterns in oasis regions present challenges to the accurate extraction of crop structures at high resolution [
33,
34,
35]. Traditional single-image spectral classification methods, such as Maximum Likelihood and Support Vector Machines, face significant limitations in crop identification due to the inherent spectral confusion during critical crop growth stages [
36]. This challenge is particularly pronounced in oasis regions, characterized by complex and diverse cropping patterns, where the applicability of these methods is further diminished [
37]. In contrast, time-series classification methods have demonstrably improved identification accuracy by leveraging phenological information throughout the crop growing season. However, much of the existing research in this area has relied on low-spatiotemporal-resolution imagery from platforms like MODIS and Landsat [
38], which are insufficient for the high-precision crop identification required for the small land parcels typical of oasis environments. More recently, decision tree methods, integrating vegetation index time series with crop phenological features and expert knowledge, have shown promising small-sample adaptability and interpretability [
39,
40]. Despite these advancements, the effectiveness of such models is contingent on high-quality remote sensing data, and the regional variability of crop phenological characteristics presents a considerable challenge to their broader generalization and application [
41,
42].
In order to better achieve the efficient utilization and optimized allocation of agricultural water resources in arid regions, it is crucial to accurately understand crop water requirements [
43,
44,
45]. Crop water demand is typically estimated based on reference crop evapotranspiration and crop coefficients. As the standard approach recommended by the Food and Agriculture Organization (FAO) of the United Nations, the Penman-Monteith model offers a more accurate estimation of reference evapotranspiration compared to that of empirical formulas [
46,
47]. Crop coefficients characterize the water requirements of crops at different growth stages [
48]. Therefore, by accurately calculating reference evapotranspiration using the Penman-Monteith equation and integrating crop coefficients for crop phenology in oasis regions, a water demand estimation model grounded in crop physiological characteristics can be established [
49]. This approach not only provides a robust theoretical and technical foundation for the sustainable development of oasis agriculture in water-scarce arid regions but also lays a scientific basis for the optimized allocation and efficient utilization of regional water resources.
Oasis agriculture faces an urgent need to balance crop structure optimization with efficient water resource utilization due to increasingly severe water scarcity. Existing research has attempted to use multi-objective optimization models (e.g., linear programming, fuzzy optimization, genetic algorithms) to simulate water and land resource allocation strategies under different crop combinations [
50,
51,
52]. These efforts have, to some extent, achieved regional crop layout optimization and improved resource-use efficiency. However, current research still has three main shortcomings: A comprehensive and systematic evaluation framework for the coupling mechanisms among water, soil, and crops has yet to be established. Most optimization models depend on static data, making it difficult to reflect dynamic uncertainties such as climate change and market fluctuations. Existing methods are often constrained by variations in natural geography and socioeconomic conditions, hindering their replicability and broad applicability across different regions [
53,
54,
55].
While existing research has provided valuable insights into oasis agriculture and water management, many studies have focused on well-known oasis systems such as those in the Tarim or Hexi regions, resulting in knowledge gaps regarding other critical regions [
3,
56,
57,
58,
59,
60,
61,
62]. Altay Prefecture in northern Xinjiang is one such overlooked but crucial region. Altay Prefecture, as a transition zone between arid and semi-arid ecosystems, hosts unique oasis systems where rapid agricultural expansion has led to a sharp increase in water demand. This makes Altay not only a representative site for studying the intricacies of oasis agricultural water use but also a frontier region for testing innovative water and land optimization strategies. Its geographic setting and socio-economic transformation offer a unique lens for examining sustainable oasis development in a broader Central Asian context.
In light of this, the present study focuses on the coupling relationship between agricultural land and water resources in the oasis region of Altay Prefecture. By leveraging remote sensing technology, we accurately extract the complex crop structure and spatial distribution within the oasis. Combined with meteorological data, a crop water requirement model based on crop physiological characteristics is constructed to reveal the water resource response mechanisms under multiple cropping structures in multiple scenarios. The findings provide a scientific basis and decision-making support for the efficient management and sustainable development of land and water resources in Altay and wider arid-zone oases.
2. Materials and Methods
2.1. Study Area
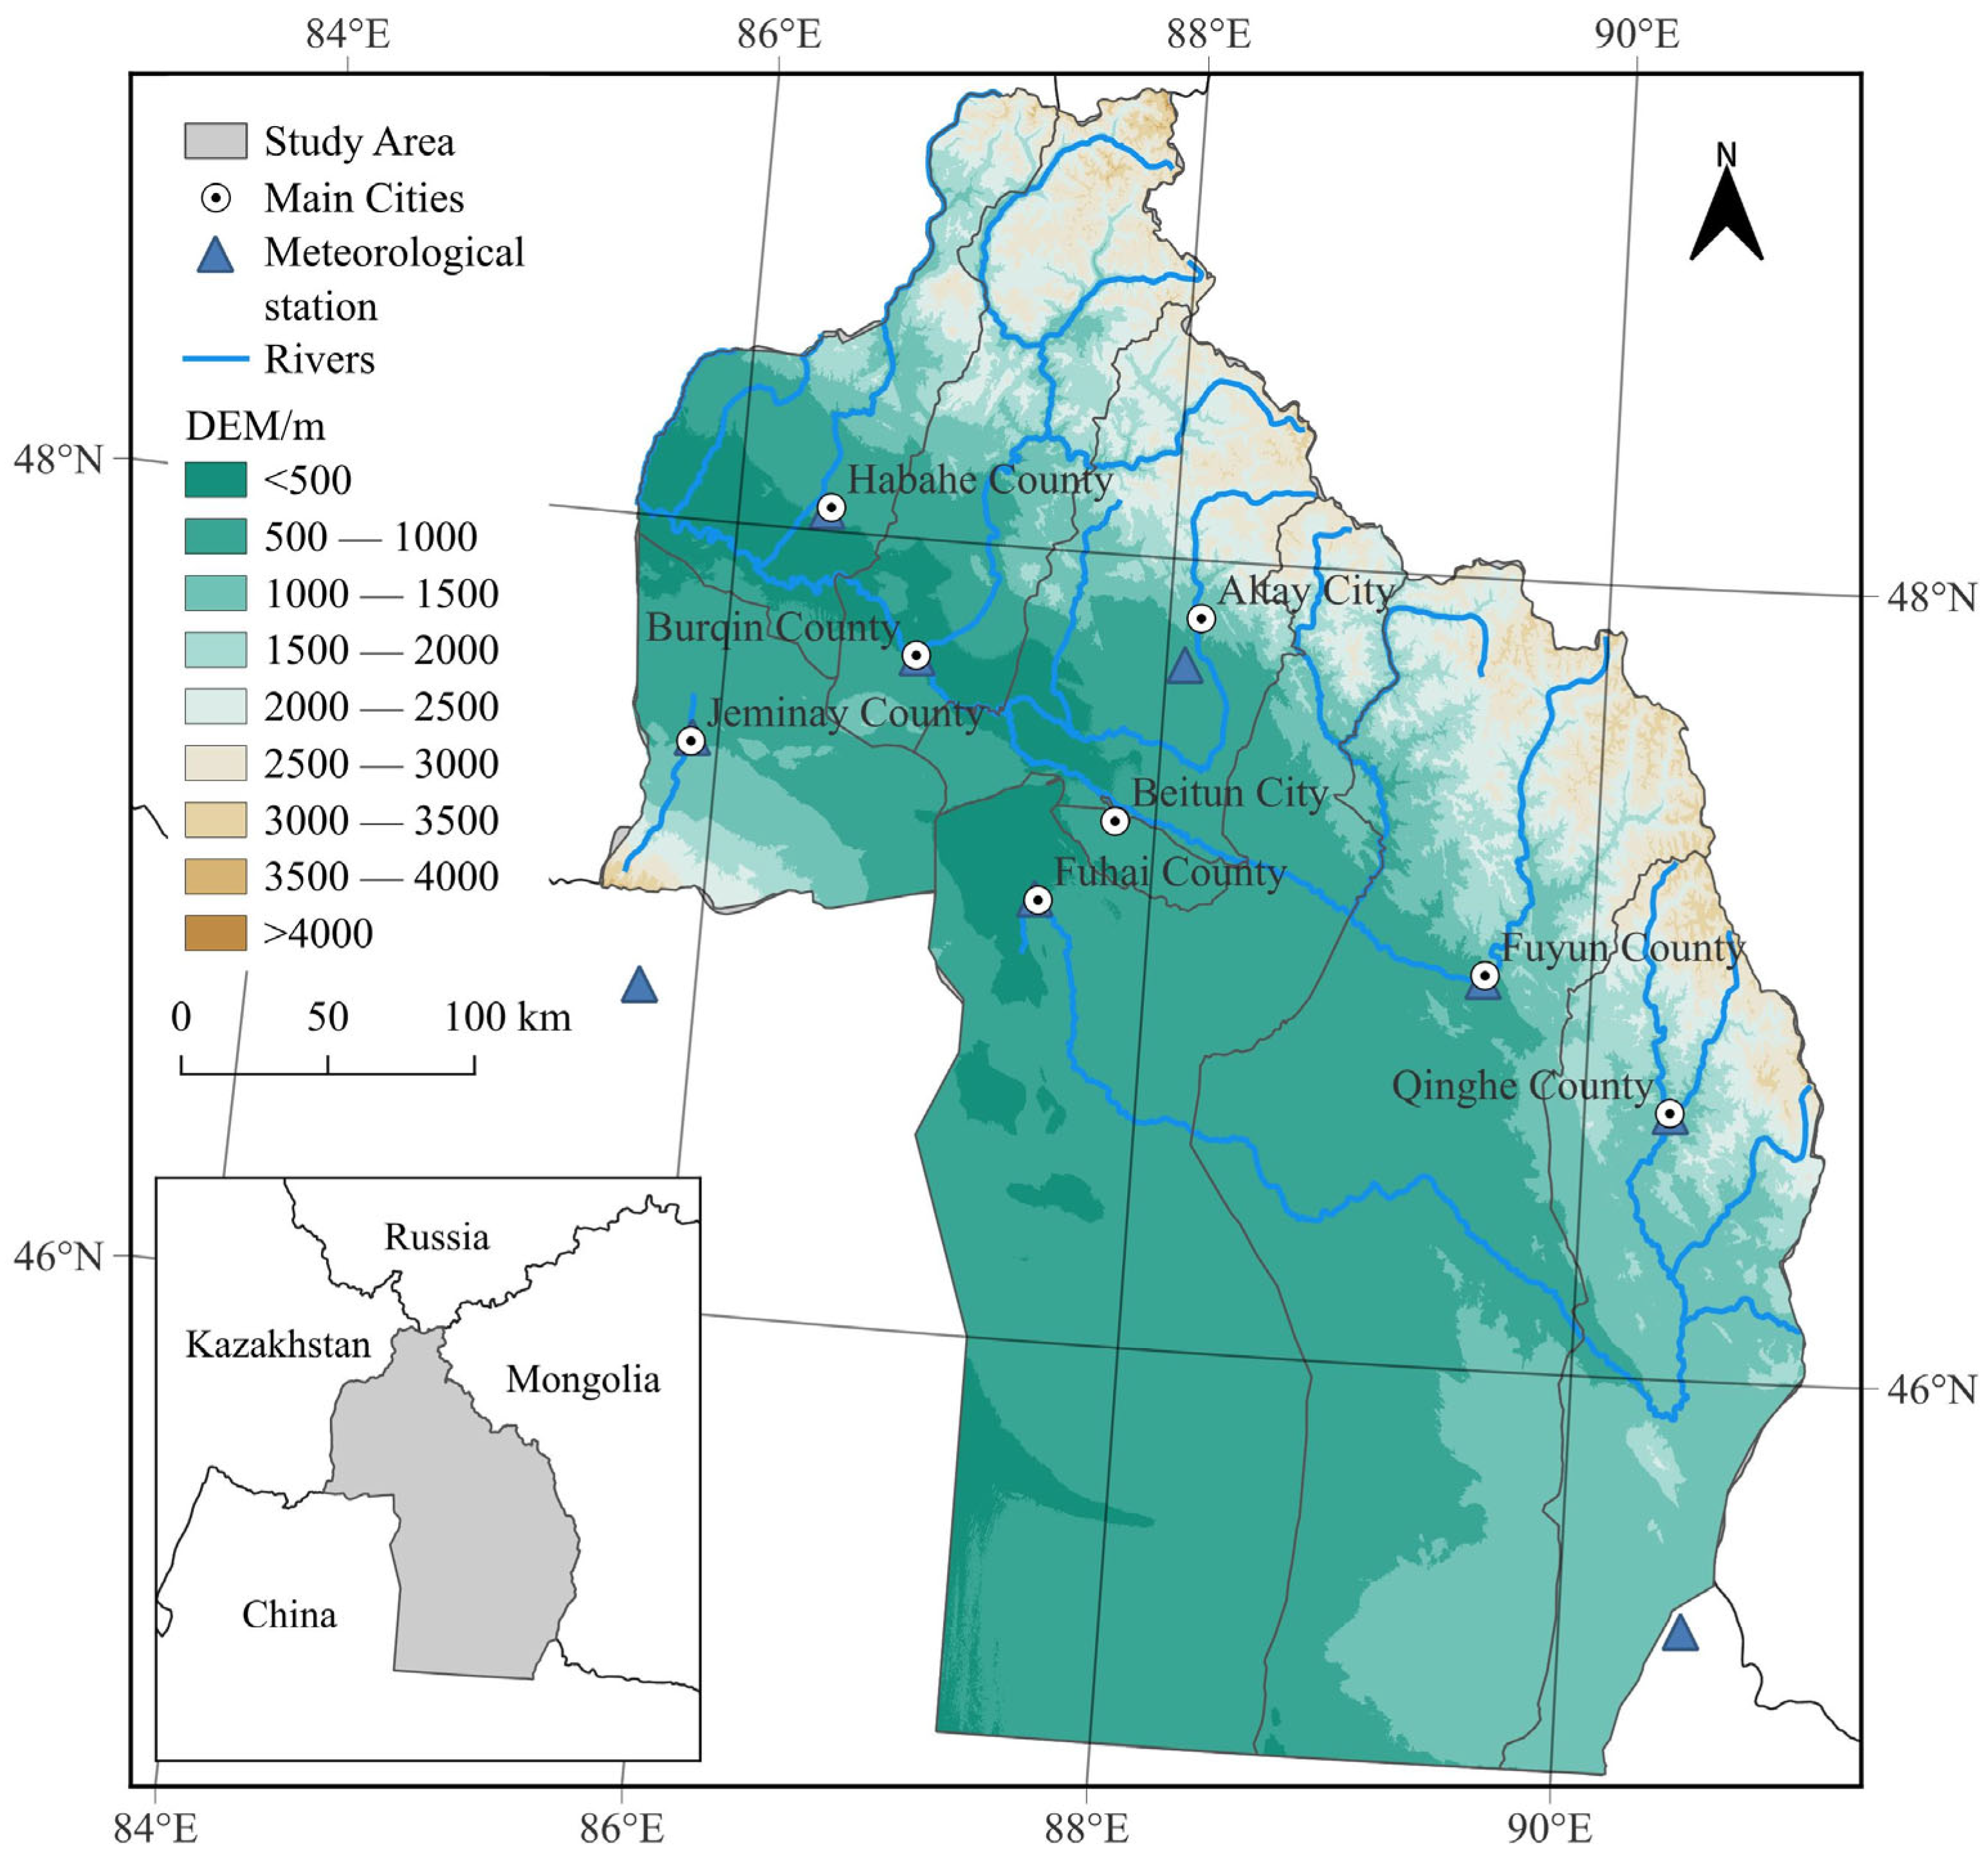
Altay Prefecture (45°00′–49°10′ N, 85°31′–91°04′ E) is located at the junction of China, Kazakhstan, Russia, and Mongolia, situated on the southwestern slope of the central Altay Mountains and the northern edge of the Junggar Basin. Covering a substantial area of 1.18 × 10
5 km
2, the prefecture accounts for approximately 7.1% of Xinjiang’s total landmass in China. Administratively, it comprises six counties and two cities, namely Altay City, Beitun City, Burqin County, Habahe County, Jeminay County, Fuhai County, Fuyun County, and Qinghe County (
Figure 1). The area experiences a temperate continental cold climate, characterized by low precipitation, high evaporation, and ample sunlight. The average annual precipitation ranges from 131 to 223 mm, while the annual evaporation rate is between 1367 and 2066 mm. The annual average total water resources in Altay Prefecture are 10.18 × 10
9 m
3, making it one of the water-rich areas in Xinjiang, China. Its hydrology is dominated by three major river systems: the Irtysh River and the Ulungur River, both originating from the Altai Mountains, and the Jeminay Mountain Stream, which originates from the Saur Mountains. These three river systems collectively drain an area of 9.57 × 10
4 km
2.
The vegetation cover in Altay Prefecture exhibits a clear vertical zonation pattern. Forests and alpine meadows dominate the mountainous areas, while the plain regions are largely characterized by arid desert landscapes with sparse vegetation, including extensive bare soil and Gobi surfaces. These areas are marked by low precipitation and high evaporation rates. Oases, vital for agricultural activity, are primarily distributed across the alluvial plains of these river valleys. In the plains, the soil-type transition from north to south, consisting of brown calcic soil, light brown calcic soil, gray-brown desert soil, and eolian sandy soil. These soils commonly share characteristics such as being thin-layered, coarse-textured, high in gravel content, and highly permeable. While this soil structure aids in both precipitation infiltration and groundwater recharge, its poor water-holding capacity makes it susceptible to significant water loss through evapotranspiration.
Agricultural practices in Altay Prefecture primarily involve a one-year ripening system. This includes spring wheat, spring maize (comprising both grain maize and silage maize varieties), and sunflower (categorized into edible and oilseed types). Additionally, alfalfa is harvested multiple times annually. Currently, agricultural irrigation predominantly relies on traditional flood irrigation methods. This approach results in a notably low irrigation efficiency, with a water-use efficiency coefficient for agriculture estimated at only 0.55. The livestock sector in the region largely centers on beef cattle breeding, with their primary feed sources being silage corn, forage, grain corn, and soybeans.
2.2. Materials
This study utilized Sentinel-2 Level-2A imagery with a spatial resolution of 10 m, accessed via the Google Earth Engine (GEE) platform. Sentinel-2 imagery includes three quality assessment (QA) bands, among which QA60 contains cloud mask information. Cloud removal was performed using threshold-based filtering of the QA60 band and other cloud masking techniques available in the GEE. Based on cloud-free imagery, land-cover interpretation keys were established.
Sample data were meticulously collected through field surveys conducted by our research team in the Altay region during August 2023 and July 2024. We acquired a total of 390 samples, distributed as follows: 100 for spring wheat, 100 for spring maize, 30 for sunflower, 80 for alfalfa, 30 for forestland, and 50 for grassland. The sample design strategically considered the relatively concentrated crop planting structure and the distinct phenological differences among crops within the study area. A decision tree model was selected for classification due to its robustness with small sample sizes, making it particularly well suited for classification tasks with limited available samples. Furthermore, to effectively mitigate the impact of insufficient minority class samples on classification performance, we integrated vegetation index time-series curves with expert knowledge to define phenological thresholds. This study employed daily meteorological data averaged over 44 years (1980–2023) from ten meteorological stations in and around Altay Prefecture, including precipitation, maximum temperature, minimum temperature, average temperature, vapor pressure, average wind speed, net radiation, and other data. These data were obtained from the China Meteorological Data Service Center (
https://data.cma.cn, accessed on 13 August 2023).
Watershed boundary vector data were extracted through hydrological analysis in ArcGIS, utilizing the SRTM 30 m Digital Elevation Model (DEM) acquired from the Google Earth Engine (GEE) platform [
63,
64]. Water resource data were acquired from the
Xinjiang Uygur Autonomous Region Water Resources Bulletin and the
Hydrological Yearbook of the People’s Republic of China-Irtysh River Basin Hydrological Data. Statistical data such as population size and crop cultivated area were sourced from the
Altay Prefecture Statistical Yearbook.
2.3. Methods
2.3.1. Research Framework
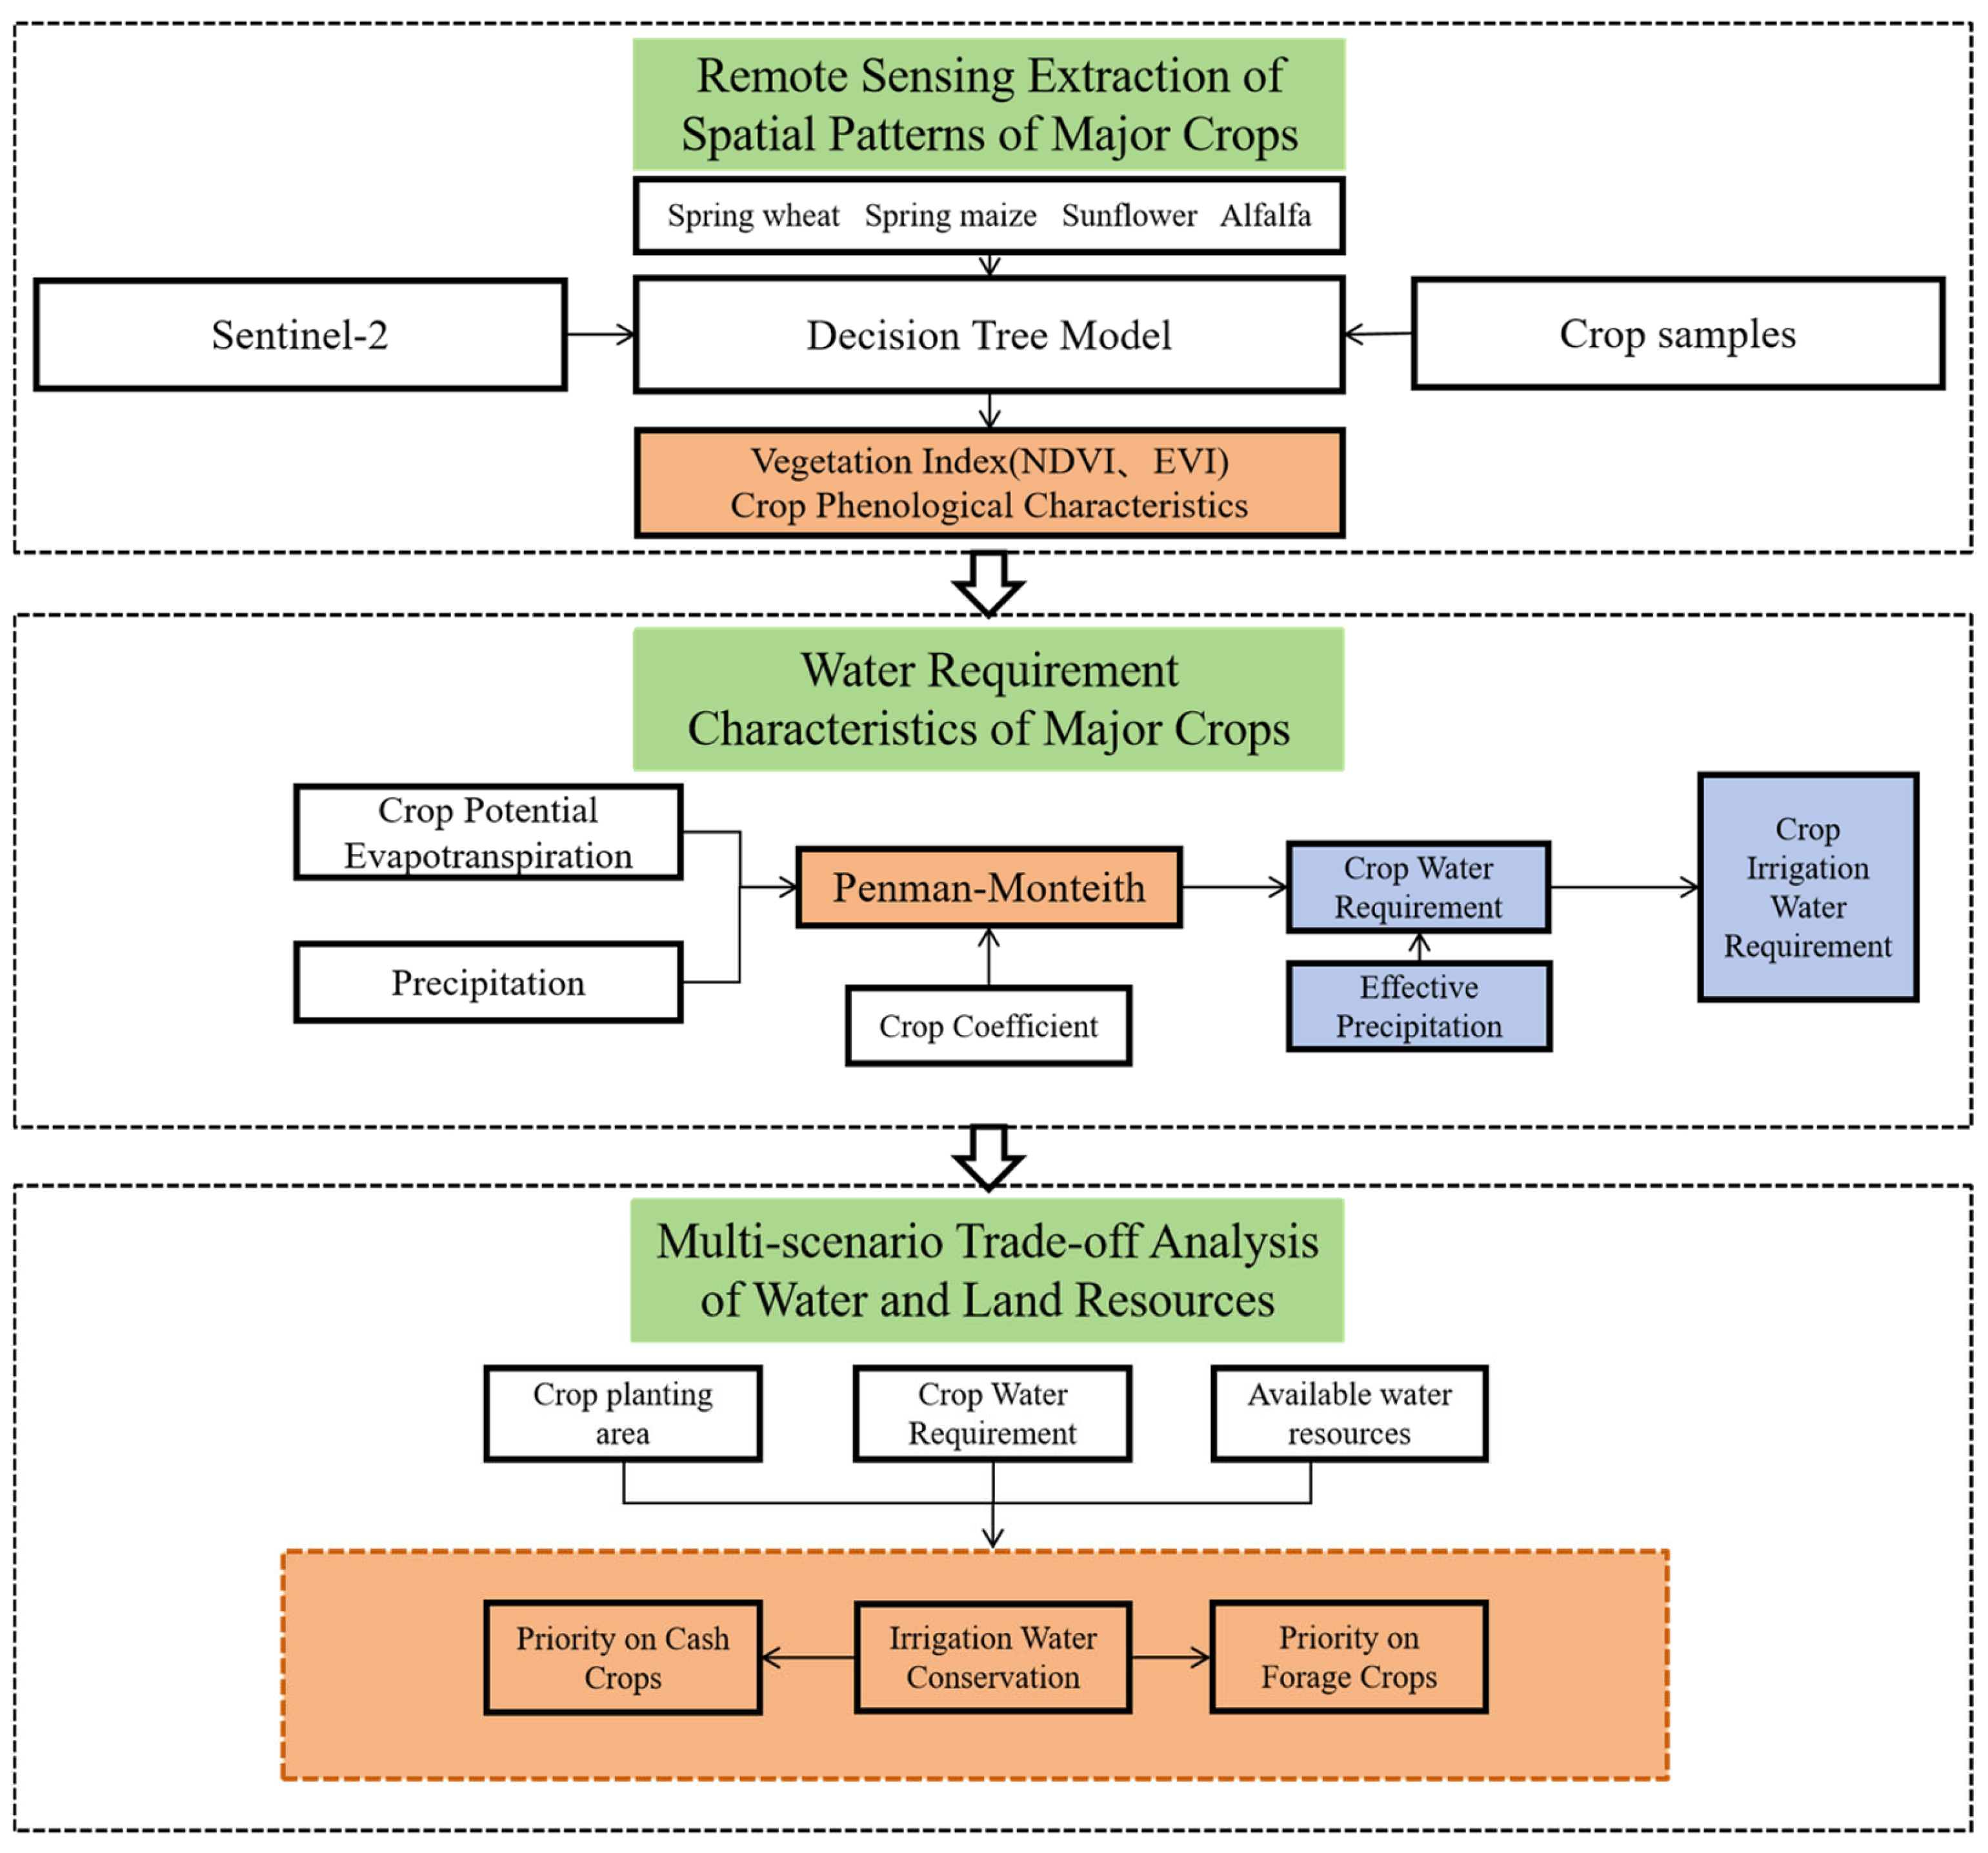
This research framework consists of three main components: first, extracting the spatial distribution of major crops using Sentinel-2 remote sensing data and a decision tree model; second, calculating crop water requirements and irrigation needs based on the Penman-Monteith model; and finally, analyzing different land and water resource allocation scenarios through multi-scenario simulations to assess the trade-offs between crop cultivation and water resource use, providing support for the optimized management of agricultural water resources (
Figure 2).
2.3.2. Remote Sensing Extraction of Crops
This study focuses on the 2023 calendar year. This specific timeframe was chosen primarily because it aligns directly with the sample data collected during our field expeditions in 2023–2024 and the latest official crop statistical data released for the Altay region. This ensures both the reliability and timeliness of our crop remote sensing image interpretation and classification. Furthermore, this synchronicity facilitates the cross-validation of our remote sensing extraction results. For the purpose of extracting crop phenological features and developing classification models, we utilized the GEE platform to synthesize the NDVI (Normalized Difference Vegetation Index) and EVI (Enhanced Vegetation Index) time-series data from Sentinel-2 imagery, covering the full year from January to December 2023. The Normalized Difference Vegetation Index (NDVI) is a widely used remote sensing metric, calculated as the ratio of the difference between near-infrared (NIR) and red (R) reflectance to their sum. It is a foundational tool for vegetation monitoring, crop identification, and land-cover classification [
65,
66,
67]. The Enhanced Vegetation Index (EVI) offers a more refined measure, exhibiting greater sensitivity to changes in the vegetation canopy structure, including the Leaf Area Index (LAI) and canopy type. The EVI incorporates atmospheric correction factors and soil adjustment parameters to effectively reduce interference from atmospheric scattering and soil background noise. This also helps mitigate the saturation issue that the NDVI can experience in areas with high vegetation cover, allowing the EVI to more accurately reflect the true physiological status of vegetation [
68,
69]. The formula is as follows:
In the formula, NIR and R represent the reflectance values of the near-infrared and red spectral bands, respectively. G is a gain factor, typically set to 2.5. C1 and C2 are adjustment factors used to correct for atmospheric scattering effects in the red and blue bands, with commonly used values of 6 and 7.5, respectively. BLUE denotes the reflectance value of the blue band. L is a constant used for atmospheric scattering correction, typically assigned a value of 1.
Raw vegetation index time-series data often contain anomalies and noise due to factors like cloud cover and aerosols in remote sensing imagery. To address this, we used the Savitzky–Golay (S-G) filtering method to smooth the time-series data. A 7-day time window was applied during this smoothing process. This approach helps preserve critical crop phenological features while simultaneously enhancing data continuity and stability [
70].
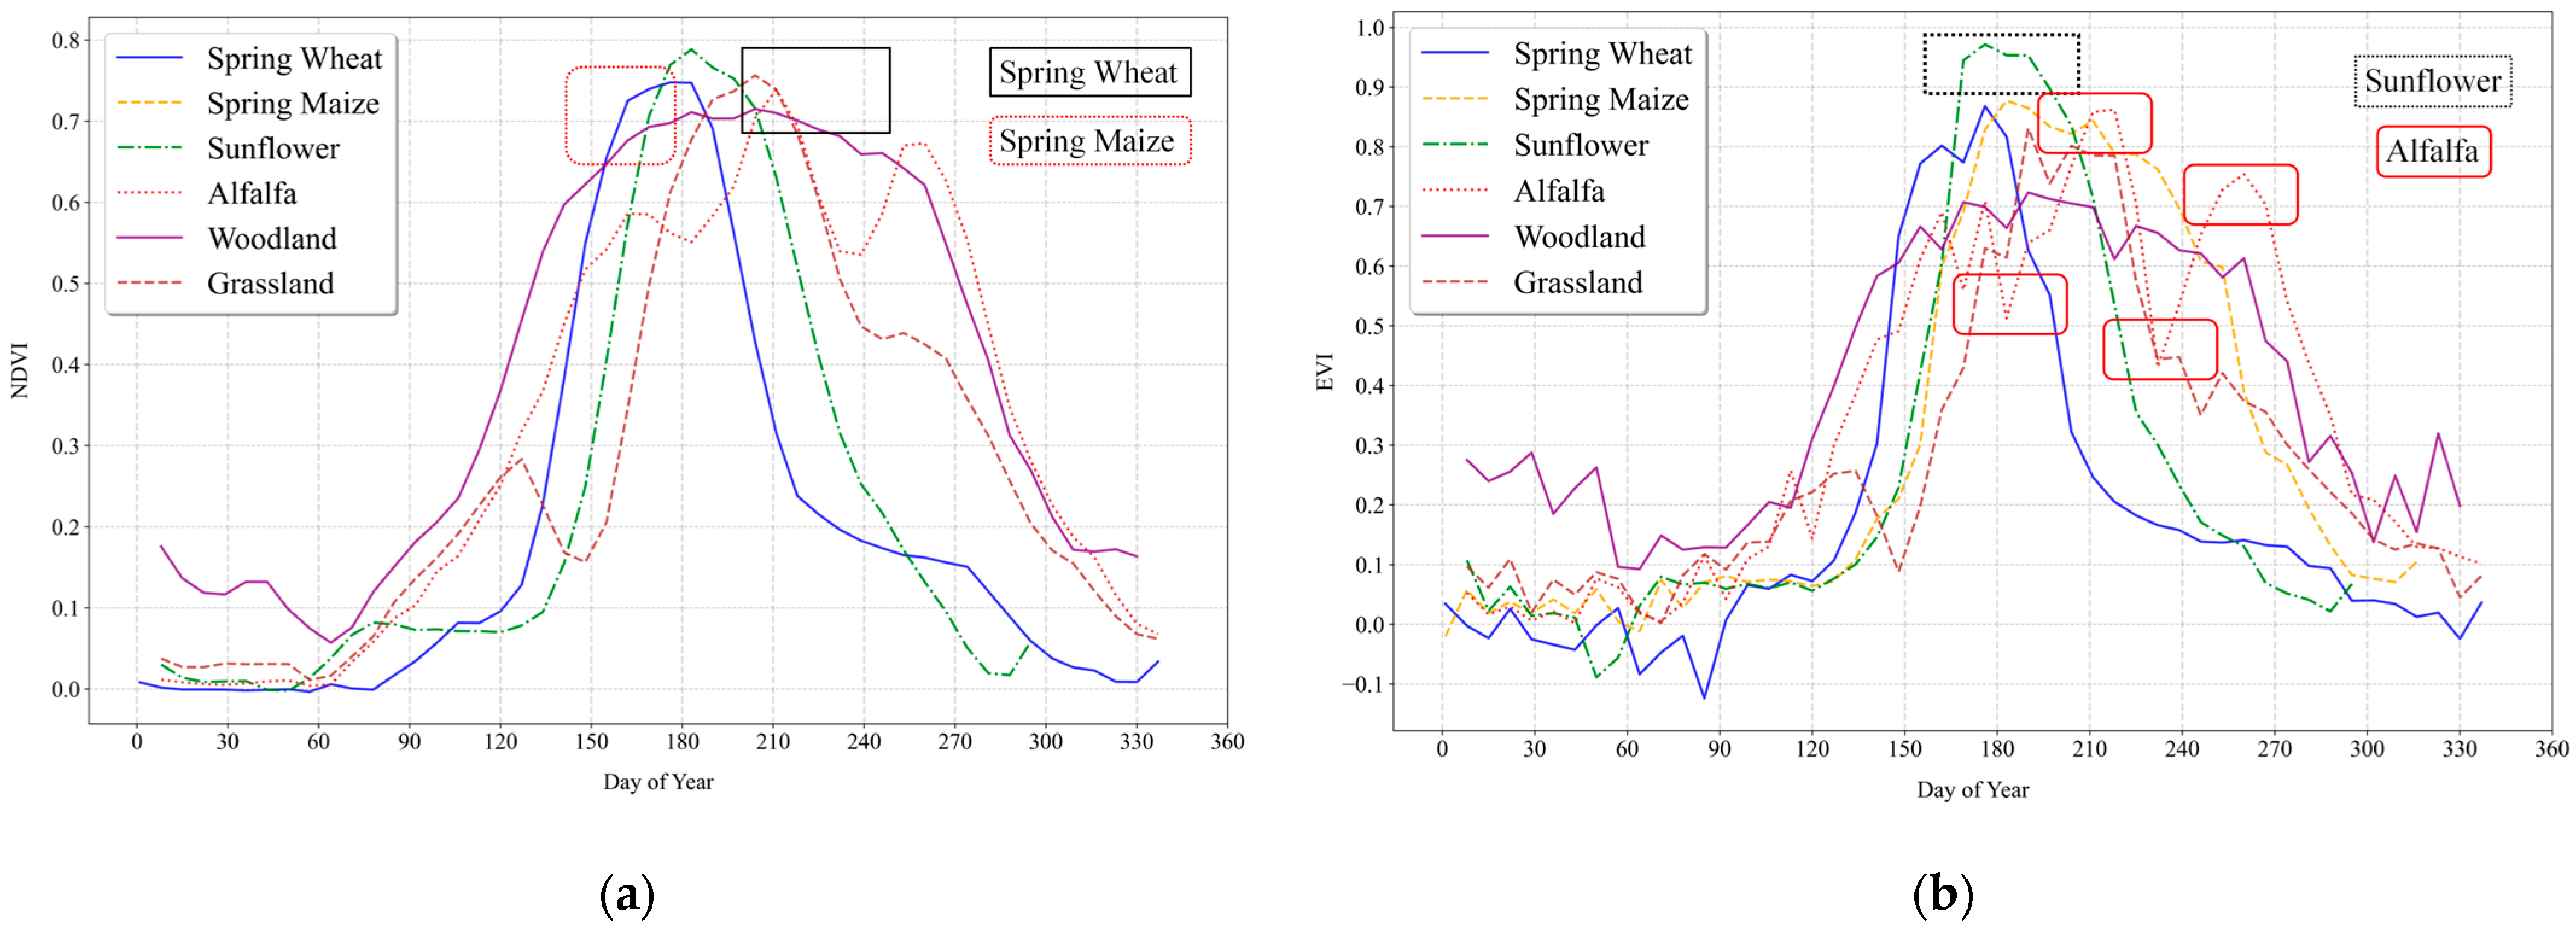
Major agricultural crops exhibit distinct growth rhythms, which are clearly reflected as varying phenological features in their vegetation index time-series data. By analyzing the characteristic changes in the NDVI and EVI time-series curves for key crops, we can extract critical phenological nodes. These nodes serve as crucial discriminators for differentiating among various crop types. Building on this, we developed a decision tree classification rule set that leverages these phenological features and vegetation index thresholds. This approach allows for the fine-grained identification of spring wheat, spring maize, sunflower, and alfalfa.
As shown in
Figure 3, spring wheat is the earliest sown crop in the Altay region, reaching its NDVI peak in early June. It can be identified as spring wheat if the NDVI value exceeds 0.13 during the period from Day of Year (DOY) 156 to 163. Spring maize reaches its maximum NDVI between mid-July and early August and is classified within the spring maize planting area when the NDVI exceeds 0.19 during DOY 196 to 216. Sunflower enters the EVI saturation phase from late June to mid-July and is identified as sunflower if the EVI value is greater than or equal to 0.9 between DOY 176 and 198. Alfalfa exhibits multiple EVI peaks and troughs throughout its growth cycle. Two identification strategies are employed to account for different harvest cycles of alfalfa: (1) The first type is characterized by EVI > 0.7 during DOY 156–163, EVI < 0.5 during DOY 186–206, and EVI > 0.7 during DOY 226–236. (2) The second type satisfies EVI > 0.7 during DOY 205–219, EVI < 0.57 during DOY 226–240, and EVI > 0.64 during DOY 247–268.
To comprehensively evaluate the crop classification results derived from the decision tree algorithm, this study employed a confusion matrix for quantitative accuracy assessment. Validation samples were obtained through a combination of field surveys and high-resolution remote sensing image interpretation. Based on the constructed confusion matrix, we calculated the overall accuracy, Kappa coefficient, User accuracy, and producer accuracy. The classification achieved an overall accuracy exceeding 93% and a Kappa coefficient greater than 0.9, indicating a high level of reliability in the classification results. Specifically, spring wheat and spring maize demonstrated high User accuracy and Producer accuracy due to their distinct phenological characteristics and ample sample sizes. Although sunflower and alfalfa had smaller sample sets, their identification was robust, benefiting from time-series threshold constraints and expert rule support (
Table 1).
2.3.3. Crop Water Requirements
The crop coefficient method recommended by FAO-56 has been widely applied in studies of crop water requirements during different growth stages. This method, based on crop type and growth stage, enables the estimation of crop water requirements at various developmental stages [
44]. The model parameters in the Penman-Monteith equation can be adjusted using field-measured crop coefficients and growth stage division. The formula is as follows:
In the formula, Wi,veg is the total water requirement of the i crop during its growth period; ET0 is the reference crop evapotranspiration (mm); and Ki is the crop coefficient for the i crop.
Numerous experimental studies have demonstrated that the Penman-Monteith equation, recommended by the Food and Agriculture Organization (FAO) in 1998, can provide highly accurate estimates of reference crop evapotranspiration [
45,
71]. The formula is as follows:
In the formula, ET0 is the reference crop evapotranspiration (mm/day); Δ is the slope of the saturation vapor pressure–temperature curve (kPa/°C); Rn is the net radiation at the crop surface (MJ/m2/day); G is the soil heat flux density (MJ/m2/day); γ is the psychrometric constant (kPa/°C); T is the mean daily air temperature at 2 m height (°C); u2 is the mean daily wind speed at 2 m height (m/s); and ea and ed are the saturation vapor pressure and actual vapor pressure (kPa).
The effective precipitation refers to the portion of precipitation that can be directly absorbed by crops for evapotranspiration, excluding surface runoff and deep percolation beyond the root zone that is unavailable for plant uptake. In this study, we employed the calculation method recommended by the Soil Conservation Service (SCS) of the United States Department of Agriculture (USDA) to calculate effective precipitation [
72]. The formula is as follows:
In the formula, Pi,eff represents the daily effective precipitation (mm), and P denotes the daily total precipitation (mm).
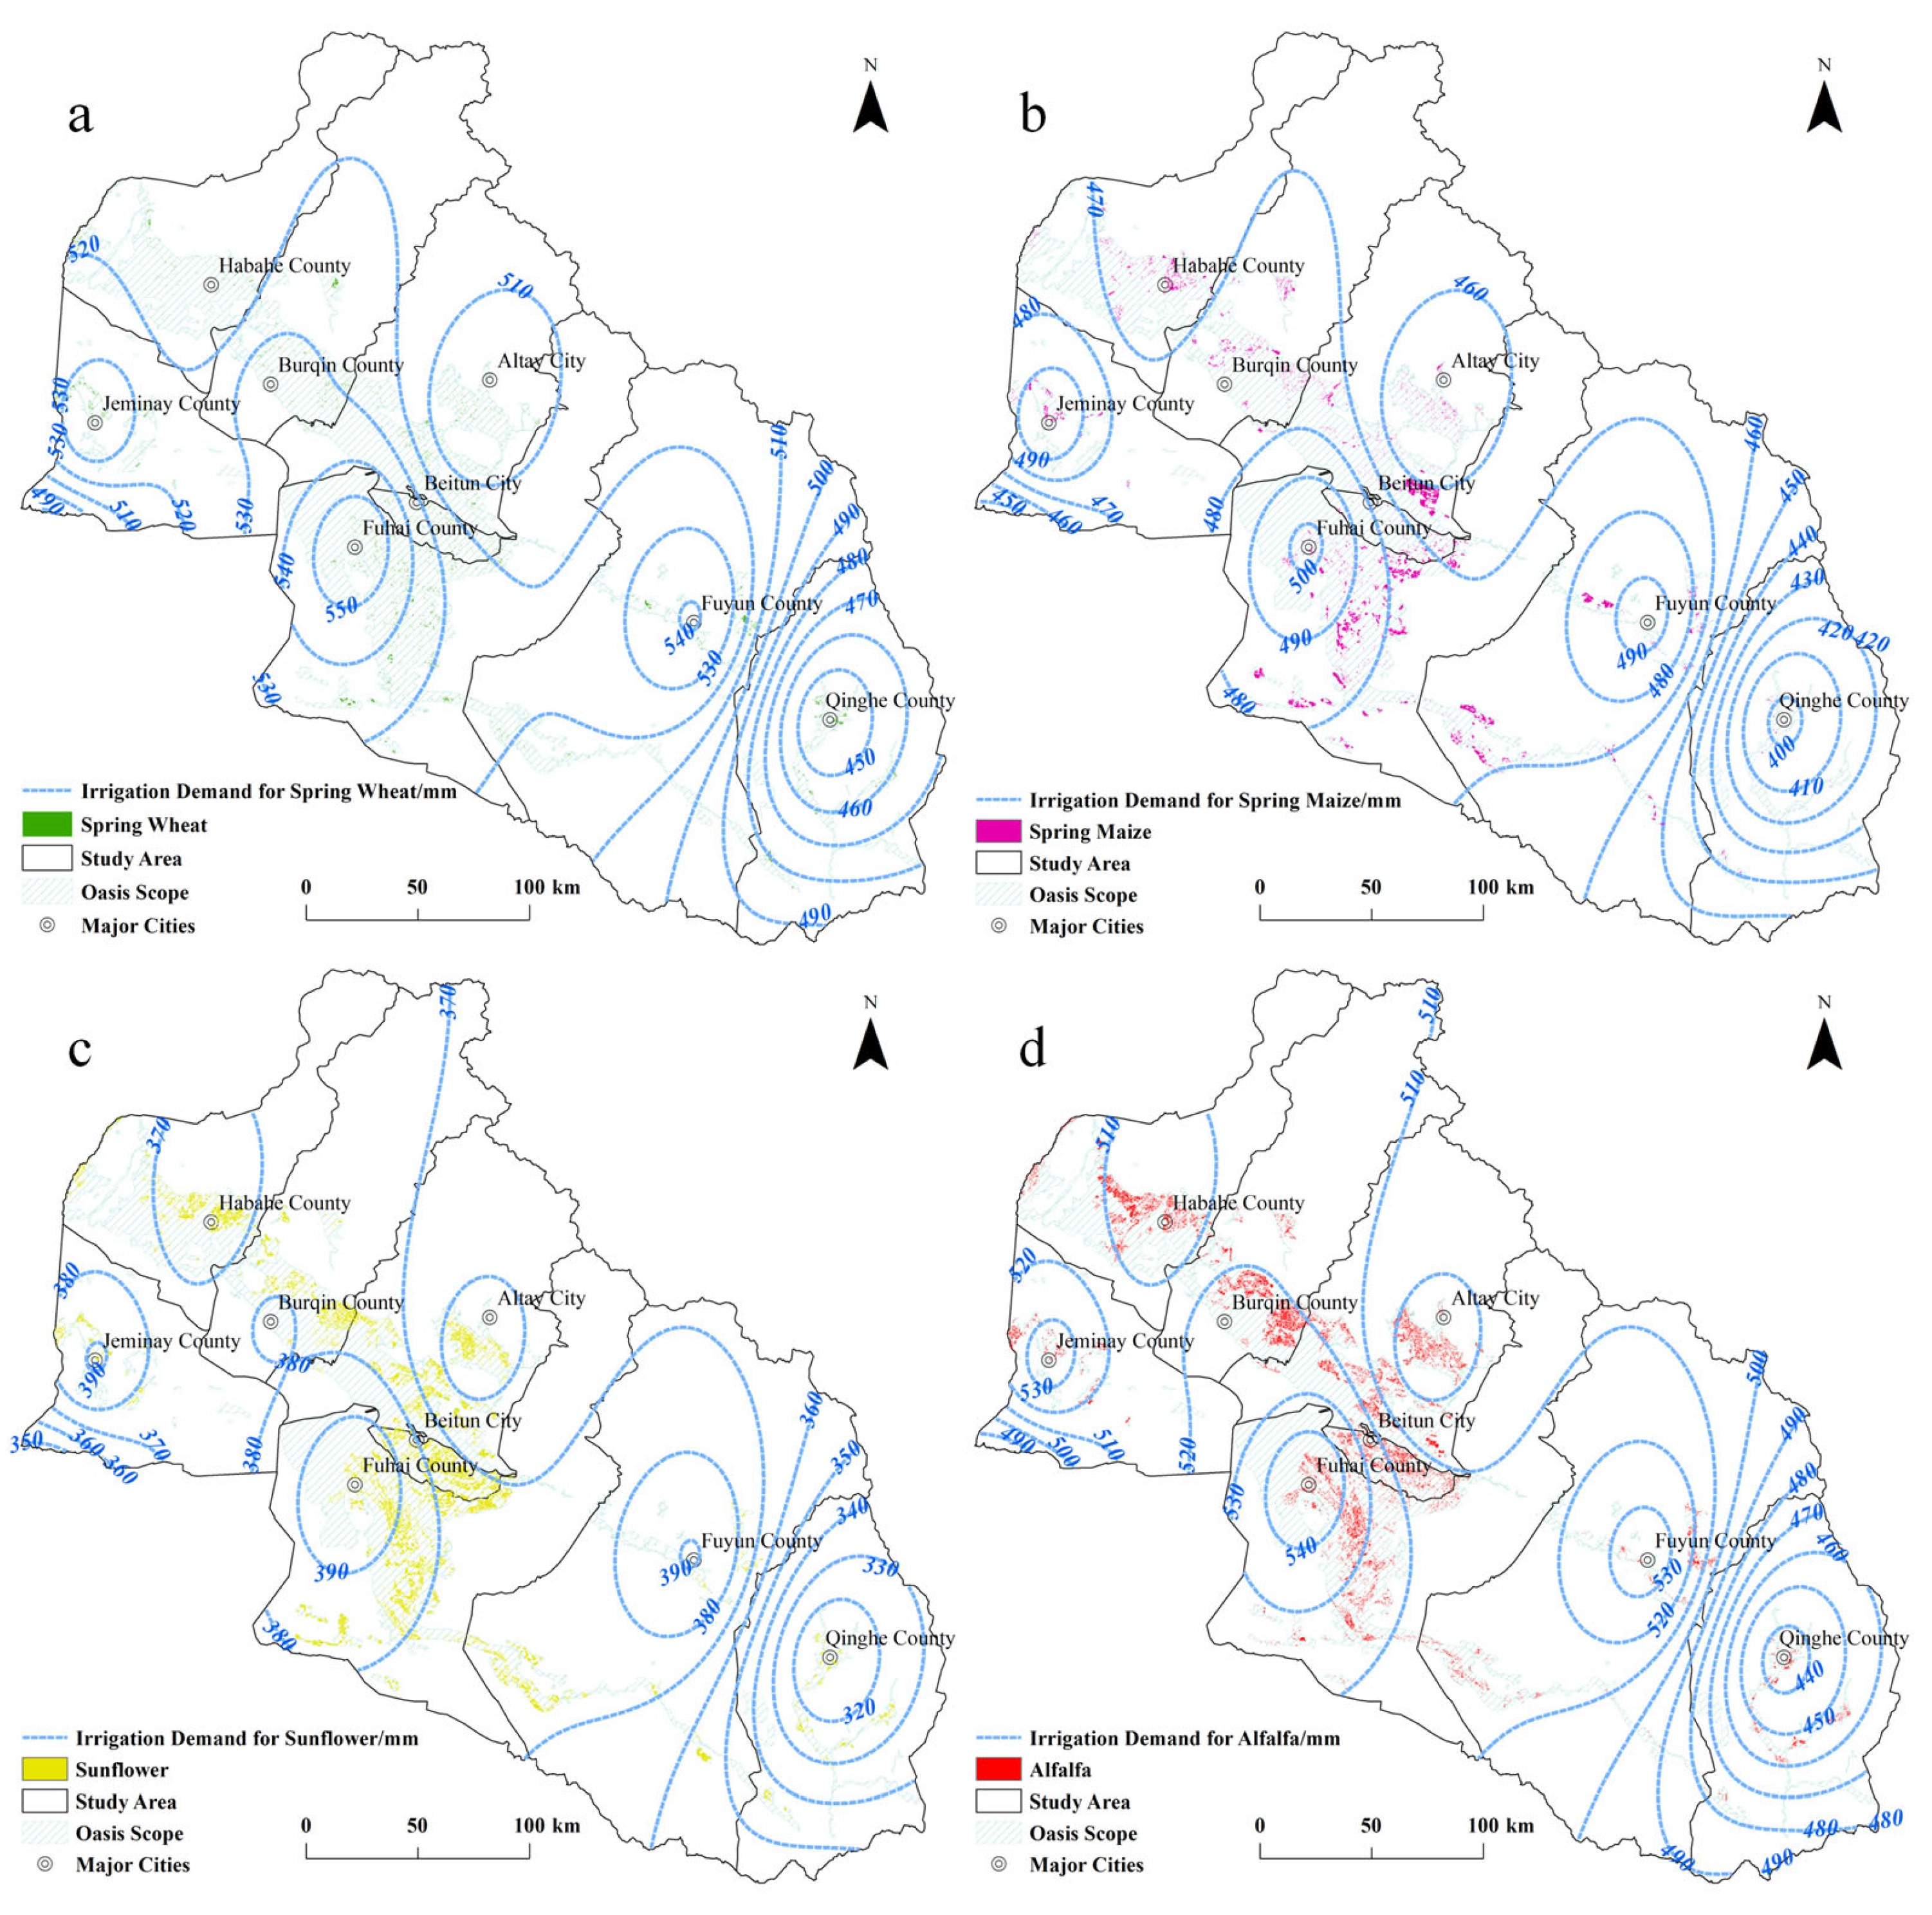
The crop irrigation water requirement can be calculated as the difference between the total crop water requirement during the growth period and the effective precipitation [
20]. The formula is as follows:
In the formula, Wi,irr represents the irrigation water requirement for crop i during its growth period; Wi,veg denotes the total water requirement for crop i during its growth period; and Pi,eff indicates the effective precipitation for crop i during its growth period. All values are expressed in millimeters (mm).
To enable the spatial visualization and quantitative analysis of crop water requirement indicators, we utilized the Inverse Distance Weighting (IDW) interpolation algorithm within the ArcGIS 10.8 platform. This method uses the discrete crop water requirement characteristics calculated from individual meteorological stations as sample data. Through IDW interpolation, a spatially continuous raster dataset was constructed, effectively transforming point-based observations into a comprehensive spatial representation of crop water demand across the study area.
This study leveraged field-observed crop phenology data collected during surveys to divide the complete crop growth cycle into four distinct stages. The Initial Growth Stage; The Rapid Development Stage; The Mid-Season Stage. The Late-Season Stage (maturity) (
Table 2).
The crop coefficients (K
c) used in this research are based on findings from relevant studies conducted in the Altay region and northern Xinjiang [
64,
73,
74,
75]. For each growth stage, the daily average of crop coefficients within that period was used as the representative crop coefficient for that specific stage. Furthermore, the average of these stage-specific crop coefficients was adopted as the parameter for calculating the crop’s total water requirement over its entire growing season (
Table 3).
2.3.4. Multi-Scenario Trade-Off Analysis of Water and Land Resources
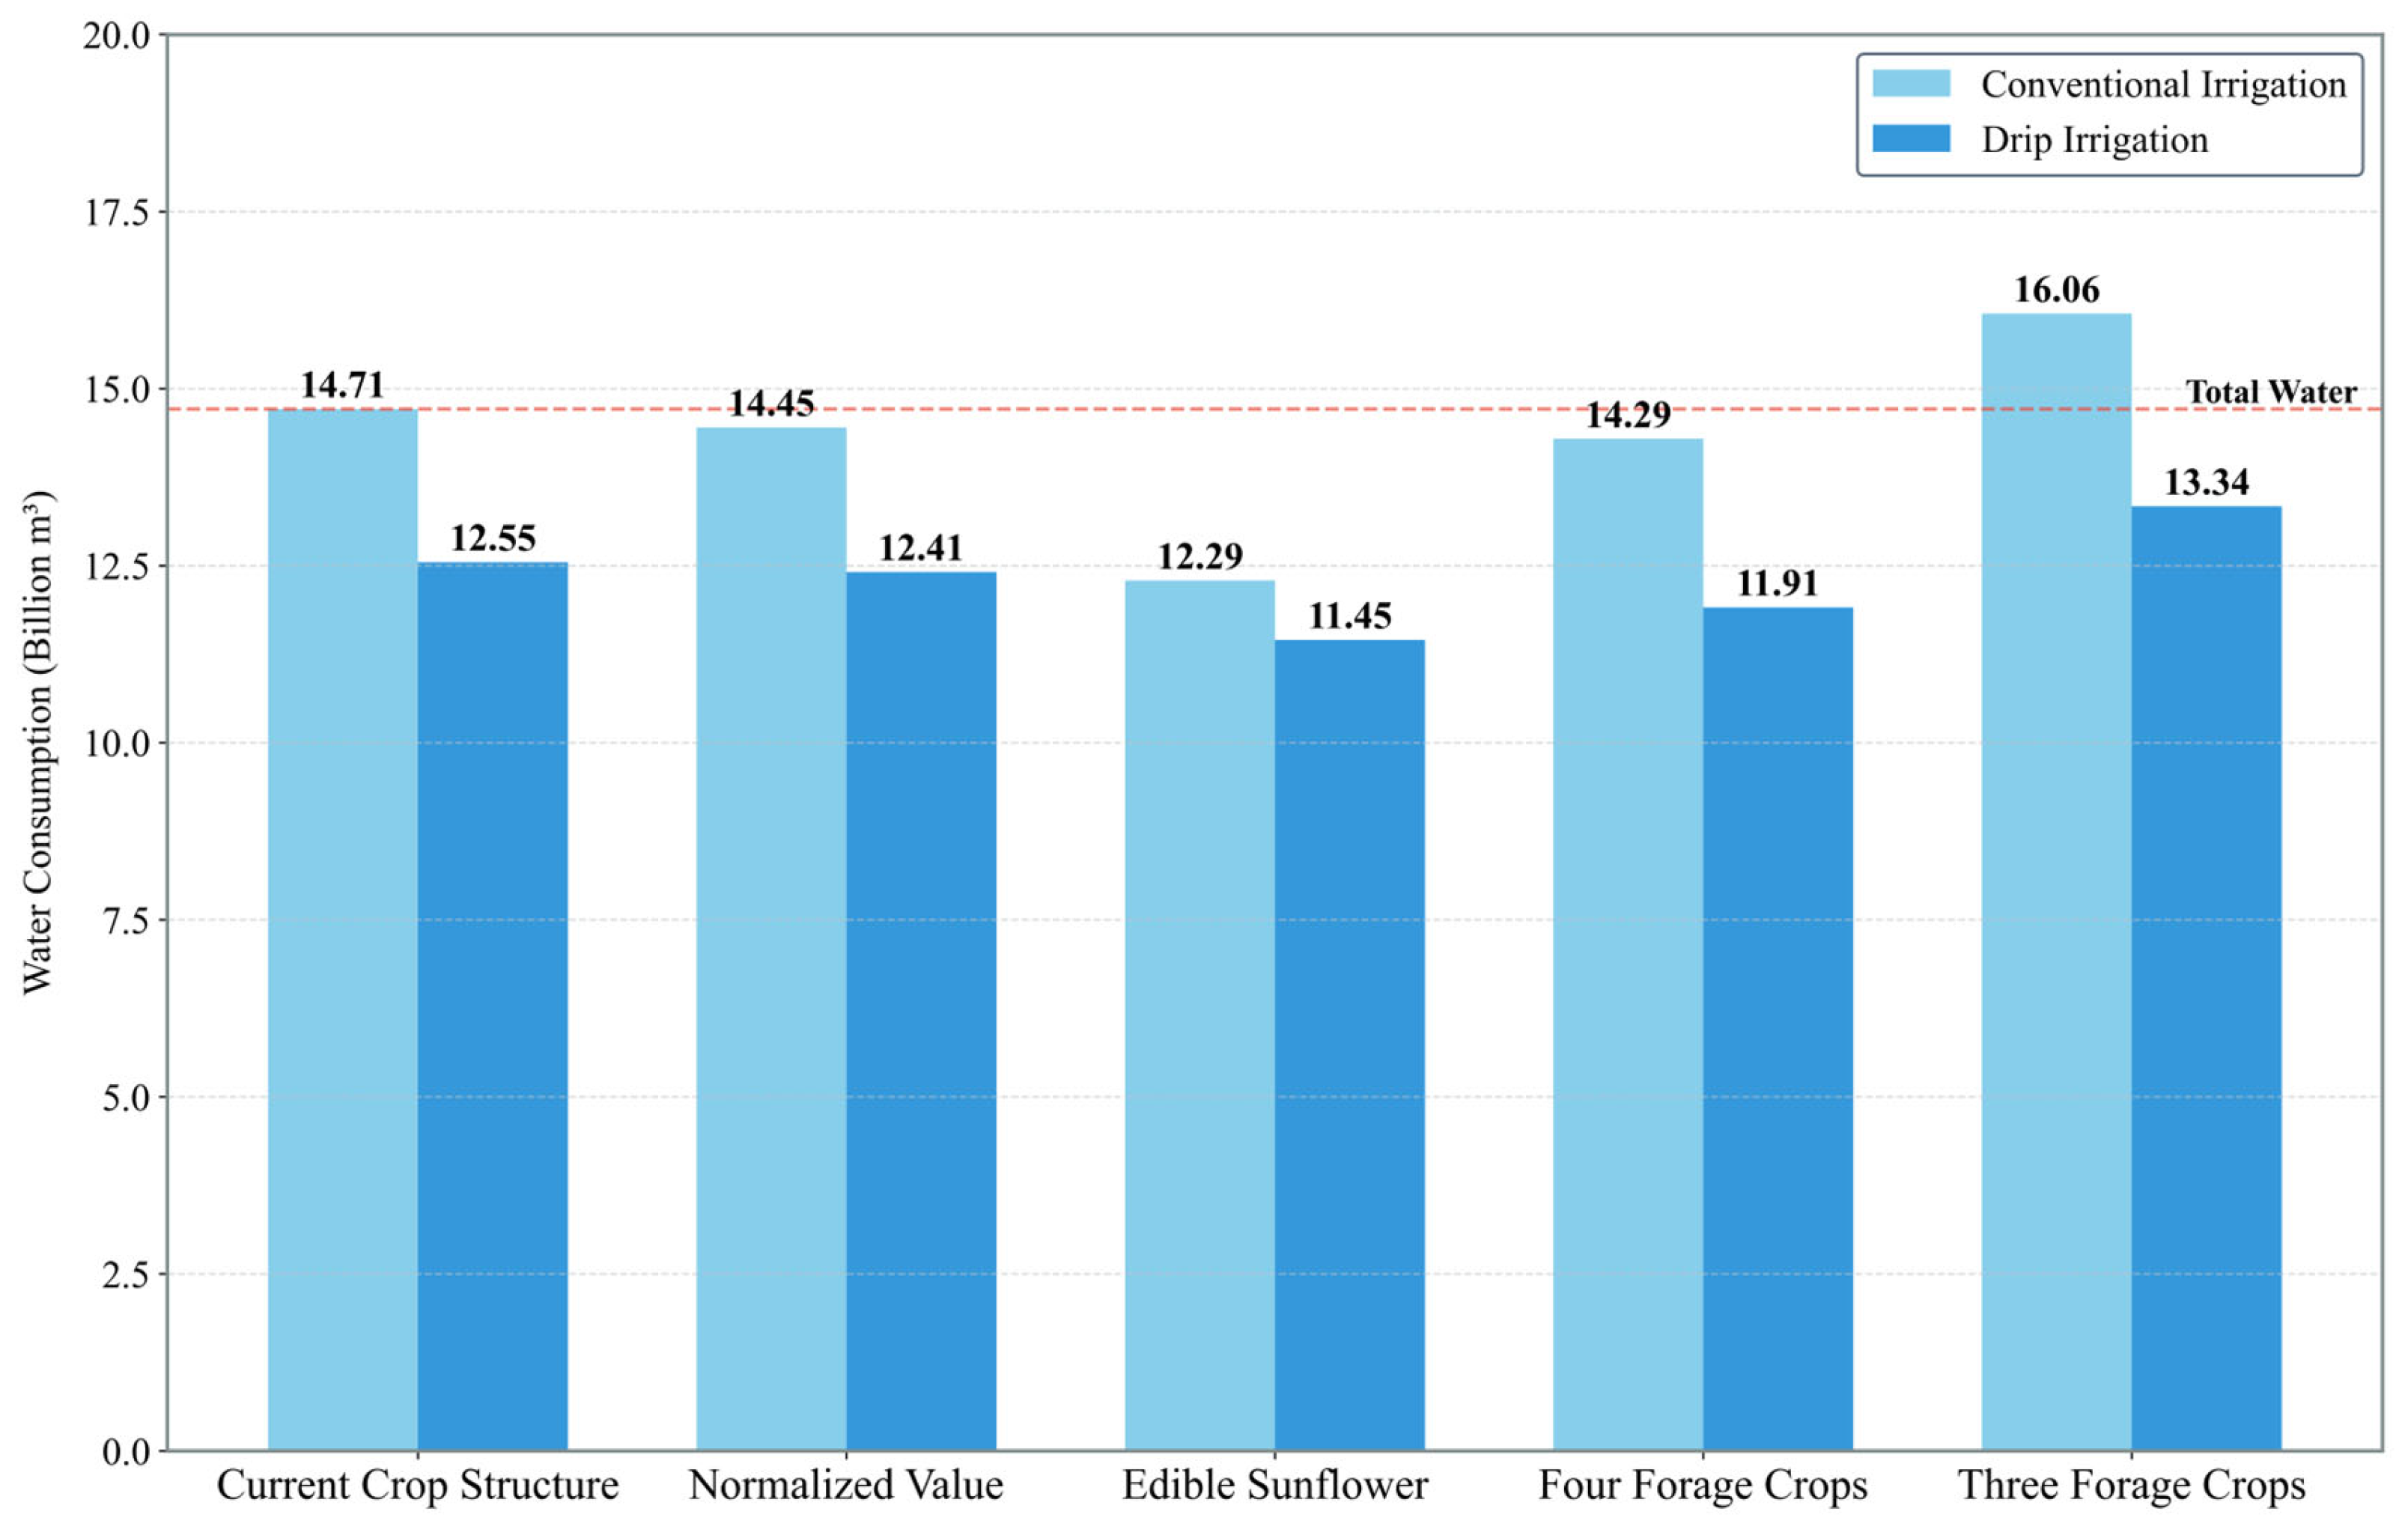
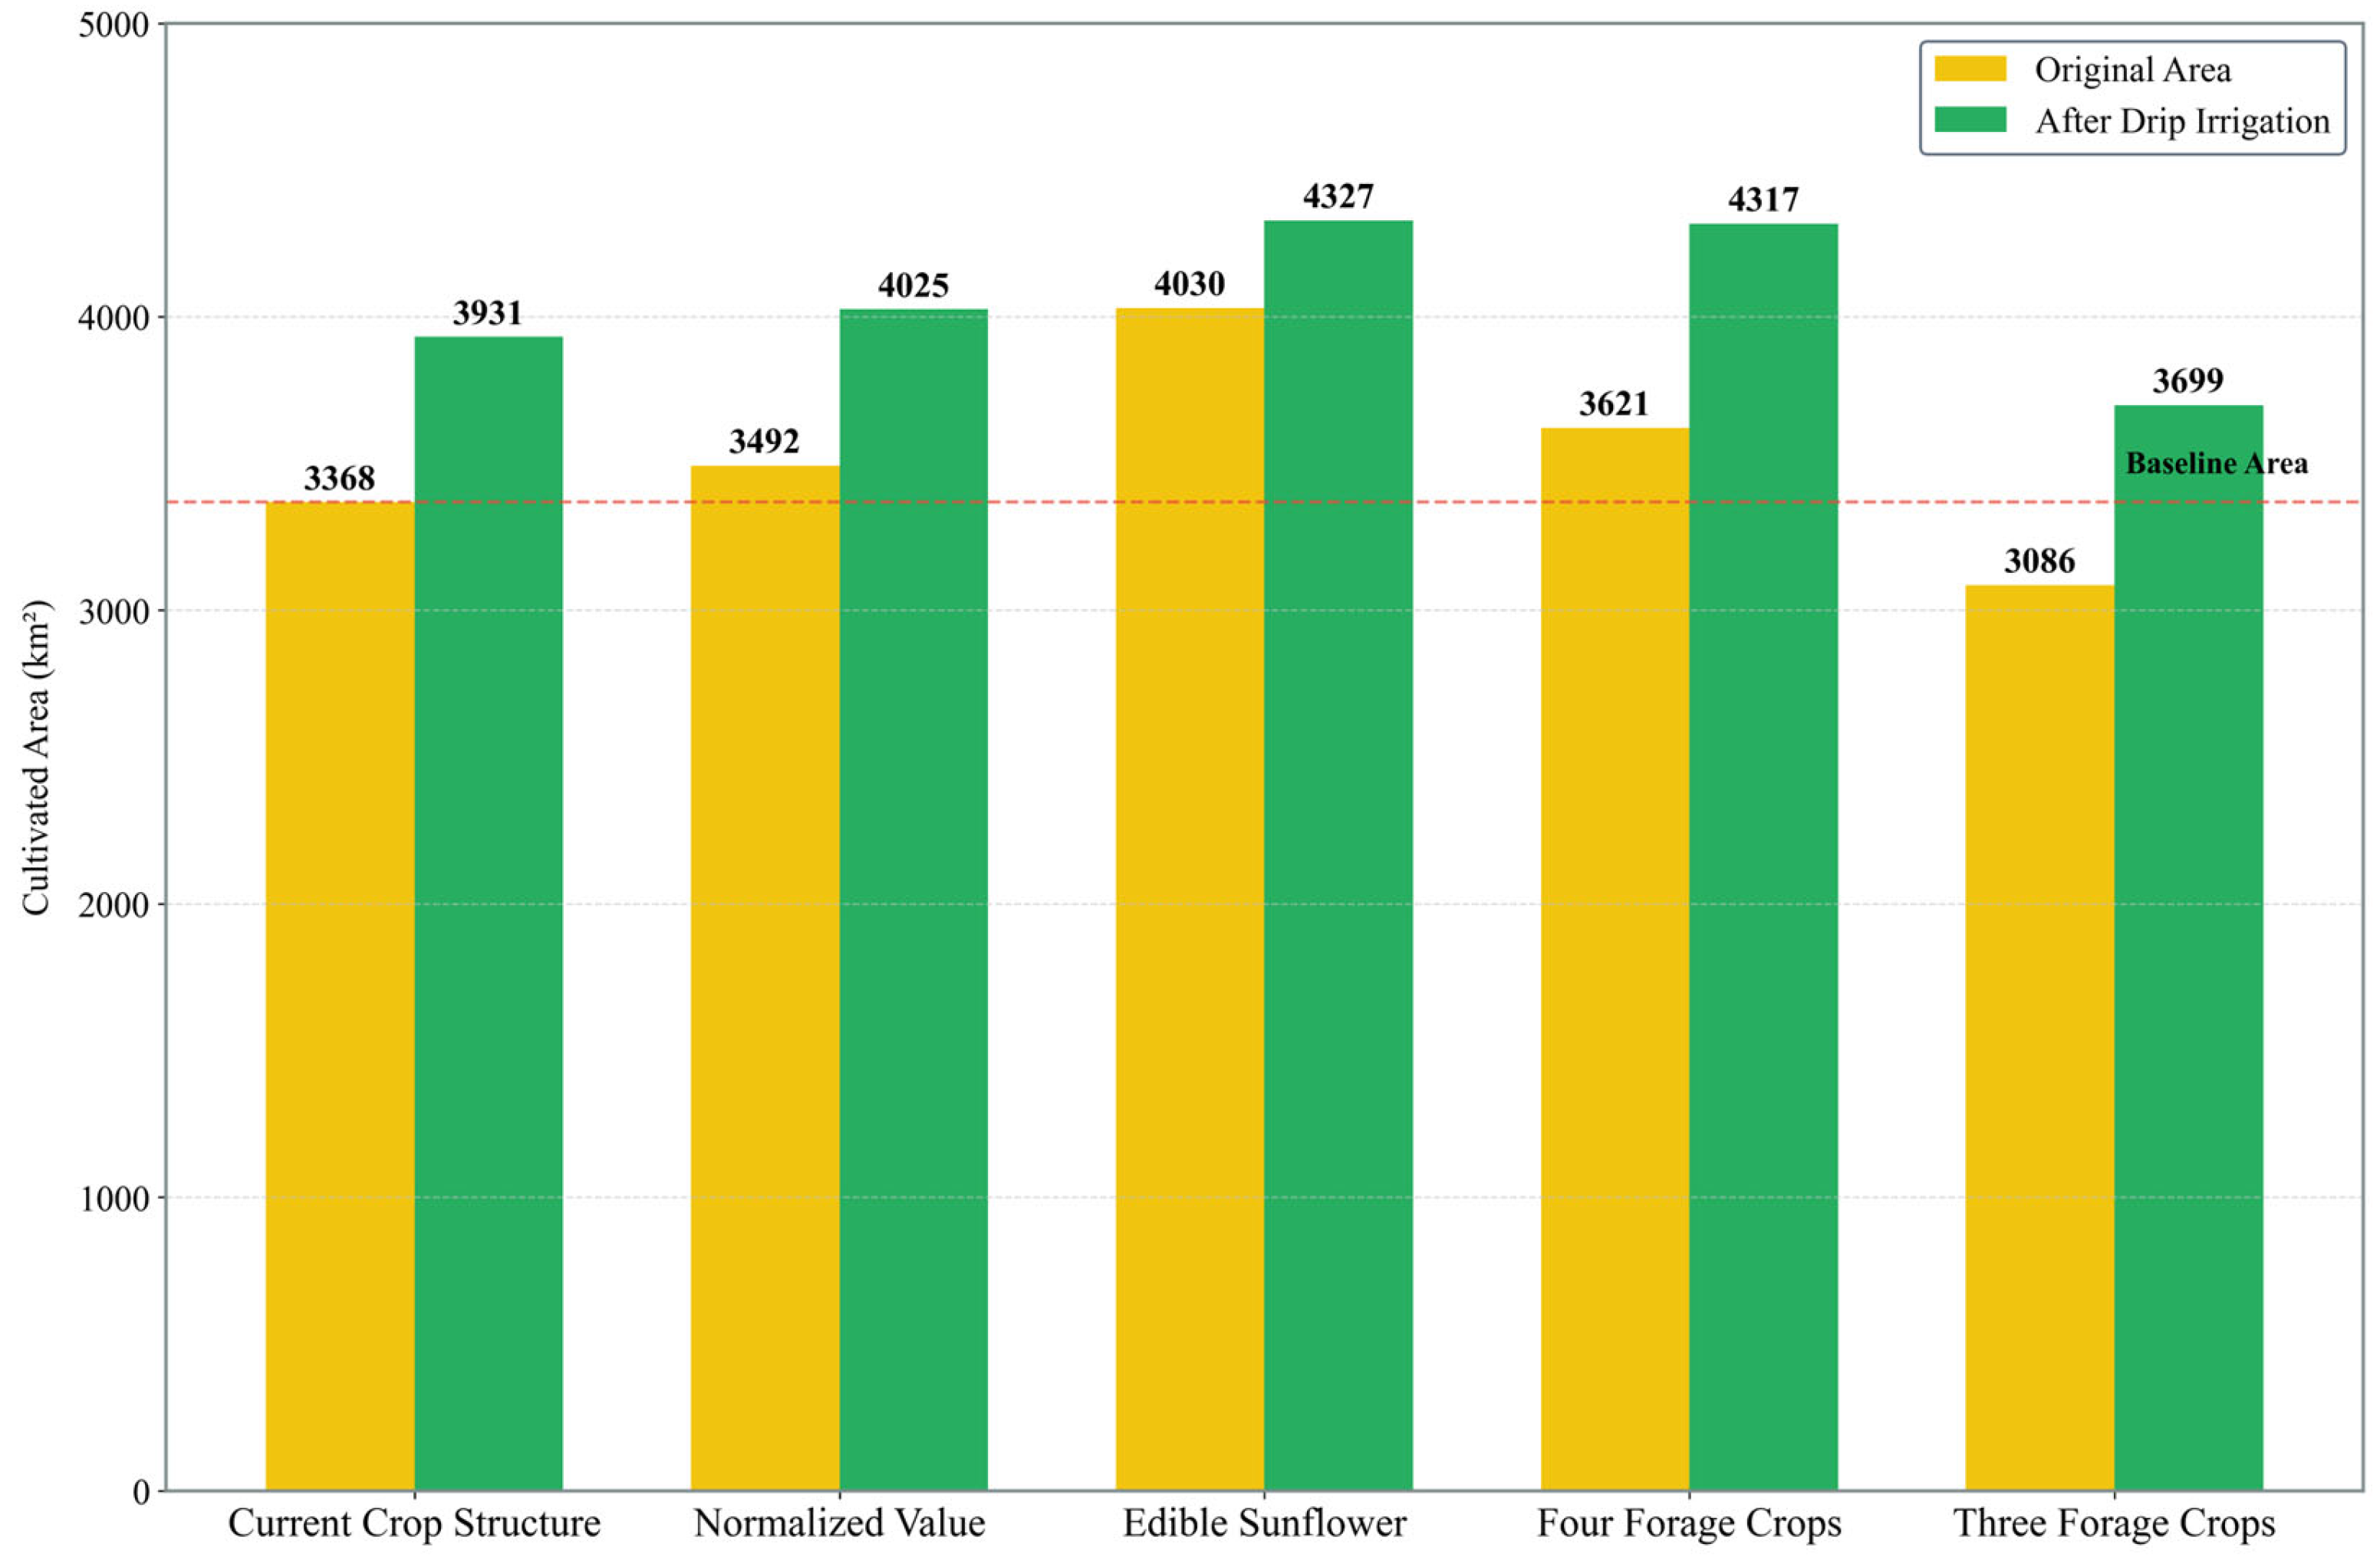
This study designs three distinct crop structure optimization scenarios, each with different development objectives, to simulate and analyze the complex interplay and trade-offs among water, land, and crops within the oasis agricultural system of the Altay region. These include (1) an Agricultural Irrigation Water-Saving Scenario, which evaluates the water-saving potential of major crops by promoting efficient irrigation methods, referencing Xinjiang’s agricultural water quotas and observed crop water requirements; (2) an Economic Crop Prioritization Scenario, aiming to maximize economic output per unit of water resource by simulating market-driven adjustments to crop planting structures and their effects on water and land resource efficiency; and (3) a forage crop prioritization scenario, which models the impact of transitioning traditional agriculture towards a forage-crop-dominated system on overall agricultural structure optimization and water and land resource allocation.
To ensure the simulation results are both practically feasible and offer valuable policy insights, this study established clear boundary conditions and constraints. Using 2023 as the baseline year, we integrated foundational data such as the acreage of major crops identified via remote sensing, along with their corresponding yields, prices, agricultural output value, and water consumption. For water resources, the total natural water availability of the rivers along the southern foothills of the Altay Mountains (1.02 × 10¹⁰ m3) forms the basis, with a crucial constraint that agricultural water use will not exceed the current actual consumption of 1.471 × 10⁹ m3. Additionally, to prevent excessive expansion, the maximum planting area for major oasis crops is capped by the area extracted from 2023 remote sensing data. These rigorous settings ensure our simulations are firmly grounded in real-world data and existing constraints, thereby enhancing their relevance for regional water and land resource management policies.
Building on the established framework, we constructed a linear programming model for crop structure optimization. This model aims to maximize different objective functions under the constraint of total water resources, thereby revealing the variations in resource utilization efficiency and the inherent trade-off mechanisms associated with various development pathways. The formula is as follows:
In the equation, W represents the total regional water requirement (m3); denotes the irrigation water requirement of the ith crop during its growing season (mm); and Ai is the planting area of crop i in square meters (m2). C is a conversion factor (typically 0.001) to convert the irrigation depth from mm to m for consistency with the area unit.
In the context of an agricultural irrigation water-saving scenario, the objective function is to minimize the total agricultural water use. This can be formally expressed as follows:
In the equation, represents the water saved for the crop; is the baseline irrigation water requirement; and is the irrigation water requirement after implementing micro-irrigation measures. All values are in cubic meters (m3).
In the Economic Crop Prioritization Scenario, to facilitate a more effective comparison of the economic value generated by different crops, the output value per unit area is calculated. This metric directly reflects the economic efficiency of each crop in terms of land utilization. The formula is as follows:
In the equation, V represents the crop output value; Yi is the unit yield of crop i (kg/km2); and Pi is the market price of crop i (USD/kg).
To evaluate the water requirements of forage crops under various structural configurations, we calculate the total crop water demand for each specific crop structure scenario. The formula is as follows:
In the equation, Wcow represents the irrigation water requirement per unit of beef cattle; Acow is the required forage crop area per unit of beef cattle; and Wirr denotes the irrigation water requirement per unit area of forage crop. C is a conversion factor (typically 0.001) to convert the irrigation depth from mm to m for consistency with the area unit.
The maximum cultivable area for a specific crop, or a combination of crops, under a given water resource constraint can be calculated using the following general formula:
In the equation, Acrop represents the planting area of the crop (hm2); Wcrop denotes the allocated irrigation water volume for the crop (m3); and Wirr is the irrigation water requirement per unit area of the crop (mm).
4. Discussion
This study introduces a novel, integrated research framework that combines remote sensing identification, water demand modeling, and multi-scenario optimization. This framework offers a fresh perspective and powerful tools for managing water and land resources in arid oasis agriculture, particularly in exploring the coupling relationship between land and water resources in the Altay oasis, which is vital for sustainable management in arid regions. Leveraging this framework, we successfully developed a crop identification model applicable at the regional scale, significantly enhancing the spatiotemporal resolution of crop water requirement estimations. Furthermore, we simulated and evaluated the dynamic changes in water and land resources under various development scenarios. This comprehensive approach provides a robust scientific basis for the optimized allocation of regional water and land resources.
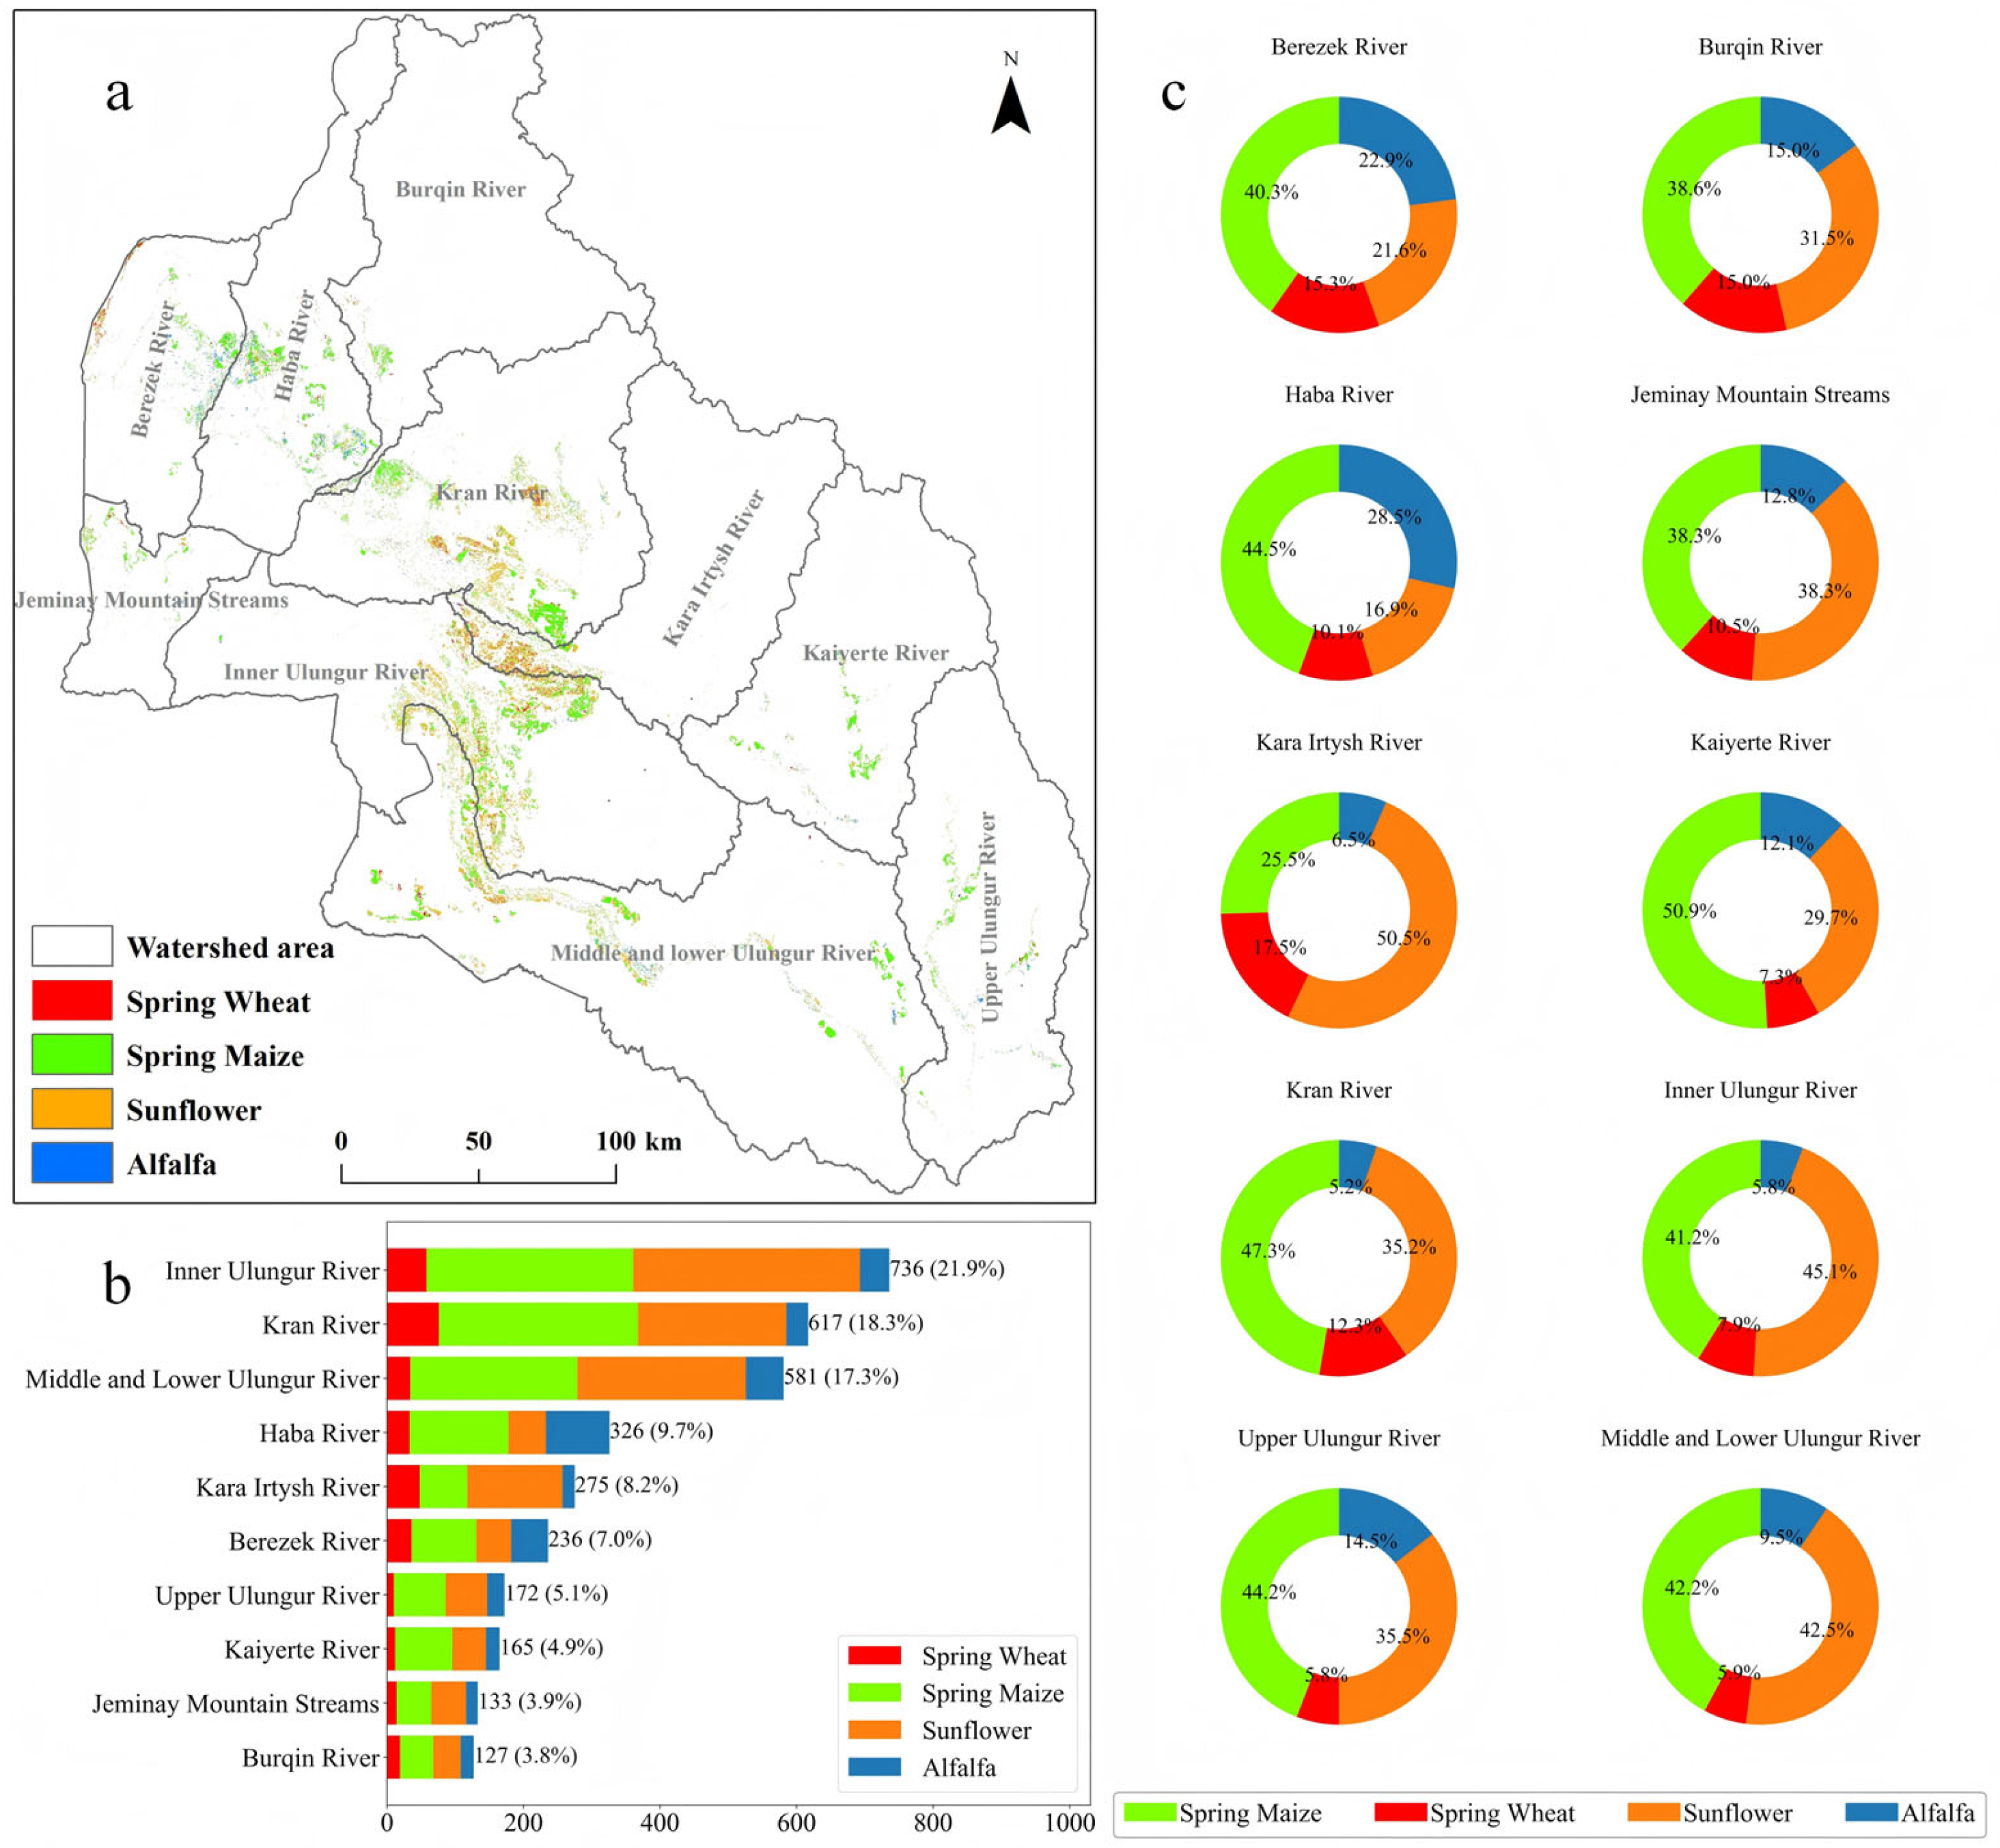
Through this integrated framework, we first leveraged the Google Earth Engine (GEE) to rapidly construct crop spectral and vegetation index time-series curves [
76] and developed a large-scale crop identification model with significantly improved spatial and temporal accuracy. The crop planting structure in the study area is clearly dominated by spring maize and sunflower, which together account for a significant 79.3% of the total major crop area. This approach not only boosted research efficiency but also provided the necessary technical support for large-scale, high-precision crop identification [
77,
78,
79]. This precision in remote sensing identification is a cornerstone of our integrated framework, directly feeding into accurate water demand estimations.
Existing research consistently shows that agricultural water use in arid regions often exceeds 80% of total water consumption, frequently coupled with inefficient water allocation [
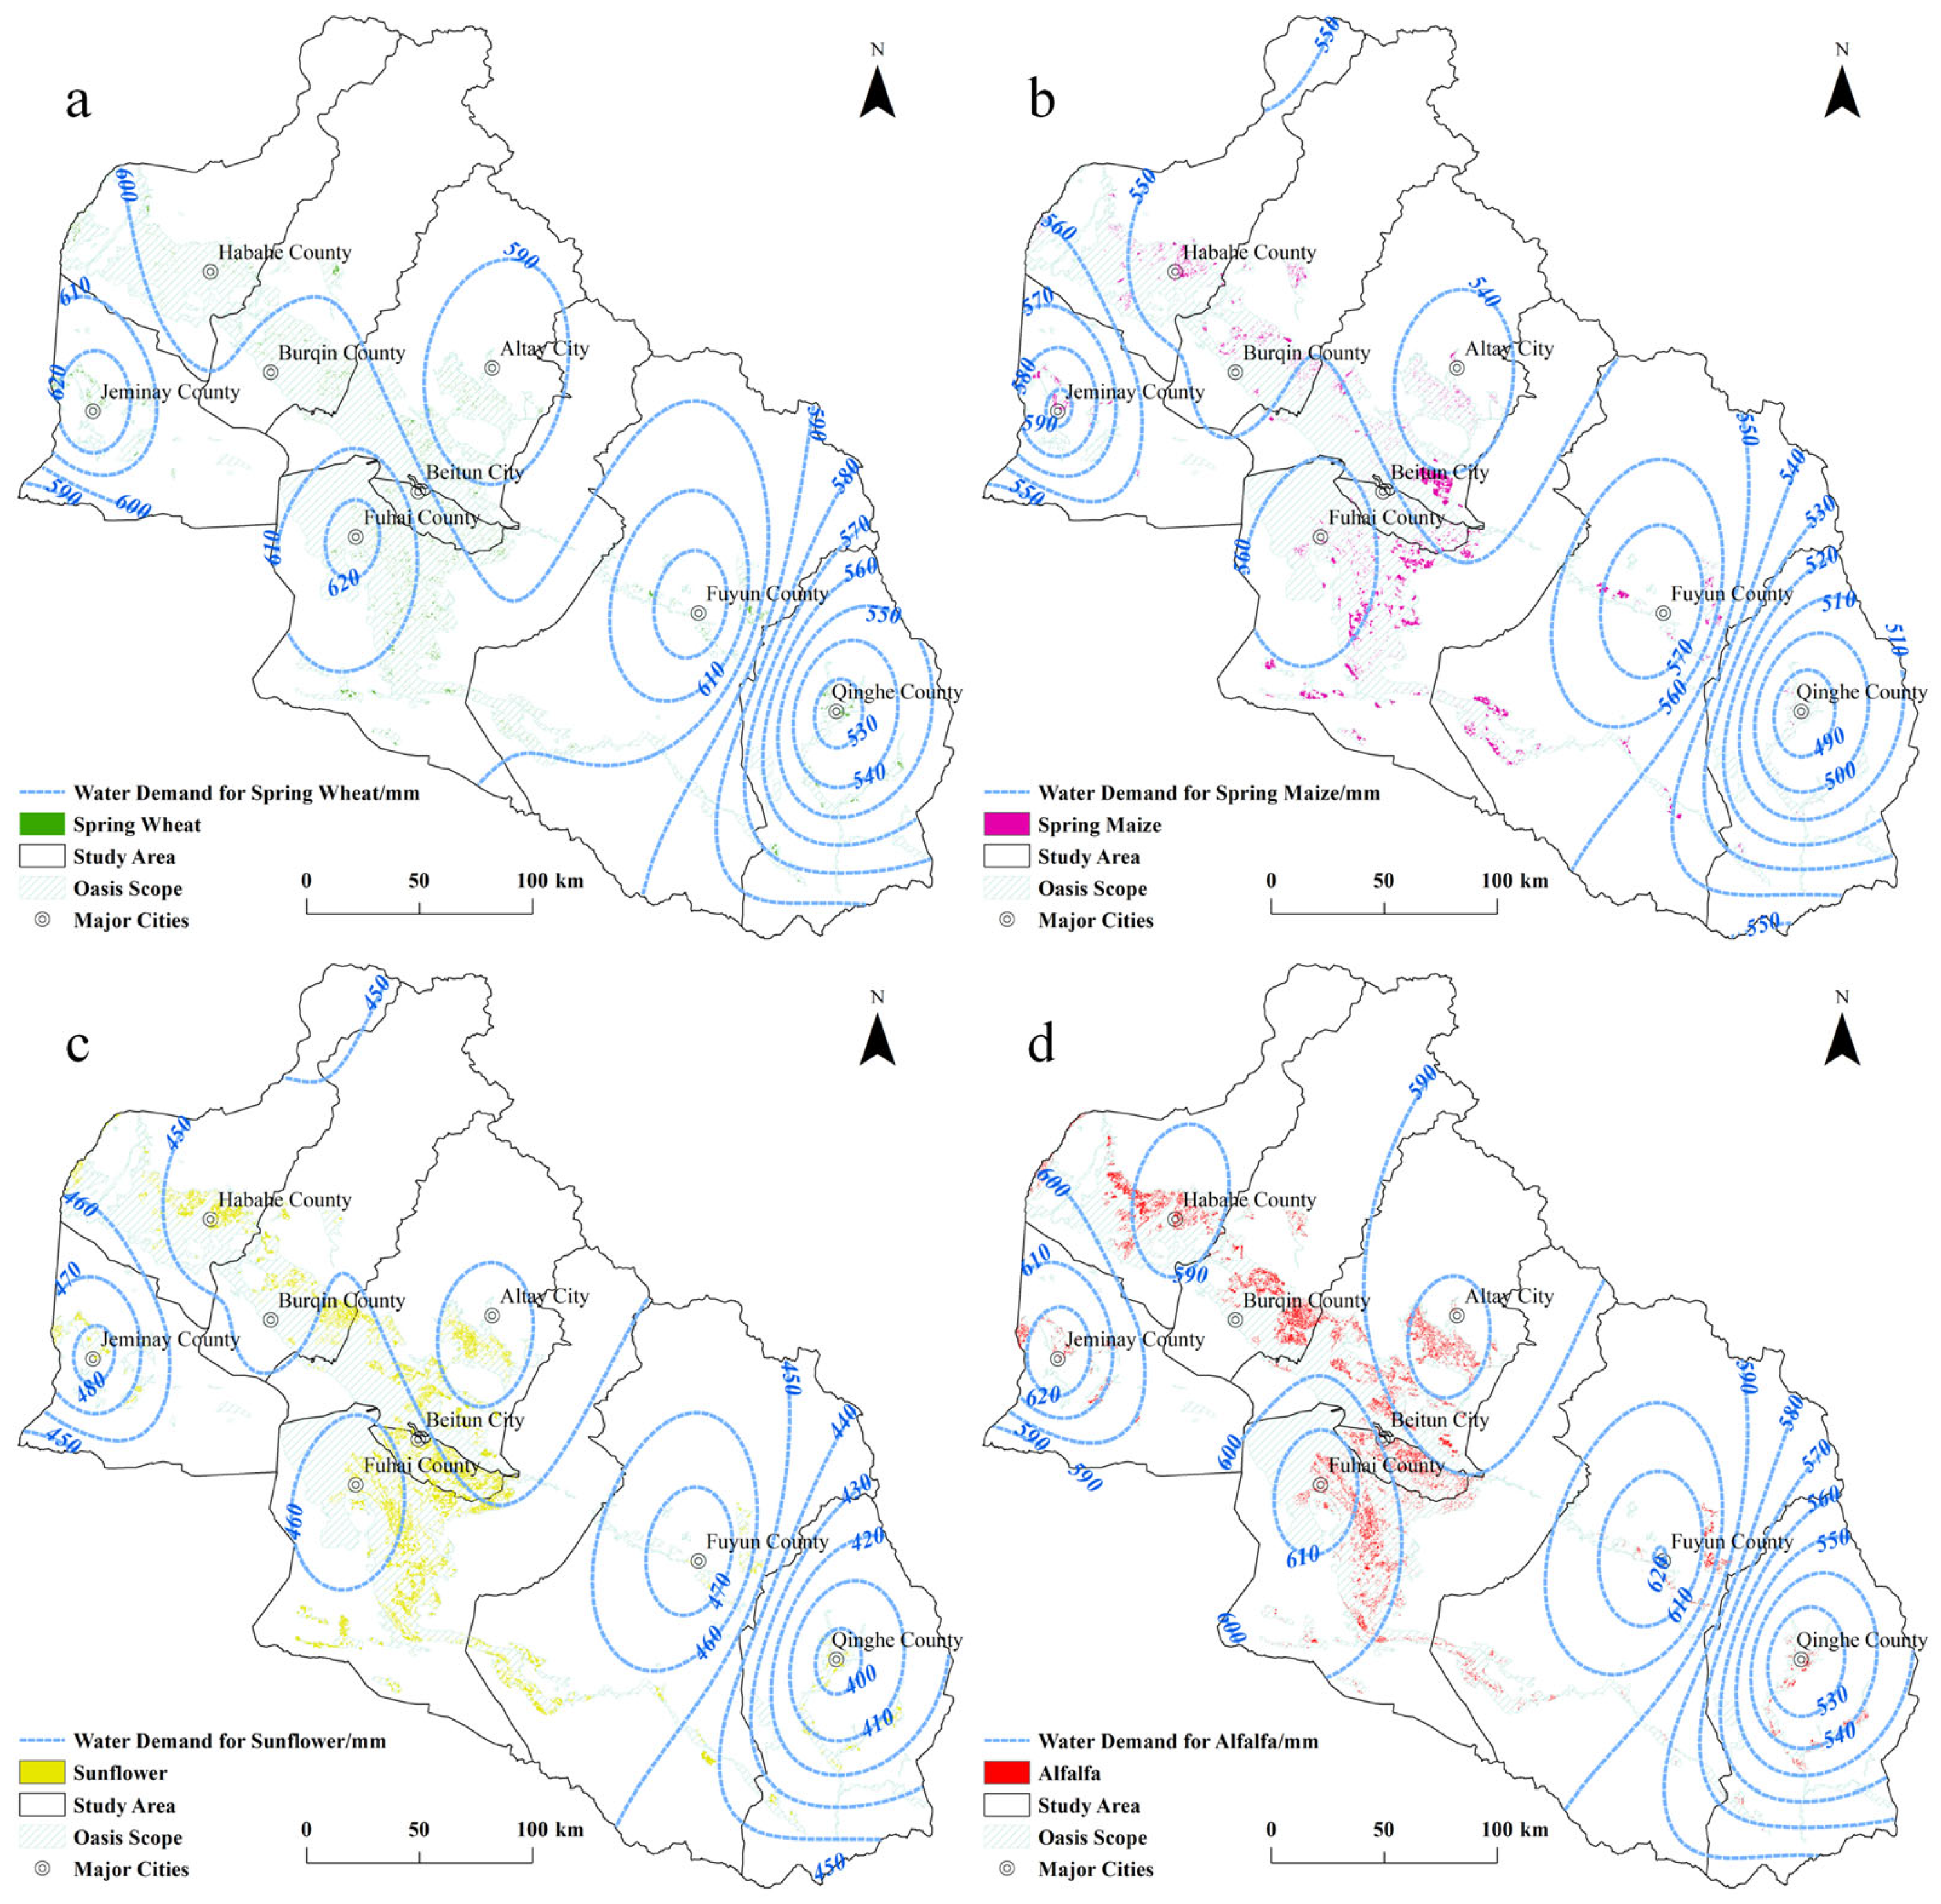
62]. This reinforces the significant reliance of oasis agriculture on irrigation and highlights a clear imbalance in water resource distribution. This study delves deeper by quantifying the differences in water resource utilization among various crop types. We found that spring wheat and alfalfa have higher water requirements during their growing seasons compared to spring maize and sunflower. This observation is directly linked to the crops’ physiological characteristics. Spring wheat’s longer growth period and higher transpiration rates and alfalfa’s multi-cutting cycles both contribute to their elevated water needs. In contrast, sunflower exhibits superior water-saving performance due to its strong drought resistance and shorter growing period, alongside a promising potential for economic output.
As seen in
Table A5, our study’s crop water requirement (CWR) values for spring wheat (594 mm) and spring maize (550 mm) generally align with the upper range of existing studies in similar climatic regions. Comparing our findings with diverse regional studies, crop water demand shows considerable variability, underscoring the critical influence of local climate, specific crop characteristics, and methodological approaches. For example, reported wheat CWRs range from around 427–693 mm in northern Algeria to 511–548 mm in Xinjiang, China, while maize CWRs vary from 350 to 380 mm in Xinjiang to 552 mm in Northeast China. Similarly, evapotranspiration (ET) for sunflower (638–882 mm) and alfalfa (up to 1427 mm) highlights their significant water consumption in different contexts. These variations emphasize that relying solely on generalized data can be misleading for water management. Our integrated framework, however, precisely accounts for these regional specificities, providing tailored and accurate CWR estimations crucial for effective water resource management [
44,
71,
73,
80,
81,
82,
83,
84,
85,
86,
87].
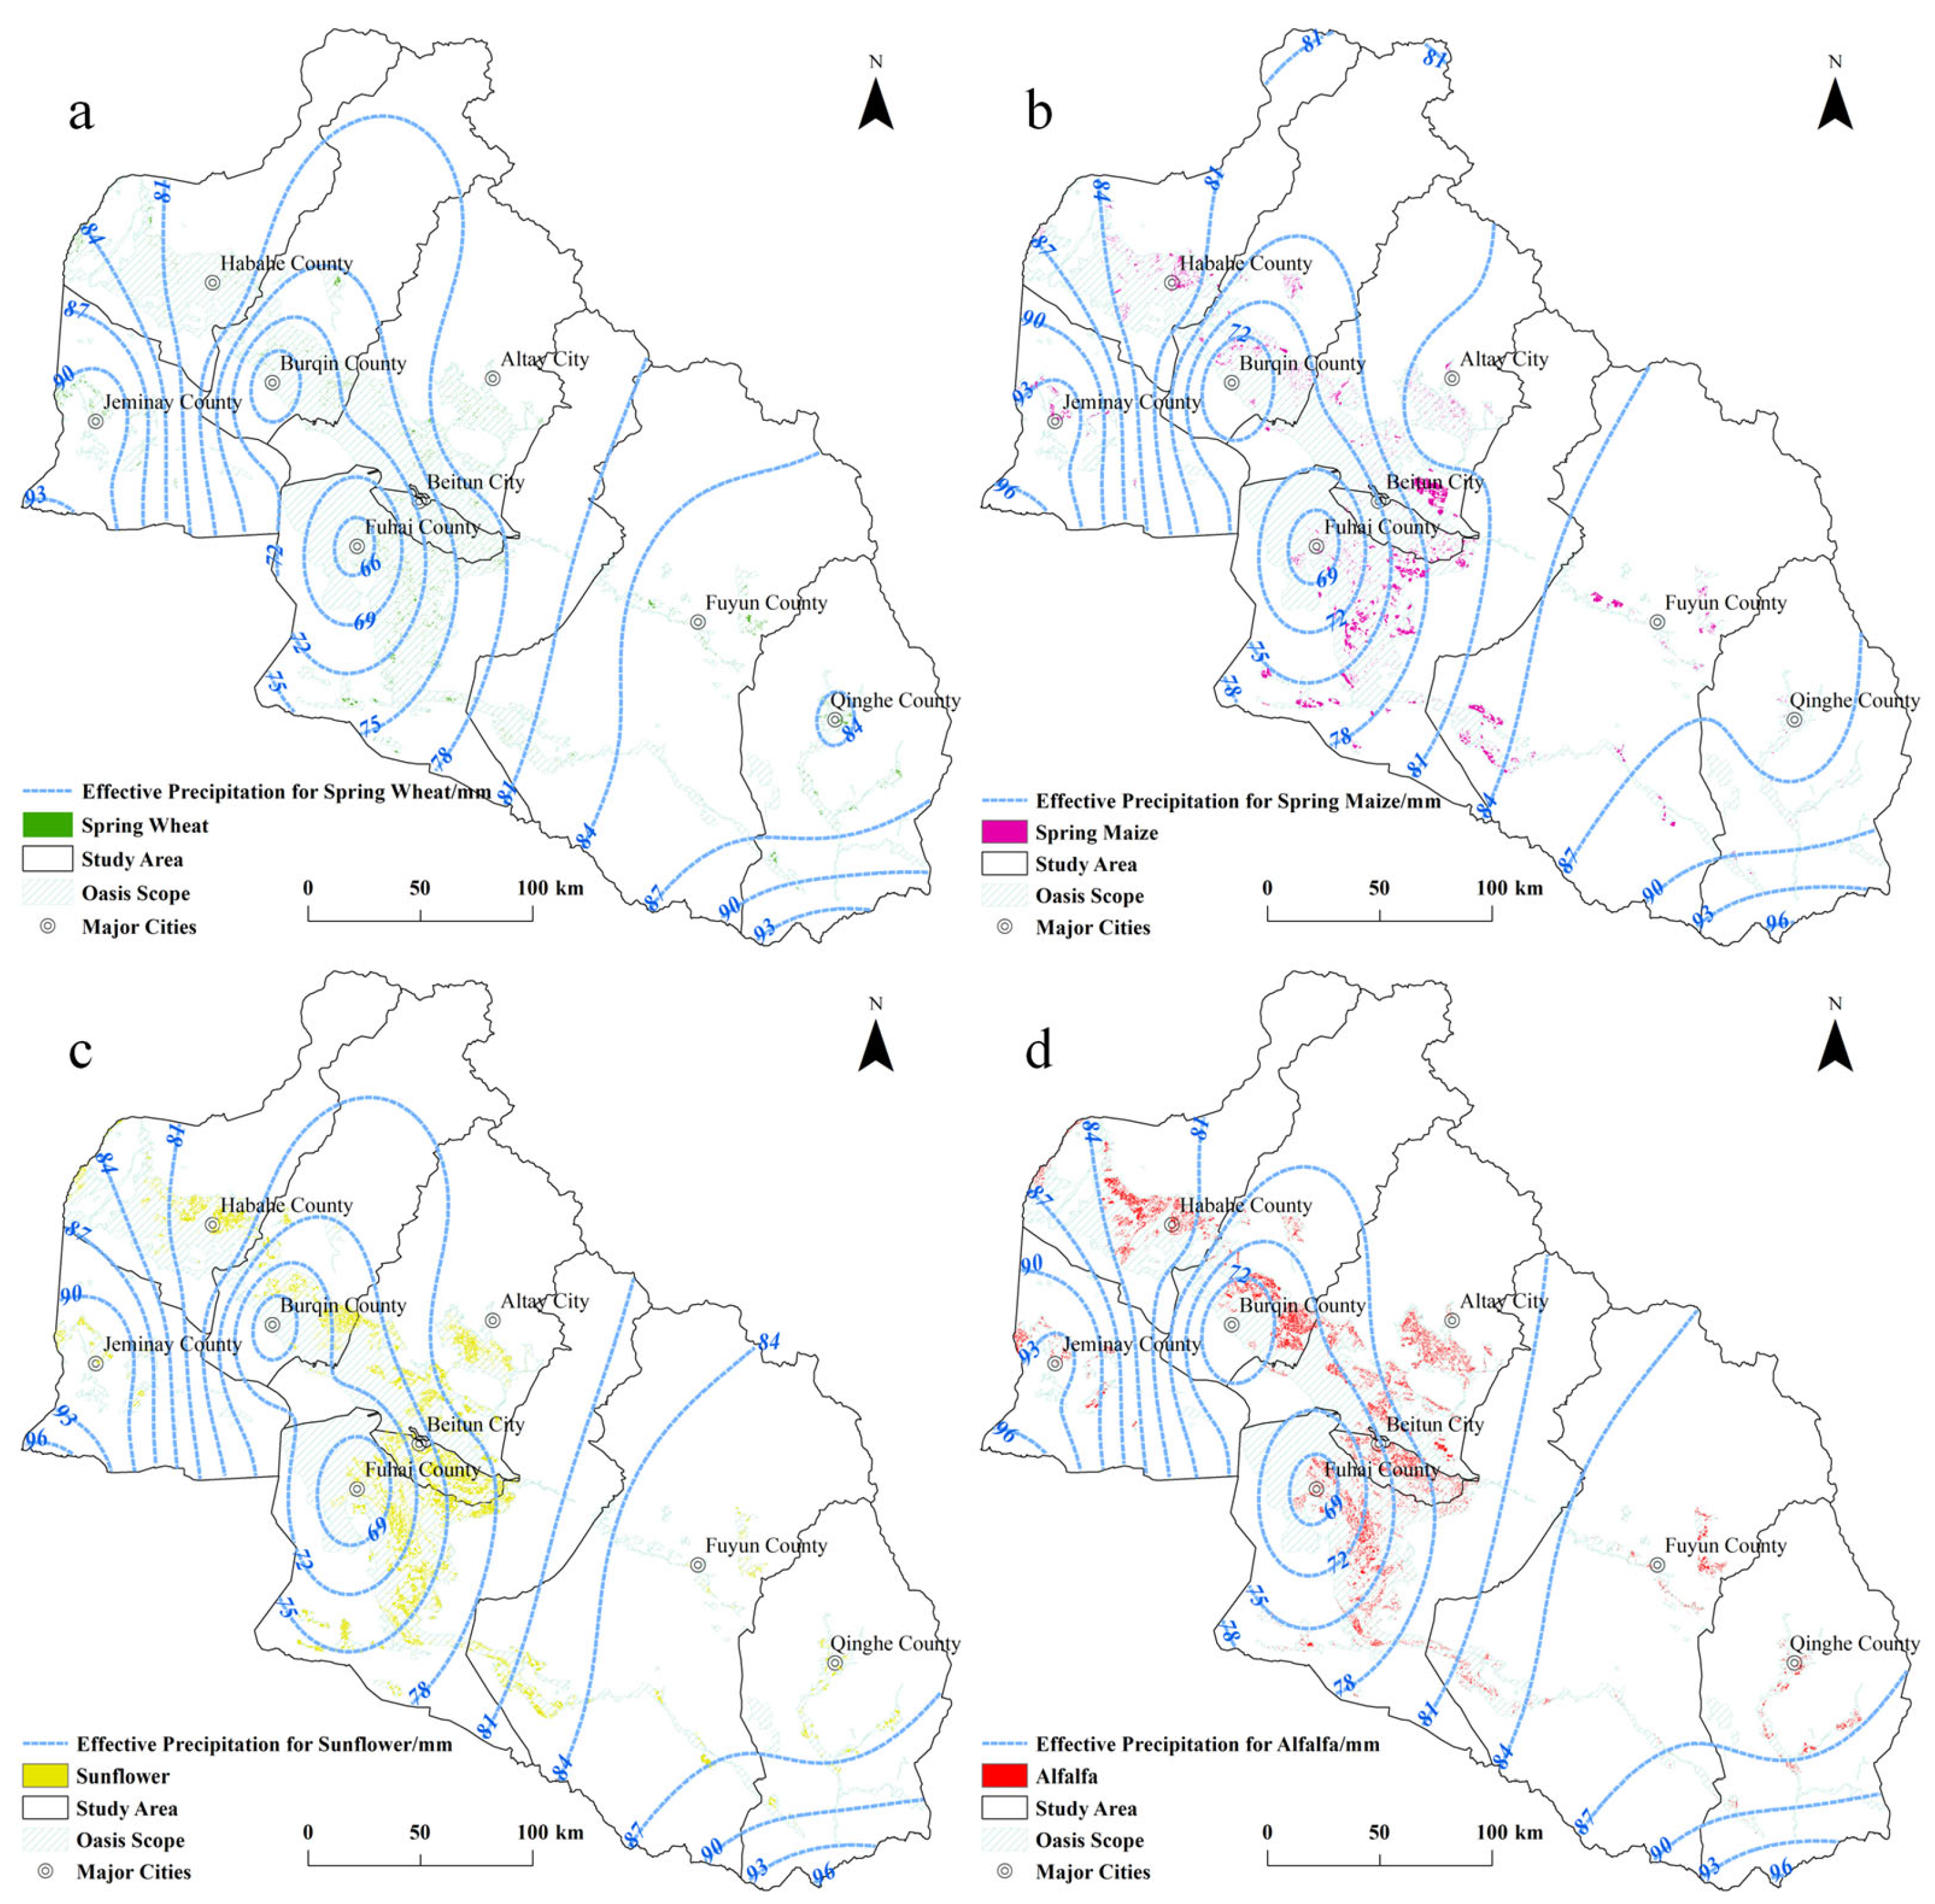
Our findings, indicating that effective precipitation meets less than 15% of crop water demand during the growing season, further confirm this high dependence on irrigation in the region. By integrating these water demand insights into our multi-scenario analysis, we propose sunflower as an optimal choice for a water-saving economic crop. This offers new evidence and a clear direction for achieving a synergistic optimization of a “water-food-economy” in arid regions.
Our research, facilitated by the holistic capabilities of the integrated framework, reveals several critical insights for sustainable agricultural development in arid regions. Promoting water-saving technologies can unlock nearly 2 × 10
8 m
3 of water-saving potential. Notably, spring wheat and alfalfa offer the largest water-saving potential per unit area, providing clear priority areas for future agricultural water conservation policies. When optimizing planting structures based on the principle of maximizing economic output, our model shows a significant expansion in edible sunflower cultivation. Crucially, this expansion leads to a reduction in regional water consumption while simultaneously increasing agricultural output value. This confirms that intelligent crop structure optimization can substantially boost water resource efficiency and agricultural economic growth [
88]. It is also noteworthy that optimizing forage crop planting structures not only reduces the water demand for beef cattle feed but also helps to increase the livestock farming scale. This clearly demonstrates the immense potential of forage crops in the agricultural transformation of arid regions. This finding further validates the “forage crop substitution strategy” proposed in this study as a feasible and important approach for ecologically vulnerable areas, offering new avenues for building more resilient agro-pastoral composite systems.
Despite the positive results, this study acknowledges limitations, primarily the constraint of mixed pixels on small-plot crop classification accuracy due to remote sensing image resolution, where small fields or their edges may contain multiple crop types, affecting precision. Future research should address this by integrating more vegetation indices for comprehensive analysis and incorporating deep learning algorithms that combine a time-series NDVI/EVI, spectral features, and texture information to build multi-modal crop identification models, thereby significantly enhancing classification accuracy [
89,
90,
91,
92,
93,
94].
Our current estimations of crop water requirements face challenges primarily due to the limited distribution of meteorological stations, leading to data gaps in mountainous and other complex terrains, which can affect accuracy [
95]. Furthermore, while the crop coefficient (Kc) values are largely sourced from the existing literature, we have incorporated local field experiment results for calibration [
96,
97,
98,
99,
100,
101]. To enhance the real-time accuracy and spatial adaptability of crop water requirement estimations, future research should focus on developing a more precise and dynamic Kc database. This could be achieved through remote sensing inversion techniques or by establishing a denser network of onsite observations.
While the promotion of micro-irrigation technologies like drip irrigation offers significant reductions in water usage per unit area, a substantial hurdle is the high upfront infrastructure investment [
102]. The water-saving benefits often require several years of operation to recoup these initial costs. Similarly, though economic crops can yield 2–3 times the output value of traditional crops per unit area, their large-scale expansion carries potential risks. This could lead to market supply–demand imbalances and increased ecological vulnerability, such as depleted soil fertility and a heightened risk of pests and diseases [
103,
104,
105,
106]. Furthermore, optimizing the structure of forage crop cultivation necessitates establishing stable external supply channels. This is crucial to ensure the consistency of forage supply and to reduce the region’s dependence on internal production alone.
Finally, our scenario settings were based on fixed market conditions and policy environments. This approach did not fully account for the complex influence of market and policy dynamics on farmers’ planting decisions, such as fluctuations in agricultural product prices or changes in water resource management policies and subsidies. Agricultural decisions are typically the result of an intricate interplay of multiple factors, including climate change, the speed of technology adoption, and dynamic market demands [
107,
108,
109,
110,
111,
112]. Therefore, future research could incorporate socio-ecological models (SESs) or probabilistic scenario analysis [
113,
114]. This would enhance the dynamism and adaptability of scenario analysis, allowing for a more comprehensive simulation and evaluation of the complex behaviors within agricultural systems and thus a more robust exploration of the coupling relationship between land and water resources.
5. Conclusions
This study successfully developed an integrated framework combining remote sensing, a crop water model, and multi-scenario analysis to explore the coupling relationship between land and water resources in Altay’s oasis agriculture. Our research yielded several key findings.
Firstly, a significant achievement of this research was demonstrating that the decision tree method can effectively identify crops at a regional scale using remote sensing data. This capability provides the foundational, precise crop distribution data essential for accurate water resource assessment within our integrated framework. We also found a dominance of a few major crops—spring wheat, spring maize, sunflower, and alfalfa—which together account for over 78% of the total sown area. Secondly, the framework enabled the accurate quantification of crop water requirements, a vital input for water resource management. Our precise crop water modeling identified that spring wheat and alfalfa exhibit the highest water demand, while sunflower shows strong water-saving potential and economic benefits. Natural precipitation meets only 15% of crop water needs, highlighting the Altay oasis’s heavy reliance on irrigation. Despite occupying only 2.85% (3368 km2) of the total land area, the main crops account for 82.5% of total regional water use. This highlights the need for targeted water management strategies tailored to these high-impact crops. Furthermore, through multi-scenario simulation and analysis, the framework effectively identified strategies for both water conservation and agricultural development. Promoting micro-irrigation technology and expanding sunflower cultivation can significantly reduce agricultural water consumption while increasing the agricultural output value. Optimizing forage crop structures offers substantial dual benefits for both livestock development and water conservation. Specifically, prioritizing a three-crop forage system (excluding soybean) significantly enhanced beef cattle breeding capacity, even under existing land or water constraints. This strategic shift in forage cultivation directly supports expanding the livestock scale while simultaneously conserving precious water resources.
In conclusion, by synergistically linking remote sensing, water modeling, and scenario analysis, this study offers a more holistic and accurate basis for sustainable decision-making than traditional, fragmented methods. This study not only advances an academic understanding of land and water resource optimization in arid agriculture but also provides a scientific basis for sustainable water and land resource management in arid oasis regions.


