Article

Spatiotemporal Distribution of Cultural Heritage in Relation to Population and Agricultural Productivity: Evidence from the Ming-Qing Yangtze River Basin

College of Landscape Architecture, Sichuan Agricultural University, Chengdu 611130, China
*
Author to whom correspondence should be addressed.
Land 2025, 14(7), 1416; https://doi.org/10.3390/land14071416
Submission received: 9 June 2025 / Revised: 30 June 2025 / Accepted: 4 July 2025 / Published: 5 July 2025

Abstract

As a carrier of civilization, cultural heritage reflects the dynamic relationship between humans and their environment within specific historical contexts. During the Ming and Qing Dynasties (1368–1912 CE), the Yangtze River Basin was one of the most prominent regions for economic and cultural activities in ancient China. The cultural heritage of this period was characterized by its dense distribution and continuous evolution. Considering the applicability bias of modern data in historical interpretation, this study selected four characteristic variables: population density, agricultural productivity, technological level, and temperature anomaly. A hierarchical Bayesian model was constructed and change points were detected to quantitatively analyze the driving mechanisms behind the spatiotemporal distribution of cultural heritage. The results show the following: (1) The distribution of cultural heritage exhibited a multipolar trend by the mid-period in both Dynasties, with high-density areas contracting in the later period. (2) Agricultural productivity consistently had a significant positive impact, while population density also had a significant positive impact, except during the mid-Ming period. (3) The cultural calibration terms, which account for observational differences resulting from the interaction between cultural systems and environmental variables, exhibited slight variations. (4) The change point for population density was 364.83 people/km2, and for agricultural productivity it was 2.86 × 10⁹ kJ/km2. This study confirms that the differentiation in the spatiotemporal distribution of cultural heritage is driven by the synergistic effects of population and resources. This provides a new perspective for researching human–land relations in a cross-cultural context.

1. Introduction

Cultural heritage is a legacy of history, reflecting the social concepts of a specific era [1]. According to the UNESCO framework, cultural heritage is categorized into tangible and intangible forms [2,3], encompassing a wide range of expressions such as historic buildings, cultural sites, and traditional craftsmanship. These heritages are regarded as vital cultural assets due to their historical significance, aesthetic value, and scientific importance. In light of global development disparities and mounting climate threats, there is an urgent need to systematically research and protect cultural heritage to promote more equitable and sustainable development.
In recent years, cultural heritage research has evolved into an increasingly interdisciplinary field integrating the humanities (archaeology, anthropology, history) [4], social sciences (sociology, economics) [5], technology [6], and environmental studies [7]. Its research themes span a wide range of areas, including heritage tourism [8,9], digital visualization [10,11], heritage conservation [12,13] and management [14,15], the construction of social significance [16,17], value assessment [18,19], spatiotemporal distribution and formation mechanisms [20,21], material analysis [22,23], and restoration [24,25]. The expanding scope of these themes has directly driven the development of technical approaches and methodological frameworks. Consequently, research methods now demonstrate a trend towards developing diverse pathways concurrently, including literature analysis [26], remote sensing monitoring [27], spatial modeling [28], spectral imaging [29], and machine learning [30]. As interdisciplinary research has advanced, academic attention has increasingly focused on integrative fields combining humanistic and environmental perspectives [31]. Against this backdrop, the study of the spatiotemporal distribution and formation mechanisms of cultural heritage has emerged as a vital means of understanding human–environment interactions and regional development dynamics. This line of inquiry, which considers geographical processes and cultural evolution, is particularly valuable in historically rich river basins [32]. The distribution patterns of cultural heritage sites in these areas reflect ancient socio-economic structures and embody the underlying mechanisms of environmental adaptation and cultural transmission.
Thanks to the application of geographic information system (GIS) technology, spatial quantitative analysis has gained prominence in this field [33]. Research scales range from the local [34] and regional [35] to the national level [36]. However, most studies primarily use ArcGIS to qualitatively interpret natural factors such as elevation, slope, and water systems [37], and social factors such as transportation and economy [38]. The lack of systematic modeling and quantitative analysis means that our understanding of the logic of spatial evolution remains constrained by empirical observations. Additionally, such studies often use modern geographical and transportation data to represent ancient environments [32], overlooking the compounded errors inherent in substituting ancient contexts with modern datasets. This may compromise the accuracy of analyses of the mechanisms influencing heritage distribution.
To address the aforementioned limitations, this study posits that although social activities are inherently complex and occasionally irrational, they are still constrained by physical factors such as material conditions and energy flows [39]. Cultural heritage is regarded as a concentrated manifestation of human activity, shaped by the intensive aggregation of resources and energy. To this end, the study selected population density, agricultural productivity, technological level, and temperature anomaly as characteristic variables to reveal the spatiotemporal distribution characteristics and evolutionary patterns of cultural heritage in the Yangtze River Basin during the Ming and Qing Dynasties. In international academic discourse, the term ‘cultural heritage’ is used inclusively to encompass both tangible and intangible dimensions. When referring to a specific category, scholars commonly use qualifiers such as ‘tangible’ or ‘intangible’ for clarity [40]. Based on the specific characteristics of the research objects and to avoid redundancy, this study exclusively uses the term ‘cultural heritage’ to refer to immovable tangible cultural heritage. This includes five primary types: ancient sites, ancient tombs, ancient buildings, grotto temples and stone carvings, and modern and contemporary historical sites and representative buildings [41].
As a core geographical and cultural region of China [42], the Yangtze River Basin has nurtured a vast and diverse array of cultural heritage throughout history. The similarities and differences between this basin and other major river civilizations worldwide make it an important case study for understanding broader patterns in cultural geography. This study analyzes the spatiotemporal distribution characteristics and evolutionary mechanisms of representative heritage sites from the Ming and Qing Dynasties within the basin. The analysis provides novel insights into the adaptive pathways of culture in East Asia and beyond. The research findings aim to enhance understanding of historical geographical processes and contribute a novel theoretical framework to the field of global cultural heritage research and conservation.

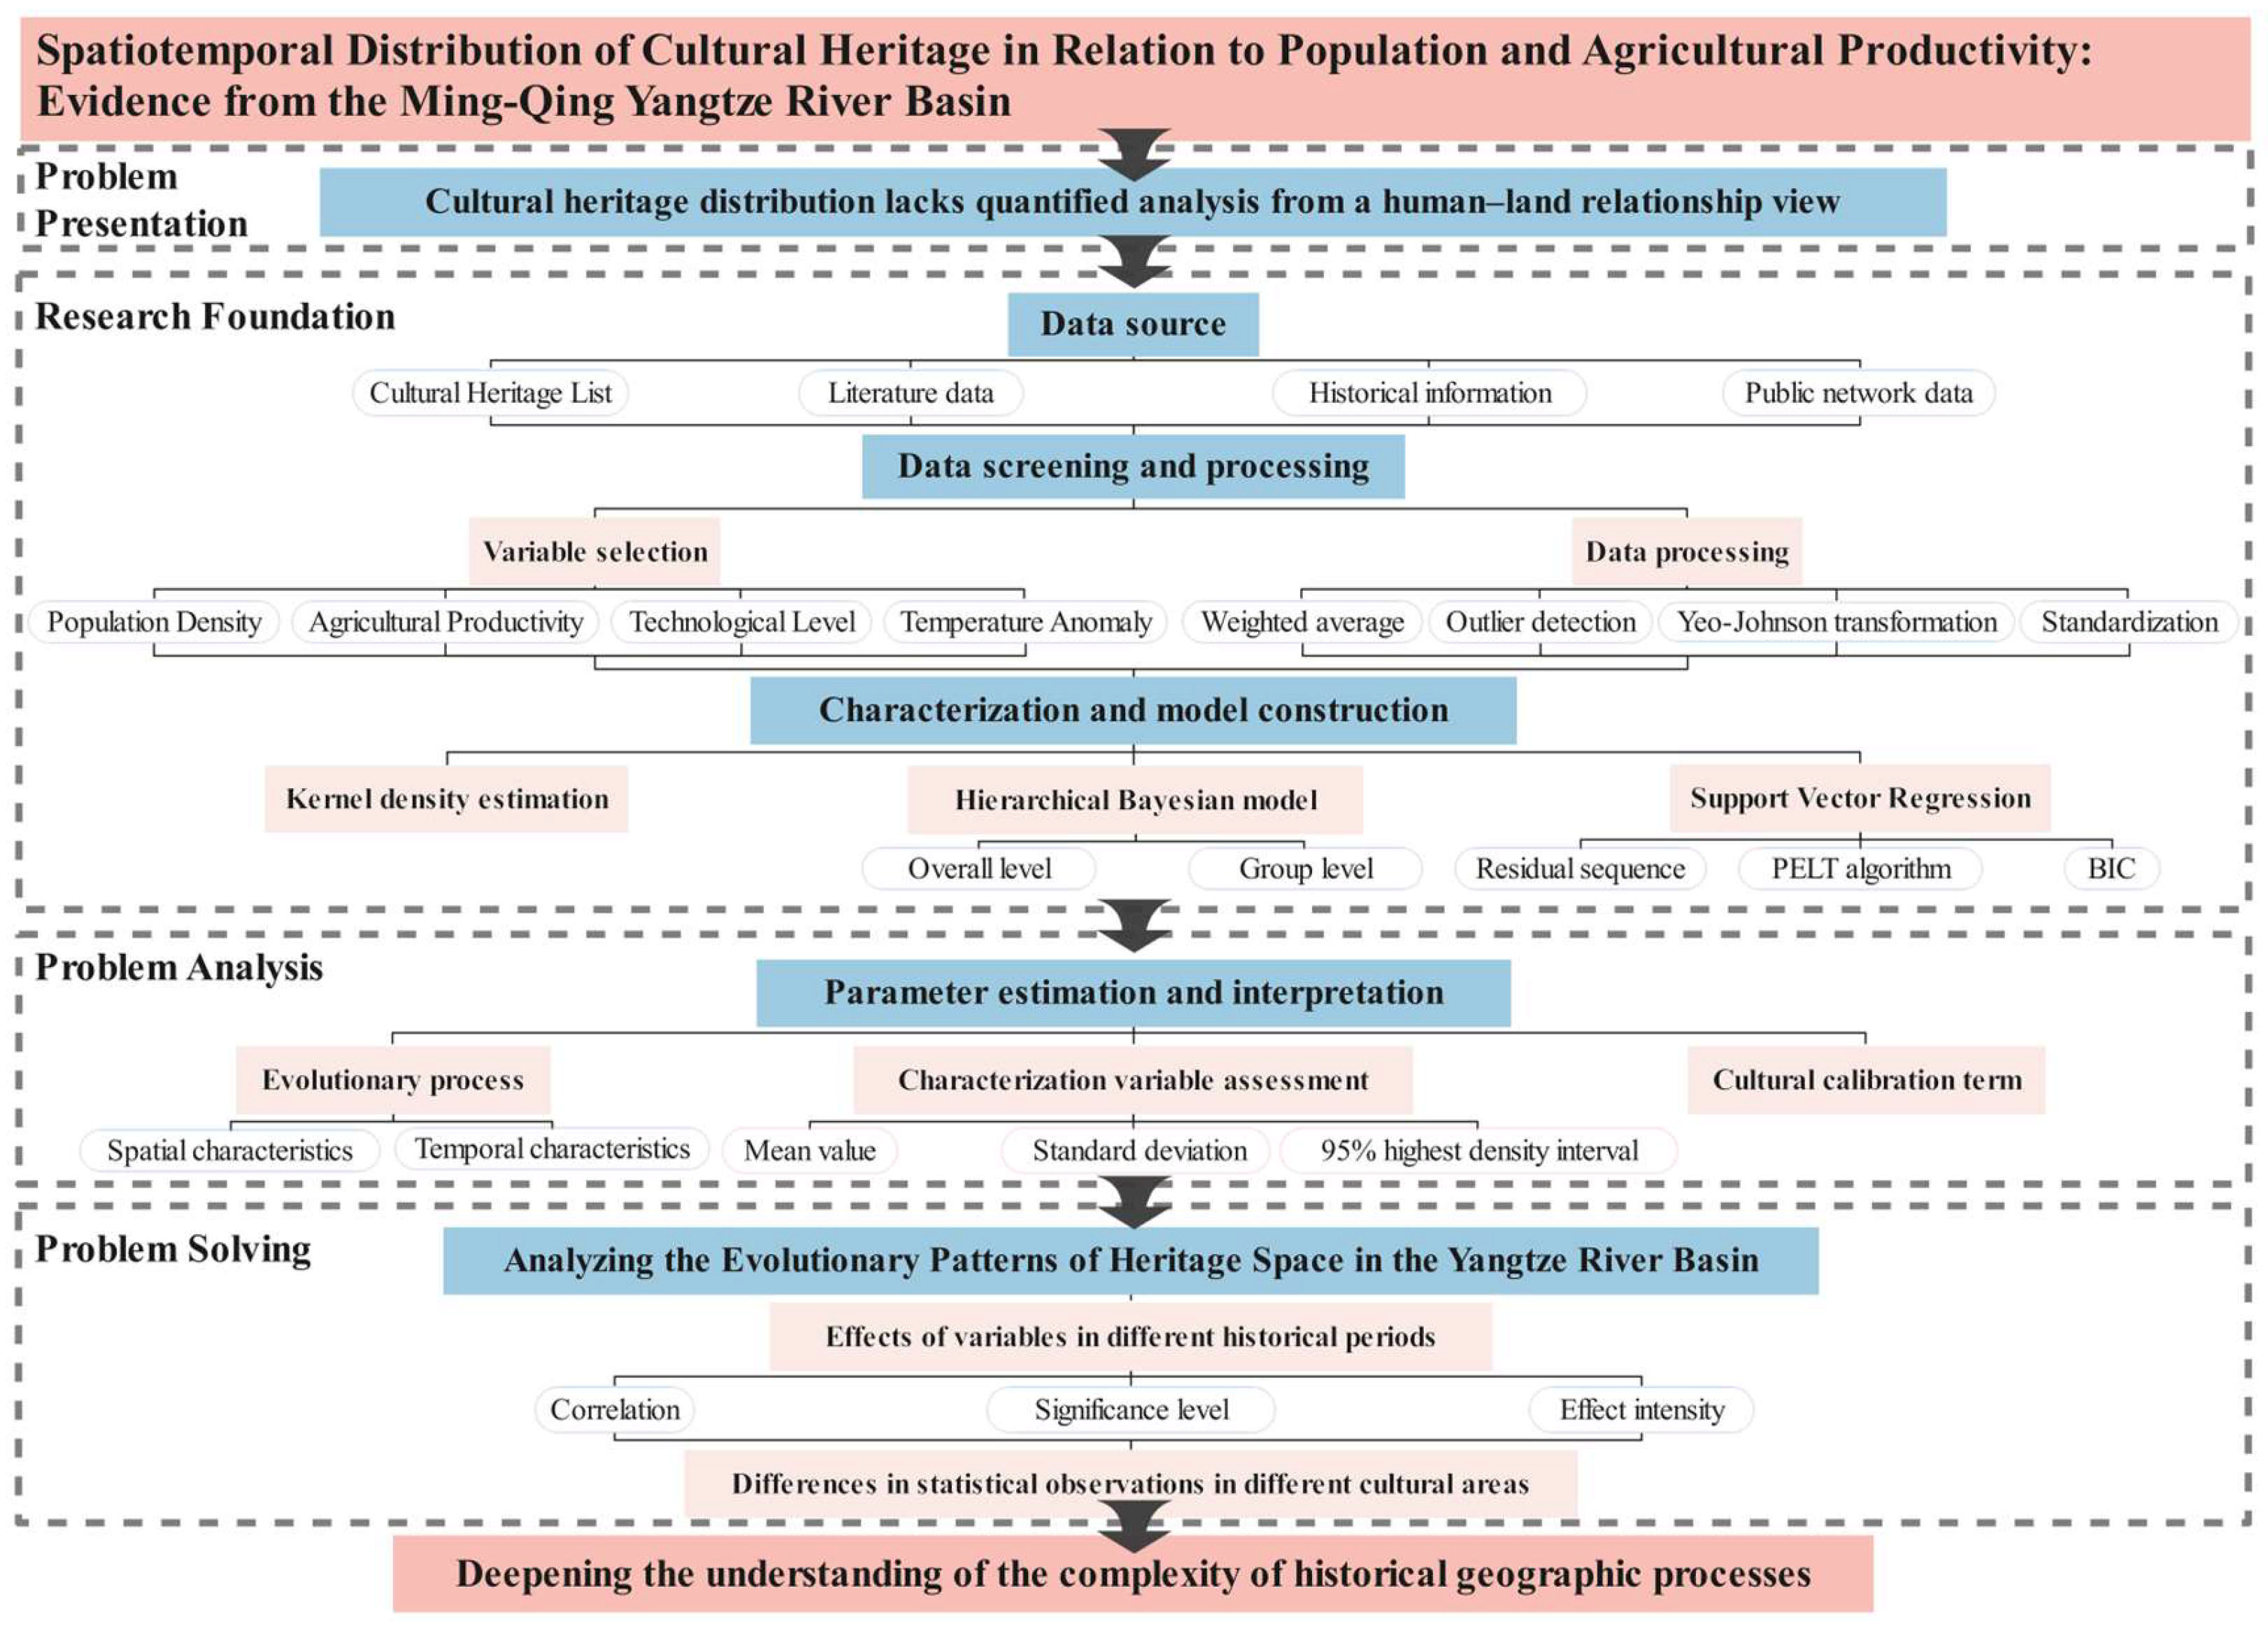
2. Materials and Methods
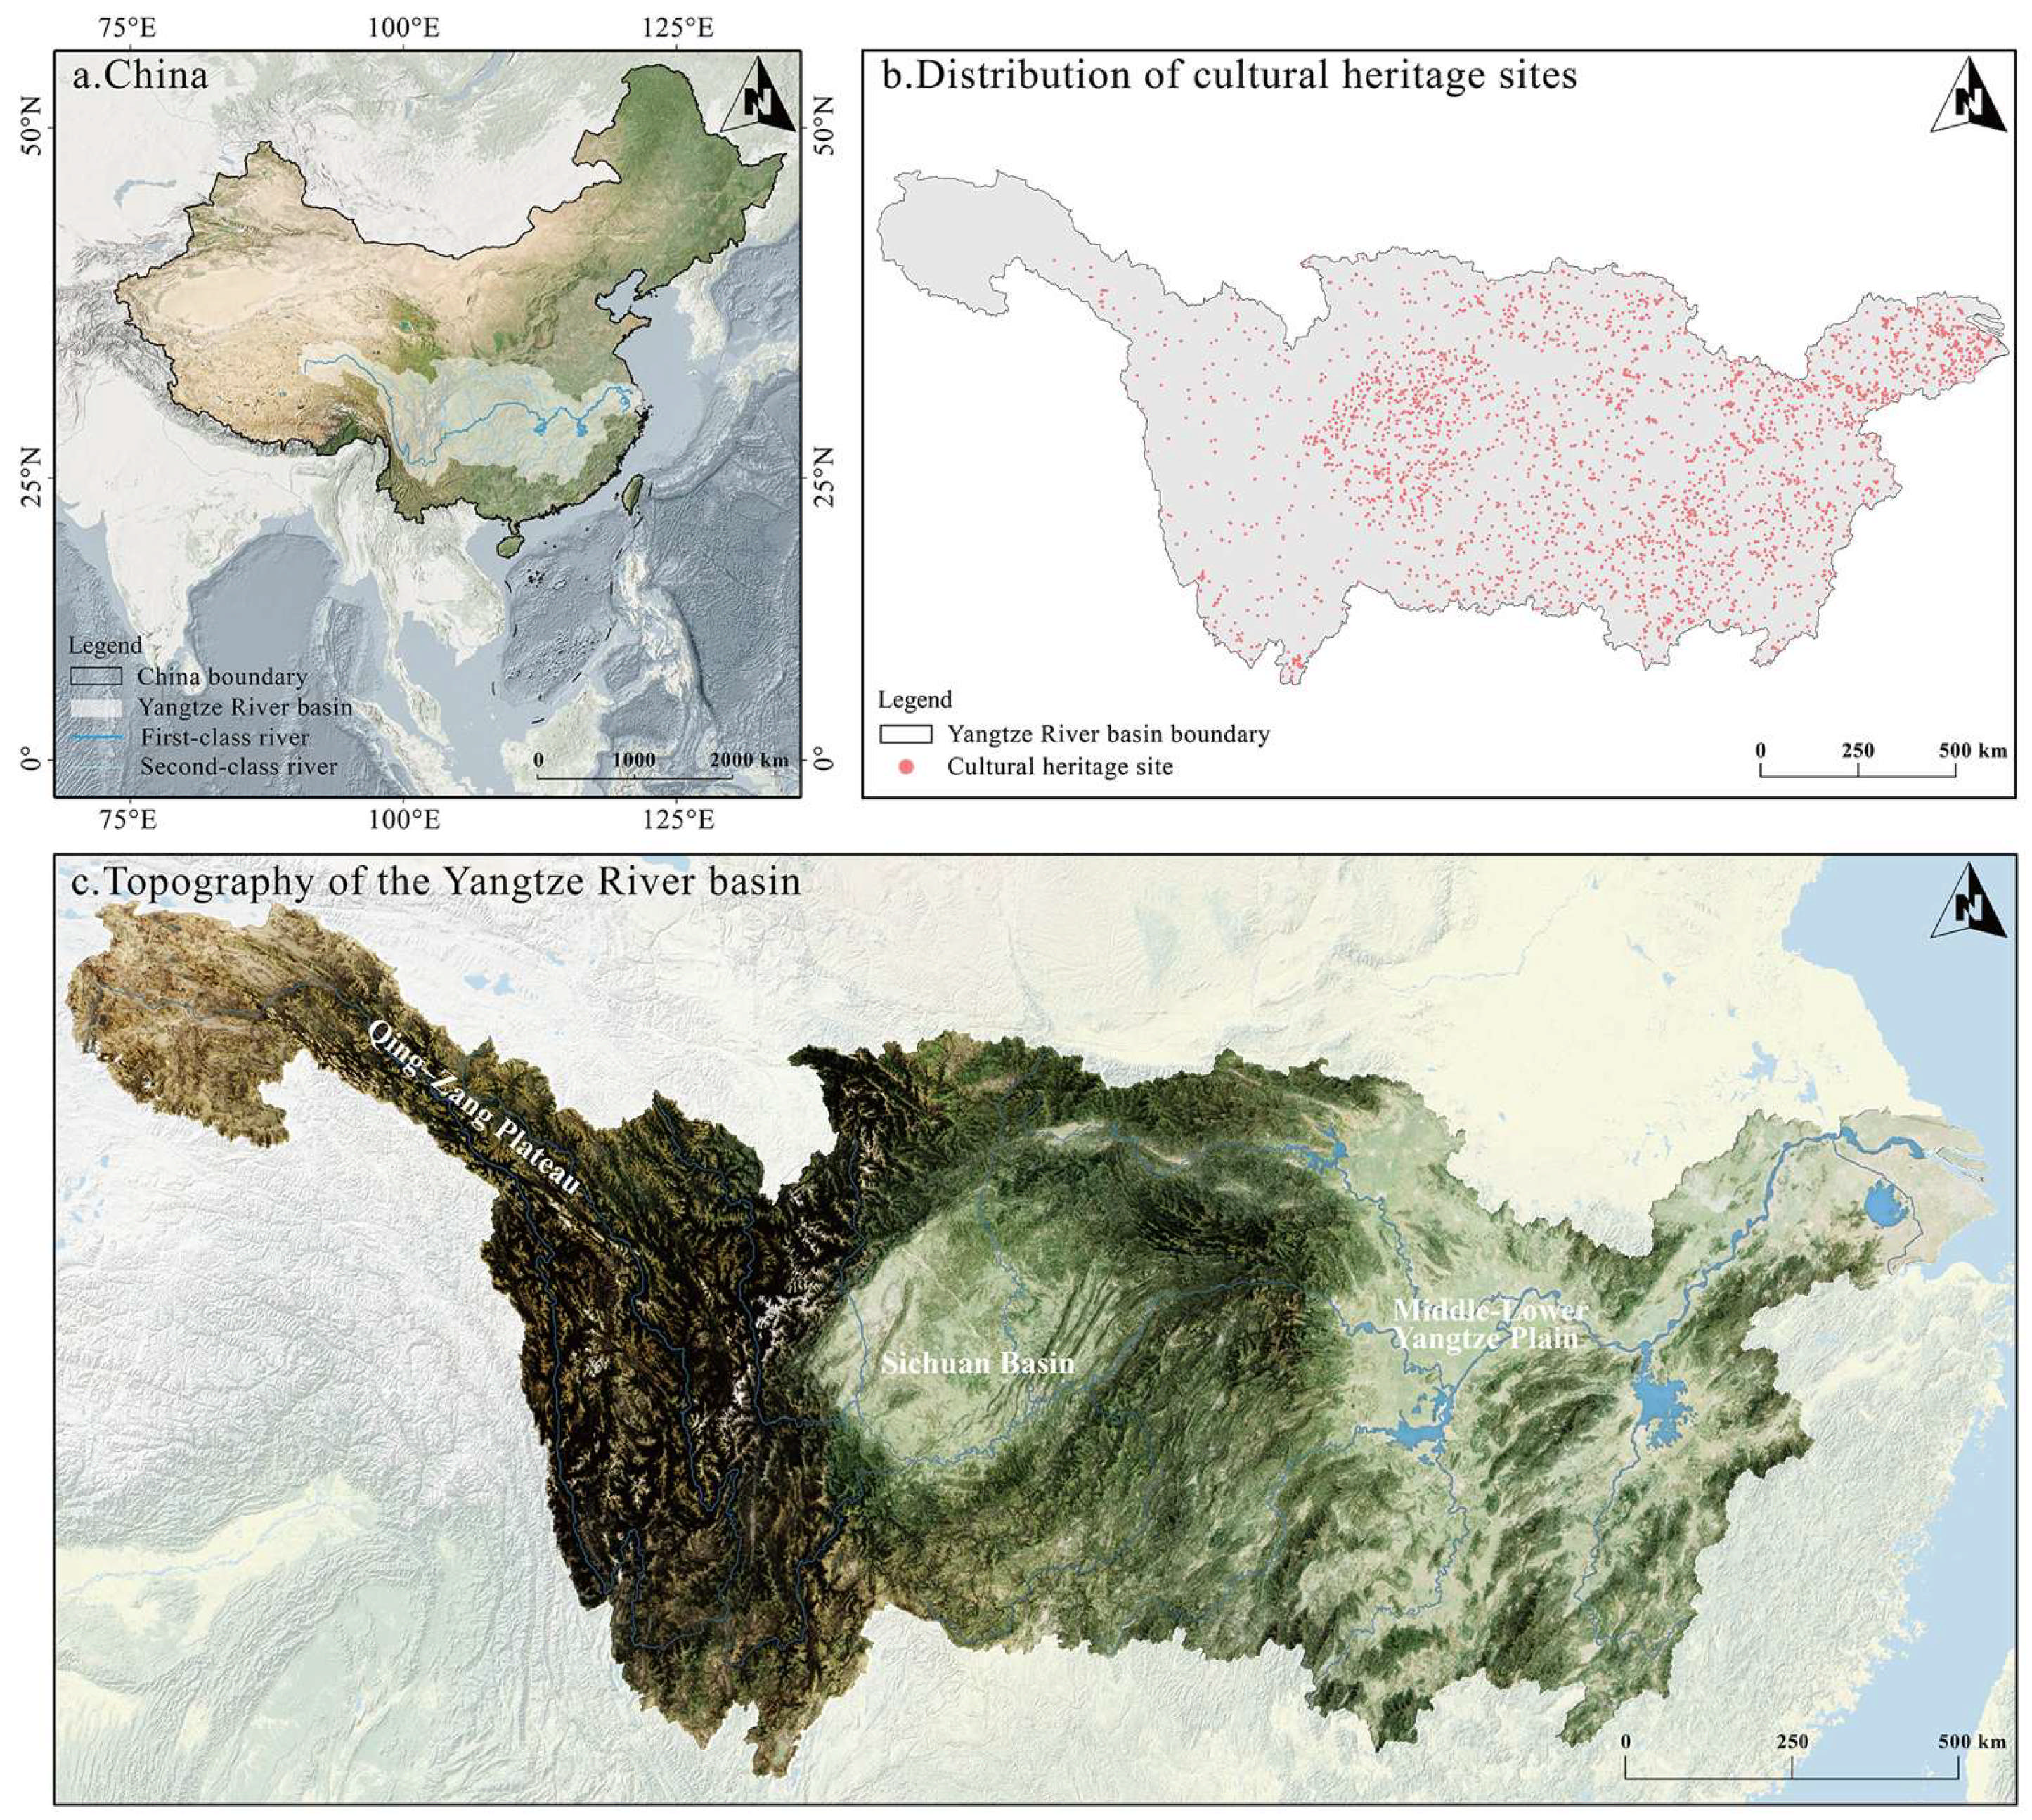
2.1. Research Area

The Yangtze River Basin (approximately 90° E–122° E, 24° N–35° N) covers an area of 1.8 million km2 and spans the Qinghai–Tibet Plateau, the Sichuan Basin, and the middle and lower reaches of the Yangtze River Plain (Figure 1). As the core region of Chinese civilization, the basin has supported human activity since the Paleolithic era. Its significant topographical variations and climatic gradients have shaped diverse ecological and agricultural zones, forming the natural foundation for the spatial differentiation of civilization [43]. Driven by factors such as social structure, resource endowments, and technological progress, China’s economic center gradually shifted southwards from the Yellow River Basin to this region beginning with the Western Jin Dynasty (265–316 CE). By the Ming and Qing Dynasties, the basin accounted for over 60% of the nation’s grain production [44]. Mounting population pressure and declining land productivity in parts of the middle and lower reaches (>100 people/km2) [45] prompted changes in land management models, such as the adoption of the clan field system. As cultural customs spread and technology advanced, a landscape of high-density cultural layers emerged. Compared to the compounded pressures experienced in the Mesopotamian and Nile River basins, the Yangtze River Basin maintained increasing energy output and the continuity of civilization through the development of terraced fields, embanked agriculture, and double-cropping rice systems, as well as sustained administrative structures [46]. Its heritage spatial patterns reflect the adaptive mechanisms of human–land relationships under high pressure, offering insights into the long-term interactive mechanisms between human adaptation and environmental constraints in the pre-industrial era.

2.2. Data Source

A total of 3934 cultural heritage sites were identified based on the list published by the cultural heritage protection authorities. Among these, 318 are attributed to the early Ming Dynasty (1368–1441 CE; hereafter Period I), 732 to the mid-Ming Dynasty (1442–1582 CE; Period II), and 211 to the late Ming Dynasty (1583–1644 CE; Period III). Additionally, 455 sites are attributed to the early Qing Dynasty (1644–1735 CE; Period IV), 1165 to the mid-Qing Dynasty (1736–1850 CE; Period V), and 1053 to the late Qing Dynasty (1851–1912 CE; Period VI). The spatial coordinates of the sites were obtained from the Baidu coordinate system and converted from BD-09 to WGS84 coordinates using Python 3.12.4.
Historical maps were obtained from the homepage of researcher yuanyy_worldmap the Harvard WorldMap platform (https://worldmap.maps.arcgis.com/home/index.html, accessed on 21 February 2025). The 12.5 m resolution DEM data for each Chinese province was obtained from the Resource and Environmental Science Data Platform (https://www.resdc.cn/data.aspx?DATAID=337, accessed on 5 March 2025), merged using ArcGIS Pro, and clipped to the Yangtze River Basin using a mask. Population and arable land data were cross-referenced with Statistics of Population, Land and Land Tax in China Throughout the Dynasties [44], and entered by year and ancient administrative division. Grain yield per mu and crop planting ratios were determined by combining data from Study on grain yield per mu in past dynasties of China (updated and reprinted) [47], Historical Agricultural Geography of China [48], and Study on grain yield per mu in Qing Dynasty [49]. The 90 m resolution Chinese soil organic carbon dataset was obtained from the Soil SubCenter, National Earth System Science Data Center, National Science & Technology Infrastructure of China (http://soil.geodata.cn, accessed on 10 March 2025). Temperature anomaly data were derived from the nearly thousand-year Chinese temperature series established by Wang S. et al. [50].

2.3. Data Screening and Processing

This study selected population density (PD), agricultural productivity (AP), technological level (TL), and temperature anomaly (TA) as explanatory variables for the formation mechanism of the spatiotemporal distribution of cultural heritage. This selection was based on a comprehensive evaluation of both the limitations of historical data and the principles governing civilizational evolution. Due to the absence of systematic ancient geographical and social data, historical records are typically fragmented and incomplete. Therefore, it is essential to adopt universally applicable quantitative indicators to ensure consistency across spatial and temporal dimensions. From an ecological anthropological perspective, human social behavior is consistently constrained by material and energy factors [51]. The emergence of cultural heritage reflects a highly concentrated accumulation of energy. The combination of PD and AP effectively captures the material basis and social dynamics necessary for the emergence of cultural heritage. Furthermore, although technological development has primarily functioned as an instrumental rather than a determining force in the evolution of cultural heritage, it can still effectively facilitate social continuity and transformation [52]. When human agency remains at the core of social dynamics, technology can enhance the efficiency of cultural transmission. Even though traditional communities have been able to sustain cultural inheritance with minimal technological input, the level of technological development should nevertheless be incorporated as an important auxiliary variable within the analytical framework. Climate fluctuations profoundly influence agricultural output, population distribution, and social stability [53]. This impact was particularly pronounced during the Ming and Qing Dynasties, which were dominated by traditional agriculture. Temperature anomalies, which indicate deviations from long-term climate norms, indirectly affect the distribution of cultural heritage.
The data processing steps were as follows: First, the indicators that could not be obtained directly were calculated before modeling. Data from multiple years were weighted and averaged to obtain the characteristic values corresponding to each period. Outliers were then identified and addressed to eliminate the impact of extreme values on the model results. Next, the Yeo–Johnson transformation was applied to enhance the normality and variance stability of the variables. Finally, standardization was performed to meet the prior requirements and parameter estimation needs of the Bayesian model.
(1)
Calculation of average annual heritage density
To avoid bias caused by differences in the length of time between historical periods, this study selected average annual heritage density (AAHD) as the target variable, calculated using the following formula:
A A H D = N A r × Δ T
N represents the number of cultural heritage sites in a given area; Ar represents the area of that region (km2); ΔT represents the duration of a given historical period (in years).
It should be clarified that this variable is calculated based on cultural heritage sites that have been formally recognized by contemporary communities. These analytical objects are cultural elements that have crossed the threshold of contemporary heritage recognition, not merely archeological remains or historical cultural features.
(2)
Calculation of agricultural productivity
The agricultural productivity used in this paper refers to the heat output of crop production per unit area, which is used to reflect the level of energy supply supporting human activities in a specific region. The formula is as follows:
A P = S × G × H A r
S represents the area of arable land; G represents the grain yield per unit area (kg/km2); H represents the average calorific value of grain (kJ/kg), which is approximately 15,069.06 kJ/kg according to the Food Composition Tables published by the Food and Agriculture Organization of the United Nations [54]; Ar represents the region’s area (km2).
(3)
Calculation of technological level
The Cobb–Douglas (C–D) production function is widely used to reveal the impact of inputs on economic growth. Its application has expanded beyond traditional economic analysis to fields such as agriculture and environmental science. Due to the lack of reliable historical technology data, this study used grain yield per mu as a proxy for technological level. A C–D function incorporating multiple variables, including climate factors, was then employed to estimate this level [55].
Y = A · L α · C β · T γ
In Equation (3), Y denotes grain yield per mu; A represents technological level; L indicates soil fertility; C denotes temperature anomaly; and T refers to population density. The coefficients α, β, and γ represent the output elasticities of the corresponding variables. In this study, organic carbon content was converted to organic matter content to approximate L [56].
To facilitate parameter estimation, the C–D function was transformed into a linear model using the natural logarithm. Let ln(A) = β0, and introduce an error term ϵ. Ordinary Least Squares (OLS) regression was then used to estimate the parameters β0, α, β, and γ, from which the technological level A was derived as A = eβ0.
ln ( Y ) = ln ( A ) + α ln ( L ) + β ln ( C ) + γ ln ( T ) + ϵ
(4)
Weighted average processing of multi-period characteristic variables
In fields such as sociology and ecology, the current state of a system is often the result of interactions and cumulative effects over multiple time periods [57]. Complex systems exhibit temporal lags in their response to disturbance factors [58], meaning that more recent observational data more accurately reflects the system’s current state. Within this framework, the weighted average method using linear increments can be applied to allow for differentiated weight allocation to historical data. The core idea is to increase the influence of more recent data to quantify the historical accumulation effects of each characteristic. Ultimately, multiple data points from a given period are integrated into a single representative characteristic value. The formula is as follows:
μ ω = i = 1 n ω i x i = i = 1 n 2 i n n + 1 x i
In Equation (5), μω represents the weighted average for the target time period; i denotes the time index, increasing from the earliest to the most recent time point; n refers to the total number of data points within the time period; ωi represents the weight for the i-th time point; and xᵢ is the observation value at the i-th time point.
(5)
Outlier detection and treatment
The modified z-score method, which combines the median and the median absolute deviation (MAD), effectively mitigates the impact of extreme values on the statistical properties of the sample [59]. This method was used in this study to identify outliers. After removing the extreme outliers that fell outside the expected physical range, the remaining outliers were addressed using median imputation.
M i = 0.6745 × ( x i x ˜ ) MAD
MAD = median x i x ˜
Among them, x ~ is the median of sample point xi. Observations with |Mi| > 3.5 are usually considered outliers.
(6)
Yeo–Johnson transformation
This is a widely used preprocessing method for various types of data, performing excellently when the data contains outliers or is skewed. It effectively stabilizes the variance of random variables and improves their normality, thus meeting the normality assumption required by Bayesian models [60].
Y ( λ ) = ( Y + 1 ) λ 1 λ , if   Y 0 , λ 0 ln ( Y + 1 ) , if   Y 0 , λ = 0 ( Y + 1 ) 2 λ 1 2 λ , if   Y < 0 , λ 2 ln ( Y + 1 ) , if   Y < 0 , λ = 2
In Equation (8), Y(λ) represents the transformed data, and Y represents the original data. The transformation parameter, λ, adjusts the shape of the transformation and is determined using the maximum likelihood estimation method.
(7)
Standardization
Standardization aims to unify variable scales and avoid biases caused by differences in the scales of different characteristics [61]. The formula is as follows:
x = x μ σ
x is the original data value; μ is the mean of the data; σ is its standard deviation.

2.4. Research Methods

Figure 2 illustrates the complete research framework. In this study, kernel density estimation was used in ArcGIS Pro to visualize the spatiotemporal distribution characteristics of cultural heritage. The model parameters were then gradually adjusted to achieve optimal performance, and the posterior distributions of the regression coefficients and cultural calibration term were extracted. Finally, a change point detection method was used to identify abrupt changes in the values of different features. Both the hierarchical Bayesian model construction and the change point detection were implemented using Python and its associated libraries.
(1)
Kernel density estimation (KDE)
This method smooths the data distribution by overlaying kernel functions to estimate the probability density function of a random variable. It is widely used for visualizing complex datasets and identifying underlying trends [62].
f n x = 1 n h i = 1 n K x x i h
In Equation (7), n represents the sample size; h represents the bandwidth parameter that controls the degree of smoothing, with larger values producing smoother estimates; K represents the kernel function; and xᵢ refers to the i-th observation point.
First, Silverman’s rule of thumb was used to calculate the optimal bandwidths for each period [63], yielding the values 135,965 m, 117,008 m, 140,151 m, 125,795 m, 94,621 m, and 96,088 m, respectively. To ensure comparability of the results, a unified bandwidth parameter was then determined using a sample-size-weighted averaging method. The final bandwidth value was 108,569 m.
(2)
Hierarchical Bayesian model (HBM)
This model incorporates hyperpriors across multiple levels to enable information sharing, thereby improving inference accuracy by leveraging other samples from different categories. Its hierarchical regression structure balances the influence of hyperpriors with group-specific parameters, enabling the model to capture both intergroup dependencies and intragroup variability. Within the hierarchical framework, partial pooling enables parameter shrinkage towards the overall mean, providing robust group-level estimates [64].
In this study, the constructed HBM was organized into six groups based on historical periods from Period I to Period VI, in order to explore associations and differences over time. Cultural calibration terms were introduced to improve the model’s geographic adaptability by accounting for baseline variation across regions. The original dataset was randomly divided into a training set (70%) and a test set (30%). The model hierarchy is as follows:
Overall level: Hyperpriors are set for all data to achieve information transfer between multiple levels and to constrain the parameter range of each group.
μ α ~ N ( 0 , 1 2 ) , σ α ~ HalfNormal ( 1 )
μ β ~ N ( 0 , I ) , σ β ~ i . i . d . H a l f N o r m a l ( 0.50 )
Among them, μα and σα represent the global mean and standard deviation of the intercept terms for all groups, respectively. μβ and σβ represent the global mean and standard deviation vectors of the regression coefficients, respectively. μβ is assumed to follow a multivariate normal distribution with an identity covariance matrix I. i.i.d. here indicates that each element in the vector σβ is independent and identically distributed.
Group level: This level includes group-specific parameters, such as intercepts and regression coefficients. Although these parameters tend to shrink towards the overall mean due to structural constraints, they are still independently sampled from the hyperpriors using the Markov Chain Monte Carlo (MCMC) method [65], thereby preserving differences between groups. In the observation model component, separate regression sub-models are constructed for each group.
α g [ i ] ~ N ( μ α , σ α 2 ) , β ( g [ i ] ) ~ N ( μ β , σ β 2 )
y i ~ N α g [ i ] + X i β ( g [ i ] ) + γ k [ i ] , σ 2 , k = C U L ( i )
γ k ~ N ( 0 , σ α 2 ) , k = 1 , 2 , , 7
αg[i] represents the intercept of the group to which the i-th sample belongs; β(g[i]) represents the regression coefficient vector constrained by the hyperprior; Xi represents the feature vector; γk[i] represents the cultural calibration term corresponding to the sample. This term is shared across all temporal groups and is designed to correct for potential systematic biases among regions. It does not serve as a value judgment of cultural types but rather reflects the structural impact differences introduced by varying cultural backgrounds. Seven distinct cultural types are defined based on the regional characteristics of the Yangtze River Basin [66].
(3)
Change point detection method
Support Vector Regression (SVR) uses kernel functions to map data into a high-dimensional feature space, thereby constructing an optimal regression function [67]. Due to its applicability to complex fitting tasks, this study employed SVR to model the relationship between AAHD and significant feature variables, subsequently obtaining the residual sequence. The pruned exact linear time (PELT) algorithm was then applied to identify structural changes in the data by minimizing the total cost function [68].
TotalCost = i = 1 k + 1 C ( y t i 1 + 1 : t i ) + β k
BIC = n · ln 1 n i = 1 n ( y i y ^ i ) 2 + k · ln ( n )
In Equation (16), C y t i 1 + 1 : t i represents the cost function of the i-th data segment; the penalty coefficient β controls the density of change points; k is the number of change points. In Equation (17), n is the total number of samples; yi and y ^ i represent the i-th observed and predicted values, respectively.
After testing 20 penalty terms on a logarithmic scale ranging from 1 to 100, the optimal penalty term was selected based on the Bayesian information criterion (BIC) [69], enabling the identification of the optimal change point. The rationale for selecting this range is as follows: (1) the lower bound was set to 1 to ensure the PELT algorithm’s pruning rule functioned effectively (β > 0); and (2) the upper bound was set to approximately ten times the theoretical BIC penalty term (10.665) for this dataset, thereby covering a broad spectrum of penalty levels from strict to lenient. In addition, we compared three information criteria: BIC, the Akaike information criterion (AIC), and the Hannan–Quinn criterion (HQC). All three criteria yielded the same optimal penalty term (β = 6.952) and the same number of change points. Given BIC’s advantages in ensuring consistency in change point detection and applying a moderate penalty for model complexity [70], it was ultimately chosen as the selection criterion.
It is important to note that this study used two types of residuals. The first type was derived from the posterior predictions of the HBM and was used to evaluate the model’s goodness of fit. The second type, known as SVR residuals, was used to identify potential structural change points.

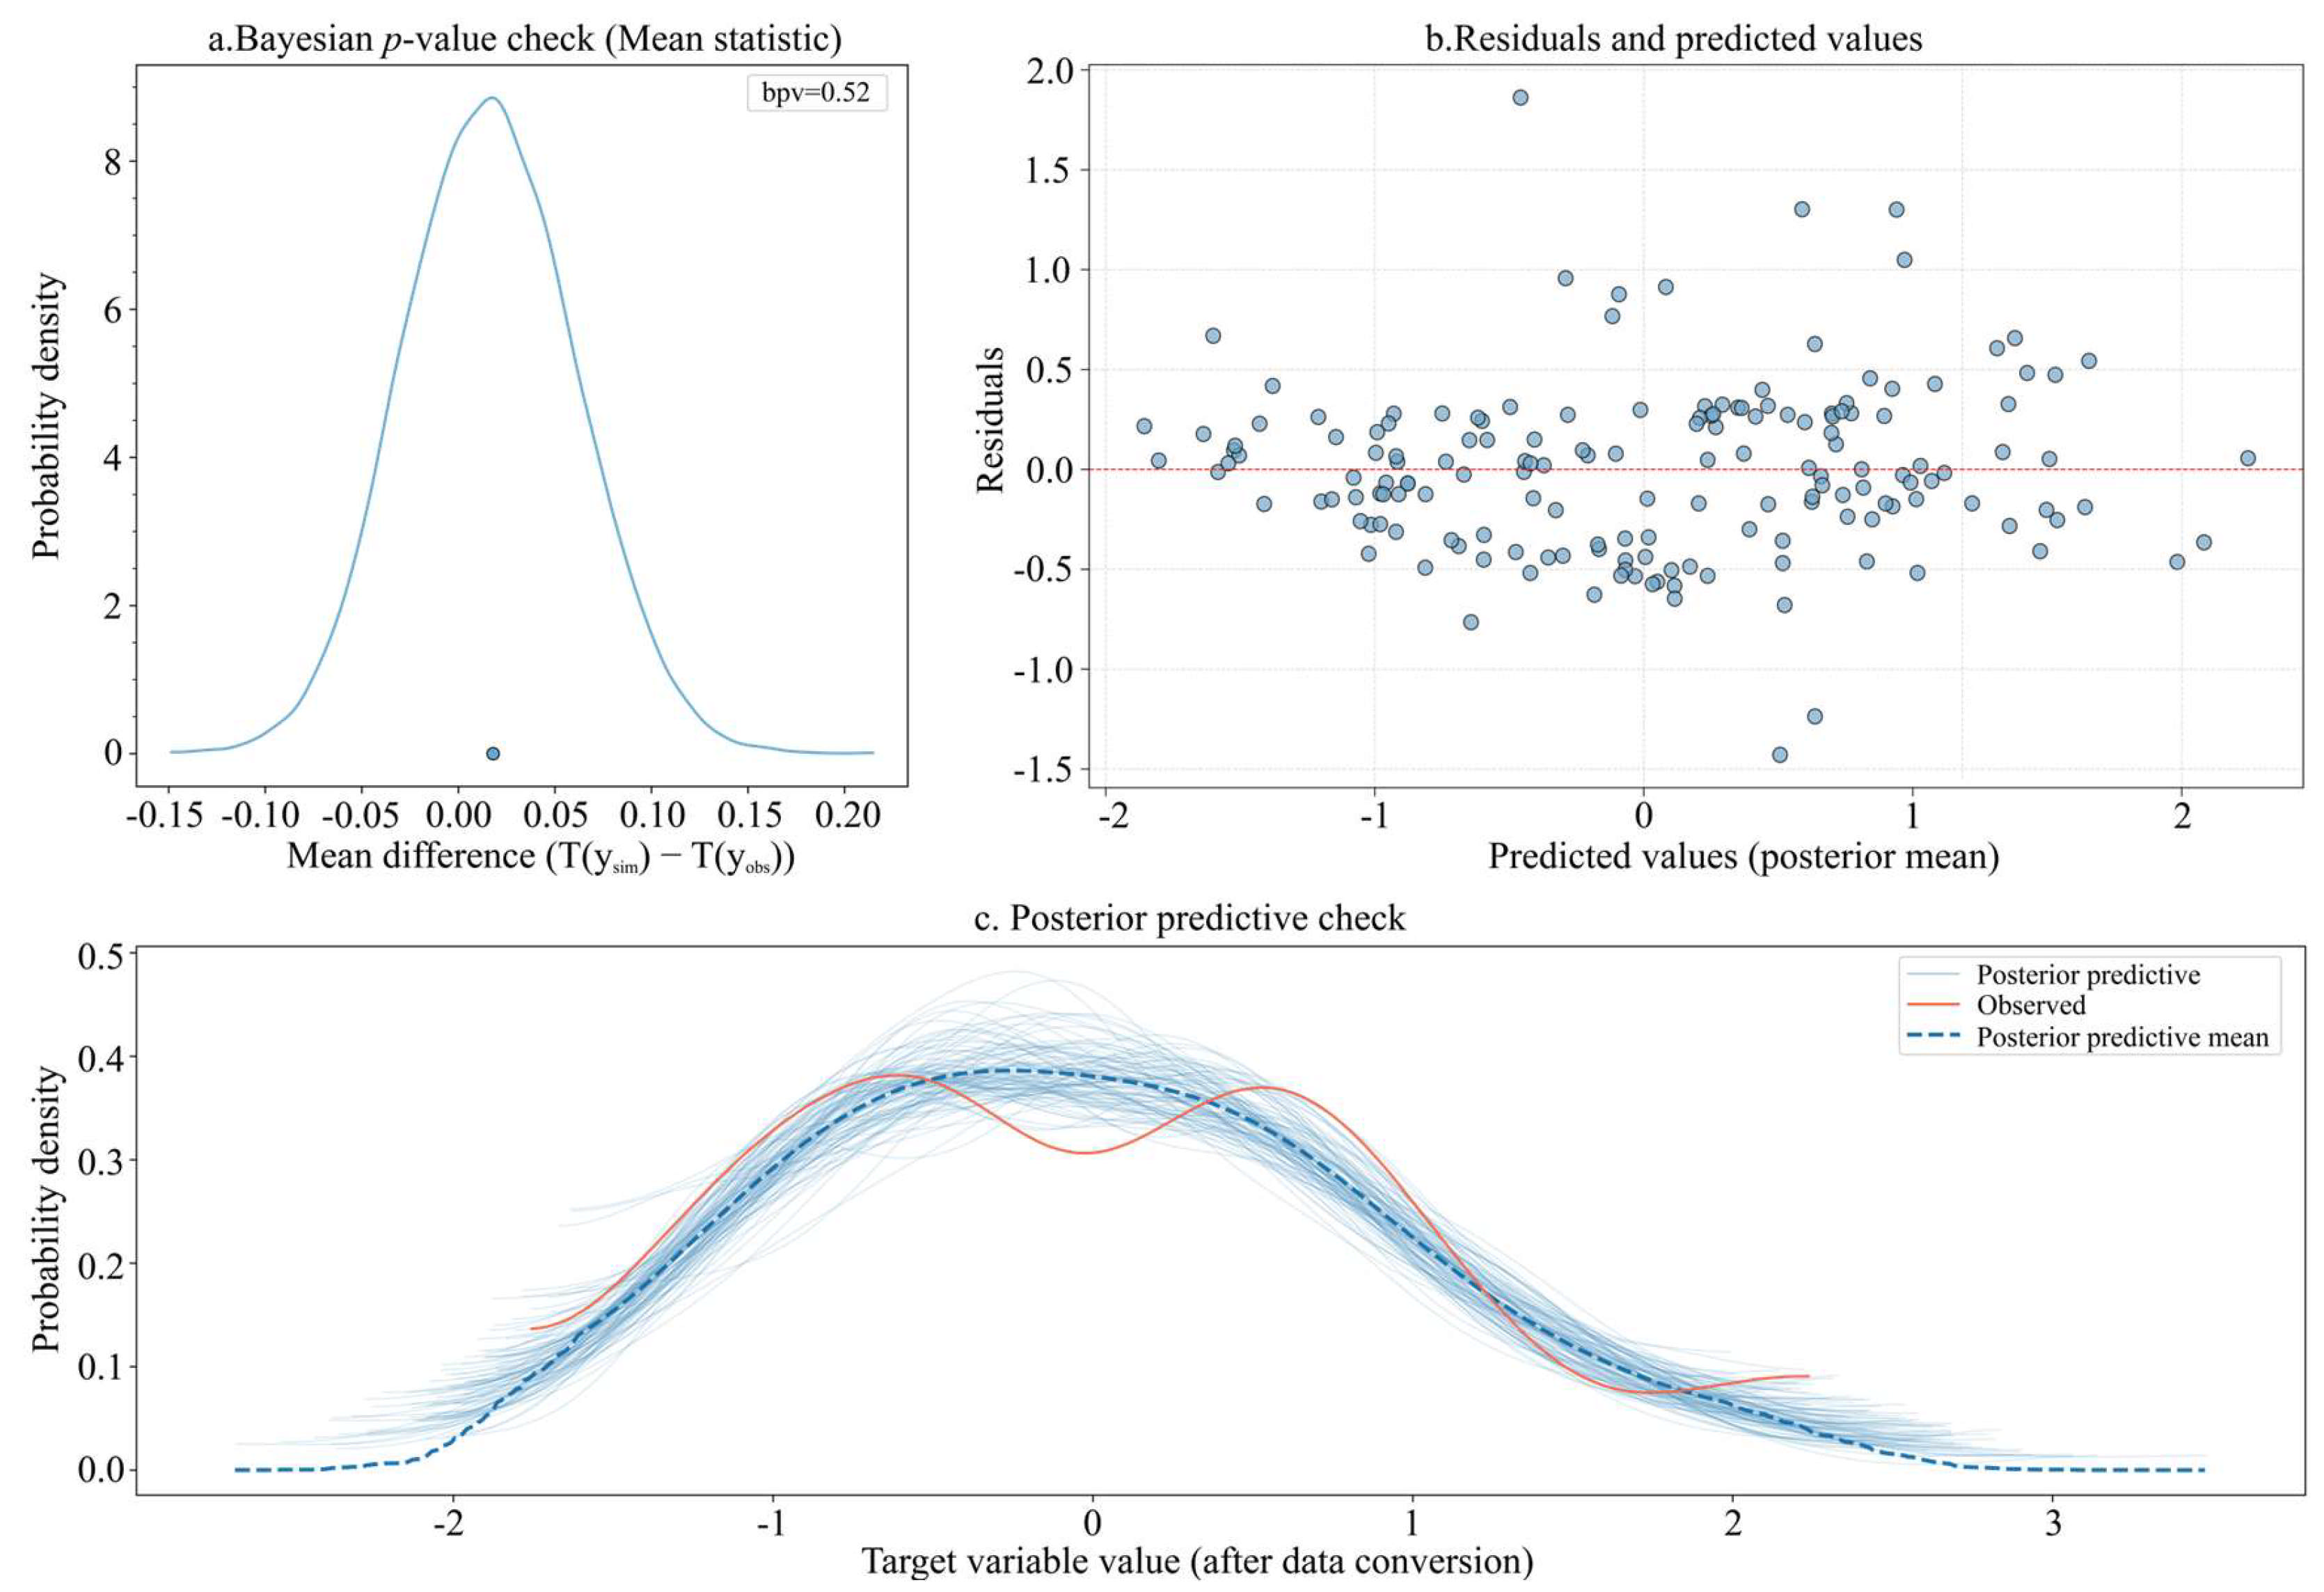
2.5. Model Evaluation

Three evaluation metrics were employed to assess model performance from the perspectives of goodness-of-fit, predictive accuracy, and statistical validity: the coefficient of determination (R2), the root mean square error (RMSE), and the Bayesian p-value (BPV). R2 measures the proportion of variance in the target variable explained by the model, with values closer to 1 indicating a better fit [71]. RMSE quantifies the deviation between predicted and observed values, with lower values indicating smaller prediction errors [72]. BPV, a diagnostic metric specific to Bayesian models, represents the cumulative probability that the model-generated data are less than or equal to the observed values. When the model exhibits no systematic bias, the BPV is expected to be close to 0.5 [73].
R 2 = 1 i = 1 N y i y i ^ 2 i = 1 N y i y ¯ 2
R M S E = 1 N i = 1 N y i ^ y i 2
B P V = P T s i m T o b s d a t a
Among them, yi and y ^ i represent the i-th observed and predicted values, respectively. Tsim and Tobs represent the test statistics calculated from the simulated and observed data, respectively.

3. Results

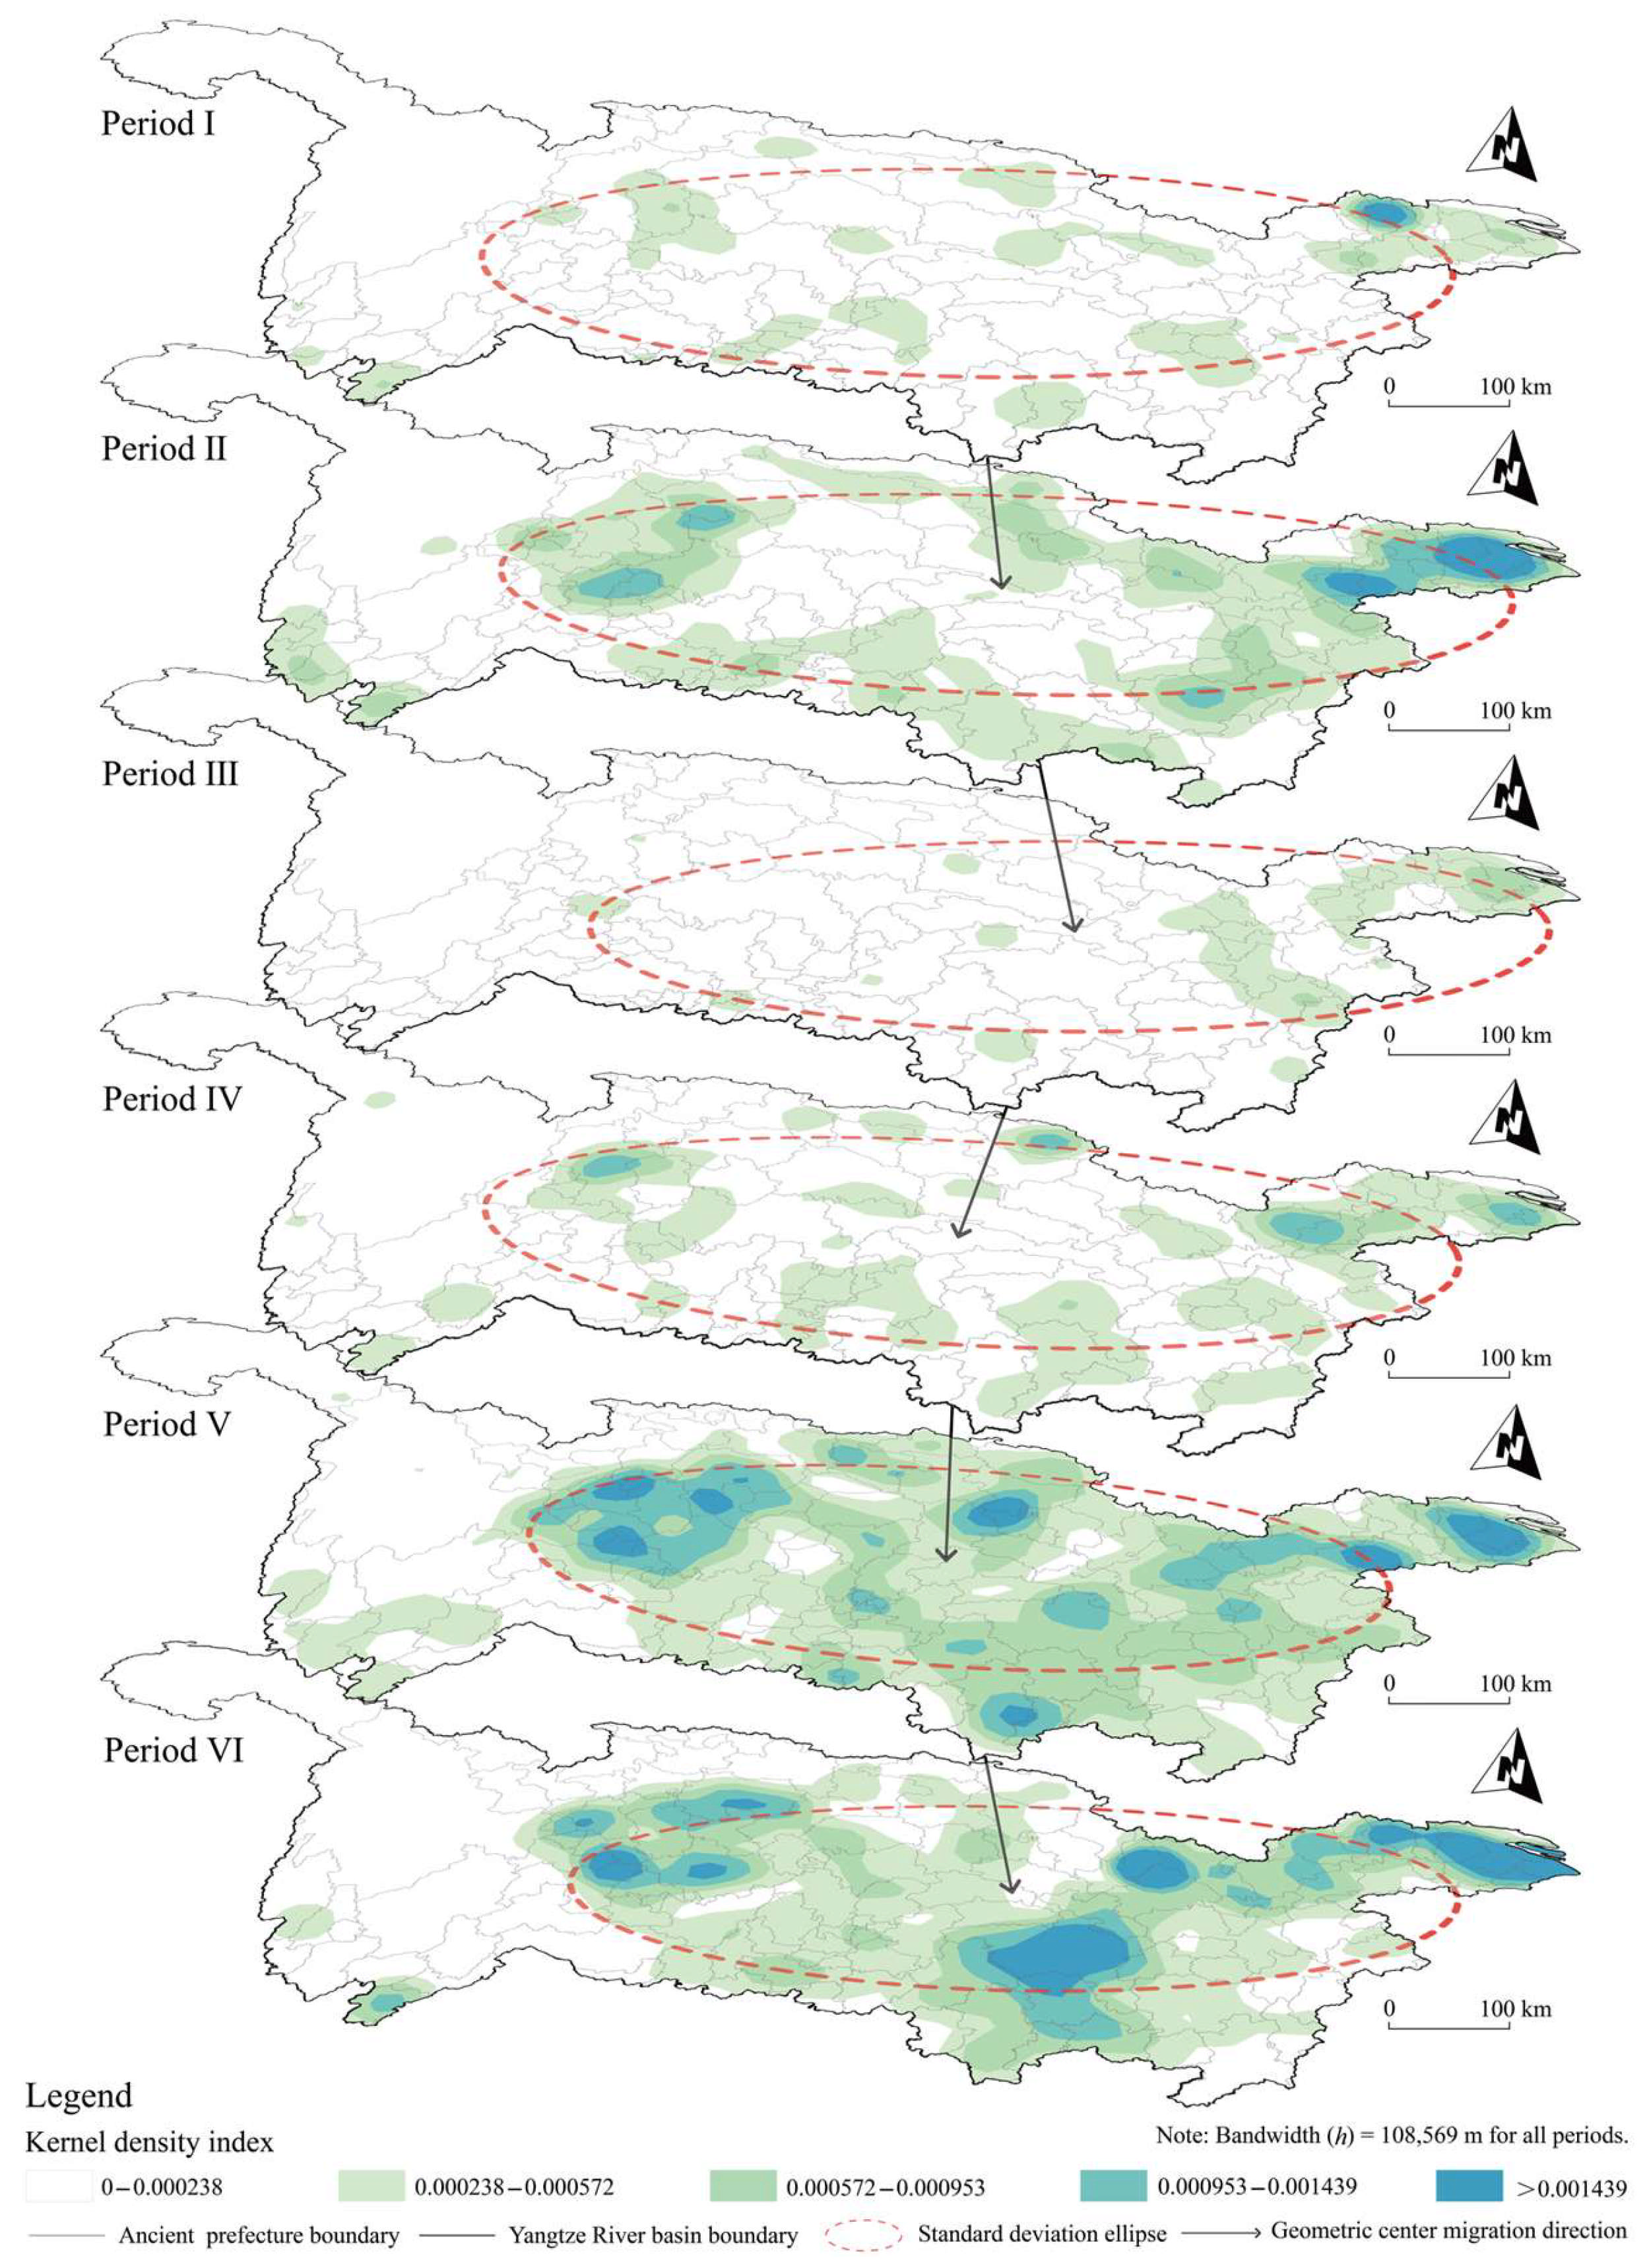
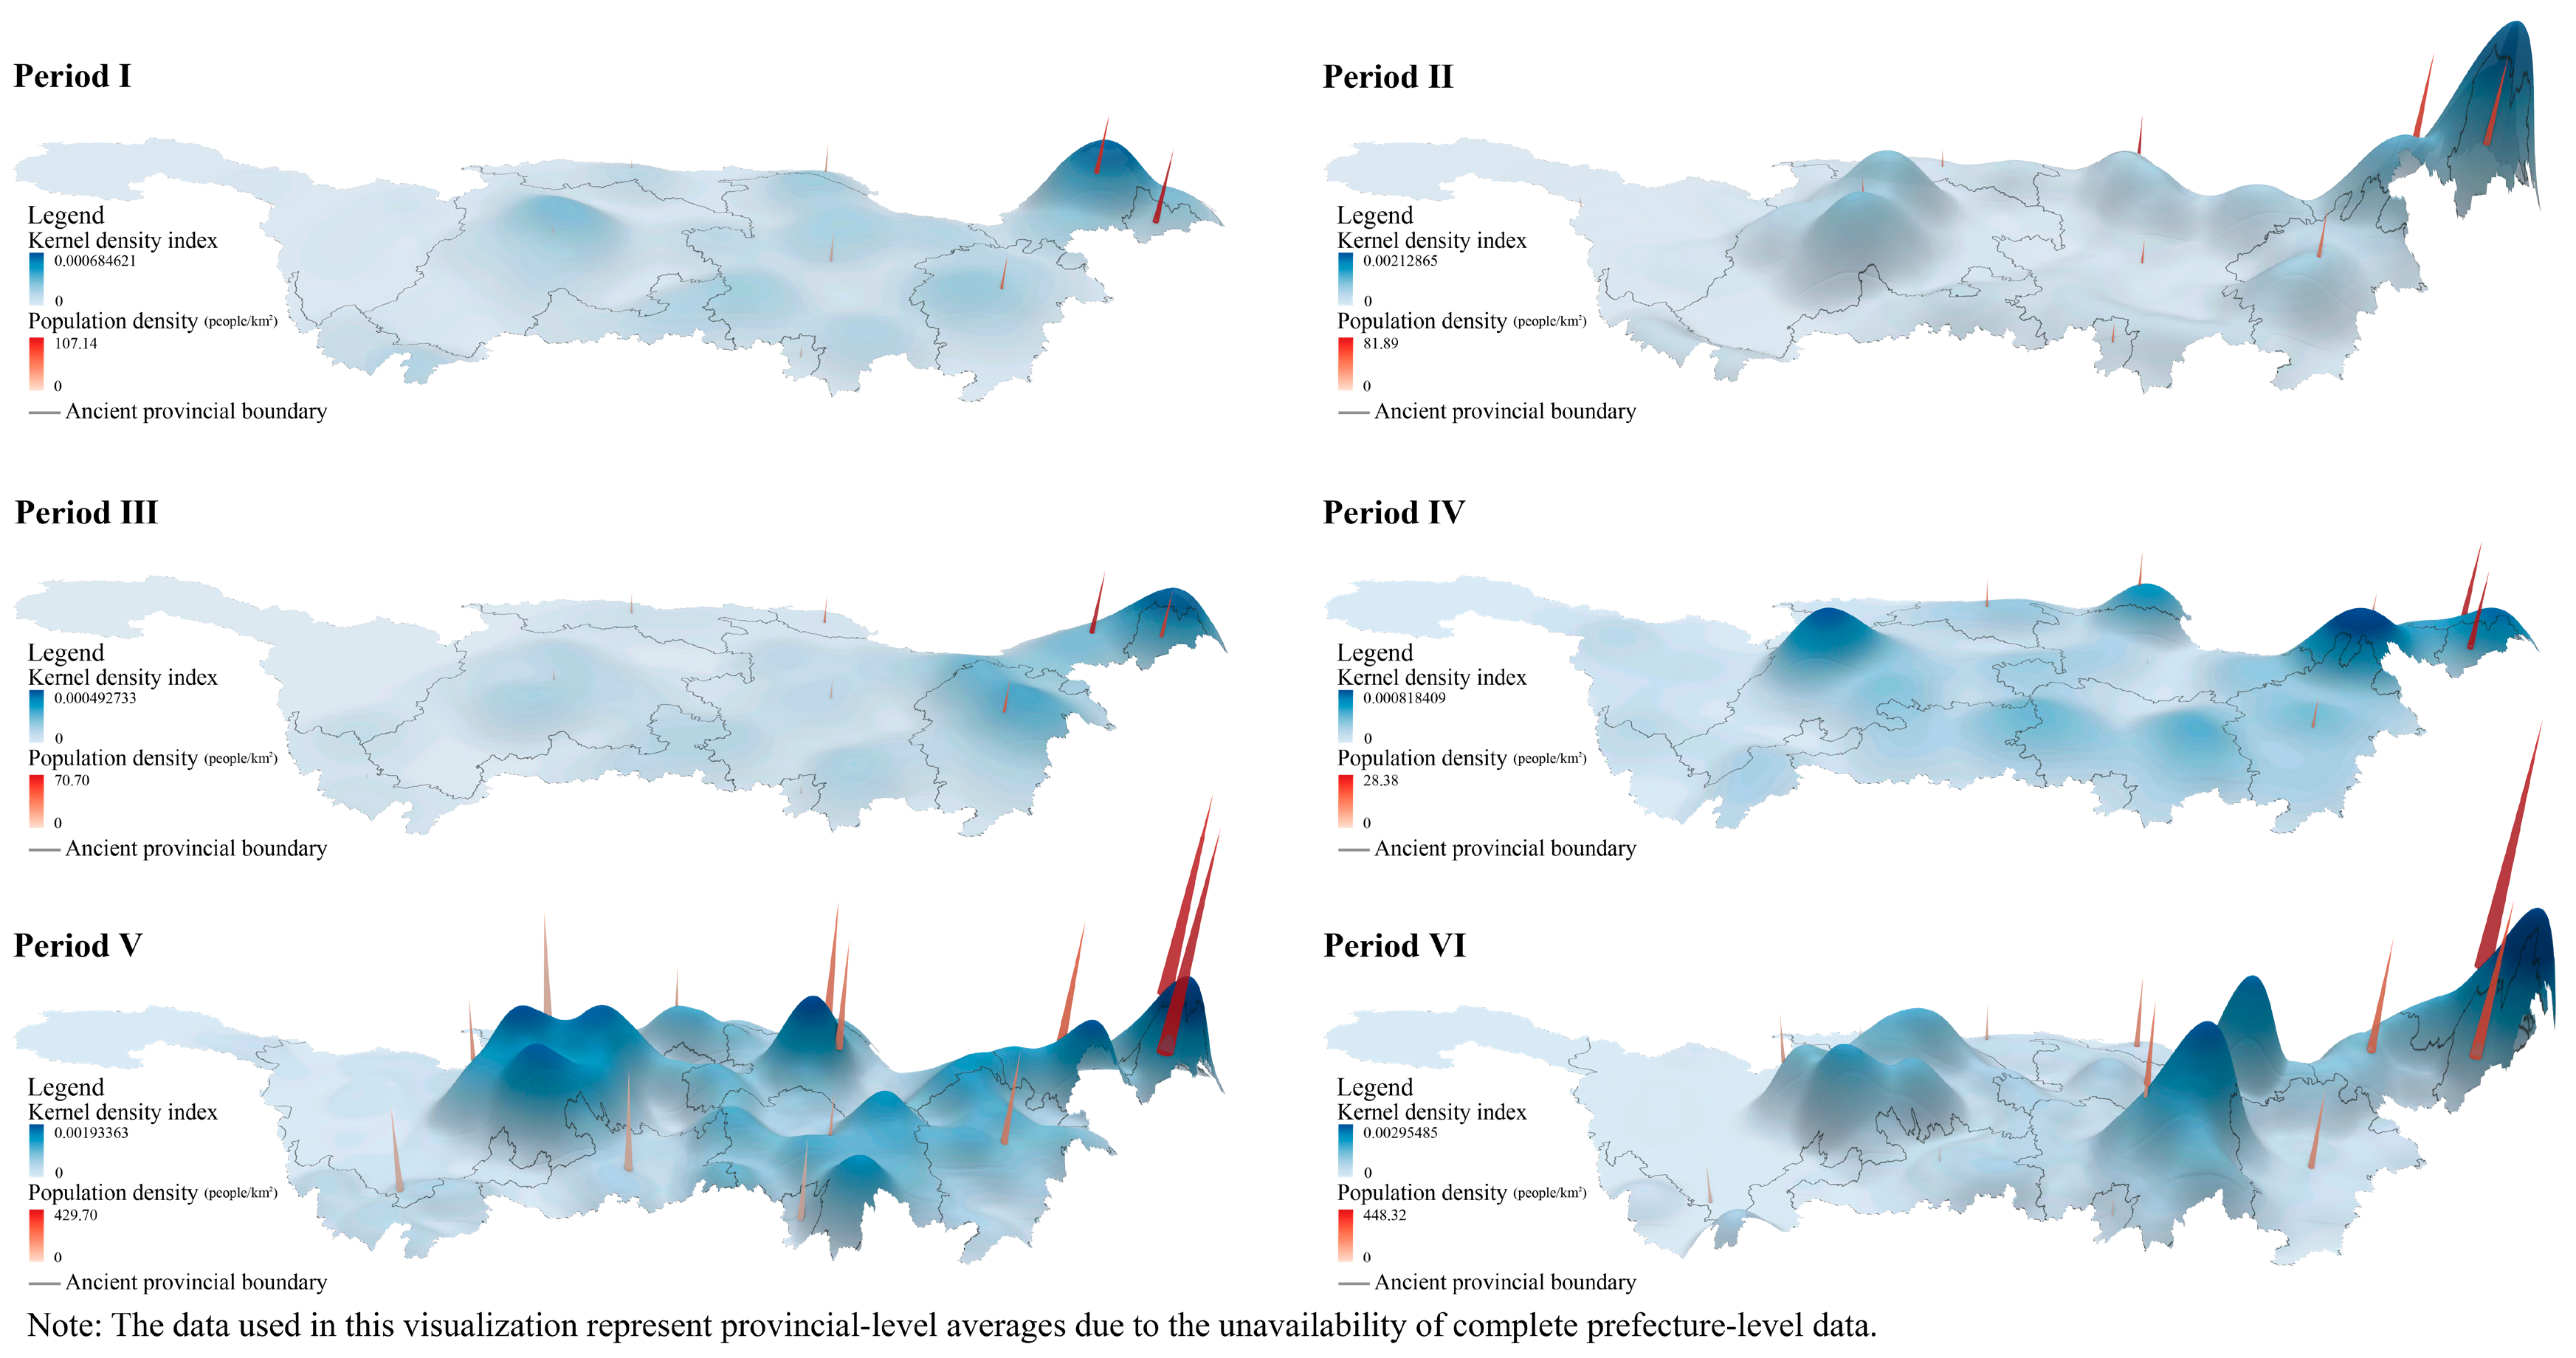
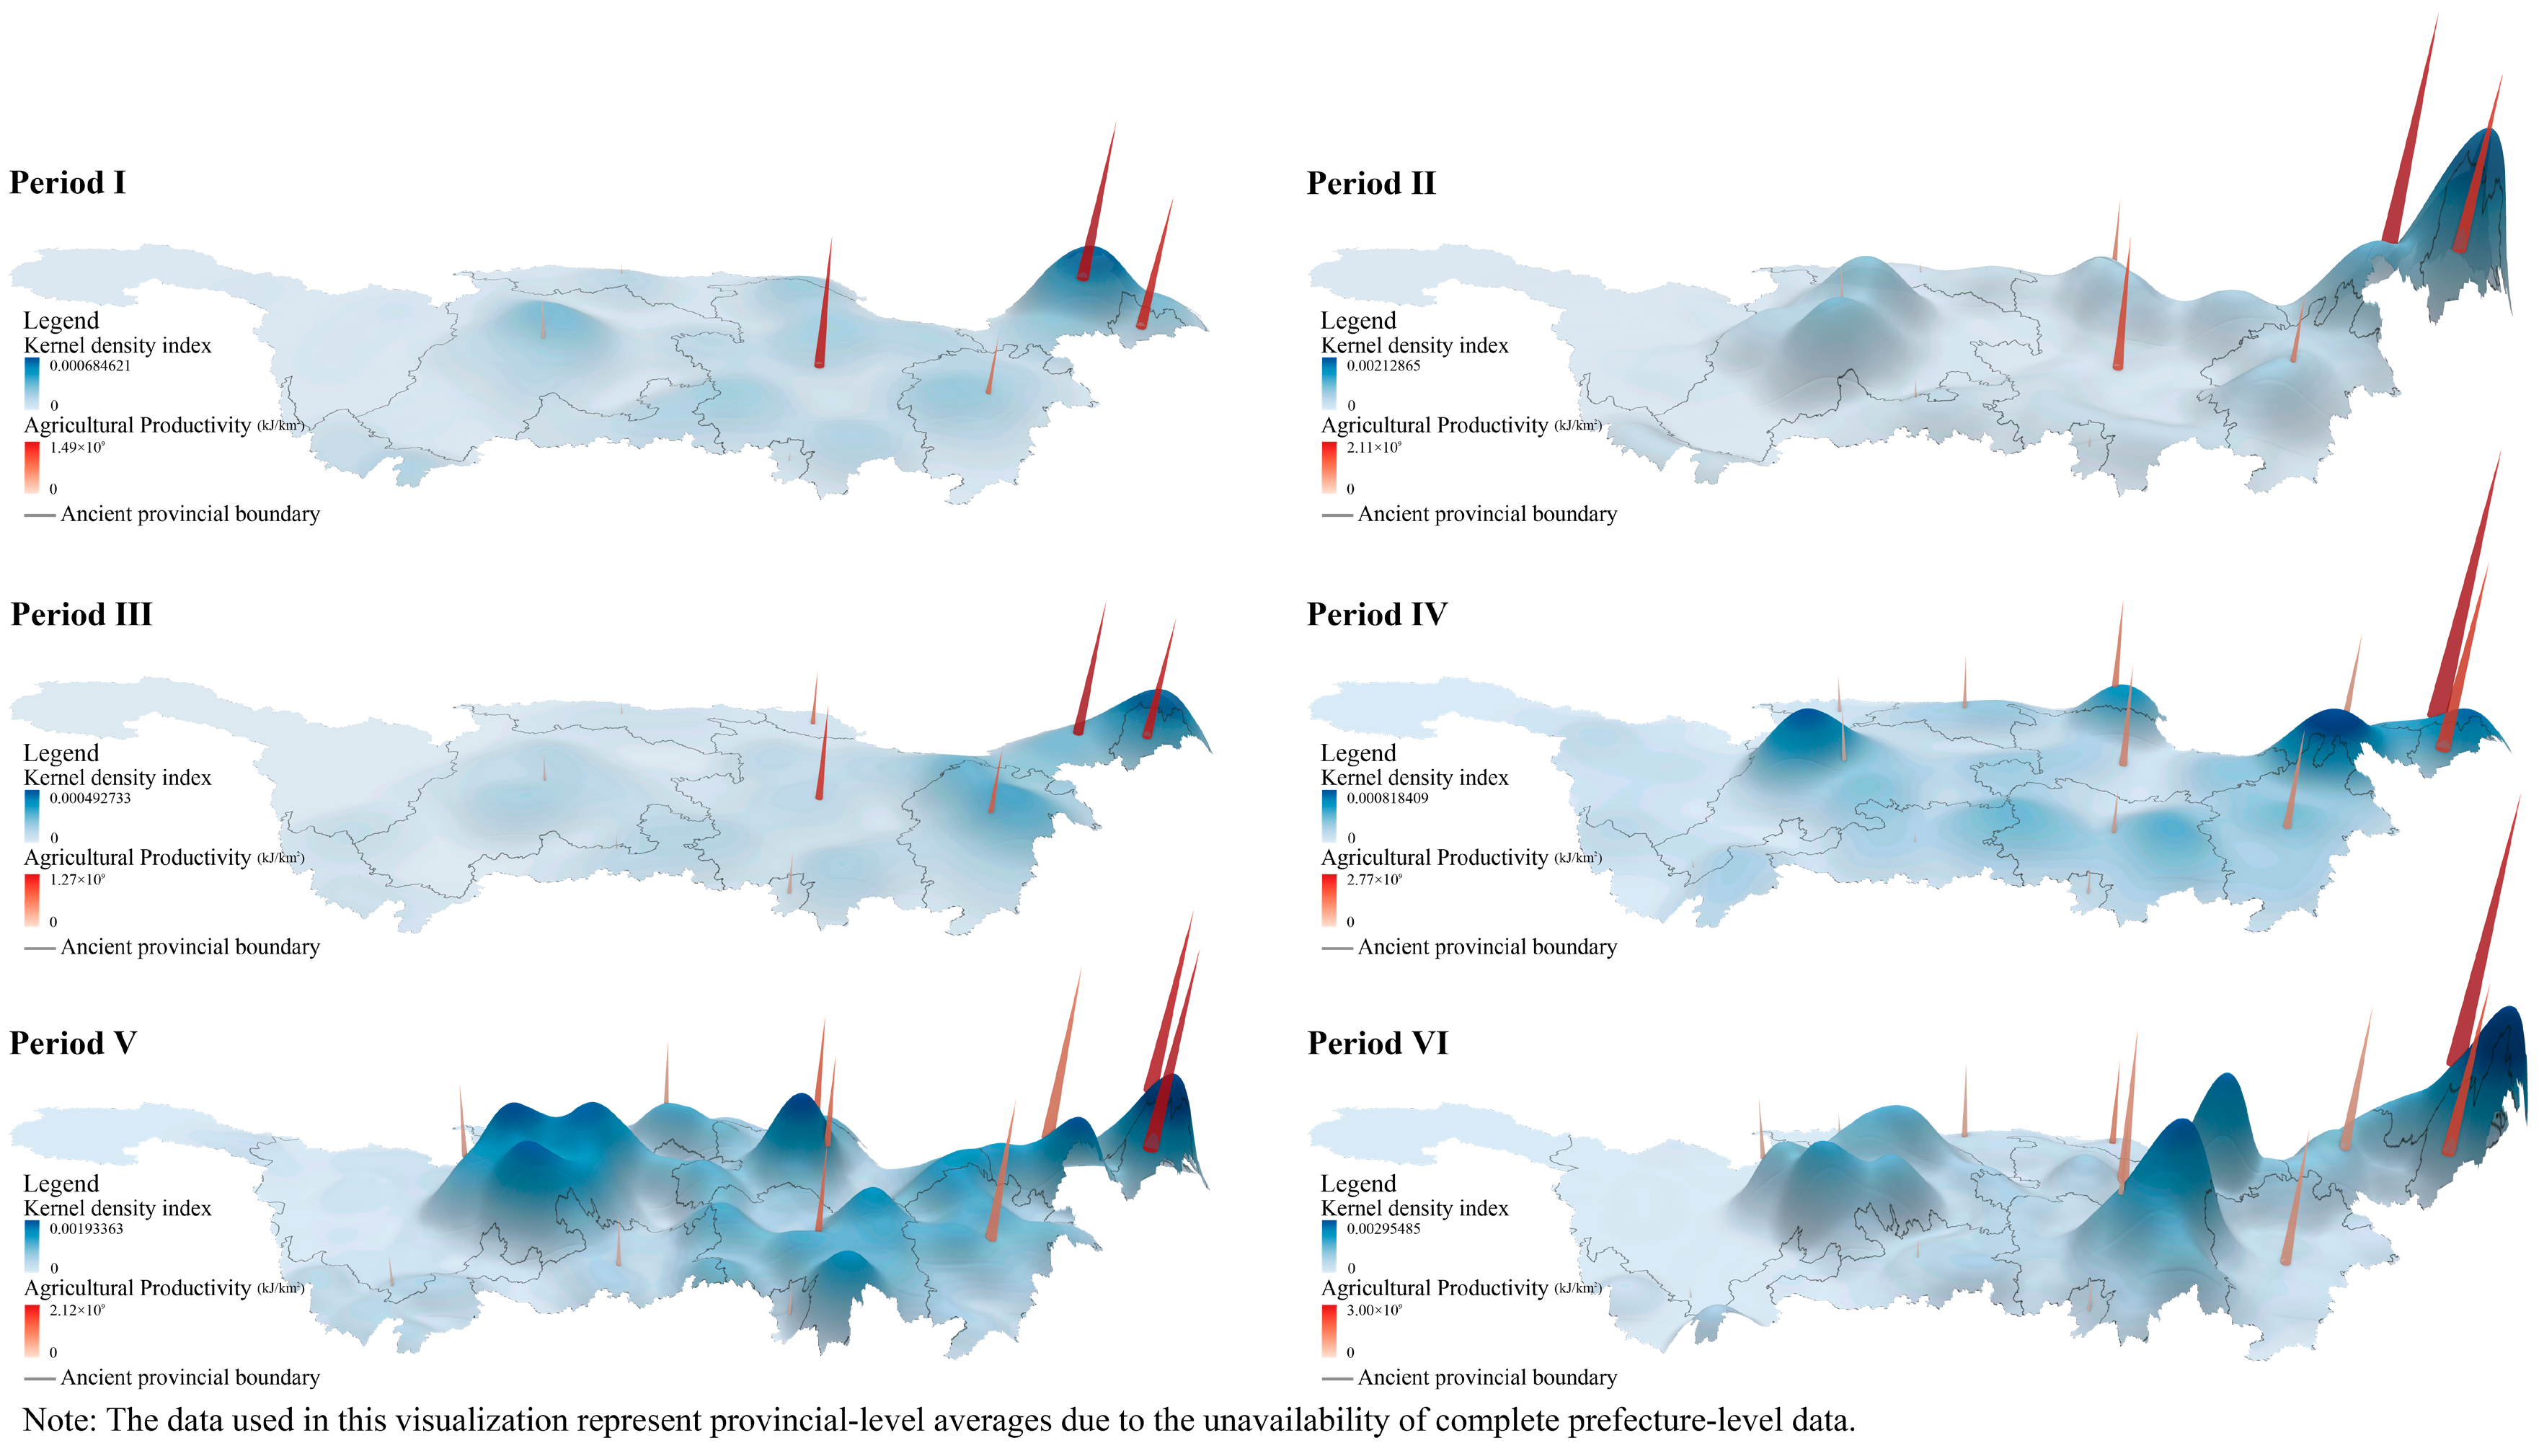
3.1. Spatiotemporal Distribution Characteristics of Cultural Heritage

The spatiotemporal distribution patterns of cultural heritage within the basin are illustrated in Figure 3. During Period I, the core concentration area was located in the downstream plains, with peak kernel density reaching 1.99 × 10⁻³. Secondary clusters were primarily distributed along the Sichuan Basin, while the core zone in the central and southeastern regions exhibited a ring-like diffusion pattern. In Period II, the high-density area inherited from Period I expanded significantly. A continuous high-density patch spanning over 400 km emerged across the downstream plains and the south-eastern region, with peak kernel density increasing to 3.74 × 10⁻³. In Period III, the overall degree of heritage concentration declined. The high-density patch in the downstream plains shrank compared to Period II, with the peak kernel density falling to 8.87 × 10⁻⁴. In Period IV, the kernel density peak increased to 1.43 × 10⁻³, while a low-density area appeared in the central region. Scattered clusters emerged in the northern, southern, and Sichuan Basin areas, indicating the initial formation of a multi-centered pattern. Period V exhibited a multi-centered and networked spatial pattern. The overall concentration of heritage sites increased, reaching a kernel density peak of 2.44 × 10⁻³. In Period VI, the peak kernel density reached 4.07 × 10⁻³. The three high-density centers, located in the Sichuan Basin and the mid- and downstream regions, were distributed as mutually isolated spatial clusters.
From a temporal perspective, the density of cultural heritage sites increased initially and then decreased during the Ming Dynasty, whereas it continued to increase throughout the Qing Dynasty. High-density areas exhibited a pattern of spatial expansion followed by contraction from the early to late periods. The trend of density polarization was more pronounced in the middle period than in the early period. In both dynasties, the spatial centroid of cultural heritage shifted eastwards. However, during the transition from Period III to Period IV, the spatial centroid shifted significantly westwards. Cultural heritage sites were primarily located in the downstream, midstream and Sichuan Basin regions. The downstream area consistently exhibited high values, while the Qinghai–Tibet Plateau consistently exhibited low values. During Periods II and VI, cultural heritage in the downstream region showed a clear diffusion trend towards the midstream and southeastern areas. Except for Period III, the Sichuan Basin was a single-pole core region for cultural heritage. The southwestern region exhibited a marginal area filling pattern, with sparse distribution in all periods.

3.2. HBM Performance Evaluation

Table 1 shows the values of the three evaluation metrics. The R2 values for the training and test sets were 0.81 and 0.72, respectively, indicating that the HBM explained 81% and 72% of the variance in the training and test data, respectively. The RMSE values were 0.44 for the training set and 0.51 for the test set. Although slightly higher in the test set, both values remained relatively low. The differences in R2 (Δ = 0.09) and RMSE (Δ = 0.07) remained within an acceptable range. Additionally, the BPV of 0.52 indicates a well-specified model structure. These results suggest that the HBM successfully captured the underlying patterns in the data without significant overfitting. Overall, the HBM demonstrated strong explanatory power, high predictive accuracy, and good generalization capability.
The HBM integrated the available data and updated the model parameters to assess the model’s goodness of fit by comparing the predicted and observed values. The results are shown in Figure 4.
Figure 4a shows that the BPV approached the ideal value of 0.5. This indicates a high level of consistency between the data generated by the model and the latent patterns in the observed data. The curve was generally symmetrical without significant skewness or heavy tails, demonstrating that the residual distribution was approximately normal. These results show that the HBM successfully reproduced the statistical characteristics of the observed data and reflected the key patterns of the data-generating mechanism. Figure 4b shows that the residuals were predominantly concentrated within the range [−1.5, 1.5], with a few outliers deviating from the central distribution. Residual fluctuations remained relatively stable, with no systematic trend of increase or decrease, suggesting weak heteroscedasticity. The scatter points were evenly distributed around the red zero line, implying no substantial systematic bias in the HBM predictions. Figure 4c shows 100 randomly selected posterior predictive samples (solid blue lines) and their mean kernel density estimate (dashed blue line). These substantially overlapped with the observed data across most distribution regions, demonstrating well-aligned overall trends. The predictions showed slight overestimation near zero, which can be attributed to the weak inherent bimodality of the observed data.
In summary, the HBM developed for AAHD and four feature variables demonstrated favorable goodness of fit and generalization capability. Consequently, the key parameters proved reliable, providing a robust empirical basis for analyzing the driving mechanisms and spatial differentiation of cultural features.

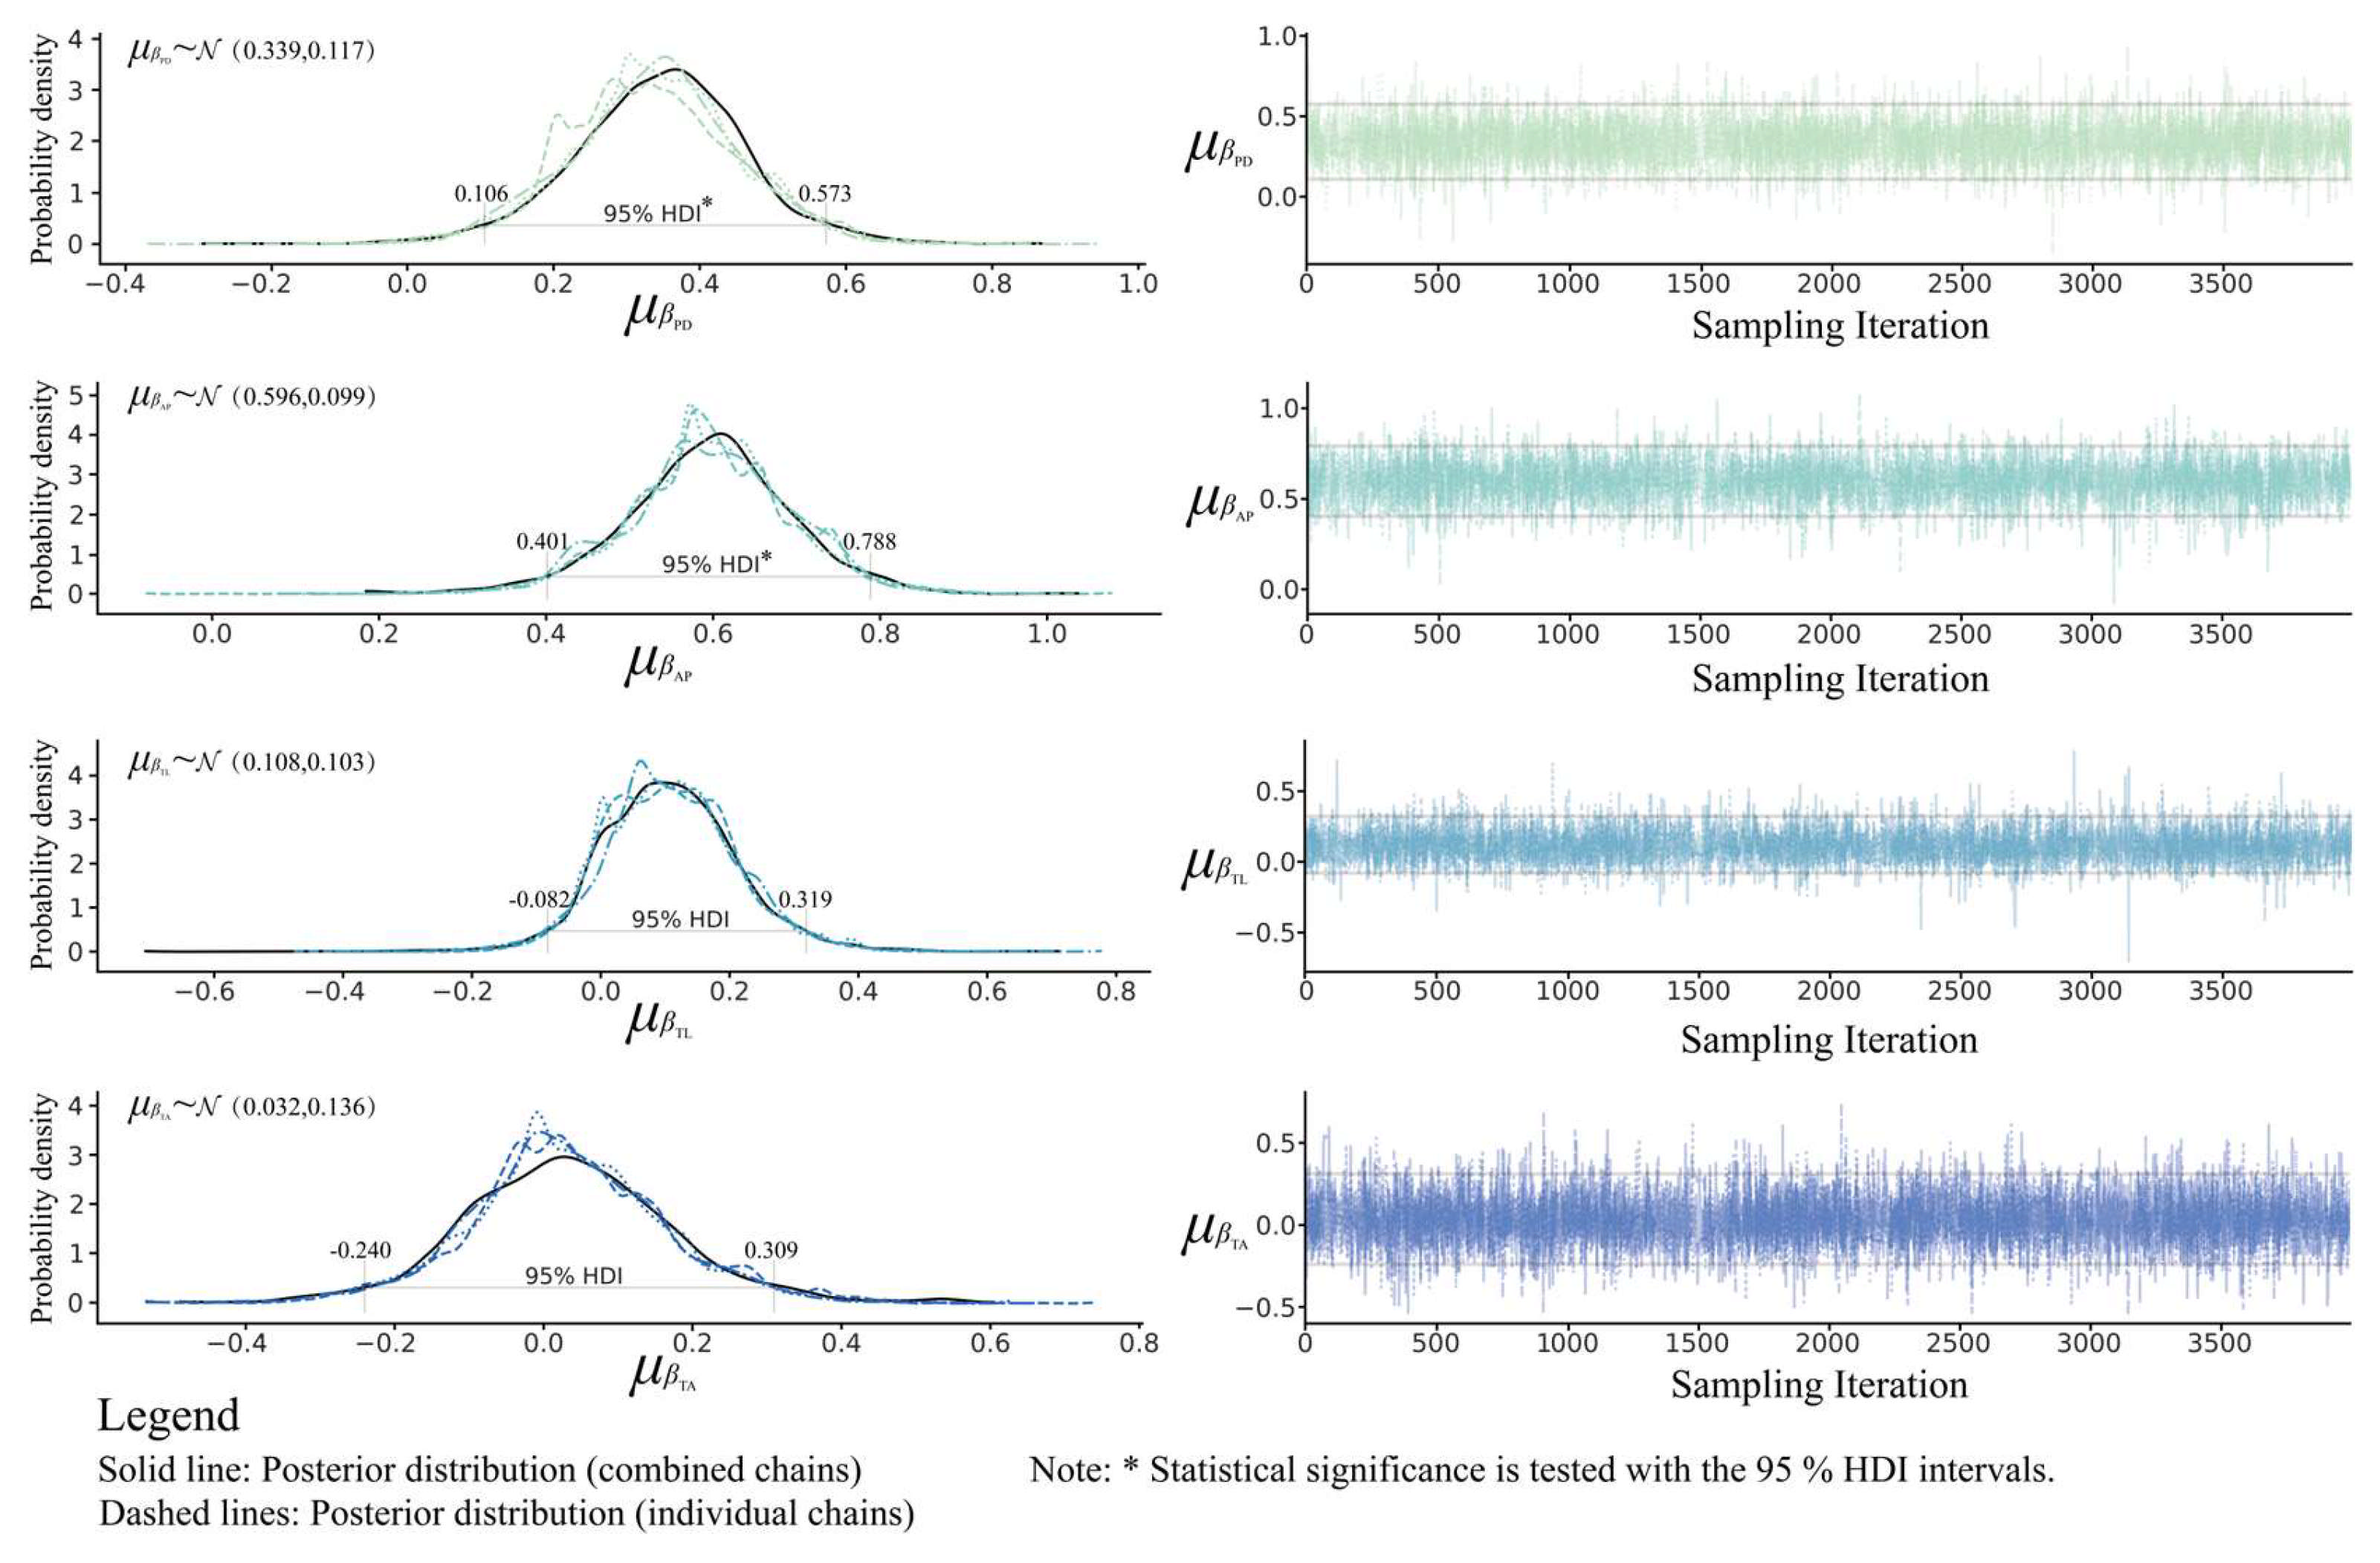
3.3. Posterior Distribution and Sampling Analysis of Regression Coefficients at the Overall Level

The regression coefficients at the overall level reflect the global average effects shared across the six historical periods. Figure 5 shows their posterior distributions and sampling trajectories. In the left panel, the solid lines represent the combined results from all MCMC chains, while the dashed lines show the sampling distributions of the individual chains and are used to assess inter-chain consistency. The left panel shows that the sample distributions of the regression coefficients are relatively concentrated, with no signs of extreme uncertainty. The high degree of overlap among the chains indicates that the estimation results are stable. The right panel shows that the sampling trajectories of all parameters are steady, with no apparent trend drifts, indicating that the sampling process has adequately converged and the parameter estimates are reliable.
In Bayesian modeling, a regression coefficient is considered statistically significant if its 95% highest density interval (HDI) does not include zero. The posterior mean values of βPD, βAP, βTL, and βTA were 0.339, 0.596, 0.108, and 0.032, respectively, with standard deviations of 0.117, 0.099, 0.103, and 0.136, respectively. Their 95% HDIs were (0.106, 0.573), (0.401, 0.788), (−0.082, 0.319), and (−0.240, 0.309), respectively. The standard deviations of all regression coefficients were close to 0.1, indicating low variability in the effect strengths of the feature variables. Both PD and AP had a statistically significant positive effect on AAHD, with AP having a larger effect size. This confirms that regions with higher population density and agricultural productivity tended to have greater heritage density. Insufficient evidence was found to support the statistically significant effects of TL or TA on AAHD at the overall level, suggesting that their direct influence was relatively limited. Instead, they may predominantly affect AAHD through indirect pathways. Based on these findings, further investigation of the 95% HDI at the group level [74] is warranted to determine the context-specific effects of the feature variables across historical periods.

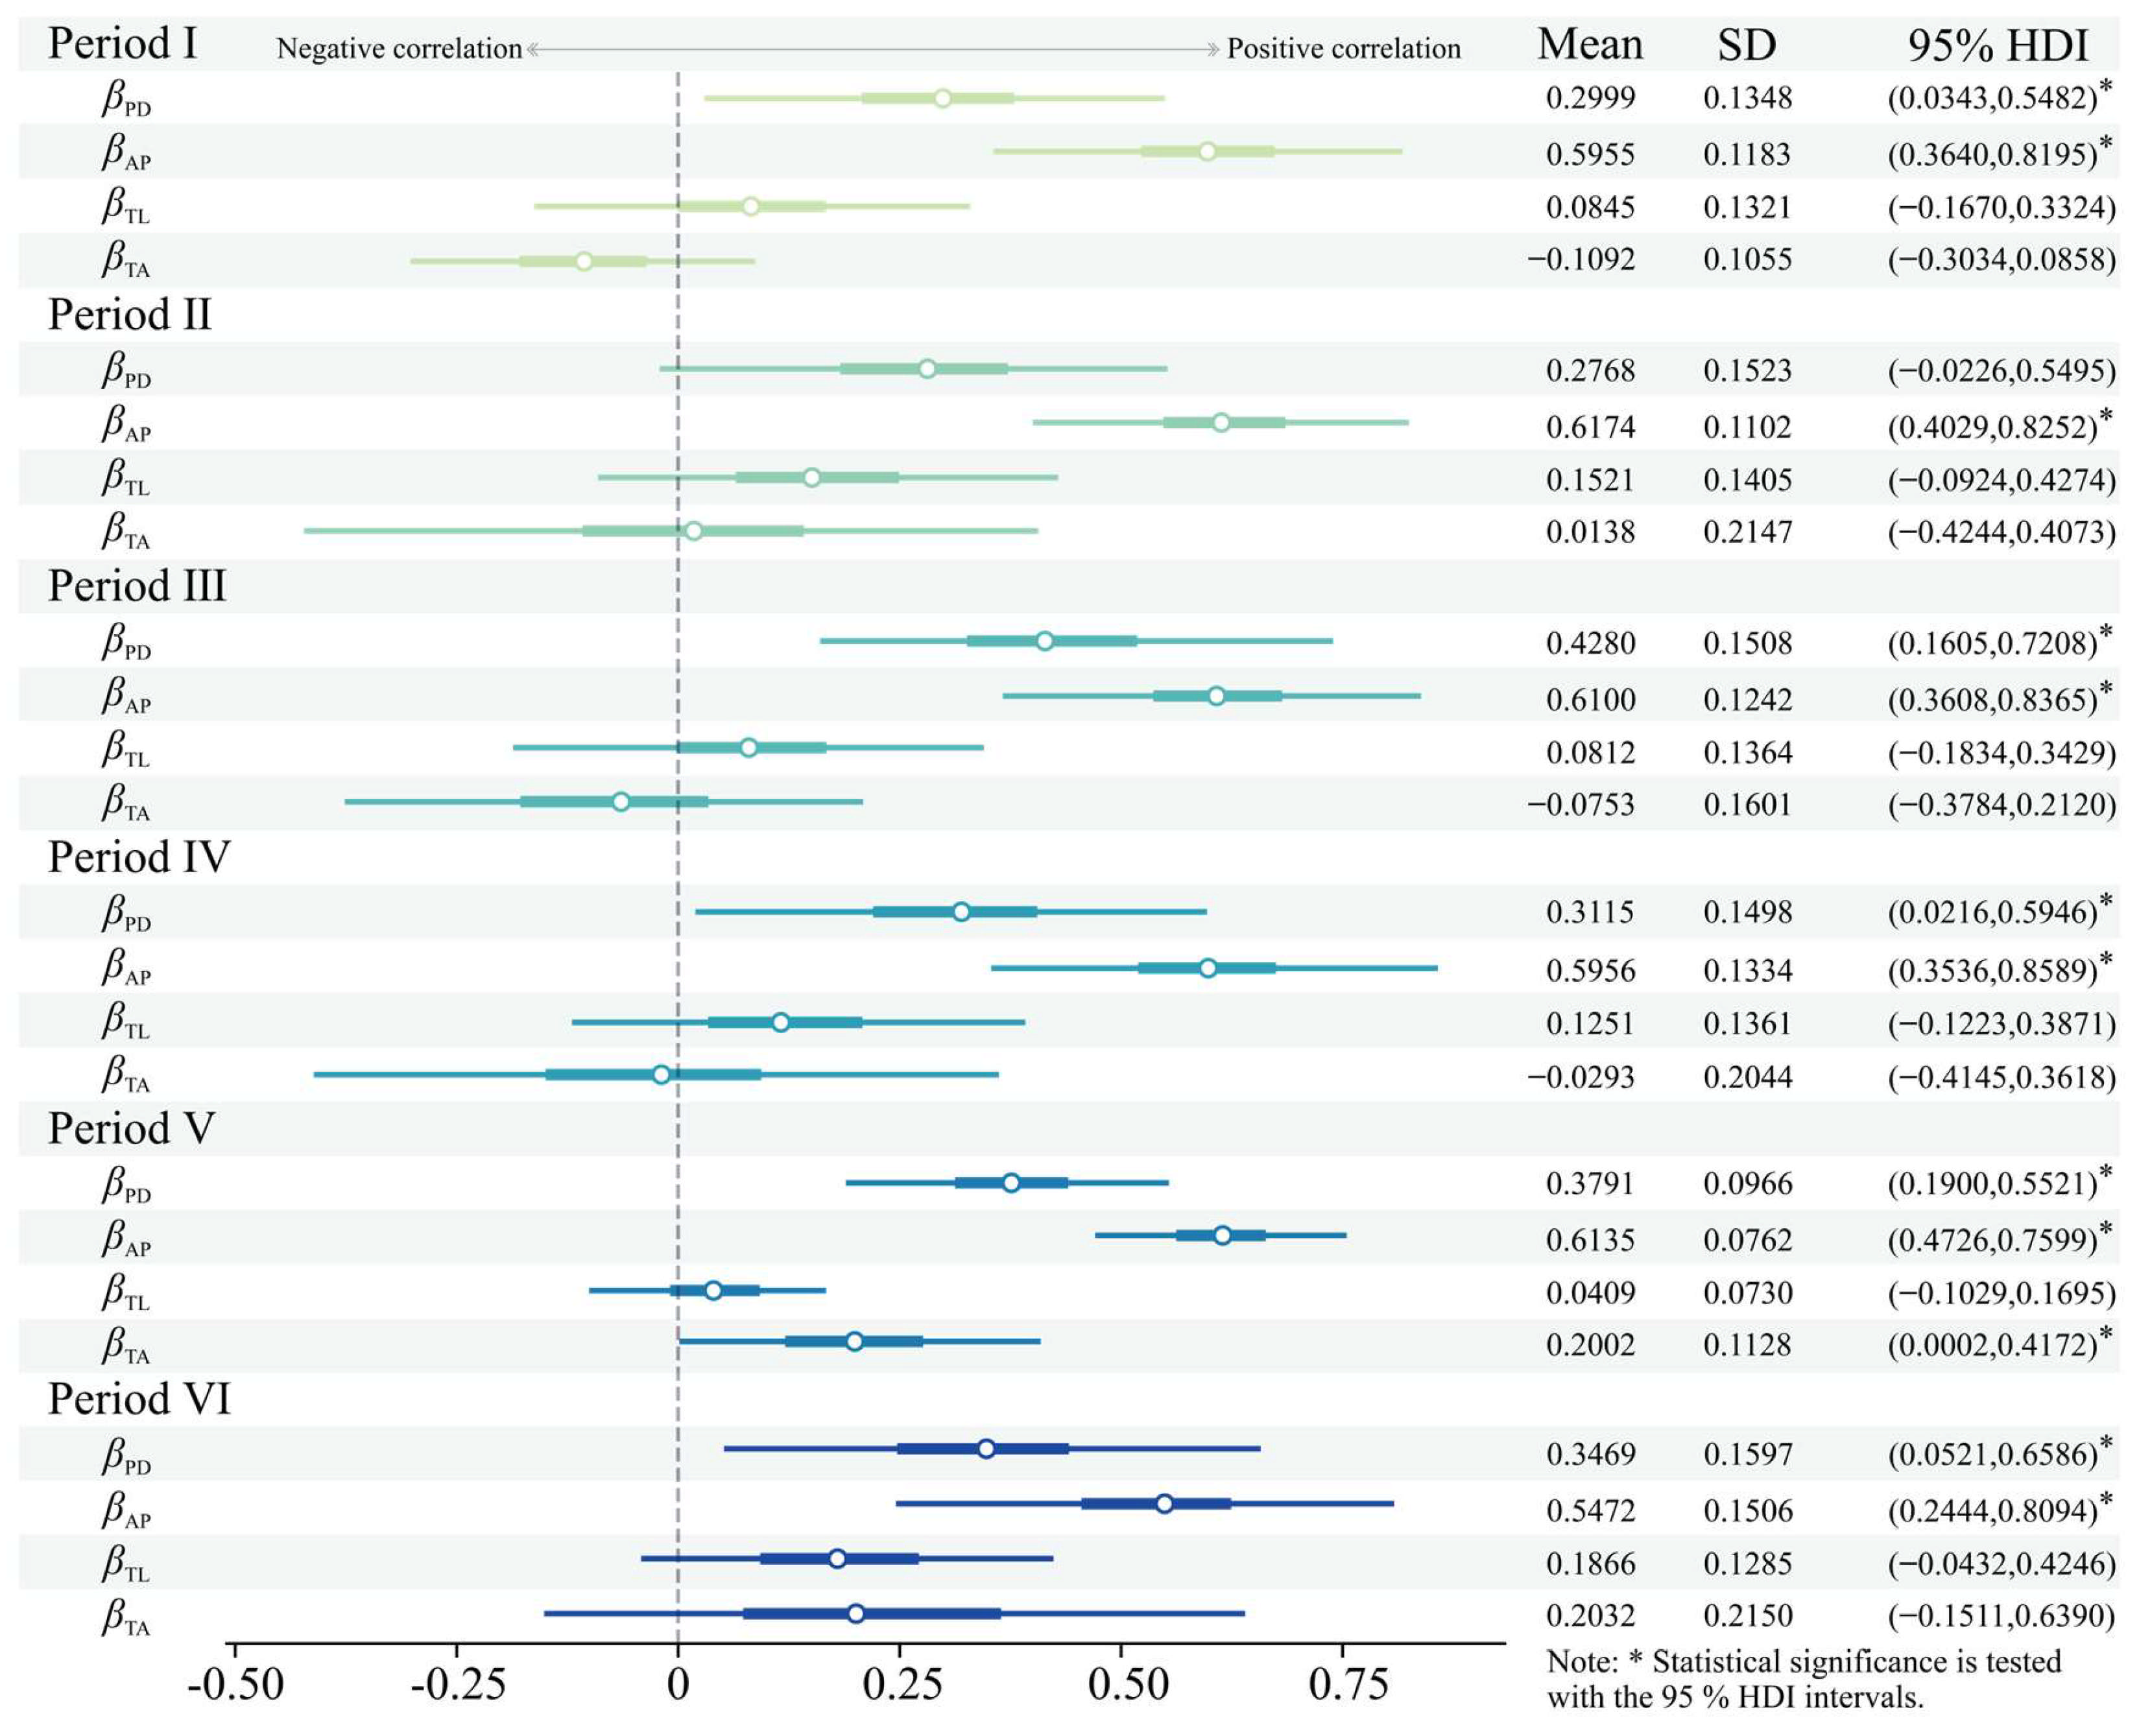
3.4. Posterior Distribution of Regression Coefficients at the Group Level

Figure 6 shows the posterior distribution of the regression coefficients at the group level, revealing varying effect magnitudes and uncertainties for each variable across different periods. PD exerted significantly positive effects during the five historical periods (excluding Period II). The corresponding mean βPD values for these periods were 0.2999, 0.4280, 0.3115, 0.3791, and 0.3469, respectively. These results demonstrate that, although PD’s influence varied over time, it remained robust overall. AP showed statistically significant effects in all periods with the largest mean coefficients, indicating its predominant influence on AAHD. The mean values of βAP in each period were 0.5955, 0.6174, 0.6100, 0.5956, 0.6135, and 0.5472, respectively, with maximum values achieved midway through each dynasty. βAP consistently displayed lower standard deviations than βPD, reflecting greater temporal stability in AP’s effects. TL demonstrated non-significant effects throughout all six periods, highlighting persistent uncertainty in its impact. TA exerted a significantly positive influence exclusively during Period V, suggesting that climatic factors only had a discernible influence on cultural development during specific historical phases.
Overall, the significance and strength of the effect of different factors exhibited both consistency and variation. AP maintained a dominant role in shaping the spatiotemporal characteristics of cultural heritage, whereas PD’s effect fluctuated slightly over time. High-density heritage areas largely coincided with regions of high PD and AP values. In contrast, TL did not exhibit a consistent pattern of influence, and its specific impact mechanism remains unclear. TA only played a promotional role in heritage formation during certain periods. These results extend the patterns of factor effects revealed at the overall level, providing additional evidence to help us understand the temporal characteristics of variable effects.

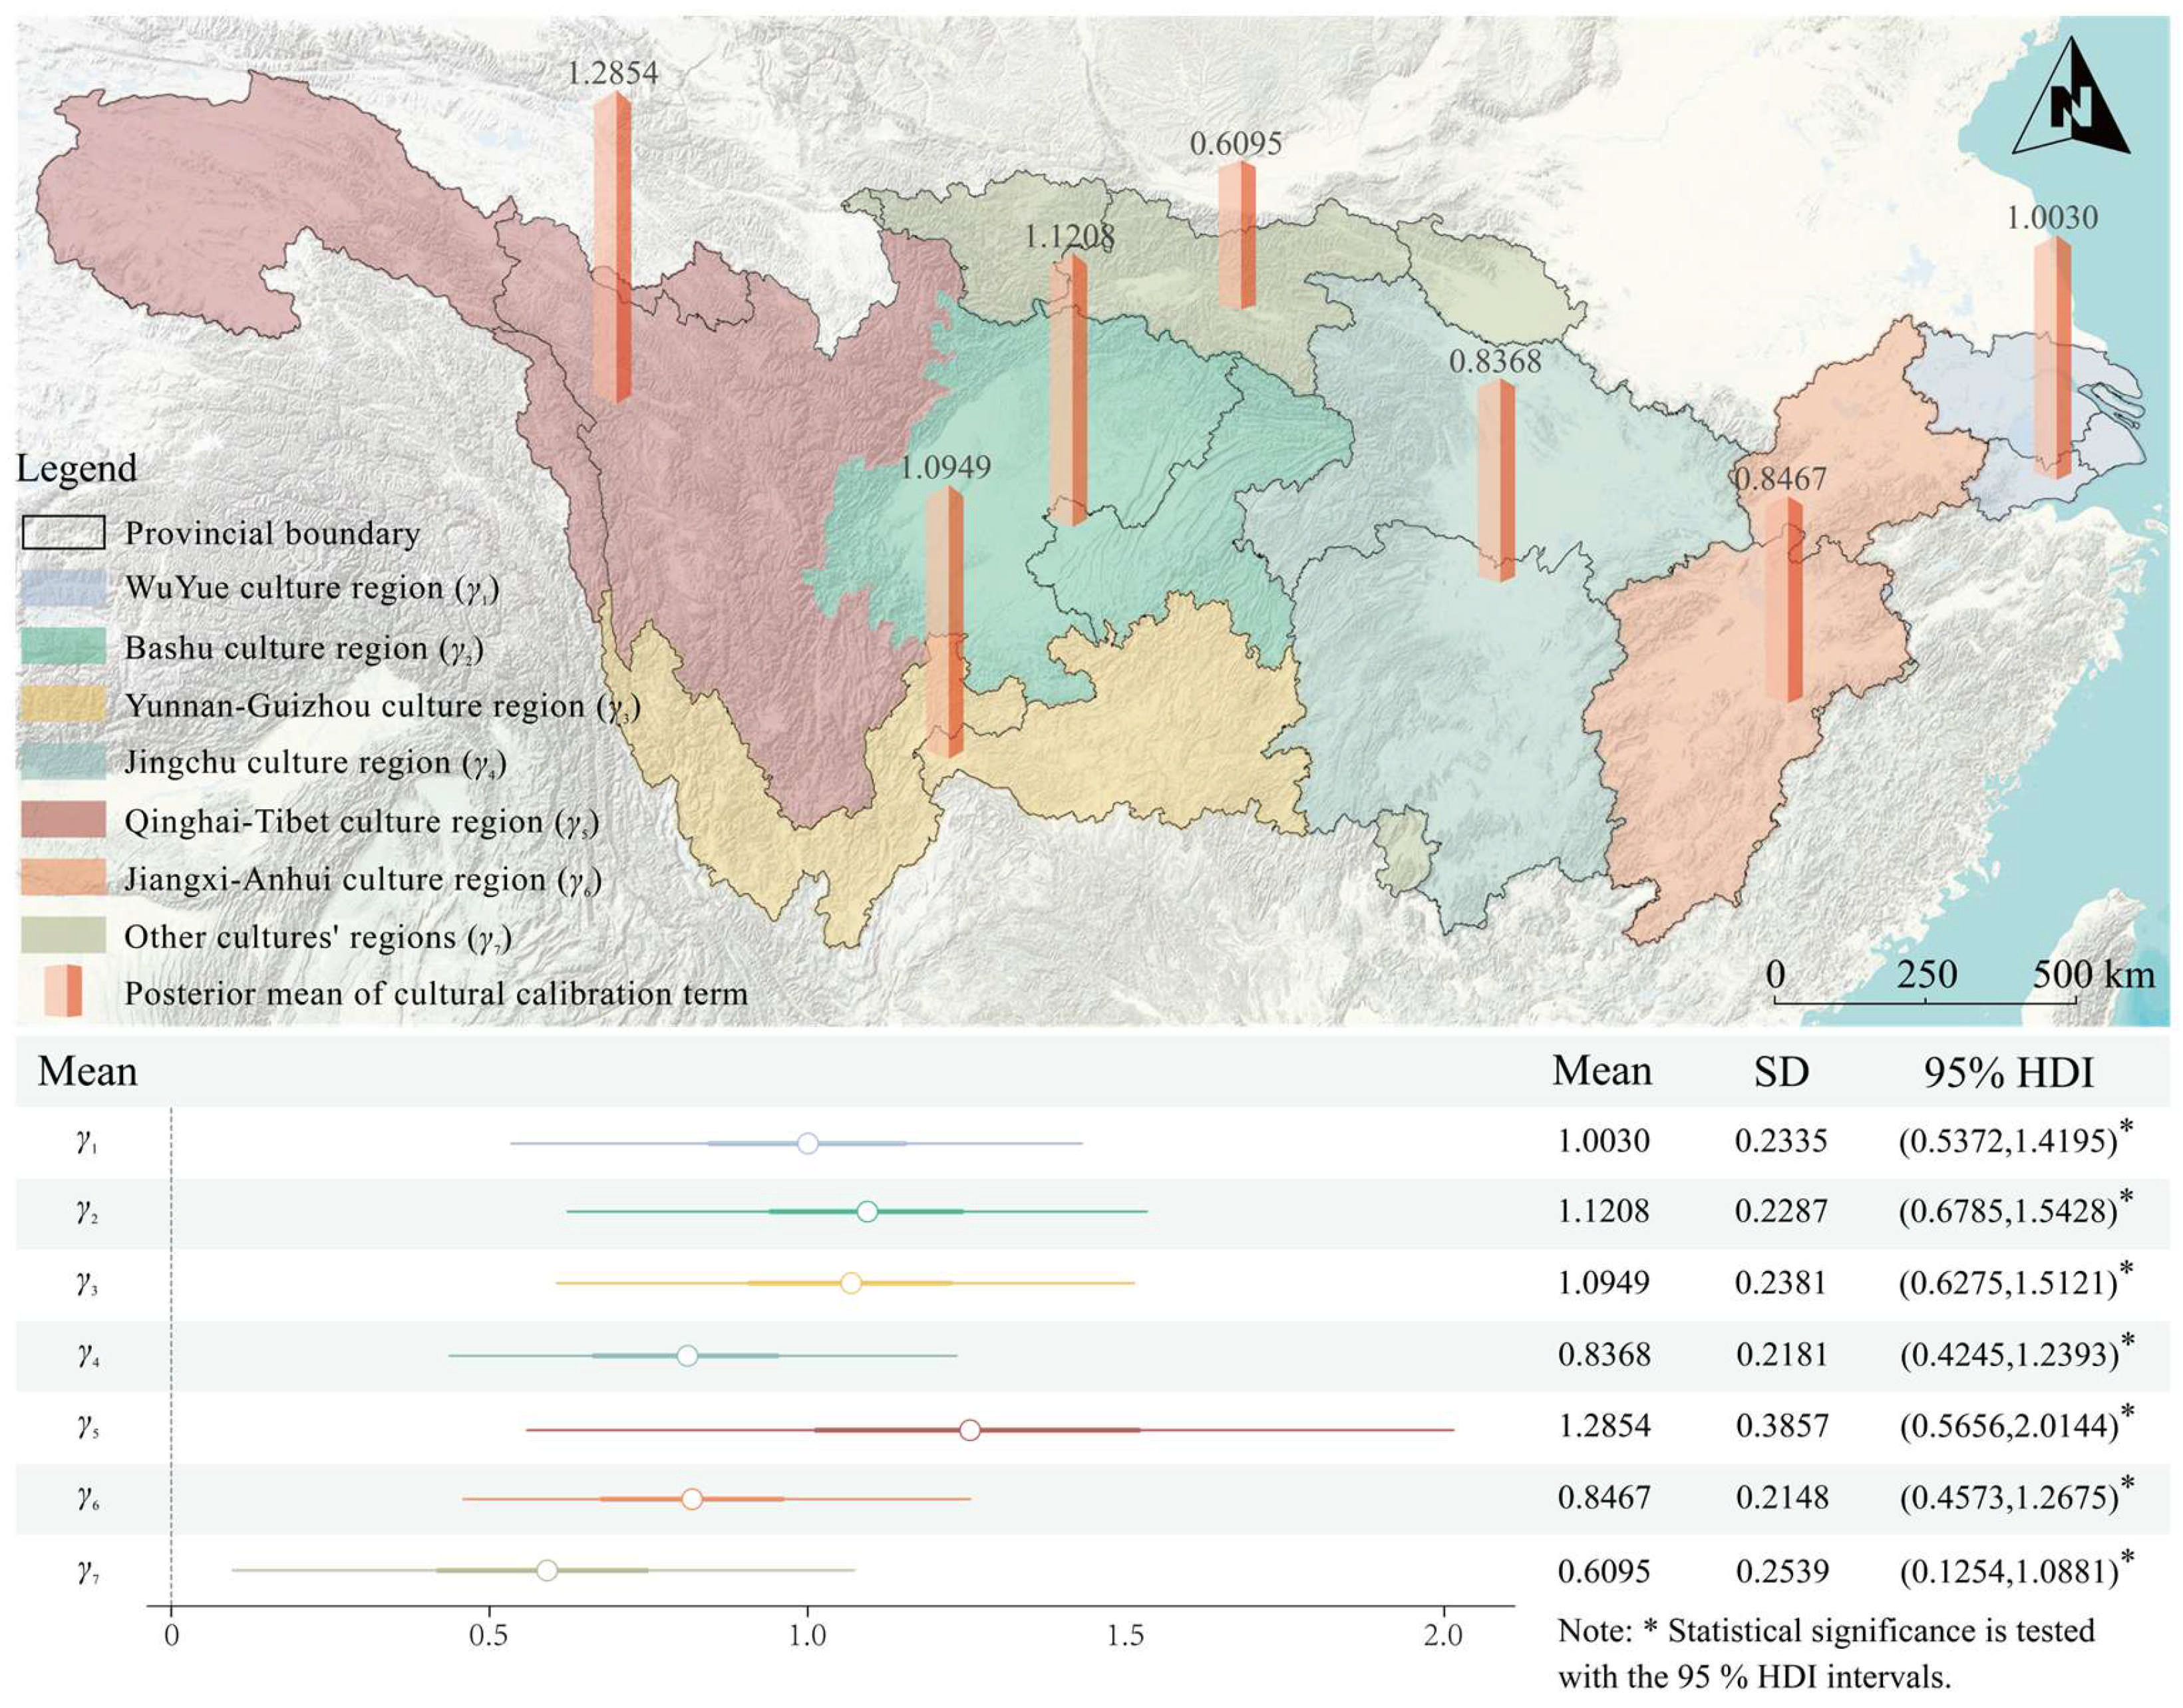
3.5. Posterior Distribution of Cultural Calibration Terms

Considering the regional influence of different cultural types in the Yangtze River Basin, the model introduced cultural calibration terms to capture statistical deviations arising from the interaction between cultural systems and environmental variables. These parameters do not constitute any form of value judgment on culture. The posterior distribution is shown in Figure 7. The Qinghai–Tibet culture region (γ5) had the highest posterior mean, at 1.2854, indicating a higher baseline level of heritage density in this region after controlling for feature variables. The Bashu, Yunnan–Guizhou, and WuYue culture regions (γ2, γ3, and γ1) had posterior means of 1.1208, 1.0949, and 1.0030, respectively, reflecting moderate positive deviations from the baseline. In contrast, the Jingchu and Jiangxi–Anhui culture regions (γ4 and γ6) had posterior means of 0.8467 and 0.8368, respectively, indicating slightly lower deviations from the baseline. Regions whose main parts are located outside the Yangtze River Basin were excluded from the present analysis.
These differences reflect the different cultural types’ response patterns to specific environmental variables. The magnitude of the values may be associated with various objective factors, such as regional ecological stress, cultural strategies, and modes of resource utilization. For instance, the relatively high cultural calibration term in the Qinghai–Tibet cultural region may be statistically linked to its limited exposure to warfare and large-scale development due to the geographical isolation of the plateau [75]. Thus, this parameter essentially represents a mathematical characterization of the environment–culture coupling relationship, revealing systematic differences in heritage distribution among cultural regions.

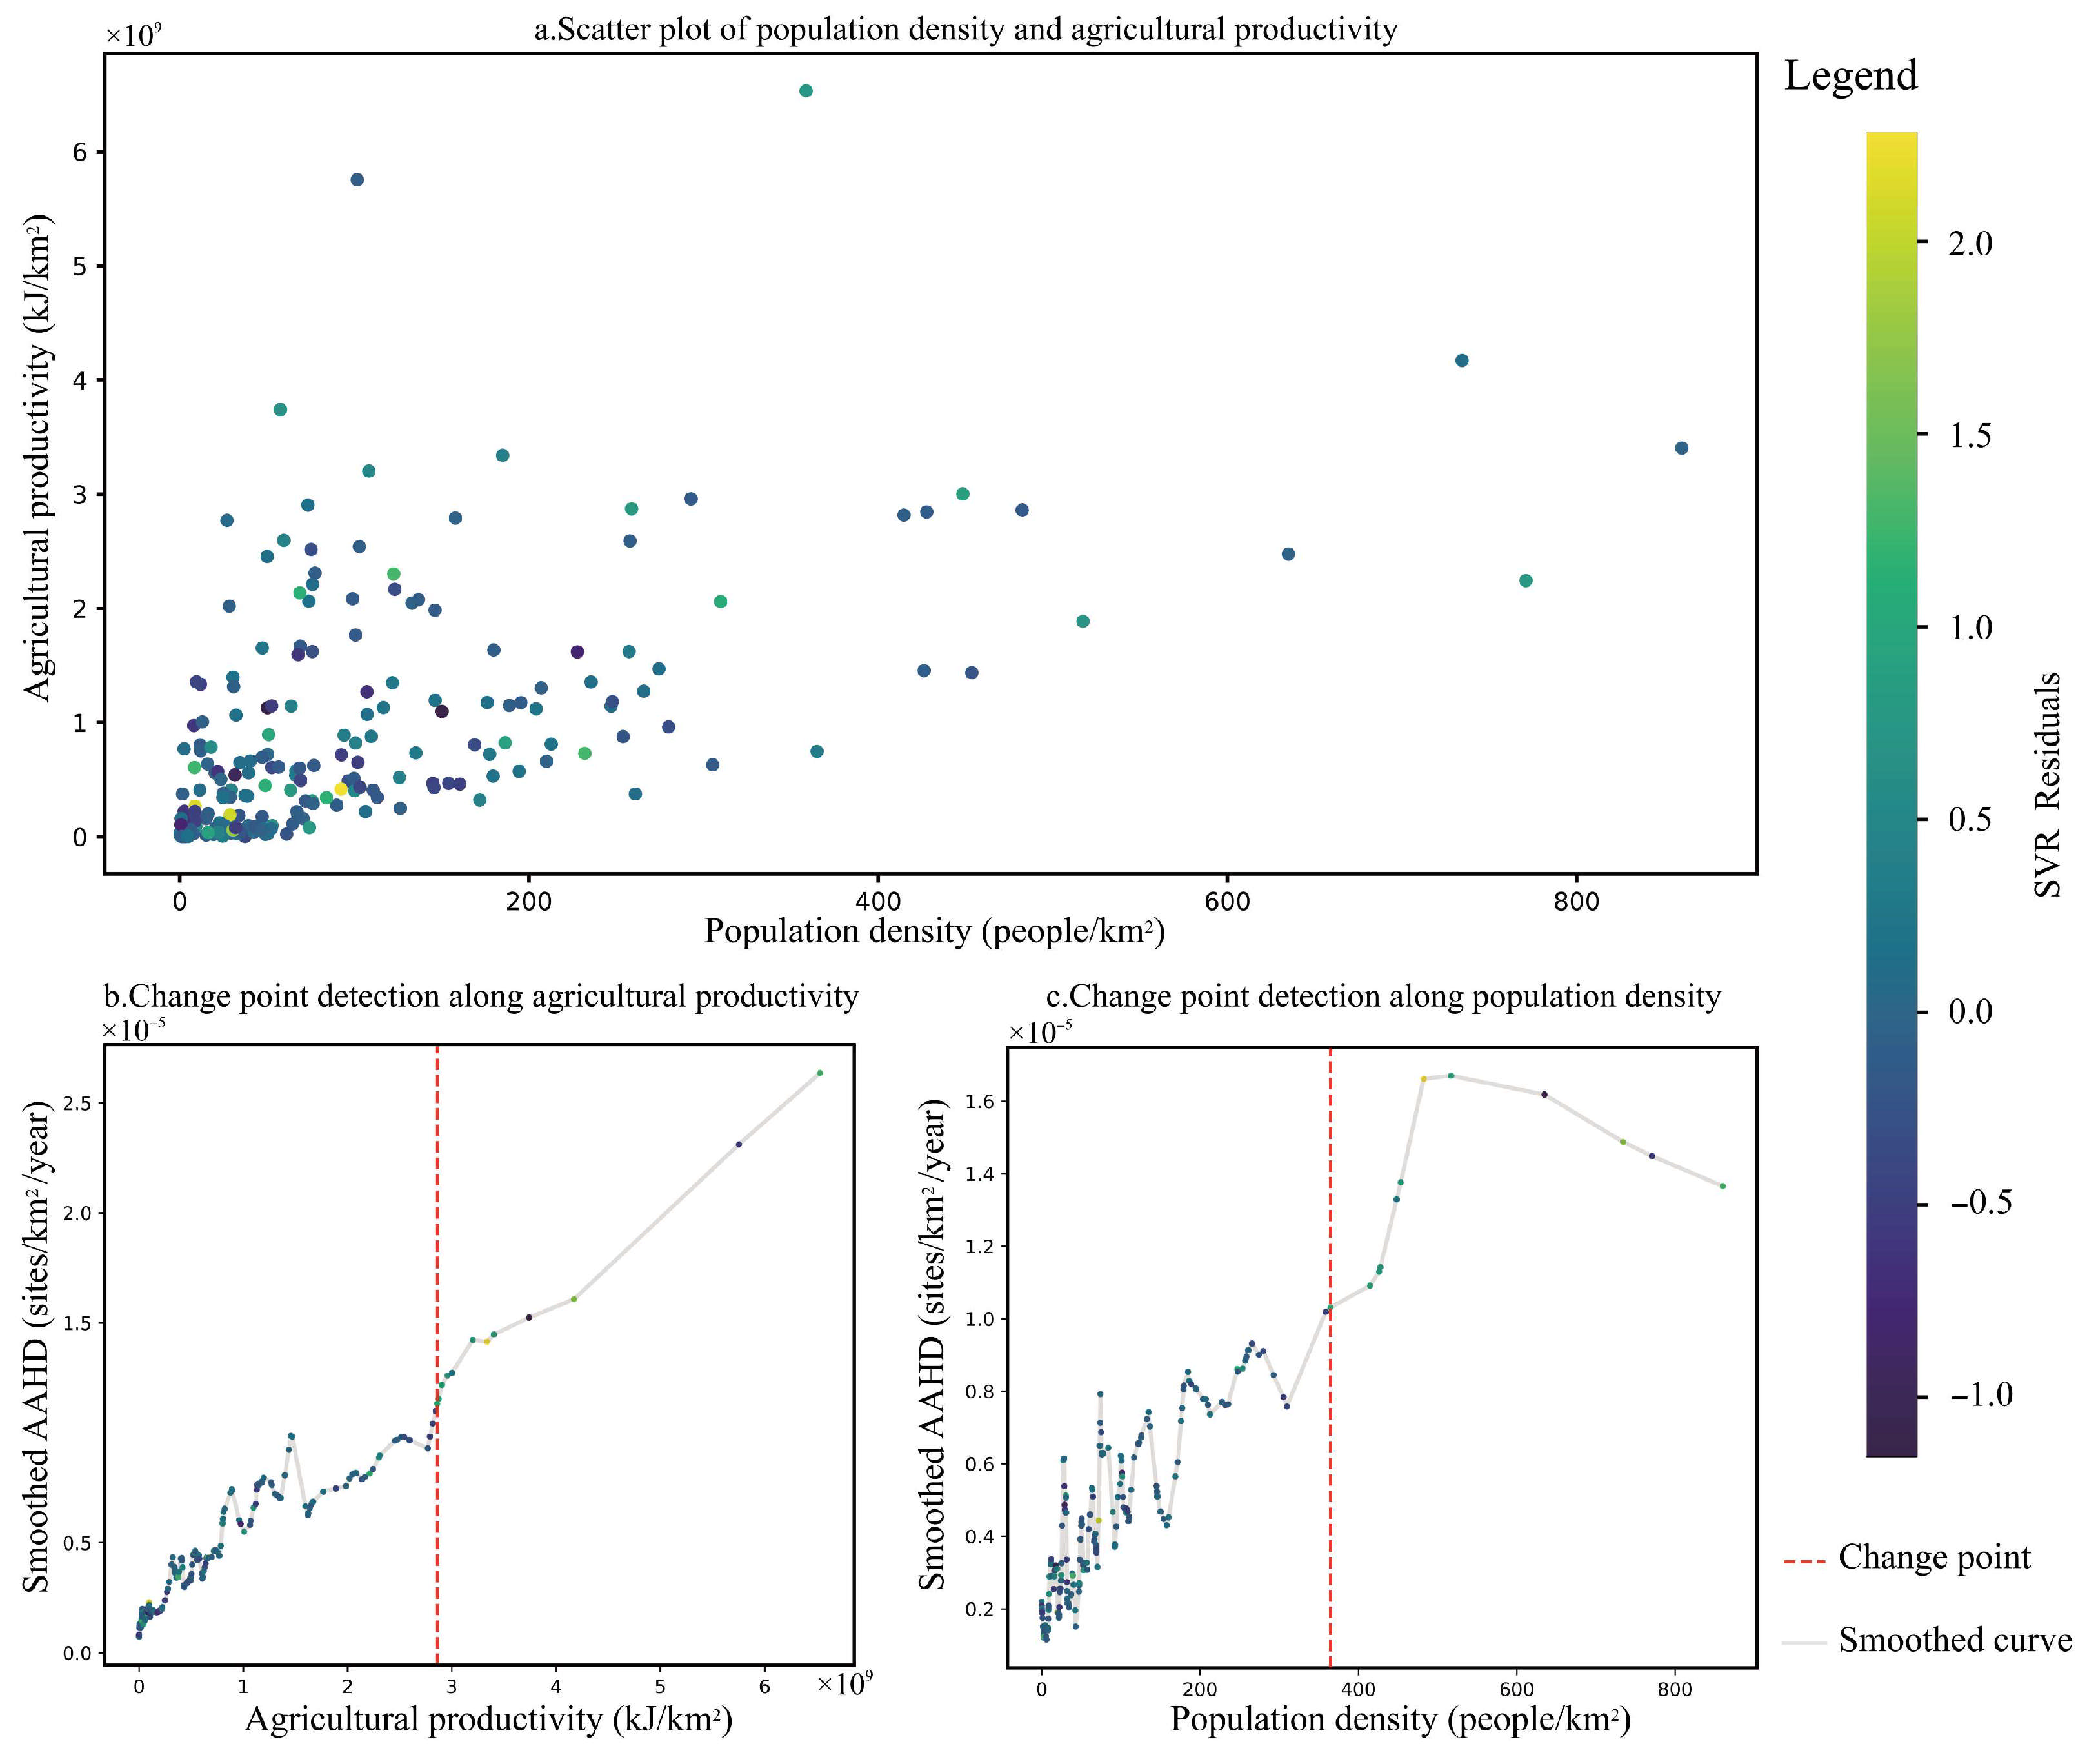
3.6. Change Point Detection Results

This study performed change point detection on PD and AP to explore whether AAHD’s response to key variables exhibits potential threshold effects. The HBM confirmed the statistical significance of these two variables. The results of SVR residuals and change point detection are shown in Figure 8.
As shown in Figure 8a, PD was primarily concentrated within the range of 0–300 people/km2, while AP was mainly distributed between 0 and 3 × 10⁹ kJ/km2. A few large SVR residuals appeared in areas with low PD and moderate AP, whereas the residual values in the remaining regions were reasonable. This indicates that the SVR model effectively captured the key features of the data. In Figure 8b,c, the red dashed lines denote the structural change points detected using the PELT algorithm, which divide the data into two sub-intervals with significantly different statistical properties. The AP and PD values at the change points were 2.86 × 10⁹ kJ/km2 and 364.83 people/km2, respectively. To the left of the change points, in the low-value regions, SVR residuals were generally low. In contrast, to the right, within the high-value regions, some SVR residuals increased markedly. This result suggests that the system tended to undergo a state shift when the AP and PD exceeded the thresholds corresponding to the change points. Phase transitions in AAHD were observed near the change points. This implies that when population density or energy output surpassed the identified thresholds, the upward trend of AAHD accelerated.

4. Discussion

4.1. Spatial Relationship Between Population and Cultural Heritage

Figure 9 illustrates the spatiotemporal distribution patterns of the population and cultural heritage. During the Ming and Qing Dynasties, PD and AAHD exhibited a high degree of spatial consistency, reflecting the positive impact of population aggregation on the development of cultural heritage.
Prolonged wars and subsequent instability meant that population density and cultural heritage density remained low during the early Ming period. With the implementation of land redistribution and household registration systems, the population began to grow rapidly. The Grand Canal’s prosperity, which facilitated the transport of goods, promoted the development of the commodity economy in the southern regions [76], driving a large influx of people into these areas. By the mid-Ming period, population growth in the middle and lower reaches of the Yangtze River had stimulated agricultural development [77], and cultural heritage began to exhibit a concentration trend. This suggests that population concentration provided the social foundation for the formation of cultural heritage. However, frequent border wars and severe tax burdens triggered intense social conflicts in the late Ming period, destabilizing the social structure and hastening the collapse of the fiscal system. As natural disasters worsened [78], a large number of civilians were forced to flee, resulting in a significant population decline. This population decline led to a reduction in labor and resource concentration, making it difficult to continue constructing new cultural facilities. On the other hand, population migration and the collapse of the social structure prevented the maintenance of the existing cultural order, leading to disruption to cultural inheritance. Therefore, a simultaneous decline in population density and cultural heritage concentration was observed in the late Ming period.
In the early Qing period, restorative policies such as the new land tax system and the resettlement of displaced populations facilitated the regrouping of the population after the war and the reuse of land resources [79]. During this period, population disparities influenced the formation of cultural heritage sites, resulting in significant spatial unevenness in their distribution. Compared to peripheral regions such as the southwestern frontier, the middle and lower river plains experienced a more significant increase in heritage density due to their relatively rapid population recovery. By the mid-Qing period, regions with high population density and regions with high cultural heritage density had become more spatially aligned. At that time, China’s population exceeded 400 million, accompanied by a structural transformation of the demographic pattern [80]. Large-scale, state-sponsored migration campaigns, such as ‘Huguang filled Sichuan’, drove substantial population expansion into mountainous areas [81], contributing to cultural accumulation in previously sparse heritage zones. A large number of ancestral halls, academies, bridges and temples were built or rebuilt during this period. Previous studies have shown that the increase in ancient bridges in the lower Yangtze region during this period corresponded to population growth resulting from large-scale clan migrations [82]. During the late Qing period, Chinese society faced intense external shocks. The traditional agrarian economy was centered on smallholder farming. It was unable to effectively respond to the challenges posed by industrialized nations [83]. Nevertheless, heritage density remained high and was not immediately suppressed by external threats or the industrial impact. Traditional high-density areas such as the Sichuan Basin continued to support a high population density and preserved pre-existing social structures. This suggests that with a large population base and the persistence of traditional social frameworks, the formation and evolution of cultural heritage showed significant inertia and cultural resilience [84]. Consequently, the maintenance and construction of cultural heritage continued, even giving rise to cultural defense mechanisms. For example, the proliferation of martyr tombs and commemorative halls for notable figures can be seen as a societal response to external cultural shocks. Additionally, regions with coastal access and developed transport networks gradually saw the emergence of buildings that differed significantly from traditional heritage forms, including churches, post offices and early modern factories [85]. These phenomena resulted in a unique dual-cultural coexistence pattern in late Qing society, promoting the diversification of heritage types and expanding their functions.
Overall, population growth tends to promote the generation and transmission of culture, while population mobility reduces the risk of losing cultural information [86]. Population decline weakens the capacity for cultural creation and accumulation, undermining the conditions necessary for existing cultural forms to endure. Ultimately, this decline leads to a significant spatial contraction of cultural heritage. Therefore, it can be inferred that population serves as a key mediator between cultural processes and spatial outcomes. Demographic patterns shape the materialization of cultural practices into physically anchored heritage sites and influence their geographic distribution.

4.2. The Impact of Agricultural Productivity on the Distribution of Cultural Heritage

Energy is the fundamental driving force behind the evolution of biological and social systems, and the formation of cultural heritage aligns with this principle. The ability to acquire energy directly influences the level of social productivity and the material basis for cultural expression. In agrarian societies, agricultural productivity is an indicator of the intensity of human activity and the extent to which resources are exploited in a given region. During the Ming and Qing Dynasties, AP and AAHD exhibited a high degree of consistency, and this relationship became increasingly pronounced over time (Figure 10).
During the early Ming period, social resources were primarily concentrated in downstream areas with dense irrigation networks. These regions, characterized by favorable hydrothermal conditions and fertile soils [87], exhibited high levels of agricultural productivity, which in turn facilitated the rapid development of cultural spaces. In contrast, the low-productivity regions in the west were unable to support complex social and cultural structures due to natural constraints, resulting in sparse cultural heritage distribution. By the mid-Ming period, overall agricultural productivity had increased significantly due to the expansion of cultivated land, adjustments in cropping patterns and innovations in agricultural techniques [88]. A large number of locally led constructions, dominated by clans and local gentry, emerged during this time to serve public functions and foster cultural identity. Centered around the eastern part of the basin, the Two Lakes region, and the Sichuan Basin, cultural space networks began to expand outwards. Cultural heritage also extended beyond traditional developed regions, spreading along rivers and post roads to peripheral areas. However, by the late Ming period, frequent natural disasters and wars had severely disrupted the agricultural system, leading to a decline in productivity [89]. The pace of cultural heritage formation slowed or even halted. In contrast, the southwestern frontier, relatively insulated from warfare, experienced steady cultural development. This was largely due to the region’s stable agricultural activity and the absence of significant declines in productivity. These changes suggest that, even during periods of social unrest, regions less affected by destruction could retain the basic capabilities required to sustain the minimum material support necessary for cultural activities [90].
During the early Qing period, the ruling authorities implemented a series of measures to promote agricultural development, including encouraging land reclamation and advancing crop rotation systems [91]. Consequently, agricultural productivity recovered and began to grow in multiple regions, forming a critical foundation for the renewed accumulation of cultural heritage. Additionally, crops of American origin, such as sweet potatoes and maize, were introduced to China during the late Ming period through European colonial expansion and maritime trade routes [92]. These crops were widely adopted during the transition from the early to the mid-Qing period. Due to their high yields and suitability for dryland farming, these crops significantly increased the amount of arable land available and boosted agricultural capacity [93]. With the rapid rise in population and agricultural productivity during the mid-Qing period, numerous high-yield centers emerged, supporting extensive cultural systems. Cultural heritage sites such as ancestral halls, academies, Confucian temples, Buddhist temples, and classical gardens were constructed during this time. Temperature anomalies also had a significant positive effect, with warming trends facilitating increased agricultural output [94]. Local elites actively promoted cultural expression by building academies and restoring ancestral halls. As a result, a significant number of rural cultural heritage sites were established. Concurrently, non-core agricultural regions in the south and northwest also exhibited high heritage densities. This indicates that the increase in agricultural productivity had a spatial diffusion effect, enabling cultural heritage to spread from the core regions to the periphery. Although traditional agricultural production faced significant challenges during the late Qing period due to warfare, indemnities and natural disasters, the continued availability of a stable agricultural supply ensured the persistence of cultural facilities. This endurance was largely attributed to the structural resilience of high-yield agricultural regions. With the opening of treaty ports and the spread of missionary activities, coastal and riverine areas began to develop new forms of cultural expression driven by external energy inputs [95]. This shift marked a gradual transition from cultural heritage primarily powered by traditional agricultural energy to one increasingly supported by complex energy systems. The transformation of energy regimes during this period paved the way for the emergence and evolution of modern cultural heritage patterns.
From the perspective of change points, low-density areas may correspond to a linear growth pattern in resource utilization. In contrast, high-density areas are more likely to exhibit complex effects, such as resource competition or efficiency saturation. As the foundation of essential societal activities, energy underpins basic functioning and influences the spatial concentration of cultural heritage through its capacity for redistribution. Energy has effectively sustained the basic operations of society, ensuring the continuity of cultural heritage and its potential for development.

4.3. Constraining Role of Physical Geography

Physical geography determines regional resource endowments and ecological carrying capacity [96], thereby constituting a broad structural boundary. Although it does not directly influence population distribution or agricultural productivity, it does impose structural constraints on both. Areas with favorable topography and hydrothermal conditions are more likely to support long-term human settlement. For example, Maya settlement systems in the Belize River Valley tend to be concentrated in zones with high soil productivity [97], reflecting a common land-use strategy among human societies in different regions. With sustained and frequent social activities, cultural heritage tends to accumulate significantly. In areas of high cultural heritage density, both population density and agricultural productivity are generally elevated. This spatial overlap is rooted in the development potential provided by the physical geography.
Agricultural productivity reflects the extent to which resources are realized under the influence of technology, institutions and social structures. Its improvement fundamentally depends on the sustained investment of human activity. Only through the active participation of people can energy output be transformed into tangible cultural outcomes. Therefore, population is not merely a passive dependent variable of energy, but rather the main agent responsible for mobilizing and allocating it [98]. Throughout history, humans have acted as the key mediators in integrating energy into cultural systems.
From a material perspective, cultural heritage is the outcome of resource flows and is essentially the product of collective behavior and cultural creation. It is simultaneously constrained by the spatial boundaries imposed by physical geography and dependent on the material support provided by energy systems. The spatial differentiation of cultural heritage reflects long-term interactions between human societies and natural environments [36]. These interactions shape regionally specific cultural landscapes and provide spatial foundations for cultural stabilization and heritage formation. This helps to explain why regions with similar environmental resources may exhibit significant differences in heritage density, which stem from variations in energy utilization and population organization. The analysis of cultural heritage reveals spatial patterns that embody the materialized expressions of historical cultural practices. These patterns demonstrate how interactions between humans and the landscape over multiple periods have formed the cultural heritage that defines the region’s identity. Accordingly, introducing natural geography into the discussion is not intended to provide a deeper causal explanation for population and agricultural productivity, but rather to offer a boundary-based perspective on their spatial structure. This perspective contributes to a more comprehensive understanding of the spatiotemporal logic underlying the distribution of cultural heritage.

4.4. Theoretical Contributions and Practical Significance

To address the methodological limitations in the quantitative analysis of the spatiotemporal distribution of cultural heritage, this study has developed an integrated theoretical framework grounded in authentic historical variables. This framework avoids the cumulative errors often introduced by the use of modern data and offers a new analytical paradigm for understanding historical geographical evolution.
From a theoretical innovation perspective, the study is based on the principle that human activities are constrained by resources and energy. By integrating four key historical variables—population density, agricultural productivity, temperature anomalies and technological level—it provides a more historically accurate explanation of the spatial evolution of cultural heritage. Furthermore, integrating a hierarchical Bayesian model with heritage research overcomes the limitations of traditional GIS-based approaches in terms of description, enabling the rigorous statistical inference of key driving factors. The introduction of a cultural calibration term within the machine learning framework offers a fresh perspective on the interaction between culture and the environment. This parameter also serves as an effective tool for quantifying the influence of cultural diversity on the distribution of heritage sites. Additionally, this study is the first to apply change point detection methods in this field. These methods can identify structural shifts in the relationship between environmental conditions and cultural systems, revealing the non-linear dynamics of human societies.
From a practical perspective, this research provides an evidence-based support system for cultural heritage conservation planning. The quantitative modeling approach identifies key variables and risk thresholds with precision, providing a robust data foundation for vulnerability assessments and risk predictions. This capability is particularly critical in areas where modern urban development intersects with historical heritage sites. Decision-makers can use these insights to proactively identify priority zones and optimize resource allocation. The cultural calibration term, by quantifying the distinctiveness of different cultural systems, provides empirical support for the formulation of differentiated conservation strategies. This approach, combining scientific rigor with local specificity, can significantly enhance the cross-regional coherence and cultural sensitivity of heritage policies.
The methodological framework developed in this study demonstrates robust generalizability and scalability. By organically integrating historical data authenticity with machine learning techniques, it facilitates the creation of standardized analytical procedures applicable across diverse cultural and geographical contexts. This standardization potential not only promotes a shift from descriptive documentation to predictive science in heritage studies but also contributes new theoretical tools and methodological foundations to the academic field.

5. Conclusions

This study used the HBM to investigate the spatiotemporal distribution of cultural heritage during the Ming and Qing Dynasties, as well as its potential driving factors. Quantifying the model’s parameters revealed the effects of key variables and identified statistical differences in observations across cultural regions. The statistically significant variables identified through the HBM were then used for change point detection, offering insights into threshold-driven transitions in the spatial patterns of heritage distribution. The main conclusions are as follows:
(1)
Cultural heritage was primarily concentrated in the lower and middle reaches of the Yangtze River and the Sichuan Basin. During the Ming Dynasty, the density of cultural heritage first increased and then declined. In contrast, during the Qing Dynasty, it exhibited a continuous upward trend. During both dynasties, a clear multipolar pattern emerged in the middle period, followed by the contraction of high-density areas in the late period.
(2)
The HBM demonstrated good model fit and generalization capability. Posterior results indicated that PD and AP were statistically significant overall, with AP demonstrating a stronger positive effect. At the group level, AP remained consistently significant. PD had a significant positive effect in all periods except Period II. TL was not significant in any period, while TA was only significant in Period II with a positive effect.
(3)
The cultural calibration terms do not imply any value judgment about cultural significance. After controlling for feature variables, the mean values of the cultural calibration terms in the Qinghai–Tibet, Bashu, Yunnan–Guizhou, and WuYue cultural regions were all greater than 1, indicating a higher baseline level of cultural heritage in these areas. In contrast, the JingChu and Jiangxi–Anhui cultural regions showed slightly lower mean values, potentially due to ecological stress or other contextual constraints.
(4)
The identified change points were 364.83 people/km2 for PD and 2.86 × 10⁹ kJ/km2 for AP. Once the AP and PD values exceed these thresholds, the state of AAHD tends to shift, indicating threshold-driven transitions in heritage density patterns.
This study analyzed the spatial evolution of cultural heritage in the Yangtze River Basin to uncover the underlying logic of human–land relations and resource allocation. However, several issues remain that warrant further empirical investigation. Firstly, natural degradation or human-caused destruction may have resulted in the historical loss of cultural heritage, which makes it difficult to fully reconstruct the original spatial pattern. Secondly, due to data limitations, this study did not consider energy sources such as fisheries, mining and biomass. Furthermore, the study used the Cobb–Douglas production function to infer technological levels, with yield per unit area serving as the target variable. Although this approach has become a classical paradigm in economic modeling, its applicability in historical contexts still requires further validation. Additionally, this study focuses solely on tangible cultural heritage, while intangible heritage elements that are equally significant in shaping cultural identity and continuity remain unexplored and warrant future investigation. Future research could incorporate multi-source historical documents and archeological evidence to improve the identification of heritage sites and technological levels. Integrating richer spatial data and historical contexts into the analytical framework would deepen our understanding of heritage mechanisms. Meanwhile, given the multiple value dimensions of cultural heritage, future research could apply settlement pattern and cultural landscape frameworks to investigate the relational mechanisms between cultural heritage and religious beliefs, tourism development, and community identity. From a practical perspective, this research not only provides empirical support for interdisciplinary heritage studies but also offers valuable insights for formulating sustainable heritage conservation and development strategies.

Author Contributions

Conceptualization, Y.L.; data curation, Y.L. and Y.B.; methodology, Y.L. and X.D.; software, Y.L.; formal analysis, Y.L.; investigation, Y.L., Y.B. and W.L.; validation, Y.L. and W.L.; visualization, Y.L.; supervision, Q.C. and X.D.; writing—original draft preparation, Y.L., Y.B. and W.L.; writing—review and editing, Y.L., Y.B. and W.L.; project administration, Q.C.; funding acquisition, Q.C. All authors have read and agreed to the published version of the manuscript.

Funding

This research was supported by the National Natural Science Foundation of China (Grant Number 32271944).

Data Availability Statement

The datasets used or analyzed during the current study are available from the corresponding author on reasonable request.

Acknowledgments

We gratefully acknowledge the researcher yuanyy_worldmap from Harvard WorldMap for providing the historical maps of ancient China that supported this study. We also appreciate the data support from Soil SubCenter, National Earth System Science Data Center, National Science & Technology Infrastructure of China (http://soil.geodata.cn, accessed on 10 March 2025).

Conflicts of Interest

The authors declare no conflicts of interest.

Abbreviations

GISGeographic Information System
DEMDigital Elevation Model
PDPopulation Density
APAgricultural Productivity
TLTechnological Level
TATemperature Anomaly
AAHDAverage Annual Heritage Density
C-DCobb–Douglas
OLSOrdinary Least Squares
MADMedian Absolute Deviation
KDEKernel Density Estimation
HBMHierarchical Bayesian Model
SVRSupport Vector Regression
PELTPruned Exact Linear Time
BICBayesian Information Criterion
AICAkaike Information Criterion
HQCHannan–Quinn Criterion
R2Coefficient of Determination
RMSERoot Mean Square Error
BPVBayesian p-value
MCMCMarkov Chain Monte Carlo

References

  1. Choi, Y.; Yang, Y.J.; Sohn, H.G. Resilient cultural heritage through digital cultural heritage cube: Two cases in South Korea. J. Cult. Herit. 2021, 48, 36–44. [Google Scholar] [CrossRef]
  2. UNESCO. Convention Concerning the Protection of the World Cultural and Natural Heritage. 1972. Available online: https://whc.unesco.org/en/conventiontext/ (accessed on 27 June 2025).
  3. UNESCO. The Convention for the Safeguarding of the Intangible Cultural Heritage. 2003. Available online: https://ich.unesco.org/en/convention (accessed on 27 June 2025).
  4. Dippon, P.; Helferich, A. Sharing the documentary heritage of humanity: Disparities in distribution. Int. J. Herit. Stud. 2023, 29, 145–166. [Google Scholar] [CrossRef]
  5. Zhang, R.; Huang, Q.; Luo, J.; Xu, J.; Pan, Y. Enhancing User Participation in Cultural Heritage through Serious Games: Combining Perspectives from the Experience Economy and SOR Theory. Sustainability 2024, 16, 7608. [Google Scholar] [CrossRef]
  6. Chen, D.; Sun, N.; Lee, J.H.; Zou, C.; Jeon, W.S. Digital Technology in Cultural Heritage: Construction and Evaluation Methods of AI-Based Ethnic Music Dataset. Appl. Sci. 2024, 14, 10811. [Google Scholar] [CrossRef]
  7. Jiang, L.L.; Li, J.J.; Wider, W.; Tanucan, J.C.M.; Lobo, J.; Fauzi, M.A.; Hidayat, H.; Zou, R. A bibliometric insight into immersive technologies for cultural heritage preservation. npj Herit. Sci. 2025, 13, 126. [Google Scholar] [CrossRef]
  8. Dai, T.C.; Zheng, X.; Yan, J. Contradictory or aligned? The nexus between authenticity in heritage conservation and heritage tourism, and its impact on satisfaction. Habitat. Int. 2021, 107, 102307. [Google Scholar] [CrossRef]
  9. Song, H.; Moon, J.; Choe, Y. Determinants of cultural heritage tourism demands: Learning in cultural heritage tourism destination. J. Hosp. Leis. Sport Tour. Educ. 2024, 35, 100499. [Google Scholar] [CrossRef]
  10. Tang, Y.C.; Liu, L.; Pan, T.B.; Wu, Z.X. A bibliometric analysis of cultural heritage visualisation based on Web of Science from 1998 to 2023: A literature overview. Hum. Soc. Sci.Commun. 2024, 11, 1081. [Google Scholar] [CrossRef]
  11. Li, S.Y.; Jiang, Y.; Jing, B.W.; Yang, L.Y.X.; Zhang, Y.H. AI-based experts’ knowledge visualization of cultural heritage: A case study of Terracotta Warriors. J. Cult. Herit. 2025, 72, 81–90. [Google Scholar] [CrossRef]
  12. Selim, G.; Farhan, S.L. Reactivating voices of the youth in safeguarding cultural heritage in Iraq: The challenges and tools. J. Soc. Archaeol. 2024, 24, 58–78. [Google Scholar] [CrossRef]
  13. Katapidi, I. The role of conservation policies in local understandings of heritage in living heritage places: A Greek testimony. Int. J. Herit. Stud. 2023, 29, 275–293. [Google Scholar] [CrossRef]
  14. Durrant, L.J.; Vadher, A.N.; Teller, J. Disaster risk management and cultural heritage: The perceptions of European world heritage site managers on disaster risk management. Int. J. Disaster Risk Reduct. 2023, 89, 103625. [Google Scholar] [CrossRef]
  15. Fatorić, S.; Daly, C. Towards a climate-smart cultural heritage management. Wiley Interdiscip. Rev. Clim. Chang. 2023, 14, e855. [Google Scholar] [CrossRef]
  16. Yi, X.L.; Fu, X.X.; Lin, B.N.; Sun, J.X. Authenticity, identity, self-improvement, and responsibility at heritage sites: The local residents’ perspective. Tour. Manag. 2024, 102, 104875. [Google Scholar] [CrossRef]
  17. Foroughi, M.; de Andrade, B.; Roders, A.P. Capturing public voices: The role of social media in heritage management. Habitat. Int. 2023, 142, 102934. [Google Scholar] [CrossRef]
  18. Li, X.F.; Zhou, X.P.; Weng, F.F.; Ding, F.Z.; Wu, Y.J.; Yi, Z.X. Evolution of cultural landscape heritage layers and value assessment in urban countryside historic districts: The case of Jiufeng Sheshan, Shanghai, China. npj Herit. Sci. 2024, 12, 96. [Google Scholar] [CrossRef]
  19. Albaqawy, G.A.; Alnaim, M.M.; Bay, M.A.; Touahmia, M. Assessment of Saudi Arabia’s Classification and Selection Criteria for Heritage Sites: A Case Study of Barzan Heritage Area in Hail City. Sustainability 2023, 15, 1015. [Google Scholar] [CrossRef]
  20. Li, C.; Qian, Y.Y.; Li, Z.K.; Tong, T. Identifying factors influencing the spatial distribution of minority cultural heritage in Southwest China. npj Herit. Sci. 2024, 12, 117. [Google Scholar] [CrossRef]
  21. Lu, Y.Y.; Han, Q.W.; Zhang, Z.; Sun, Z.; Dai, J. Spatiotemporal Distribution and Evolution of Global World Cultural Heritage, 1972–2024. ISPRS Int. J. Geo-Inf. 2025, 14, 190. [Google Scholar] [CrossRef]
  22. Poulin, J.; Kearney, M.; Veall, M.A. Direct Inlet Py-GC-MS analysis of cultural heritage materials. J. Anal. Appl. Pyrolysis 2022, 164, 105506. [Google Scholar] [CrossRef]
  23. Galvagno, E.; Tartaglia, E.; Stratigaki, M.; Tossi, C.; Marasco, L.; Menegazzo, F.; Zanardi, C.; Omenetto, F.; Coletti, C.; Traviglia, A. Present status and perspectives of graphene and graphene-related materials in cultural heritage. Adv. Funct. Mater. 2024, 34, 2313043. [Google Scholar] [CrossRef]
  24. Tonelli, M.; Gelli, R.; Giorgi, R.; Pierigè, M.I.; Ridi, F.; Baglioni, P. Cementitious materials containing nano-carriers and silica for the restoration of damaged concrete-based monuments. J. Cult. Herit. 2021, 49, 59–69. [Google Scholar] [CrossRef]
  25. Ding, Q.K.; Liang, H.E. Digital restoration and reconstruction of heritage clothing: A review. npj Herit. Sci. 2024, 12, 225. [Google Scholar] [CrossRef]
  26. Salpina, D.; Casartelli, V.; Marengo, A.; Mysiak, J. Financing strategies for the resilience of cultural landscapes. Lessons learned from a systematic literature and practice review. Cities 2025, 162, 105922. [Google Scholar] [CrossRef]
  27. Campana, S.; Sordini, M.; Berlioz, S.; Vidale, M.; Al-Lyla, R.; Abbo al-Araj, A.; Bianchi, A. Remote sensing and ground survey of archaeological damage and destruction at Nineveh during the ISIS occupation. Antiquity 2022, 96, 436–454. [Google Scholar] [CrossRef]
  28. Li, X.B.; Zhu, R.; Shi, C.Y.; Yang, X.K.; Chen, J.Z.; Wei, K.X. Research on the construction of intangible cultural heritage corridors in the Yellow River Basin based on geographic information system (GIS) technology and the minimum cumulative resistance (MCR) model. npj Herit. Sci. 2024, 12, 271. [Google Scholar] [CrossRef]
  29. Li, X.Y.; Yang, H.Q.; Chen, C.W.; Zhao, G.; Ni, J.H. Deterioration identification of stone cultural heritage based on hyperspectral image texture features. J. Cult. Herit. 2024, 69, 57–66. [Google Scholar] [CrossRef]
  30. Ying, M.; Jiang, Y.J. The inheritance and analysis of colors in Rimpa art: A machine learning perspective. Expert Syst. Appl. 2025, 276, 127129. [Google Scholar] [CrossRef]
  31. Huang, Y. Bibliometric analysis of GIS applications in heritage studies based on Web of Science from 1994 to 2023. npj Herit. Sci. 2024, 12, 57. [Google Scholar] [CrossRef]
  32. Wang, X.R.; Zhang, T.J.; Duan, L.G.; Liritzis, I.; Li, J.S. Spatial distribution characteristics and influencing factors of intangible cultural heritage in the Yellow River Basin. J. Cult. Herit. 2024, 66, 254–264. [Google Scholar] [CrossRef]
  33. Yuan, H.Y.; Fan, J.Y. Construction of integrated, contiguous conservation and utilization system for cultural relics protection unit in Qiandongnan based on quantitative analysis. npj Herit. Sci. 2025, 13, 216. [Google Scholar] [CrossRef]
  34. Zhang, J.H.; Jiang, L.; Wang, X.Q.; Chen, Z.H.; Xu, S.B. A Study on the Spatiotemporal Aggregation and Corridor Distribution Characteristics of Cultural Heritage: The Case of Fuzhou, China. Buildings 2024, 14, 121. [Google Scholar] [CrossRef]
  35. Liu, Y.; Chen, M.; Tian, Y. Temporal and spatial patterns and influencing factors of intangible cultural heritage: Ancient Qin-Shu roads, Western China. npj Herit. Sci. 2022, 10, 201. [Google Scholar] [CrossRef]
  36. Shen, W.; Chen, Y.L.; Cao, W.W.; Yu, R.Y.; Rong, P.J.; Cheng, J.L. Spatial pattern and its influencing factors of national-level cultural heritage in China. npj Herit. Sci. 2024, 12, 384. [Google Scholar] [CrossRef]
  37. Jiao, M.; Lu, L. Spatiotemporal distribution of toponymic cultural heritage in Jiangsu Province and its historical and geographical influencing factors. npj Herit. Sci. 2024, 12, 377. [Google Scholar] [CrossRef]
  38. Pang, L.; Wu, L. Distribution characteristics and influencing factors of Intangible Cultural Heritage in Beijing-Tianjin-Hebei. npj Herit. Sci. 2023, 11, 19. [Google Scholar] [CrossRef]
  39. Mueller, N.G. The Broad-Spectrum Revolution at 50: Increasing dietary diversity reflects the heterogeneity of domesticated landscapes. J. Anthropol. Archaeol. 2022, 68, 101444. [Google Scholar] [CrossRef]
  40. Xiao, X.; Li, P.; Seekamp, E. Sustainable adaptation planning for cultural heritage in coastal tourism destinations under climate change: A mixed-paradigm of preservation and conservation optimization. J. Travel Res. 2024, 63, 215–233. [Google Scholar] [CrossRef]
  41. National Cultural Heritage Administration. The State of Cultural Heritage Preservation in China. The Central People’s Government of the People’s Republic of China. 2023. Available online: https://www.gov.cn/guoqing/2012-04/11/content_2584143.htm (accessed on 27 June 2025).
  42. Zhao, Y.L.; Sun, H.J.; Wang, X.D.; Ding, J.; Lu, M.Y.; Pang, J.W.; Zhou, D.P.; Liang, M.; Ren, N.Q.; Yang, S.S. Spatiotemporal drivers of urban water pollution: Assessment of 102 cities across the Yangtze River Basin. Environ. Sci. Ecotechnol. 2024, 20, 100412. [Google Scholar] [CrossRef]
  43. Bai, Y.Q.; Tian, Y.G.; Geng, B.; Liu, X.B.; Zheng, K. Does ‘living by water’ still exist? A new perspective for quantifying ISA dynamics at different distances from the Yangtze River. Ecol. Indic. 2024, 166, 112339. [Google Scholar] [CrossRef]
  44. Liang, F.Z. Statistics of Population, Land and Land Tax in China Throughout the Dynasties; Zhonghua Book Company: Beijing, China, 2008; pp. 264–555. (In Chinese) [Google Scholar]
  45. Ge, J.X. Development History of Population in China; People’s Publishing House: Beijing, China, 1991; pp. 227–257. (In Chinese) [Google Scholar]
  46. Hu, X.S.; Wu, L.; Zhuang, Y.J.; Wang, X.Y.; Ma, C.M.; Li, L.Y.; Guan, H.C.; Lu, S.G.; Luo, W.J.; Xu, Z.Y. Evolution of the historical polder landscape in the ancient Danyang wetland, lower Yangtze River, China, during the last 3000 years. J. Geogr. Sci. 2024, 34, 2053–2073. [Google Scholar] [CrossRef]
  47. Wu, H. Study on Grain Yield per Mu in Past Dynasties of China (Updated and Reprinted); China Agriculture Press: Beijing, China, 2016; pp. 213–217. (In Chinese) [Google Scholar]
  48. Han, M.L. Historical Agricultural Geography of China; Peking University Press: Beijing, China, 2012; pp. 461–510. (In Chinese) [Google Scholar]
  49. Zhao, G.; Liu, Y.C.; Wu, H.; Chen, C.Y.; Zhu, J.F.; Chen, Q.K. Study on Grain Yield Per Mu in Qing Dynasty; China Agriculture Press: Beijing, China, 1995; pp. 15–45. (In Chinese) [Google Scholar]
  50. Wang, S.W.; Wen, X.Y.; Luo, Y.; Dong, W.J.; Zhao, Z.C.; Yang, B. Reconstruction of temperature series of China for the last 1000 years. Chin. Sci. Bull. 2007, 52, 3272–3280. [Google Scholar] [CrossRef]
  51. Watson, A.; Gingrich, S.; MacFadyen, J. Recent advances in social metabolism research: Sources and methods. Hist. Methods 2024, 57, 199–204. [Google Scholar] [CrossRef]
  52. Zhou, X.X.; Cai, Z.M.; Tan, K.H.; Zhang, L.L.; Du, J.T.; Song, M.L. Technological innovation and structural change for economic development in China as an emerging market. Technol. Forecast. Soc. Chang. 2021, 167, 120671. [Google Scholar] [CrossRef]
  53. Bouteska, A.; Sharif, T.; Bhuiyan, F.; Abedin, M.Z. Impacts of the changing climate on agricultural productivity and food security: Evidence from Ethiopia. J. Clean Prod. 2024, 449, 141793. [Google Scholar] [CrossRef]
  54. Food and Agriculture Organization of the United Nations. Food Composition Tables. 2001. Available online: https://www.fao.org/4/x9892e/X9892e05.htm (accessed on 23 May 2025).
  55. Li, C.X. Climate change impacts on rice production in Japan: A Cobb-Douglas and panel data analysis. Ecol. Indic. 2023, 147, 110008. [Google Scholar] [CrossRef]
  56. Niu, X.G.; Zhang, S.L.; Zhang, C.B.; Yan, P.K.; Wang, H.; Xu, W.T.; Song, M.K.; Aurangzeib, M. Key factors influencing the spatial distribution of soil organic carbon and its fractions in Mollisols. Catena 2024, 247, 108522. [Google Scholar] [CrossRef]
  57. Beauchesne, D.; Cazelles, K.; Daigle, R.M.; Gravel, D.; Archambault, P. Ecological interactions amplify cumulative effects in marine ecosystems. Sci. Adv. 2025, 11, eadp9315. [Google Scholar] [CrossRef]
  58. Liao, S.M.; Xue, L.Q.; Dong, Z.C.; Zhu, B.L.; Zhang, K.; Wei, Q.; Fu, F.B.; Wei, G.H. Cumulative ecohydrological response to hydrological processes in arid basins. Ecol. Indic. 2020, 111, 106005. [Google Scholar] [CrossRef]
  59. Fatemifar, S.; Awais, M.; Akbari, A.; Kittler, J. Developing a generic framework for anomaly detection. Pattern Recognit. 2022, 124, 108500. [Google Scholar] [CrossRef]
  60. Atkinson, A.C.; Riani, M.; Corbellini, A. The Box–Cox Transformation: Review and Extensions. Stat. Sci. 2021, 36, 239–255. [Google Scholar] [CrossRef]
  61. Yang, A.J.; Zhang, M.; Chen, H.; Li, T.H.; Liu, S.P.; Xu, X.Y. tanh As a robust feature scaling method in training deep learning models with imbalanced data. Pattern Recognit. 2025, 167, 111746. [Google Scholar] [CrossRef]
  62. Wang, C.; De Ceuster, S.; Eremin, K.; Laursen, S.; Degryse, P. A methodological case study of lead resource movements during the Warring States Period and Western Han Dynasty: Applying kernel density estimation to four lead-barium glass Bi Artifacts. J. Cult. Herit. 2025, 71, 71–80. [Google Scholar] [CrossRef]
  63. Wilcox, R.R. Introduction to Robust Estimation and Hypothesis Testing; Academic press: New York, NY, USA, 2011; pp. 48–50. [Google Scholar]
  64. Dardeno, T.A.; Worden, K.; Dervilis, N.; Mills, R.S.; Bull, L.A. On the hierarchical Bayesian modelling of frequency response functions. Mech. Syst. Signal Proc. 2024, 208, 111072. [Google Scholar] [CrossRef]
  65. Plummer, M. Simulation-Based Bayesian Analysis. Annu. Rev. Stat. Appl. 2023, 10, 401–425. [Google Scholar] [CrossRef]
  66. Ye, D. Interdistrict Interaction Study of Ethnic Dance in the Cultural Space of the Yangtze River Basin—An Essay on the Basin Anthropological Paradigm of Ethnic Dance Studies. J. Southeast Univ. (Philos. Soc. Sci.) 2022, 24, 129–138+14. (In Chinese) [Google Scholar] [CrossRef]
  67. Zhao, J.; Suo, W.Y. Research on the Construction and Application of a SVM-Based Quantification Model for Streetscape Visual Complexity. Land 2024, 13, 1953. [Google Scholar] [CrossRef]
  68. Obour, M.I.; Brian, B.; Conor, C. Assessing change point detection methods to enable robust detection of early stage Artisanal and Small-Scale mining (ASM) in the tropics using Sentinel-1 time series data. Int. J. Appl. Earth Obs. Geoinf. 2025, 139, 104525. [Google Scholar] [CrossRef]
  69. Gao, Z.Z.Y.; Xiao, X.; Fang, Y.P.; Rao, J.; Mo, H.D. A Selective Review on Information Criteria in Multiple Change Point Detection. Entropy 2024, 26, 50. [Google Scholar] [CrossRef]
  70. Zhang, J.; Yang, Y.; Ding, J. Information criteria for model selection. Wiley Interdiscip. Rev. Comput. Stat. 2023, 15, e1607. [Google Scholar] [CrossRef]
  71. Ruan, B.; Liu, C.J.; Zhou, Z.L.; Miao, J.X.; Huang, H. Prediction of compression coefficient of Nanjing floodplain soft soil based on explainable artificial intelligence. Adv. Eng. Inform. 2025, 65, 103308. [Google Scholar] [CrossRef]
  72. Sun, W.; Liu, H.L.; Zhang, W.G.; Liu, S.L.; Han, L. Determination of groundwater buoyancy reduction coefficient in clay: Model tests, numerical simulations and machine learning methods. Undergr. Space 2023, 13, 228–240. [Google Scholar] [CrossRef]
  73. Martin, O. Bayesian Analysis with Python: A Practical Guide to Probabilistic Modeling; Packt Publishing Ltd.: Birmingham, UK, 2024; pp. 152–154. [Google Scholar]
  74. Saadati Nik, A.; Asgharzadeh, A.; Fernández, A.J. Bayesian credible regions for two-parameter exponential distributions under type-II censoring. J. Comput. Appl. Math. 2025, 470, 116721. [Google Scholar] [CrossRef]
  75. Xu, X.W.; Zhang, J.Y.; Liu, S.P.; Liu, J.Q.; Zhang, Z.; Tian, X.Y. Entropy Change of Historical and Cultural Heritage in Traditional Tibetan Area of China Based on Spatial-Temporal Distribution Pattern. Buildings 2023, 13, 2995. [Google Scholar] [CrossRef]
  76. Lu, M.; Ou, H.J.; Zhong, Y.J. Political governance and urban systems: A persistent shock on population distribution from capital relocation in ancient China. Reg. Sci. Urban Econ. 2024, 108, 104034. [Google Scholar] [CrossRef]
  77. Li, M.J.; He, F.N.; Yang, F.; Hao, R.F. Per Capita Cropland Estimations for Traditional Agricultural Areas of China over Past Millennium. Land 2024, 13, 1122. [Google Scholar] [CrossRef]
  78. Ren, M.; Liu, Y.; Cai, Q.F.; Li, Q.; Song, H.M.; Sun, C.F. The collapse of the Ming Dynasty actually began with the Wanli megadrought: Insights from a hydroclimate reconstruction based on tree-ring δ18O over the past 460 years. Paleogeogr. Paleoclimatol. Paleoecol. 2024, 655, 112548. [Google Scholar] [CrossRef]
  79. Yang, F.; Dong, G.P.; Wu, P.F.; He, F.N. Stylized facts of past 1000-year of China’s cropland changes. Land Use Pol. 2024, 144, 107258. [Google Scholar] [CrossRef]
  80. Orlandi, G.; Hoyer, D.; Zhao, H.J.; Bennett, J.S.; Benam, M.; Kohn, K.; Turchin, P. Structural-demographic analysis of the Qing Dynasty (1644–1912) collapse in China. PLoS ONE 2023, 18, e0289748. [Google Scholar] [CrossRef]
  81. Yuan, C.C.; Jiang, M. Migration and Land Exploitation from Yuan to Qing Dynasties: Insights from 252 Traditional Villages in Hunan, China. Sustainability 2023, 15, 1001. [Google Scholar] [CrossRef]
  82. Zhao, Y.; Jia, X.; Lee, H.F.; Zhao, H.Q.; Cai, S.L.; Huang, X.J. Relationship between ancient bridges and population dynamics in the lower Yangtze River Basin, China. PLoS ONE 2017, 12, e0182560. [Google Scholar] [CrossRef] [PubMed]
  83. Wang, H.; Rodríguez-Pose, A.; Lee, N. The long shadow of history in China: Regional governance reform and Chinese territorial inequality. Appl. Geogr. 2021, 134, 102525. [Google Scholar] [CrossRef]
  84. Li, R.; Li, Y.Q.; Ruan, W.Q.; Zhang, S.N.; Wang, M.Y. Cultural resilience of heritage sites: Dimension exploration and scale development. J. Hosp. Tour. Manag. 2024, 61, 299–312. [Google Scholar] [CrossRef]
  85. Xiong, X.G.; Wang, Y.H.; Ma, C.; Chi, Y.W. Ensuring the Authenticity of the Conservation and Reuse of Modern Industrial Heritage Architecture: A Case Study of the Large Machine Factory, China. Buildings 2023, 13, 534. [Google Scholar] [CrossRef]
  86. Derex, M.; Mesoudi, A. Cumulative Cultural Evolution within Evolving Population Structures. Trends Cogn. Sci. 2020, 24, 654–667. [Google Scholar] [CrossRef]
  87. Kang, Y.B.; Yang, Y.D.; Shi, F.; Hao, Z.X.; Liu, B.T.; Zhang, R.H. The response of agricultural harvest in southern China to climate change during the Ming and Qing dynasties (1368–1911CE). Sci. China Earth Sci. 2025, 68, 1974–1990. [Google Scholar] [CrossRef]
  88. Tian, F.Y.; Chen, X.D.; Su, Y. Comparative Analysis of Extreme Drought Events and Social Impacts in Henan Province during the Middle Ming Dynasty. Weather Clim. Soc. 2022, 14, 1009–1021. [Google Scholar] [CrossRef]
  89. Gao, X.; An, R.; Gao, G.; Li, P.W. The famine of the Ming Dynasty in Shaanxi Province, China. Reg. Envir. Chang. 2024, 24, 35. [Google Scholar] [CrossRef]
  90. Millward-Hopkins, J.; Steinberger, J.K.; Rao, N.D.; Oswald, Y. Providing decent living with minimum energy: A global scenario. Glob. Environ. Change 2020, 65, 102168. [Google Scholar] [CrossRef]
  91. Wang, X.X.; Li, G.; Wang, S.; Feng, C.X.; Xu, W.; Nie, Q.F.; Liu, Q. The effect of environmental changes on locust outbreak dynamics in the downstream area of the Yellow River during the Ming and Qing Dynasties. Sci. Total Environ. 2023, 877, 162921. [Google Scholar] [CrossRef]
  92. O’Brien, P.J. The Sweet Potato: Its Origin and Dispersal. Am. Anthropol. 1972, 74, 342–365. [Google Scholar] [CrossRef]
  93. Perez Garcia, M. Global History and New Polycentric Approaches; Palgrave Macmillan: London, UK, 2018; pp. 53–80. [Google Scholar]
  94. Lee, H.F.; Zhang, D.D. A tale of two population crises in recent Chinese history. Clim. Chang. 2013, 116, 285–308. [Google Scholar] [CrossRef]
  95. Ao, J.H.; Xu, Z.L.; Li, W.C.; Ji, S.S.; Qiu, R. Quantitative typological analysis applied to the morphology of export mugs and their social factors in the Ming and Qing dynasties from the perspective of East–West trade. npj Herit. Sci. 2024, 12, 125. [Google Scholar] [CrossRef]
  96. Liu, H.C.; Fan, J.; Zhou, K.; Xu, X.; Zhang, H.P.; Guo, R.; Chen, S.F. Assessing the dynamics of human activity intensity and its natural and socioeconomic determinants in Qinghai–Tibet Plateau. Geogr. Sustain. 2023, 4, 294–304. [Google Scholar] [CrossRef]
  97. Walden, J.P.; Hoggarth, J.A.; Ebert, C.E.; Fedick, S.L.; Biggie, M.; Meyer, B.; Shaw-Müller, K.; Qiu, Y.J.; Ran, W.Y.; Ellis, O.P.; et al. Classic Maya Settlement Systems Reveal Differential Land Use Patterns in the Upper Belize River Valley. Land 2023, 12, 483. [Google Scholar] [CrossRef]
  98. Goggins, G.; Rau, H.; Moran, P.; Fahy, F.; Goggins, J. The role of culture in advancing sustainable energy policy and practice. Energy Policy 2022, 167, 113055. [Google Scholar] [CrossRef]
Figure 1. Geographical location and distribution of cultural heritage in the Yangtze River basin. (a) China; (b) Distribution of cultural heritage sites; (c) Topography of the Yangtze River basin.
Land 14 01416 g001
Figure 2. Research framework diagram.
Land 14 01416 g002
Figure 3. Spatiotemporal distribution characteristics of cultural heritage.
Land 14 01416 g003
Figure 4. HBM performance evaluation. (a) Bayesian p-value check (Mean statistic); (b) Residuals and predicted values; (c) Posterior predictive check.
Land 14 01416 g004
Figure 5. Results of regression coefficients in Overall level.
Land 14 01416 g005
Figure 6. Forest plot of regression coefficients at the group level.
Land 14 01416 g006
Figure 7. Cultural regional division and cultural calibration terms.
Land 14 01416 g007
Figure 8. Change point detection and threshold. (a) Scatter plot of population density and agricultural productivity; (b) Change point detection along agricultural productivity; (c) Change point detection along population density.
Land 14 01416 g008
Figure 9. The relationship between population density and cultural heritage.
Land 14 01416 g009
Figure 10. The relationship between agricultural productivity and cultural heritage.
Land 14 01416 g010
Table 1. Results of model evaluation metrics.
Evaluation MetricsTraining DatasetTesting Dataset
R20.810.72
RMSE0.440.51
BPV0.52
Disclaimer/Publisher’s Note: The statements, opinions and data contained in all publications are solely those of the individual author(s) and contributor(s) and not of MDPI and/or the editor(s). MDPI and/or the editor(s) disclaim responsibility for any injury to people or property resulting from any ideas, methods, instructions or products referred to in the content.

