Article

Disturbance and Response Strategies of Carbon Sinks in Forest Land Due to Land Use Change: Taking Liushahe Town of Ningxiang as an Example

1
School of Architecture and Planning, Hunan University, Changsha 410012, China
2
Hunan Key Laboratory of Sciences of Urban and Rural Human Settlements in Hills Areas, Changsha 410082, China
3
College of Forestry, Central South University of Forestry and Technology, Changsha 410018, China
*
Author to whom correspondence should be addressed.
Land 2025, 14(7), 1418; https://doi.org/10.3390/land14071418
Submission received: 1 June 2025 / Revised: 27 June 2025 / Accepted: 1 July 2025 / Published: 6 July 2025
(This article belongs to the Section Land Use, Impact Assessment and Sustainability)

Abstract

Forest land plays a vital role as a terrestrial carbon sink. Urbanization, particularly the conversion of forest land into agricultural and construction areas, has significantly affected the carbon sink capacity of forests. The protection of carbon sinks in forest land has become a critical issue in advancing the dual carbon strategy. Taking Liushahe Town as a case study, this study develops an integrated framework of analysis and response strategies, which encompass “land use change prediction, forest land carbon sink evaluation, and multi-objective optimization”. The purpose is to identify an optimal forest planning scheme that balances carbon sink capacity and biodiversity. The results indicate that: (1) Land use change substantially affects the extent of forest land in Liushahe Town, in which the area exhibits an initial increase followed by a decrease, and is projected to shrink to 89.88% of its 2021 level by 2041. (2) There are significant disparities in carbon sink performance among various forest land plots. The strategic elimination of inefficient plots and preservation of those with high carbon sink potential are key to enhancing the resilience of forest land to disturbances. (3) Multi-objective optimization planning schemes effectively reconcile carbon sinks and biodiversity, and enhance the synergistic effects of forest ecosystem services. Overall, this research provides practical guidance and methodological support for the protection of carbon sinks in forest land within township-scale spatial planning.

1. Introduction

The data from the Third National Land Survey reveal that forest land comprises 60.96% of the total land area in Hunan Province [1], whereas cultivated land and construction land account for 17.39% and 10.34%, respectively. Thus, forest land represents a dominant proportion of the regional land. Within forest ecosystems, forest land serves as a critical terrestrial carbon sink due to its high efficiency in biomass accumulation and carbon sequestration [2,3]. However, as farmland protection policies are implemented and urbanization in township areas is accelerated [4,5], forest land has been quickly converted into agricultural and construction land [6,7,8]. This transition not only significantly alters the area, structure, and ecological function of forest land, but also renders land use change a major driver of forest carbon sink degradation [9,10,11]. In order to maintain the stability of regional ecosystem carbon storage capacity, it is crucial to investigate the impact of land use change on forest carbon sinks at the township scale and formulate planning strategies to designate appropriate plots for forest land retention or conversion.
Existing research on the effective protection of forest carbon sinks amid land use transitions primarily follows two major directions. The first approach involves macro-level control of land use restructuring to minimize forest land conversion. This research paradigm advocates for incorporating forest protection principles into the early stages of territorial spatial planning [12,13,14,15] and aims to reduce demand for cultivated and construction land through the systematic optimization of land use structures [16], so as to minimize the risk of forest land encroachment [17]. On the one hand, the need for additional arable land can be reduced by improving the utilization efficiency of farmland [18,19,20], promoting agricultural intensification [21], and enhancing the multifunctionality of agricultural land. On the other hand, during urban and rural development planning, the encroachment of construction land on surrounding forest land can be effectively mitigated by optimizing spatial layouts [22,23,24], constraining urban expansion boundaries [25], and reinforcing policy-based regulations. The second approach involves the precise identification and prioritization of high-value forest plots based on carbon sink potential. This approach emphasizes the establishment of scientifically sound carbon sink assessment systems for forest land [26,27,28], identifies plots with high carbon sequestration capacity [29], and designates them as priority conservation areas. Guided by a carbon sink-oriented conservation strategy, such studies usually focus on quantifying the carbon sequestration performance of different forest land types and plots [30,31], and integrate data such as topography, vegetation types, and growth models to develop differentiated protection strategies and achieve precise management and allocation of forest land resources [32,33].
Despite the considerable progress made in research on forest carbon sink protection in the context of land use change, there are still several limitations. First, current studies often fail to adequately consider the inherent patterns and developmental demands of land use transitions. Most of the existing research adopts a carbon-centric perspective and emphasizes restrictions on the expansion of cultivated and construction land to prioritize the spatial preservation of forest land. However, in practical applications, these strategies often overlook the developmental needs of township areas undergoing urbanization. Cultivated land plays a vital role in ensuring food security [34,35], while construction land is directly linked to residents’ quality of life and industrial expansion [36,37], making their growth both necessary and rational, to some extent. Therefore, strategies aimed at suppressing the expansion of cultivated and construction land may conflict with local development goals and lack both feasibility and policy flexibility. Second, the conservation objectives for forest carbon sinks are often overly narrow and neglect the holistic nature of ecosystem services. Many studies focus exclusively on carbon sequestration as a singular ecological indicator and underscore carbon efficiency as the primary criterion for determining forest land retention or conversion. However, forest land fulfills multiple ecological roles beyond carbon storage alone. It serves not only as a critical habitat for biodiversity conservation, but also as a refuge for numerous plant and animal species [38]. In the forest land conversion process, disruptions to regional ecological stability often manifest through biodiversity loss and species homogenization [39], which ultimately compromises the resilience and multifunctionality of the entire ecosystem.
To address these research gaps, this paper proposes a forest carbon sink conservation approach that integrates the dynamics of township land use change with the ecological characteristics of regional ecosystems. Specifically, the first step is to acknowledge realistic development demands and define the disturbance boundaries of forest carbon sinks. This involves a systematic analysis of the historical evolution and periodic patterns of land use at the township scale to anticipate the extent to which land use change may alter forest land coverage. While enabling a clear delineation of the disturbed area and providing empirical support for setting scientifically grounded thresholds for forest land retention, this ensures preservation for essential ecological structures of forest land and the accommodation of rational land use demands. Second, a multi-objective optimization strategy for forest land planning should be developed to sustain the functional integrity of ecosystems. By proposing integrated objectives that balance carbon sink efficiency with biodiversity considerations, this approach transcends traditional “carbon-prioritized” or “single-metric” assessments. The objective is to identify optimal combinations of forest plots to be retained or converted. In the optimization process, plots with high carbon sequestration capacity are preserved to sustain the overall carbon storage function. At the same time, a spatially balanced distribution of diverse species is guaranteed to support ecosystem multifunctionality and long-term stability. Ultimately, this strategy aims to achieve synergistic enhancement of both carbon storage capacity and biodiversity conservation.
On the premise of not compromising the essential demands for construction and cultivated land, this study seeks to optimize the spatial configuration of forest land and unlock its ecological potential by imposing land use change constraints and integrating a planning scenario simulation mechanism. The aim is to maximize ecological benefits and minimize interference with local economic development. This forest land planning strategy not only demonstrates practical applicability, but also provides both technical support and valuable reference points for delineating forest conservation areas, formulating land consolidation policies, and promoting the integration of multiple planning frameworks in future township-level territorial spatial planning.

2. Study Area, Data, and Methods

2.1. Study Area

Located in a subtropical monsoon climate zone, Liushahe Town covers an administrative area of 140.56 km2. The long-term average annual temperature is 16.8 °C, with an extreme minimum temperature of 0.3 °C. The area experiences an average frost-free period of 274 days and annual average precipitation of 1358.3 mm. The terrain of the town generally slopes from east to west and north to south, with hilly landscapes dominating the topography. The northwestern region primarily consists of hilly and mountainous areas (Figure 1), where forest land is relatively concentrated, while the central and eastern areas are mainly designated for cultivation and construction. The predominant soil types in the area are red soil and paddy soil. The primary sources of forest biomass carbon sinks in Liushahe Town include Liquidambar formosana (sweetgum), Pinus massoniana (Masson pine), Phoebe zhennan (nanmu), Cunninghamia lanceolata (Chinese fir), Pinus elliottii (slash pine), Cinnamomum camphora (camphor tree), mixed broad-leaved species, other hardwood broad-leaved species, bamboo, and shrubs.

2.2. Data Sources

The topographic data utilized in this study were sourced from the Geospatial Data Cloud Platform of the Computer Network Information Center, Chinese Academy of Sciences (www.gscloud.cn (accessed on 21 April 2025)), specifically from the GDEMV3 dataset with a spatial resolution of 30 m. Land cover data from 1991 to 2021 were obtained from the China Land Cover Dataset (CLCD) released by Wuhan University for long short-term memory (LSTM) network modeling. Data on growth-influencing factors for backpropagation (BP) neural network computations, along with spatial data for 12,623 forest land plots in Liushahe Town, were acquired from the “2021 Unified Map of Forestry, Grassland, and Wetland Resources” survey. Land classification standards followed the Technical Regulations for the Third National Land Survey (TD/T 1055-2019) [40]. According to the Methodology for Carbon Sink Afforestation Projects, the minimum accounting period for carbon sink evaluation is 20 years. Hence, the period from 2021 to 2041 was adopted as the projection horizon.

2.3. Research Framework

By integrating spatiotemporal sequence analysis, machine learning modeling, and global optimization techniques, this study objectively examined the impacts of land use change on forest land during the development process and proposed a rational forest land planning strategy guided by multi-objective optimization (Figure 2).
First, this study forecasted changes in forest land area by identifying land use change trends. Based on historical land use data, a long short-term memory (LSTM) neural network model was applied to predict future evolution patterns of land use structure. The CLCD dataset from 1990 to 2021 served as the training set, in which time-series modeling was used to quantify the temporal variation characteristics of different land use types (i.e., forest land, cultivated land, construction land, and other land uses). Model training and back-testing were conducted to ensure prediction accuracy [41], and the 2041 land use structure was subsequently projected. This enabled a clear understanding of future area trends for each land category, particularly for forest land adjustments, and thereby provided essential data support for subsequent analyses.
Second, the carbon sink potential of individual forest land plots was assessed to quantify the carbon sequestration capacity of each plot over the study period. Forest land carbon sinks were primarily derived from biomass carbon [42], including tree, bamboo, and shrub carbon pools. Given the variation in dominant carbon-sequestering species across plots [43], a two-pronged modeling approach was adopted. On the one hand, a backpropagation (BP) neural network was employed to develop species-specific growth models for arboreal groups based on ten ecological factors: growth year, plot area, landform type, slope aspect, slope position, slope degree, soil type, soil thickness, origin, and planting density. This model estimated the carbon sink efficiency of dominant tree species (or groups) in each plot [44]. On the other hand, dimensionless constants derived from existing survey data were used to estimate bamboo and shrub carbon sequestration values during the study period [45,46].
Third, a forest land planning strategy was developed to integrate carbon sink efficiency and biodiversity balance. A genetic algorithm was applied to iteratively optimize the selection of forest plots to be retained or converted, so as to mitigate the impact of land use change on forest carbon sinks and overall ecosystem stability. Specifically, based on the projected changes in total forest area and the carbon sink estimates of individual plots, an evolutionary computation approach was applied to a multi-objective function that balances carbon efficiency and species diversity. Through multiple iterations, the globally optimal configuration of retained and converted plots was determined [47]. The resulting spatial planning scheme preserves sufficient carbon storage, ensures a balanced spatial distribution of species, and thus enhances ecosystem multifunctionality and long-term resilience.

2.4. Research Methods

2.4.1. Land Use Structure Prediction Method

The long short-term memory (LSTM) network, as a specialized type of recurrent neural network (RNN), was designed to address the limitations of traditional RNNs in handling long-term time series, particularly the issues of vanishing and exploding gradients [48]. By incorporating a gating mechanism, LSTM networks can dynamically determine which information to retain or discard. This capability enables them to effectively capture both short-term and long-term dependencies within temporal sequences, so that they are particularly well-suited for modeling the complex evolution of land use structures over time.
h t = o t t a n h f t C t 1 + i t C ~ t
In the above equation, h t denotes the hidden state at the current time step, representing the output of the LSTM; o t represents the output gate, controlling which parts of the cell state are exposed as output; f t denotes the forget gate, determining which information from the previous cell state is discarded; i t represents the input gate, regulating the amount of new information added to the cell state; C ~ t is the candidate cell state, representing potential new content derived from the current input; C t 1 denotes the previous cell state, serving as the core component of long-term memory; tanh signifies the hyperbolic tangent activation function, mapping values to the range (−1, 1); and ⊙ denotes the element-wise (Hadamard) product operation.

2.4.2. Growth Model Construction for Arboreal Species (Groups)

The backpropagation (BP) neural network, renowned for its powerful multidimensional nonlinear mapping capabilities, exhibits strong performance in estimating the growing stock volume of arboreal species or species groups [49]. This neural network has been widely applied in regression analysis tasks. In this study, ten growth-influencing factors (i.e., growth year, plot area, landform type, slope aspect, slope position, slope degree, soil type, soil thickness, origin, and planting density) are used as input layer variables to construct a BP neural network-based growth model. The model is adopted to estimate the growing stock volume of tree species or species groups within each forest land plot.
The variance inflation factor (VIF) and tolerance values are key diagnostic tools for detecting multicollinearity among ecological variables. When the VIF exceeds 10, it suggests significant multicollinearity, which can compromise the model’s stability and interpretability. The tolerance value, which is the reciprocal of the VIF, provides an additional check for collinearity. Low tolerance values (typically below 0.1) indicate high collinearity, which could be problematic for model estimation. To ensure the model’s reliability, we evaluated metrics such as the mean absolute error (MAE), loss profiles, and VIF. MAE and loss profiles help to assess the model’s ability to capture nonlinear relationships and minimize prediction errors. Low VIF values, indicating minimal multicollinearity, and high tolerance values, suggesting low correlation between variables, collectively confirm the accuracy of the model’s predictions. These diagnostic metrics ensure stable, accurate, and reliable estimates of growing stock volume, which are essential for evaluating the carbon sink capacity of forest land plots.

2.4.3. Carbon Sink Estimation Method

In this study, regional carbon stock is estimated through volume-to-biomass conversion equations [50]. Subsequently, the carbon sink quantity is characterized by the difference in carbon stock between the beginning and end of the study period. Specifically, the calculation includes aboveground and belowground biomass carbon pools at the plot level, and excludes carbon pools from litterfall, deadwood, soil organic carbon, and harvested wood or bamboo products. Over the 20-year period of this study (2021–2041), the evaluation of forest land carbon sinks requires comprehensive consideration of dominant species and their biomass growth characteristics. In plots dominated by arboreal species, carbon sink estimates were obtained using species-specific growth models that incorporate ecological factors, combined with volume-to-biomass conversion equations. In plots dominated by bamboo and shrub species, a fixed maximum constant method was applied alongside biomass equations to accommodate their discontinuous biomass accumulation patterns.
C j , t = a V b 1 + R j C F j A j , t 44 12
In the equation, C j , t denotes the carbon stock of vegetation type j in year t ; V represents the per-unit-area growing stock volume in year t ; a   and   b are biomass conversion parameters specific to vegetation type j ; R j is the ratio of belowground to aboveground biomass for vegetation type j ; C F j is the carbon content coefficient of biomass for vegetation type j ; A j , t denotes the area covered by vegetation j ; and 44 12 is the molecular weight ratio of C O 2 to C .
W j , s = C j , t C j , t 1
In the equation, W j , s denotes the carbon sink amount of vegetation type j ; C j , t represents the carbon stock of vegetation j at time t (the end of the study period); and C j , t 1 represents the carbon stock of vegetation j at time t 1 (the beginning of the study period).

2.4.4. Diversity-Equilibrium Evaluation Method

The Shannon Index is commonly used for measuring species diversity within a given area [51]. Unlike the traditional Shannon Index, which is based solely on species count, this study employs a spatially weighted version that accounts for species distribution area. This modified index captures the relative spatial distribution of different species across the study area and provides a more accurate assessment of biodiversity levels within the forest ecosystem. Apart from that, it offers deeper insights into the spatial equilibrium of species distribution, and thus establishes a quantitative foundation for optimizing carbon enhancement strategies. For computational simplification, bamboo and shrubs are each treated as a single species.
H = i = 1 S A i A t o t a l ln A i A t o t a l
In this equation, H denotes the Shannon diversity index; S represents the total number of species; A i refers to the distribution area of the i -th species; and A t o t a l indicates the total area of all species combined.

2.4.5. Forest Land Spatial Planning Method

The genetic algorithm (GA) is an optimization algorithm that simulates the natural selection process. By mimicking biological evolutionary operations such as selection, crossover, and mutation, the GA can explore the solution space to identify the global optimum [52]. In the context of forest land spatial planning, the genetic algorithm is applied to optimize the configuration of different plot combinations in order to achieve an optimal balance between carbon sink efficiency and biodiversity.

3. Results and Analysis

3.1. Land Use Change Trends

3.1.1. Stability of the LSTM Model

During training, the LSTM model demonstrated high stability and optimal performance. Both training and validation losses decreased steadily as the epoch count increased (Figure 3). In the initial phase, losses declined rapidly, indicating that the model quickly adapted to land-use change characteristics and effectively captured dynamic patterns in the data. As training proceeded, the loss curves gradually leveled off; by approximately 100 epochs, loss values had stabilized, indicating convergence of model parameters toward an optimal state. Additionally, the small difference between training and validation losses suggests consistent performance across datasets, without significant overfitting or underfitting. These results reflect good generalization ability in capturing the spatiotemporal features of land-use change, enabling reliable prediction of future trends. Residual analysis further confirmed model stability: residuals were generally small and evenly distributed, with no systematic bias or outliers, indicating that predictions closely matched underlying land-use dynamics. Therefore, the LSTM model not only effectively captures the temporal evolution of land use, but also provides high stability and reliability, offering robust support for forecasting future land-use transitions.

3.1.2. Land Use Evolution Trends

The analysis of township-level land-use changes indicates substantial structural shifts between 2021 and 2041 (Figure 4). The forest land (Q1) area decreased from 68,586 ha in 2021 to 61,644.41 ha in 2041, while the cultivated land (Q2) area increased from 8507 ha to 91,630.61 ha. The construction land (Q3) area increased from 2018 ha to 2188.21 ha, and that of other land (Q4) increased from 503 ha to 714.77 ha. These changes reflect a pronounced transformation in land-use structure over the 20-year study period.
Forest land (Q1) exhibited an initial increase followed by a decline. Specifically, the forest land proportion rose from 35.63% in 1990 to a maximum of 57.45% in 1998; thereafter, it decreased to 43.92% by 2021. This pattern may reflect the impact of certain policy measures and ecological conditions. The rise between 1990 and 1998 corresponds to the implementation of conservation and afforestation programs, whereas the subsequent decline aligns with accelerated urbanization and increased demand for agricultural land. From 2021 to 2041, the forest land proportion is projected to decrease further to 39.47%, representing a total reduction of 6.25 km2, primarily converted to cultivated and construction land to support local economic development.
Cultivated land (Q2) followed an inverse trajectory, with an initial decrease followed by recovery. Specifically, its proportion declined from 63.23% in 1990 to 41.36% in 1998, then gradually rebounded, and is projected to reach 58.67% by 2041. This reversal closely reflects strong national policy support: instruments such as the Basic Farmland Protection Regulation and the “Storing Grain in the Land” strategy have prioritized farmland conservation and expansion through land consolidation and reclamation [53]. The upward trend in cultivated land thus demonstrates alignment between national agricultural policies and township-level land-use planning priorities.
Construction land (Q3) displayed a steady, continuous increase, rising from 0.73% in 1990 to a projected 1.40% in 2041. The expansion rate accelerated noticeably after 1997. Urbanization has been the primary driver of this growth; however, farmland protection policies have limited encroachment of construction land into cultivated areas. Consequently, most new construction land has been converted from marginal forest land and low-efficiency parcels. This trend underscores rapid urban expansion and evolving land-use transformation patterns.
Other land (Q4) remained relatively stable, rising marginally from 0.40% in 1990 to 0.46% in 2041. This minimal change indicates a slow increase in demand for this land-use category and underscores the nuanced complexity of spatial allocation within township-level planning.

3.2. Carbon Sink Estimation of Forest Land Plots

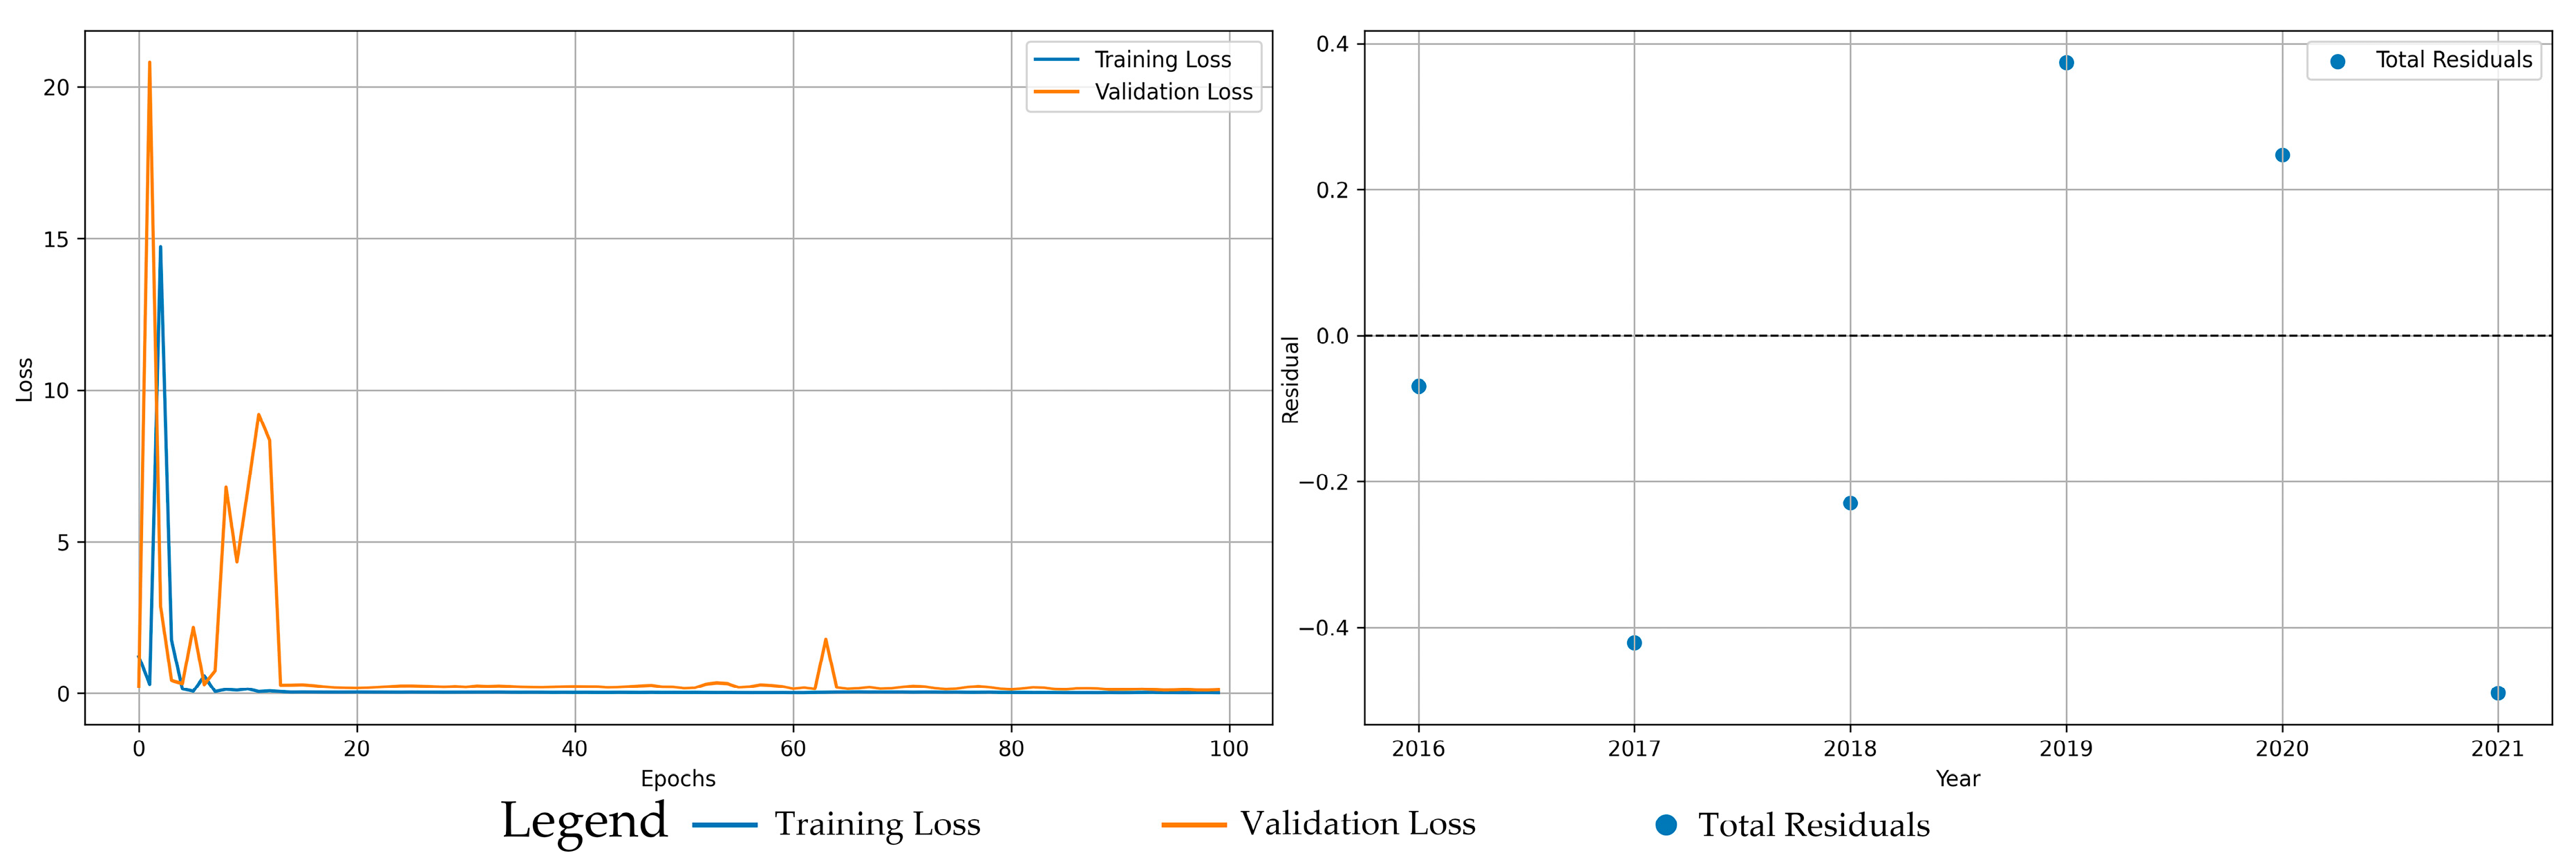
3.2.1. Stability of the Growth Model for Arboreal Species (Groups)

A growth model incorporating feature-encoded ecological factors was developed to estimate the carbon sink capacity of tree species or species groups based on growing stock volume (Table 1). The feature encoding step converted categorical ecological variables into numerical representations, thereby enhancing the model’s ability to detect underlying patterns.
According to the calculation results (Table 2), all ecological factors had VIF values below 10, which suggests minimal multicollinearity issues among these variables and ensures the model’s reliability. For example, the VIF of growth stage was 2.996, and the VIF of plot area was 1.210. These values indicate low correlations between variables and guarantee the stability and accuracy of the model in estimating the carbon sink capacity of forest plots. Additionally, the tolerance values further support the model’s reliability. For instance, the tolerance for landform is 0.789, and for planting density, it is 0.324. These values confirm that the variables are not highly correlated and that the model is stable and robust in estimating carbon sequestration potential.
The MAE profile and training/validation loss curves of the BP neural network demonstrate high stability and accuracy across species groups (Figure 5). The MAE values ranged from 0.06 to 0.10, and the training and validation losses decreased steadily over epochs. These results indicate effective capture of nonlinear relationships among ecological factors and dynamic growth patterns of the examined tree species or species groups.
Specifically, the model had low prediction errors for Liquidambar formosana, Phoebe zhennan, and Pinus elliottii, with MAE values of 0.06, showing good fitting performance. The errors were slightly higher for mixed broad-leaved species and Cunninghamia lanceolata, with MAE values of 0.08 and 0.10, respectively, but remained within acceptable limits. The training and validation loss curves also reflect the model’s strong convergence and robustness, with both losses stabilizing as training progressed, indicating reliable generalization.
Overall, the BP neural network model provided consistently high-precision predictions of growing stock volume under complex environmental conditions, demonstrating strong generalization capability. The inclusion of both MAE and loss profiles confirmed the model’s ability to minimize prediction errors and adapt to varying ecological conditions. This robustness ensures applicability across forest plots with diverse ecological conditions and enhances the practical utility of growing stock estimation for tree species or species groups.

3.2.2. Carbon Sink Assessment of Forest Land Plots

The results reveal significant spatial heterogeneity in dominant species, area, and carbon sink capacity across forest land plots during the study period (Figure 6). Even plots dominated by the same species showed considerable variation in carbon sink performance, driven by local microenvironmental differences such as landform and soil depth. For example, plots #5020 and #5025, both dominated by Pinus massoniana and similar in area, differed substantially in their carbon sink capacity over 20 years. Plot #5020 demonstrated a cumulative carbon sink 128.85% greater than that of plot #5025, suggesting that plot #5020 has a higher carbon value and should be prioritized for retention, whereas plot #5025 may be considered for conversion. Similarly, among shrub-dominated plots #5003, #5004, #5010, and #5018, plot #5004 exhibits superior carbon sink performance and is thus recommended for preferential conservation, while the others may be considered for conversion, provided that biodiversity is not negatively affected.
In terms of per-unit-area carbon sink capacity by dominant species over the study period, the values are as follows: Pinus elliottii: 0.0097 tCO2e/m2, bamboo: 0.0085 tCO2e/m2, Cunninghamia lanceolata: 0.0082 tCO2e/m2, mixed broad-leaved species: 0.0079 tCO2e/m2, Liquidambar formosana: 0.0077 tCO2e/m2, Pinus massoniana: 0.0076 tCO2e/m2, other hardwood broad-leaved species: 0.0058 tCO2e/m2, Cinnamomum camphora: 0.0051 tCO2e/m2, Phoebe zhennan: 0.0039 tCO2e/m2, and shrubs: 0.0032 tCO2e/m2.
These results indicate that forest plots in Liushahe Town dominated by Pinus elliottii, bamboo, and Cunninghamia lanceolata possess markedly higher carbon sink potential compared with plots dominated by Phoebe zhennan or shrubs. Shrub-dominated plots exhibit substantially lower carbon sequestration efficiency than those dominated by trees or bamboo, reflecting inherent limitations in carbon storage capacity. However, shrub-dominated stands should not be deprioritized solely on the basis of carbon efficiency, as they play a critical role in maintaining biodiversity and ecological resilience.

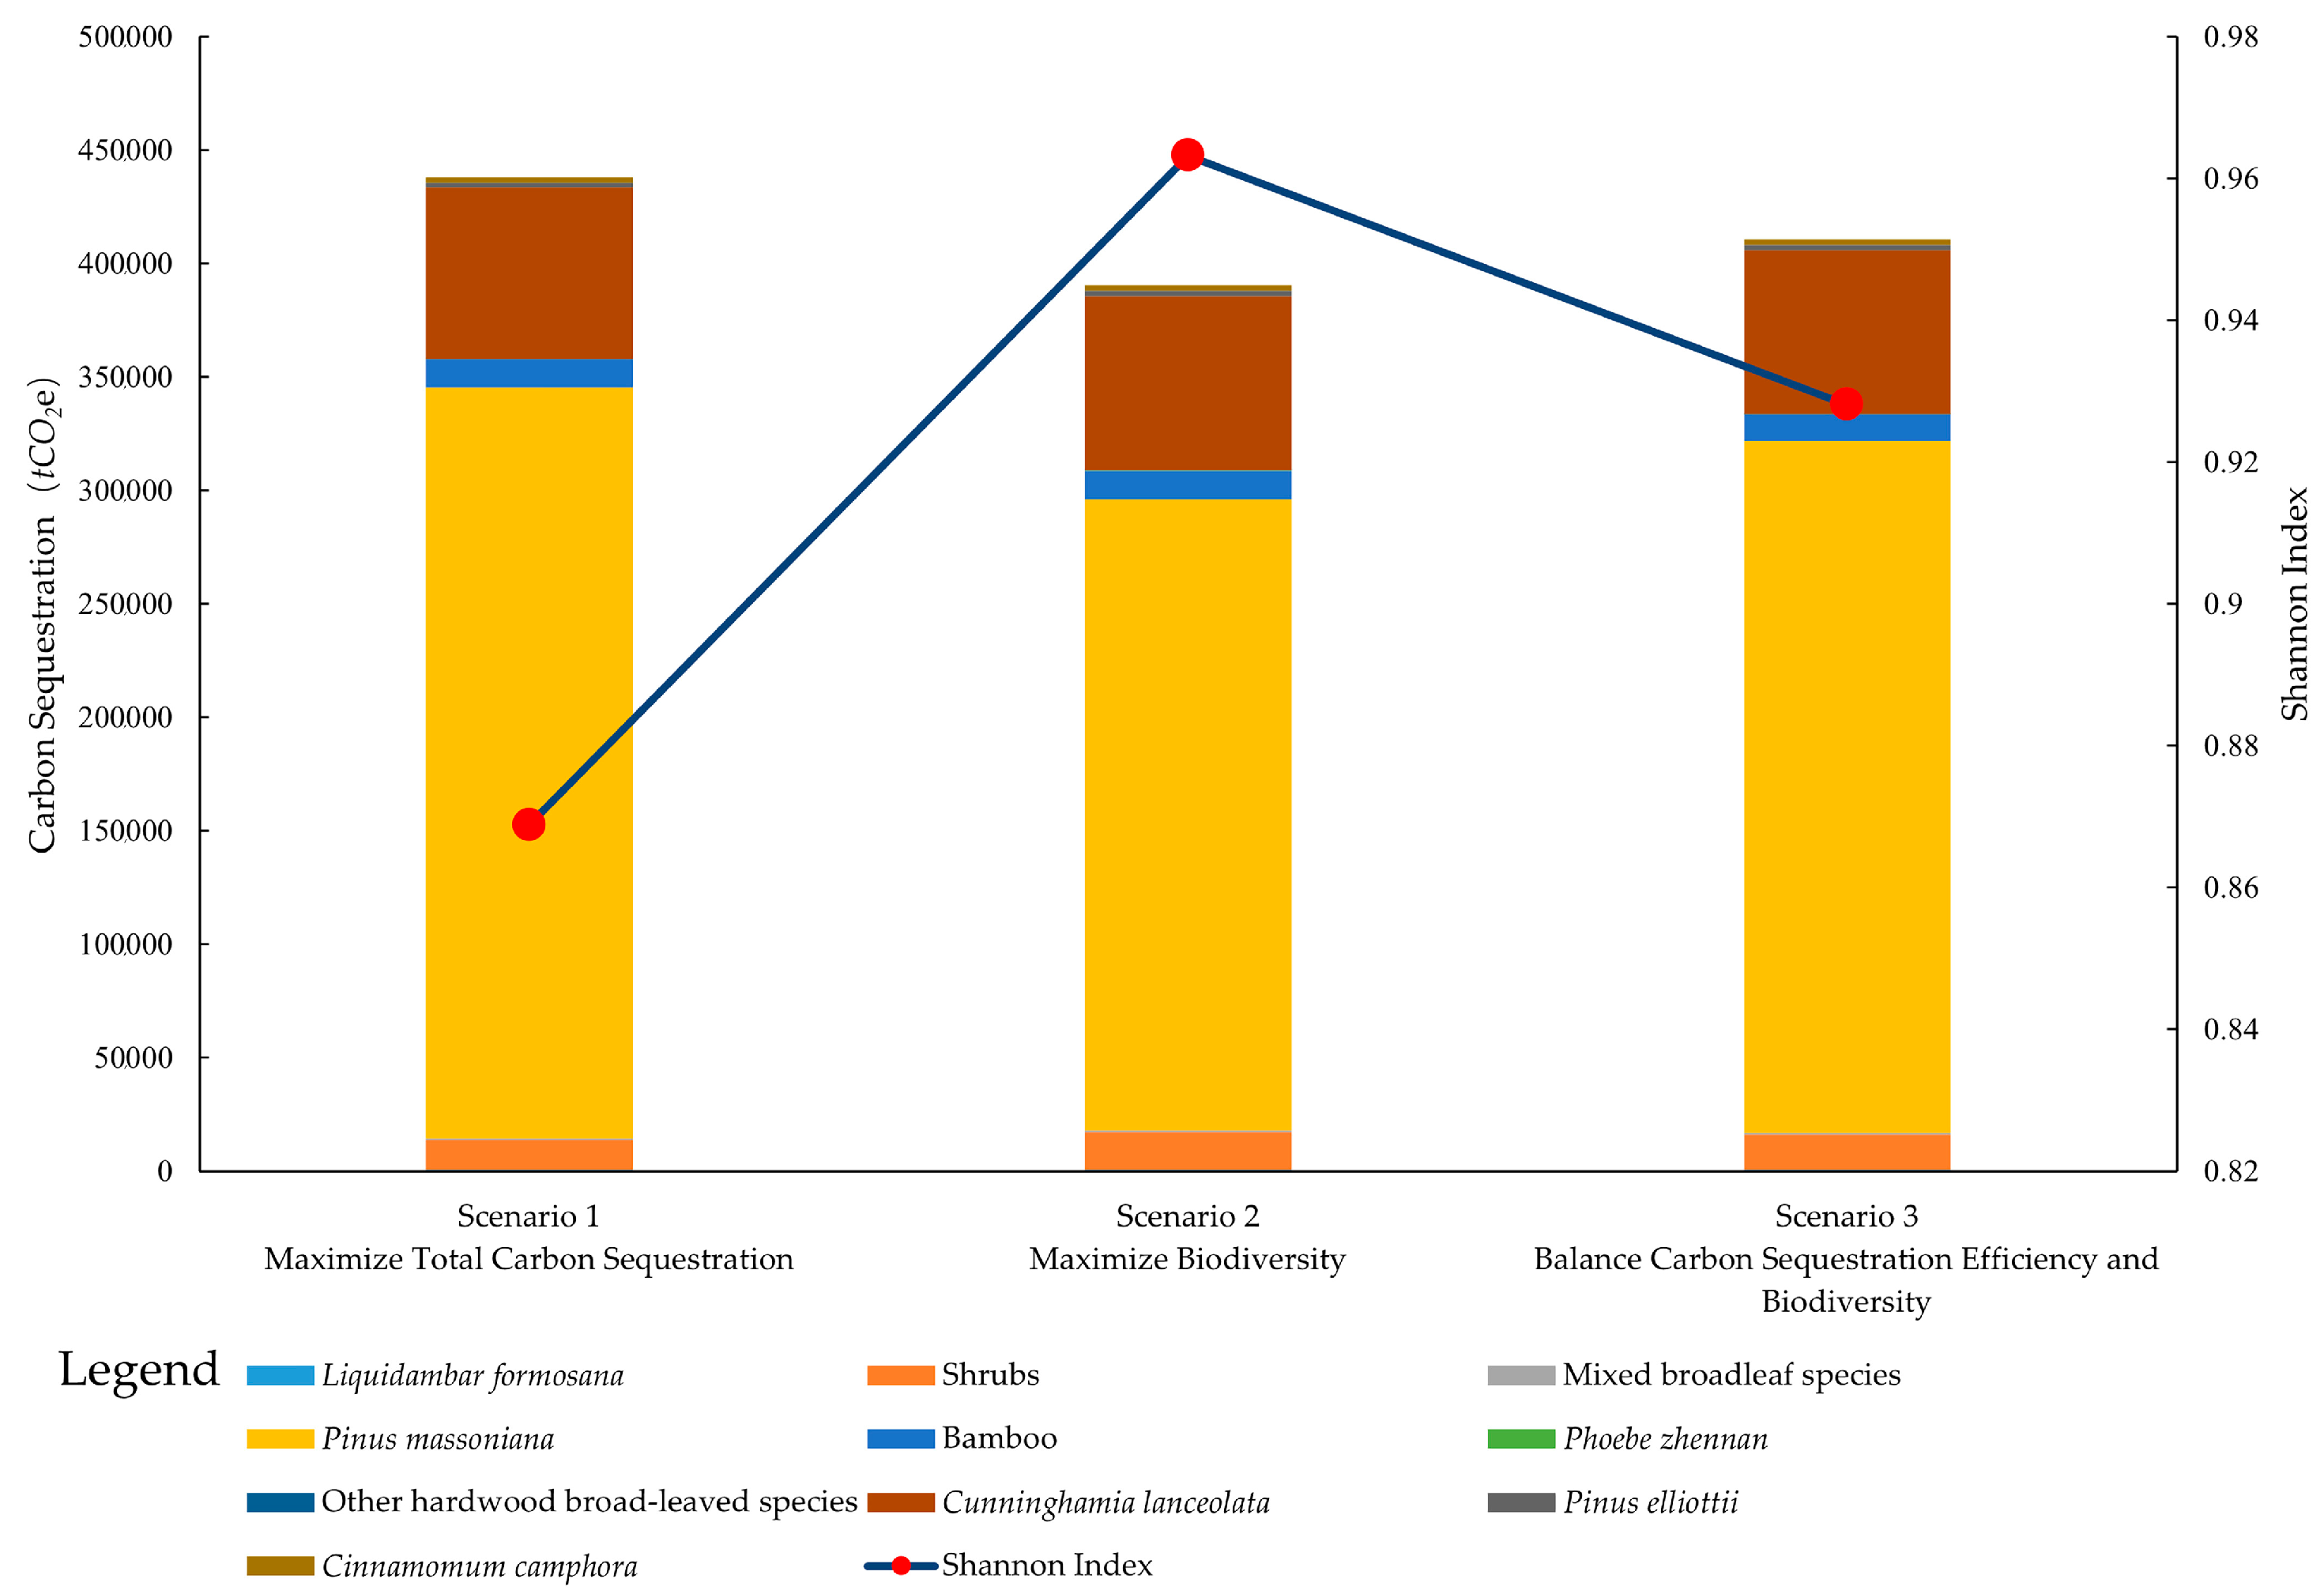
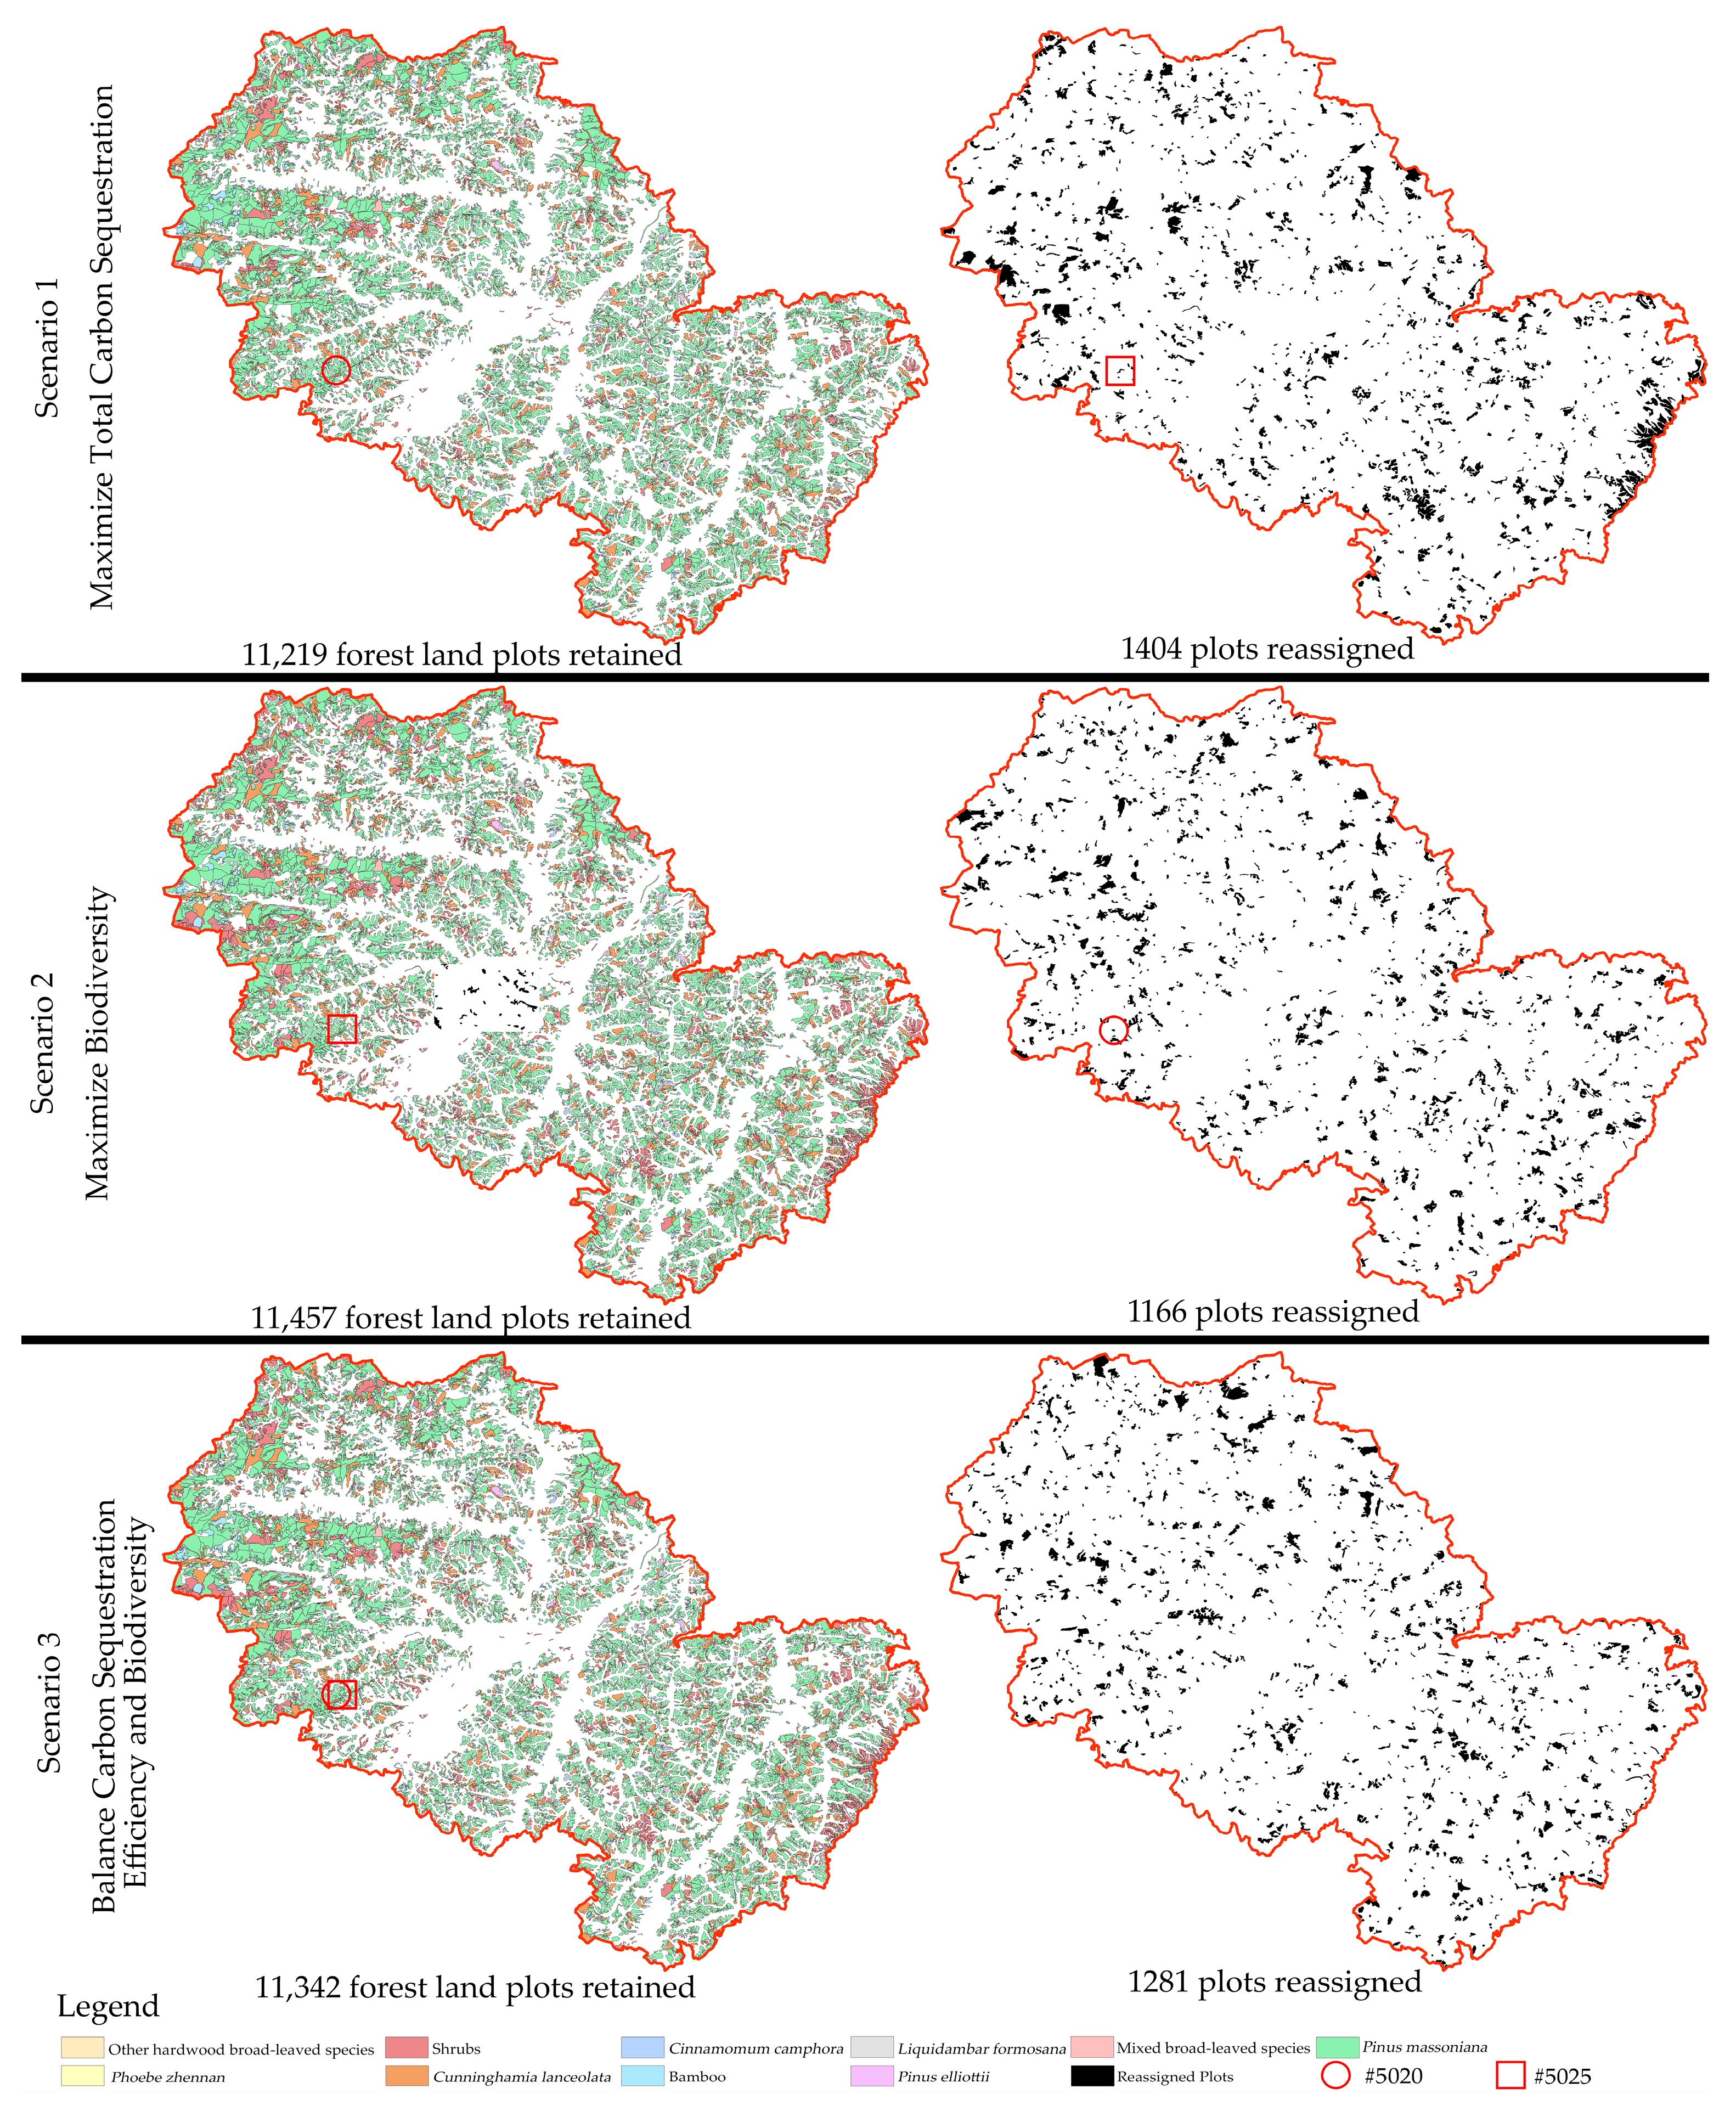
3.3. Optimization Process for Balancing “Carbon Sink Efficiency–Biodiversity Equilibrium”

Projected land-use trends indicate that forest land area will decline from 61.73 km2 in 2021 to 55.48 km2 by 2041, representing 89.88% of the 2021 extent. Accordingly, planning for the existing 12,623 forest land plots should limit the retained area to no more than 89.88% of the current total to accommodate future township development requirements.
A genetic algorithm was applied for 1000 iterations of evolutionary optimization to develop a forest land planning scheme balancing carbon sink efficiency and biodiversity (Figure 7). In each generation, 3000 candidate plot combinations competed. The Shannon index initially declined from 0.8940 at generation 1 to a minimum of 0.8880 at generation 3, then increased to 0.9027 by generation 9. Following minor fluctuations, the index rose steadily to a peak of 0.9282 at generation 549 and stabilized at approximately 0.9281 thereafter. This pattern indicates that the genetic algorithm progressively optimized species composition, thereby enhancing biodiversity over successive generations.
A gradual increase in carbon sink volume was observed throughout the evolutionary process. The initial carbon sink value of 408,183.37 tCO2e rose steadily across generations, reaching 409,024.07 tCO2e by generation 14 and 410,174.35 tCO2e by generation 362. The carbon sink volume peaked at 410,526.96 tCO2e in generation 685 and then stabilized. These results indicate that individuals with higher fitness, optimized for both the Shannon index and carbon sink volume, were preferentially retained in subsequent generations, guiding the population toward convergence on a globally optimal solution.
The final result shows that the genetic algorithm found a reasonable trade-off between biodiversity and carbon sequestration at generation 685. At this point, 11,342 forest plots were retained, achieving a Shannon index of 0.9281 and a total carbon sink of 410,526.96 tCO2e. This optimal solution not only maximized carbon sink efficiency, but also preserved biodiversity with minimal loss, representing an ideal balance between ecological productivity and diversity.

3.4. Comparison of Three Forest Land Planning Scenarios

To evaluate the effectiveness of different forest land planning strategies, this study compares three distinct scenarios:
  • Scenario 1: Maximization of carbon sink volume as the sole objective;
  • Scenario 2: Maximization of biodiversity (Shannon index) as the sole objective;
  • Scenario 3: Integration of carbon sink efficiency and biodiversity equilibrium as a multi-objective optimization strategy.
From the perspective of total regional carbon sink (Figure 8), during 2021–2041, the carbon sink volumes under Scenarios 1 to 3 were 438,143.41 tCO2e, 390,423.79 tCO2e, and 410,526.96 tCO2e, respectively. As demonstrated by these results, Scenario 1, which focuses exclusively on carbon sequestration, achieves the highest total carbon storage and significantly surpasses the other two scenarios. However, this outcome is primarily driven by the preferential retention of plots dominated by species with high biomass growth and strong carbon sequestration potential, which may compromise long-term ecological stability.
In contrast, Scenario 2, which targets the highest Shannon index, records the lowest total carbon sink, suggesting that maximization of biodiversity does not inherently ensure high carbon sequestration. This illustrates a clear trade-off between ecological diversity and carbon sequestration capacity. Scenario 3, as the result of multi-objective optimization, achieves a balanced outcome by delivering approximately 5.15% more carbon than Scenario 2 and sacrificing only 6.30% compared to the carbon-maximizing Scenario 1. Obviously, the integrated planning is effective in harmonizing ecosystem services.
Regarding biodiversity, the Shannon indices under Scenarios 1 through 3 are 0.8688, 0.9632, and 0.9281, respectively, showing an inverse trend relative to carbon sink values. Scenario 2, which ignores carbon efficiency, achieves an almost ideal level of structural complexity by maximizing the proportional area distribution among different species, triggering the highest biodiversity. Despite achieving the highest carbon volume, Scenario 1 predominantly retains high-carbon homogeneous plots, resulting in a lower Shannon index. This implies reduced ecological heterogeneity, which could increase long-term risks such as pest outbreaks and declined climate resilience.
Although Scenario 3 is slightly less diverse than Scenario 2, it significantly outperforms Scenario 1 in biodiversity metrics, successfully balances carbon storage needs with biodiversity conservation, and thus reinforces overall ecosystem functionality. As confirmed by these findings, multi-objective genetic algorithm optimization provides a robust pathway for achieving coordinated and sustainable ecosystem development.
From the perspective of spatial distribution (Figure 9), Scenario 1 retains 11,219 forest plots, Scenario 2 retains 11,457 plots, and Scenario 3 retains 11,342 plots. Despite the relatively small differences in the number of retained and removed plots among the three scenarios, the spatial layout reveals distinct structural variations.
In Scenario 1, the 1404 removed plots are primarily concentrated in marginal and fragmented areas, while the retained plots favor large, contiguous blocks. This reflects the preference of the carbon-efficiency-driven strategy for spatially coherent and high-performing species compositions. However, this strategy may lead to increased local species homogenization, potentially compromising ecosystem diversity.
In contrast, Scenario 2 demonstrates a more spatially balanced configuration. Its 1166 removed plots are more diffusely distributed, which can help to preserve ecological connectivity and landscape heterogeneity. That is to say, biodiversity-oriented optimization translates spatially into broader coverage and greater structural dispersion, thereby enhancing habitat diversity and ecological resilience.
Scenario 3 combines features from both preceding strategies. With 1281 plots designated for removal, it not only avoids the risk of large-scale monoculture clustering typical of carbon-focused planning, but also maintains a degree of spatial cohesion among ecological patches. This configuration supports a balanced synergy between ecological integrity and functional efficiency.
Overall, Scenario 3 achieves a carefully considered trade-off among plot quantity, distribution breadth, and spatial continuity. It represents a more robust and ecologically adaptive forest land planning strategy, and provides a spatial pattern that supports both environmental sustainability and land use efficiency.

4. Discussion

4.1. Suitability of the Balanced Strategy

In comparison with current research, our approach—the integration of carbon sink efficiency and biodiversity equilibrium as a multi-objective optimization strategy—demonstrates significant advantages in balancing ecological benefits with local development needs. Existing studies often focus on single-objective optimization, particularly in maximizing carbon sink capacity, but the importance of biodiversity conservation is neglected. In contrast, our study successfully addresses both objectives through the incorporation of multi-objective optimization. This approach, especially in forest land planning with genetic algorithms, improves carbon sink capacity and biodiversity, reducing the ecological loss from carbon-only strategies.
For example, Shenzhen adopted a carbon-prioritized model using remote sensing and LULC change analysis to improve forest carbon storage [54], but biodiversity metrics were absent. Similarly, Hangzhou focused on carbon sequestration potential by afforestation and reforestation initiatives without considering species diversity [55]. In contrast, our method integrates ecological diversity as an optimization goal, ensuring resilience and functional integrity.
On this basis, the forest land planning strategies presented in this paper further clarify the rationale behind the selection of this framework. Particularly, the reasons for the need to balance carbon sink efficiency and biodiversity within a multi-objective optimization framework are explained. Through the selection and optimization of forest plots with high carbon sink potential and maintenance of ecological diversity, the optimization plan not only enhances carbon sequestration, but also ensures synergistic ecosystem services. Additionally, these strategies are practically applicable, which provides significant value in both enhancing carbon sink capacity and protecting biodiversity, especially under the condition that forest land protection does not compromise local economic development needs.
The integration of carbon sink efficiency and biodiversity equilibrium as a multi-objective optimization strategy implies that, in practical applications, flexible and efficient forest land planning schemes can be developed based on the specific ecological characteristics, carbon sink efficiency, and biodiversity requirements of forest plots. While enhancing carbon sink capacity, this strategy strengthens the long-term resilience of regional ecosystems.

4.2. Integration of the Balanced Strategy with Policy Implementation

In recent years, Liushahe Town has made steady progress in implementing the dual carbon strategy (carbon peak and carbon neutrality goals), particularly through policy initiatives focused on forest protection and land use. According to the land use policies of Liushahe Town, the municipality is accelerating the urbanization process and gradually improving forest quality, with an emphasis on forest protection and sustainable use. Specifically, while implementing forest protection measures, Liushahe Town has started to focus on how to achieve multiple ecological benefits through the protection of forest carbon sinks, including carbon sequestration, biodiversity, and biological habitats.
Notably, while promoting the improvement of forest quality, Liushahe Town is also considering how to optimize land use structures, lower the encroachment of construction land on forests, and mitigate the loss of forest carbon sinks caused by land development through scientific forest planning and optimization measures. Liushahe Town can achieve a balance between carbon sinks and biodiversity by adopting the integration of carbon sink efficiency and biodiversity equilibrium as a multi-objective optimization strategy proposed in this paper. While supporting regional biodiversity conservation, this approach ensures that the forest ecosystem contributes to supporting carbon neutrality goals, so that Liushahe Town can more efficiently achieve the dual carbon goals during future urban development.

4.3. Potential Applications

Although Liushahe Town is used as an example to validate this study, the LSTM modeling and genetic algorithm methods employed have broad applicability, especially in regions with similar land use dynamics. These methods can effectively provide optimized solutions for forest carbon sink protection. For instance, regions such as the Yangtze River Economic Belt and the Pearl River Delta suffer from similar land use transformation pressures. By adopting the methods presented in this paper, these regions can receive scientific support for their forest carbon sink protection strategies.
This approach, which is helpful for identifying optimal forest land planning solutions, can be flexibly adjusted based on specific ecological, social, and economic contexts. Within the multi-objective optimization framework, this method provides significant technical support and theoretical foundations for global forest carbon sink and biodiversity conservation efforts.

4.4. Limitations and Future Improvements

The protection of forest carbon sinks and biodiversity, as a critical pillar of regional sustainable development, is central to ecosystem service management. Although this study has made initial progress in exploring forest carbon sink conservation strategies under land use change, several aspects still need to be further investigated and refined: Firstly, more in-depth exploration is needed to investigate the challenge of reconciling regional development demands with ecological protection. Although this study elaborates the historical evolution and current trends of land use change in its modeling approach and employs multi-objective optimization to balance ecological and developmental goals, tensions between land policy and local economic development are still difficult to resolve entirely [56]. In particular, under the dual pressures of rigid farmland demand and urban expansion, some high-carbon-sink and high-ecological-value forest plots may still be subject to conversion. In future research, policy constraint mechanisms and trade-off assessments (e.g., ecological compensation schemes and transferable land use quota systems) should be incorporated to enhance the practical feasibility and adaptive capacity of forest land planning strategies. Secondly, the forest carbon sink evaluation framework requires multidimensional expansion and dynamic updates. This study conducts plot-level estimation of biomass-based carbon sinks based on static species distributions and average carbon efficiency. However, this approach may not adequately capture the impacts of future climate change, forest degradation, or ecological restoration on carbon sink capacity. In future research, remote sensing monitoring, long-term ecological datasets, and climate simulation models should be integrated to expand the scope of carbon sink assessment. At the same time, real-time monitoring and dynamic modeling will be essential for forecasting and addressing spatiotemporal variations in forest carbon performance. Additionally, the biodiversity analysis conducted in this study primarily relies on the Shannon index as the sole diversity metric. Though this index provides a useful measure of species richness and evenness, it may not fully capture the complexity of biodiversity dynamics. In order to ensure a more comprehensive understanding of ecosystem health and resilience, future research will explore the application of other diversity indices, such as the Simpson index or the Berger–Parker index. The incorporation of multiple biodiversity indices will provide a clearer picture of how different forest management strategies affect species diversity across various spatial scales. This will be a key focus for subsequent studies.

5. Conclusions

From the perspectives of land use structural evolution and ecological co-regulation, this study examined the disturbances to forest land carbon sinks and ecosystem functions caused by land use change and proposed corresponding planning strategies. Additionally, an integrated technical framework that combines temporal prediction, carbon sink estimation, and multi-objective optimization has been constructed to systematically demonstrate the spatial evolution trends and carbon sink performance dynamics of forest land under future development scenarios. The findings derived from this framework have directly informed the proposed forest land planning strategies that balance regional development needs with ecological conservation goals.
(1) Land use change remarkably disrupts forest land scale and carbon sink capacity. Projections based on the LSTM model forecast a decrease in forest land area to 89.88% of the 2021 level by 2041, which is driven mainly by the expansion of cultivated and construction land. This disruption underscores the inadequacy of traditional “land expansion restriction” strategies. As suggested by the findings, forward-looking planning, based on predictive modeling, is essential for ensuring flexibility in development and supporting spatial optimization and the ecological functionality of forest land.
(2) As forest carbon sink capacity exhibits significant spatial heterogeneity, differentiated conservation strategies are needed. The application of the BP neural network-based growth model reveals substantial variability in carbon sink efficiency across forest plots. Even plots with the same dominant species exhibit different carbon performances based on ecological factors, emphasizing the need for selective conservation. Moreover, the data support the conclusion that the prioritization of high-carbon-potential plots and removal of low-efficiency plots are crucial for enhancing forest resilience against disturbances caused by land use changes.
(3) The multi-objective optimization of “carbon sink efficiency–biodiversity equilibrium” can achieve synergistic enhancement of ecosystem services. By applying a genetic algorithm-based multi-objective optimization model, this study has successfully balanced carbon sink capacity and species diversity, even under the constraint of reduced forest land area. As demonstrated by the empirical results, this multi-objective approach outperforms single-objective strategies in terms of both ecosystem structure and carbon performance, triggering better ecological resilience and long-term sustainability in planning.

Author Contributions

Conceptualization, Y.Z. and F.X.; methodology, Y.Z.; software, Y.Z.; validation, Y.Z.; formal analysis, Y.Z.; investigation, Y.C.; resources, F.X.; data curation, Y.Z.; writing—original draft preparation, Y.Z.; writing—review and editing, Y.Z.; visualization, Y.Z.; supervision, F.X.; project administration, F.X. All authors have read and agreed to the published version of the manuscript.

Funding

This work was supported by Natural Science Foundation of Hunan Province, China (Grant No. 2025JJ50234).

Data Availability Statement

The data are not publicly available due to privacy.

Conflicts of Interest

The authors declare no conflicts of interest.

References

  1. Li, Z.; Chang, J.; Li, C.; Gu, S. Ecological Restoration and Protection of National Land Space in Coal Resource-Based Cities from the Perspective of Ecological Security Pattern: A Case Study in Huaibei City, China. Land 2023, 12, 442. [Google Scholar] [CrossRef]
  2. Khan, K.; Khan, S.N.; Ali, A.; Khokhar, M.F.; Khan, J.A. Estimating Aboveground Biomass and Carbon Sequestration in Afforestation Areas Using Optical/SAR Data Fusion and Machine Learning. Remote Sens. 2025, 17, 934. [Google Scholar] [CrossRef]
  3. Zhou, X.; Wang, J.; Tang, L.; He, W.; Li, H. Impact of Land Use Change on Carbon Storage Dynamics in the Lijiang River Basin, China: A Complex Network Model Approach. Land 2025, 14, 1042. [Google Scholar] [CrossRef]
  4. Chen, B.; Yao, N. Evolution Characteristics of Cultivated Land Protection Policy in China Based on Smith Policy Implementation. Agriculture 2024, 14, 1194. [Google Scholar] [CrossRef]
  5. Li, L.; Zheng, S.; Zhao, K.; Shen, K.; Yan, X.; Zhao, Y. The Quantitative Impact of the Arable Land Protection Policy on the Landscape of Farmland Abandonment in Guangdong Province. Remote Sens. 2022, 14, 4991. [Google Scholar] [CrossRef]
  6. Wang, Q.; Bai, X. Spatiotemporal Characteristics and Driving Mechanisms of Land-Use Transitions and Landscape Patterns in Response to Ecological Restoration Projects: A Case Study of Mountainous Areas in Guizhou, Southwest China. Ecol. Inform. 2024, 82, 102748. [Google Scholar] [CrossRef]
  7. Yu, T.; Jia, S.; Dai, B.; Cui, X. Spatial Configuration and Layout Optimization of the Ecological Networks in a High-Population-Density Urban Agglomeration: A Case Study of the Central Plains Urban Agglomeration. Land 2025, 14, 768. [Google Scholar] [CrossRef]
  8. Li, Y.; Ma, X.; Zhao, J.; Zhang, S.; Liu, C. Spatio-Temporal Evolution and Conflict Diagnosis of Territorial Space in Mountainous–Flatland Areas from a Multi-Scale Perspective: A Case Study of the Central Yunnan Urban Agglomeration. Land 2025, 14, 703. [Google Scholar] [CrossRef]
  9. Zhang, J.; Ding, H.; Xu, J.; Zheng, B. A Simulation-Based Prediction of Land Use Change Impacts on Carbon Storage from a Regional Imbalance Perspective: A Case Study of Hunan Province, China. Land 2024, 13, 1721. [Google Scholar] [CrossRef]
  10. Liu, J.; Hu, Y.; Feng, Z.; Xiao, C. A Review of Land Use and Land Cover in Mainland Southeast Asia over Three Decades (1990–2023). Land 2025, 14, 828. [Google Scholar] [CrossRef]
  11. Ye, C.; Deng, P.; Ke, C.; Fu, X.; Mi, J.; Zhou, L. A Framework for Assessing the Effectiveness of Carbon Storage Change During the Process of Land Consolidation. Land 2025, 14, 747. [Google Scholar] [CrossRef]
  12. Yang, M.; Wang, Z.; Zhang, Z.; Chen, P.; Zhao, D.; Cheng, E.; Wang, C.; Yan, Y. Pathways for Ecological Restoration of Territorial Space Based on Ecosystem Integrity: A Case Study of Approach to Protecting and Restoring Mountains, Rivers, Forests, Farmlands, Lakes, and Grasslands in Beijing, China. Ecol. Front. 2024, 44, 1214–1223. [Google Scholar] [CrossRef]
  13. You, Y.; Jiang, P.; Wang, Y.; Wang, W.; Chen, D.; Hu, X. Using Multi-Scenario Analyses to Determine the Driving Factors of Land Use in Inland River Basins in Arid Northwest China. Land 2025, 14, 787. [Google Scholar] [CrossRef]
  14. Xu, Y.; Liu, X.; Zhao, L.; Li, H.; Zhu, P.; Liu, R.; Wang, C.; Wang, B. Spatial and Temporal Analysis of Habitat Quality in the Yellow River Basin Based on Land-Use Transition and Its Driving Forces. Land 2025, 14, 759. [Google Scholar] [CrossRef]
  15. Chen, N.; Nie, W.; Fan, W. Simulation and Analysis of Changes in Carbon Storage and Ecosystem Services Against the Backdrop of Land Transfer: A Case Study in Lvzenong Park. Land 2025, 14, 694. [Google Scholar] [CrossRef]
  16. Xie, Y.; Dai, W.; Xiang, S.; Deng, H.; Wang, Z.; Li, Y.; Wang, Z.; Zhou, M.; Gao, M. Supply and Demand of Ecosystem Services and Their Interaction with Urbanization: The Case of Chengdu-Chongqing Urban Agglomeration. Urban Clim. 2024, 55, 101978. [Google Scholar] [CrossRef]
  17. Peng, Y.; Cheng, W.; Xu, X.; Song, H. Analysis and Prediction of the Spatiotemporal Characteristics of Land-Use Ecological Risk and Carbon Storage in Wuhan Metropolitan Area. Ecol. Indic. 2024, 158, 111432. [Google Scholar] [CrossRef]
  18. Hu, X.; Dong, C.; Zhang, Y. Impacts of Cropland Utilization Patterns on the Sustainable Use Efficiency of Cropland Based on the Human–Land Perspective. Land 2024, 13, 863. [Google Scholar] [CrossRef]
  19. Xu, Q.; Zhu, P.; Tang, L. Agricultural Services: Another Way of Farmland Utilization and Its Effect on Agricultural Green Total Factor Productivity in China. Land 2022, 11, 1170. [Google Scholar] [CrossRef]
  20. Zhang, Z.; Du, J.; Shen, Z.; El Asraoui, H.; Song, M. Effects of Modern Agricultural Demonstration Zones on Cropland Utilization Efficiency: An Empirical Study Based on County Pilot. J. Environ. Manag. 2024, 349, 119530. [Google Scholar] [CrossRef]
  21. Ndip, F.E.; Sakurai, T. Enhancing Agricultural Intensification through Contract Farming: Evidence from Rice Production in Senegal. Agric. Food Secur. 2025, 14, 6. [Google Scholar] [CrossRef]
  22. Wang, Y.; Lyu, J.; Xun, L.; Chuanhua, L.; Xiaonan, M.; Jiang, L.; Qiang, L.; Lina, Z.; Guan, Q. Using Zipf’s Law to Optimize Urban Spatial Layouts in an Urban Agglomeration Area. Ann. Am. Assoc. Geogr. 2024, 114, 1342–1364. [Google Scholar] [CrossRef]
  23. Zhou, C.; Wu, Y. A Planning Support Tool for Layout Integral Optimization of Urban Blue–Green Infrastructure. Sustainability 2020, 12, 1613. [Google Scholar] [CrossRef]
  24. Luan, C.; Liu, R.; Zhang, Q.; Sun, J.; Liu, J. Multi-Objective Land Use Optimization Based on Integrated NSGA–II–PLUS Model: Comprehensive Consideration of Economic Development and Ecosystem Services Value Enhancement. J. Clean. Prod. 2024, 434, 140306. [Google Scholar] [CrossRef]
  25. McManamay, R.A.; Vernon, C.R.; Chen, M.; Thompson, I.; Khan, Z.; Narayan, K.B. Dynamic Urban Land Extensification Is Projected to Lead to Imbalances in the Global Land-Carbon Equilibrium. Commun. Earth Environ. 2024, 5, 70. [Google Scholar] [CrossRef]
  26. Zhang, Y.; Zhang, Y.; Yang, J.; Wu, W.; Tao, R. Integrating System Dynamics, Land Change Models, and Machine Learning to Simulate and Predict Ecosystem Carbon Sequestration Under RCP-SSP Scenarios: Fusing Land and Climate Changes. Land 2024, 13, 1967. [Google Scholar] [CrossRef]
  27. Di Lallo, G.; De Notaris, C.; Chiriacò, M.V. Evaluating Natural Climate Solutions in Long-Term Climate Strategies: Opportunities for Enhanced Mitigation Across the European Union. Land 2025, 14, 825. [Google Scholar] [CrossRef]
  28. Bera, D.; Chatterjee, N.D.; Dinda, S.; Ghosh, S.; Dhiman, V.; Bashir, B.; Calka, B.; Zhran, M. Assessment of Carbon Stock and Sequestration Dynamics in Response to Land Use and Land Cover Changes in a Tropical Landscape. Land 2024, 13, 1689. [Google Scholar] [CrossRef]
  29. Hou, L.; Hu, H.; Liu, T.; Ma, C. Ecological Security Pattern Construction for Carbon Sink Capacity Enhancement: The Case of Chengdu Metropolitan Area. Sustainability 2025, 17, 4483. [Google Scholar] [CrossRef]
  30. Yu, Z.; Liu, S.; Li, H.; Liang, J.; Liu, W.; Piao, S.; Tian, H.; Zhou, G.; Lu, C.; You, W.; et al. Maximizing Carbon Sequestration Potential in Chinese Forests through Optimal Management. Nat. Commun. 2024, 15, 3154. [Google Scholar] [CrossRef]
  31. Tao, P.; Lin, Y.; Wang, X.; Li, J.; Ma, C.; Wang, Z.; Dong, X.; Yao, P.; Shao, M. Optimization of Green Spaces in Plain Urban Areas to Enhance Carbon Sequestration. Land 2023, 12, 1218. [Google Scholar] [CrossRef]
  32. Song, Z.; Shi, P.; Li, P.; Li, Z.; Niu, H.; Zu, P.; Cao, M.; Jia, Y. Effects of Forest Type on Carbon Storage in the Hilly Region of Loess Plateau, China. Front. For. Glob. Change 2024, 7, 1349047. [Google Scholar] [CrossRef]
  33. Guan, D.; Nie, J.; Zhou, L.; Chang, Q.; Cao, J. How to Simulate Carbon Sequestration Potential of Forest Vegetation? A Forest Carbon Sequestration Model across a Typical Mountain City in China. Remote Sens. 2023, 15, 5096. [Google Scholar] [CrossRef]
  34. Li, M.; Li, J.; Haq, S.U.; Nadeem, M. Agriculture Land Use Transformation: A Threat to Sustainable Food Production Systems, Rural Food Security, and Farmer Well-Being? PLoS ONE 2024, 19, e0296332. [Google Scholar] [CrossRef]
  35. Liang, C.; Penghui, J.; Wei, C.; Manchun, L.; Liyan, W.; Yuan, G.; Yuzhe, P.; Nan, X.; Yuewei, D.; Qiuhao, H. Farmland Protection Policies and Rapid Urbanization in China: A Case Study for Changzhou City. Land Use Policy 2015, 48, 552–566. [Google Scholar] [CrossRef]
  36. Zhang, X.; Han, H. Characteristics and Factors Influencing the Expansion of Urban Construction Land in China. Sci. Rep. 2024, 14, 16040. [Google Scholar] [CrossRef] [PubMed]
  37. Bai, J.; Jia, Z.; Sun, Y.; Zheng, C.; Wen, M. Multi-Scenario Simulation of Land Use Change Along with Ecosystem Service Value for the Lanzhou–Xining Urban Agglomeration. Land 2025, 14, 860. [Google Scholar] [CrossRef]
  38. Wang, L.; Wei, F.; Tagesson, T.; Fang, Z.; Svenning, J.-C. Transforming Forest Management through Rewilding: Enhancing Biodiversity, Resilience, and Biosphere Sustainability under Global Change. One Earth 2025, 8, 101195. [Google Scholar] [CrossRef]
  39. Viljur, M.-L.; Abella, S.R.; Adámek, M.; Alencar, J.B.R.; Barber, N.A.; Beudert, B.; Burkle, L.A.; Cagnolo, L.; Campos, B.R.; Chao, A.; et al. The Effect of Natural Disturbances on Forest Biodiversity: An Ecological Synthesis. Biol. Rev. 2022, 97, 1930–1947. [Google Scholar] [CrossRef]
  40. TD/T 1055-2019; Technical Regulation of the Third Nationwide Land Survey. Standards Press of China: Beijing, China, 2019.
  41. Zhao, X.; Wang, P.; Gao, S.; Yasir, M.; Islam, Q.U. Combining LSTM and PLUS Models to Predict Future Urban Land Use and Land Cover Change: A Case in Dongying City, China. Remote Sens. 2023, 15, 2370. [Google Scholar] [CrossRef]
  42. Ruehr, S.; Keenan, T.F.; Williams, C.; Zhou, Y.; Lu, X.; Bastos, A.; Canadell, J.G.; Prentice, I.C.; Sitch, S.; Terrer, C. Evidence and Attribution of the Enhanced Land Carbon Sink. Nat. Rev. Earth Environ. 2023, 4, 518–534. [Google Scholar] [CrossRef]
  43. Tadese, S.; Soromessa, T.; Aneseye, A.B.; Gebeyehu, G.; Noszczyk, T.; Kindu, M. The Impact of Land Cover Change on the Carbon Stock of Moist Afromontane Forests in the Majang Forest Biosphere Reserve. Carbon. Balance Manag. 2023, 18, 24. [Google Scholar] [CrossRef] [PubMed]
  44. Cheng, H.; Wang, Y.; Shan, L.; Chen, Y.; Yu, K.; Liu, J. Mapping Fine-Scale Carbon Sequestration Benefits and Landscape Spatial Drivers of Urban Parks Using High-Resolution UAV Data. J. Environ. Manag. 2024, 370, 122319. [Google Scholar] [CrossRef]
  45. García, J.C.C.; Arango, A.M.A.; Trinh, L. The Potential of Bamboo Forests as a Carbon Sink and Allometric Equations for Estimating Their Aboveground Biomass. Environ. Dev. Sustain. 2024, 26, 20159–20187. [Google Scholar] [CrossRef]
  46. Li, L.; Zayiti, A.; He, X. Evaluating the Stand Structure, Carbon Sequestration, Oxygen Release Function, and Carbon Sink Value of Three Artificial Shrubs alongside the Tarim Desert Highway. Forests 2023, 14, 2137. [Google Scholar] [CrossRef]
  47. Nadirgil, O. Carbon Price Prediction Using Multiple Hybrid Machine Learning Models Optimized by Genetic Algorithm. J. Environ. Manag. 2023, 342, 118061. [Google Scholar] [CrossRef]
  48. Ceni, A. Random Orthogonal Additive Filters: A Solution to the Vanishing/Exploding Gradient of Deep Neural Networks. IEEE Trans. Neural Netw. Learn. Syst. 2025, 36, 1–14. [Google Scholar] [CrossRef]
  49. Yao, J.; Zhao, C.; Hu, X.; Jin, Y.; Li, Y.; Cai, L.; Li, Z.; Li, F.; Liang, F. A Method for Estimating Tree Growth Potential with Back Propagation Neural Network. Sustainability 2025, 17, 1411. [Google Scholar] [CrossRef]
  50. Guo, W.; Liu, Z.; Xu, W.; Wang, W.J.; Shafron, E.; Lv, Q.; Li, K.; Zhou, S.; Guan, R.; Yang, J. Spatial and Temporal Patterns of Forest Biomass Carbon Sink in China from 1990 to 2021. Remote Sens. 2024, 16, 3811. [Google Scholar] [CrossRef]
  51. Kitikidou, K.; Milios, E.; Stampoulidis, A.; Pipinis, E.; Radoglou, K. Using Biodiversity Indices Effectively: Considerations for Forest Management. Ecologies 2024, 5, 42–51. [Google Scholar] [CrossRef]
  52. Papazoglou, G.; Biskas, P. Review and Comparison of Genetic Algorithm and Particle Swarm Optimization in the Optimal Power Flow Problem. Energies 2023, 16, 1152. [Google Scholar] [CrossRef]
  53. Xiao, Y.; Zhao, J.; Zhang, Y.; Wang, S. Grain Self-Sufficiency in Guangdong, China: Current Trends and Future Perspectives. Foods 2025, 14, 1126. [Google Scholar] [CrossRef] [PubMed]
  54. Wang, C.; Li, M.; Wang, X.; Deng, M.; Wu, Y.; Hong, W. Spatio-Temporal Dynamics of Carbon Storage in Rapidly Urbanizing Shenzhen, China: Insights and Predictions. Land 2024, 13, 1566. [Google Scholar] [CrossRef]
  55. Wang, Z.; Xu, L.; Shi, Y.; Ma, Q.; Wu, Y.; Lu, Z.; Mao, L.; Pang, E.; Zhang, Q. Impact of Land Use Change on Vegetation Carbon Storage During Rapid Urbanization: A Case Study of Hangzhou, China. Chin. Geogr. Sci. 2021, 31, 209–222. [Google Scholar] [CrossRef]
  56. Han, B.; Jin, X.; Zhao, Q.; Chen, H. Spatiotemporal Patterns and Mechanisms of Land-Use Conflicts Affecting High-Quality Development in China. Appl. Geogr. 2023, 155, 102972. [Google Scholar] [CrossRef]
Figure 1. Topography, 2021 land use structure, and road network. (a) Topographic variation; (b) Spatial relationships between land use types.
Land 14 01418 g001
Figure 2. Research framework.
Land 14 01418 g002
Figure 3. LSTM loss and residual plots.
Land 14 01418 g003
Figure 4. Land use change trends and proportion relationships.
Land 14 01418 g004
Figure 5. Training Loss and MAE of growth models for tree species (groups).
Land 14 01418 g005
Figure 6. Relationship among dominant species, area, and carbon sink volume in selected forest land plots.
Land 14 01418 g006
Figure 7. Evolution of the optimal solution for “carbon sink efficiency–diversity balance”.
Land 14 01418 g007
Figure 8. Changes in carbon sink volume and Shannon index.
Land 14 01418 g008
Figure 9. Spatial pattern comparison of three planning scenarios.
Land 14 01418 g009
Table 1. Encoding methods for categorical variables of ecological factors.
Ecological FactorTypeEncoding Method
Growth StageYoung Forest (Young Bamboo), Middle-Aged Forest (Mature Bamboo), Pre-Mature Forest (Old Bamboo), Mature Forest, Over-Mature Forest1–5
Plot Area Actual measured values were normalized to a scale of 1 to 10 for modeling purposes.
LandformVery High Mountain, High Mountain, Medium Mountain, Low Mountain, Hill, Plain1–6
Slope AspectNorth, Northeast, East, Southeast, South, Southwest, West, Northwest, No Slope Aspect1–9
Slope PositionRidge, Upper Slope, Middle Slope, Lower Slope, Valley, Flat Land, Entire Slope1–7
Slope GradientFlat, Gentle, Moderate, Steep, Very Steep, Extremely Steep1–6
Soil TypeRed Soil, Paddy Soil1–2
Soil Thickness Actual measured values were normalized to a scale of 1 to 10 for modeling purposes.
OriginNatural, Purely Natural, Artificially Promoted, Naturally Regenerated1–1.3
Artificial, Planting (Seedlings), Direct Seeding, Aerial Seeding, Coppice Regeneration (Artificial)2–2.4
Planting Density Actual measured values were normalized to a scale of 1 to 10 for modeling purposes.
Note: All variables were normalized to a scale of 1 to 10 to avoid gradient imbalance.
Table 2. Calculation of VIF and tolerance.
VariableVIFTolerance
Growth Stage2.9960.334
Plot Area1.2100.826
Landform1.2670.789
Slope Aspect1.0920.916
Slope Position1.0700.934
Slope Gradient1.0530.950
Soil Type1.0190.982
Soil Thickness1.0600.943
Origin1.0060.994
Planting Density3.0910.324
Disclaimer/Publisher’s Note: The statements, opinions and data contained in all publications are solely those of the individual author(s) and contributor(s) and not of MDPI and/or the editor(s). MDPI and/or the editor(s) disclaim responsibility for any injury to people or property resulting from any ideas, methods, instructions or products referred to in the content.

