Article

Simulating Land Use and Evaluating Spatial Patterns in Wuhan Under Multiple Climate Scenarios: An Integrated SD-PLUS-FD Modeling Approach

1
College of Civil Engineering and Architecture, Zhejiang University, Hangzhou 310058, China
2
College of Tourism & Landscape Architecture, Guilin University of Technology, Guilin 541006, China
*
Author to whom correspondence should be addressed.
Land 2025, 14(7), 1412; https://doi.org/10.3390/land14071412
Submission received: 23 May 2025 / Revised: 26 June 2025 / Accepted: 30 June 2025 / Published: 4 July 2025

Abstract

Amid intensifying global climate anomalies and accelerating urban expansion, land use systems have become increasingly dynamic, complex, and uncertain. Accurately predicting and scientifically evaluating the evolution of land use patterns is essential to advancing territorial spatial governance and achieving ecological security goals. However, most existing land use models emphasize quantity forecasting and spatial allocation, while overlooking the third critical dimension—structural complexity, which is essential for understanding the nonlinear, fragmented evolution of urban systems, thus limiting their ability to fully capture the evolutionary characteristics of urban land systems. To address this gap, this study proposes an integrated SD-PLUS-FD model, which combines System Dynamics, Patch-based Land Use Simulation, and Fractal Dimension analysis to construct a comprehensive three-dimensional framework for simulating and evaluating land use patterns in terms of quantity, spatial distribution, and structural complexity. Wuhan is selected as the case study area, with simulations conducted under three IPCC-aligned climate scenarios—SSP1-2.6, SSP2-4.5, and SSP5-8.5—to project land use changes by 2030. The SD model demonstrates robust predictive performance, with an overall error of less than ±5%, while the PLUS model achieves high spatial accuracy (average Kappa >0.7996; average overall accuracy >0.8856). Fractal dimension analysis further reveals that since 2000, the spatial boundary complexity of all land use types—except forest land—has generally shown an upward trend across multiple scenarios, highlighting the increasingly nonlinear and fragmented nature of urban expansion. The FD values for construction land and cultivated land declined to their historical low in 2005, then gradually increased, reaching their peak under the SSP1-2.6 scenario. Notably, the increase in FD for construction land was significantly greater than that for cultivated land, indicating a stronger dynamic response in spatial structural evolution. In contrast, forest land exhibited pronounced scenario-dependent variations in FD. Its structural complexity remained generally stable under all scenarios except SSP5-8.5, reflecting higher structural resilience and boundary adaptability under diverse socioclimatic conditions. The SD-PLUS-FD model effectively reveals how land systems respond to different socioclimatic drivers in both spatial and structural dimensions. This three-dimensional framework reveals how land systems respond to socioclimatic drivers across temporal, spatial, and structural scales, offering strategic insights for climate-resilient planning and optimized land resource management in rapidly urbanizing regions.

1. Introduction

Under the dual pressures of accelerating urbanization and persistent global climate anomalies, urban land use patterns are encountering unprecedented structural and functional disruptions. As cities continue to expand, land use systems undergo multi-dimensional transformations, including changes in land quantity, reconfiguration of spatial layouts, and increasing structural complexity. These transitions signal a broader shift in urban spatial development—from mono-functional dominance toward multi-functional integration, and from centralized expansion toward polycentric and decentralized diffusion. However, amid the overlapping influences of extensive land use practices and diversified urban growth trajectories, urban land systems are increasingly plagued by fragmentation, disconnection, and structural weakening, which severely undermine spatial order and ecological stability [1,2,3]. With the growing frequency of extreme climate events—such as heat waves, severe floods, drought-induced water shortages, and accelerated glacier melting—the Earth’s climate system has markedly deviated from its geological-period equilibrium threshold, displaying greater volatility and intensity [4,5,6,7,8]. Climate change profoundly reshapes land development patterns by altering regional hydrothermal regimes and constraining ecological carrying capacities. Simultaneously, habitat degradation, carbon cycle disturbances, and cascading disaster chains have further intensified functional disorders and spatial uncertainty within land use systems [9,10,11]. Such adaptive responses—farmland abandonment, wetland loss, and urban encroachment—follow a cascading trajectory of “climate stress → land use response → ecological degradation,” highlighting the high sensitivity and vulnerability of land systems to climate stimuli. More critically, land use evolution, in turn, exerts a substantial influence on the climate system. On the one hand, large-scale urbanization increases impervious surface coverage and amplifies the urban heat island effect, thereby disrupting regional energy balances and atmospheric circulation, thus altering not only surface albedo but also increasing anthropogenic heat emissions. On the other hand, forest fragmentation, wetland loss, and farmland overexploitation weaken carbon sink capacities, disrupt evapotranspiration processes and hydrological cycles, and further intensify greenhouse effects and climatic extremes. Within this bidirectional coupling and dynamic feedback relationship, land use is no longer a passive recipient of climate change but has emerged as an active driver. The structural evolution and process-level disturbances of land systems continuously feed back into the climate system, forming a complex, nonlinear interaction mechanism. Against this backdrop, it becomes essential to accurately simulate land use change processes and systematically assess spatial pattern evolution to address the compounded risks posed by urban expansion and climate change. Particularly under future scenarios characterized by rising uncertainty and multi-scalar development strategies, clarifying the mechanisms by which land use responds to climate stress—and elucidating embedded feedback loops—is crucial to achieving a resilient equilibrium between urban spatial expansion and ecological sustainability.
Land use models serve as essential tools for understanding land use change processes, analyzing system driving mechanisms, supporting spatial planning and policy formulation, and evaluating the impacts of land use on both ecological systems and socioeconomic development [12,13]. These models facilitate the quantitative identification of internal transformation mechanisms, thereby providing a robust scientific foundation for informed decision-making. Existing land use simulation methods are primarily structured around the dual dimensions of quantity forecasting and spatial reconstruction, forming the basic framework of “quantity simulation–spatial simulation” (Table 1). Quantity-based models—such as System Dynamics (SD) [14,15], Gray Forecasting (GF) [16,17], and Markov Chain (MC) [18,19]—effectively project the structural composition of land demand but lack capabilities to simulate spatial distributions. Conversely, spatial simulation models—including Cellular Automata (CA) [20,21,22,23], CLUE-S [24,25,26], FLUS [27,28,29,30], and Patch-generating Land Use Simulation (PLUS) [31,32]—excel at reproducing the spatial allocation of land use types but provide limited support for forecasting land demand over time. This methodological split causes dimensional fragmentation: quantity-based models overlook spatial interactions, while spatial models fail to capture systemic feedback dynamics. To address these limitations, model coupling has emerged as a critical strategy that integrates the strengths of distinct approaches. The SD-PLUS model exemplifies this integration by combining the nonlinear, feedback-driven simulation of macrolevel socioeconomic drivers offered by SD with the high-resolution spatial allocation capabilities of the PLUS model, which is built upon the Land Expansion Analysis Strategy (LEAS) and multi-type random patch seeding mechanisms. This coupling enables the establishment of a dynamic feedback loop between land demand forecasting and spatial pattern simulation [33]. Further extensions have incorporated ecological assessment modules—such as InVEST, SWAT, and others—into coupled frameworks, enabling applications in ecosystem service evaluation, carbon cycle analysis, and sustainability planning [34,35,36,37,38,39]. These integrations shift focus toward evaluating land use “quality.” However, most models still lack effective structural indicators to characterize the nonlinear, heterogeneous, and morphologically complex nature of land use systems. This gap hampers the capacity to detect spatial order, emergent patterns, and self-organization in urban land evolution. Accordingly, there is a pressing need to develop a multi-model integration framework that synthesizes system dynamics, spatial expansion logic, and structural complexity. Introducing structural complexity as a third simulation dimension, alongside quantity and spatial layout, would significantly improve model sensitivity to spatial structure and enhance the explanatory power of land use modeling under complex future scenarios.
Fractals refer to geometric structures that exhibit self-similarity, where both the overall form and local details maintain consistent patterns across different spatial scales. The concept, first introduced by mathematician Benoît Mandelbrot in the 1970s, challenges the limitations of traditional integer-dimensional geometry. It provides a powerful tool for describing natural and urban systems characterized by irregular boundaries and scale-invariant spatial patterns. Fractal theory has been widely applied across natural sciences, ecology, and urban geography to characterize complex yet orderly spatial forms [40,41,42,43]. As a key manifestation of spatial system evolution, urban land use patterns are far more than the sum of land use quantities and positions. They reflect spatial coupling among land units, boundary configurations, and multi-dimensional interactions with socioeconomic and ecological subsystems. Together, these factors produce nonlinear urban expansion, nested hierarchies, and evolving boundaries, resulting in strong structural complexity and spatial heterogeneity [44,45,46,47,48]. To address the limitations of existing land use models in capturing such structural attributes, this study introduces an integrated SD-PLUS-FD framework, which couples System Dynamics (SD) and the Patch-based Land Use Simulation model (PLUS) with Fractal Dimension (FD) as a structural complexity indicator. This approach enables land use evolution to be simulated and evaluated from three interconnected dimensions: quantity, spatial allocation, and structural form. Under different climate scenarios, the framework supports both predictive simulation and structural complexity assessment, thereby offering a scientific foundation for adaptive spatial planning and land system decision-making in the face of future climate and socioenvironmental uncertainty.
This study selects Wuhan City as the research area and adopts three climate scenarios—SSP1-2.6, SSP2-4.5, and SSP5-8.5—derived from the IPCC 2020 report. On this basis, a coupled SD-PLUS model is developed and validated by integrating a wide range of socioeconomic driving factors and climate change variables. Using the period from 2000 to 2020 as the historical calibration phase, the model simulates and forecasts changes in land use quantity and spatial patterns under the three scenarios by 2030. Subsequently, the Fractal Dimension (FD) is introduced as a structural indicator to quantitatively analyze the spatial pattern evolution of typical land use types, enabling a comprehensive assessment of structural complexity in both historical and future periods. Furthermore, a three-dimensional evaluation framework is constructed, incorporating quantity adaptability, spatial layout rationality, and pattern complexity. Through the integrated application of system dynamics simulation, spatial expansion modeling, and structural complexity measurement—with FD serving as the core structural metric—the model effectively captures the self-organizing behavior and evolutionary characteristics of land use structures. The SD-PLUS-FD framework not only provides theoretical support and technical guidance for interpreting multi-scenario simulation results, but also contributes to a deeper understanding of the evolutionary patterns in urban land systems under the combined influence of climate and socioeconomic uncertainties.

2. Methodology and Data Sources

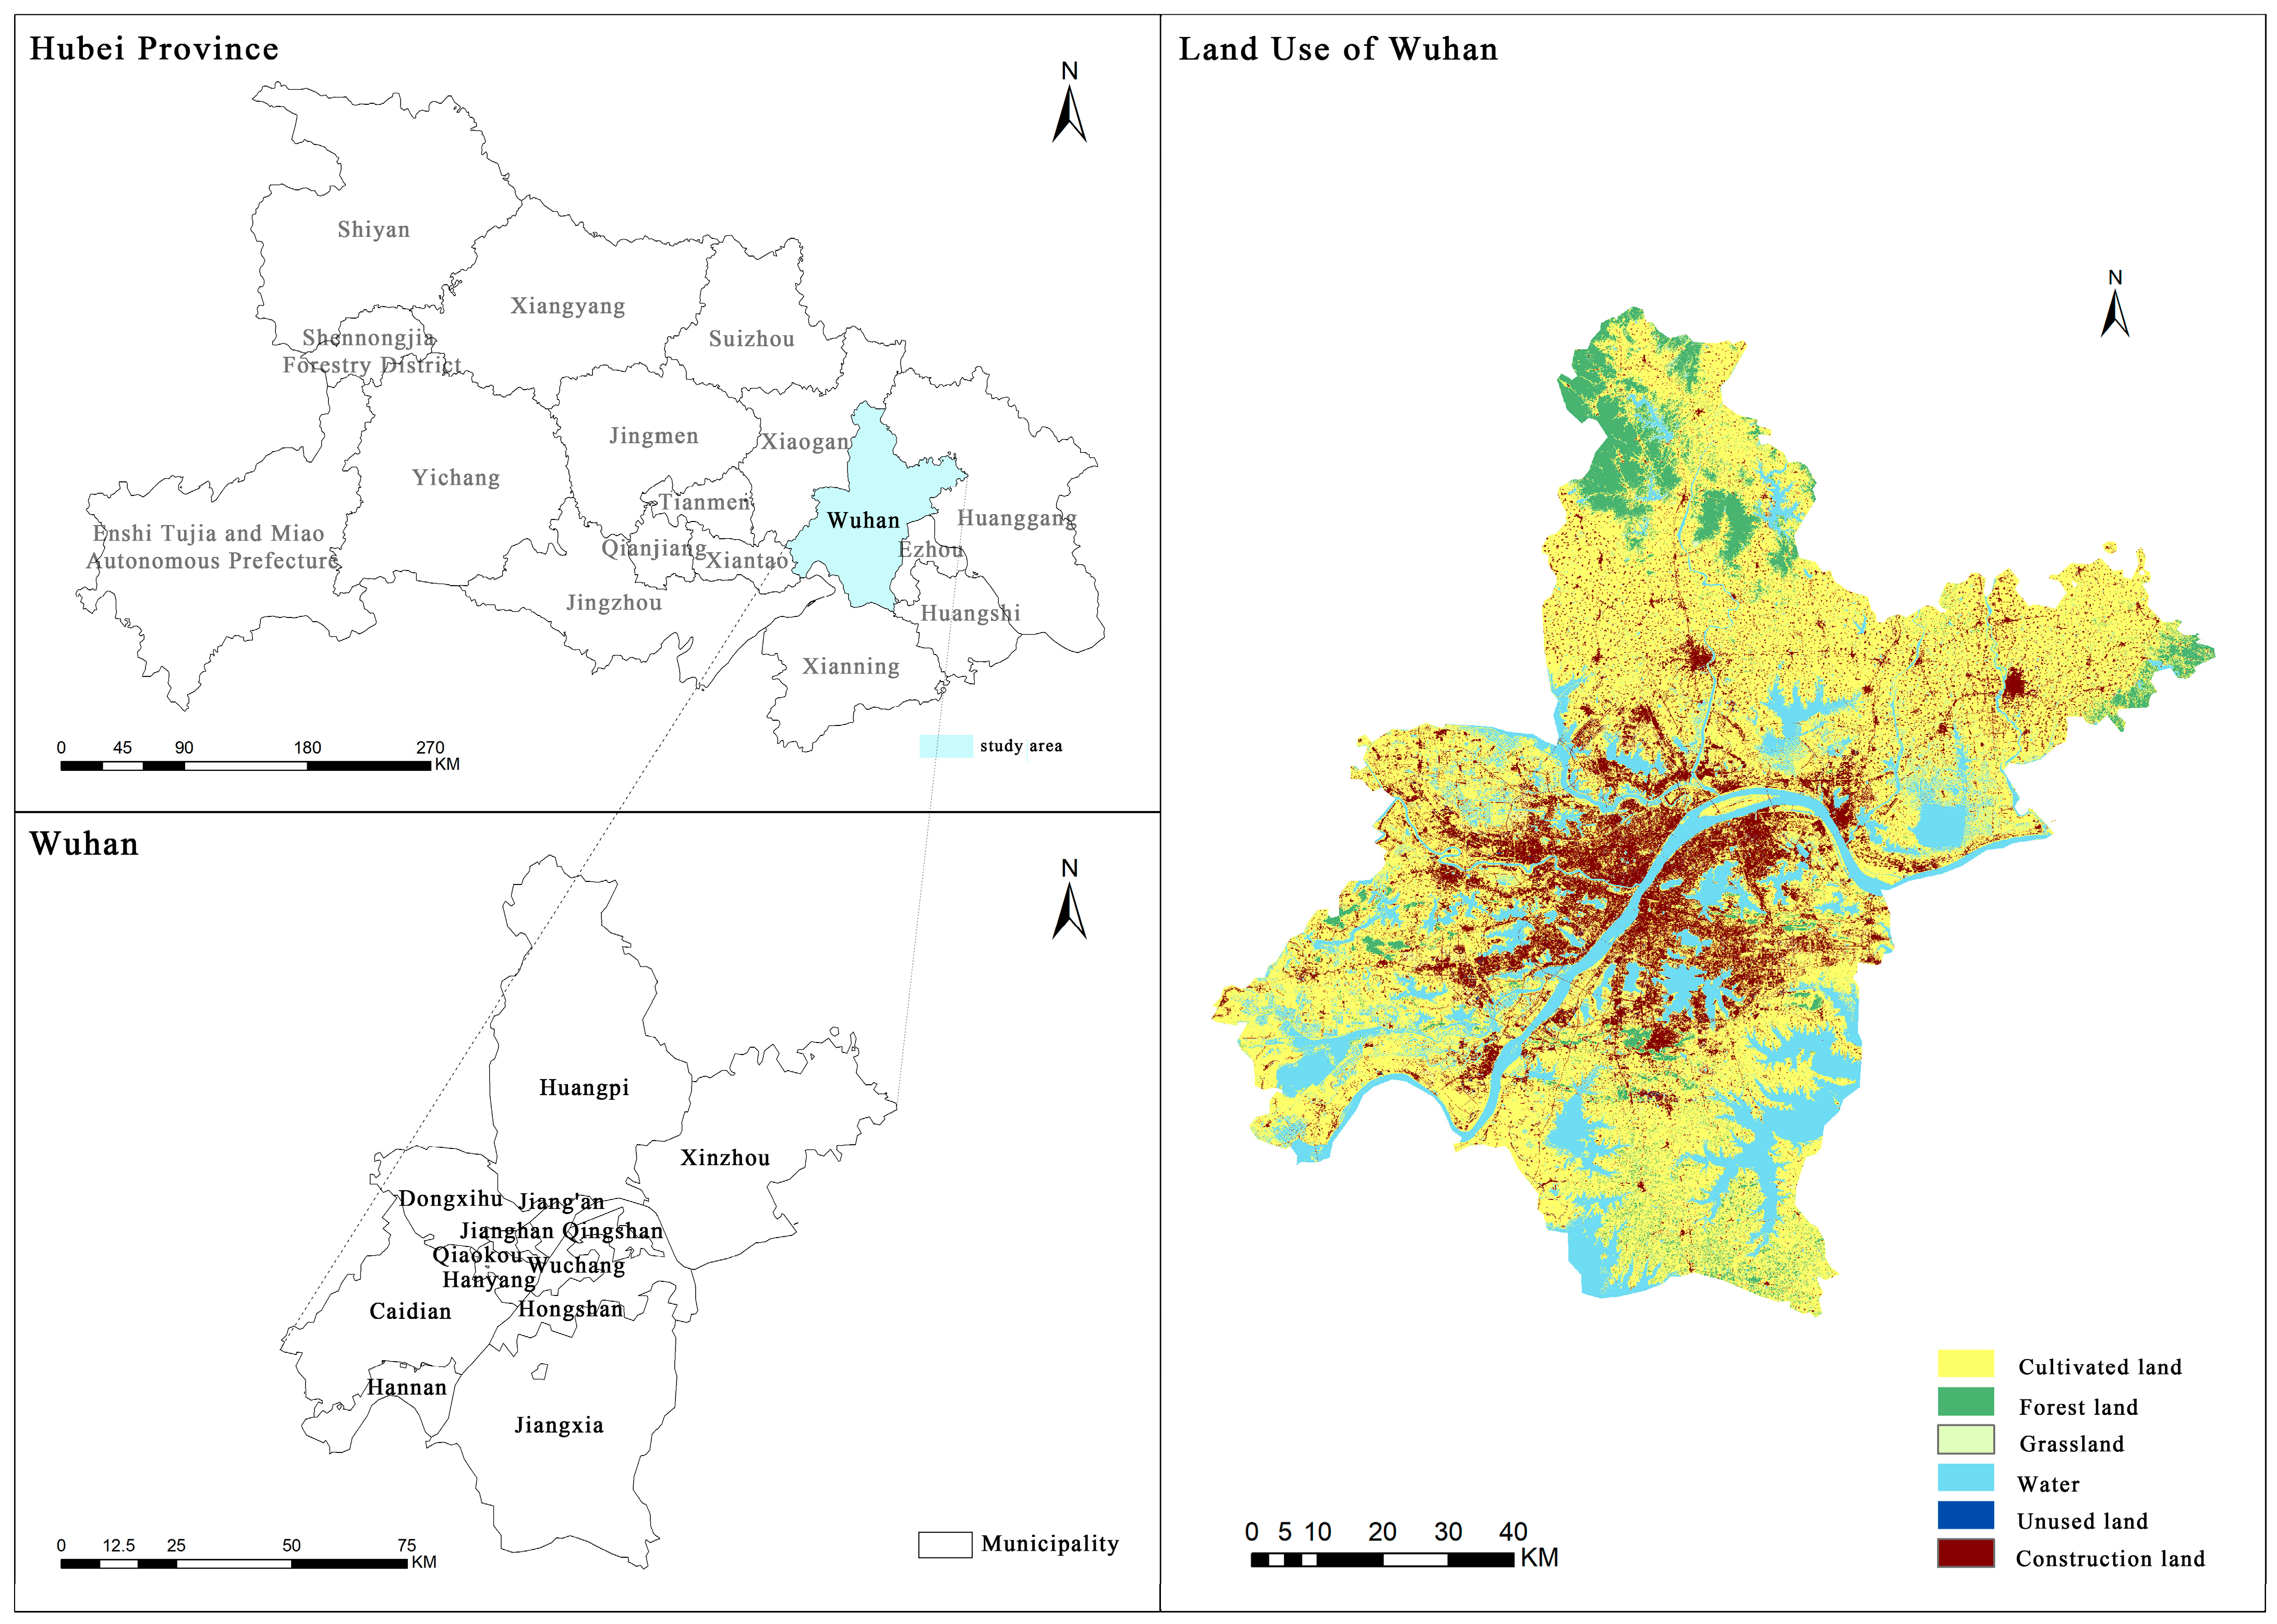
2.1. Study Area Overview

Wuhan City is located in central China and serves as the capital of Hubei Province. Geographically, it spans from 29°58′ to 31°22′ N latitude and from 113°41′ to 115°05′ E longitude. The city’s main urban area includes Jiang’an, Jianghan, Qiaokou, Hanyang, Wuchang, Hongshan, and Qingshan Districts. As a core node of the middle reaches of the Yangtze River urban agglomeration and a national central city, Wuhan exhibits high concentrations of population, economic activity, and industrial resources, making it an important engine for regional development and spatial transformation (Figure 1). With the rapid advancement of new urbanization, contradictions within the regional human–land system have become increasingly prominent. The resource and environmental carrying capacity is approaching critical thresholds, while land development—driven by the joint forces of climate change and human activity—is displaying marked spatial heterogeneity. In response to these challenges, there is an urgent need to establish an intelligent territorial spatial regulation system based on multi-source data integration. Such a system should dynamically simulate the ecological–economic–social coupling effects of land use transformation under multiple scenarios and develop an adaptive mechanism with strong spatiotemporal resilience.

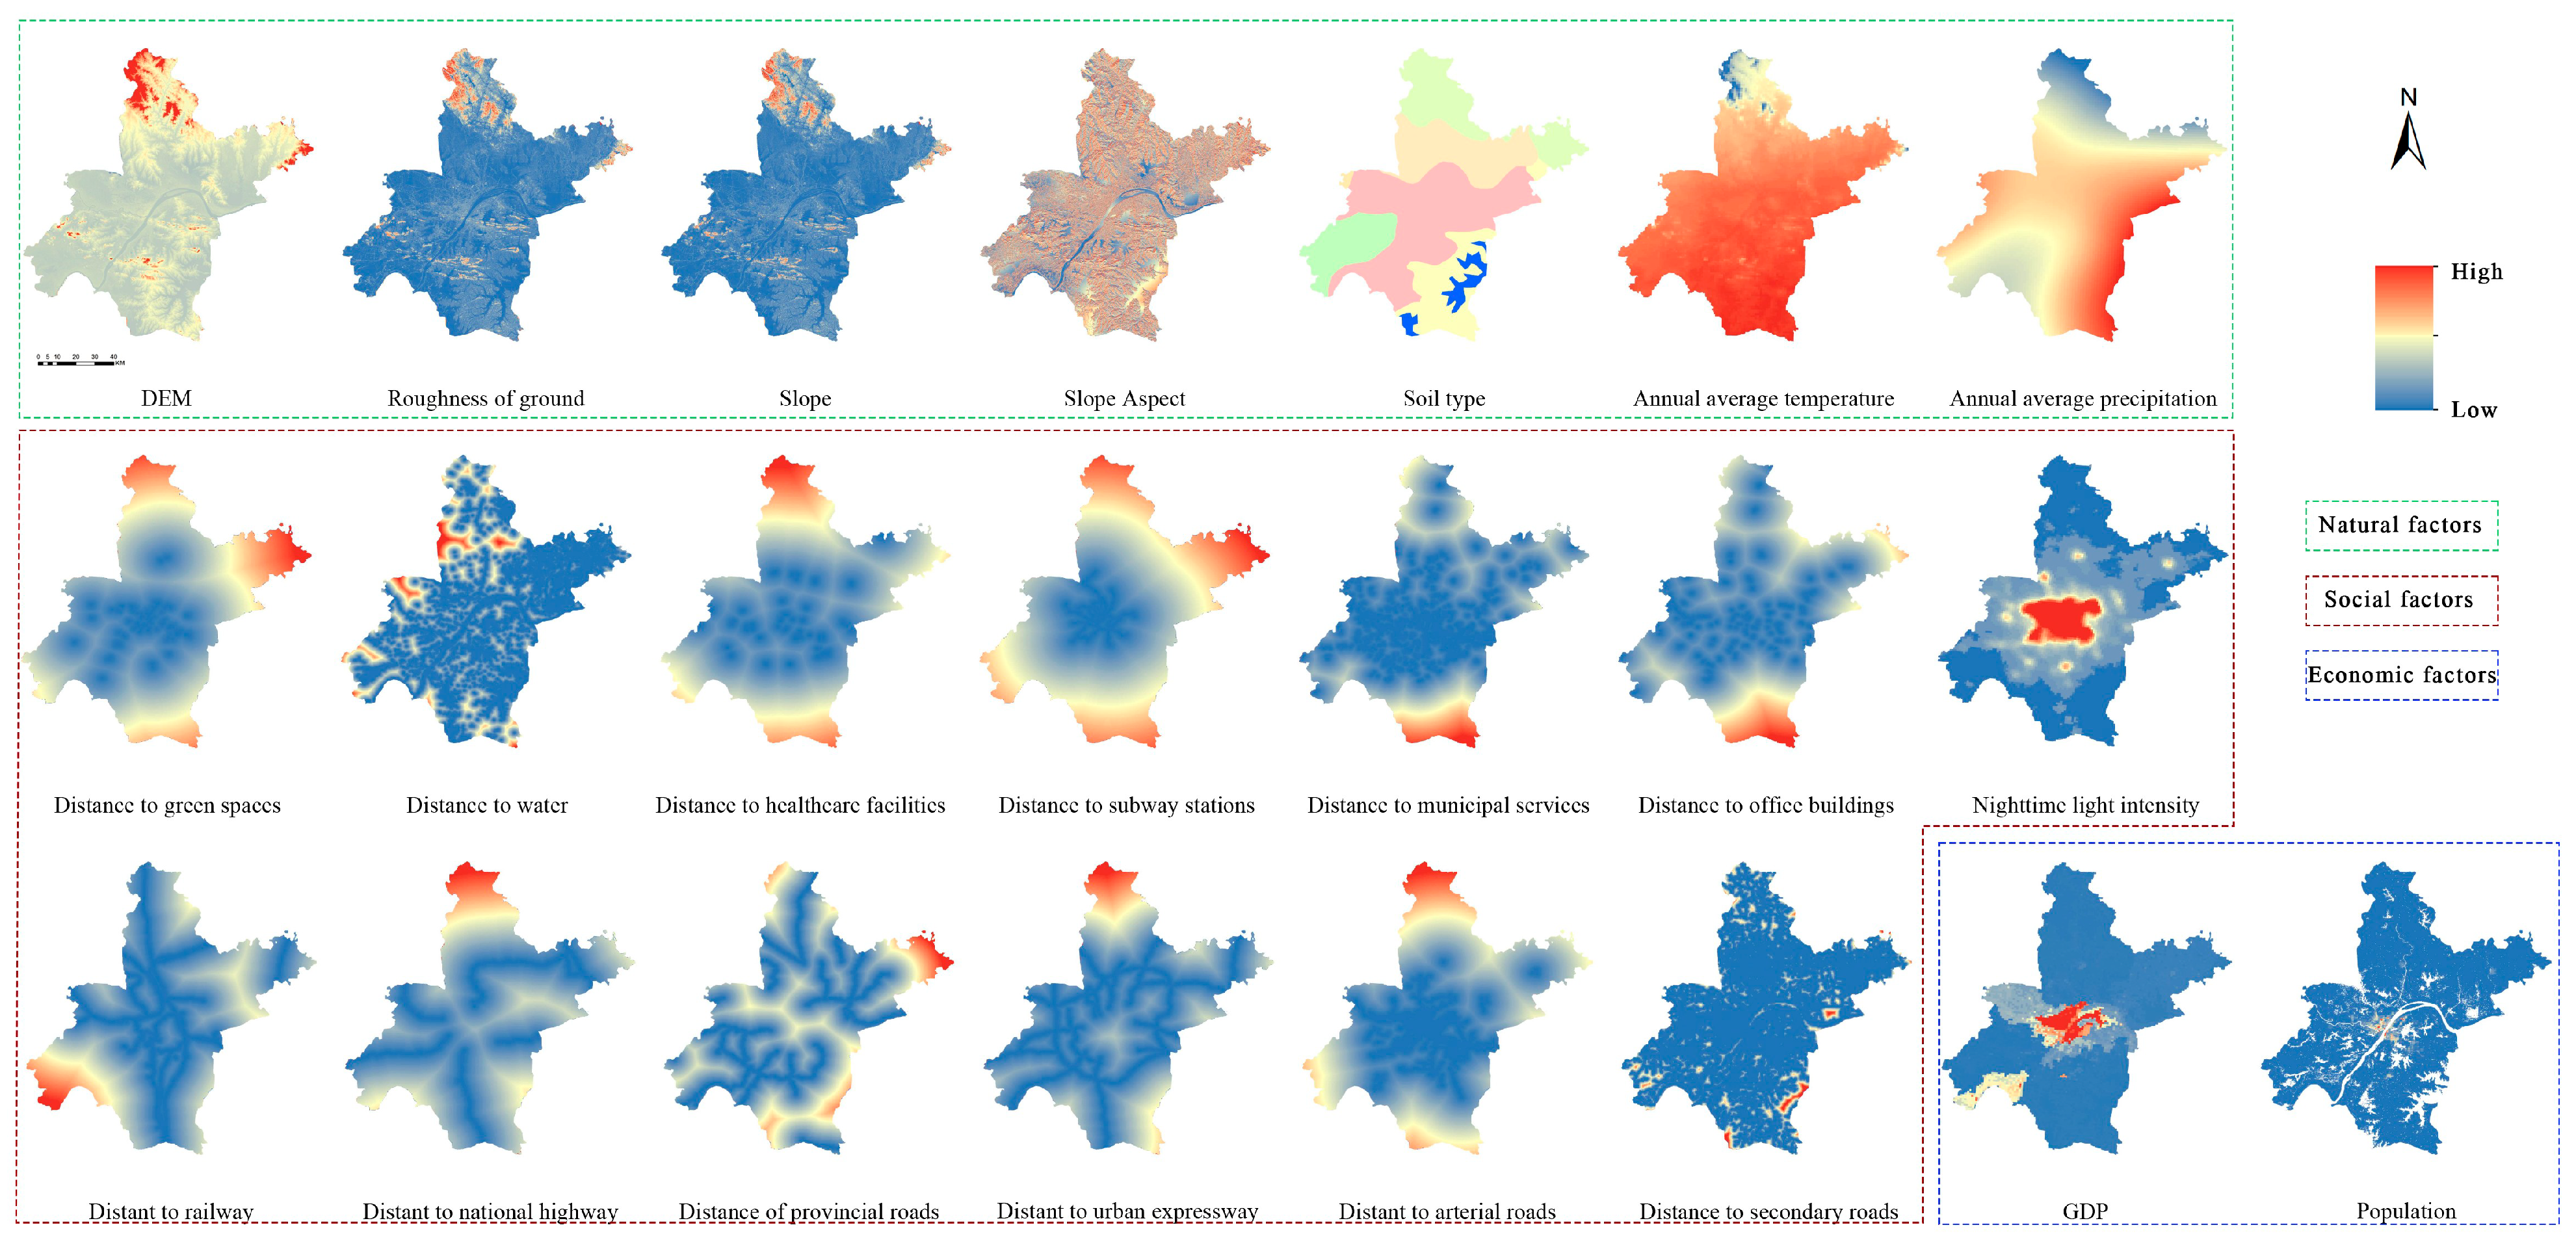
2.2. Data Sources and Processing
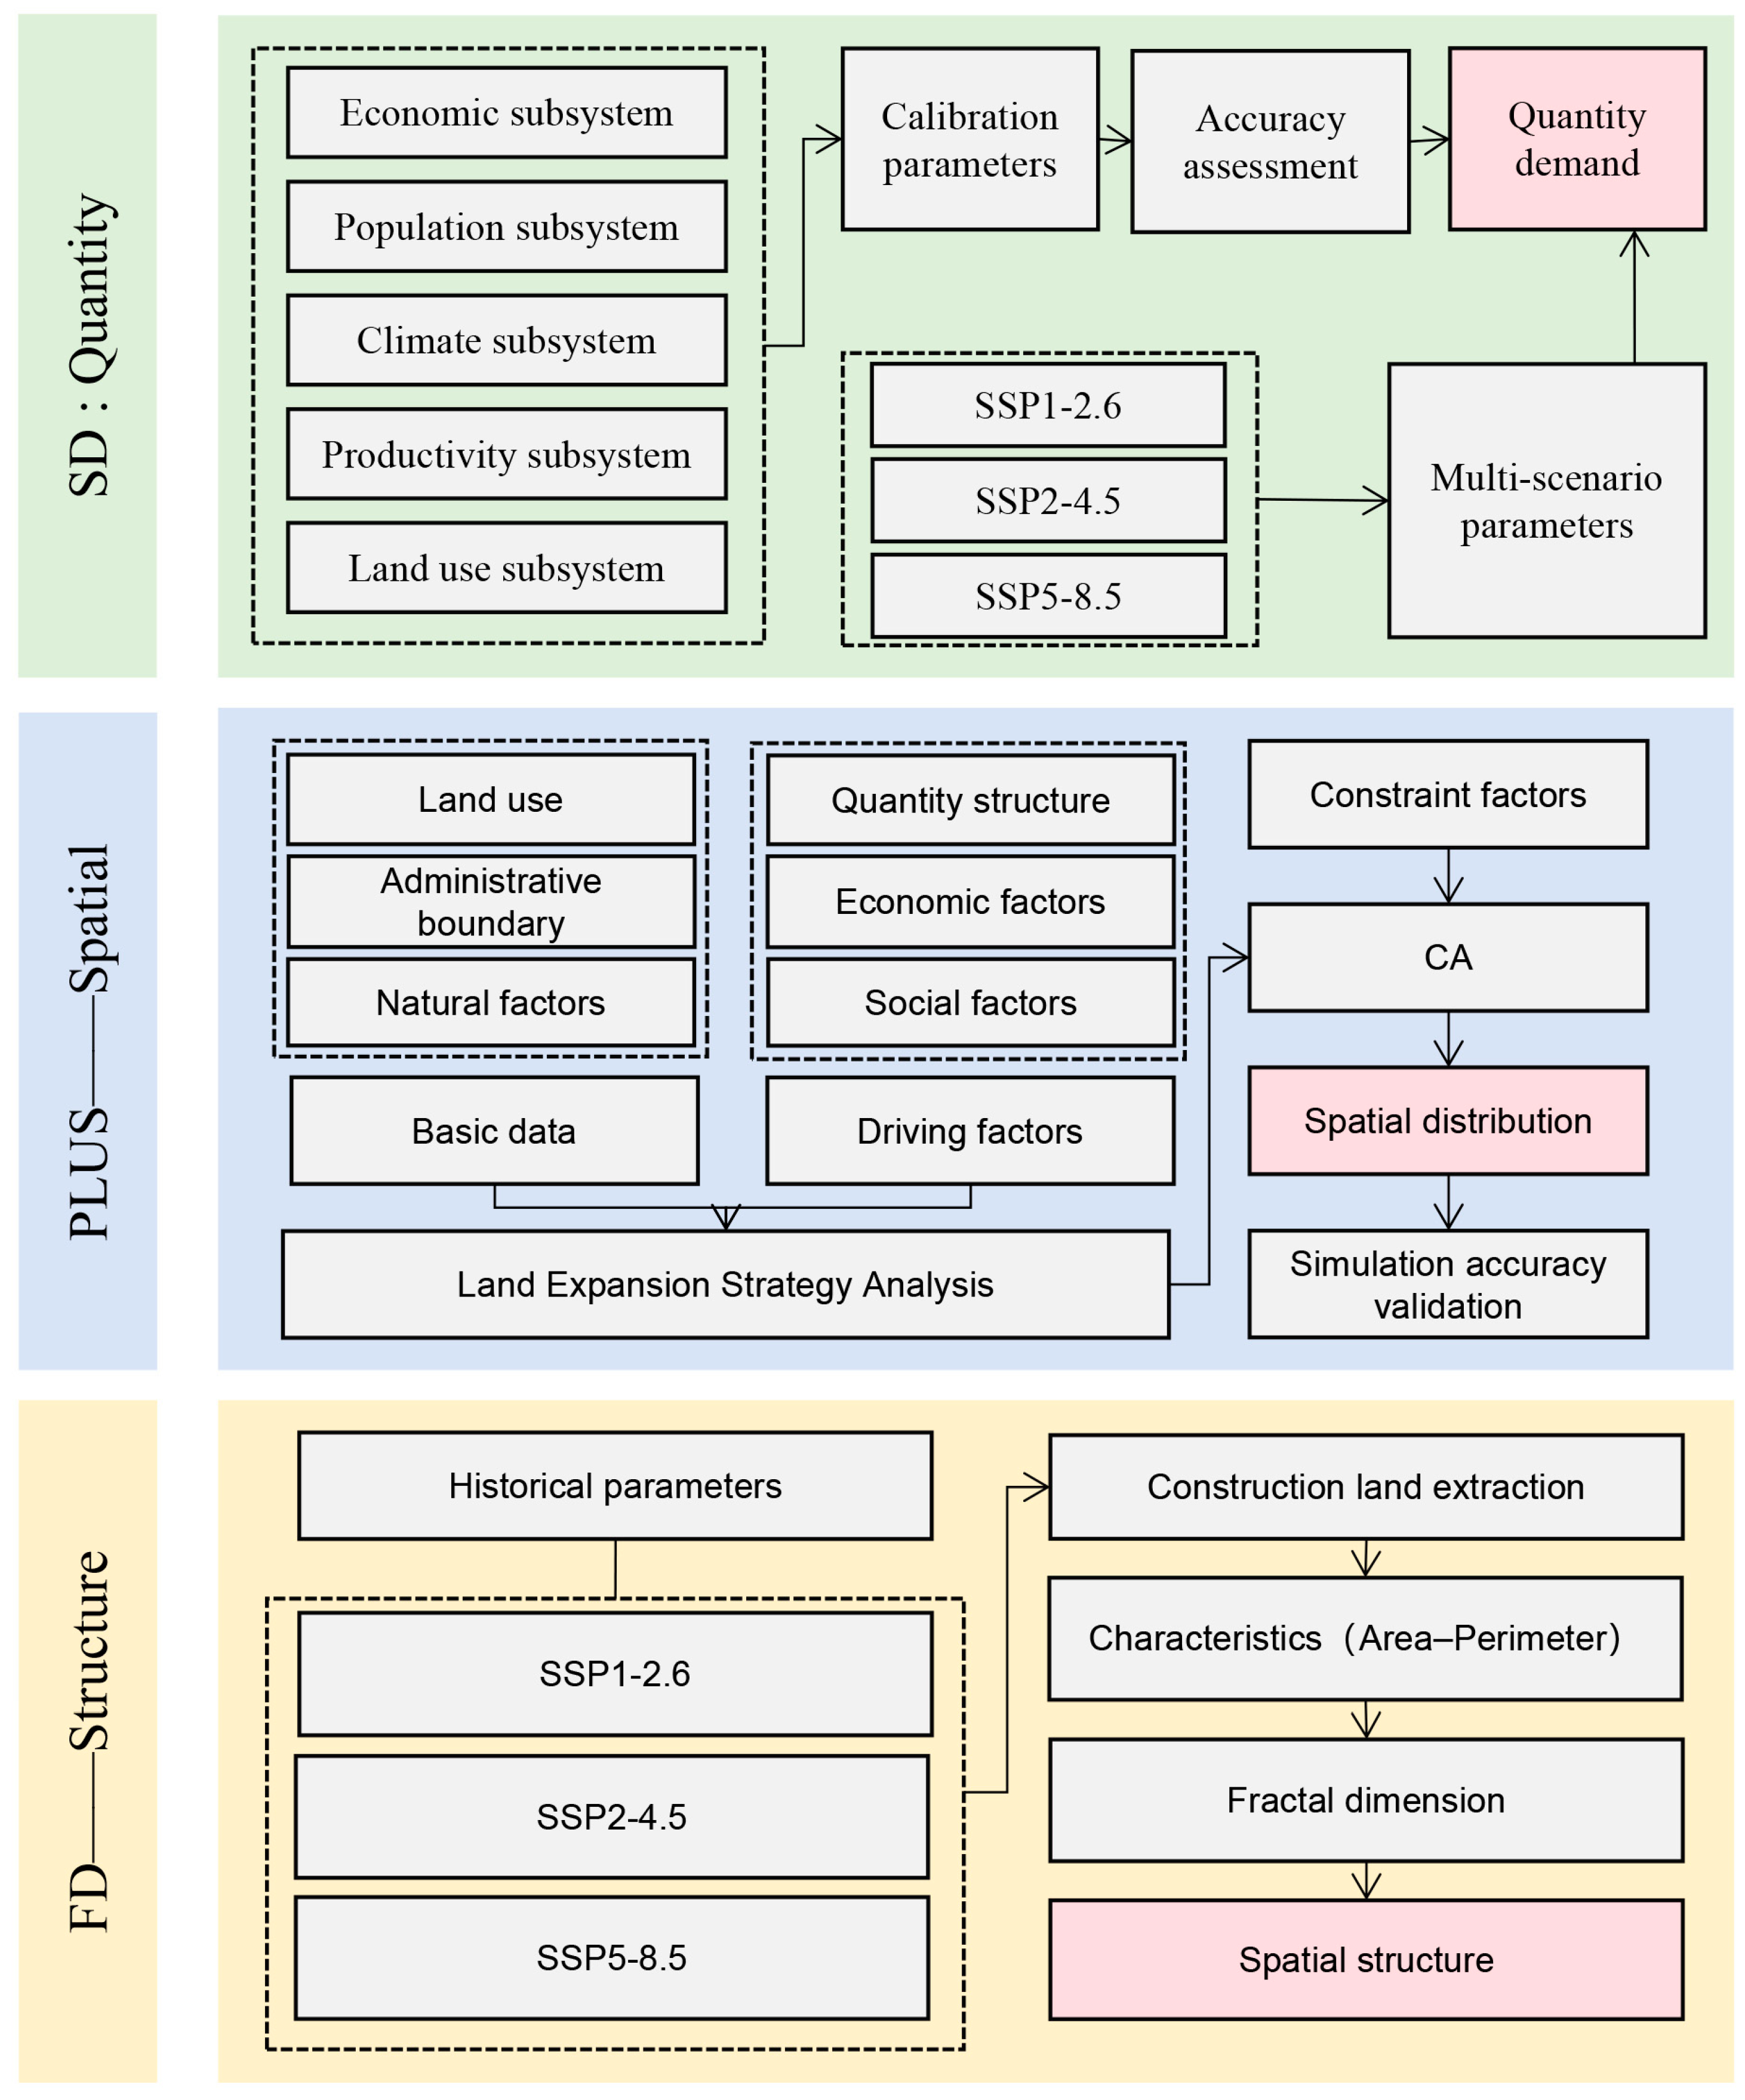
The data used in this study include nonspatial data for constructing the SD model and spatial data for building the PLUS model. The nonspatial data primarily consist of time-series socioeconomic statistics, while the spatial data include land use data, natural environmental data, and fundamental geographic information. Detailed data sources and attributes are summarized in Table 2. According to modeling requirements, land use types were reclassified into six categories: cultivated land, forest land, grassland, water bodies, construction land, and unused land. All spatial data were projected to the WGS 1984 UTM Zone 49N coordinate system using ArcGIS 10.8, and the spatial resolution was resampled to 30 m. To ensure consistency across datasets, all spatial layers were standardized. The distances between pixels and driving factors were calculated using Euclidean distance. This preprocessing ensured data compatibility for both the system dynamics and spatial simulation components of the model.

2.3. Methodology

This study proposes an integrated SD-PLUS-FD modeling framework that combines three key components: System Dynamics (SD) for land use demand forecasting, the Patch-based Land Use Simulation model (PLUS) for spatial allocation, and Fractal Dimension (FD) as a quantitative indicator of structural complexity. Together, these modules form a comprehensive simulation system capable of capturing land use change from three interconnected dimensions—quantity evolution, spatial patterns, and structural form. The core objectives of this framework are (1) to simulate changes in urban land use quantity and spatial expansion driven by the combined effects of climate change and socioeconomic development; (2) to introduce the FD metric for quantifying the morphological evolution of urban land boundaries and the complexity of spatial configurations; and (3) to construct a tri-dimensional evaluation system integrating quantity, spatial distribution, and structural complexity to enhance the understanding of land use evolution processes. By integrating dynamic simulation, spatial modeling, and structural assessment—with FD as the central metric—this framework supports both predictive simulation and complexity analysis. It enables the continuous assessment of structural complexity across both historical and future periods, effectively capturing the self-organizing behavior and morphological evolution of land systems. The overall methodological framework is illustrated in Figure 2.

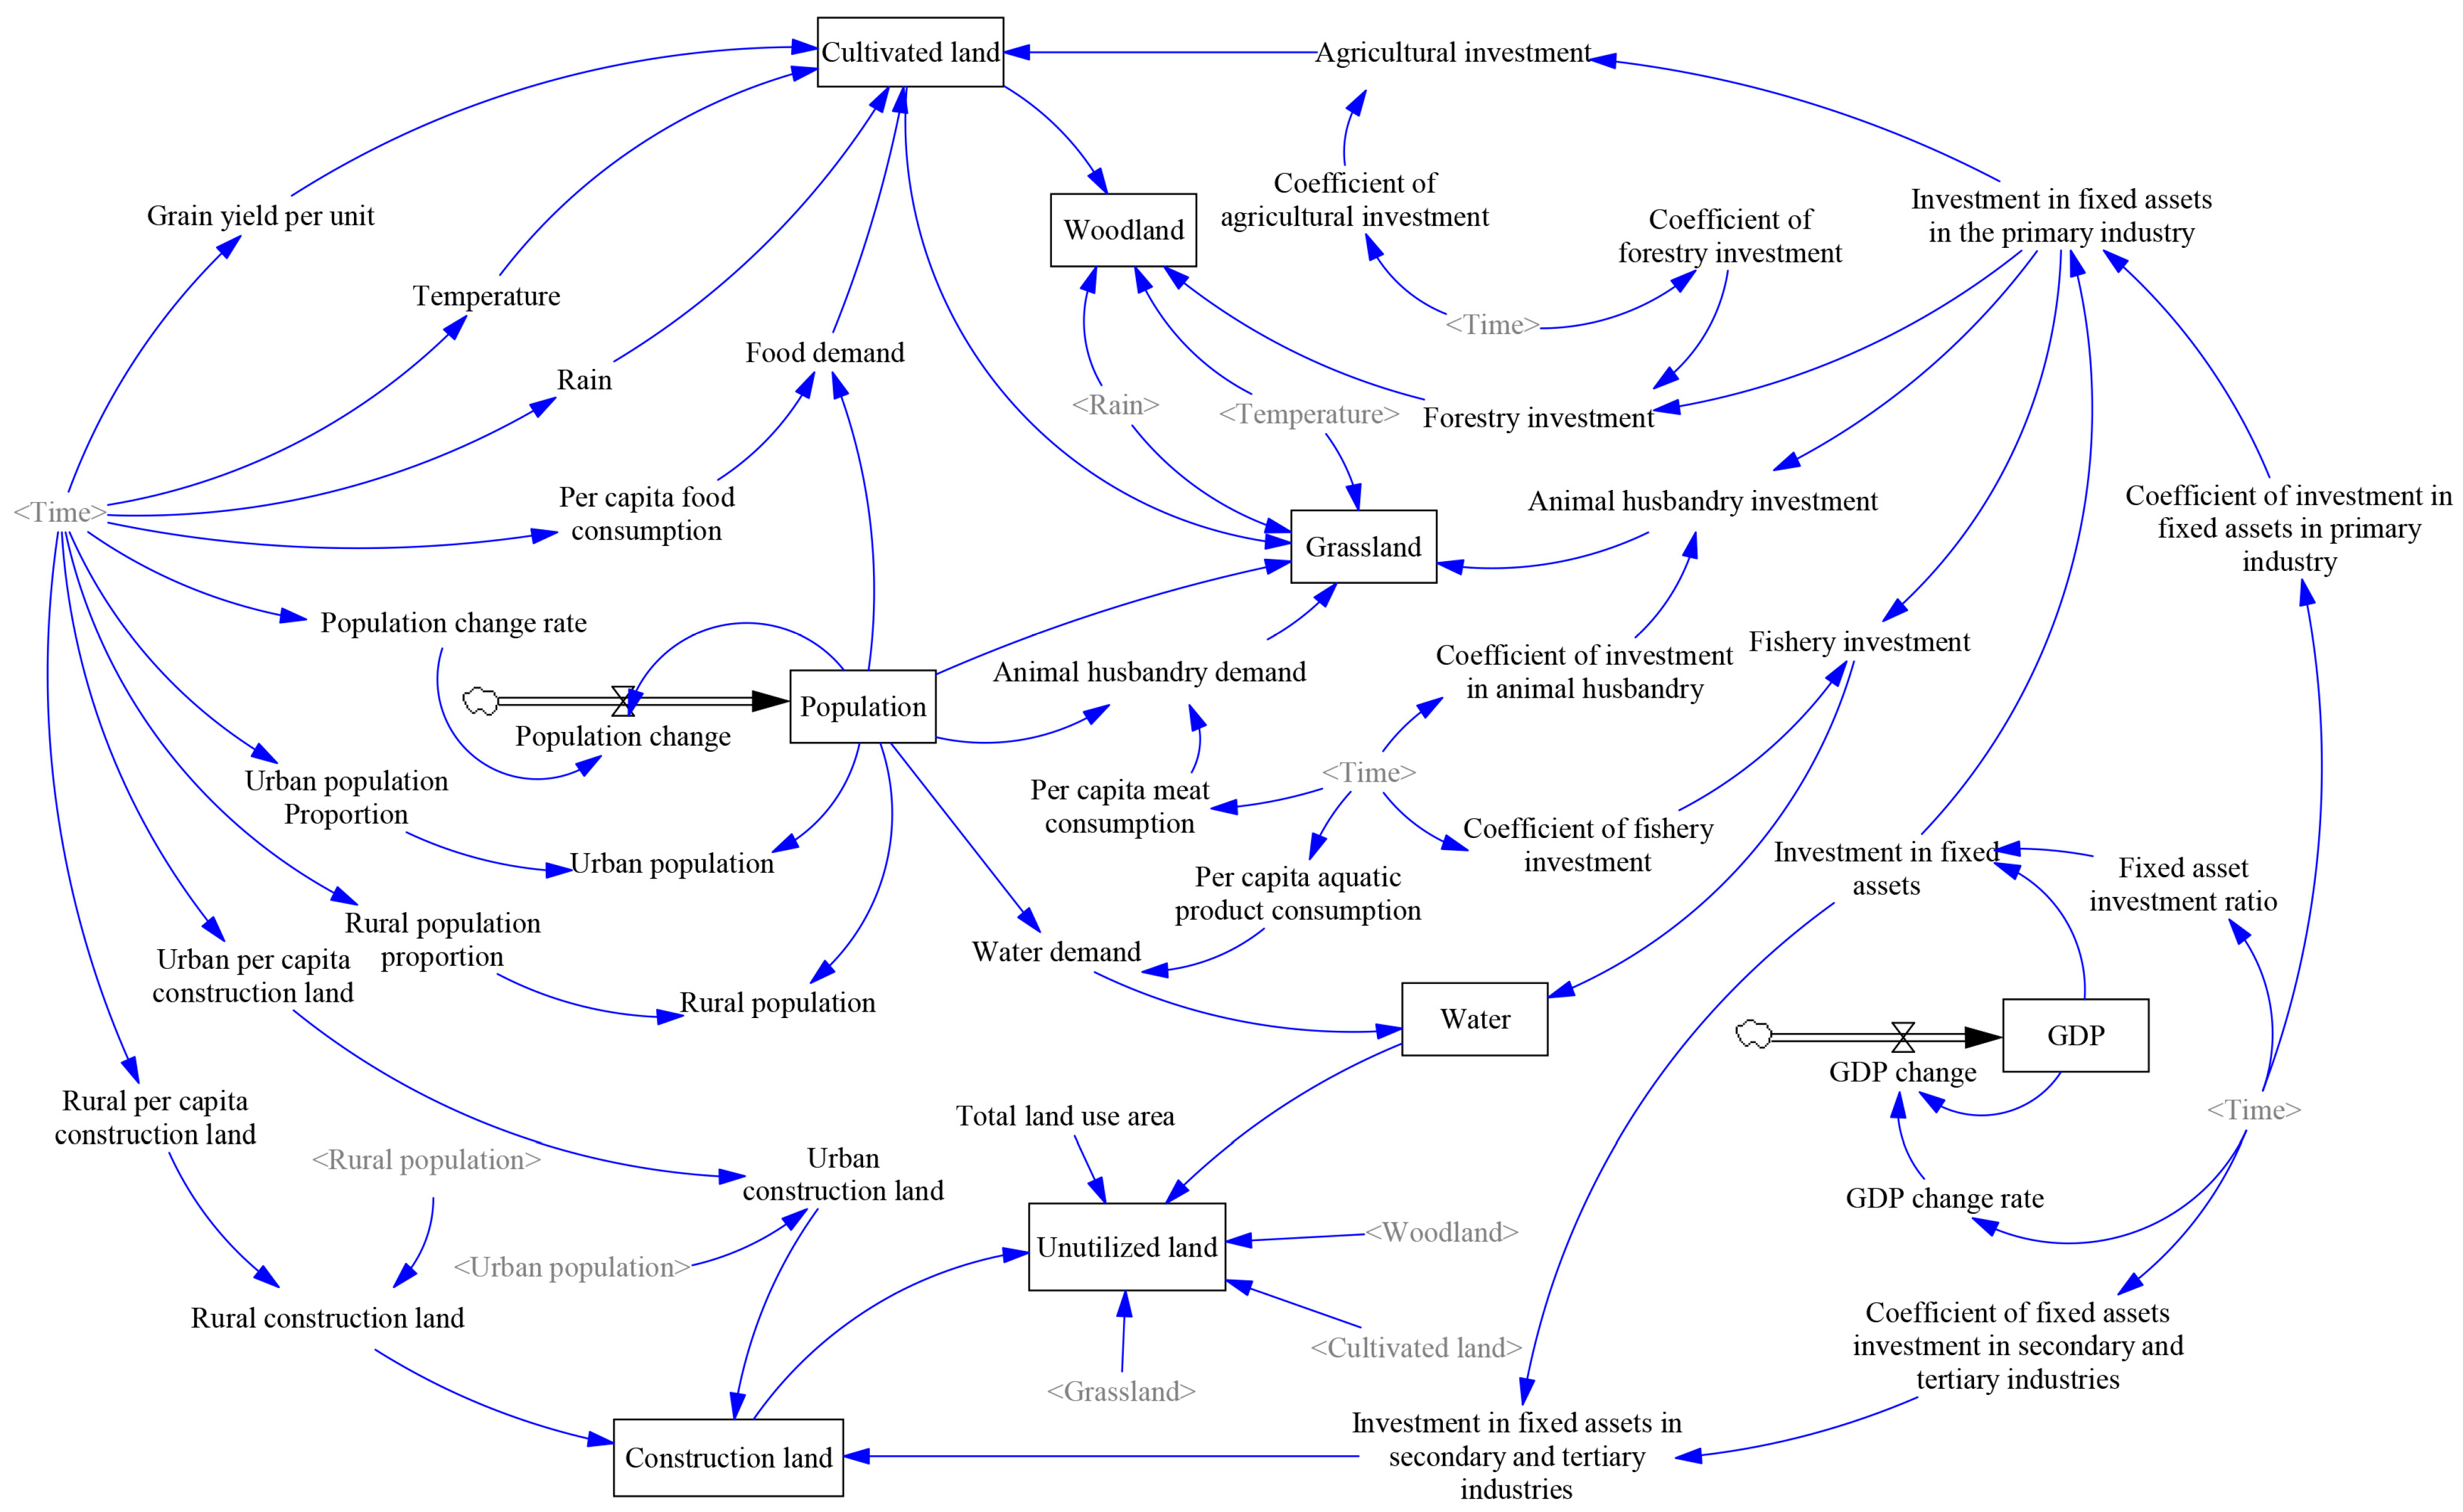
2.3.1. Land Use Demand Forecasting and Validation Based on the SD Model

The System Dynamics (SD) model characterizes the dynamic interactions among multiple subsystems through feedback loops between variables [49]. To simulate land use changes, the LUCC system must comprehensively incorporate various driving forces. Based on previous studies [50,51,52], this study divides Wuhan’s land use demand system into five interconnected subsystems: population, economy, productivity, climate, and land use.
Given limitations in data availability and accessibility, the spatial boundary of the model is set to the administrative boundary of Wuhan City, and the temporal range spans from 2000 to 2030, with historical calibration from 2000 to 2020 and simulation projection from 2021 to 2030. The time step is set to one year. Vensim PLE, a widely used software tool for dynamic system modeling, supports the construction of causal loop diagrams, equation modeling, sensitivity analysis, and result visualization, making it well suited for simulating complex systems and evaluating policy interventions [53,54,55]. The SD model was built and iteratively calibrated in Vensim, based on the defined interrelationships among variables, while the quantitative relationships between variables were derived using SPSS 26. The finalized SD model structure is shown in Figure 3.
Model validation for the SD simulation includes two key procedures: historical error testing and sensitivity analysis. The historical error test assesses the model’s reliability by comparing the simulated results with actual historical data and evaluating the degree of fit. The relative error is calculated using Equation (1):
E = [ ( S H ) / H ] 100 %
where S is the simulated value and H is the historical value.
The sensitivity test evaluates the robustness of the model by adjusting key parameters to determine whether changes in these inputs significantly affect the forecast results. The sensitivity coefficient is computed using Equation (2):
S ( t ) = | ( Δ Y Y ( t ) ) / Δ X X ( t ) |
In Equation (2), S represents the sensitivity value of variable Y with respect to parameter X, while ΔX and ΔY denote the changes in the parameter and the output variable, respectively, over time t. When S(t) < 1, the parameter is considered insensitive, indicating that the model remains relatively stable under variations in that input.

2.3.2. Multi-Scenario Setting

This study adopts the SSP–RCP coupled scenario framework proposed by the Intergovernmental Panel on Climate Change (IPCC) [56], integrating it with the regional development characteristics of Wuhan. Three representative coupled scenarios—SSP1-2.6, SSP2-4.5, and SSP5-8.5—are selected for simulation and comparative analysis. The SSP–RCP framework combines Shared Socioeconomic Pathways (SSPs), which quantify trajectories of socioeconomic development, with Representative Concentration Pathways (RCPs), which characterize trends in atmospheric pollutants and greenhouse gas emissions under varying resource use modes [57]. The scenario parameters are determined based on a comprehensive assessment of historical trends, regional development plans, and climate model projections (Table 3). The specific logic of scenario construction is as follows:
SSP1-2.6 (Sustainability Scenario): This scenario emphasizes sustainable development, assuming low population and GDP growth rates, a low-emission pathway, and moderate technological advancement. Environmental protection policies are effectively implemented, leading to significant improvements in ecological quality and a balanced relationship between socioeconomic development and climate goals.
SSP2-4.5 (Middle-of-the-Road Scenario): Based on historical trends, this scenario represents a baseline development trajectory without major policy shifts. Socioeconomic growth and carbon emissions are set at moderate levels, reflecting inertia-driven dynamics. Moderate growth rates and steady technological progress are assumed.
SSP5-8.5 (Rapid Development Scenario): This scenario features high economic growth, intensive energy consumption, and high carbon emissions. It assumes rapid population and GDP growth, accelerated technological advancement, but weak environmental regulation. Industrialization and urbanization proceed at a fast pace, accompanied by increased resource pressure and environmental risks.

2.3.3. Land Use Simulation and Validation Based on the PLUS Model

The PLUS model (Patch-generating Land Use Simulation) is a land use simulation framework based on Cellular Automata (CA), composed of two core modules: the Land Expansion Analysis Strategy (LEAS) and the CA model based on Random Seeds (CARS) [58]. The LEAS module extracts land expansion patches between two time points and applies a random forest algorithm to identify the key driving factors of land use change, thereby estimating the development probability for each land use type. The CARS module then simulates land expansion using these probabilities and spatial constraints through multi-type random patch seeding and cellular automaton rules. Drawing on prior studies [59,60] and incorporating relevant policy documents such as the Wuhan Territorial Spatial Master Plan (2021–2035), this study selects a total of 22 LUCC driving factors, categorized into three major groups (Figure 4).
The CARS module simulates the spatial distribution of future land use by integrating the development probabilities of each land use type, applying spatial constraint factors, and incorporating parameters such as predicted land demand, neighborhood weights, and the land use transition cost matrix. These factors collectively determine the spatial allocation outcomes under different land expansion scenarios. In this study, specific land use constraints were selected based on policy and ecological considerations to limit inappropriate conversions (Figure 5).
To evaluate the reliability of the simulation results generated by the PLUS model, this study employs the Kappa coefficient as a measure of simulation accuracy. The Kappa coefficient quantifies the agreement between the simulated results and actual land use data, reflecting the classification accuracy of the model under multi-category scenarios. A Kappa value exceeding 0.75 is generally considered indicative of high simulation accuracy and strong model performance [61,62].

2.3.4. Land Use Pattern Evaluation Based on Fractal Dimension

Land use patterns reflect not only the quantity and spatial distribution of land use types, but also the morphological complexity, boundary regularity, and the degree of spatial aggregation or fragmentation—key structural characteristics often overlooked in conventional land use simulation. However, these structural attributes are critical for understanding ecological processes, organizing urban functions, and guiding spatial planning and regulation [63]. Under the dual pressures of rapid urbanization and complex climatic conditions, simulations based solely on land quantity and location are no longer sufficient to reveal the underlying mechanisms of urban spatial system evolution and ecological stability.
Fractal structures are not only widespread in natural geomorphological systems but also deeply embedded in the formation and evolution of urban spatial morphology. In natural environments, features such as coastlines, fjords, mountain ranges (e.g., the Himalayas and the Andes), meandering river networks, and volcanic landforms (e.g., Iceland and Hawaii) typically exhibit high fractal dimensions due to their complex geometrical shapes and highly self-organizing evolutionary processes [64,65,66,67]. These characteristics reflect the inherent spatial complexity and scale invariance of natural systems in the absence of external control. Similarly, urban systems—as a form of complex adaptive systems—tend to exhibit spontaneous and decentralized spatial development processes. Under the combined influence of market forces, policy interventions, and population agglomeration, urban space gradually evolves into morphological structures with fractal geometric characteristics. These are manifested in irregular boundary shapes, spatial heterogeneity of land patches, and multi-scale spatial organization patterns [48,68,69,70]. Therefore, the fractal dimension has emerged not only as a tool to measure structural complexity in natural systems, but also as a robust quantitative index to characterize urban spatial structure. It aids in identifying fragmentation trends, structural evolution paths, and hidden spatial risks that are often overlooked by conventional land use indicators.
To enhance the model’s explanatory power with respect to spatial structure, this study introduces the FD as a structural evaluation metric to quantify the complexity of land use patterns. The FD is calculated based on a power-law relationship between area and perimeter, offering a simplified yet effective measure of structural complexity. Although it is not equivalent to the Hausdorff fractal dimension in a strict mathematical sense, it serves as a widely applied empirical index in studies on urban boundaries, self-organizing spatial forms, and landscape pattern analysis, demonstrating strong applicability and interpretability.
P = k A D / 2 27 F 9 D = 2 ( log P / log A ) + C i
In the fractal dimension calculation, P represents the perimeter (boundary length) of the land patch; A is the area of the land patch; k is a scaling coefficient; C is the undetermined constant, where the subscript i denotes the corresponding administrative “block”; D is the fractal dimension, with a typical range of 1 ≤ D ≤ 2. A higher D value indicates a more complex and irregular boundary, while a lower D implies smoother, more compact shapes. The intercept term Ci is the constant in the linearized formula, and its value may vary depending on differences between administrative units or land use types.
At the operational level, this study calculates FD values using historical land use data from 2000 to 2020 together with simulated land use maps for 2030 under three climate scenarios: SSP1-2.6, SSP2-4.5, and SSP5-8.5. For each scenario and time point, the area and perimeter of typical land use categories are extracted to compute corresponding FD values. By comparing FD values over time and across scenarios, this study reveals the evolutionary trajectory of urban form, the structural differentiation of spatial patterns, and the self-organizing behavior of the land system. The analysis provides a quantitative basis for ranking development scenarios, evaluating structural stability, and guiding urban spatial planning under future climate uncertainties.

3. Results and Analysis

3.1. Model Accuracy Evaluation

3.1.1. Accuracy Verification of the SD Model

(1)
Historical Error Test
To assess the reliability of the SD model, 2010 and 2020 were selected as the main sample years for historical error testing. Considering the significant impact of the COVID-19 pandemic on land use dynamics in 2020, the years 2011 and 2019 were additionally included as reference years for comparative analysis. The test results are presented in Table 4.
As shown in Table 4, the relative errors between the simulated and observed land use values for most land categories are within ±5%, indicating a high level of model accuracy. It is generally accepted that when the relative error is within ±10%, the model can be considered to have good fitting performance, which meets the standard modeling accuracy requirements [71,72]. Among the land use types, the area of water bodies exhibited minimal simulation error, which is consistent with actual conditions. This is largely attributed to Wuhan’s strict ecological protection policies that have maintained long-term stability in water resources. The category of unused land was not included in the error analysis, as it primarily functions as a residual adjustment item in the total land balance. It is worth noting that in 2020, the simulation errors for construction land and forest land were relatively higher. This deviation may be associated with the impact of the COVID-19 pandemic, which disrupted the pace of economic development and urban construction. To address this anomaly, the year 2019 was added as a comparative reference. Results show that the simulation accuracy for 2019 was significantly better, further validating the robustness and reliability of the SD model under non-crisis conditions.
In summary, the SD model constructed in this study demonstrates strong fitting performance and predictive reliability, accurately capturing the trends in land use quantity changes in Wuhan. It thus provides a solid foundation for subsequent scenario-based land demand forecasting.
(2)
Parameter Sensitivity Test
To evaluate the operational stability of the SD model, a sensitivity analysis was conducted using nine key parameters. Each parameter was adjusted by ±10% annually, and the resulting impact on the predicted land use demand was observed. The analysis results are presented in Table 5. All nine parameters exhibited sensitivity coefficients less than 1, indicating that the SD system is insensitive to individual parameter fluctuations. This suggests that the model operates in a stable range and is not overly dependent on any single input variable. These findings confirm that the system dynamics model for land demand developed in this study performs reliably and stably. It is therefore suitable for simulating future land use demand in Wuhan under different climate and socioeconomic scenarios.
Based on the above validation results, it can be concluded that the SD model developed in this study demonstrates good stability and reliability, and is therefore suitable for predicting future land use demand in the study area.

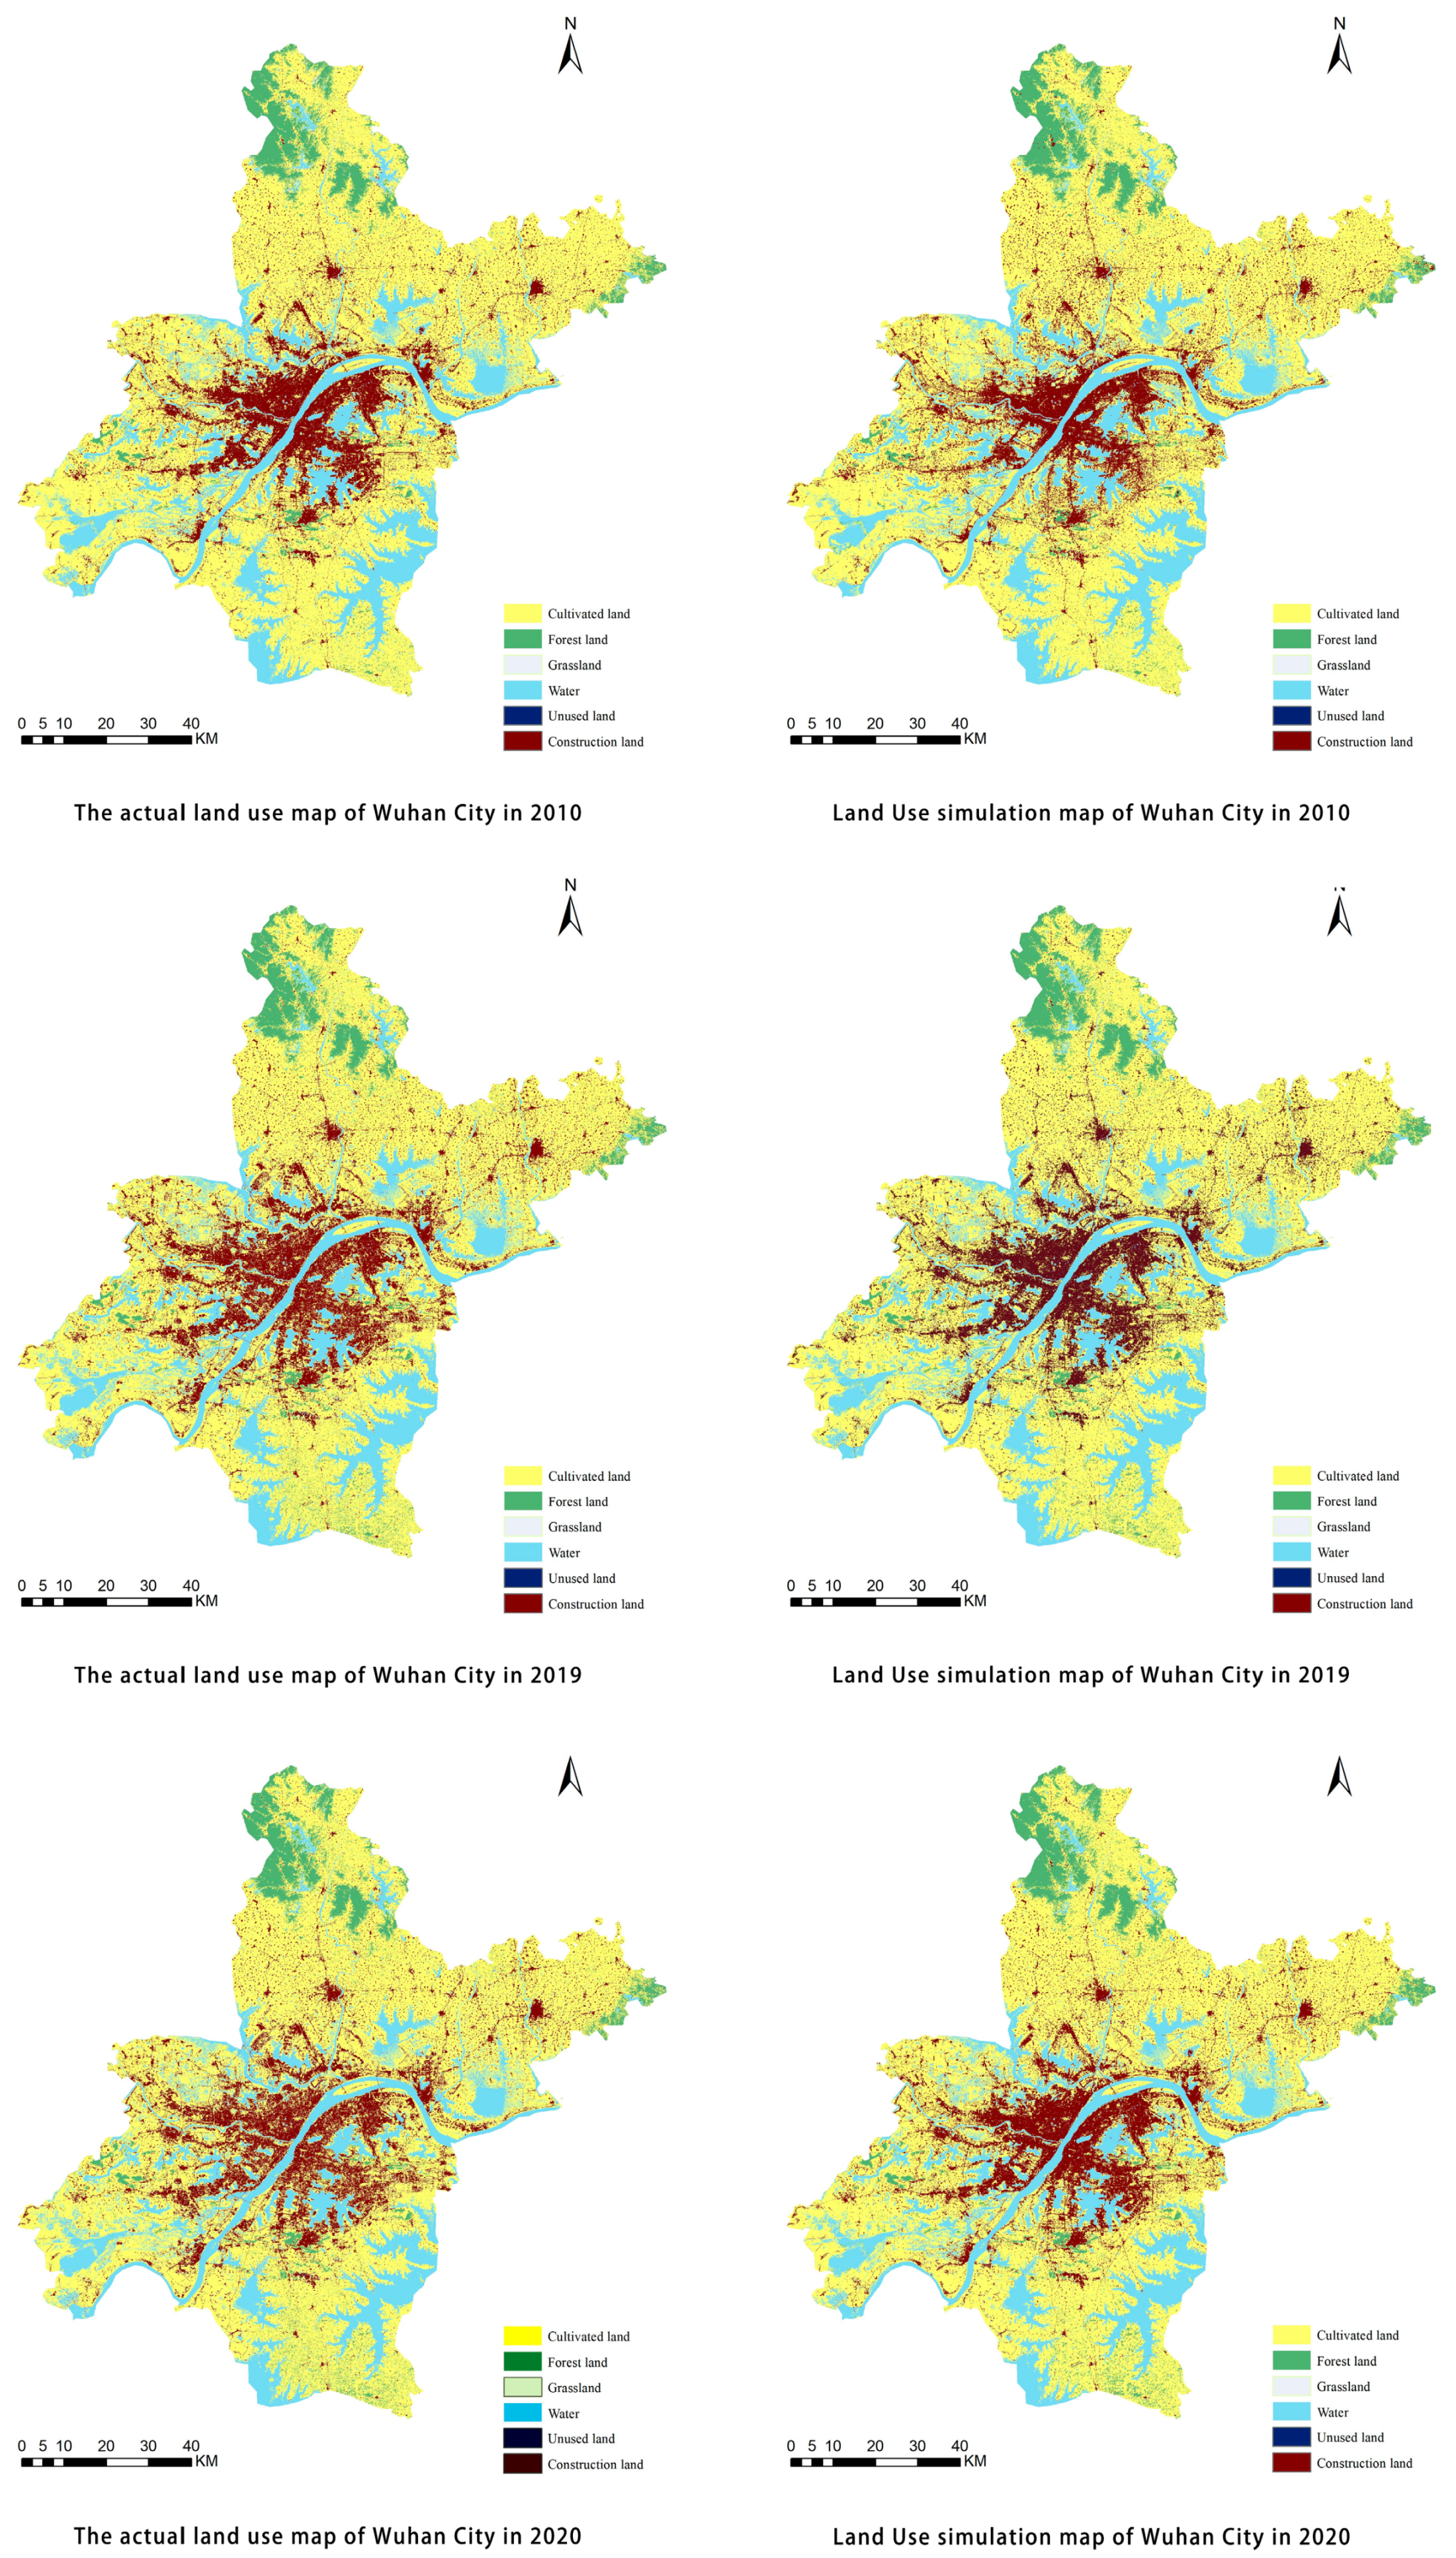
3.1.2. Accuracy Verification of the PLUS Model

To evaluate the simulation accuracy of the PLUS model, this study conducted land expansion analysis using land use data from 2000 and 2010. Based on this, and in combination with selected driving factors and constraint datasets, the land use spatial patterns for 2019 and 2020 were simulated (with 2019 serving primarily to examine whether special events might influence land use patterns). The simulated results were then compared with the actual land use maps for 2019 and 2020 (see Figure 6). The results indicate that the simulated spatial structure is generally consistent with the actual land use distribution. For the 2010 simulation, the Kappa coefficient reached 0.8135 and the overall accuracy was 0.8970; for the 2019 simulation, the Kappa coefficient was 0.7929 and the overall accuracy was 0.8790; for the 2020 simulation, the Kappa coefficient was 0.7924 and the overall accuracy was 0.8810. From 2010 to 2020, the simultaneous decline in Kappa coefficient and overall accuracy suggests a slight weakening in the model’s predictive performance. This change may be attributed to external disturbances—such as the COVID-19 pandemic—that were not fully captured by the model’s logic. Nevertheless, the model’s overall accuracy remains at a high level (average Kappa > 0.7996; average overall accuracy > 0.8856), indicating that the model maintains strong spatial predictive capability across different time periods. The PLUS model constructed in this study demonstrates the ability to accurately capture land use change trends and is suitable for future LUCC (Land Use/Cover Change) simulations under various scenarios.

3.2. Analysis of Multi-Scenario Simulation Results

(1)
Land Use Demand Forecasting Under Multiple Scenarios
Based on the parameter settings of the three selected scenarios, the SD model was used to calculate the projected land use demand for various categories in the study area by the year 2030. The results are presented in Table 6.
According to the simulation results in Table 6, when compared to the actual land use data for 2020, all three scenarios project varying degrees of increase in construction land, grassland, and forest land by 2030, reflecting a parallel trend in urban expansion and green space restoration. Specifically, construction land is projected to increase by 26.95% under SSP1-2.6, 37.90% under SSP2-4.5, and 54.41% under SSP5-8.5, indicating that the more aggressive the economic development scenario, the more significant the expansion of built-up areas. Grassland shows the most pronounced change, with projected increases of 81.21%, 153.96%, and 248.15% under the three respective scenarios. This may be attributed to factors such as policy-driven ecological restoration and land consolidation programs, highlighting a strong trend in ecological land recovery. Forest land also increases across all scenarios, with growth rates of 4.77% (SSP1-2.6), 6.41% (SSP2-4.5), and 10.45% (SSP5-8.5), suggesting continued strengthening of ecological protection and afforestation efforts. In contrast, cultivated land declines under all scenarios—by 8.46%, 12.51%, and 18.48%, respectively—indicating that urban expansion continues to exert pressure on farmland resources. Furthermore, the area of water bodies remains relatively stable, consistently around 1786.99 km2, with minimal variation. This stability is likely due to ecological redlines and natural constraints, which limit the spatial transformation of aquatic ecosystems.
(2)
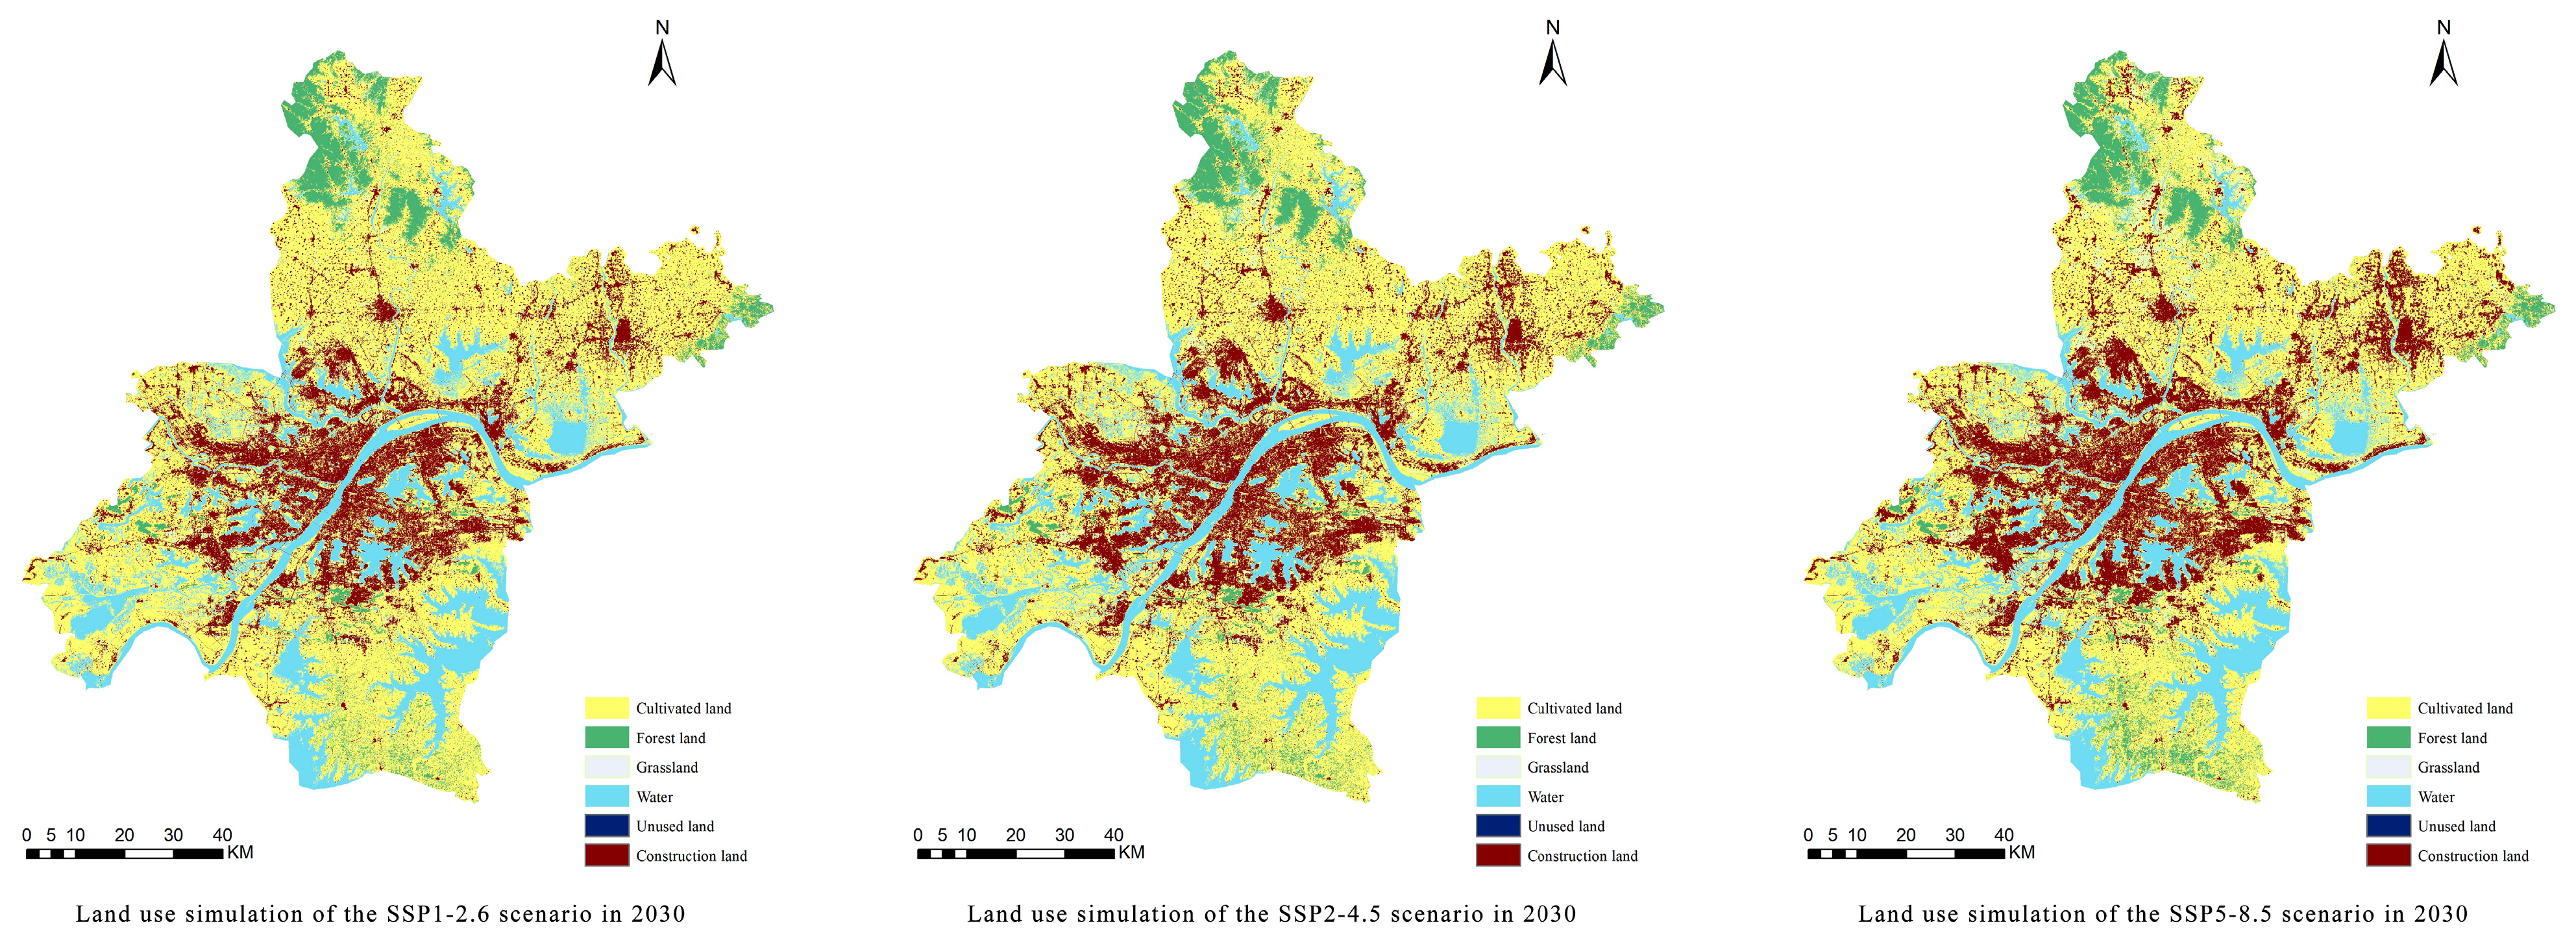
Spatial Pattern Simulation of Land Use Under Multiple Scenarios
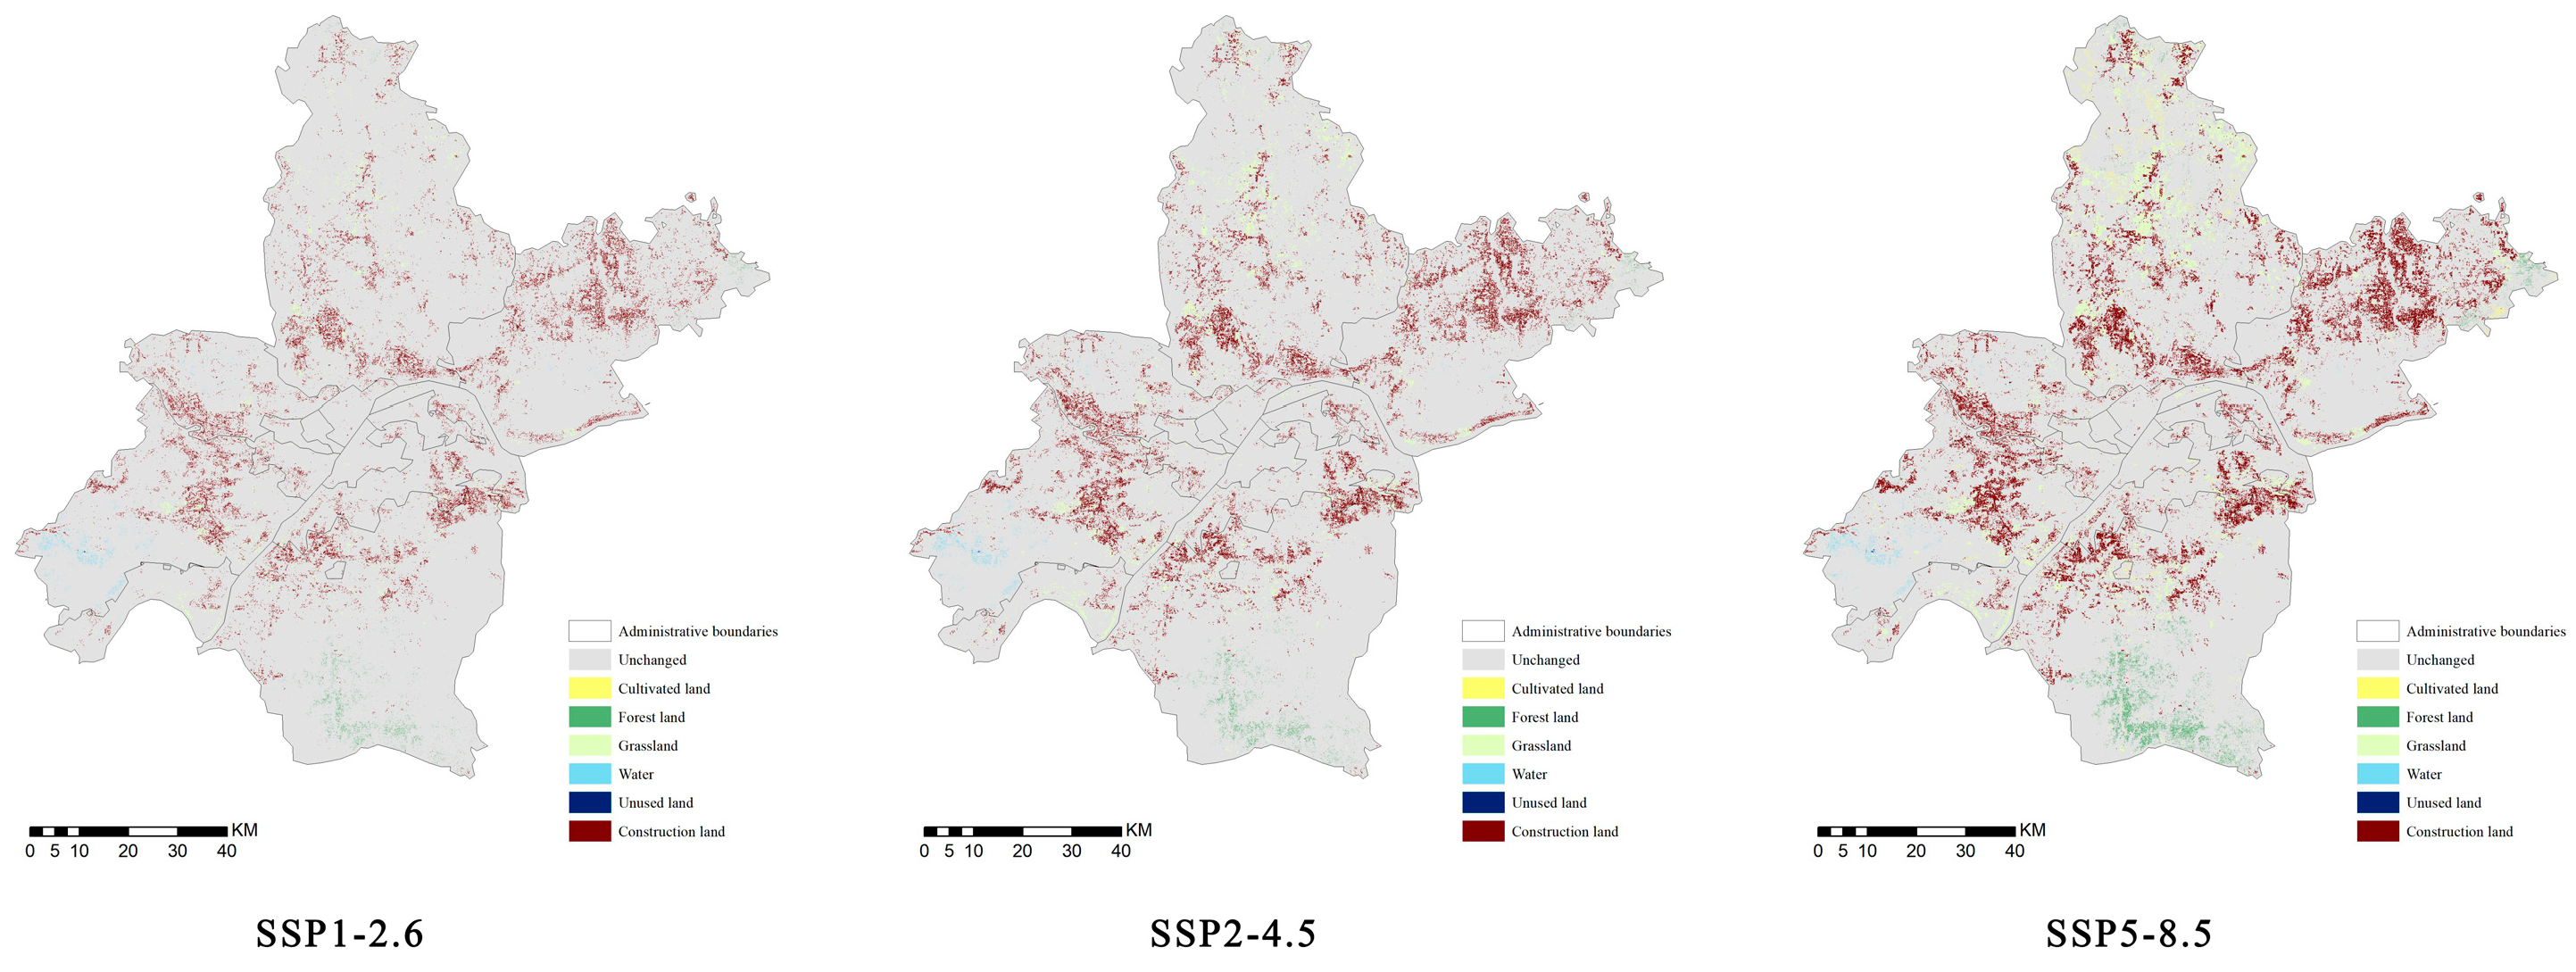
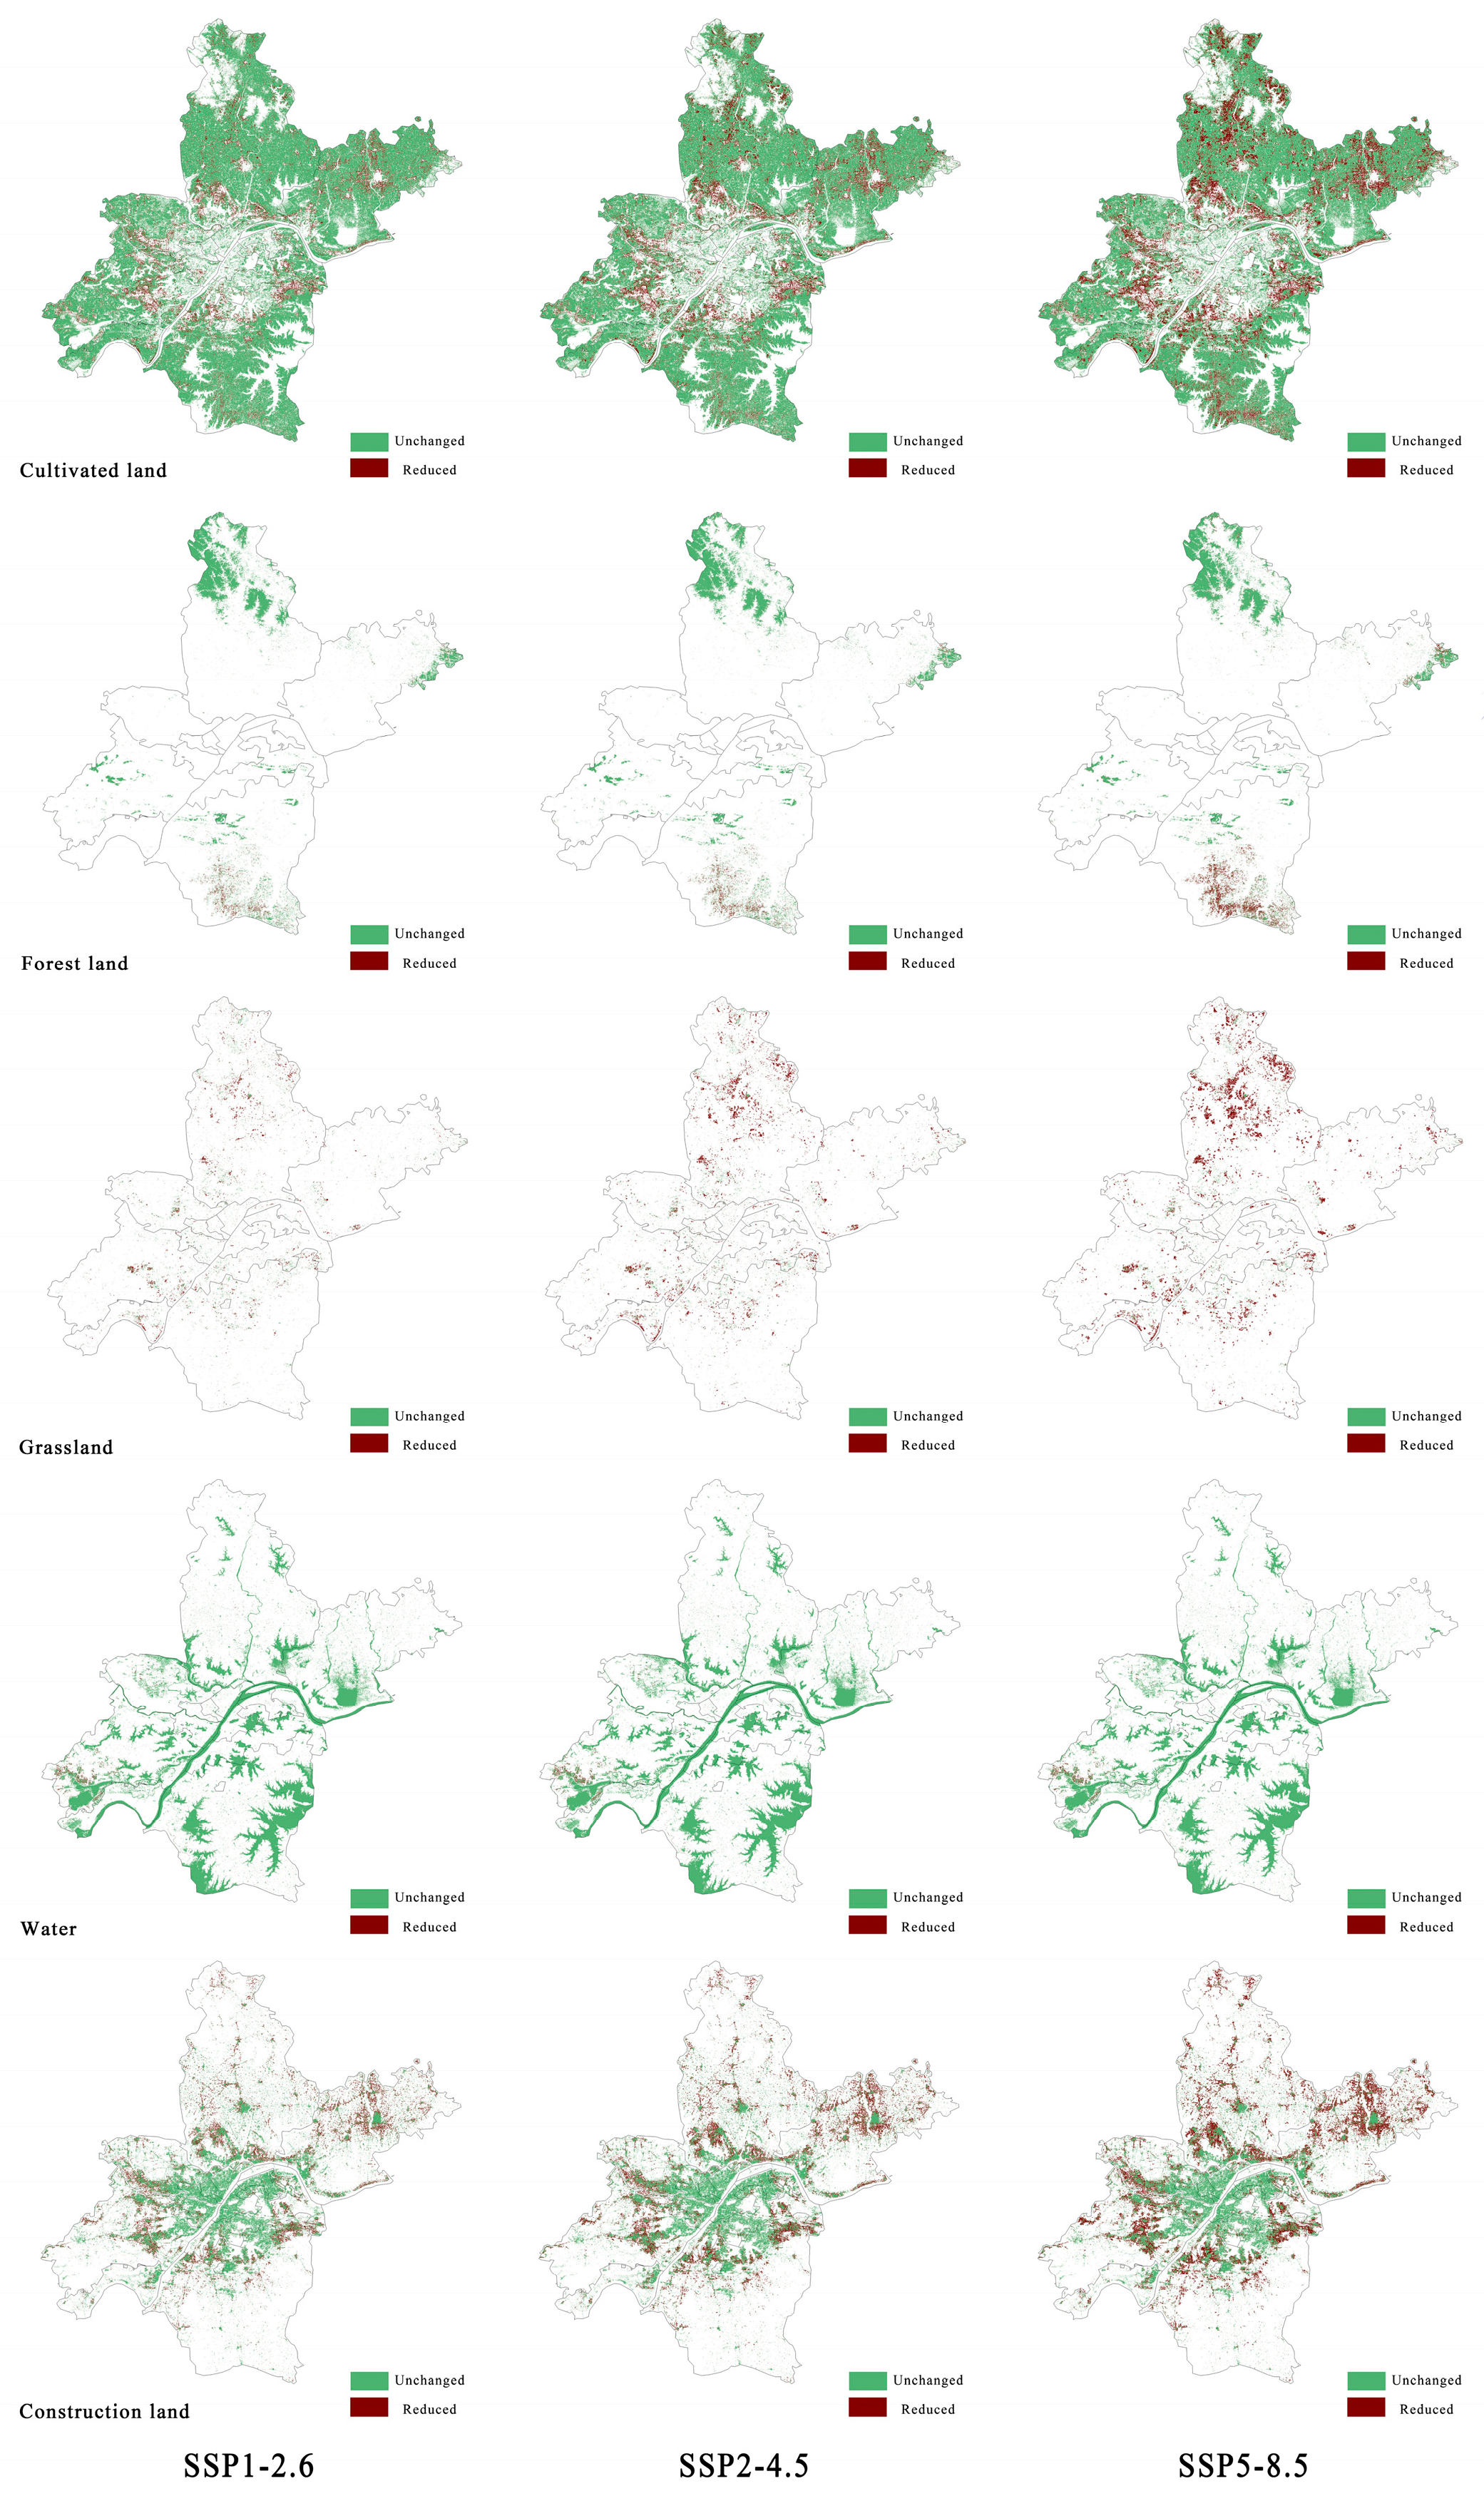
Using the 2020 land use data of the study area as the initial condition, a land use transition cost matrix was established for each scenario based on its respective development characteristics (Table 7), along with the designation of restricted development zones. The PLUS model was then applied to simulate the spatial patterns of land use in 2030 under the three scenarios. The simulation outputs are illustrated in Figure 7.
The spatial patterns of land use in 2030 exhibit distinct differences across the three climate scenarios:
Under the SSP1-2.6 scenario, land use changes are the most moderate and sustainable. Although construction land increases by 385.18 km2 (+27.0%) compared to 2020, the overall expansion remains limited, suggesting that ecological protection policies effectively constrain urban spatial growth. Additionally, forest land and grassland increase by 28.02 km2 and 90.26 km2, respectively, reflecting a steady upward trend in ecological land use and indicating positive outcomes in regional ecological restoration. Although cultivated land declines slightly, the reduction is controlled within 8.5%, demonstrating strong preservation of farmland under urban development pressure—aligned with strategies balancing food security and ecological sustainability.
The SSP2-4.5 scenario reflects a progressive adjustment of land use based on historical trends. Construction land expands by 541.74 km2 (+37.9%), while cultivated land decreases by 763.40 km2 (−12.5%). Grassland and forest land increase by 171.13 km2 and 37.65 km2, respectively, with ecological land showing even greater growth than in SSP1-2.6, highlighting potential for green space restoration. Overall, this scenario achieves a relative balance between economic growth and ecological recovery, though it still faces the risk of accelerating farmland loss, underscoring the need to strengthen land use conversion controls in future policy.
In contrast, the SSP5-8.5 scenario shows the most intensive land use transformation. Construction land surges by 777.65 km2 (+54.4%), while cultivated land sharply declines by 1127.76 km2 (−18.5%), becoming the main source for urban expansion. This reflects a high level of encroachment on agricultural land by urban growth. Although there are some increases in grassland and forest land, much of this growth occurs in peripheral or low-ecological-value areas, raising concerns about the effectiveness and sustainability of ecological restoration. Overall, this scenario presents a typical pattern of “disordered urban expansion—severe farmland loss—ecological fragmentation”, with signs of core-area hollowing in certain districts, posing serious threats to regional ecological security and spatial sustainability.
(3)
Land Use Transition Characteristics Under Multiple Scenarios
To further elucidate the land use transition dynamics under different climate scenarios by the year 2030, this study conducted a comparative analysis of land use data from 2020 and 2030. The overall land conversion patterns were compiled and are visualized in Figure 8, while a more detailed category-specific analysis was carried out for five major land use types: cultivated land, forest land, grassland, water bodies, and construction land (Figure 9). The results indicate that the dominant land use transitions involve the conversion of cultivated land into construction land, forest land, and grassland, which are primarily classified as ecological or urban use types. This trend reflects a spatial evolution characterized by “compression of production land—recovery of ecological land—urban expansion dominance.” The findings underscore a shift in land system dynamics, driven by urban development priorities, ecological restoration initiatives, and pressure on agricultural spaces.
Under the SSP1-2.6 scenario, the major changes in cultivated land are concentrated around the urban fringe areas, particularly at the borders between Hongshan and Jiangxia Districts, between Dongxihu and Caidian, as well as in central Huangpi and central Xinzhou. These areas show clear signs of conversion from farmland to forest and grassland, reflecting effective implementation of ecological restoration policies. In the SSP2-4.5 and SSP5-8.5 scenarios, the spatial patterns of cultivated land change are similar to those in SSP1-2.6 but exhibit greater extent and intensity, indicating that stronger development pressure results in more extensive farmland conversion to non-agricultural uses. Forest land increases significantly in all three scenarios, with most new forest areas appearing in eastern Xinzhou and southern Jiangxia. However, these newly added forest patches are often located on the urban–rural fringe or within ecological compensation zones, which may result in a high degree of fragmentation and lower ecological quality, requiring follow-up restoration planning.
Regarding grassland, the SSP1-2.6 scenario shows only a modest increase, mainly at the edges of the urban boundary. In contrast, grassland expansion is more evident in the SSP2-4.5 scenario, especially in Huangpi District, although the new patches remain dispersed and fragmented, raising concerns about landscape connectivity and functional integration. Under SSP5-8.5, grassland expands more extensively, forming large, contiguous patches, some of which even extend toward central urban areas. This expansion may be associated with tourism-oriented development around ecological attractions such as Mulan Tianchi in Huangpi. Water bodies exhibit minimal changes across all scenarios, with slight variation primarily along the Huangsi River in Caidian District. This stability is largely attributed to the strict enforcement of ecological redlines and the Yangtze River Protection Law, indicating the high level of spatial regulation governing aquatic land use. Construction land shows a clear gradient of expansion across scenarios. In SSP1-2.6, urban growth is relatively restrained and mainly occurs outside the core city, including parts of Huangpi (near Jiang’an), central Xinzhou, the Caidian–Dongxihu boundary, and the northern fringe of Jiangxia. In SSP2-4.5, expansion extends further into northern Hongshan and Qingshan, with the urban structure pushing toward the outer ring. Under SSP5-8.5, construction land increases substantially in both density and extent, particularly along transportation corridors in Huangpi and across Xinzhou, where large-scale expansion reaches close to the northern administrative boundary, presenting a typical pattern of high-intensity, low-regulation urban sprawl.

3.3. Evaluation of Land Use Pattern Complexity Based on Fractal Dimension

(1)
Fractal Dimension Analysis of Different Land Use Types
The fractal dimension of Wuhan’s administrative boundary is 1.3074. This relatively low level of boundary complexity enhances the spatial recognizability of administrative management and facilitates regional coordination. Furthermore, a moderate degree of boundary complexity also reflects Wuhan’s spatial flexibility and diversity during its urban development process, which may be conducive to promoting the growth of multi-functional zones—such as waterfront development and the stimulation of peripheral districts. The evolution of fractal dimensions reveals that the urban spatial boundaries in the study area experienced a marked transformation from relatively regular forms to highly complex structures between 2000 and 2020 (Figure 10). The degree of structural response varied across land use types, reflecting a diversified trajectory of urban expansion patterns and boundary regulation mechanisms. This section focuses on construction land, cultivated land, and forest land as representative categories for fractal dimension analysis. Although grassland, water bodies, and unused land occupy a certain proportion within the overall land use classification system, this study does not include their fractal dimension 0 calculations, for the following reasons. First, these land types are typically scattered, small in area, and subject to seasonal variation, hydrological processes, or temporary development activities, resulting in unstable and inconsistent boundary features that do not reliably reflect structural evolution. Second, due to limitations in remote sensing resolution and classification accuracy, their boundaries often involve mixed pixels or blurred edges, which do not meet the fundamental requirements of FD calculation, such as clear and continuous contours. Third, compared to construction land, cultivated land, and forest land, these land types exhibit relatively minor structural changes under urban expansion and are less sensitive to policy intervention, making them peripheral to the core focus of current urban spatial transformation studies. Lastly, the limited number of samples for these categories prevents their meaningful inclusion in correlation analyses with socioeconomic variables such as population and GDP, which may result in statistically insignificant or misleading interpretations. Based on these considerations, this study concentrates on the three primary land use types that show pronounced boundary change, clear structural characteristics, and strong policy relevance. For construction land, the fractal dimension was 1.7626 in 2000. After a temporary decline to 1.7009 in 2005, it rebounded to 1.7634 in 2010, indicating that early-stage urban expansion followed relatively orderly, compact boundaries—likely influenced by large-scale, centralized development policies. However, since 2010, the fractal dimension increased rapidly, reaching 1.9034 in 2015 and 1.9088 in 2020. This trend reflects a significant rise in boundary fragmentation and nonlinear spatial structure, suggesting leapfrogging, multi-directional urban sprawl. Such boundary complexity is likely driven by the intensification of multi-core urban development, increased construction pressure, and lagging spatial regulation. In the future scenario simulations, the fractal dimensions of construction land reach 1.9410 (SSP1), 1.9357 (SSP2), and 1.8968 (SSP5), indicating that urban boundary complexity remains high across all scenarios. Notably, SSP1, the sustainable development pathway, shows the highest fractal dimension, suggesting that while spatial expansion becomes more compact and policy-constrained, the structure becomes more refined, diverse, and ecologically embedded.
For cultivated land, the fractal dimension remained relatively stable, ranging from 1.79 to 1.84. Between 2000 and 2020, it increased slightly from 1.7945 to 1.8209, suggesting that while farmland experienced encroachment from urban expansion, its boundary complexity remained limited. Under future scenarios, the fractal dimension continues a mild upward trend: 1.8776 under SSP1, 1.8689 under SSP2, and 1.8524 under SSP5. This indicates that while high-intensity development may increase fragmentation in farmland structure, the overall complexity remains constrained—likely due to institutional boundaries or ecological redlines.
For forest land, the fractal dimension consistently remained low (1.5–1.6) with no notable increase after 2020, suggesting that its boundary morphology is still largely defined by natural edges, maintaining strong structural stability. However, under the SSP5 scenario, the fractal dimension of forest land declines to 1.5004, with an R2 value of only 0.7975, the lowest among all samples. This indicates that under high-intensity development, forest boundaries may become compressed and simplified, exposing ecological spatial patterns to degradation risks.
In summary, changes in fractal dimensions across land use types clearly reflect the phased evolution of urban boundary complexity. Construction land exhibits the strongest nonlinear structural growth, cultivated land evolves slowly and relatively steadily, while forest land demonstrates robust edge resilience but scenario-specific vulnerability. The overall upward trend in fractal dimensions under all future scenarios suggests that, in the absence of effective spatial coordination mechanisms and boundary control strategies, urban expansion is likely to follow a trajectory of increased spatial disintegration and ecological risk. Incorporating fractal dimension analysis into urban land use simulation and spatial governance not only helps to identify critical risk points in boundary evolution, but also provides a quantitative basis for optimizing future urban growth boundaries.
(2)
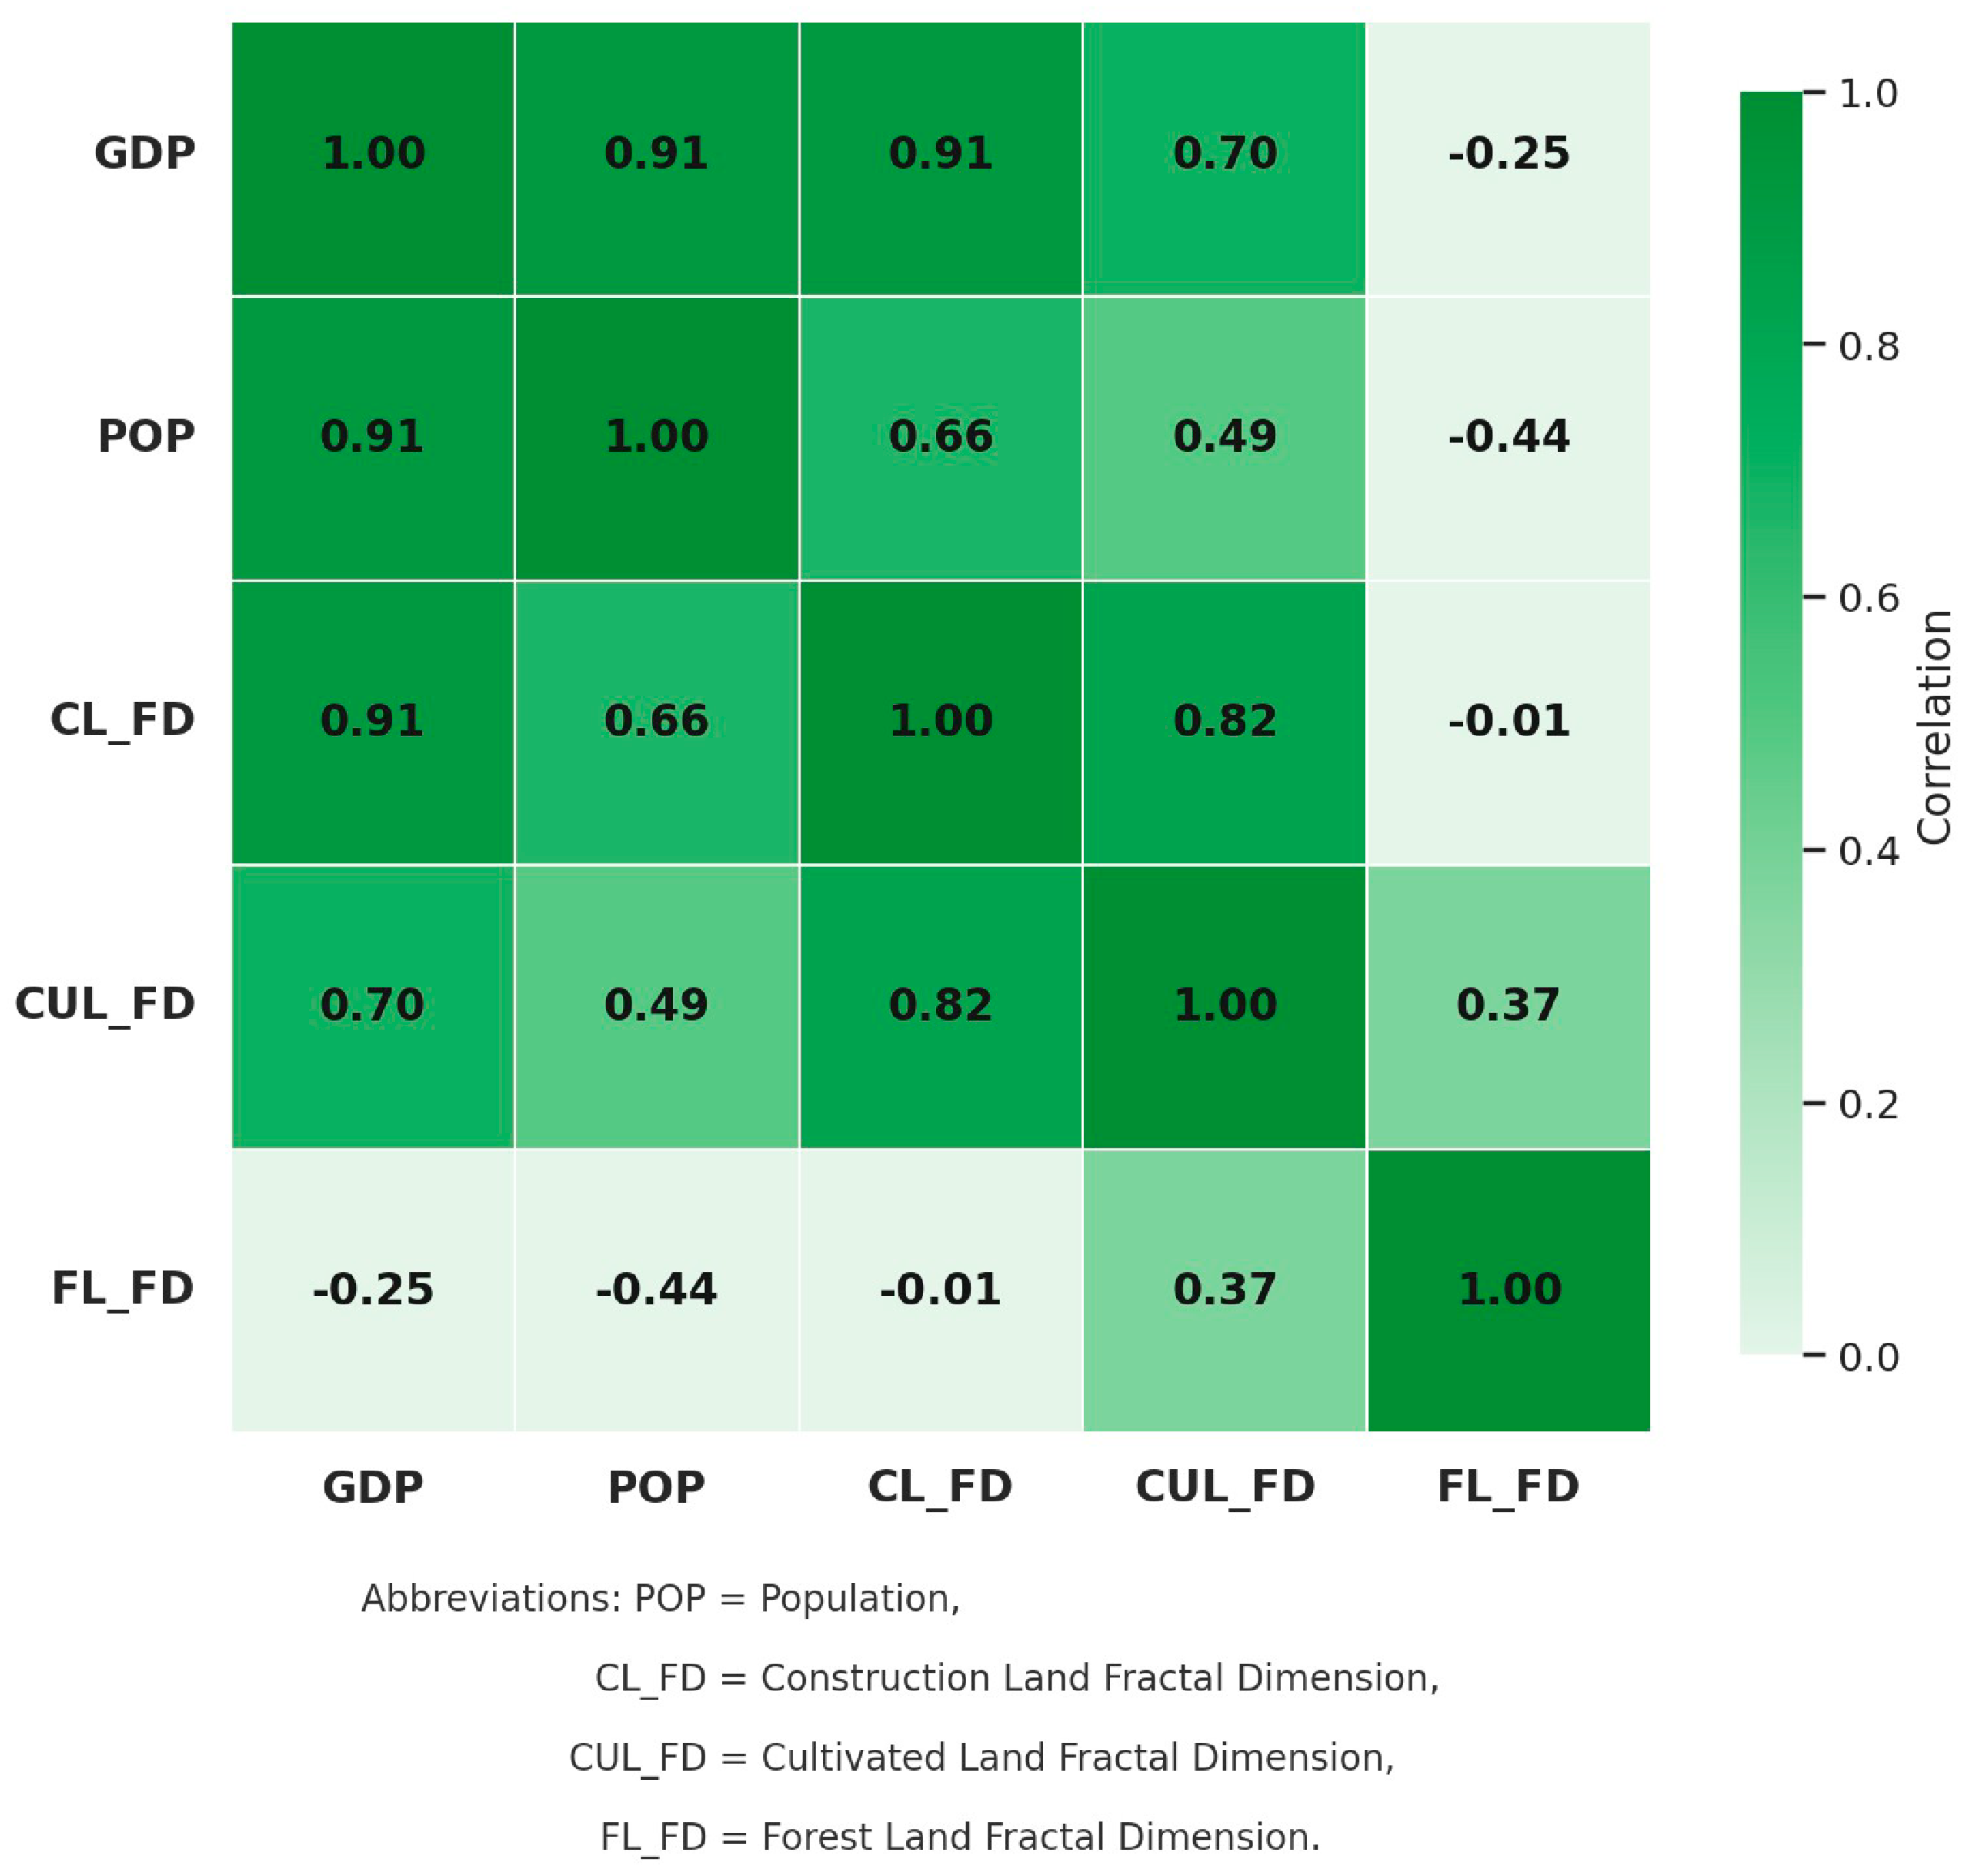
Coupled Analysis of Fractal Dimension, Population, and GDP
To systematically reveal the coupled driving mechanisms between population growth, economic development, and the evolution of urban spatial structure, this study analyzes the correlation between the FD of different land use types and two key socioeconomic indicators—urban population and Gross Domestic Product (GDP)—in Wuhan from 2000 to 2020 (Figure 11). The results show that both population expansion and economic growth significantly influence the complexity of urban spatial boundaries. However, the structural responses differ across land types, reflecting the diversity of urban expansion trajectories and the evolution of spatial organization patterns.
Under population-driven dynamics, the fractal dimension of construction land is strongly and positively correlated with population growth (r ≈ 0.66). As the population increased from 7.49 million to 9.16 million, the FD of construction land rose from 1.7626 to 1.9088, indicating that the spatial morphology of urban development has shifted from compact and regular patterns to more fragmented, multi-directional, and irregular forms. This trend suggests that under endogenous growth pressures, urban spatial systems undergo nonlinear structural reconfiguration to accommodate increasing demands for housing, transportation, and public services.
Cultivated land also shows a moderate positive correlation between FD and population (r ≈ 0.49), implying an indirect impact of urban population growth on farmland boundary structure. As construction land expands outward, the spatial boundaries of cultivated land become increasingly fragmented and less regular, indicating growing tension and spatial competition between urban development and farmland preservation. This highlights the need to strengthen boundary stability and spatial connectivity for cultivated areas.
In contrast, the FD of forest land is negatively correlated with population (r ≈ −0.44), suggesting that urbanization exerts a compressive and simplifying effect on forest boundaries. Although the total forest area may not decrease significantly, the tendency toward boundary regularization and complexity reduction indicates increased spatial pressure on forest edges, especially in peri-urban zones. This may result in landscape fragmentation and heightened ecological degradation risk.
From an economic perspective, the relationship between GDP and construction land FD is even stronger, with a high positive correlation (r ≈ 0.91). Between 2000 and 2020, GDP in Wuhan grew rapidly from 120.68 billion CNY to 1,551.61 billion CNY, while the FD of construction land rose markedly—particularly after 2010, jumping from 1.7634 (2010) to 1.9034 (2015). This reflects the profound influence of economic growth on urban form, through industrial agglomeration, infrastructure investment, and spatial restructuring, which collectively intensify the nonlinear expansion of urban boundaries.
The FD of cultivated land also increases with GDP (r ≈ 0.70), indicating that economic development amplifies the pressure of farmland conversion to construction land. This reflects heightened spatial competition under accelerated development, contributing to increased boundary complexity and weakening land use stability.
In contrast, the relationship between GDP and forest land FD is weakly negative (r ≈ −0.25). While forest areas remain largely intact, their boundary shapes tend to become more regular and simplified, suggesting marginalization of ecological spaces in the face of economic expansion. This trend may lead to reduced landscape diversity and ecological connectivity, increasing overall system vulnerability. However, a correlation coefficient of 0.25 is not considered strong, which may suggest that other factors have a greater influence on changes in forest boundaries, or that the relationship itself is more complex than a simple linear one.
In conclusion, both population growth and economic expansion exert significant influence on the complexity evolution of urban spatial structure. However, the responses differ across land use types—manifesting as increased complexity, boundary fragmentation, or boundary regularization, depending on land function and location. A deeper understanding of the “population–economy–spatial structure” coupling mechanism is crucial for clarifying urban land use evolution logic, enhancing spatial governance capacity, and formulating targeted territorial optimization strategies.

4. Discussion

4.1. Driving Mechanism of Climate Change on Land Use Evolution

With the increasing frequency of extreme weather events, investigating the feedback mechanisms between climate change and land use has become essential for preserving urban identity, optimizing spatial structure, and enhancing climate resilience. A planning framework integrating risk identification, spatial adaptation, and adaptive governance is vital not only for sustainable land resource use but also for promoting urban resilience and mitigating climate impacts. This study constructed and validated an SD-PLUS model that incorporates both socioeconomic and climatic factors to simulate spatiotemporal land use changes in the study area by 2030 under multiple future climate scenarios. Results show that land use change is closely linked to climate change, and the patterns of change differ across scenarios. Under SSP2-4.5, climate change is moderate, and land use transitions occur gradually. In SSP5-8.5, the high-emission, growth-driven scenario leads to intense climate shifts and drastic land changes, with uncontrolled construction land expansion encroaching on ecological and productive land. In SSP1-2.6, the sustainable pathway results in the most stable LUCC, with ecological and productive land being reasonably protected. Additionally, climate change is strongly tied to land degradation. In SSP2-4.5 and SSP5-8.5, ecological land decreases by 4.06% and 7.08%, respectively. Temperature anomalies and extreme weather lead to degradation of land and ecological functions, which in turn increase greenhouse gas emissions and weaken soil carbon storage, further accelerating climate change. Only in SSP1-2.6 is ecological land sustainably managed, helping mitigate climate impact.
In SSP1-2.6, economic growth and ecological conservation are well balanced. With strict controls on construction land and optimized land structures, the city achieves steady economic growth while ensuring ecological security. In SSP2-4.5, both economic development and ecological protection remain at intermediate levels, though ecosystem services begin to decline. Planning efforts must focus on gradual optimization of land structures under current policy frameworks. In SSP5-8.5, rapid economic growth comes at the cost of severe ecological degradation. Despite short-term economic gains, long-term sustainability is threatened. Stronger environmental policies and restoration efforts are urgently needed to slow ecosystem decline.

4.2. Structural Significance of Land Use Pattern Evaluation

Urban land use evolution does not follow a simple linear or monocentric trajectory; rather, it reflects complex interactions, self-organization, and scale-dependence, resulting in dynamic and diverse spatial forms across different development stages. Traditional land use simulations often emphasize land quantity and spatial distribution, yet tend to neglect spatial quality dimensions such as structural complexity, boundary morphology, and pattern continuity.
To address this gap, this study introduces Fractal Dimension (FD) as a structural metric to assess urban boundary complexity. Results reveal a notable rise in the FD of construction land, especially after 2010, peaking at 1.9034 in 2015 and reaching 1.941 under the SSP1 scenario in 2030. This indicates increasing spatial irregularity and nonlinearity in urban form.
In contrast, cultivated land shows relatively stable FD values between 1.73 and 1.82, with only minor fluctuations over time. However, under SSP1, the FD rises to 1.8776, suggesting increased fragmentation in ecological-priority settings—possibly due to scattered preservation and ecological coupling strategies. Forest land consistently shows lower FD values than the other types, reflecting its natural boundaries and spatial stability. Its FD rises slightly from 2000 to 2020, but remains low under future scenarios.

4.3. Disruptive Effects of Sudden Events on Land Use Systems

As a typical complex adaptive system, urban land use is highly sensitive and responsive to external shocks. During the COVID-19 pandemic in 2020, Wuhan’s land development pace was severely disrupted. Model back-testing revealed significantly higher simulation errors for construction and forest land that year, compared to other periods.
This confirms that sudden events can rapidly alter land demand structures and spatial configurations through impacts on population mobility, investment behavior, policy response, and social dynamics—potentially triggering structural tipping points in the system.
Thus, relying solely on linear trend forecasting is insufficient. Future simulations should adopt a coupled framework of “normal evolution–shock–feedback”, treating extreme events as endogenous variables in the model. Incorporating dimensions such as urban safety, resilience, and recovery capacity will improve the system’s adaptability under compound risks.
Moreover, it is recommended to establish multi-dimensional dynamic monitoring platforms to assess how land systems respond spatially and temporally to social events, policy shifts, and environmental anomalies, thereby strengthening the foresight and flexibility of spatial governance systems.

4.4. Special Interpretation of Fractal Dimension (FD): Fragmentation or Functional Complexity?

Traditionally, a higher fractal dimension (FD) in land use patterns is interpreted as indicative of spatial fragmentation and reduced organizational order, as exemplified in the SSP5-8.5 scenario. In this case, rapid and unregulated urban sprawl produces highly disordered, irregular land patches, resulting in ecological isolation and weakened spatial governance. However, a high FD does not inherently signify negative spatial outcomes. As observed in the SSP1-2.6 scenario, construction land exhibits the highest FD value (1.9410), yet this complexity reflects a positive spatial logic characterized by compact expansion, ecological embedding, and multi-functional land integration. Thus, fractal dimension should not be interpreted in isolation, but rather evaluated within the broader context of urban development strategies, spatial governance logic, and ecological objectives.
Although both diagrams exhibit “complex boundaries and interlaced patches” in form, they represent two fundamentally different spatial logics and planning mechanisms. While both spatial patterns display high boundary complexity, the left figure illustrates disorderly fragmentation resulting from uncontrolled expansion, whereas the right figure reflects structural nesting shaped by sustainable planning. Therefore, not all complexity is inherently negative; when embedded within a rational spatial–ecological framework, a higher fractal dimension may instead signify structural optimization and ecological integration, rather than disordered fragmentation. To clarify this duality, we propose a conceptual comparison framework (Table 8):
Although both diagrams visually exhibit “complex boundaries and interwoven patches,” they reflect two fundamentally different spatial logics and planning mechanisms (Figure 12). While both spatial forms demonstrate high boundary complexity, the left diagram represents disorderly fragmentation driven by uncontrolled urban sprawl, whereas the right diagram illustrates structural nesting shaped by sustainable planning guidance. Therefore, not all forms of complexity are negative; when embedded within a rational spatial-ecological framework, a higher fractal dimension can indicate structural optimization and ecological integration, rather than chaotic fragmentation. To clarify this duality, we propose a conceptual comparison framework (Table 8).

4.5. Limitations and Future Outlook

Although the SD-PLUS model developed in this study performs well in simulating land use changes in Wuhan’s urban core across multiple scenarios, several limitations merit further discussion and refinement:
First, while the model incorporates economic, social, and environmental driving factors, it does not account for climate disasters such as extreme precipitation, droughts, or flooding due to data limitations. These factors increasingly influence LUCC, particularly in rapidly urbanizing regions where ecological degradation and agricultural productivity loss are major risks. Future studies should integrate climate disaster datasets to better capture the drivers of land use change.
Second, the model involves numerous parameters, and their selection and calibration contain subjective elements that may affect simulation outcomes. In particular, while the SD model provides a useful framework for capturing macroscale land demand dynamics, it requires predefined causal relationships and coefficient settings, which rely on expert judgment or policy assumptions and may introduce subjectivity. For example, although the SD model provides a useful framework for assessing long-term land use changes, its ability to capture fine-scale spatial variations is limited. Furthermore, key components of the PLUS model—such as weight assignment and transition rule setting—rely heavily on the researcher’s subjective judgment, lacking a unified scientific standard. Future research could incorporate parameter optimization techniques—such as machine learning-based auto-calibration, sensitivity testing, or Bayesian parameter estimation—to reduce subjectivity and enhance model robustness.
In addition, the applicability of the proposed SD-PLUS-FD framework beyond the current study area requires further examination. The model was developed and tested in the context of a large Chinese metropolis with a specific sociopolitical and urbanization context. Its performance in other types of urban systems—especially in non-Asian regions such as European cities, which may feature different planning cultures, land management mechanisms, and spatial governance structures—remains to be validated. Furthermore, while this study focuses primarily on urban expansion and construction land dynamics, the framework’s adaptability to other land use types, such as agricultural land, forest land, or wetland systems, has not been comprehensively explored. Future studies should conduct comparative applications in diverse geographic and institutional settings and test the model’s effectiveness across a wider range of land use categories to ensure its generalizability and global relevance.
Finally, the current multi-scenario simulation is based on existing policy trajectories and development trends. It does not fully account for future uncertainties, such as technological advances, policy shifts, or global climate transitions. Future research could incorporate uncertainty analysis—e.g., Monte Carlo simulations or scenario sensitivity analysis—to enhance the robustness and applicability of simulation results.

5. Conclusions

Under the dual pressures of ongoing global climate change and accelerating urbanization, land use systems are exhibiting unprecedented levels of dynamism, complexity, and uncertainty. Using Wuhan as a representative study area, this study constructs an integrated SD-PLUS-FD modeling framework, which combines System Dynamics (SD), Patch-based Land Use Simulation (PLUS), and Fractal Dimension (FD) analysis to simulate and evaluate the evolution of urban land use under different climate change scenarios for the year 2030. The study yields the following key conclusions and theoretical insights:
(1)
The SD-PLUS model demonstrates strong stability, accuracy, and explanatory power across multiple scenarios, effectively supporting the simulation of dynamic responses of urban land systems under different socioclimatic pathways.
The coupled SD-PLUS model achieves high simulation accuracy. The SD module maintains relative errors within ±5% for all land use categories, while the PLUS model attains a Kappa coefficient of 0.84 and overall accuracy of 0.93, confirming the model’s reliability across both quantitative and spatial dimensions. Under all future scenarios, a common trend is observed: a reduction in cultivated land and an increase in both construction and ecological land (i.e., forest and grassland). Notably, the intensity of construction land expansion correlates with scenario development aggressiveness: +385.18 km2 in SSP1-2.6, +541.74 km2 in SSP2-4.5, and +777.65 km2 in SSP5-8.5.
Cultivated land consistently declines, though the drop is relatively limited under SSP1-2.6, thereby supporting food security goals. Spatially, land use shifts mainly from cultivated land to construction and ecological land. Under SSP1-2.6, expansion occurs in a controlled manner along the urban periphery, reflecting stronger ecological constraints. In contrast, under SSP2-4.5 and SSP5-8.5, construction land expands more in non-core areas, exacerbating spatial fragmentation.
(2)
Incorporating fractal dimension enables the identification of nonlinear structural patterns in urban boundary evolution, offering a quantitative basis for understanding spatial morphology reconstruction.
The fractal dimension of construction land has significantly increased over time—especially after 2010—rising to 1.9034 in 2015, and further reaching 1.9410 under the SSP1 scenario by 2030. This indicates an ongoing trend toward greater boundary complexity and spatial irregularity. Cultivated land shows relatively stable FD values, fluctuating between 1.73 and 1.82, but continues to rise slightly under all future scenarios—peaking at 1.8776 in SSP1—suggesting more fragmented boundaries due to ecological zoning and dispersal strategies. Forest land, by contrast, consistently displays the lowest FD values, with modest increases over time. However, under the SSP5 scenario, FD declines to 1.5004, indicating structural simplification and potential degradation of ecological spatial organization. These findings underscore the importance of enhancing land use regulation and ecological space governance to prevent boundary fragmentation and promote more coherent urban structure.
(3)
Exogenous disturbances, such as public health emergencies, exert significant shocks on land use systems, necessitating the integration of a “resilience–response–adaptation” mechanism in simulation and planning frameworks.
Land use systems are highly sensitive to sudden events. Extreme climate conditions (e.g., floods, droughts, heat waves), major natural disasters (e.g., earthquakes, landslides), and public health emergencies (e.g., COVID-19) can profoundly affect land use quantity, structure, and spatial configuration. During the COVID-19 pandemic in 2020, the simulation errors for construction and forest land in Wuhan deviated significantly from baseline expectations, serving as a notable example. Future land use simulations and spatial planning strategies must incorporate such external disturbance factors to enhance resource allocation flexibility and emergency response capacity, thereby strengthening the resilience of urban spatial systems.
(4)
The proposed “quantity–space–structure” integrated framework offers a novel modeling paradigm and practical decision support tool for multi-scenario urban governance and ecological security strategy formulation.
Unlike traditional models that focus solely on land use quantity or spatial distribution, this study advances a theoretical shift from “quantitative logic” to “structural logic” by integrating system dynamics, spatial simulation, and structural complexity evaluation. The proposed framework enhances the spatial interpretability of simulation results and enables quantifiable assessments of boundary complexity, system stability, and structural risks.
Results indicate that the SSP1 scenario leads to the most orderly urban expansion and effective ecological land protection, making it the most suitable pathway for achieving a balanced ecological–economic future. Conversely, under the SSP5 scenario, land systems become highly fragmented and spatially disordered, underscoring the urgent need to reinforce baseline resource constraints and implement strong regulatory mechanisms for high-intensity development control.

Supplementary Materials

The following supporting information can be downloaded at: https://www.mdpi.com/article/10.3390/land14071412/s1.

Author Contributions

Conceptualization, H.Y., G.S. and M.X.; Methodology, H.Y., X.L., M.D. and M.X.; Software, H.Y.; Validation, H.Y., X.L. and G.S.; Formal analysis, H.Y., M.D. and M.X.; Investigation, H.Y.; Resources, H.Y. and G.S.; Data curation, H.Y. and M.X.; Writing—original draft, H.Y. and X.L.; Writing—review & editing, H.Y., X.L., G.S. and M.X.; Visualization, H.Y. and M.D.; Supervision, X.L., M.D. and M.X.; Project administration, G.S. and M.X.; Funding acquisition, M.X. All authors have read and agreed to the published version of the manuscript.

Funding

This research was funded by National Natural Science Foundation of China, grant number 52468009.

Data Availability Statement

The original contributions presented in this study are included in the article/Supplementary Materials. Further inquiries can be directed to the corresponding author.

Conflicts of Interest

The authors declare no conflict of interest.

References

  1. Deng, Y.; Qi, W.; Fu, B.; Wang, K. Geographical Transformations of Urban Sprawl: Exploring the Spatial Heterogeneity across Cities in China 1992–2015. Cities 2020, 105, 102415. [Google Scholar] [CrossRef]
  2. Chen, H.; Jia, B.; Lau, S.S.Y. Sustainable Urban Form for Chinese Compact Cities: Challenges of a Rapid Urbanized Economy. Habitat Int. 2008, 32, 28–40. [Google Scholar] [CrossRef]
  3. Jiang, F.; Liu, S.; Yuan, H.; Zhang, Q. Measuring Urban Sprawl in Beijing with Geo-Spatial Indices. J. Geogr. Sci. 2007, 17, 469–478. [Google Scholar] [CrossRef]
  4. Turner, B.L.; Skole, D.; Sanderson, S.; Fischer, G.; Fresco, L.; Leemans, R. Land-Use and Land-Cover Change: Science/Research Plan. 1995. Available online: https://asu.elsevierpure.com/en/publications/land-use-and-land-cover-change-scienceresearch-plan-2 (accessed on 15 April 2025).
  5. Wang, S.; Li, Z.; Long, Y.; Yang, L.; Ding, X.; Sun, X.; Chen, T. Impacts of Urbanization on the Spatiotemporal Evolution of Ecological Resilience in the Plateau Lake Area in Central Yunnan, China. Ecol. Indic. 2024, 160, 111836. [Google Scholar] [CrossRef]
  6. Aghsaei, H.; Mobarghaee Dinan, N.; Moridi, A.; Asadolahi, Z.; Delavar, M.; Fohrer, N.; Wagner, P.D. Effects of Dynamic Land Use/Land Cover Change on Water Resources and Sediment Yield in the Anzali Wetland Catchment, Gilan, Iran. Sci. Total Environ. 2020, 712, 136449. [Google Scholar] [CrossRef]
  7. Dosdogru, F.; Kalin, L.; Wang, R.; Yen, H. Potential Impacts of Land Use/Cover and Climate Changes on Ecologically Relevant Flows. J. Hydrol. 2020, 584, 124654. [Google Scholar] [CrossRef]
  8. Guédé, K.G.; Yu, Z.; Simonovic, S.P.; Gu, H.; Emani, G.F.; Badji, O.; Chen, X.; Sika, B.; Adiaffi, B. Combined Effect of Landuse/Landcover and Climate Change Projection on the Spatiotemporal Streamflow Response in Cryosphere Catchment in the Tibetan Plateau. J. Environ. Manag. 2025, 376, 124353. [Google Scholar] [CrossRef]
  9. Wang, C.; Liu, S.; Zhou, S.; Zhou, J.; Jiang, S.; Zhang, Y.; Feng, T.; Zhang, H.; Zhao, Y.; Lai, Z.; et al. Spatial-Temporal Patterns of Urban Expansion by Land Use/Land Cover Transfer in China. Ecol. Indic. 2023, 155, 111009. [Google Scholar] [CrossRef]
  10. Shi, K.; Liu, G.; Zhou, L.; Cui, Y.; Liu, S.; Wu, Y. Satellite Remote Sensing Data Reveal Increased Slope Climbing of Urban Land Expansion Worldwide. Landsc. Urban Plan. 2023, 235, 104755. [Google Scholar] [CrossRef]
  11. Liu, X.; Wang, S.; Wu, P.; Feng, K.; Hubacek, K.; Li, X.; Sun, L. Impacts of Urban Expansion on Terrestrial Carbon Storage in China. Environ. Sci. Technol. 2019, 53, 6834–6844. [Google Scholar] [CrossRef]
  12. Costanza, R.; Ruth, M. Using Dynamic Modeling to Scope Environmental Problems and Build Consensus. Environ. Manag. 1998, 22, 183–195. [Google Scholar] [CrossRef]
  13. Li, S.; Liu, X.; Li, X.; Chen, Y. Simulation Model of Land Use Dynamics and Application: Progress and Prospects. Natl. Remote Sens. Bull. 2021, 21, 329–340. [Google Scholar] [CrossRef]
  14. Song, J.; Tang, B.; Zhang, J.; Dou, X.; Liu, Q.; Shen, W. System Dynamics Simulation for Optimal Stream Flow Regulations under Consideration of Coordinated Development of Ecology and Socio-Economy in the Weihe River Basin, China. Ecol. Eng. 2018, 124, 51–68. [Google Scholar] [CrossRef]
  15. Gu, C.; Guan, W.; Liu, H. Chinese Urbanization 2050: SD Modeling and Process Simulation. Sci. China Earth Sci. 2017, 60, 1067–1082. [Google Scholar] [CrossRef]
  16. Jiang, J.; Wang, Z.; Lai, C.; Wu, X.; Chen, X. Climate and Landuse Change Enhance Spatio-Temporal Variability of Dongjiang River Flow and Ammonia Nitrogen. Sci. Total Environ. 2023, 867, 161483. [Google Scholar] [CrossRef]
  17. Yang, Y.; Wang, W.; Qiao, J.; Zhang, E. An Improved Gray Neural Network Method to Optimize Spatial and Temporal Characteristics Analysis of Land-Use Change. Comput. Intell. Neurosci. 2022, 2022, 2699031. [Google Scholar] [CrossRef]
  18. Chu, L.; Zhang, X.-R.; Wang, T.-W.; Li, Z.-X.; Cai, C.-F. Spatial-Temporal Evolution and Prediction of Urban Landscape Pattern and Habitat Quality Based on CA-Markov and InVEST Model. Chin. J. Appl. Ecol. 2018, 29, 4106. [Google Scholar] [CrossRef]
  19. Gasirabo, A.; Xi, C.; Hamad, B.R.; Edovia, U.D. A CA–Markov-Based Simulation and Prediction of LULC Changes over the Nyabarongo River Basin, Rwanda. Land 2023, 12, 1788. [Google Scholar] [CrossRef]
  20. Xu, C.; Zhang, Q.; Yu, Q.; Wang, J.; Wang, F.; Qiu, S.; Ai, M.; Zhao, J. Effects of Land Use/Cover Change on Carbon Storage between 2000 and 2040 in the Yellow River Basin, China. Ecol. Indic. 2023, 151, 110345. [Google Scholar] [CrossRef]
  21. Tang, Z.; Ning, R.; Wang, D.; Tian, X.; Bi, X.; Ning, J.; Zhou, Z.; Luo, F. Projections of Land Use/Cover Change and Habitat Quality in the Model Area of Yellow River Delta by Coupling Land Subsidence and Sea Level Rise. Ecol. Indic. 2024, 158, 111394. [Google Scholar] [CrossRef]
  22. Shi, M.J.; Wu, H.Q.; Jia, H.T.; Zhu, L.; Dong, T.; He, P.X.; Yang, Q.J. Temporal and Spatial Evolution and Prediction of Carbon Stocks in Yili Valley Based on MCE-CA-Markov and InVEST Models. Nongyeziyuan Yu Huanjing Xuebao 2021, 38, 1010–1019. [Google Scholar]
  23. Zhan, Y.; Zhu, J.; Yan, Y. Dynamic Simulation of Urban Space Based on the Cellular Automata Model. Acta Ecol. Sin. 2017, 37, 4864–4872. [Google Scholar]
  24. Wu, M.; Ren, X.; Che, Y.; Yang, K. A Coupled SD and CLUE-S Model for Exploring the Impact of Land Use Change on Ecosystem Service Value: A Case Study in Baoshan District, Shanghai, China. Environ. Manag. 2015, 56, 402–419. [Google Scholar] [CrossRef]
  25. Wang, Q.; Liu, R.; Men, C.; Guo, L. Application of Genetic Algorithm to Land Use Optimization for Non-Point Source Pollution Control Based on CLUE-S and SWAT. J. Hydrol. 2018, 560, 86–96. [Google Scholar] [CrossRef]
  26. Peng, J.; Wei, H.; Wu, W.; Liu, Y.; Wang, Y. Storm Flood Disaster Risk Assessment in Urban Area Based on the Simulation of Land Use Scenarios: A Case of Maozhou Watershed in Shenzhen City. Acta Ecol. Sin. 2018, 38, 3741–3755. [Google Scholar] [CrossRef]
  27. Yu, Q.; Wu, Z.; Wang, Y. A Land Use Change Simulation Model: Coupling of Evolutionary Algorithm and FLUS Model. J. Geo-Inf. Sci. 2023, 25, 510–528. [Google Scholar] [CrossRef]
  28. Ding, Q.; Chen, Y.; Bu, L.; Ye, Y. Multi-Scenario Analysis of Habitat Quality in the Yellow River Delta by Coupling FLUS with InVEST Model. Int. J. Environ. Res. Public Health 2021, 18, 2389. [Google Scholar] [CrossRef]
  29. Lin, W.; Sun, Y.; Nijhuis, S.; Wang, Z. Scenario-Based Flood Risk Assessment for Urbanizing Deltas Using Future Land-Use Simulation (FLUS): Guangzhou Metropolitan Area as a Case Study. Sci. Total Environ. 2020, 739, 139899. [Google Scholar] [CrossRef]
  30. Liu, J.; Xiong, J.; Chen, Y.; Sun, H.; Zhao, X.; Tu, F.; Gu, Y. An Integrated Model Chain for Future Flood Risk Prediction under Land-Use Changes. J. Environ. Manag. 2023, 342, 118125. [Google Scholar] [CrossRef]
  31. Guo, W.; Teng, Y.; Li, J.; Yan, Y.; Zhao, C.; Li, Y.; Li, X. A New Assessment Framework to Forecast Land Use and Carbon Storage under Different SSP-RCP Scenarios in China. Sci. Total Environ. 2024, 912, 169088. [Google Scholar] [CrossRef]
  32. Cai, G.; Xiong, J.; Wen, L.; Weng, A.; Lin, Y.; Li, B. Predicting the Ecosystem Service Values and Constructing Ecological Security Patterns in Future Changing Land Use Patterns. Ecol. Indic. 2023, 154, 110787. [Google Scholar] [CrossRef]
  33. Wang, C.; Li, T.; Guo, X.; Xia, L.; Lu, C.; Wang, C. Plus-InVEST Study of the Chengdu-Chongqing Urban Agglomeration’s Land-Use Change and Carbon Storage. Land 2022, 11, 1617. [Google Scholar] [CrossRef]
  34. Lin, B.; Chen, X.; Yao, H.; Chen, Y.; Liu, M.; Gao, L.; James, A. Analyses of Landuse Change Impacts on Catchment Runoff Using Different Time Indicators Based on SWAT Model. Ecol. Indic. 2015, 58, 55–63. [Google Scholar] [CrossRef]
  35. Memarian, H.; Balasundram, S.K.; Abbaspour, K.C.; Talib, J.B.; Sung, C.T.B.; Sood, A.M. SWAT-Based Hydrological Modelling of Tropical Land-Use Scenarios. Hydrol. Sci. J. 2014, 59, 1808–1829. [Google Scholar] [CrossRef]
  36. Sun, J.; Yan, H.; Bao, Z.; Wang, G. Investigating Impacts of Climate Change on Runoff from the Qinhuai River by Using the SWAT Model and CMIP6 Scenarios. Water 2022, 14, 1778. [Google Scholar] [CrossRef]
  37. Duguma, D.W.; Brueck, M.; Shumi, G.; Law, E.; Benra, F.; Schultner, J.; Nemomissa, S.; Abson, D.J.; Fischer, J. Future Ecosystem Service Provision under Land-Use Change Scenarios in Southwestern Ethiopia. Ecosyst. People 2024, 20, 2321613. [Google Scholar] [CrossRef]
  38. Hua, Y.; Yan, D.; Liu, X. Assessing Synergies and Trade-Offs between Ecosystem Services in Highly Urbanized Area under Different Scenarios of Future Land Use Change. Environ. Sustain. Indic. 2024, 22, 100350. [Google Scholar] [CrossRef]
  39. Redhead, J.W.; May, L.; Oliver, T.H.; Hamel, P.; Sharp, R.; Bullock, J.M. National Scale Evaluation of the InVEST Nutrient Retention Model in the United Kingdom. Sci. Total Environ. 2018, 610–611, 666–677. [Google Scholar] [CrossRef]
  40. Yin, L.; Li, X.; Zheng, W.; Yin, Z.; Song, L.; Ge, L.; Zeng, Q. Fractal Dimension Analysis for Seismicity Spatial and Temporal Distribution in the Circum-Pacific Seismic Belt. J. Earth Syst. Sci. 2019, 128, 22. [Google Scholar] [CrossRef]
  41. Muolo, A.; Konaxis, I.; Salvati, L. Applying Zipf’s Law to Land-Use Classes in a Tourism-Specialized Metropolitan Context. Land Use Policy 2025, 155, 107580. [Google Scholar] [CrossRef]
  42. Zhou, Y.; Li, Y. Scaling the Living Space: Zipf’s Law for Traditional Courtyard Houses in South China. Front. Built Environ. 2022, 8, 901776. [Google Scholar] [CrossRef]
  43. Postigliola, M.; Salvati, L. Land-Use Change and Zipf’s Law: A Novel Tool to Investigate Regional Transformations. Pap. Reg. Sci. 2025, 104, 100074. [Google Scholar] [CrossRef]
  44. Batty, M.; Longley, P. Fractal Cities: A Geometry of Form and Function; Academic Press: Cambridge, MA, USA, 1994; ISBN 978-0-12-455570-9. [Google Scholar]
  45. Benguigui, L.; Marinov, M.; Czamanski, D.; Portugali, Y. When and Where Is a City Fractal? Environ. Plan. B Plan. Des. 1999, 27, 507–519. [Google Scholar] [CrossRef]
  46. Marques, M.L. Metodologias para Estimativa da Dimensão Fractal do Crescimento de Aglomerados Urbanos: Uma Contribuição ao Estudo da Expansão Urbana da Região Metropolitana de São Paulo Entre 1905 e 2001. Ph.D. Thesis, UNESP, São Paulo, Brazil, 2005. [Google Scholar]
  47. Xu, X.; Min, X. Quantifying Spatiotemporal Patterns of Urban Expansion in China Using Remote Sensing Data. Cities 2013, 35, 104–113. [Google Scholar] [CrossRef]
  48. Agostinho, F.; Costa, M.; Coscieme, L.; Almeida, C.M.V.B.; Giannetti, B.F. Assessing Cities Growth-Degrowth Pulsing by Emergy and Fractals: A Methodological Proposal. Cities 2021, 113, 103162. [Google Scholar] [CrossRef]
  49. Winz, I.; Brierley, G.; Trowsdale, S. The Use of System Dynamics Simulation in Water Resources Management. Water Resour. Manag. 2009, 23, 1301–1323. [Google Scholar] [CrossRef]
  50. Li, F.; Liu, D.; Kong, X.; Liu, Y. Multi-Scenario Evaluation of County-Scale Development Potential Based on Shared Socioeconomic Pathways and Dynamic Simulation Approach. J. Geo-Inf. Sci. 2022, 24, 684–697. [Google Scholar] [CrossRef]
  51. Gu, M.; Ye, C.; Li, X.; Hu, M. Scenario Simulation of Land Use Change in Jiangxi Province Based on SD Model. Geogr. Geo-Inf. Sci. 2022, 38, 95–103. [Google Scholar]
  52. Gu, H.; Ma, T.; Qian, F.; Cai, Y. County land use scenario simulation and carbon emission effect analysis using CLUE-S model. Trans. Chin. Soc. Agric. Eng. 2022, 38, 288–296. [Google Scholar] [CrossRef]
  53. Abadi, L.S.K.; Shamsai, A.; Goharnejad, H. An Analysis of the Sustainability of Basin Water Resources Using Vensim Model. KSCE J. Civ. Eng. 2015, 19, 1941–1949. [Google Scholar] [CrossRef]
  54. Qu, L.; Tu, Z.; Liu, J.; Li, Y. Coupling Coordination Evolution of the Settlements-Farming System and Its Optimization Path: Keys to Sustainable Rural Development in the Three Gorges Reservoir Area of China. Habitat Int. 2025, 163, 103456. [Google Scholar] [CrossRef]
  55. Yeh, S.-C.; Wang, C.-A.; Yu, H.-C. Simulation of Soil Erosion and Nutrient Impact Using an Integrated System Dynamics Model in a Watershed in Taiwan. Environ. Model. Softw. 2006, 21, 937–948. [Google Scholar] [CrossRef]
  56. Van Vuuren, D.P.; Carter, T.R. Climate and Socio-Economic Scenarios for Climate Change Research and Assessment: Reconciling the New with the Old. Clim. Chang. 2014, 122, 415–429. [Google Scholar] [CrossRef]
  57. Li, J.; Chen, X.; Kurban, A.; Voorde, T.; Maeyer, P.; Zhang, C. Coupled SSPs-RCPs Scenarios to Project the Future Dynamic Variations of Water-Soil-Carbon-Biodiversity Services in Central Asia. Ecol. Indic. 2021, 129, 107936. [Google Scholar] [CrossRef]
  58. Liang, X.; Guan, Q.; Clarke, K.C.; Liu, S.; Wang, B.; Yao, Y. Understanding the Drivers of Sustainable Land Expansion Using a Patch-Generating Land Use Simulation (PLUS) Model: A Case Study in Wuhan, China. Comput. Environ. Urban Syst. 2020, 85, 101569. [Google Scholar] [CrossRef]
  59. Yang, Y.; Bao, W.; Liu, Y. Scenario Simulation of Land System Change in the Beijing-Tianjin-Hebei Region. Land Use Policy 2020, 96, 104677. [Google Scholar] [CrossRef]
  60. Xie, X.D.; Lin, X.S.; Wang, Y.; Tu, R.Y.; Zhang, J.X. Multi-Scenario Simulation of Land Use in Nanchuan District of Chongqing Based on PLUS Model. J. Chang. River Sci. Res. Inst. 2023, 40, 86. [Google Scholar] [CrossRef]
  61. Hu, Y.; Li, T. Forecasting Spatial Pattern of Land Use Change in Rapidly Urbanized Regions Based on SD-CA Model. Acta Sci. Nat. Univ. Pekin. 2022, 58, 372. [Google Scholar] [CrossRef]
  62. Liang, X.; Liu, X.; Li, X.; Chen, Y.; Tian, H.; Yao, Y. Delineating Multi-Scenario Urban Growth Boundaries with a CA-Based FLUS Model and Morphological Method. Landsc. Urban Plan. 2018, 177, 47–63. [Google Scholar] [CrossRef]
  63. Wu, X.; Huang, X.; Guo, S. The Fractal Characteristics and Risk Indicators of Urban Ecological Environment Vulnerability Evolution. Ecol. Inform. 2025, 86, 103033. [Google Scholar] [CrossRef]
  64. Mandelbrot, B. How Long Is the Coast of Britain? Statistical Self-Similarity and Fractional Dimension. Science 1967, 156, 636–638. [Google Scholar] [CrossRef]
  65. Turcotte, D.L. Fractals and Chaos in Geology and Geophysics, 2nd ed.; Cambridge University Press: Cambridge, UK, 1997; ISBN 978-0-521-56733-6. [Google Scholar]
  66. Turcotte, D.L. Fractal River Basins–Chance and Self-Organization. Eos Trans. Am. Geophys. Union 1998, 79, 463. [Google Scholar] [CrossRef]
  67. Cheng, Q.; Agterberg, F.P.; Ballantyne, S.B. The Separation of Geochemical Anomalies from Background by Fractal Methods. J. Geochem. Explor. 1994, 51, 109–130. [Google Scholar] [CrossRef]
  68. Chen, Y.; Feng, J. Spatial Analysis of Cities Using Renyi Entropy and Fractal Parameters. Chaos Solitons Fractals 2017, 105, 279–287. [Google Scholar] [CrossRef]
  69. Bharathi, N.; Malghan, D.; Mishra, S.; Rahman, A. Fractal Urbanism: City Size and Residential Segregation in India. World Dev. 2021, 141, 105397. [Google Scholar] [CrossRef]
  70. Guo, S.; Pei, T.; Xie, S.; Song, C.; Jie, C.; Liu, Y.; Shu, H.; Wang, X.; Yin, L. Fractal Dimension of Job-Housing Flows: A Comparison between Beijing and Shenzhen. Cities 2021, 112, 103120. [Google Scholar] [CrossRef]
  71. Moriasi, D.; Arnold, J.; Van Liew, M.; Bingner, R.; Harmel, R.D.; Veith, T. Model Evaluation Guidelines for Systematic Quantification of Accuracy in Watershed Simulations. Trans. ASABE 2007, 50, 885–900. [Google Scholar] [CrossRef]
  72. Arora, A.; Pandey, M.; Mishra, V.; Rai, P.; Costache, R.-D.; Punia, M.; Di, L. Comparative Evaluation of Geospatial Scenario-Based Land Change Simulation Models Using Landscape Metrics. Ecol. Indic. 2021, 128, 107810. [Google Scholar] [CrossRef]
Figure 1. Wuhan’s geographic location and land use.
Land 14 01412 g001
Figure 2. Technology flowchart.
Land 14 01412 g002
Figure 3. SD model of land use change in Wuhan.
Land 14 01412 g003
Figure 4. Data set of driving factors for the PLUS model.
Land 14 01412 g004
Figure 5. Constraint factors used in the PLUS model.
Land 14 01412 g005
Figure 6. Comparison of simulated land use and actual land use in Wuhan for 2010 and 2020.
Land 14 01412 g006
Figure 7. Simulated land use maps for 2030 under different scenarios.
Land 14 01412 g007
Figure 8. Overall land use transition matrix from 2020 to 2030 under different scenarios.
Land 14 01412 g008
Figure 9. Land use conversion in different scenarios.
Land 14 01412 g009
Figure 10. Fractal dimension trends in key land use types in Wuhan.
Land 14 01412 g010
Figure 11. Correlation heat map of GDP, population, and land use fractal dimensions.
Land 14 01412 g011
Figure 12. Contrasting interpretations of high fractal dimension: negative fragmentation vs. positive interspersion under different scenarios.
Land 14 01412 g012
Table 1. Comparison of land use models.
Model TypeModelAdvantagesDisadvantages
Quantity Prediction ModelsSDCapable of simulating nonlinear dynamic feedback mechanisms;
Able to integrate socioeconomic variables;
Suitable for policy scenario analysis
Strong subjectivity in parameter setting;
Weak capability in representing spatial distribution;
Limited ability to capture microlevel heterogeneity
MCSimple and easy to use;
Intuitive in modeling land transition probabilities
Ignores spatial relationships;
Incapable of handling complex driving mechanisms;
Only simulates static transitions without dynamic feedback
GMSuitable for small-sample datasets;
Simple modeling process
Relies on idealized assumptions;
Lacks spatial modeling capability;
Accuracy is highly sensitive to data fluctuations
Spatial Distribution ModelsCASimple structure;
Clear rules;
Suitable for simulating spatial neighborhood changes
Strong subjectivity in rule setting;
Lacks system-level feedback mechanisms;
Unstable in long-term evolution simulations
CLUE-SConsiders multiple driving factors;
Flexible in land use type transitions
Complex parameter tuning;
Lacks temporal feedback mechanisms;
Difficult to handle structural evolution analysis
FLUSIntroduces stochastic disturbance mechanisms;
Optimizes the CA seeding mechanism;
Better adapted to complex land use categories
Relatively complex model logic;
High sensitivity to driving factors;
Also lacks the ability for structural analysis
PLUSBased on the LEAS strategy and multi-type patch seeding mechanism;
High spatial allocation accuracy;
Easily integrated with other models
Spatially dominated; quantity prediction relies on external models;
Still limited in expressing structural complexity
Table 2. Main data and data sources.
CategoryName of DataData Source
Nonspatial dataPopulation (2000–2020),
economy (2000–2020)
Statistical Yearbook of Wuhan City
Demand for grain,
animal husbandry, and water resources
National Bureau of Statistics (https://www.stats.gov.cn/)
Spatial dataBasic dataLand use data (2000–2020)Globeland 30 (https://aircas.cas.cn/)
Natural driving factorDEM,
slope,
aspect,
average annual temperature,
average annual rainfall,
soil type,
distance to water bodies, etc.
Geospatial Data Cloud (http://www.gscloud.cn/), The Data Center for Resources and Environmental Sciences (https://www.resdc.cn/)
Economic driving factorPopulation density,
GDP,
distance to government locations, distance to medical and health facilities, etc.
The Data Center for Resources and Environmental Sciences (https://www.resdc.cn/)
Social driving factorDistance to expressways,
distance to national highways,
distance to provincial highways, distance to subways,
distance to railways, etc.
Open Street Map (https://www.openstreetmap.org/)
Limiting factorWater areaRelevant planning documents
Table 3. Parameter settings for different climate scenarios.
ScenariosPopulation Growth RateGDP Growth RateAnnual Average Temperature Variation °C·a − 1Annual Average Precipitation Variation mm·a − 1
SSP1-2.62.02%Linear decrease to 5%0.012.6
SSP2-4.54.12%Average 7%0.0254.3
SSP5-8.56%Linear rise to 10%0.0557.5
Table 4. Historical error test results of the SD model.
Cultivated LandForest LandGrasslandWater BodyConstruction Land
Historical values 20105382.60452.4752.791530.111151.18
Simulated value5411.87454.7452.321530.781139.77
Relative error0.54%0.50%−0.88%0.04%−0.99%
Historical values 20115359.33451.5555.681526.441176.16
Simulated value5359.51452.5763.541530.701166.60
Relative error0.00%0.23%14.12%0.28%−0.81%
Historical values 20195120.45496.8998.021527.691326.11
Simulated value5145.13493.6492.721532.061334.95
Relative error0.48%−0.65%−5.41%0.29%0.67%
Historical values 20205283.42421.6596.241530.221237.62
Simulated value5254.01509.9799.181547.281368.94
Relative error−0.56%20.95%3.06%1.11%10.61%
Table 5. Parameter sensitivity test results of SD model.
ParameterParameters Reduce Sensitivity by 10%Parameter Increases Sensitivity by 10%
Population growth rate0.02210.1166
GDP growth rate0.10650.2333
Fixed asset investment coefficient0.06350.1056
Investment coefficient of the primary industry0.03800.0698
Investment coefficient of the secondary and tertiary industries0.02670.0266
Agricultural investment coefficient0.02860.0447
Forestry investment coefficient0.01130.0277
Investment coefficient of animal husbandry0.00450.0846
Fishery investment coefficient--
Note: The fishery investment coefficient is only related to the water body area. However, due to the strict ecological protection in Wuhan, it basically has no impact on other land use types.
Table 6. Forecast of land demand in Wuhan for 2030.
Construction LandCultivated LandGrasslandForest LandWater BodiesUnused Land
SSP1-2.61554.274784.46172.52527.221530.68-
SSP2-4.51688.384572.83241.79535.471530.68-
SSP5-8.51890.454260.73331.47555.821530.68-
Table 7. Land use conversion cost matrix by scenarios.
SSP1-2.6 ScenarioSSP2-4.5 ScenarioSSP5-8.5 Scenario
abcdefabcdefabcdef
a111111111111111111
b010000011111111111
c011000011111111111
d000100000100000100
e000010000010000010
f111111111111111111
Note: a, b, c, d, e, and f, respectively, represent cultivated land, forest land, grassland, water area, construction land, and unused land; 0 indicates that conversion is not allowed, and 1 indicates that conversion is allowed. The inner rows of the matrix represent exits, and the columns represent entries.
Table 8. Comparative Interpretation of Positive Interspersion and Negative Fragmentation in Urban Spatial Structure Based on Fractal Dimension.
DimensionPositive InterspersionNegative Fragmentation
Patch DistributionOrdered intermixing of construction and green spacesScattered urban patches, passively segmented
Spatial ContinuityFunctional coherence, ecological corridors maintainedDisconnected structure, chaotic boundaries
Formation MechanismMulti-centric planning, ecological zoningUncontrolled sprawl, lack of governance
Ecological EmbeddingUrban land embedded within ecological networksGreen spaces isolated, “island” effect intensified
Structural AttributeHigh FD = fine-grained, multi-functional (positive)High FD = disordered, low organization (negative)
Disclaimer/Publisher’s Note: The statements, opinions and data contained in all publications are solely those of the individual author(s) and contributor(s) and not of MDPI and/or the editor(s). MDPI and/or the editor(s) disclaim responsibility for any injury to people or property resulting from any ideas, methods, instructions or products referred to in the content.

