Abstract
Driven by global climate change and sustainable development, the coordinated development of multiple industries based on photovoltaic energy in the “Desert-Gobi-Wilderness” region has become the key to achieving sustainable development, as well as transforming and upgrading the energy structure. However, the site selection decision for “Photovoltaic +” multi-industry integration, which takes into account economic, social and ecological benefits in a complex ecological environment, is still a key difficulty that restricts the feasibility and scalability of the project. This study first identified and systematically analyzed six “PV +” multi-industry integrations suitable for development in China, including “PV + sand control”, “PV + agriculture”, “PV + agriculture + tourism”, “PV + animal husbandry”, “PV + animal husbandry + tourism”, and “PV + tourism”. Then, a site selection decision framework for “PV +” multi-industry integration consists of three parts. Part 1 establishes a multi-dimensional suitability assessment system that takes into account heterogeneous data from multiple sources. Part 2 uses an integration method based on BWM-CRITIC-TODIM for priority ranking analysis, which first uses a Geographic Information System (GIS) to carry out suitability simulation for the entire region of China—identifying six alternative regions—then uses the interactive and multi-criteria decision-making (MCDM) method to prioritize the alternative areas. Part 3 carries out further sensitivity analyses, scenario analyses, and comparative analyses to verify the dynamics and scientific nature of the site selection decision framework. Finally, this study identifies regions of high suitability for development corresponding to the six multi-industry integrations. The framework is designed to help decision stakeholders achieve precise site selection and benefit optimization for “PV +” multi-industry integration and provides a replicable planning tool for achieving industrial synergy and sustainable development in the “Desert-Gobi-Wilderness” region driven by green energy.
1. Introduction
1.1. Background and Motivations
With respect to f global climate governance and energy structure transformation [], China is accelerating the massive-scale development of renewable energy under the goal of “double carbon”. The “Desert-Gobi-Wilderness” region usually refers to the arid and semi-arid desert, Gobi, wilderness regions in the west of China, and the regions in the northwest of China have become an ideal region for the sustainable development of photovoltaic energy due to its vast land resources and abundant light conditions []. The “Desert-Gobi-Wilderness” region is generally characterized by fragile ecological environment, and the existing single-PV development mode will lead to land competition, environmental degradation, and other problems []. The composite development mode of PV conforms to the development trend of sustainable development and provides a feasible solution to the contradictions between people, land, and resources.
The single-PV development model faces many problems and challenges due to the complex natural environment. Firstly, regarding its ecological benefits, the “Desert-Gobi-Wilderness” region has a weak environmental carrying capacity. The single development mode leads to surface destruction and sand and dust exacerbation []. Then, there is the economic benefit: a single-PV power generation mode in the “Desert-Gobi-Wilderness” region has a low land utilization rate and maintenance cost, which leads to a low internal rate of return and poor economic feasibility. At the same time, there is a problem of abandoned light in the northwestern region, which has resulted in the inefficient use of light resources and caused considerable economic losses []. In terms of social benefits, a single-PV project produces conflicts in the distribution of benefits.
The development of “PV +” multi-industry integration in the “Desert-Gobi-Wilderness” region refers to a diversified development model that integrates PV power generation with other industries such as agriculture and animal husbandry in ecologically complex and fragile areas such as deserts, Gobi, and wilderness. Chinese “Desert-Gobi-Wilderness” regions are rich in land resources and have outstanding light conditions []. In the meantime, the combination of PV power generation and multi-industry integration can facilitate the use of green electricity in the daily production and operation processes of agriculture [], animal husbandry [], and other industry integration, further promoting industrial transformation and sustainable energy development, which further reduce the impact of uncertain factors such as climate, policies, or market environment on the single-photovoltaic industry.
Chinese PV power generation has risen rapidly in recent years and has become the benchmark of global energy transition []. Xinjiang Province has built a number of ten-million-kilowatt bases with an installed capacity of more than 40 million kilowatts. However, compared to the strong local consumption of photovoltaic power in the eastern provinces, Xinjiang Province encounters power grid transmission capacity limitations, and the light rejection rate still reached 5% in 2023. As a national energy base, Xinjiang Province urgently needs to break the bottleneck of consumption to support the national green power strategy. Figure 1 shows the development of PV projects in China and Xinjiang Province.
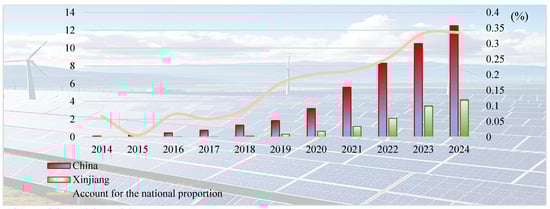
Figure 1.
Comparison of installed photovoltaic capacity in China and Xinjiang Province.
However, existing decisions on the siting of “PV +” multi-industry integration face many challenges: There is a lack of a comprehensive evaluation system for multi-source real data, including target indicators. There is an imbalance in the distribution of benefits among different stakeholders, which diminishes the synergistic effect of the “PV +” multi-industry. The dynamic adaptability of site selection is insufficient to respond to fluctuations in the economic, policy, and other indicators. Most studies are limited to idealized scenarios and lack empirical research on the real environment.
Therefore, this study constructs a site selection decision framework for “PV +” multi-industry integration in the “Desert-Gobi-Wilderness” region. It includes a multi-source data-driven site selection decision model: First, the study performs a spatial suitability simulation on suitable indicators of multiple categories. Then, using priority ranking indicators, the ranking of alternative regions carries out the most appropriate development regions for different multi-industry integrations.
1.2. Literature Review
This research literature review was mainly carried out from three aspects: the evolution path of “PV +” multi-industry integration, the analysis indicators used in the location decision of “PV +” multi-industry integration, and the location decision method of “PV +” multi-industry integration, which involves technology integration and scenario adaptation.
1.2.1. Evolutionary Path of “PV +” Multi-Industry Integration
Discussion of the relevant research has found that the “Desert-Gobi-Wilderness” region has superior light conditions and abundant land resources. The regions have the advantage of resource endowment for the development of PV projects []. However, most existing research on the “Desert-Gobi-Wilderness” region focused on single-PV power generation projects; moreover, due to the harsh natural environment in the “Desert-Gobi-Wilderness” region, a single development model will bring many problems and challenges []. Existing research on “PV +” multi-industry integration includes “PV + agriculture” and others. Ramadhani et al. found that animal husbandry significantly contributed at least 14.5% of total greenhouse gas emissions []; PV power generation provides clean energy for several key processes. Martins et al. examined sustainable tourism practices in the environmentally complex South Caucasus region through the lens of the United Nations Sustainable Development Goals (SDGs) []. Knapp and Sturchio argued that PV arrays aim to combine ecological principles with a priority on ecosystem services and energy production [].
1.2.2. Analyzing Indicators of “PV +” Multi-Industry Integration Site Selection Decision
There are limitations to the existing suitability indicators for “PV +” multi-industry integration site selection studies. Firstly, there is less research on the siting of PV projects in “Desert-Gobi-Wilderness” region. Secondly, there are relatively few target indicators related to the combination of different multi-industry integration in “PV +”.
Shriki et al. established the suitability assessment system, including three leading indicators of technology and economy, environment, and electricity, as well as fourteen sub-indicators []. Kaya et al. established an indicator system for the siting of electric taxis, including six leading indicators and 25 sub-indicators, such as construction cost, distance to water resources, and air quality []. Feyzi et al. selected 15 sub-indicators for the siting of municipal solid waste incineration (MSWI) power plants, which they divided into three dimensions: environmental, economic, and sociocultural [].
1.2.3. “PV +” Multi-Industry Integration Site Selection Decision Methodology
The GIS is widely used for site selection decisions. Elomiya et al. used GIS to analysis the spatial details of the twenty key indicators in a study []. Li et al. used MCDA and GIS for offshore wind farm site selection in GB []. Ma et al. used the MCDM to establish a complete life cycle planning framework for urban agricultural waste management through GIS analysis [].
Priority ranking methods widely used today include acronyms in Portuguese for interactive and multi-criteria decision making (TODIM), fuzzy synthetic evaluation (FSE) [], multi-attribute border approximation area (MABAC) [], etc. Li et al. used the TODIM for suitability assessment to identify the hydropower plants with the highest suitability for investment []. The TODIM method can more accurately describe decision makers’ psychological behavior in risky environments and is, therefore, suitable for use as a ranking method in this study. The Hesitant Fuzzy Linguistic Term Set (HFLTS) is a powerful tool for describing cognitively complex language information for experts [].
1.3. Deficiencies in Current Site Selection Decisions
Although some progresses have been made in this study of site selection decision for “PV +” multi- industry integration in the “Desert-Gobi-Wilderness” region, there are still some deficiencies and limitations. The findings can be categorized into the following dimensions:
- (1)
- Most of the existing studies focus on site selection decisions and the efficiency of a single-PV power plant, and there is a lack of research on the feasibility of “PV +” multi-industry integration and the decision making on project siting.
- (2)
- The targeted indicators of site selection decision are missing. Most of the indicator weights of the existing PV industry focus on power generation efficiency, but there is a lack of relative indicators related to other multi-industry integrations.
- (3)
- Extant research neglects consideration of the uncertainty and dynamics of the site selection decision environment. The “Desert-Gobi-Wilderness” region “PV +” multi-industry integration site selection decision is affected by many indicators, especially the energy transition, and green low-carbon projects affected by the policy fluctuation degree are larger.
- (4)
- There is insufficient quantification of different stakeholders. In reality, the site selection decision process will involve many different scenarios. Most of the current studies set the decision preferences of different decision stakeholders to the same coefficient without distinguishing between them.
To address the limitations outlined above, this study implements the following measures:
- (1)
- An empirical analysis is carried out in the “Desert-Gobi-Wilderness” region of China. This study constructs a multi-industry coupling site selection decision framework, by using methods such as the GIS and TODIM, and carries out suitability simulation and priority ranking of the research region.
- (2)
- The targeted indicators of the “Desert-Gobi-Wilderness” region are reflected through the suitability simulation of multi-source data. This study integrates multi-source data, overlays multi-source data layers for suitability simulation, and further generates alternative regions for “PV +” multi-industry integration.
- (3)
- The study examines uncertain decisions and simulates multiple scenarios so as to improve the rationality and scientific nature of site selection decisions. This study sets priority ranking indicators to fluctuate within a specific range randomly, identifies highly sensitive decision-making nodes, and analyzes the stability of the priority ranking of site selection decisions.
- (4)
- This study quantifies the site selection decision preferences of different stakeholders, reflects the results in various scenarios, and solves the problems of site selection and benefit distribution for different decision stakeholders.
1.4. Objectives and Contribution of the Study
The main contributions are as follows:
- (1)
- This study constructs a site selection decision framework for “PV +” multi-industry integration, breaking through the limitations of a single industry. The site selection decision is carried out in three parts in the “Desert-Gobi-Wilderness” region. Part I builds a multi-source data-driven system of site selection decision indicators. Part II uses the GIS-MCDM method, conducts the suitability analysis and priority ranking, and finally obtains the site selection results in two stages.
- (2)
- This study couples multi-source data and organizes multi-disciplinary site selection decision data; it constructs a site selection decision system of indicators and sets targeted indicators for the complex and fragile natural environment of the “Desert-Gobi-Wilderness” region.
- (3)
- In prioritizing alternative regions, this study carries out a dynamic analysis in response to the uncertainty of the site selection decision environment. This study also carries out a sensitivity analysis on the decision-making results to verify the stability of the site selection decision framework.
- (4)
- This study sets different site selection decision preference scenarios for three different decision stakeholders and conducts decision scenario analyses considering different interest preferences. Moreover, this study sets four different decision preference scenarios based on priority ranking indicators.
- (5)
- This study uses the “Desert-Gobi-Wilderness” region of Xinjiang Province in China as the research object to carry out empirical analysis, provides a scientific and reasonable basis for the site selection decision process of the “PV +” multi-industry integration in the “Desert-Gobi-Wilderness” region, and conforms to the global trend of climate governance.
The following sections present the organizational framework of this study: Section 2 first identifies six “PV +” multi-industry integrations and then constructs and analyses in detail a three-part “PV +” multi-industry integration site selection decision framework. In Section 3, this study conducts an empirical analysis in the “Desert-Gobi-Wilderness” region of Xinjiang Province, China, which has excellent light conditions. Furthermore, this study analyzes the results of the site selection decision in terms of sensitivity analysis, scenario analysis, and comparative analysis. Section 4 concludes the results of this study and provides an outlook.
2. Site Selection Decision of “PV +” Multi-Industry Integration Region
Combining the resource endowment advantages of “light–land–production”, this study dovetails with the construction objectives of the ten major industrial clusters of the Autonomous Region so as to realize the adaptability of resources and industries, the system of economy and ecology, and the linkage of strategy and people’s livelihood. Through the classification framework of resource adaptation–policy embedding–functional synergy, this paper analyzes three types of constraints: resource constraints, policy constraints, and functional constraints. Based on the data from 45 counties in Xinjiang Province, the paper ultimately identifies six types of “PV +” multi-industry integration suitable for the development of the Xinjiang region by matching the number of industrial clusters and the utilization rate of resources. Combination: In terms of subsequent dynamic expansion, based on the dynamic derivation of policy response, for example, the new “green hydrogen industry cluster” in Xinjiang may generate “PV +” industry integration of “PV +” hydrogen production and pasture”. “PV +” industry integration: This study identifies “PV + sand control” (Q1), “PV + agriculture” (Q2), “PV + agriculture + tourism” (Q3), “PV + animal husbandry” (Q4), “PV + animal husbandry + tourism” (Q5), and “PV + tourism” (Q6), exploring a total of six kinds of “PV +” multi-industry integration (Figure 2).
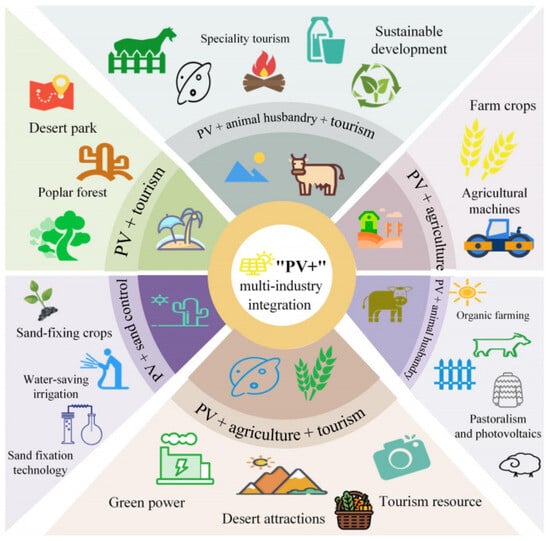
Figure 2.
Six kinds of “PV +” multi-industry integration.
2.1. “PV +” Multi-Industry Integration Site Decision Framework
This study constructs a “PV +” multi-industry integration site selection decision framework in the “Desert- Gobi-Wilderness” region; the framework consists of three parts: Part I integrates multiple source data-driven suitable indicators and priority ranking indicators. Suitable indicators include geospatial data of different categories, and priority ranking indicators include four primary indicators—economy, technology, society, and environment. Part II constructs a two-stage site selection decision model: Stage 1 uses the GIS to conduct suitability simulation and initially identify alternative regions by inputting suitable indicators. Stage 2 uses TODIM to prioritize the alternative regions for potential development by inputting priority ranking indicators. Part III analyzes and discusses the results of the site selection decision (Figure 3).
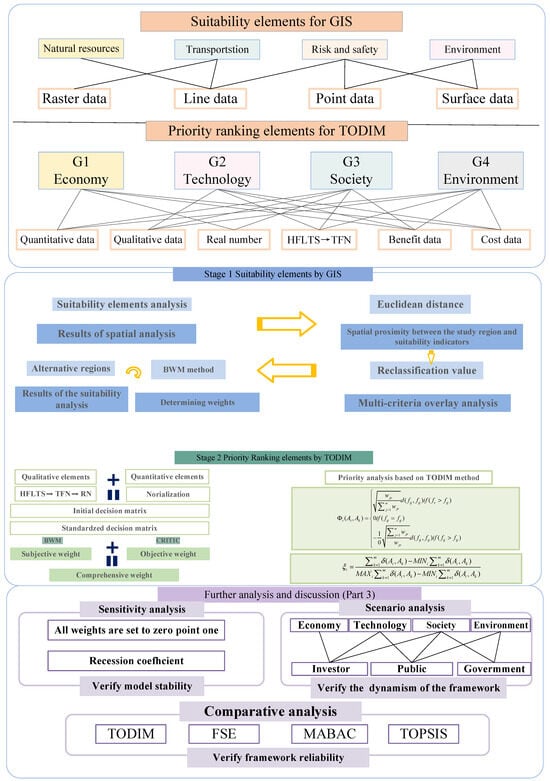
Figure 3.
Framework of “PV +” multi-industry site selection decision in “Desert-Gobi-Wilderness” region.
2.2. Multiple-Source, Data-Driven Suitability Indicators and Ranking Indicators (Part I)
Stage 1: When using the GIS for suitability assessment, this study identified eight suitability indicators—E1 to E8.
Stage 2: When using TODIM for ranking, this study identified four main indicators and ten secondary indicators. The following focuses on several critical indicators.
This study set three secondary indicators for the economy indicators (G1): investment cost (C11), annual earnings (C12), and investment payback period (C13). In the quantitative calculation of quantitative indicators, the study set the unit PV panel rated power of 0.28 kW and the area of 1.6 m2, and it set the installed capacity of 10 MW in the alternative regions.
The investment cost (C11) mainly includes equipment purchase costs, equipment operation, and maintenance costs; the specific calculations are as follows:
- (1)
- The equipment investment costs are defined as
- (2)
- The maintenance costs are defined as
Annual earnings (C12) are calculated primarily based on generating capacity and carbon allowances resulting from varying generation levels across substitution regions.
- (1)
- The generating capacity is defined as
- (2)
- The carbon allowances results are as follows:
Based on statistical data released by the National Energy Administration, the whole life cycle carbon emissions per kWh of PV power generation is 54.5 g/kWh, while the carbon dioxide emissions per unit of electricity generation of thermal power is about 832 g/kWh.
The investment payback period (C13) mainly calculates static payback periods for “PV +” multi-industry integration in different sit selection decision alternative regions:
where I represents the initial investment cost, and A represents the annual net income.
In the indicators of technology (G2), the study selected technical maturity (C21) and requirements for wind and sand resistance of equipment (C22) for qualitative analysis. In the indicators of society (G3), the study selected policy support intensity (C31) and employment opportunities (C32) for qualitative analysis and quantitative analysis separately.
In terms of environment (G4), the study selected improvement degree of ecological environment (C41) and light pollution risk (C42) for qualitative analysis, and the carbon emission reduction (C42) was calculated quantitatively; we calculated the carbon emissions of PV power generation by comparing them with the carbon emissions of thermal power generation, validating the ecological benefits of “PV +” multi-industry integration (Figure 4, Table 1).
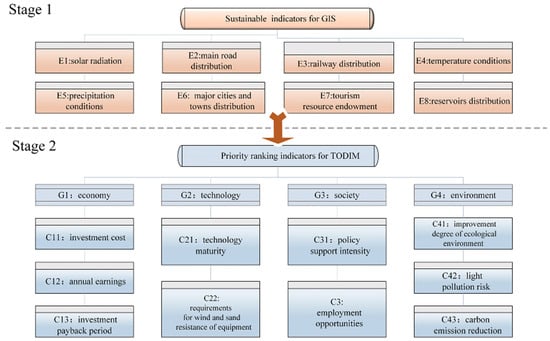
Figure 4.
Analyzing indicators of “PV +” multi-industry site selection in “Desert-Gobi-Wilderness” region.

Table 1.
Sources and presentation of the set of analytical indicators of the “PV +” multi-business site selection decision framework.
2.3. A Two-Stage Model of the Site Selection Decision Framework (Part 2)
The site selection decision model consists of two stages. Stage 1 assesses the spatial suitability of the “Desert-Gobi-Wilderness” region and selects regions through the input of suitability indicators E1 to E8, with high suitability for potential development. Stage 2 prioritizes six alternative regions for multi-industry integration using TODIM by inputting priority ranking indicators C11 to C43, which helps investor (P1), public (P2), and government (P3) stakeholders with different preferences for obtaining different decision-making results.
2.3.1. Stage 1: Suitability Assessment with the Help of the GIS by Inputting Suitability Indicators E1 to E8
This study used ArcGIS software to analyze and process the data collected for all the suitability indicators E1 to E8. This study output the Euclidean distance results and the reclassification results of the suitability indicators sequentially and finally obtained the alternative regions. The process is outlined below:
- (1)
- The analysis dealt with different types of indicators, including then-dimensional space between P (x1, x2, …, xn) and Q (y1, y2, …, yn), where the Euclidean distance between them was calculated as follows:
- (2)
- This study used the reclassification process on the Euclidean distance layers obtained from the analysis. Based on the Jenks method, this study formed a discrete scoring system of 1–10 points. Higher scores for positive indicators indicate better conditions, and the reverse is true for negative indicators.
- (3)
- The BWM is a subjective weight assignment method based on the decision stakeholder’s preference. By identifying the best indicator and worst indicator in the site selection decision system of indicators, we constructed a two-by-two comparison matrix and used a mathematical optimization model to solve the weights of the indicators.
Step 1: Subjective determination of the best indicator CB and the worst indicator CW.
Step 2: Construct a two-by-two comparison matrix of indicators. The best indicator CB is compared to the other indicators in the comparison matrix AB = (aB1, aB2, …, aBn), and the other indicators are compared to the worst indicator CW in the comparison matrix Bb = (a1W, a2W, …, aNw)T.
Step 3: Build a linear programming model to solve for indicator weights using the following equation:
where wB and ww represent the weights of the relative best and relative worst indicators, wj represents the weights of the remaining indicators, ξ represents the deviation, and aBj and ajW are the scores determined for comparison.
2.3.2. Stage 2: Prioritization of Alternative Regions for Potential Development Using the MCDM by Inputting Priority Ranking Indicators C11 to C43
- (1)
- Characterization and processing of qualitative indicators.
The study used an HFLTS to deal with the problem of multi-valued linguistic evaluation by experts in the site selection decision process due to incomplete information or fuzzy perception.
Definition 1.
This study uses an HFLTS to collect qualitative evaluation information for site selection decision by experts, thereby providing qualitative indicator information for “PV +” multi-industry integration site selection decisions.
where S is a finite sequent with an odd number of languages belonging to the variable.
Definition 2.
The collected HFLTSs are converted into triangular fuzzy numbers (TFNs) to facilitate subsequent quantitative analyses, and the conversion relationship between HFLTSs and TFNs is as follows:
For the setting of TFN values {x|0 < xl ≤ xm ≤ xu, x, xl, xm, xu ∈ R}, xu and xl are the upper and lower bounds of this triangular fuzzy number, and xm is the middle value of the range determined by the upper and lower bounds, making it the value that best characterizes the properties of this information set. In addition, when the range of values of the whole information set is distributed between 0 and 1, this triangular fuzzy number can be called the standard triangular fuzzy number.
Definition 3.
The results of TFN are defuzzified to obtain real numbers using the following equation:
Here, xa and xc represent the lower and upper boundaries of the triangular fuzzy number, respectively, with xb corresponding to the midpoint value derived from the interval defined by the lower and upper boundaries xa and xc.
- (2)
- Formation of a standardized site selection decision matrix.
- (3)
- Calculation of combined weights of priority ranking indicators.
The composite weights are obtained by weighting the subjective weights and objective weights with the following linear weighting formula:
where wsj denotes subjective weight, woj denotes objective weight, and this study assigns equal importance to both subjective weights α and objective weights β, α = β = 0.5, to finally obtain the final composite weight result wj.
The subjective weights wsj still using the BWM mentioned in Section 2.3.1: The objective weights use the indicator’s importance through inter-criteria correlation (CRITIC) method [,,], which is an objective weighting method that determines weights by quantifying the strength of comparison and conflict between indicators.
Step 1: Calculate the intensity of contrast between indicators as follows:
where zij denotes the standardized value of the j indicator; is the mean value of j indicator.
Step 2: Calculate the correlation coefficient between different priority ranking indicators, with larger values representing fewer conflicts and lower corresponding weights for that indicator, as follows:
where rjk is the correlation coefficient between indicator j and indicator k.
Step 3: The standardization of objective weights is defined as follows:
where wj represents the final weight of indicator j, and Ik and Ij represent the comparative strengths of indicator k and indicator j.
- (4)
- Use the TODIM for priority ranking in alternative regions by inputting priority ranking indicators C11 to C43.
Step 1: Calculate the relative weights of the ten indicators as follows:
where wr represents the largest indicators weight value, and wr = max {wj|j ∈ n}.
Step 2: Determine the relative advantage degrees of two alternative regions for each indicator and analyze the discrepancies across distinct indicators.
where denotes the degree of dominance of alternative region Ai over Ak, and we use this formula to determine the dominance degrees of all alternative regions across each indicator. θ is a recession coefficient representing the decision maker’s sensitivity to loss or risk; fij denotes the value in decision matrix of Ai, and fkj denotes the value in decision matrix of Ak.
Further, the degree of relative advantage of Ai over Ak under all metrics can be calculated as follows:
where Φ (Ai, Ak) represents the overall degree of relative advantage of Ai over Ak.
Step 3: The obtained global dominance degree of all alternative regions Ai is normalized to get the final priority ranking result using the following formula:
where represents the degree of global dominance on behalf of Ai.
2.4. Further Analysis and Discussion of the Results of Site Selection Decisions (Part 3)
2.4.1. Dual Sensitivity Analysis
- (1)
- Sensitivity analysis of the recession coefficient θ.
This study set θ = 1, and in the TODIM method, θ > 1 indicates that the decision stakeholder is risk-averse, while θ < 1 indicates that the decision stakeholder is risk-preferring. This study set θ to 0.1, 0.25, 0.5, 0.75, 1.25, 1.5, 1.75, 2, and 2.25 for sensitivity analysis.
- (2)
- Sensitivity analysis of indicators weight values.
This study made a total of twenty upward and downward adjustments to the weight values of the ten indicators and verified the stability of the TODIM method under parameter perturbations.
2.4.2. Analysis of Decision-Making Preferences of Different Subjects
In the reality of PV industry site selection decision, different decision stakeholders have different decision preferences [,,]. This study mapped different decision-making preferences by adjusting the θ values of different priority ranking indicators, quantitatively revealing the conflicting decision-making preferences and synergistic paths of different stakeholders.
2.4.3. Comparative Analysis of the Results of Site Selection Decisions
This study used the FSE, TOPSIS, and MABAC to compare and analyze the results of the site selection decisions; to validate the applicability of the TODIM used in this study for “PV +” multi-industry integration site selection decision, we demonstrate the unique value of the TODIM in resolving multi-subject psychological preference and risk conflicts.
3. Empirical Study
3.1. Study Context and Study Region
Xinjiang Province is located in the inland northwest of China, is rich in light and land resources, and is the ideal region for the development of the PV industry. As the energy hub of the “Belt and Road” and the general battlefield of the “Double Carbon” goal, Xinjiang Province has a relatively perfect PV industry chain, with the strongest policy support in China. Xinjiang is a natural laboratory for exploring the development of photovoltaic (PV) multi-industry integration in the “Desert-Gobi-Wilderness” region, with its ideal resource conditions, national strategic position, depth of multi-industry integration practice, space for policy innovation, and complex system challenges. The results of this study will directly contribute to the national energy transition and the ecological governance of western China. Therefore, this study chose the “Desert-Gobi-Wilderness” region of Xinjiang Province as the study region to verify the site selection decision framework constructed (Figure 5).
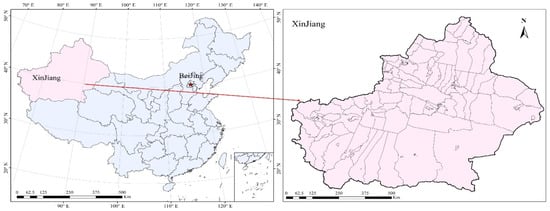
Figure 5.
Study region for “PV +” multi-industry site selection decision.
3.2. Analysis of Empirical Results
3.2.1. Results of the Suitability Assessment for “PV +” Multi-Industry Site Selection Decision
Step 1: This study integrated data from eight suitability indicators into the ArcGIS platform for empirical analysis. The spatial analysis outcomes of suitability indicators are shown in Figure 6. In the second step, this study used Euclidean distance to assess the spatial proximity between the study region and the suitability indicators (Figure 7). In the final step, this study conducted a multi-criteria overlay analysis through reclassification to obtain regions of high suitability for alternative regions (Figure 8).
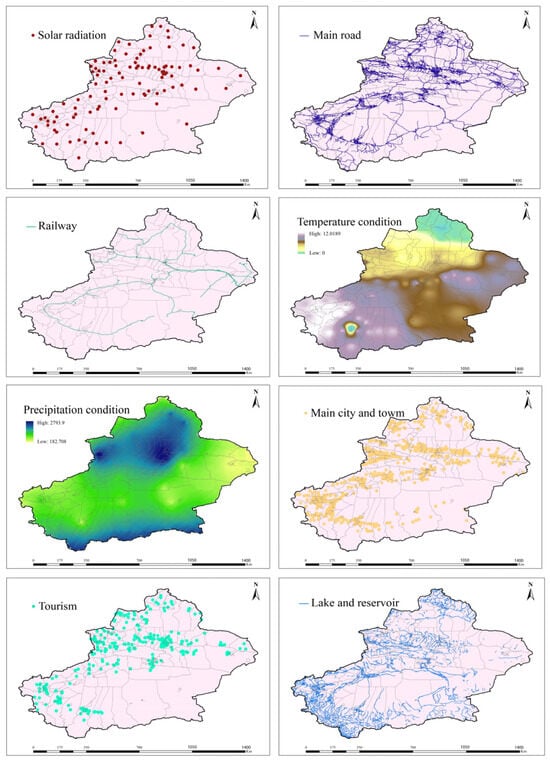
Figure 6.
Suitability indicators for layout suitability of “PV +” multi-industry integration.
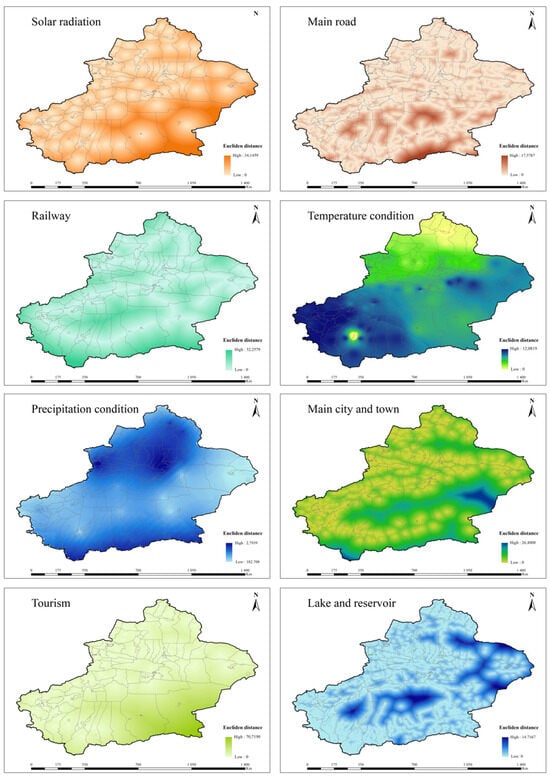
Figure 7.
Euclidean distance results of “PV +” multi-industry integration suitability indicators.
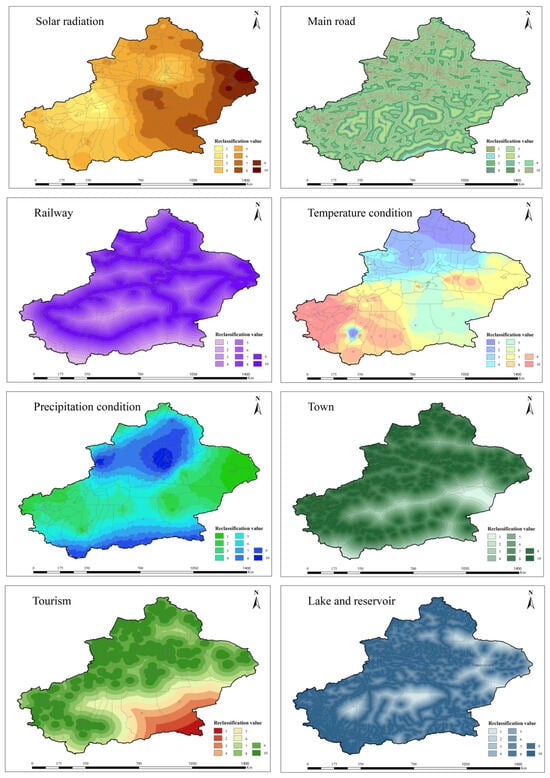
Figure 8.
Reclassification results of “PV +” multi-industry integration suitability indicators.
Step 2: We used the BWM to obtain the weighting results of the suitability indicators (Table 2).
Table 2.
Suitability indicators weights.
Step 3: Based on the global suitability simulation results within the Xinjiang Province regions obtained in Step 2 and Step 3, the upper left figure in Figure 9 shows the high suitability potential development region for the layout of “PV +” multi-industry integration. The other three figures show the results of the analyses under different thresholds.
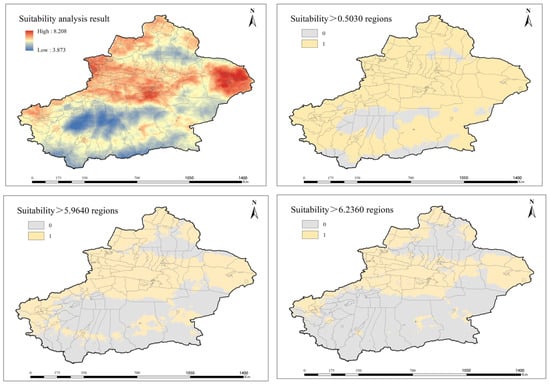
Figure 9.
Potential development regions of high suitability at different levels of suitability.
Step 4: This study chose the region with suitability > 5.964 to be compared with the “Desert-Gobi-Wilderness” region. Because it balances the scale of the high-potential region between scale and sustainability development and, at the same time, avoids the potential risk of fragmentation in the region with suitability >6.236 and the low development efficiency in the region with suitability > 0.503. Subsequently, this study compared the results with agricultural land, animal husbandry land, and tourism land in Xinjiang Province to derive alternative regions for “PV +” multi-industry integration (Figure 10).
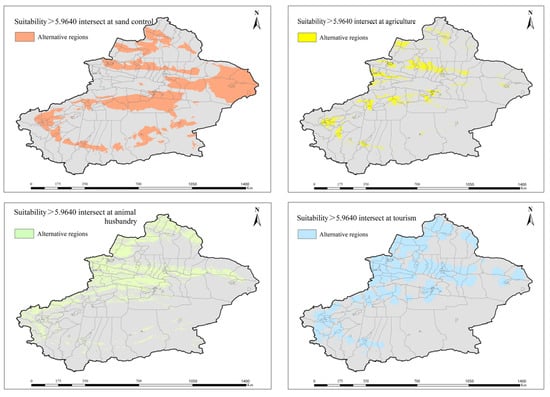
Figure 10.
Regions of high suitability for potential development and regions of overlap for multi-industry.
In summary, this study finally identified six high suitability potential development regions: Q1–Q6 (Figure 11). These include the Tacheng region and the Irtysh River valley (A1), the southern part of the Junggar Basin (A2), the Hami region (A3), the southern part of the Tianshan Mountains and the northern part of the Tarim Basin (A4), the southwestern part of the Tarim Basin (A5), and the northern part of the Kunlun Mountains (A6) (Table 3).
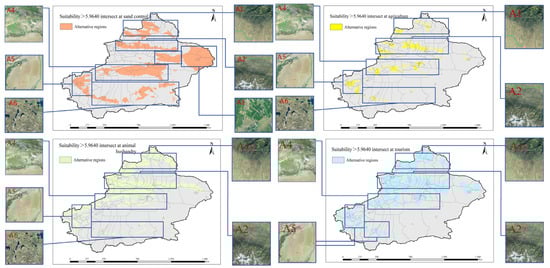
Figure 11.
Six alternative regions with high suitability for “PV +” multi-industry site selection.
Table 3.
Alternative regions for six multi-industry integration.
3.2.2. Priority Ranking of “PV +” Multi-Industry Integration Site Selection Decision
The initial decision matrix for the prioritization indicators is shown in Table 4 below.
Table 4.
Initial decision matrix for the priority ranking indicators of the “PV +” multi-industry integration.
The next step was to obtain the combined weights of the prioritized indicators (Figure 12).
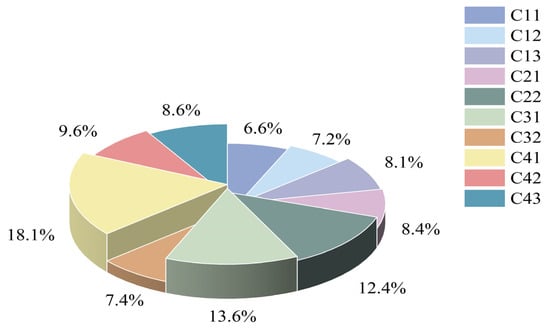
Figure 12.
Combined weights of priority ranking indicators.
Finally, using the TODIM to calculate the priority ranking of the six alternative regions among the six “PV +” multi-industry integrations, the results are as follows.
The results of the “PV + sand control” industry (Q1) came out to the following: A2 > A6 > A1 > A5 > A3 > A4 (Table 5).
Table 5.
Analytical results of the siting decision for Q1.
The “PV + agriculture” (Q2), “PV + agriculture + tourism” (Q3), “PV + animal husbandry” (Q4), and “PV + animal husbandry+ tourism” (Q5) ranking results came out to the following: A2 > A6 > A5 > A1 > A4 (Table 6).
Table 6.
Analytical results of siting decisions for Q2, Q3, Q4, Q5.
The “PV + tourism” (Q6) priority ranking result yielded the following outcome: A2 > A5 > A1 > A4 (Table 7).
Table 7.
Analytical results of site selection decisions for Q6.
3.3. Further Analyses and Discussions
The results of the analysis of the alternative regions of the six “PV +” multi-industry integration in Section 3.2.1 of this study show that the alternative regions of the “PV + sand control” industry include all regions A1–A6. Therefore, this section mainly took the alternative regions of “PV + sand control” as an example and conducted a sensitivity analysis, scenario analysis, and comparative analysis.
3.3.1. Sensitivity Analysis of the Results of Site Selection Decisions
Step 1: We adjusted the value of θ. The change in the priority ranking of A3 and A4 indicates that they have a conflict of profit and loss with respect to the priority ranking indicator. The ranking of the other regions did not change because they are less sensitive to changes in θ. When θ > 1, the rankings of A3 and A4 changed, and the rankings of the remaining regions remained unchanged. Because the decision maker ignores the risk when θ = 1, but the decision maker avoids the risk when θ > 1, the decision maker’s sensitivity to the loss exceeds the gain, which results in A3 being highly affected by the cost-based indicators C11, C13, C22, and C42; the global dominance degree of A3 decreases, and the rankings happen to fall. However, A4 rises in the ranking in the global comparison due to its low-risk characteristics. Therefore, the site selection decision needs to adjust θ in combination with the decision stakeholders’ risk preference to achieve the synergistic optimization of subjective preference and objective data. The analysis further validates the framework’s scientific validity and flexibility in complex decision-making scenarios (Figure 13).
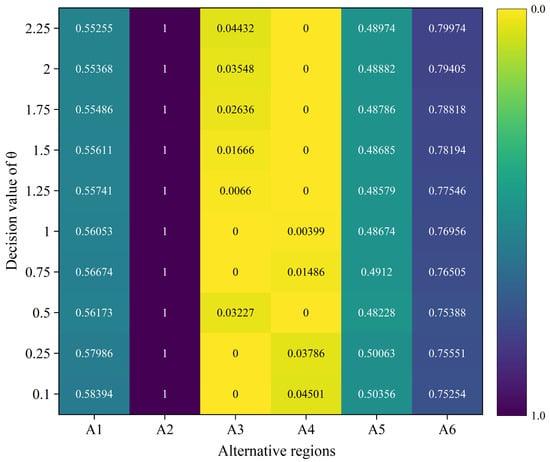
Figure 13.
Sensitivity analysis results for the decline coefficient θ in the TODIM.
Step 2: This study adjusted up and down the weights of a total of ten priority ranking indicators from C11 to C43 by 20%. The results show that the priority ranking results of the alternative regions did not change under the change in the weights of the indicators, indicating that the site selection decision framework in the “Desert-Gobi-Wilderness” region has robustness and effectively adapts to different site selection decision scenarios in which the weights of the indicators are ambiguous (Figure 14).
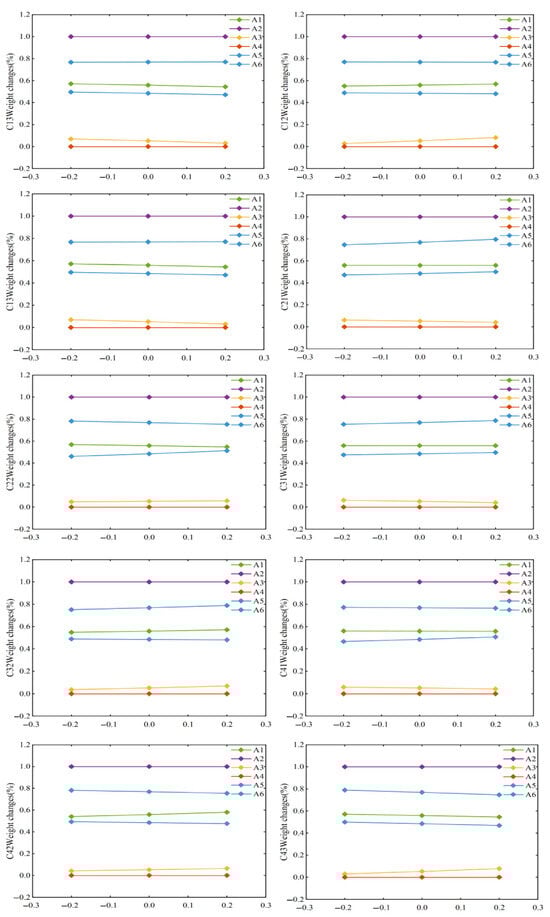
Figure 14.
Sensitivity analysis results for fluctuations in indicator weights in site selection decisions.
3.3.2. Scenario Analysis Results
In the reality of the site selection decision process, different stakeholders tend to hold different preferences for different priority ranking indicators. Therefore, this study constructed different site selection decision scenarios. Figure 15 demonstrates the dynamic and feasibility of the “PV +” multi-industry integration site selection decision-making framework; considers the decision-making preferences of three stakeholders, investors (P1), public (P2), and government (P3); sets up seven scenarios; and reflects the differences by adjusting the θ value. The θ value of the decision-making stakeholder preference indicators adjusted to 0.1, indicating the higher sensitivity for that priority ranking indicator, while other indicators’ θ values remained at 1 (Figure 16).
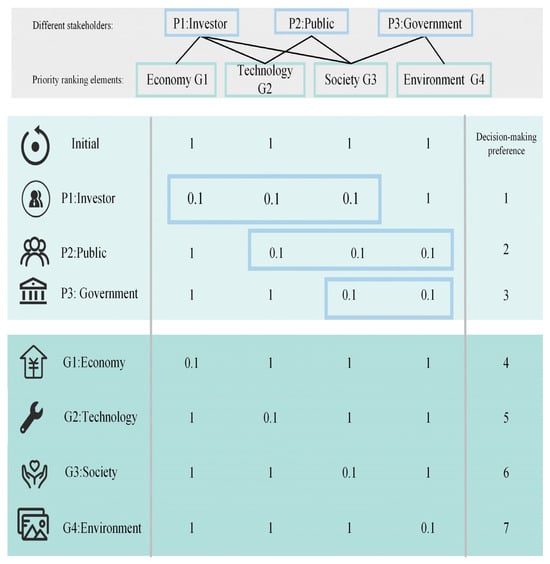
Figure 15.
Prioritization analysis under different scenarios for “PV +” multi-industry siting decisions.
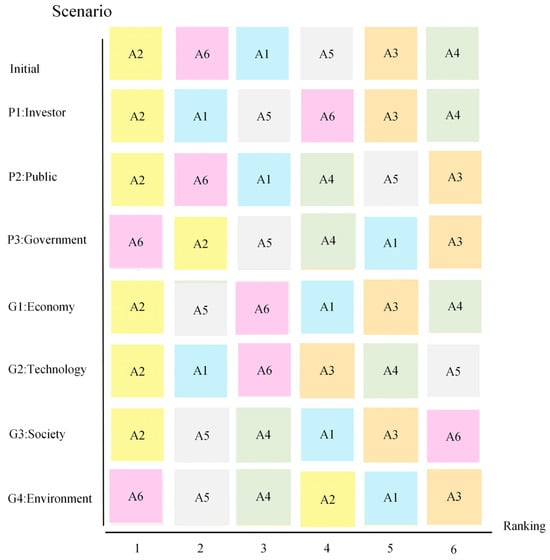
Figure 16.
Ranking results of “PV +” multi-industry site selection under different scenarios.
The scenarios analysis results show in the figure that there was a significant difference in the ranking results after accounting for the different decision preference scenarios. For example, Scenario 1 takes into account the preferences of investors (P1); investors place more emphasis on G1, G2, and G3, and the results show that the A2 region maintains the first place in the rankings, while the A3 and A4 regions maintain the last place in the rankings, which shows that the government’s preferences have a significant effect on the results of the site selection decision.
3.3.3. Comparative Analysis Results
In this section, using the FSE, MABAC, and TOPSIS to establish the priority ranking of the six alternative regions (Table 8), we present a comparison with the sorting results of the TODIM (Figure 17).
Table 8.
Comparative results of priority ranking analysis for “PV +” multi-industry siting decisions.
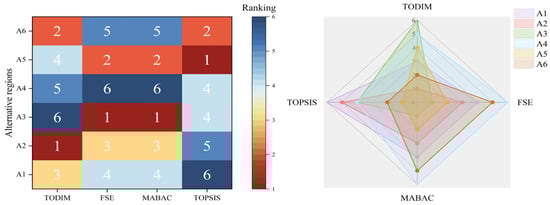
Figure 17.
Comparison results of different methods for “PV +” multi-industry siting decisions.
As can be seen from the table above, the ranking results of the FSE and MABAC are precisely the same because the high-weighted indicators are decisive for the results of both methods. Different multi-criteria decision-making methods lead to varying results in priority site selection decisions due to their theoretical framework. Therefore, when solving the multi-criteria decision-making problem of the “PV +” multi-industry integration site section decision, we need to consider the decision stakeholder’s preference actively.
3.3.4. Theoretical Advantages and Empirical Comparison of TODIM Methods in Dynamic Preference Scenarios
The TODIM method is based on prospect theory—through the loss aversion coefficient θ to quantify the decision maker’s psychological preference; when the decision maker’s preferences are more conservative, the loss domain penalty is exponentially enlarged, which matches the dynamic risk of different decision-making subjects in the “PV +” multi-industry site selection. However, the TOPSIS method is statically flawed, relying only on geometric distance calculations, and is unable to respond to changes in decision makers’ psychological preferences. Therefore, TODIM is more decision-adaptive than TOPSIS in “PV +” multi-industry integration sitting with multiple decision makers.
4. Conclusions and Outlook
According to the United Nations Convention to Combat Desertification, desertified land covers 3.6 billion hectares globally. The “PV +” multi-industry integration for the “Desert-Gobi-Wilderness” region conforms to the development path of green power production–industrial synergy and provides a replicable solution for the transformation and upgrading of the energy structure and sustainable development goals. This study provides the site selection decision framework, fills the gap in the methodology of multi-industry synergistic development in the “Desert-Gobi-Wilderness” region, and facilitates the green transformation of arid and semi-arid areas around the world. The site selection decision framework is divided into three parts: Part I integrates geographic, meteorological, economic, social, ecological and other multi-dimensional indicators systems to construct a high-resolution spatial database. Part II constructs a site selection decision model including two stages. Stage 1 assesses the suitability of the “Desert-Gobi-Wilderness” region in China and screens out potential development regions with high suitability. Stage 2 prioritizes the alternative areas. Stage 3 conducts sensitivity analysis, scenario analysis, and comparative analysis and improves the site selection decision results.
This study conducted an empirical analysis of the “Desert-Gobi-Wilderness” region of China and obtained the following results: (1) Taking the “Desert-Gobi-Wilderness” region of Xinjiang Province as the study region, this study identified regions suitable for the development of different multi-industry integrations by combining climatic, humanistic, and other conditions, and then through constructs a site selection decision framework, this study realized the unification of economic, social, and ecological benefits, thereby conforming to the development trend of sustainable development. (2) Innovative practice of multi-disciplinary integration: We used the integration of geographic information technology, ecology, economics, sociology, and other disciplines to reflect the critical roles of different fields in green development and energy structure transformation and upgrading. (3) Stakeholder participation in decision-making analysis: This study incorporated stakeholder participation within the site selection decision framework to inform decision processes and evaluated the qualitative decision-making indexes to ensure that the decision-making results were more authentic and accurate and more in line with reality. (4) Conducting local preference analysis: In actual decision making, different decision-making stakeholders have different attitudes, positions, and preferences toward different indicators, so preference analysis was introduced to reflect the sorting results of site selection decisions in different contexts, which better aligns with the needs of practical decision-making scenarios. At the same time, it resulted in making the results of the study more dynamic and comprehensive.
The outlook is as follows: (1) Horizontal expansion of practical applications: Cross-regional extension of the site selection decision-making framework to other desert regions, such as the Middle East Desert Region, encompasses future outlooks. (2) Realize the deep integration of multi-industry integration, such as exploring “PV + desalination”, “PV + sewage treatment “, and other new modes, deepening the transformation and upgrading of energy structure. (3) Future research needs to keep abreast with the times, focus on the changes in the development of various factors, and continuously inject new energy into the sustainable development of “PV +” multi-industry integration of “Desert-Gobi-Wilderness”.
Author Contributions
Z.S.: Writing—review and editing, Writing—original draft, Visualization. J.Z.: Original draft, Supervision, Resources, Methodology, Funding acquisition. C.Y.: Writing—review and editing, Visualization. S.W. and Z.C.: Writing review and editing, Validation. J.S.: Validation. Y.W.: Conceptualization, Funding acquisition. All authors have read and agreed to the published version of the manuscript.
Funding
This research is supported by the Xinjiang Uygur Autonomous Region Federation of Social Science Associations (2024ZJFLD07), the Research Fund for Humanities and Social Sciences of the Ministry of Education (23YJCZH328), the National Natural Science Foundation of China (72401248), the Natural Science Foundation of Xinjiang Uygur Autonomous Region (2022D01C665), and the Major Project of the National Social Science Fund of China (21&ZD133).
Data Availability Statement
No new data were created or analyzed in this study. Data sharing is not applicable to this article.
Conflicts of Interest
The authors declare that they have no known competing financial interests or personal relationships that could have appeared to influence the work reported in this paper.
Nomenclature
| Abbreviations | cj | Total conflict | |
| AHP | Analytical hierarchy process | cW | The worst indicator |
| BWM | Best–Worst method | ppv | Generating capacity |
| CRITIC | Criteria importance through inter-criteria correlation | pp | Static payback periods |
| CER | Certified emission reduction | wB | The weight of the relatively best indicators |
| DNI | Direct normal irradiance | wj | The weight of other indicators |
| FSE | Fuzzy synthetic evaluation | ww | The weight of the relatively worst indicators |
| GIS | Geographic information system | wsj | The subjective weight |
| HFLTS | Hesitant fuzzy linguistic term set | woj | The objective weight |
| MABAC | Multi-attribute border approximation area | wjr | The relative weight |
| TFN | Triangular fuzzy number | wr | The largest indicator’s weight value |
| TOPSIS | Technique for order preference by similarity to ideal solution | α | The adjustable coefficient indicators |
| PV | Photovoltaic | β | The adjustable coefficient indicators |
| MCDM | Multi-criteria decision making | aBj | The indicators other than the relative best indicators |
| TODIM | Tomada de Decisão Interativa e Multicritério | ajw | The indicators other than the relative worst indicators |
| Parameters | ξi | Standard deviation | |
| Cαep | Equipment investment costs | θ | Recession coefficient |
| Com | Maintenance costs | σj | The intensity of contrast between indicators |
| cB | The best indicator | δj(Ai,Ak) | The degree of overall advantage |
| Φj(Ai,Ak) | The degree of relative advantage | ||
References
- Judd, E.J.; Tierney, J.E.; Lunt, D.J.; Montañez, I.P.; Huber, B.T.; Wing, S.L.; Valdes, P.J. A 485-million-year history of Earth’s surface temperature. Science 2024, 385, 6175. [Google Scholar] [CrossRef]
- Bayo-Besteiro, S.; de la Torre, L.; Costoya, X.; Gómez-Gesteira, M.; Pérez-Alarcón, A.; deCastro, M.; Añel, J.A. Photovoltaic power resource at the atacama desert under climate change. Renew. Energy 2023, 216, 118999. [Google Scholar] [CrossRef]
- Meng, R.; Meng, Z.; Ren, X.; Cai, J.; Tong, X. Positive impacts of typical desert photovoltaic scenarios in China on the growth and physiology of sand-adapted plants. Front. Plant Sci. 2025, 15, 1515896. [Google Scholar] [CrossRef]
- Schwarz, R.; Ziv, Y. Shedding light on biodiversity: Reviewing existing knowledge and exploring hypothesised impacts of agrophotovoltaics. Biol. Rev. 2024, 100, 855–870. [Google Scholar] [CrossRef]
- Zhang, Y.; Sun, H.; Tan, J.; Li, Z.; Hou, W.; Guo, Y. Capacity configuration optimization of multi-energy system integrating wind turbine/photovoltaic/hydrogen/battery. Energy 2022, 252, 124046. [Google Scholar] [CrossRef]
- Olivares, D.; Marzo, A.; Taquichiri, A.; Espinoza, R.; Henriquez, M.; Portillo, C.; Ferrada, P.; Conde, L.A.; Fuentealba, E.; del Campo, V. Impact of thermoelectric coal-fired power plant emissions on the soiling mechanisms of nearby photovoltaic power plants in the atacama desert. Renew. Energy 2025, 244, 122684. [Google Scholar] [CrossRef]
- Rodriguez-Pastor, D.A.; Ildefonso-Sanchez, A.F.; Soltero, V.M.; Peralta, M.E.; Chacartegui, R. A new predictive model for the design and evaluation of bifacial photovoltaic plants under the influence of vegetation soils. J. Clean. Prod. 2022, 385, 135701. [Google Scholar] [CrossRef]
- von Rüden, L.; Satola, B.; Reininghaus, N.; Kröner, M.; Vehse, M.; Dyck, A.; Agert, C. GIS-based technical analysis of the local renewable energy production potentials of farms in Germany. Renew. Sustain. Energy Rev. 2025, 212, 115412. [Google Scholar] [CrossRef]
- Liu, B.; Huo, X. Prediction of photovoltaic power generation and analyzing of carbon emission reduction capacity in China. Renew. Energy 2024, 222, 119967. [Google Scholar] [CrossRef]
- Chen, H.; Wu, W.; Li, C.; Lu, G.; Ye, D.; Ma, C.; Ren, L.; Li, G. Temporal variations and driving mechanisms of carbon and water fluxes in desert photovoltaic ecosystems. Renew. Energy 2025, 242, 122484. [Google Scholar] [CrossRef]
- Adothu, B.; Kumar, S.; John, J.J.; Oreski, G.; Mathiak, G.; Jäckel, B.; Alberts, V.; Jahangir, J.B.; Alam, M.A.; Gottschalg, R. Comprehensive review on performance, reliability, and roadmap of c-Si PV modules in desert climates: A proposal for improved testing standard. Prog. Photovolt. 2024, 32, 495–527. [Google Scholar] [CrossRef]
- Ramadhani, U.H.; Ramdhania, L.N.; Iskandar, H.; Fudholi, A.; Abimanyu, H. Review of solar thermal technologies in sustainable animal agriculture farms: Current and potential uses. Sol. Energy 2025, 291, 113374. [Google Scholar] [CrossRef]
- Martins, F.; Sitchinava, T.; Keryan, T.; Mitrofanenko, A.; Stefanelli, N.; Guigoz, Y. Sustainable tourism and SDGs in the south caucasus. Sustain. Dev. 2025. [Google Scholar] [CrossRef]
- Knapp, A.K.; Sturchio, M.A. Ecovoltaics in an increasingly water-limited world: An ecological perspective. One Earth 2024, 7, 1705–1712. [Google Scholar] [CrossRef]
- Shriki, N.; Rabinovici, R.; Yahav, K.; Rubin, O. Prioritizing suitable locations for national-scale solar PV installations: Israel’s site suitability analysis as a case study. Renew. Energy 2023, 205, 105–124. [Google Scholar] [CrossRef]
- Kaya, Ö.; Alemdar, K.D.; Çodur, M.Y. A novel two stage approach for electric taxis charging station site selection. Sustain. Cities Soc. 2020, 62, 102396. [Google Scholar] [CrossRef]
- Feyzi, S.; Khanmohammadi, M.; Abedinzadeh, N.; Aalipour, M. Multi- criteria decision analysis FANP based on GIS for siting municipal solid waste incineration power plant in the north of Iran. Sustain. Cities Soc. 2019, 47, 101513. [Google Scholar] [CrossRef]
- Elomiya, A.; Křupka, J.; Jovčić, S.; Simic, V.; Švadlenka, L.; Pamucar, D. A hybrid suitability mapping model integrating GIS, machine learning, and multi-criteria decision analytics for optimizing service quality of electric vehicle charging stations. Sustain. Cities Soc. 2024, 106, 105397. [Google Scholar] [CrossRef]
- Li, Z.; Tian, G.; El-Shafay, A.S. Statistical-analytical study on world development trend in offshore wind energy production capacity focusing on great britain with the aim of MCDA based offshore wind farm siting. J. Clean. Prod. 2022, 363, 132326. [Google Scholar] [CrossRef]
- Ma, C.; Zhang, Y.; Yi, S.; Lu, Y. Optimizing urban agricultural waste planning and management to enhance sustainability: Strategies for three types of cities. Sustain. Cities Soc. 2025, 120, 106168. [Google Scholar] [CrossRef]
- Zorrilla-Muñoz, V.; Moyano, D.L.; Marcos Carvajal, C.; Agulló-Tomás, M.S. Towards equitable representations of ageing: Evaluation of gender, territories, aids and artificial intelligence. Land 2024, 13, 1304. [Google Scholar] [CrossRef]
- Dargahi, F.; Shamloo, J.I. Investigating the realization of spatial justice based on multi-criteria decision-making methods in a metropolis in northwest Iran. Sustain. Cities Soc. 2023, 99, 104986. [Google Scholar] [CrossRef]
- Li, X.; Xu, X.; Yin, R.M. Spatial optimization of agricultural production from the perspective of “greater food concept” in yangzhou, china. Ecol. Indic. 2024, 169, 112805. [Google Scholar] [CrossRef]
- Zhao, Y.; Jiang, N.; He, Y.; Deng, X. Entropy measures of multigranular unbalanced hesitant fuzzy linguistic term sets for multiple criteria decision making. Inf. Sci. 2024, 686, 121346. [Google Scholar] [CrossRef]
- Dang, K.B.; Windhorst, W.; Burkhard, B.; Müller, F. A bayesian belief network–based approach to link ecosystem functions with rice provisioning ecosystem services. Ecol. Indic. 2018, 100, 30–44. [Google Scholar] [CrossRef]
- Ouchani, F.; Jbaihi, O.; Maaroufi, M.; Ghennioui, A. Identification of suitable sites for large-scale photovoltaic installations through a geographic information system and analytical hierarchy process combination: A case study in marrakesh-safi region, morocco. Prog. Photovolt. 2020, 29, 714–724. [Google Scholar] [CrossRef]
- Giamalaki, M.; Tsoutsos, T. Sustainable siting of solar power installations in Mediterranean using a GIS/AHP approach. Renew. Energy 2019, 141, 64–75. [Google Scholar] [CrossRef]
- Eren, E.; Katanalp, B.Y. Fuzzy-based GIS approach with new MCDM method for bike-sharing station site selection according to land-use types. Sustain. Cities Soc. 2021, 76, 103434. [Google Scholar] [CrossRef]
- Sward, J.A.; Nilson, R.S.; Katkar, V.V.; Stedman, R.C.; Kay, D.L.; Ifft, J.E.; Zhang, K.M. Integrating social considerations in multicriteria decision analysis for utility-scale solar photovoltaic siting. Appl. Energy 2021, 288, 116543. [Google Scholar] [CrossRef]
- Zhou, J.; Wu, Y.; Tao, Y.; Gao, J.; Zhong, Z.; Xu, C. Geographic information big data-driven two-stage optimization model for location decision of hydrogen refueling stations: An empirical study in China. Energy 2021, 225, 120330. [Google Scholar] [CrossRef]
- Yücenur, G.N.; Maden, A. Location selection for a photovoltaic agricultural with f-PIPRECIA and WASPAS methods: A case study. Energy 2024, 314, 134179. [Google Scholar] [CrossRef]
- Spyridonidou, S.; Loukogeorgaki, E.; Vagiona, D.G.; Bertrand, T. Towards a sustainable spatial planning approach for PV site selection in Portugal. Energies 2022, 15, 8515. [Google Scholar] [CrossRef]
- Li, W.; Dong, F.; Shi, M.; Wang, X.; Ji, Z. Multi-attribute decision-making research on investment suitability assessment of hydropower-wind-photovoltaic-storage complementary system based on dynamic social network. Energy Convers. Manag. 2024, 307, 118358. [Google Scholar] [CrossRef]
- Wang, S.; Hou, Y.; Guan, X.; Liu, S.; Huo, Z. Resiliency-informed optimal scheduling of smart distribution network with urban distributed photovoltaic: A stochastic P-robust optimization. Energy 2024, 313, 133449. [Google Scholar] [CrossRef]
- Lin, S.-S.; Shen, S.-L.; Zhang, N.; Zhou, A. Comprehensive environmental impact evaluation for concrete mixing station (CMS) based on improved TOPSIS method. Sustain. Cities Soc. 2021, 69, 102838. [Google Scholar] [CrossRef]
- Li, G.; Liu, J.; Giordano, A. Robust optimization of construction waste disposal facility location considering uncertain factors. J. Clean. Prod. 2022, 353, 131455. [Google Scholar] [CrossRef]
- Wang, J.; Zhang, G.; Zhao, X.; Sun, L.; Wu, Y. Evaluating the effectiveness of community gardens by a quantitative systematic framework: A study of saint louis, missouri in the United States. Sustain. Cities Soc. 2022, 79, 103676. [Google Scholar] [CrossRef]
- Tan, Q.; Wei, T.; Peng, W.; Yu, Z.; Wu, C. Comprehensive evaluation model of wind farm site selection based on ideal matter element and grey clustering. J. Clean. Prod. 2020, 272, 122658. [Google Scholar] [CrossRef]
- Bukar, A.M.; Asif, M. Technology readiness level assessment of carbon capture and storage technologies. Renew. Sustain. Energy Rev. 2024, 200, 114578. [Google Scholar] [CrossRef]
- Varga, G.; Gresina, F.; Gelencsér, A.; Csávics, A.; Rostási, Á. Desert dust and photovoltaic energy forecasts: Lessons from 46 saharan dust events in Hungary (central europe). Renew. Sustain. Energy Rev. 2025, 212, 115446. [Google Scholar] [CrossRef]
- Li, Y.; Zhang, P.; Wu, Y. Public recharging infrastructure location strategy for promoting electric vehicles: A bi-level programming approach. J. Clean. Prod. 2018, 172, 2720–2734. [Google Scholar] [CrossRef]
- Feiz, R.; Geneviève, S.; Metson; Wretman, J.; Ammenberg, J. Key factors for site-selection of biogas plants in Sweden. J. Clean. Prod. 2022, 354, 131671. [Google Scholar] [CrossRef]
- Bedla, D.; Halecki, W. The value of river valleys for restoring landscape features and the continuity of urban ecosystem functions–a review. Ecol. Indic. 2021, 126, 107871. [Google Scholar] [CrossRef]
- Rahimpour, S.; El-Wali, M.; Makarava, I.; Tuomisto, H.L.; Lundström, M.; Kraslawski, A. Selected social impact indicators influenced by materials for green energy technologies. Nat. Commun. 2024, 15, 9336. [Google Scholar] [CrossRef]
- Liu, Z.; Ma, C.; Li, X.; Deng, Z.; Tian, Z. Aquatic environment impacts of floating photovoltaic and implications for climate change challenges. J. Environ. Manag. 2023, 364, 118851. [Google Scholar] [CrossRef]
- Chen, T.; Zhang, N.; Ye, Z.; Jiang, K.; Lin, Z.; Zhang, H.; Xu, Y.; Liu, Q.; Huang, H. Carbon reduction benefits of photovoltaic-green roofs and their climate change mitigation potential: A case study of Xiamen city. Sustain. Cities Soc. 2024, 114, 105760. [Google Scholar] [CrossRef]
- Dweiri, F.; Khan, S.A.; Almulla, A. A multi-criteria decision support system to rank sustainable desalination plant location criteria. Desalination 2018, 444, 26–34. [Google Scholar] [CrossRef]
- Wang, H.; Xu, Y.; Wei, X. Rural resilience evaluation and influencing factor analysis based on geographical detector method and multiscale geographically weighted regression. Land 2023, 12, 1270. [Google Scholar] [CrossRef]
- Chen, Y.-L.; Shen, S.-L.; Zhou, A. Assessment of red tide risk by integrating CRITIC weight method, TOPSIS-ASSETS method, and monte carlo simulation. Environ. Pollut. 2022, 314, 120254. [Google Scholar] [CrossRef]
- Lippe, M.; Hilger, T.; Sudchalee, S.; Wechpibal, N.; Jintrawet, A.; Cadisch, G. Simulating stakeholder-based land-use change scenarios and their implication on above-ground carbon and environmental management in northern Thailand. Land 2017, 6, 85. [Google Scholar] [CrossRef]
- Zhang, L.; Yuan, J.; Gao, X.; Jiang, D. Public transportation development decision-making under public participation: A large-scale group decision-making method based on fuzzy preference relations. Technol. Forecast. Soc. Change 2021, 172, 121020. [Google Scholar] [CrossRef]
- Ke, Y.; Tang, H.; Liu, M.; Meng, Q.; Xiao, Y. Optimal sizing for wind-photovoltaic-hydrogen storage integrated energy system under intuitionistic fuzzy environment. Int. J. Hydrogen Energy 2023, 48, 34193–34209. [Google Scholar] [CrossRef]
Disclaimer/Publisher’s Note: The statements, opinions and data contained in all publications are solely those of the individual author(s) and contributor(s) and not of MDPI and/or the editor(s). MDPI and/or the editor(s) disclaim responsibility for any injury to people or property resulting from any ideas, methods, instructions or products referred to in the content. |
© 2025 by the authors. Licensee MDPI, Basel, Switzerland. This article is an open access article distributed under the terms and conditions of the Creative Commons Attribution (CC BY) license (https://creativecommons.org/licenses/by/4.0/).