
“Photovoltaic +” Multi-Industry Integration for Sustainable Development in “Desert-Gobi-Wilderness” Region: Geospatial Suitability Simulation and Dynamic Site Selection Decision Optimization

 ,
,  ,
,
Abstract
1. Introduction
1.1. Background and Motivations
1.2. Literature Review
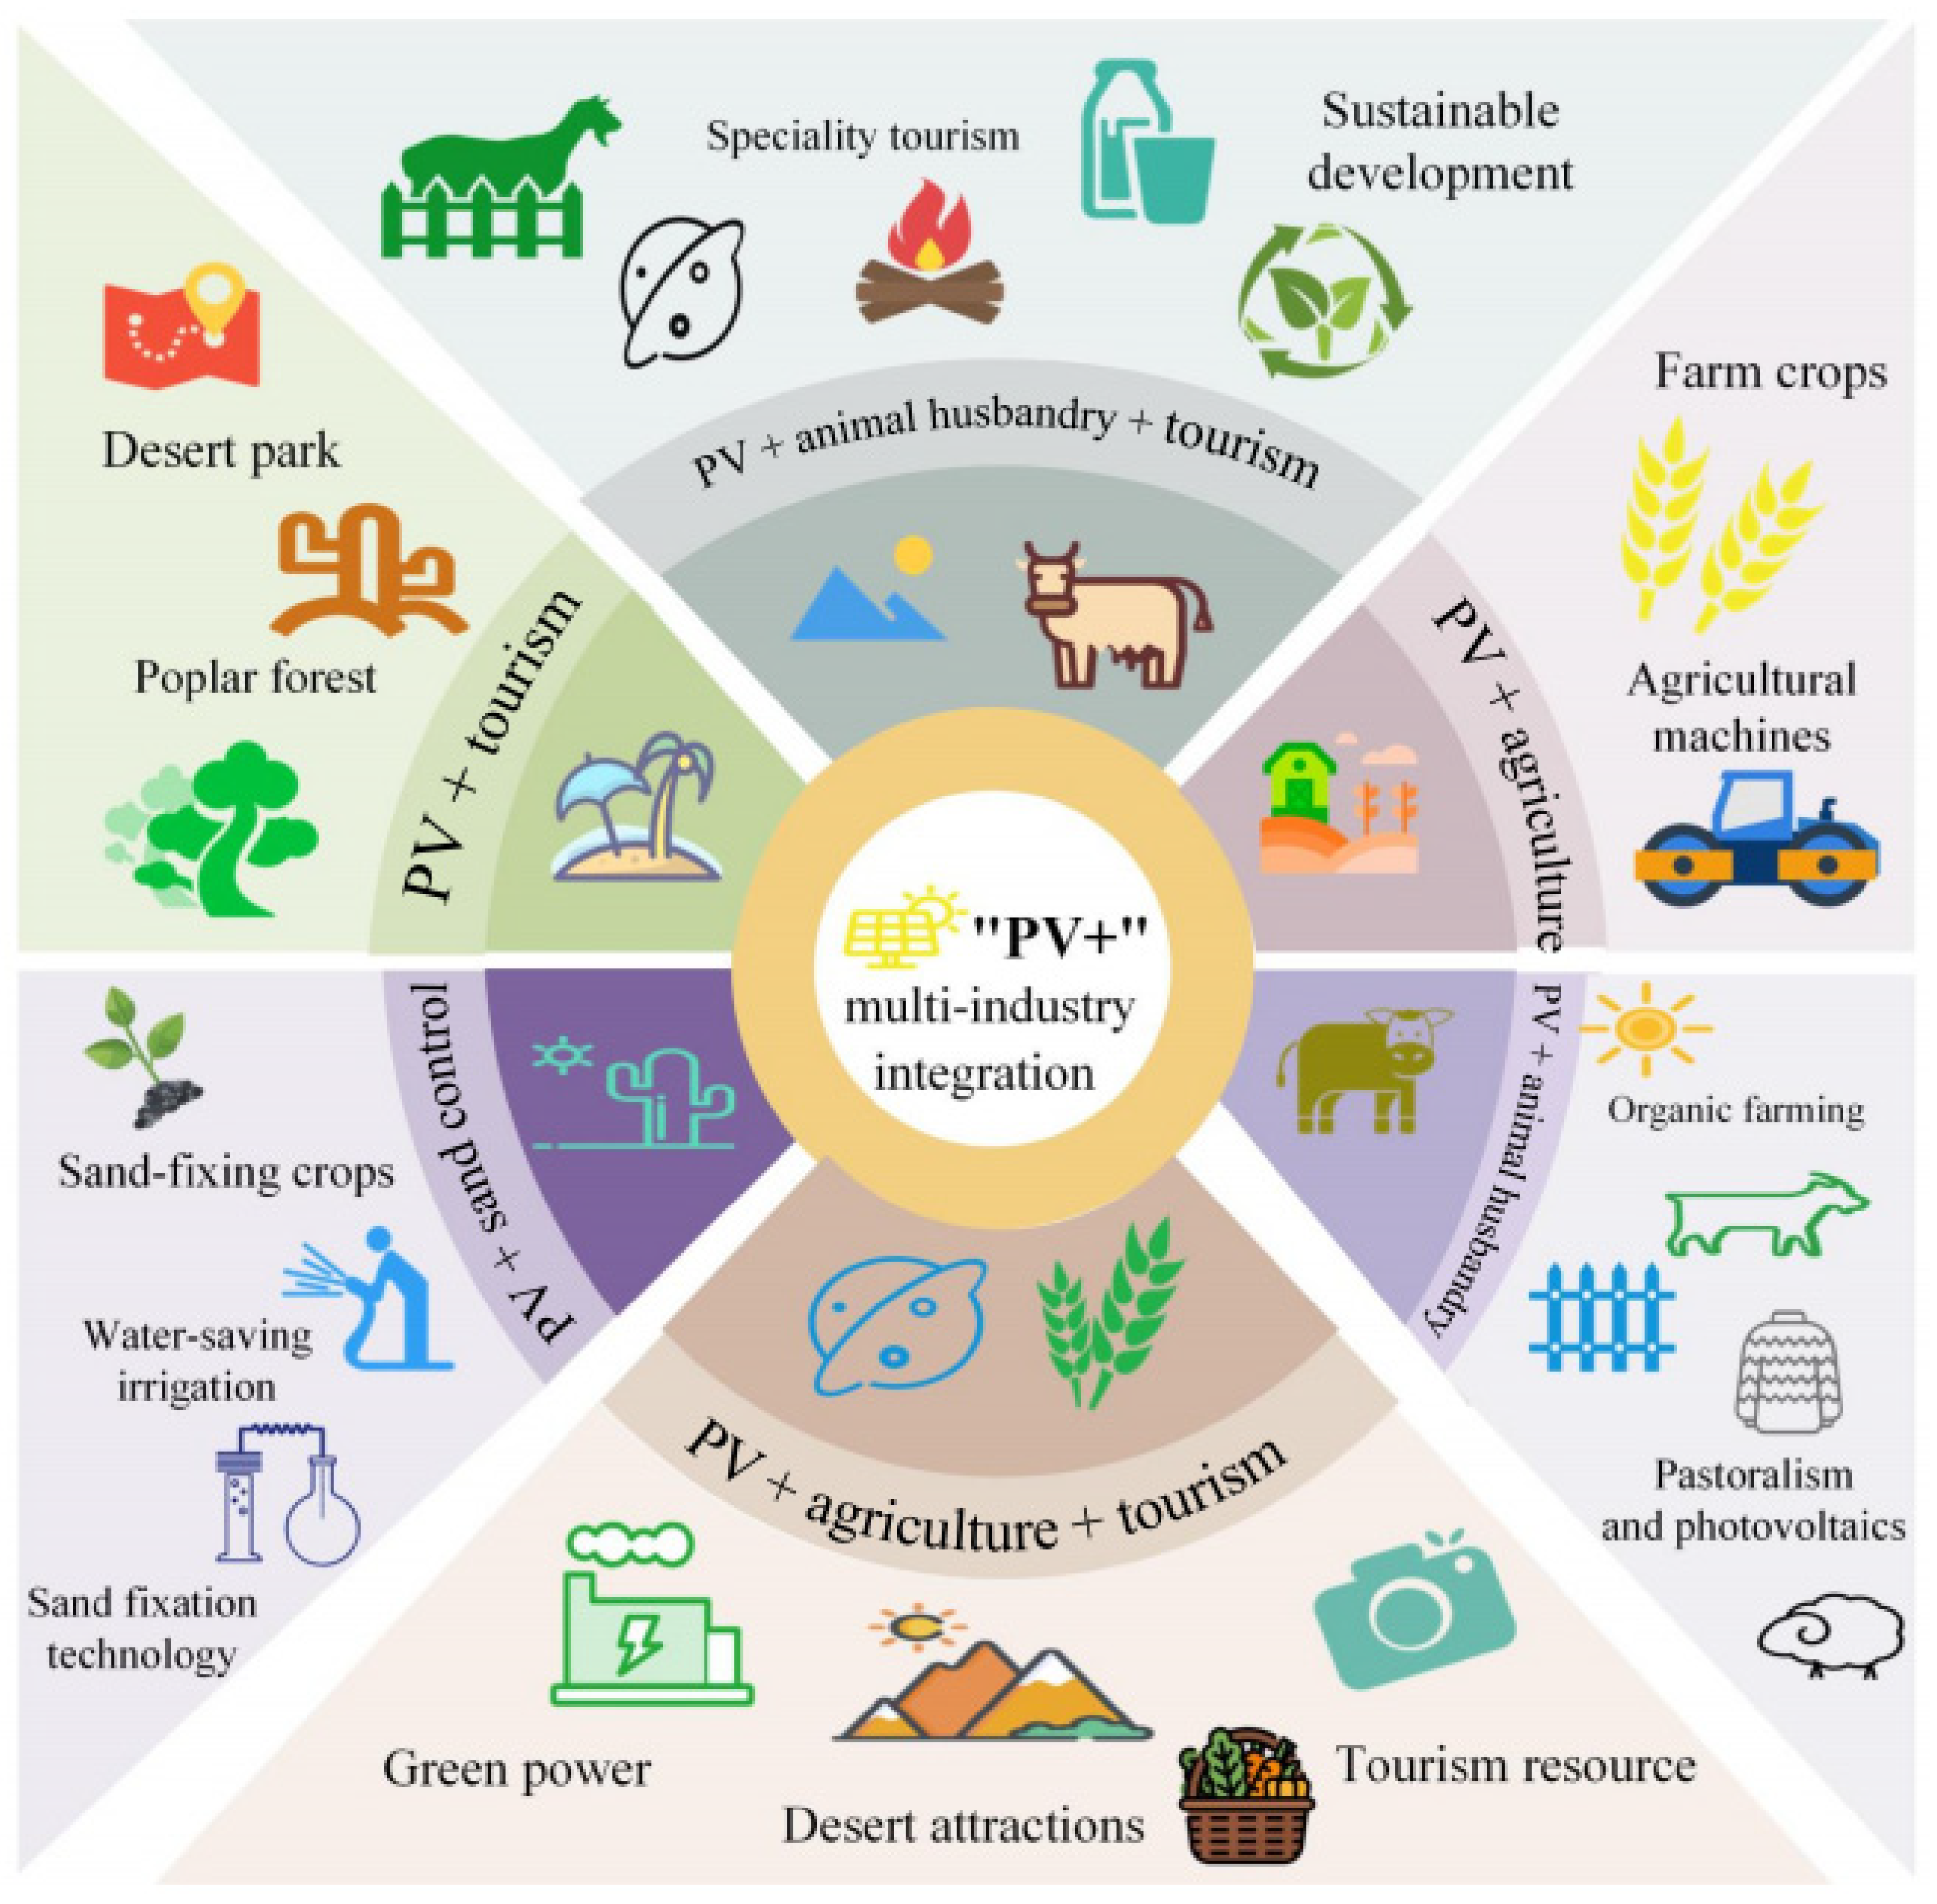
1.2.1. Evolutionary Path of “PV +” Multi-Industry Integration
1.2.2. Analyzing Indicators of “PV +” Multi-Industry Integration Site Selection Decision
1.2.3. “PV +” Multi-Industry Integration Site Selection Decision Methodology
1.3. Deficiencies in Current Site Selection Decisions
- (1)
- Most of the existing studies focus on site selection decisions and the efficiency of a single-PV power plant, and there is a lack of research on the feasibility of “PV +” multi-industry integration and the decision making on project siting.
- (2)
- The targeted indicators of site selection decision are missing. Most of the indicator weights of the existing PV industry focus on power generation efficiency, but there is a lack of relative indicators related to other multi-industry integrations.
- (3)
- Extant research neglects consideration of the uncertainty and dynamics of the site selection decision environment. The “Desert-Gobi-Wilderness” region “PV +” multi-industry integration site selection decision is affected by many indicators, especially the energy transition, and green low-carbon projects affected by the policy fluctuation degree are larger.
- (4)
- There is insufficient quantification of different stakeholders. In reality, the site selection decision process will involve many different scenarios. Most of the current studies set the decision preferences of different decision stakeholders to the same coefficient without distinguishing between them.
- (1)
- An empirical analysis is carried out in the “Desert-Gobi-Wilderness” region of China. This study constructs a multi-industry coupling site selection decision framework, by using methods such as the GIS and TODIM, and carries out suitability simulation and priority ranking of the research region.
- (2)
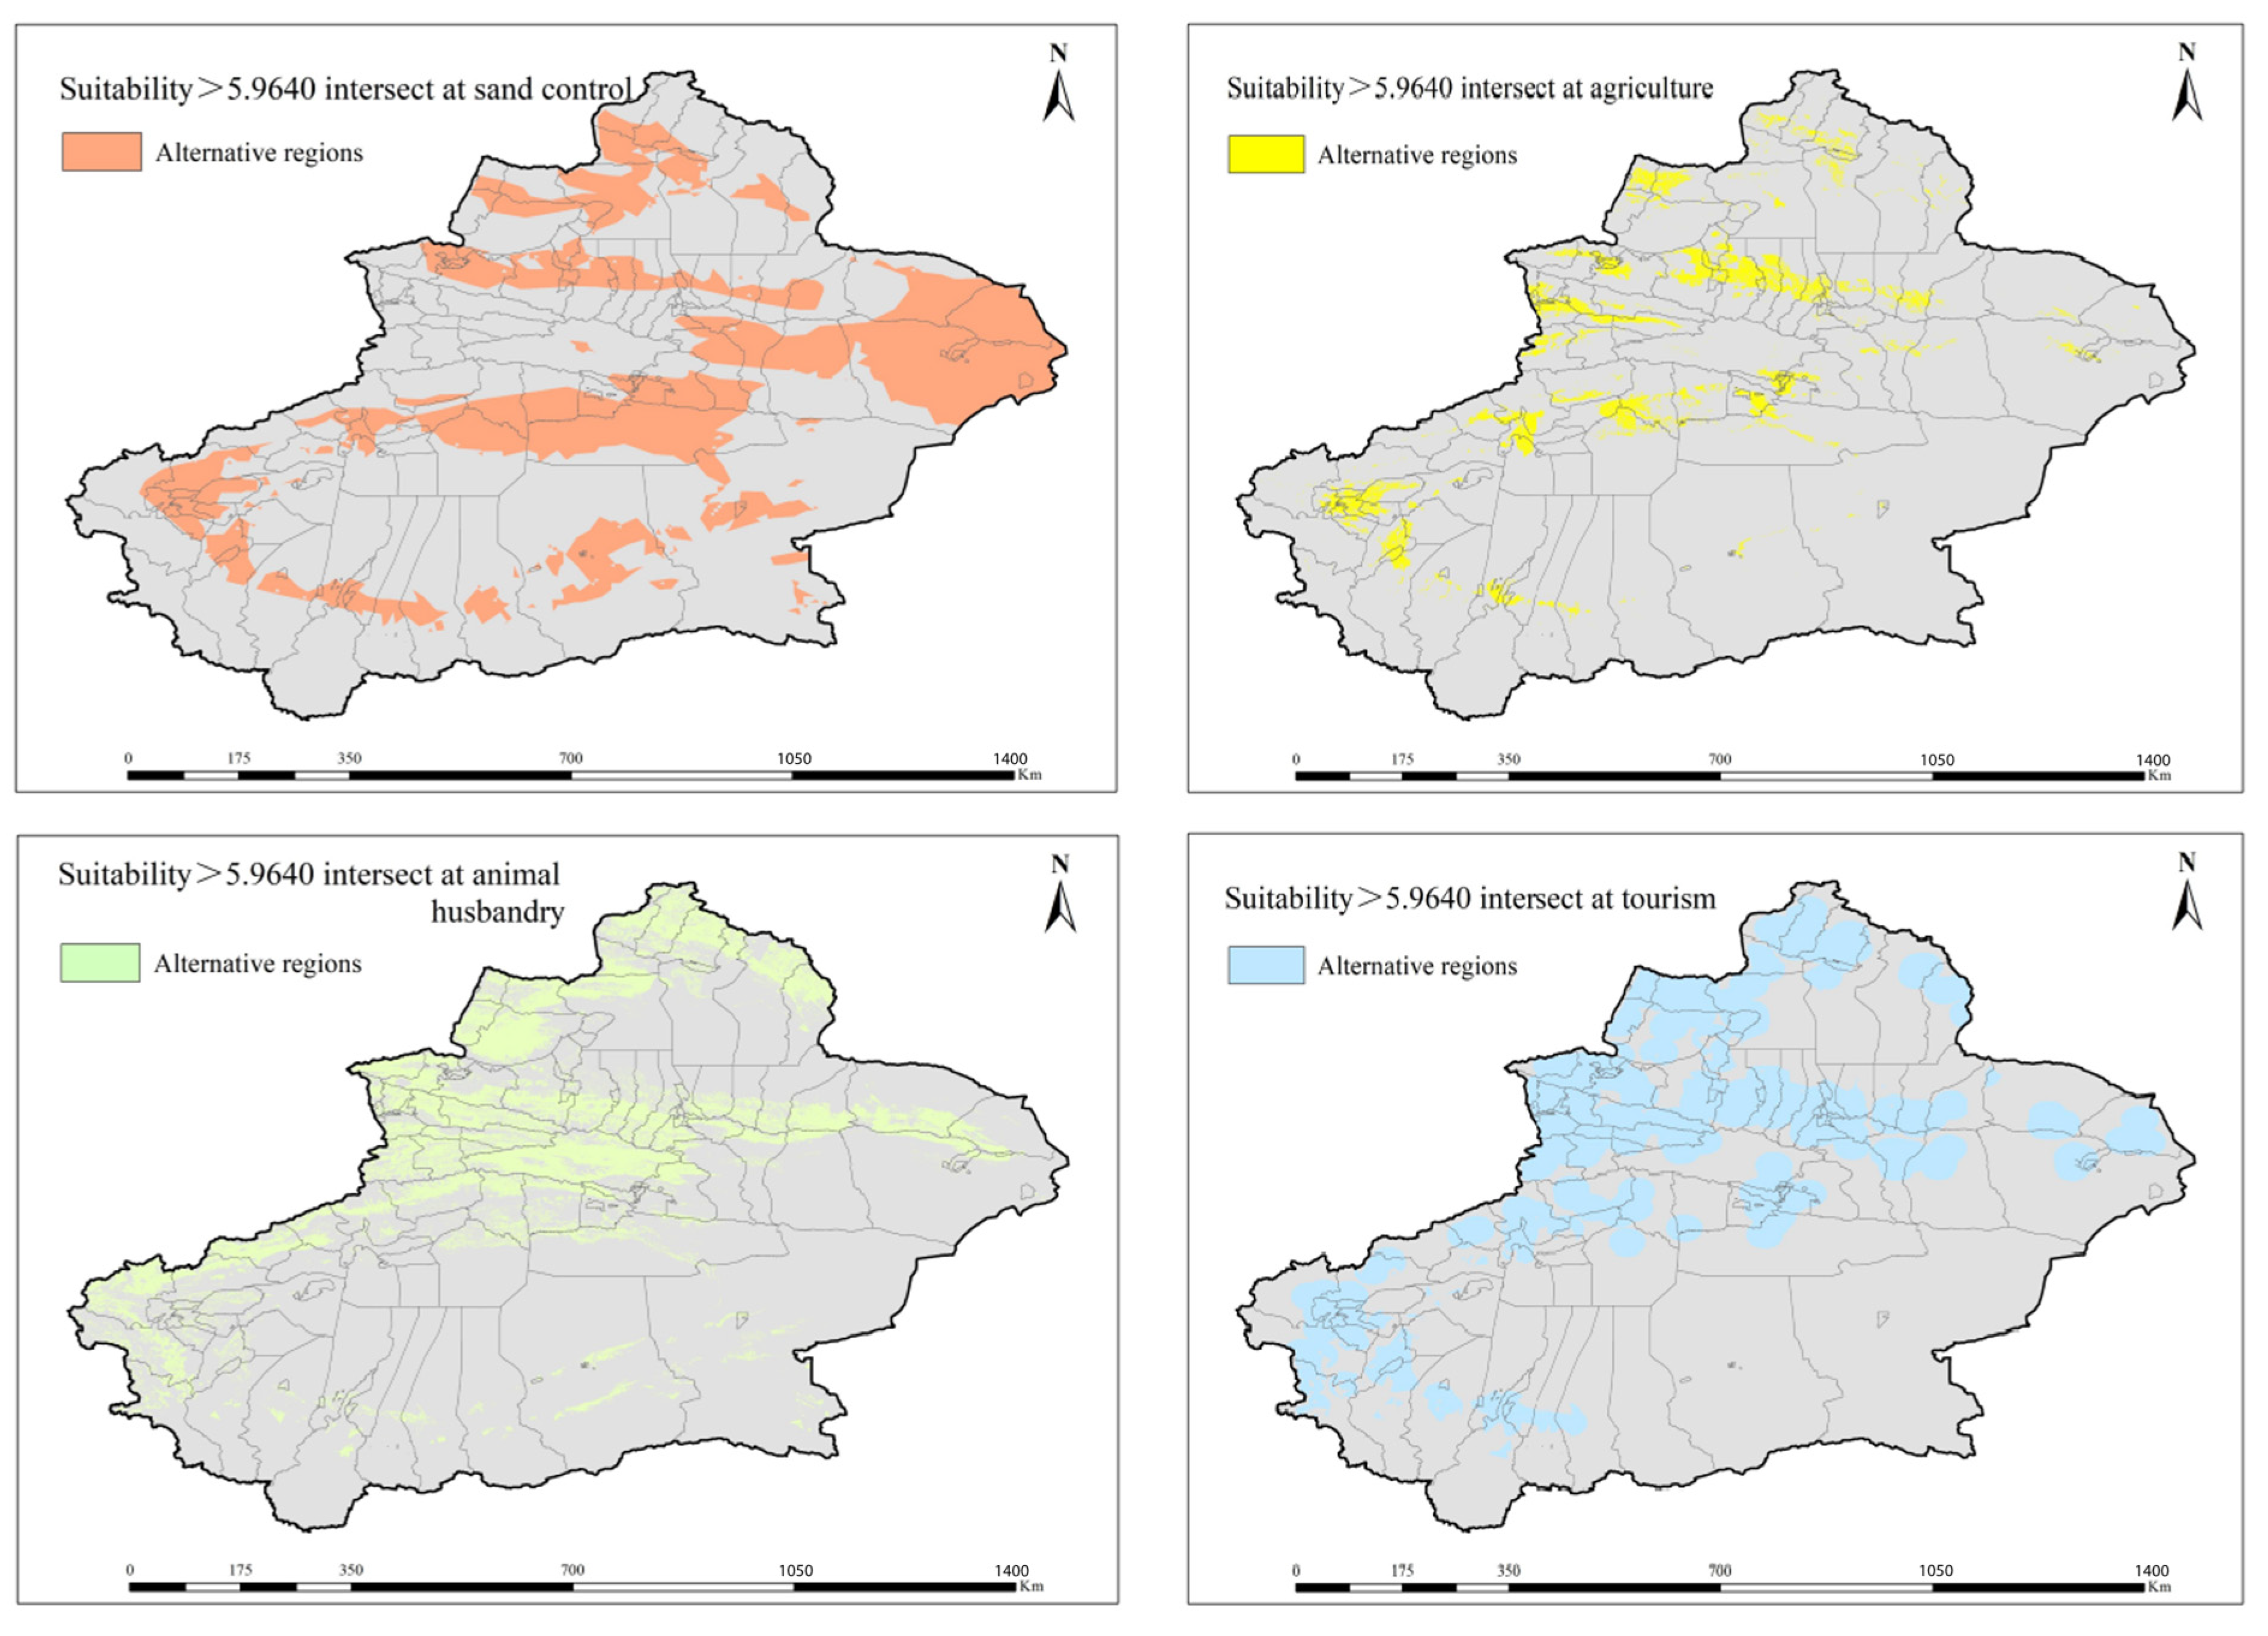
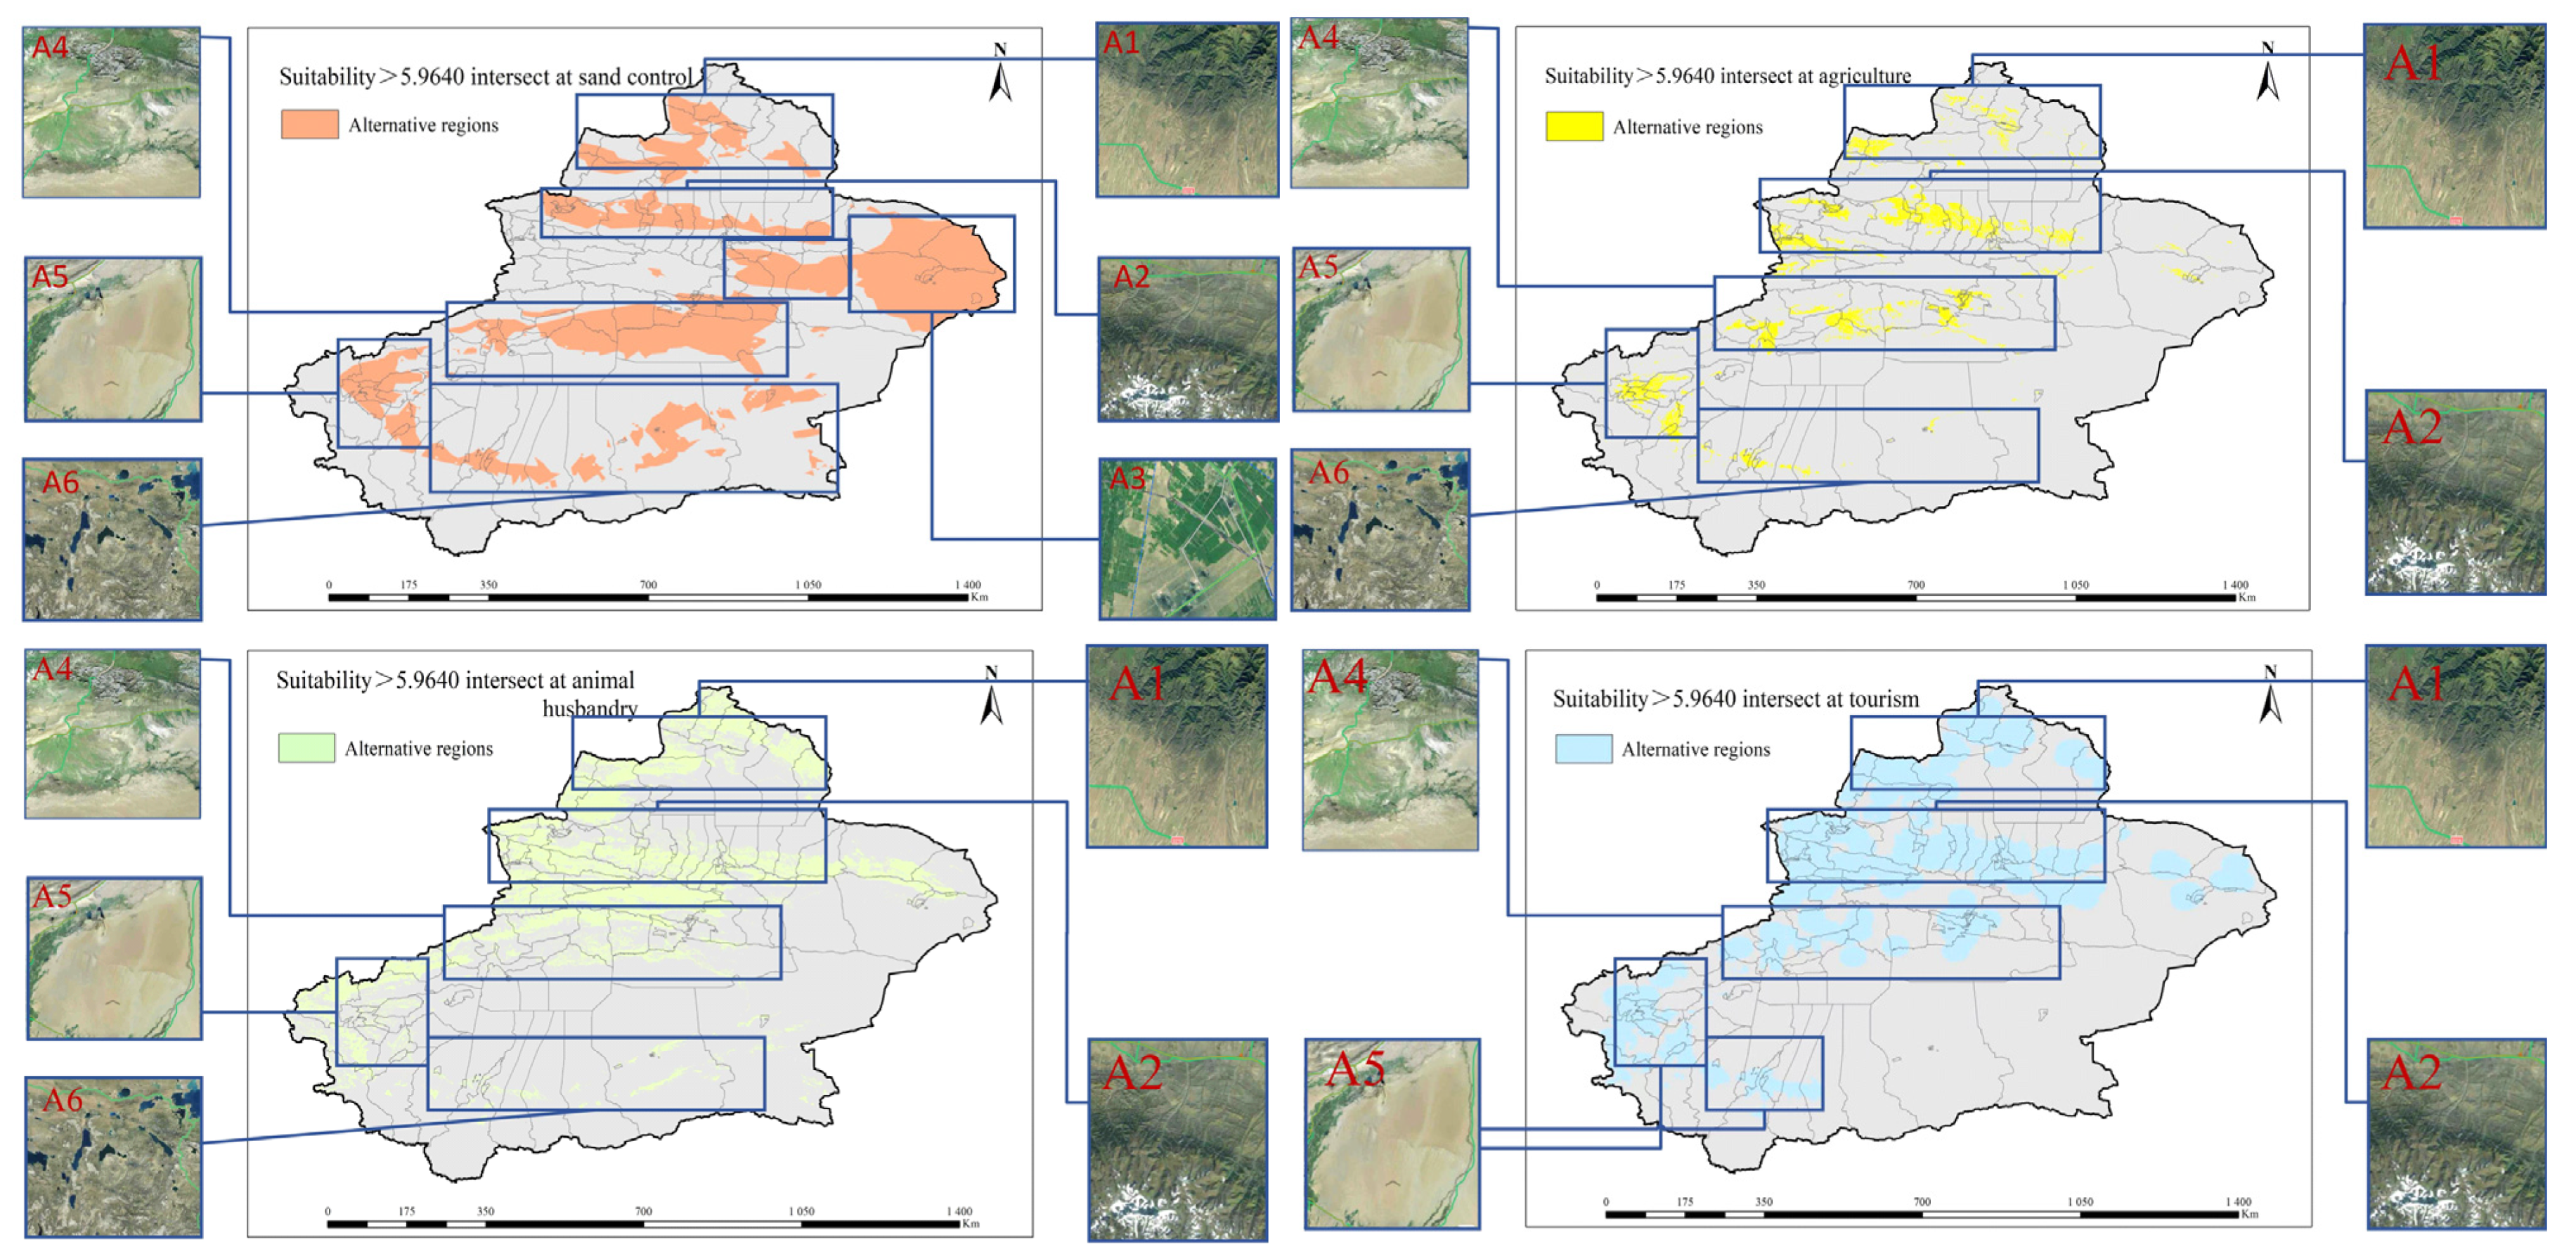
- The targeted indicators of the “Desert-Gobi-Wilderness” region are reflected through the suitability simulation of multi-source data. This study integrates multi-source data, overlays multi-source data layers for suitability simulation, and further generates alternative regions for “PV +” multi-industry integration.
- (3)
- The study examines uncertain decisions and simulates multiple scenarios so as to improve the rationality and scientific nature of site selection decisions. This study sets priority ranking indicators to fluctuate within a specific range randomly, identifies highly sensitive decision-making nodes, and analyzes the stability of the priority ranking of site selection decisions.
- (4)
- This study quantifies the site selection decision preferences of different stakeholders, reflects the results in various scenarios, and solves the problems of site selection and benefit distribution for different decision stakeholders.
1.4. Objectives and Contribution of the Study
- (1)
- This study constructs a site selection decision framework for “PV +” multi-industry integration, breaking through the limitations of a single industry. The site selection decision is carried out in three parts in the “Desert-Gobi-Wilderness” region. Part I builds a multi-source data-driven system of site selection decision indicators. Part II uses the GIS-MCDM method, conducts the suitability analysis and priority ranking, and finally obtains the site selection results in two stages.
- (2)
- This study couples multi-source data and organizes multi-disciplinary site selection decision data; it constructs a site selection decision system of indicators and sets targeted indicators for the complex and fragile natural environment of the “Desert-Gobi-Wilderness” region.
- (3)
- In prioritizing alternative regions, this study carries out a dynamic analysis in response to the uncertainty of the site selection decision environment. This study also carries out a sensitivity analysis on the decision-making results to verify the stability of the site selection decision framework.
- (4)
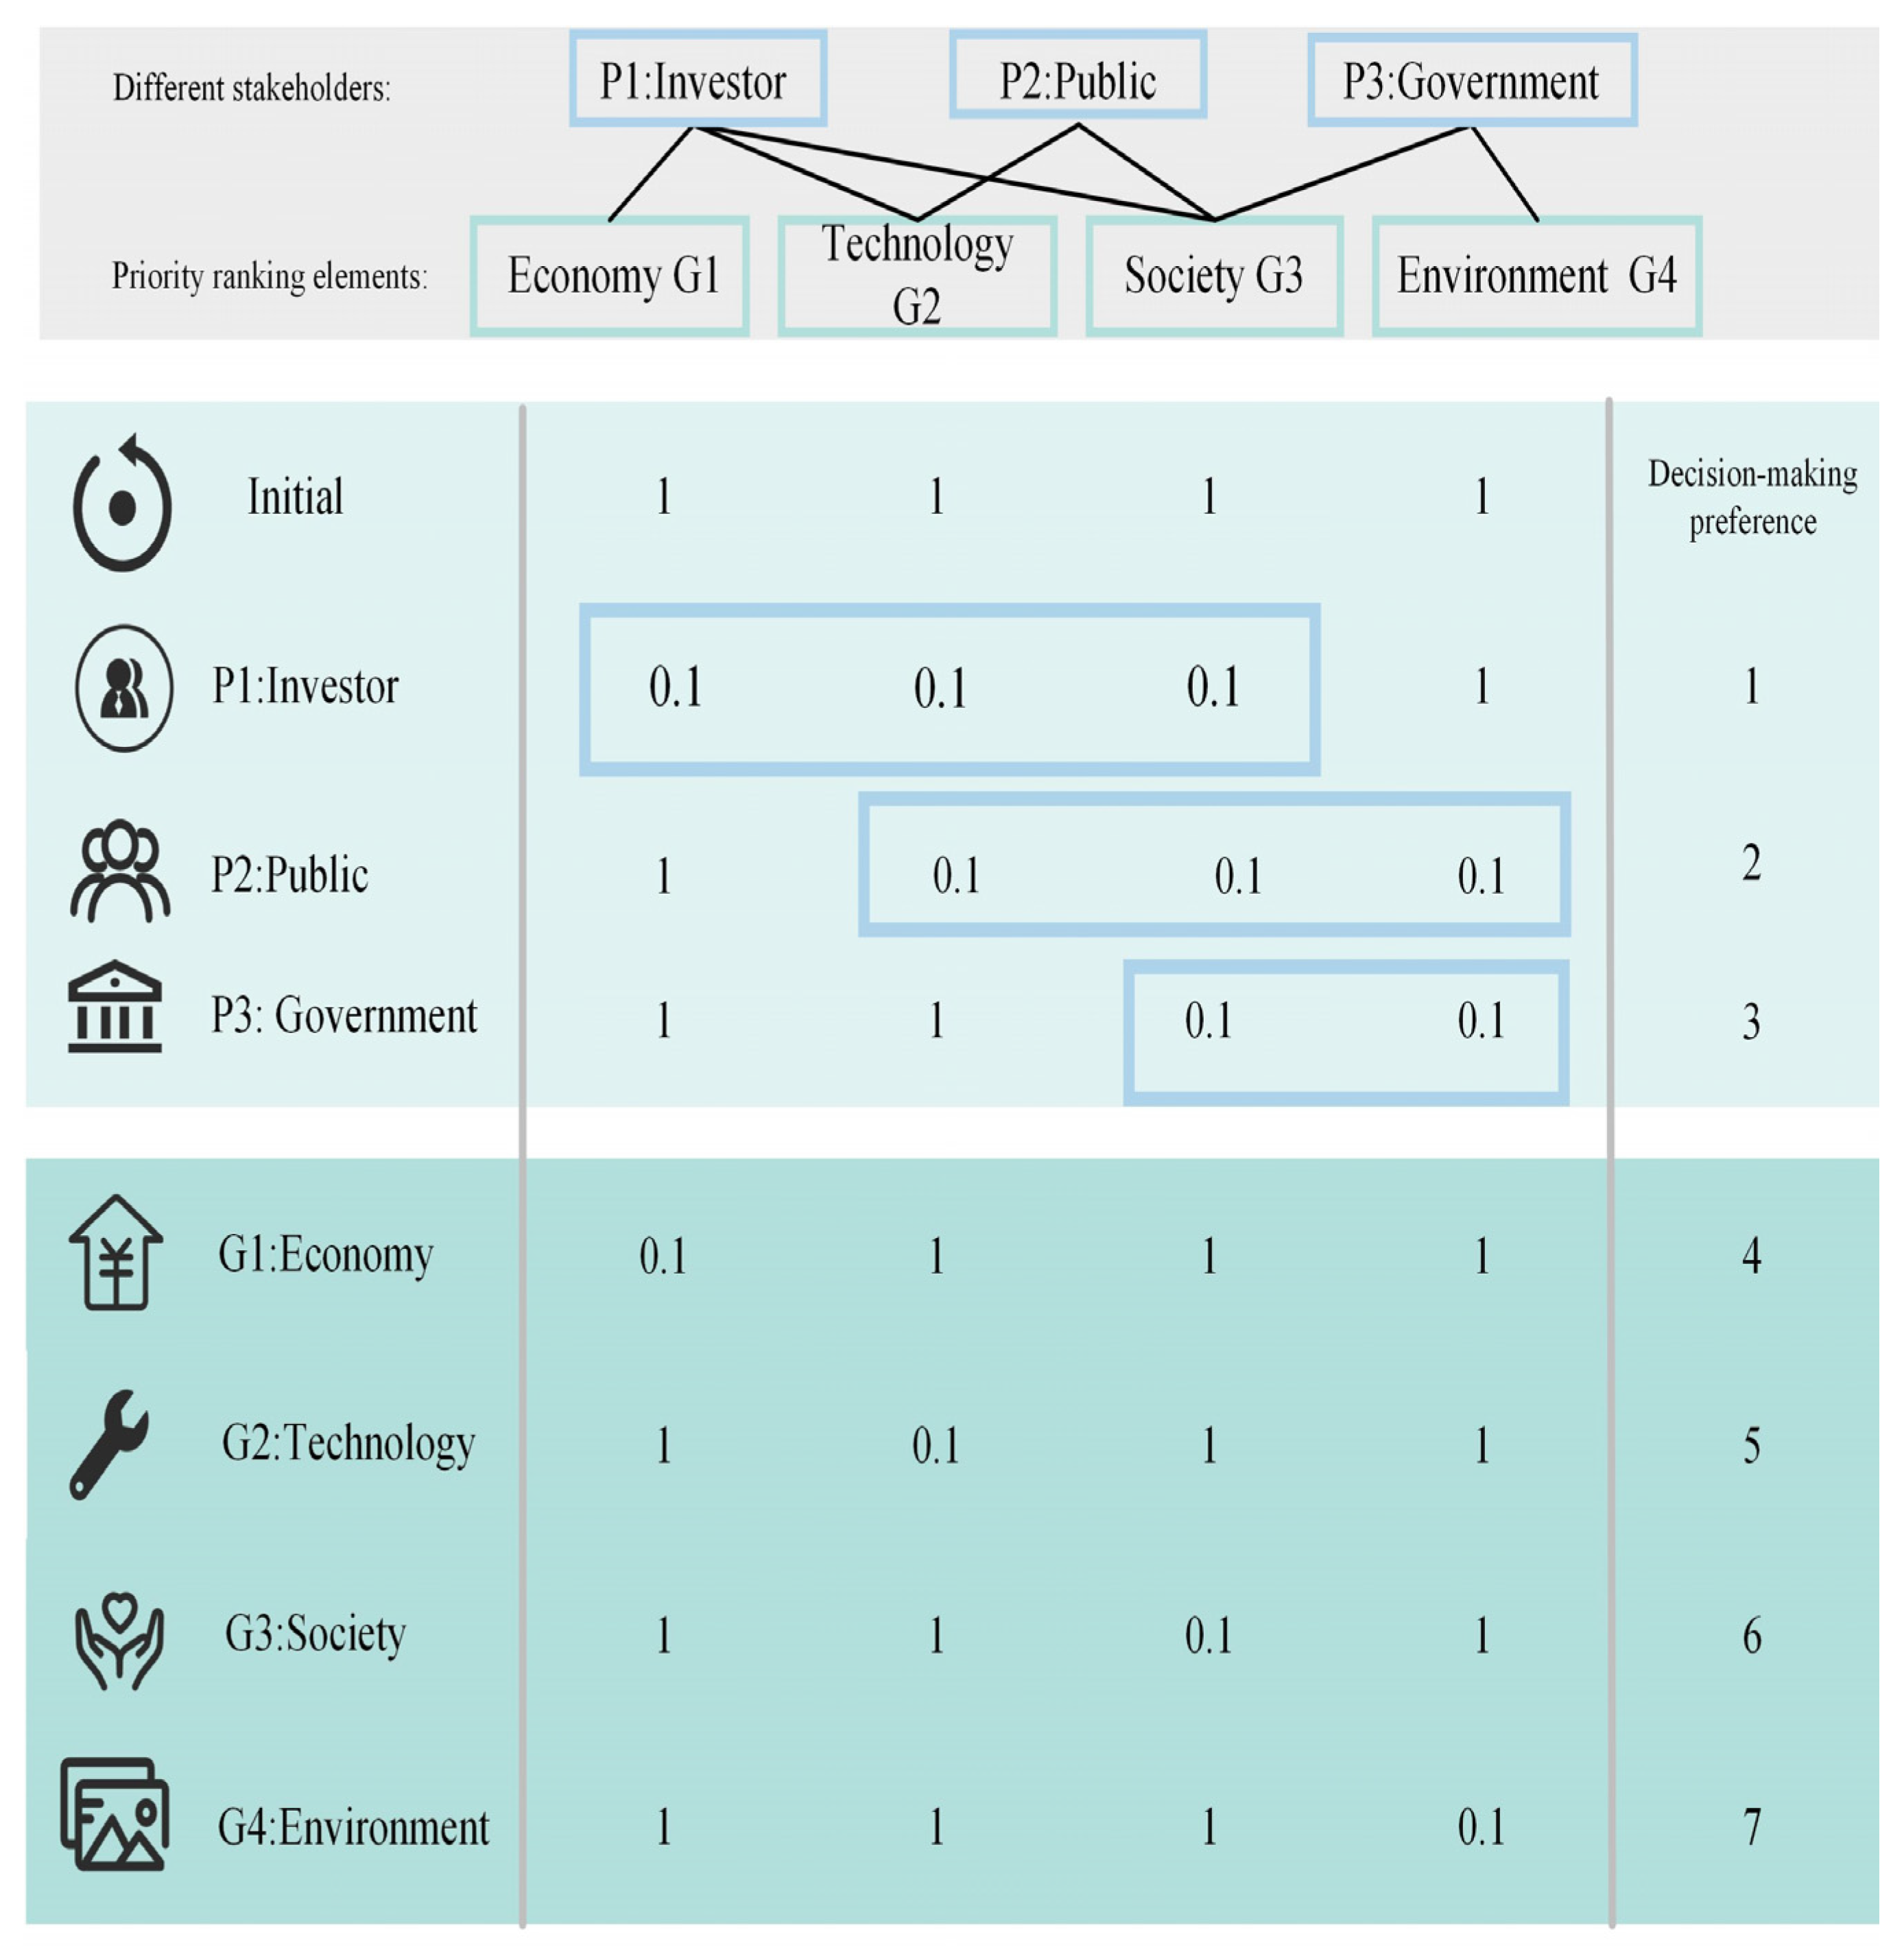
- This study sets different site selection decision preference scenarios for three different decision stakeholders and conducts decision scenario analyses considering different interest preferences. Moreover, this study sets four different decision preference scenarios based on priority ranking indicators.
- (5)
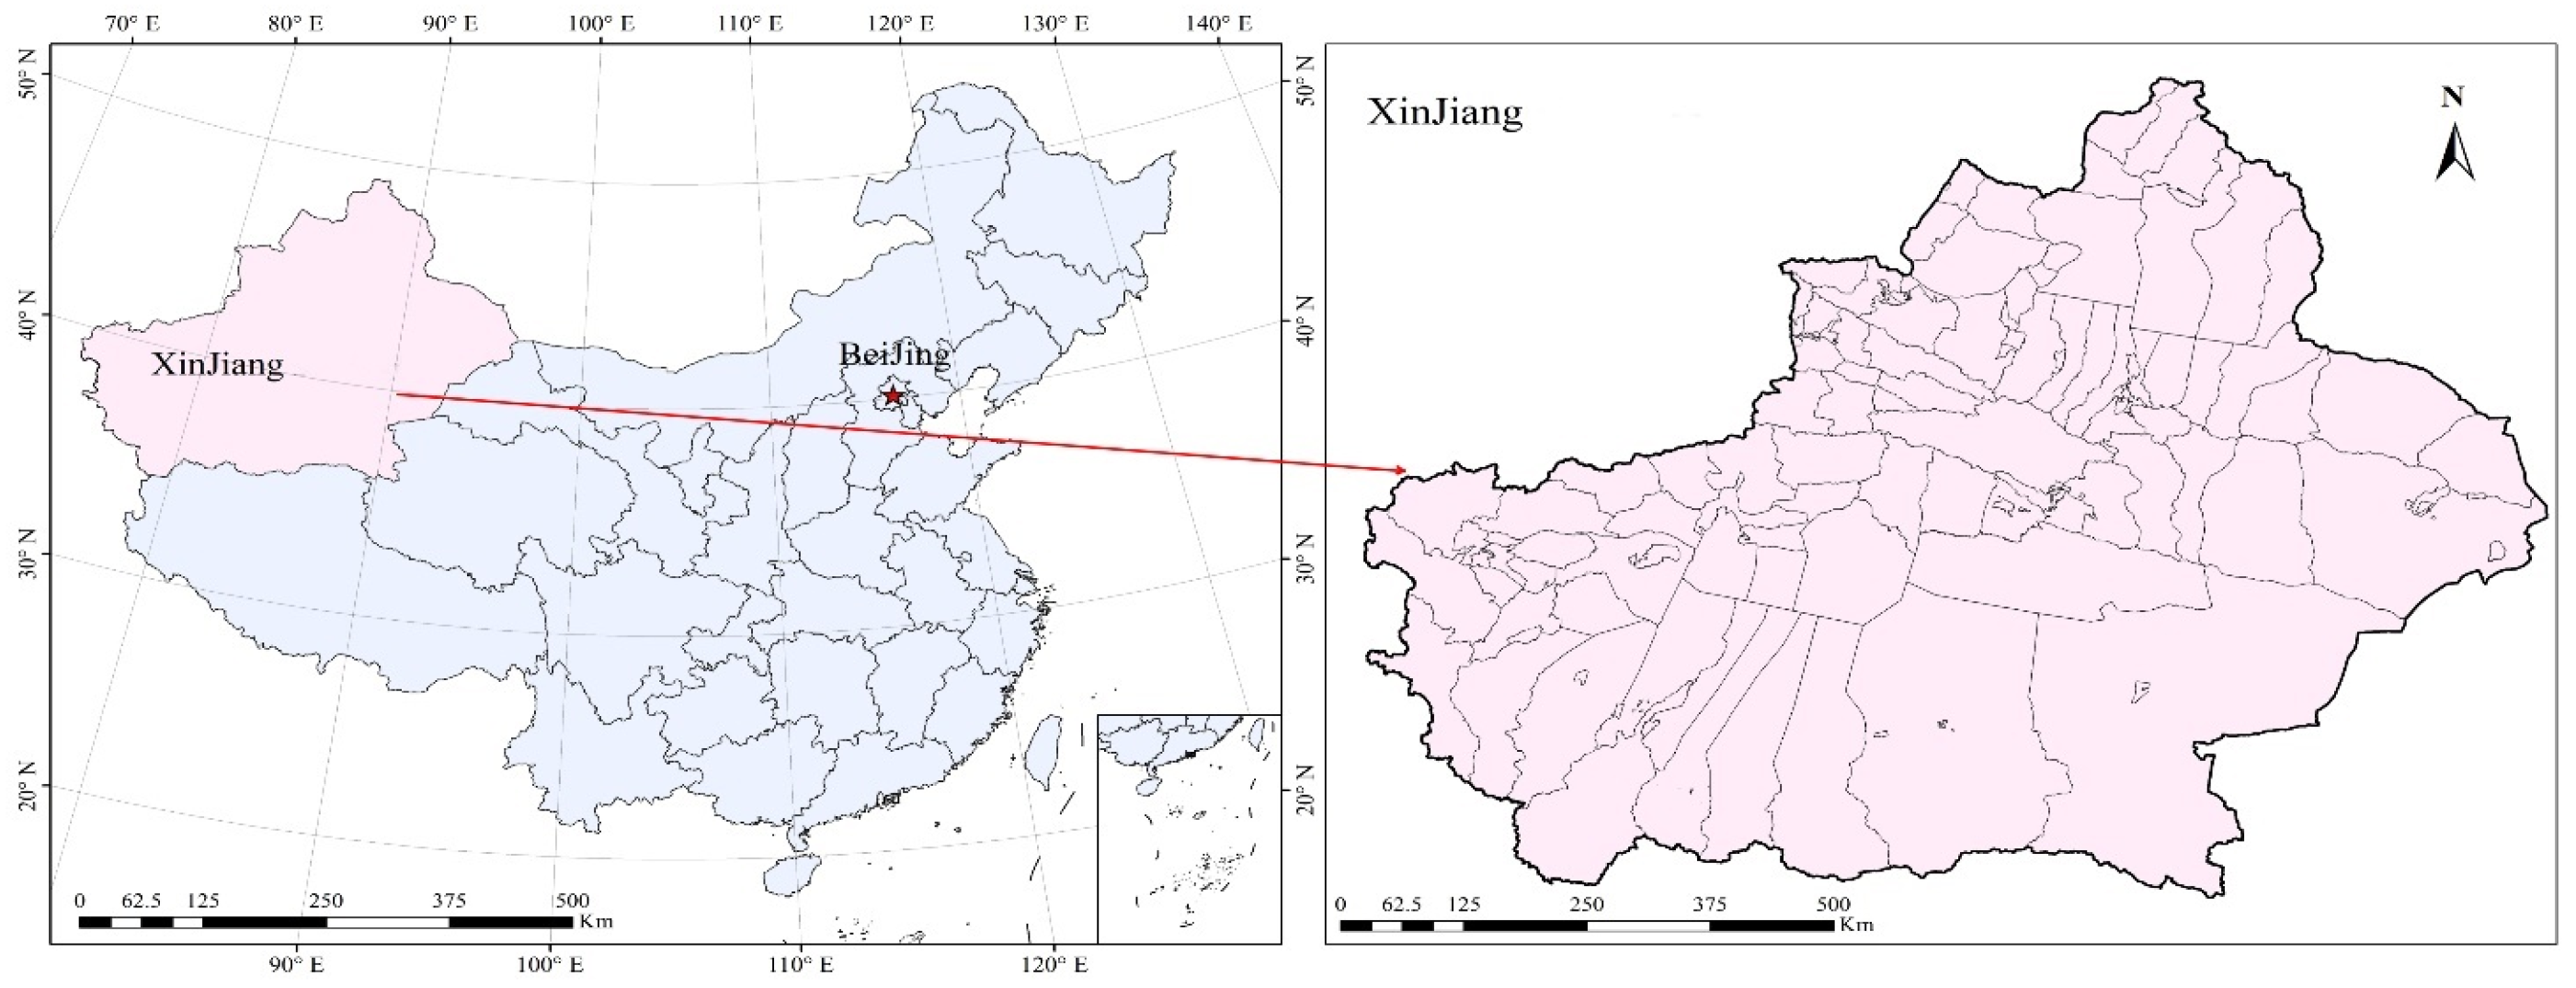
- This study uses the “Desert-Gobi-Wilderness” region of Xinjiang Province in China as the research object to carry out empirical analysis, provides a scientific and reasonable basis for the site selection decision process of the “PV +” multi-industry integration in the “Desert-Gobi-Wilderness” region, and conforms to the global trend of climate governance.
2. Site Selection Decision of “PV +” Multi-Industry Integration Region
2.1. “PV +” Multi-Industry Integration Site Decision Framework
2.2. Multiple-Source, Data-Driven Suitability Indicators and Ranking Indicators (Part I)
- (1)
- The equipment investment costs are defined as
- (2)
- The maintenance costs are defined as
- (1)
- The generating capacity is defined as
- (2)
- The carbon allowances results are as follows:
2.3. A Two-Stage Model of the Site Selection Decision Framework (Part 2)
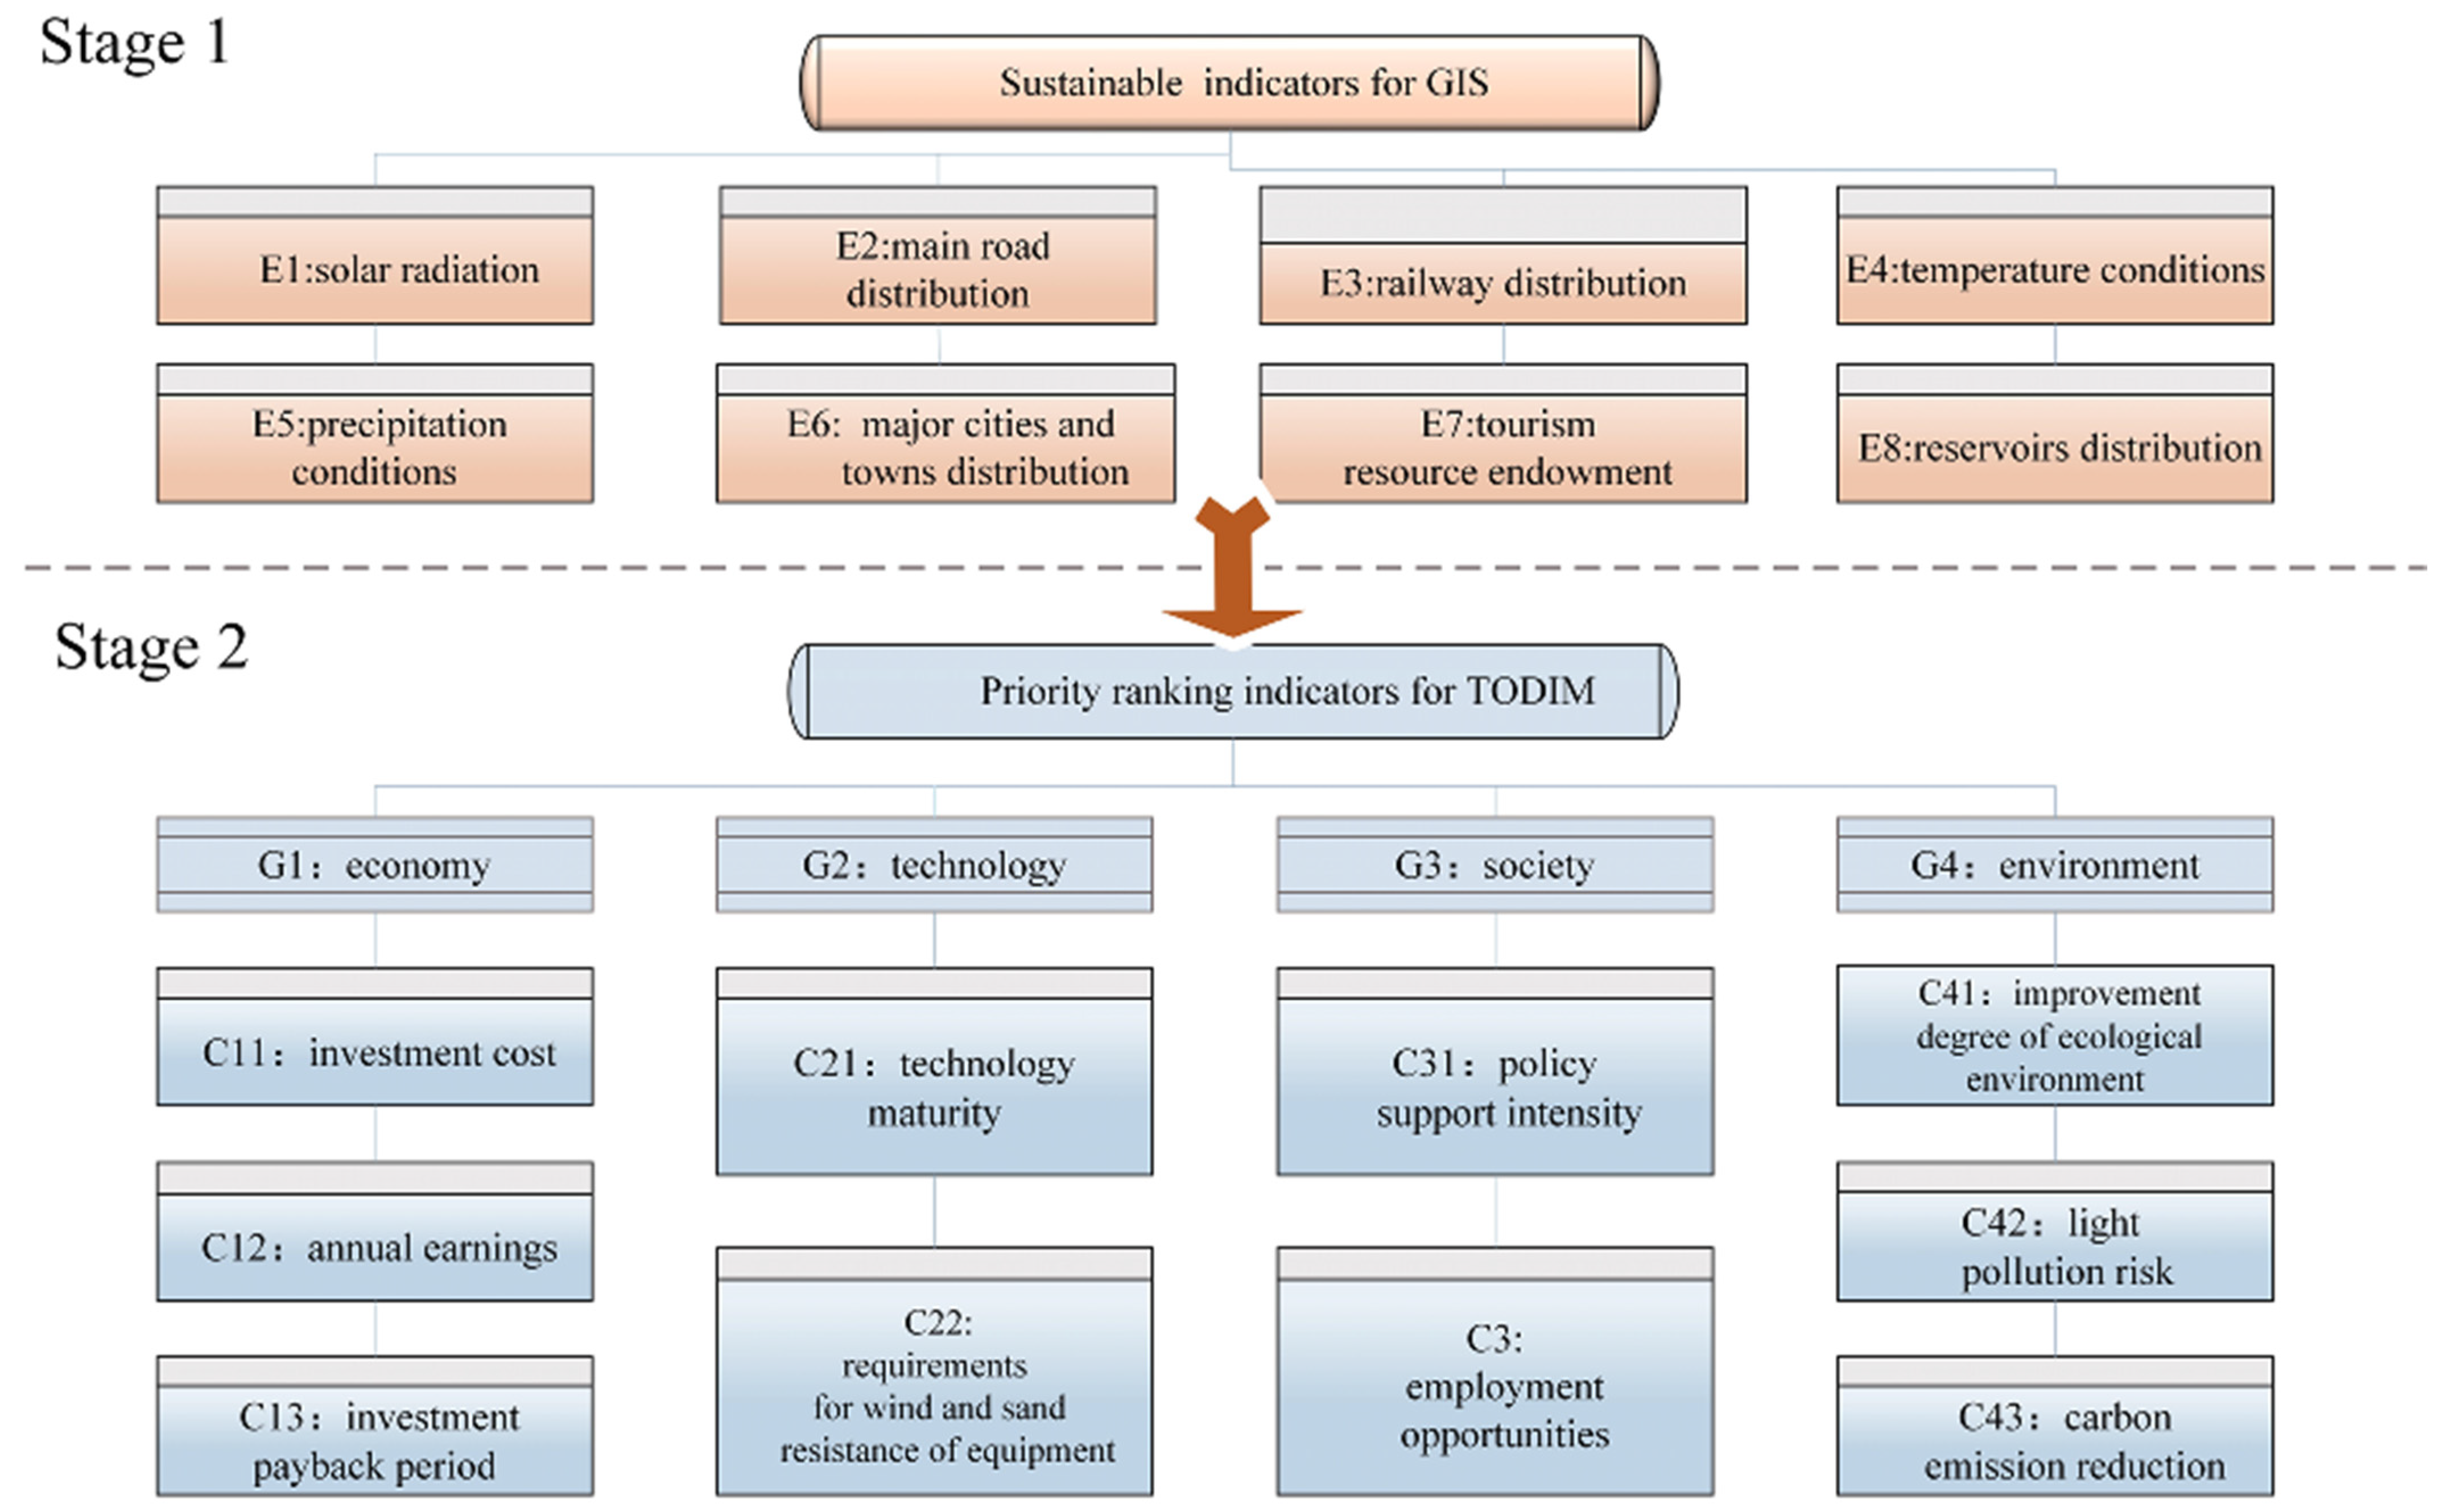
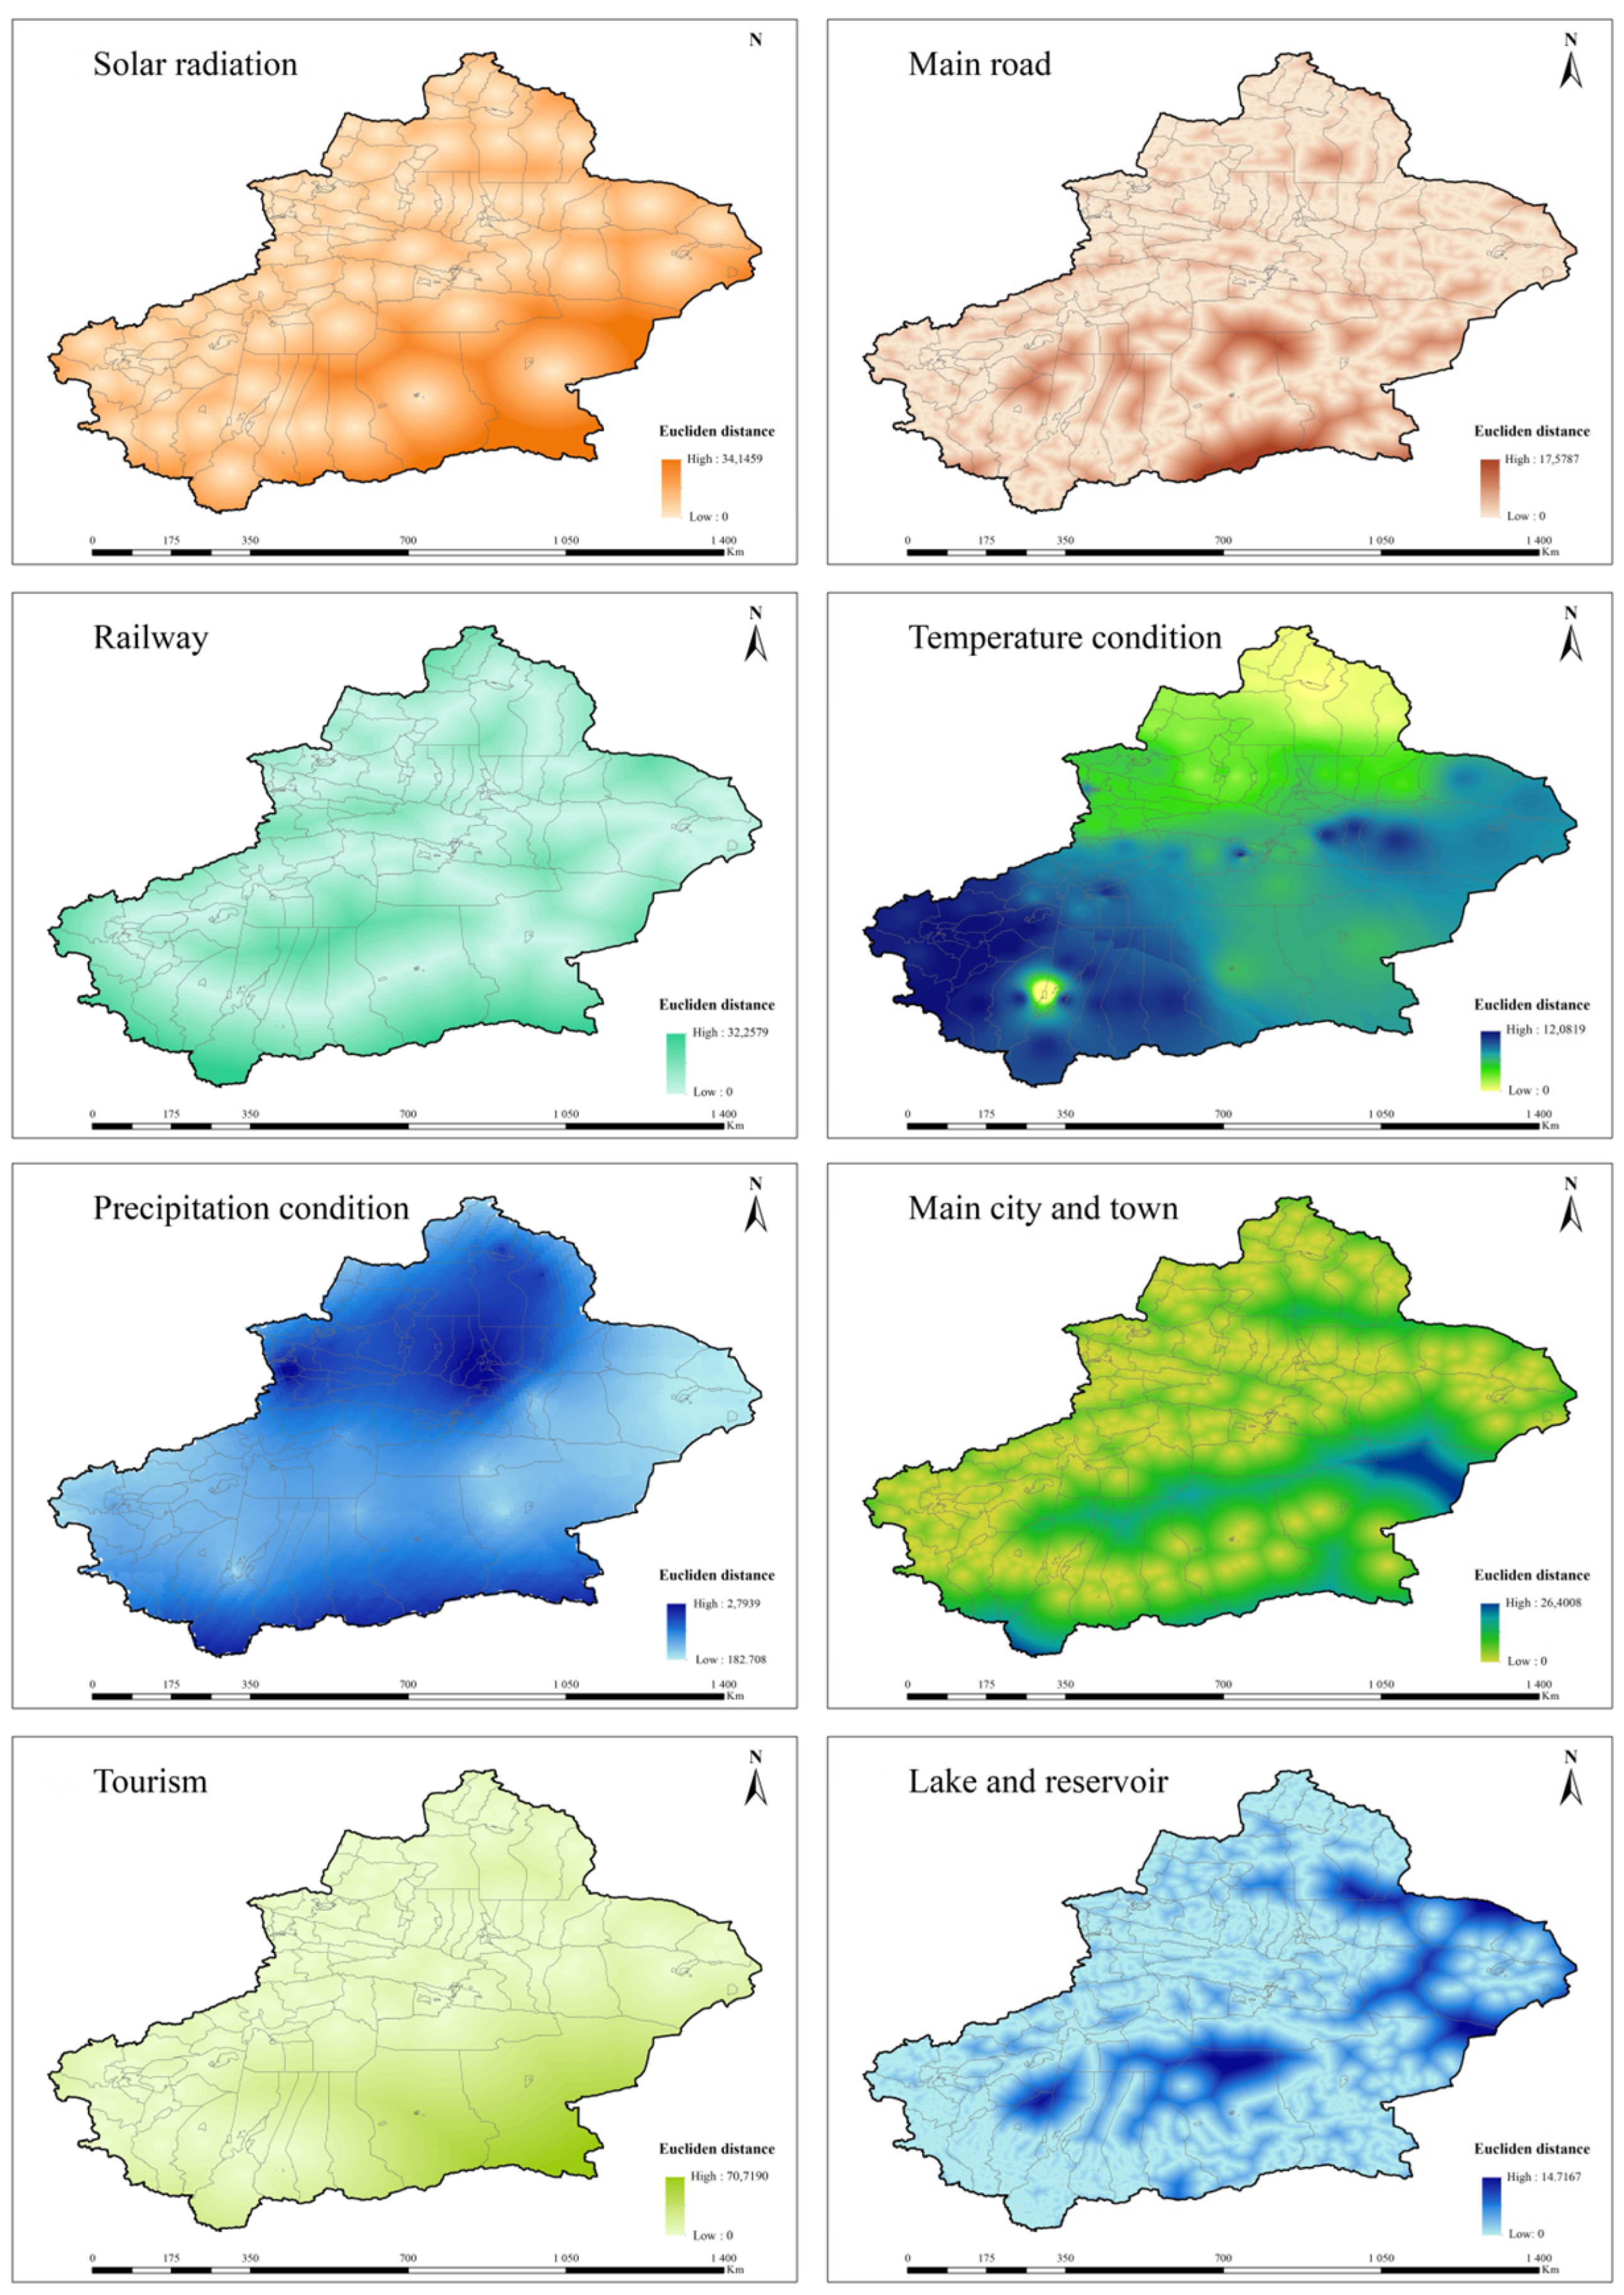
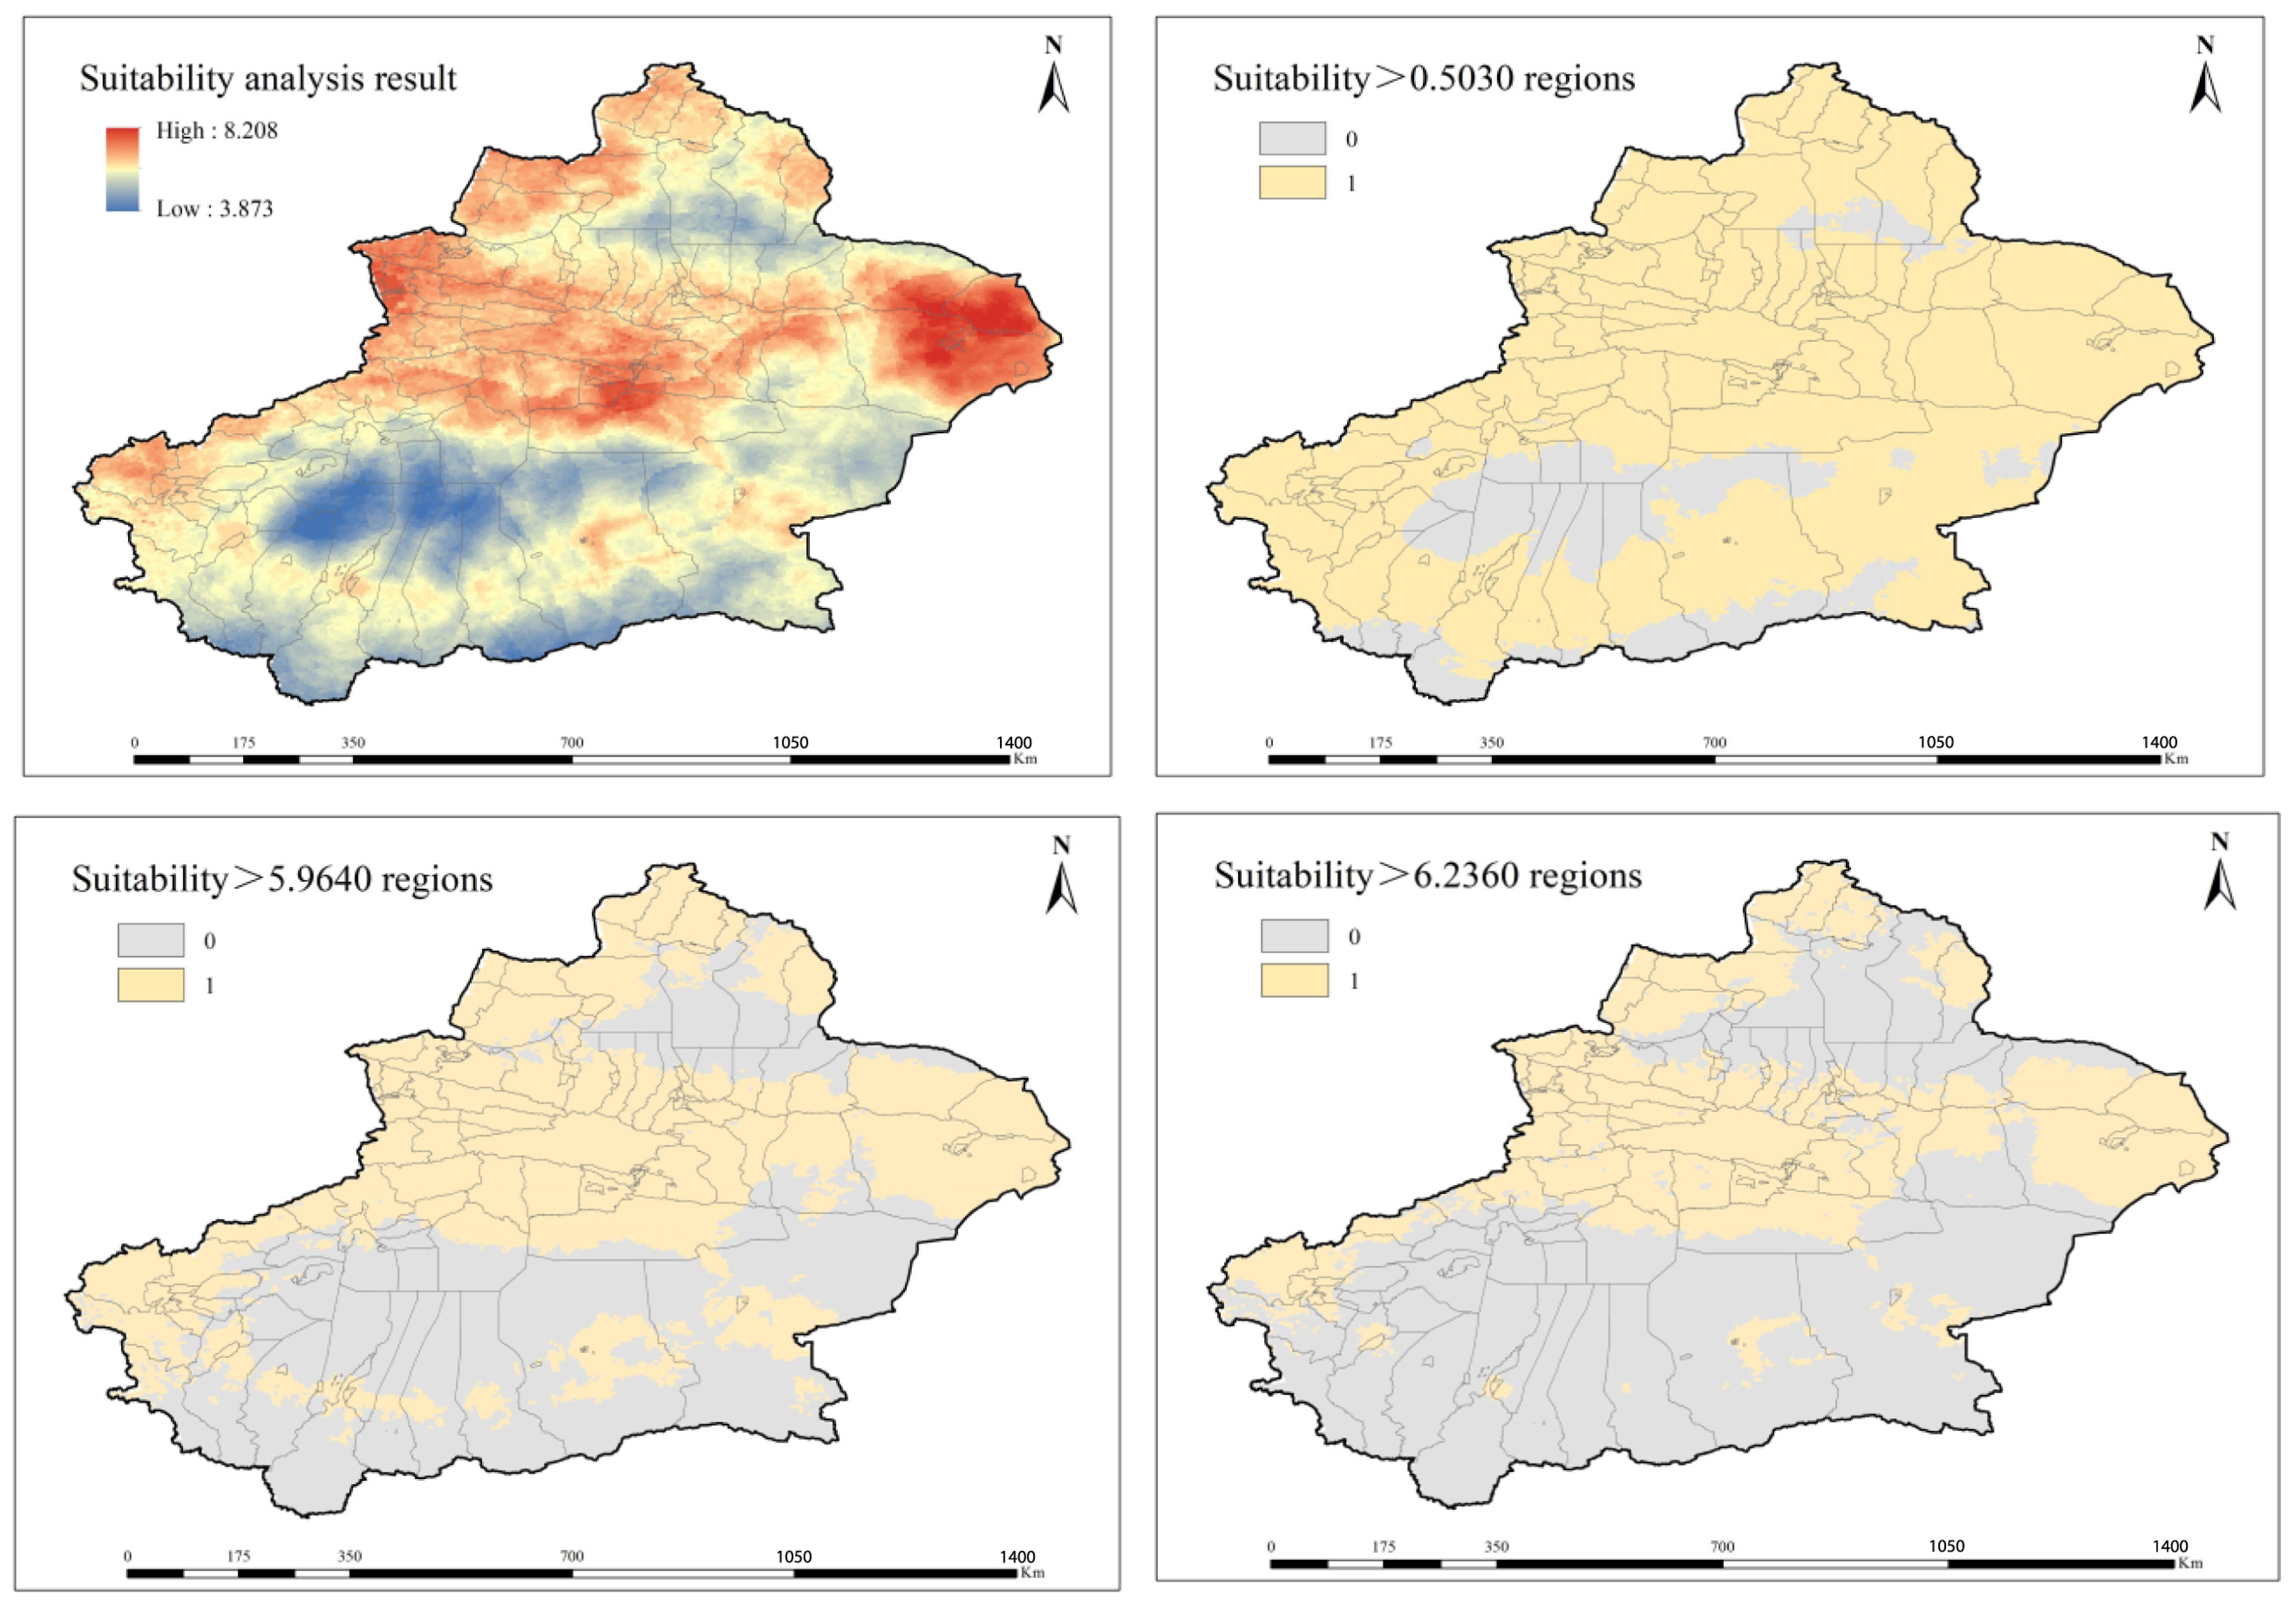
2.3.1. Stage 1: Suitability Assessment with the Help of the GIS by Inputting Suitability Indicators E1 to E8
- (1)
- The analysis dealt with different types of indicators, including then-dimensional space between P (x1, x2, …, xn) and Q (y1, y2, …, yn), where the Euclidean distance between them was calculated as follows:
- (2)
- This study used the reclassification process on the Euclidean distance layers obtained from the analysis. Based on the Jenks method, this study formed a discrete scoring system of 1–10 points. Higher scores for positive indicators indicate better conditions, and the reverse is true for negative indicators.
- (3)
- The BWM is a subjective weight assignment method based on the decision stakeholder’s preference. By identifying the best indicator and worst indicator in the site selection decision system of indicators, we constructed a two-by-two comparison matrix and used a mathematical optimization model to solve the weights of the indicators.
2.3.2. Stage 2: Prioritization of Alternative Regions for Potential Development Using the MCDM by Inputting Priority Ranking Indicators C11 to C43
- (1)
- Characterization and processing of qualitative indicators.
- (2)
- Formation of a standardized site selection decision matrix.
- (3)
- Calculation of combined weights of priority ranking indicators.
- (4)
- Use the TODIM for priority ranking in alternative regions by inputting priority ranking indicators C11 to C43.
2.4. Further Analysis and Discussion of the Results of Site Selection Decisions (Part 3)
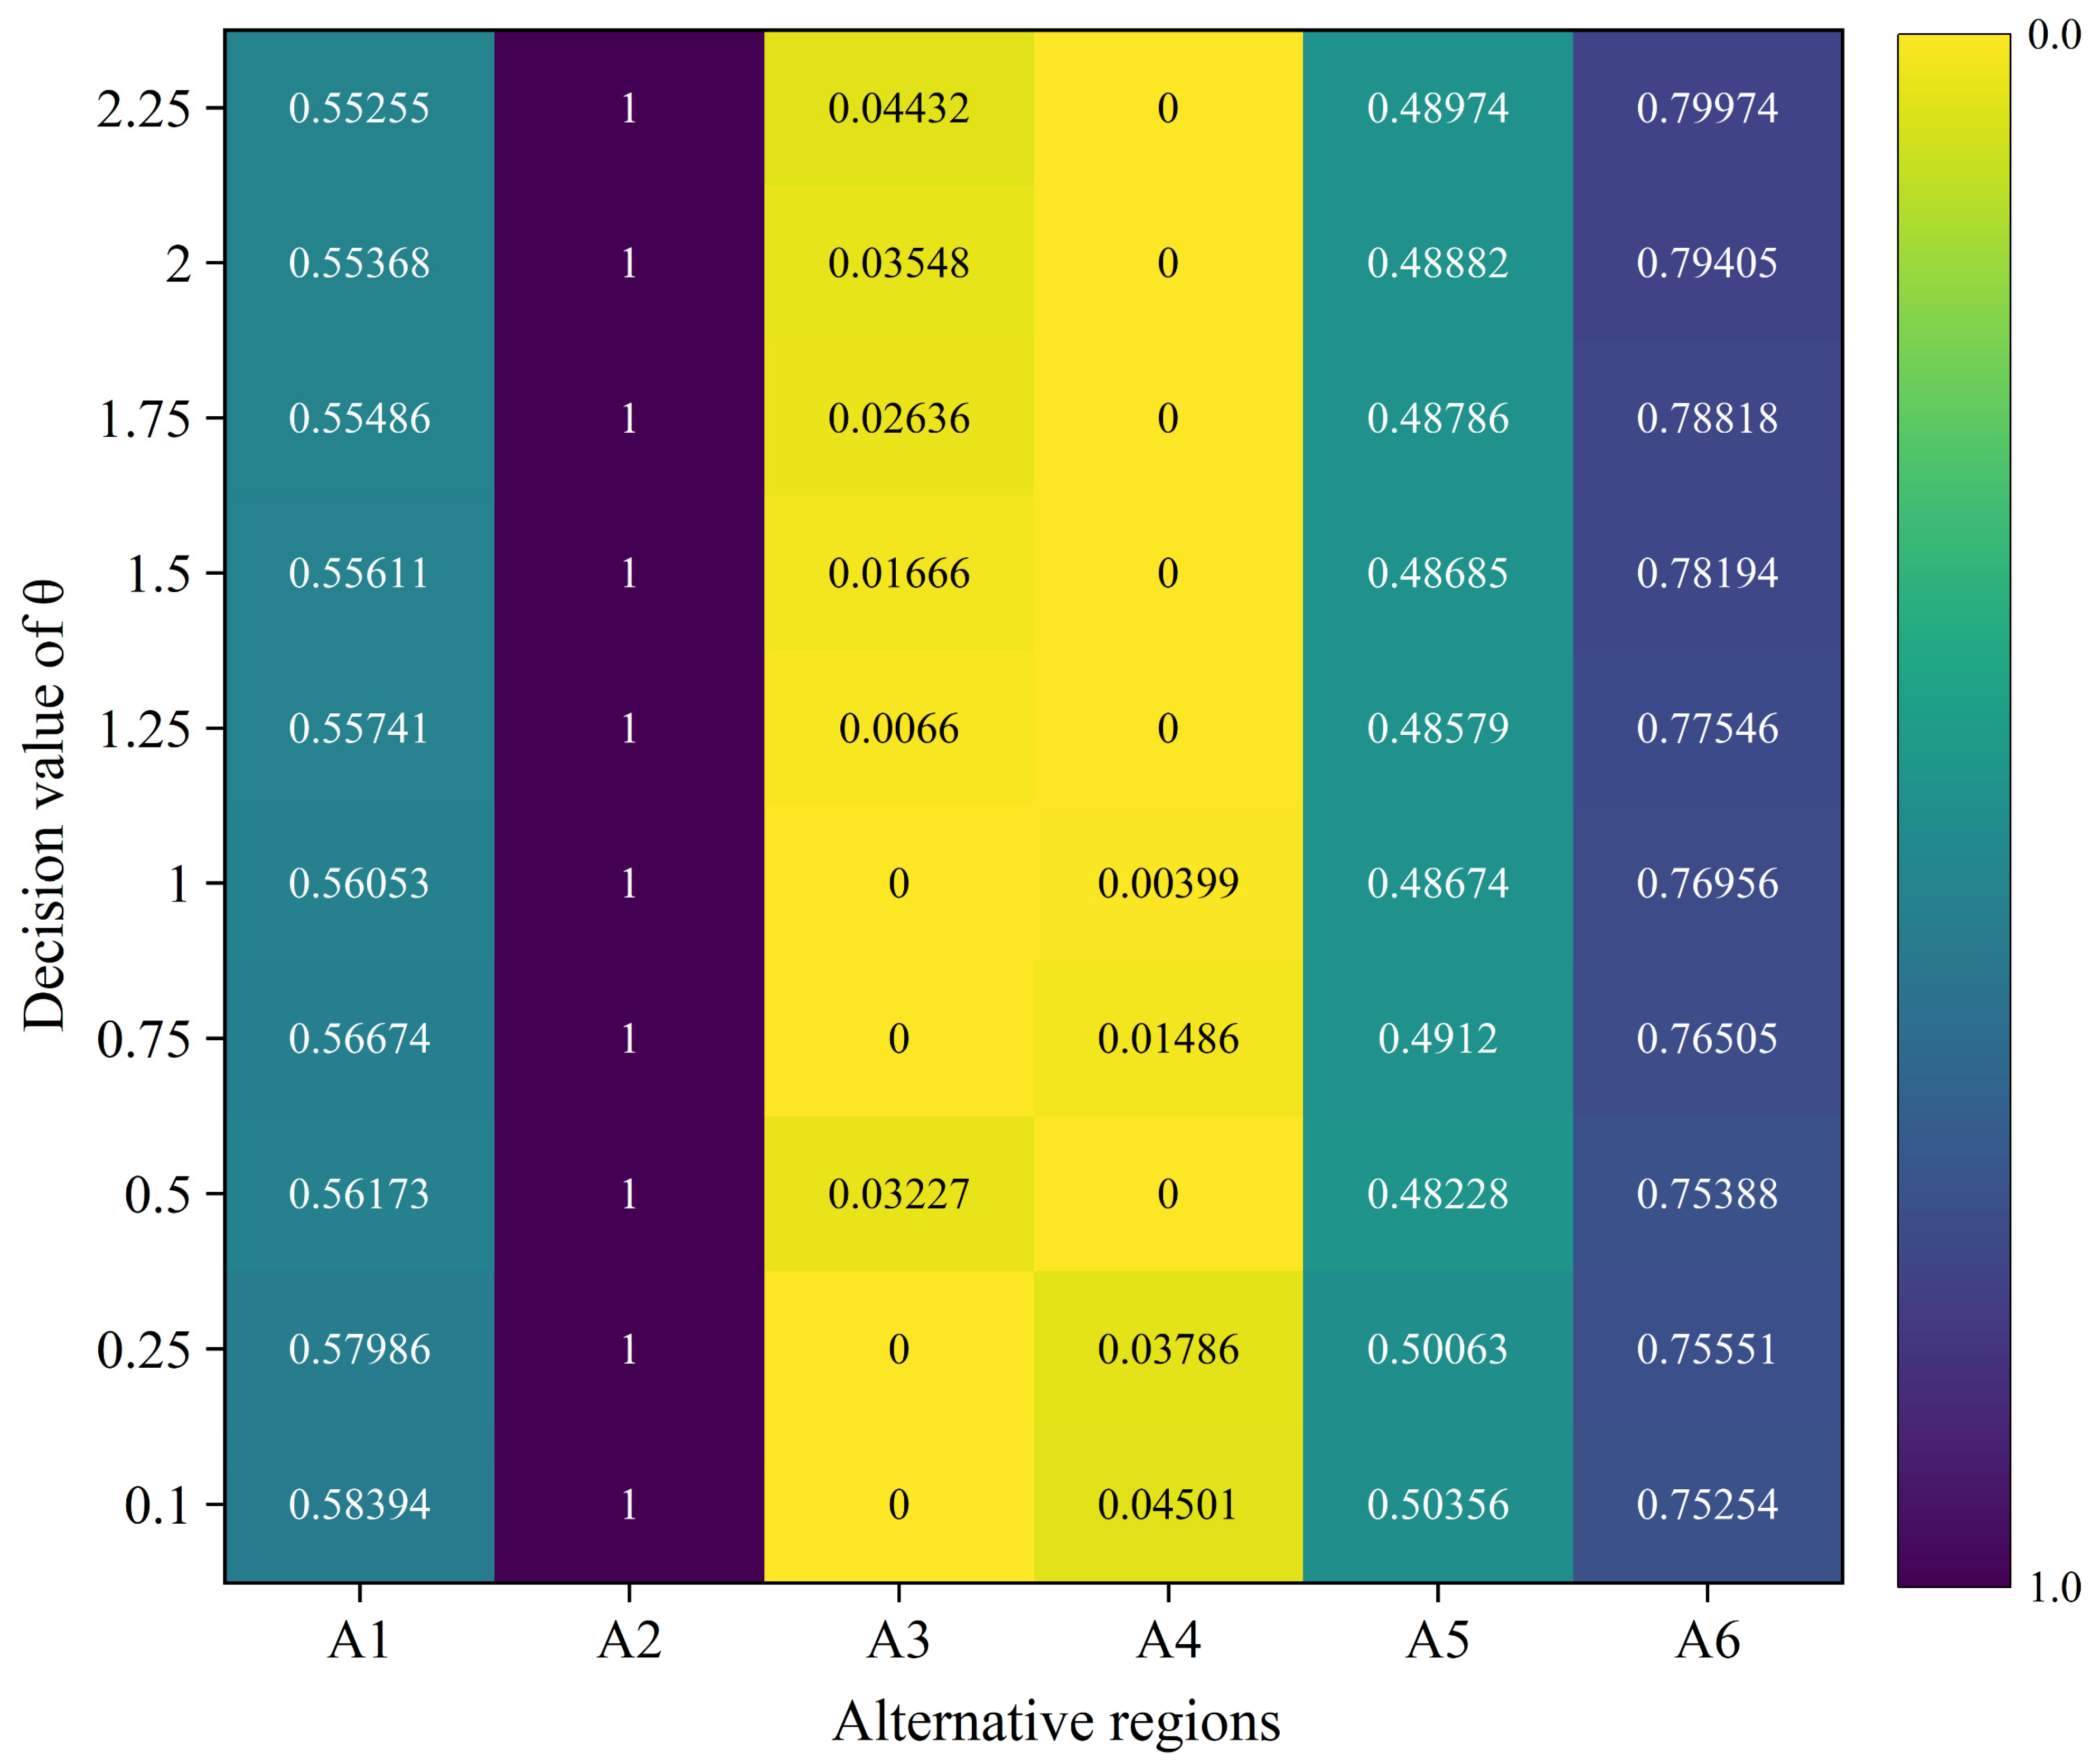
2.4.1. Dual Sensitivity Analysis
- (1)
- Sensitivity analysis of the recession coefficient θ.
- (2)
- Sensitivity analysis of indicators weight values.
2.4.2. Analysis of Decision-Making Preferences of Different Subjects
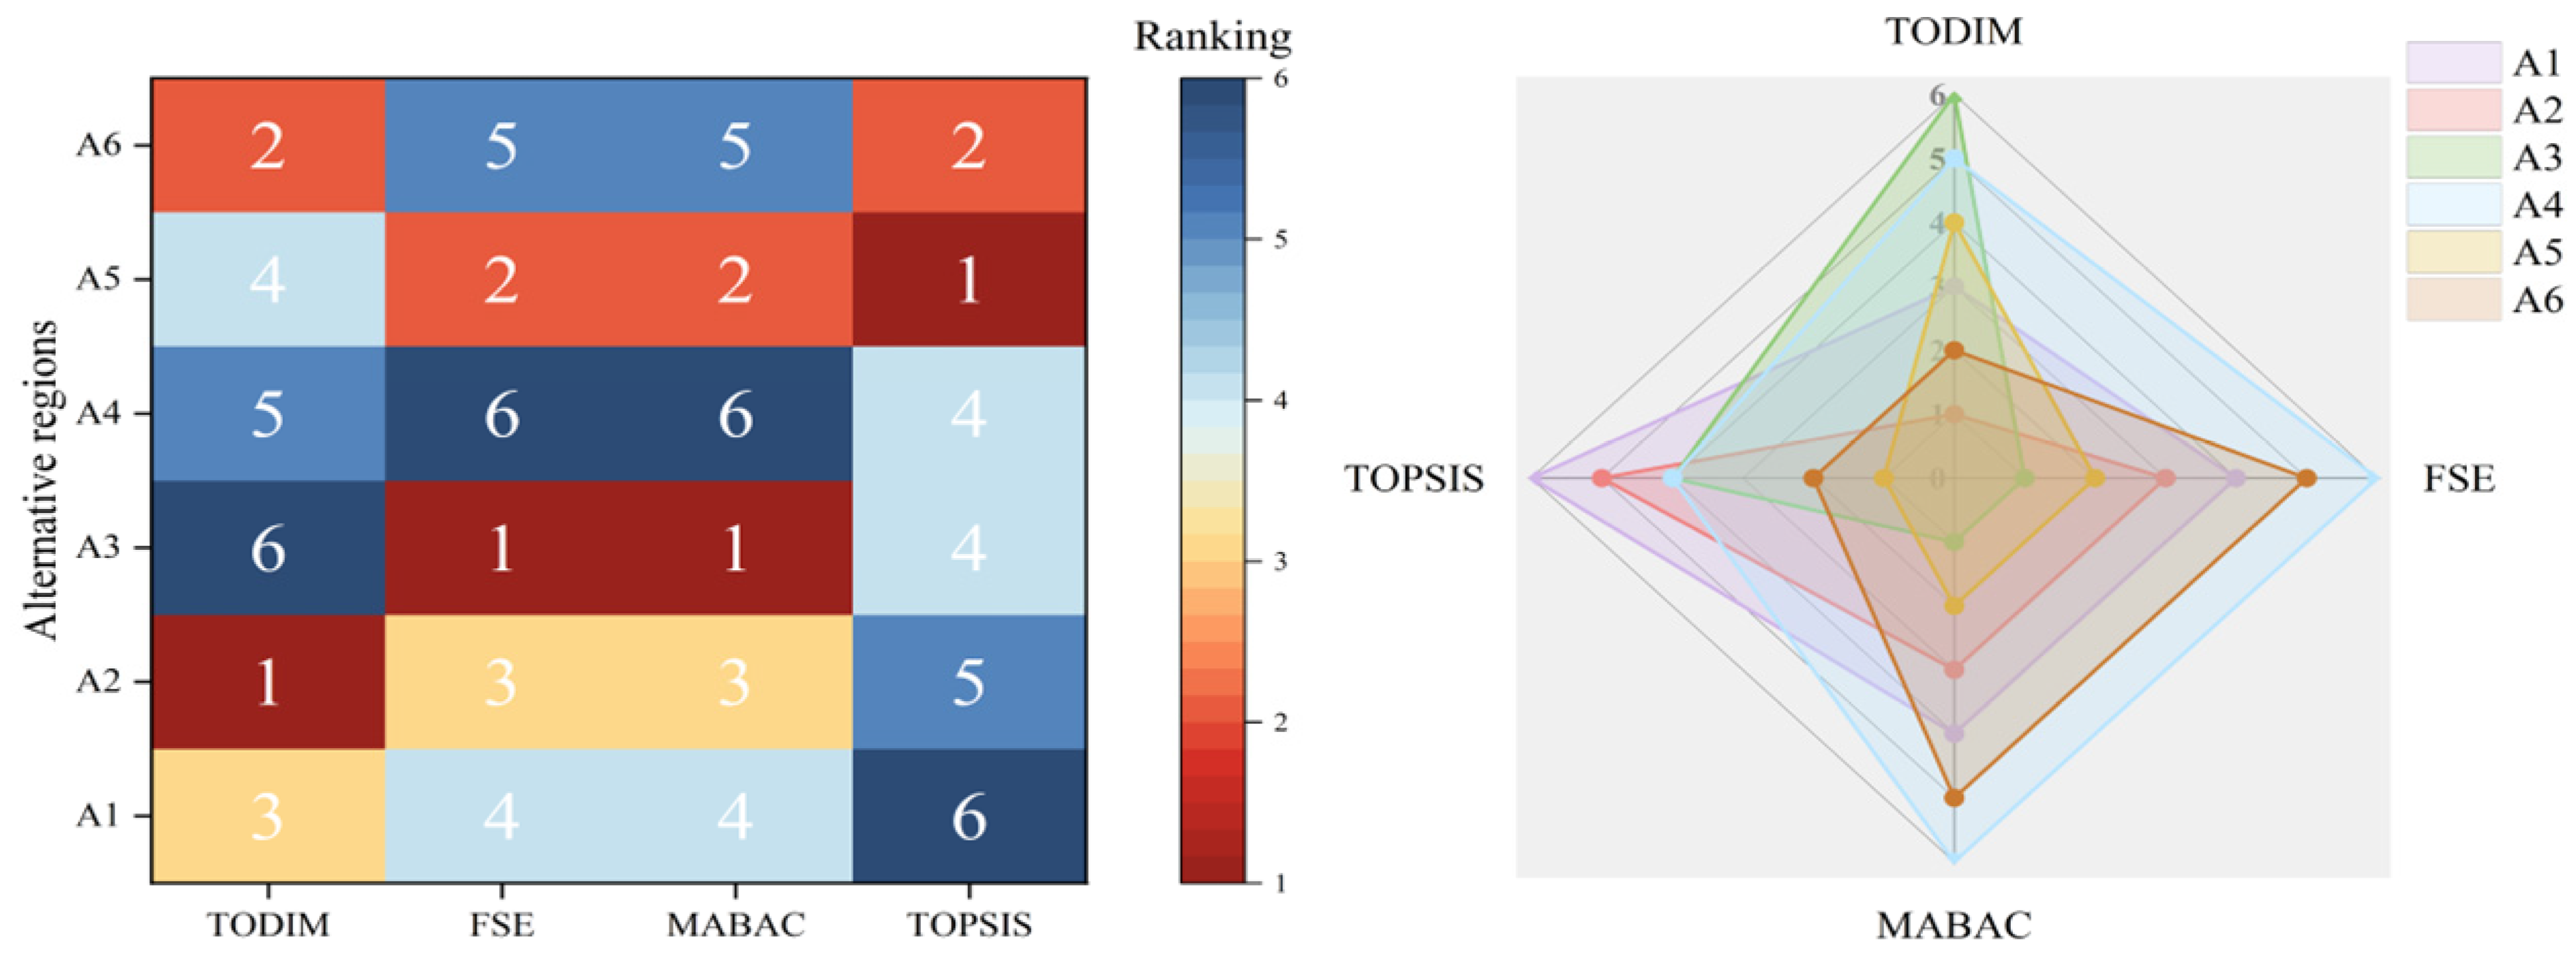
2.4.3. Comparative Analysis of the Results of Site Selection Decisions
3. Empirical Study
3.1. Study Context and Study Region
3.2. Analysis of Empirical Results
3.2.1. Results of the Suitability Assessment for “PV +” Multi-Industry Site Selection Decision
3.2.2. Priority Ranking of “PV +” Multi-Industry Integration Site Selection Decision
3.3. Further Analyses and Discussions
3.3.1. Sensitivity Analysis of the Results of Site Selection Decisions
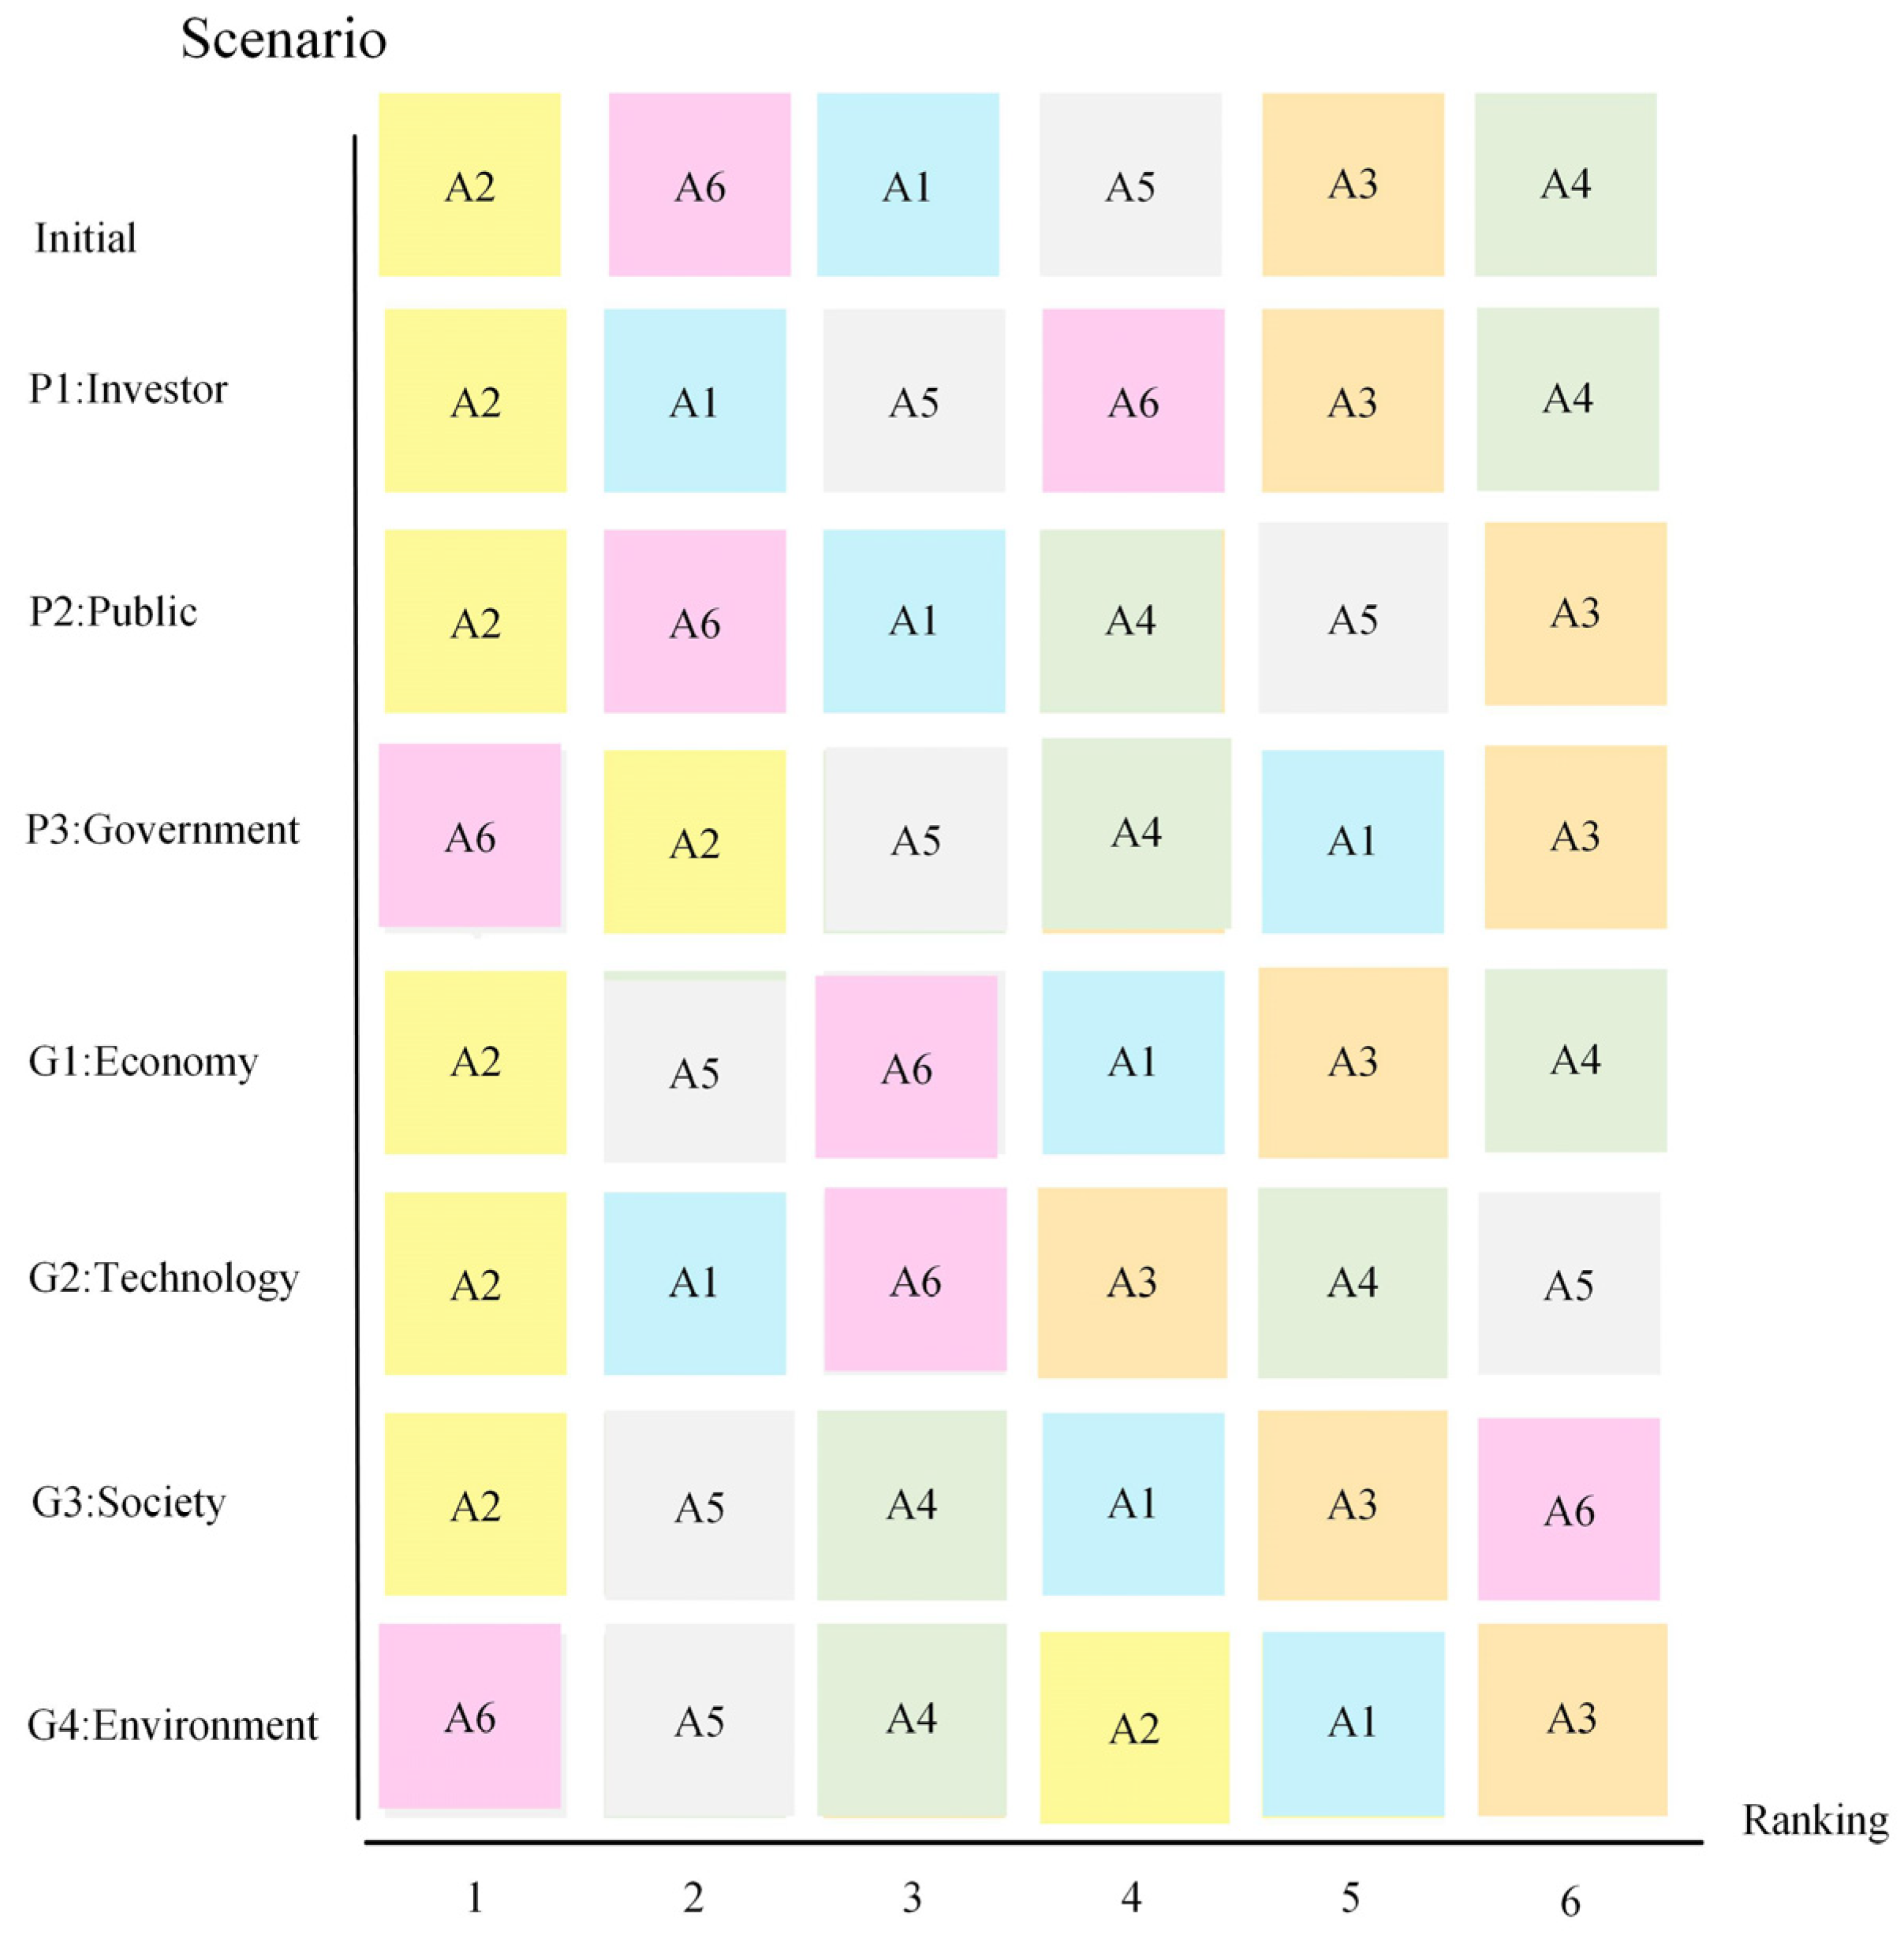
3.3.2. Scenario Analysis Results
3.3.3. Comparative Analysis Results
3.3.4. Theoretical Advantages and Empirical Comparison of TODIM Methods in Dynamic Preference Scenarios
4. Conclusions and Outlook
Author Contributions
Funding
Data Availability Statement
Conflicts of Interest
Nomenclature
| Abbreviations | cj | Total conflict | |
| AHP | Analytical hierarchy process | cW | The worst indicator |
| BWM | Best–Worst method | ppv | Generating capacity |
| CRITIC | Criteria importance through inter-criteria correlation | pp | Static payback periods |
| CER | Certified emission reduction | wB | The weight of the relatively best indicators |
| DNI | Direct normal irradiance | wj | The weight of other indicators |
| FSE | Fuzzy synthetic evaluation | ww | The weight of the relatively worst indicators |
| GIS | Geographic information system | wsj | The subjective weight |
| HFLTS | Hesitant fuzzy linguistic term set | woj | The objective weight |
| MABAC | Multi-attribute border approximation area | wjr | The relative weight |
| TFN | Triangular fuzzy number | wr | The largest indicator’s weight value |
| TOPSIS | Technique for order preference by similarity to ideal solution | α | The adjustable coefficient indicators |
| PV | Photovoltaic | β | The adjustable coefficient indicators |
| MCDM | Multi-criteria decision making | aBj | The indicators other than the relative best indicators |
| TODIM | Tomada de Decisão Interativa e Multicritério | ajw | The indicators other than the relative worst indicators |
| Parameters | ξi | Standard deviation | |
| Cαep | Equipment investment costs | θ | Recession coefficient |
| Com | Maintenance costs | σj | The intensity of contrast between indicators |
| cB | The best indicator | δj(Ai,Ak) | The degree of overall advantage |
| Φj(Ai,Ak) | The degree of relative advantage | ||
References
- Judd, E.J.; Tierney, J.E.; Lunt, D.J.; Montañez, I.P.; Huber, B.T.; Wing, S.L.; Valdes, P.J. A 485-million-year history of Earth’s surface temperature. Science 2024, 385, 6175. [Google Scholar] [CrossRef]
- Bayo-Besteiro, S.; de la Torre, L.; Costoya, X.; Gómez-Gesteira, M.; Pérez-Alarcón, A.; deCastro, M.; Añel, J.A. Photovoltaic power resource at the atacama desert under climate change. Renew. Energy 2023, 216, 118999. [Google Scholar] [CrossRef]
- Meng, R.; Meng, Z.; Ren, X.; Cai, J.; Tong, X. Positive impacts of typical desert photovoltaic scenarios in China on the growth and physiology of sand-adapted plants. Front. Plant Sci. 2025, 15, 1515896. [Google Scholar] [CrossRef]
- Schwarz, R.; Ziv, Y. Shedding light on biodiversity: Reviewing existing knowledge and exploring hypothesised impacts of agrophotovoltaics. Biol. Rev. 2024, 100, 855–870. [Google Scholar] [CrossRef]
- Zhang, Y.; Sun, H.; Tan, J.; Li, Z.; Hou, W.; Guo, Y. Capacity configuration optimization of multi-energy system integrating wind turbine/photovoltaic/hydrogen/battery. Energy 2022, 252, 124046. [Google Scholar] [CrossRef]
- Olivares, D.; Marzo, A.; Taquichiri, A.; Espinoza, R.; Henriquez, M.; Portillo, C.; Ferrada, P.; Conde, L.A.; Fuentealba, E.; del Campo, V. Impact of thermoelectric coal-fired power plant emissions on the soiling mechanisms of nearby photovoltaic power plants in the atacama desert. Renew. Energy 2025, 244, 122684. [Google Scholar] [CrossRef]
- Rodriguez-Pastor, D.A.; Ildefonso-Sanchez, A.F.; Soltero, V.M.; Peralta, M.E.; Chacartegui, R. A new predictive model for the design and evaluation of bifacial photovoltaic plants under the influence of vegetation soils. J. Clean. Prod. 2022, 385, 135701. [Google Scholar] [CrossRef]
- von Rüden, L.; Satola, B.; Reininghaus, N.; Kröner, M.; Vehse, M.; Dyck, A.; Agert, C. GIS-based technical analysis of the local renewable energy production potentials of farms in Germany. Renew. Sustain. Energy Rev. 2025, 212, 115412. [Google Scholar] [CrossRef]
- Liu, B.; Huo, X. Prediction of photovoltaic power generation and analyzing of carbon emission reduction capacity in China. Renew. Energy 2024, 222, 119967. [Google Scholar] [CrossRef]
- Chen, H.; Wu, W.; Li, C.; Lu, G.; Ye, D.; Ma, C.; Ren, L.; Li, G. Temporal variations and driving mechanisms of carbon and water fluxes in desert photovoltaic ecosystems. Renew. Energy 2025, 242, 122484. [Google Scholar] [CrossRef]
- Adothu, B.; Kumar, S.; John, J.J.; Oreski, G.; Mathiak, G.; Jäckel, B.; Alberts, V.; Jahangir, J.B.; Alam, M.A.; Gottschalg, R. Comprehensive review on performance, reliability, and roadmap of c-Si PV modules in desert climates: A proposal for improved testing standard. Prog. Photovolt. 2024, 32, 495–527. [Google Scholar] [CrossRef]
- Ramadhani, U.H.; Ramdhania, L.N.; Iskandar, H.; Fudholi, A.; Abimanyu, H. Review of solar thermal technologies in sustainable animal agriculture farms: Current and potential uses. Sol. Energy 2025, 291, 113374. [Google Scholar] [CrossRef]
- Martins, F.; Sitchinava, T.; Keryan, T.; Mitrofanenko, A.; Stefanelli, N.; Guigoz, Y. Sustainable tourism and SDGs in the south caucasus. Sustain. Dev. 2025. [Google Scholar] [CrossRef]
- Knapp, A.K.; Sturchio, M.A. Ecovoltaics in an increasingly water-limited world: An ecological perspective. One Earth 2024, 7, 1705–1712. [Google Scholar] [CrossRef]
- Shriki, N.; Rabinovici, R.; Yahav, K.; Rubin, O. Prioritizing suitable locations for national-scale solar PV installations: Israel’s site suitability analysis as a case study. Renew. Energy 2023, 205, 105–124. [Google Scholar] [CrossRef]
- Kaya, Ö.; Alemdar, K.D.; Çodur, M.Y. A novel two stage approach for electric taxis charging station site selection. Sustain. Cities Soc. 2020, 62, 102396. [Google Scholar] [CrossRef]
- Feyzi, S.; Khanmohammadi, M.; Abedinzadeh, N.; Aalipour, M. Multi- criteria decision analysis FANP based on GIS for siting municipal solid waste incineration power plant in the north of Iran. Sustain. Cities Soc. 2019, 47, 101513. [Google Scholar] [CrossRef]
- Elomiya, A.; Křupka, J.; Jovčić, S.; Simic, V.; Švadlenka, L.; Pamucar, D. A hybrid suitability mapping model integrating GIS, machine learning, and multi-criteria decision analytics for optimizing service quality of electric vehicle charging stations. Sustain. Cities Soc. 2024, 106, 105397. [Google Scholar] [CrossRef]
- Li, Z.; Tian, G.; El-Shafay, A.S. Statistical-analytical study on world development trend in offshore wind energy production capacity focusing on great britain with the aim of MCDA based offshore wind farm siting. J. Clean. Prod. 2022, 363, 132326. [Google Scholar] [CrossRef]
- Ma, C.; Zhang, Y.; Yi, S.; Lu, Y. Optimizing urban agricultural waste planning and management to enhance sustainability: Strategies for three types of cities. Sustain. Cities Soc. 2025, 120, 106168. [Google Scholar] [CrossRef]
- Zorrilla-Muñoz, V.; Moyano, D.L.; Marcos Carvajal, C.; Agulló-Tomás, M.S. Towards equitable representations of ageing: Evaluation of gender, territories, aids and artificial intelligence. Land 2024, 13, 1304. [Google Scholar] [CrossRef]
- Dargahi, F.; Shamloo, J.I. Investigating the realization of spatial justice based on multi-criteria decision-making methods in a metropolis in northwest Iran. Sustain. Cities Soc. 2023, 99, 104986. [Google Scholar] [CrossRef]
- Li, X.; Xu, X.; Yin, R.M. Spatial optimization of agricultural production from the perspective of “greater food concept” in yangzhou, china. Ecol. Indic. 2024, 169, 112805. [Google Scholar] [CrossRef]
- Zhao, Y.; Jiang, N.; He, Y.; Deng, X. Entropy measures of multigranular unbalanced hesitant fuzzy linguistic term sets for multiple criteria decision making. Inf. Sci. 2024, 686, 121346. [Google Scholar] [CrossRef]
- Dang, K.B.; Windhorst, W.; Burkhard, B.; Müller, F. A bayesian belief network–based approach to link ecosystem functions with rice provisioning ecosystem services. Ecol. Indic. 2018, 100, 30–44. [Google Scholar] [CrossRef]
- Ouchani, F.; Jbaihi, O.; Maaroufi, M.; Ghennioui, A. Identification of suitable sites for large-scale photovoltaic installations through a geographic information system and analytical hierarchy process combination: A case study in marrakesh-safi region, morocco. Prog. Photovolt. 2020, 29, 714–724. [Google Scholar] [CrossRef]
- Giamalaki, M.; Tsoutsos, T. Sustainable siting of solar power installations in Mediterranean using a GIS/AHP approach. Renew. Energy 2019, 141, 64–75. [Google Scholar] [CrossRef]
- Eren, E.; Katanalp, B.Y. Fuzzy-based GIS approach with new MCDM method for bike-sharing station site selection according to land-use types. Sustain. Cities Soc. 2021, 76, 103434. [Google Scholar] [CrossRef]
- Sward, J.A.; Nilson, R.S.; Katkar, V.V.; Stedman, R.C.; Kay, D.L.; Ifft, J.E.; Zhang, K.M. Integrating social considerations in multicriteria decision analysis for utility-scale solar photovoltaic siting. Appl. Energy 2021, 288, 116543. [Google Scholar] [CrossRef]
- Zhou, J.; Wu, Y.; Tao, Y.; Gao, J.; Zhong, Z.; Xu, C. Geographic information big data-driven two-stage optimization model for location decision of hydrogen refueling stations: An empirical study in China. Energy 2021, 225, 120330. [Google Scholar] [CrossRef]
- Yücenur, G.N.; Maden, A. Location selection for a photovoltaic agricultural with f-PIPRECIA and WASPAS methods: A case study. Energy 2024, 314, 134179. [Google Scholar] [CrossRef]
- Spyridonidou, S.; Loukogeorgaki, E.; Vagiona, D.G.; Bertrand, T. Towards a sustainable spatial planning approach for PV site selection in Portugal. Energies 2022, 15, 8515. [Google Scholar] [CrossRef]
- Li, W.; Dong, F.; Shi, M.; Wang, X.; Ji, Z. Multi-attribute decision-making research on investment suitability assessment of hydropower-wind-photovoltaic-storage complementary system based on dynamic social network. Energy Convers. Manag. 2024, 307, 118358. [Google Scholar] [CrossRef]
- Wang, S.; Hou, Y.; Guan, X.; Liu, S.; Huo, Z. Resiliency-informed optimal scheduling of smart distribution network with urban distributed photovoltaic: A stochastic P-robust optimization. Energy 2024, 313, 133449. [Google Scholar] [CrossRef]
- Lin, S.-S.; Shen, S.-L.; Zhang, N.; Zhou, A. Comprehensive environmental impact evaluation for concrete mixing station (CMS) based on improved TOPSIS method. Sustain. Cities Soc. 2021, 69, 102838. [Google Scholar] [CrossRef]
- Li, G.; Liu, J.; Giordano, A. Robust optimization of construction waste disposal facility location considering uncertain factors. J. Clean. Prod. 2022, 353, 131455. [Google Scholar] [CrossRef]
- Wang, J.; Zhang, G.; Zhao, X.; Sun, L.; Wu, Y. Evaluating the effectiveness of community gardens by a quantitative systematic framework: A study of saint louis, missouri in the United States. Sustain. Cities Soc. 2022, 79, 103676. [Google Scholar] [CrossRef]
- Tan, Q.; Wei, T.; Peng, W.; Yu, Z.; Wu, C. Comprehensive evaluation model of wind farm site selection based on ideal matter element and grey clustering. J. Clean. Prod. 2020, 272, 122658. [Google Scholar] [CrossRef]
- Bukar, A.M.; Asif, M. Technology readiness level assessment of carbon capture and storage technologies. Renew. Sustain. Energy Rev. 2024, 200, 114578. [Google Scholar] [CrossRef]
- Varga, G.; Gresina, F.; Gelencsér, A.; Csávics, A.; Rostási, Á. Desert dust and photovoltaic energy forecasts: Lessons from 46 saharan dust events in Hungary (central europe). Renew. Sustain. Energy Rev. 2025, 212, 115446. [Google Scholar] [CrossRef]
- Li, Y.; Zhang, P.; Wu, Y. Public recharging infrastructure location strategy for promoting electric vehicles: A bi-level programming approach. J. Clean. Prod. 2018, 172, 2720–2734. [Google Scholar] [CrossRef]
- Feiz, R.; Geneviève, S.; Metson; Wretman, J.; Ammenberg, J. Key factors for site-selection of biogas plants in Sweden. J. Clean. Prod. 2022, 354, 131671. [Google Scholar] [CrossRef]
- Bedla, D.; Halecki, W. The value of river valleys for restoring landscape features and the continuity of urban ecosystem functions–a review. Ecol. Indic. 2021, 126, 107871. [Google Scholar] [CrossRef]
- Rahimpour, S.; El-Wali, M.; Makarava, I.; Tuomisto, H.L.; Lundström, M.; Kraslawski, A. Selected social impact indicators influenced by materials for green energy technologies. Nat. Commun. 2024, 15, 9336. [Google Scholar] [CrossRef]
- Liu, Z.; Ma, C.; Li, X.; Deng, Z.; Tian, Z. Aquatic environment impacts of floating photovoltaic and implications for climate change challenges. J. Environ. Manag. 2023, 364, 118851. [Google Scholar] [CrossRef]
- Chen, T.; Zhang, N.; Ye, Z.; Jiang, K.; Lin, Z.; Zhang, H.; Xu, Y.; Liu, Q.; Huang, H. Carbon reduction benefits of photovoltaic-green roofs and their climate change mitigation potential: A case study of Xiamen city. Sustain. Cities Soc. 2024, 114, 105760. [Google Scholar] [CrossRef]
- Dweiri, F.; Khan, S.A.; Almulla, A. A multi-criteria decision support system to rank sustainable desalination plant location criteria. Desalination 2018, 444, 26–34. [Google Scholar] [CrossRef]
- Wang, H.; Xu, Y.; Wei, X. Rural resilience evaluation and influencing factor analysis based on geographical detector method and multiscale geographically weighted regression. Land 2023, 12, 1270. [Google Scholar] [CrossRef]
- Chen, Y.-L.; Shen, S.-L.; Zhou, A. Assessment of red tide risk by integrating CRITIC weight method, TOPSIS-ASSETS method, and monte carlo simulation. Environ. Pollut. 2022, 314, 120254. [Google Scholar] [CrossRef]
- Lippe, M.; Hilger, T.; Sudchalee, S.; Wechpibal, N.; Jintrawet, A.; Cadisch, G. Simulating stakeholder-based land-use change scenarios and their implication on above-ground carbon and environmental management in northern Thailand. Land 2017, 6, 85. [Google Scholar] [CrossRef]
- Zhang, L.; Yuan, J.; Gao, X.; Jiang, D. Public transportation development decision-making under public participation: A large-scale group decision-making method based on fuzzy preference relations. Technol. Forecast. Soc. Change 2021, 172, 121020. [Google Scholar] [CrossRef]
- Ke, Y.; Tang, H.; Liu, M.; Meng, Q.; Xiao, Y. Optimal sizing for wind-photovoltaic-hydrogen storage integrated energy system under intuitionistic fuzzy environment. Int. J. Hydrogen Energy 2023, 48, 34193–34209. [Google Scholar] [CrossRef]


| Stage 1 | ||||
|---|---|---|---|---|
| Form | Typology | Indicators | Refs. | Implications and Points of Analysis |
| Natural resources category | point data | E1: solar radiation | [25,26,27] | The total radiant energy from the sun received by an area in a given period of time is a central indicator of the potential for PV power generation. |
| Road traffic | line data | E2: main roads distribution | [28,29] | Distribution of transport networks such as trunk road, assessment of the impact of road proximity on the transport of equipment, ease of access, etc. |
| Road traffic, risk safety category | line data | E3: railway distribution | [30] | Includes the layout of freight railways and the accessibility of the power grid, taking into account the transmission of electricity. |
| Natural resources category | raster data | E4: temperature conditions | [31] | Climatic conditions affect the service life of equipment and the production and growth cycles of livestock and sand-fixing crops. |
| Natural resources category | raster data | E5: precipitation conditions | [32] | |
| Risk security category | point data | E6: major cities and towns distribution | [33] | Reflects labor supply capacity and infrastructure completeness, as well as the need to match proximity to consumption needs. |
| Risk security category | point data | E7: tourism resource endowment | [34] | The spatial distribution and development potential of the landscape resource will influence the extent of infrastructure development. |
| Risk safety, environmental category | plane data | E8: the lakes and reservoirs distribution | [35] | Spatial location of surface water resources; assessment of ecological disturbance of waters by PV construction and daily operation. |
| Stage 2 | ||||
| Form | Typology | Indicators | Refs. | Implications and points of analysis |
| G1: economic factors | actual value | C11: cost of investments | [36] | Total investment cost for initial construction and equipment purchase. |
| G1: economic factors | actual value | C12: annual earnings | [37] | The project generates annual economic returns, including PV power generation revenue and multi-industry gains. |
| G1: economic factors | actual value | C13: payback period | [38] | Reflects efficiency of return of funds and risk tolerance. |
| G2: technical factors | HFLTS→TFN | C21: technology maturity | [39] | Suitability and reliability of PV equipment and technology in complex environments in the local environment. |
| G2: technical factors | HFLTS→TFN | C22: requirements for equipment to resist sand and wind | [40] | The ability of PV equipment to withstand extreme environments has a direct impact on O&M costs and efficiency. |
| G3: social factors | HFLTS→TFN | C31: strength of policy support | [41,42] | Government support in terms of land approvals and tax breaks. |
| G3: social factors | actual value | C32: employment Opportunities | [43] | The project creates director indirect jobs, combined with measurements of the sustainability of jobs in operation and maintenance, ecological care, etc. |
| G4: environmental factors | HFLTS→TFN | C41: degree of ecological improvement | [44] | Contribution of the project to the ecological rehabilitation of the “Desert-Gobi-Wildness” region. |
| G4: environmental factors | HFLTS→TFN | C42: light pollution risk | [45] | Impact of PV arrays on neighboring residents, wildlife, etc. |
| G4: environmental factors | actual value | C43: carbon emission reductions | [46] | CO2 emission reductions from the replacement of fossil energy sources over the life cycle of the project. |
| Indicators of Suitability Analysis | E1 | E2 | E3 | E4 |
|---|---|---|---|---|
| Weighting results | 0.2851 | 0.0825 | 0.0300 | 0.1615 |
| Indicators of suitability analysis | E5 | E6 | E7 | E8 |
| Weighting results | 0.1615 | 0.1073 | 0.0825 | 0.0825 |
| Multi-Industry | A1 | A2 | A3 | A4 | A5 | A6 |
|---|---|---|---|---|---|---|
| Q1 | √ | √ | √ | √ | √ | √ |
| Q2 | √ | √ | √ | √ | √ | |
| Q3 | √ | √ | √ | √ | √ | |
| Q4 | √ | √ | √ | √ | √ | |
| Q5 | √ | √ | √ | √ | √ | |
| Q6 | √ | √ | √ | √ |
| Initial Decision Matrix | A1 | A2 | A3 | A4 | A5 | A6 |
|---|---|---|---|---|---|---|
| Investment costs C11 | 13,271.15 | 11,569.30 | 12,150.05 | 14,663.12 | 10,841.40 | 12,190.26 |
| Annual earnings C12 | 1038.23 | 949.88 | 1114.39 | 1062.5 | 1099.62 | 1088.74 |
| Payback period C13 | 17.42 | 18.86 | 15.09 | 22.34 | 17.51 | 19.01 |
| Technology maturity C21 | 0.72 | 0.83 | 0.93 | 0.62 | 0.48 | 0.40 |
| Equipment wind and sand resistance requirements C22 | 0.58 | 0.68 | 0.83 | 0.80 | 0.88 | 0.48 |
| Strength of policy support C31 | 0.68 | 0.83 | 0.86 | 0.58 | 0.57 | 0.48 |
| Employment opportunities C32 | 260 | 245 | 305 | 325 | 374 | 234 |
| Degree of ecological improvement C41 | 0.78 | 0.83 | 0.77 | 0.62 | 0.86 | 0.58 |
| Carbon emission reductions C42 | 8994.12 | 9099.86 | 10,360.19 | 9690.76 | 10,016.53 | 10,371.85 |
| Light pollution risk C43 | 0.37 | 0.43 | 0.48 | 0.40 | 0.33 | 0.28 |
| Overall Dominance | A1 | A2 | A3 | A4 | A5 | Row Sum | Standardization | Ranking |
|---|---|---|---|---|---|---|---|---|
| A1 | 0 | −8.990926515 | 3.788641377 | −2.931915191 | −8.938843187 | −32.94552629 | 0.558772052 | 3 |
| A2 | 0.729955048 | 0 | 3.725727214 | −2.359442933 | −5.304602676 | −17.28294324 | 1 | 1 |
| A3 | 6.514296439 | −9.780541701 | 0 | −7.578356279 | −12.52315747 | −50.92844674 | 0.052178276 | 5 |
| A4 | 8.739484018 | −12.53182913 | 10.02149536 | 0 | −9.797820515 | −52.7806562 | 0 | 6 |
| A5 | 7.690723811 | −10.09183931 | 6.615586626 | −2.557804216 | 0 | −35.57561826 | 0.484680181 | 4 |
| A6 | 2.803108252 | −8.056587041 | 6.370342754 | −2.93449979 | −5.331326249 | −25.49586409 | 0.768635212 | 2 |
| Overall Dominance | A1 | A2 | A4 | A5 | A6 | Row Sum | Standardization | Ranking |
|---|---|---|---|---|---|---|---|---|
| A1 | 0 | −8.990926515 | 2.931915191 | −8.938843187 | −8.29520002 | −29.15688491 | 0.465800344 | 4 |
| A2 | −0.729955048 | 0 | 2.359442933 | −5.304602676 | −5.163215373 | −13.55721603 | 1 | 1 |
| A4 | −8.739484018 | −12.53182913 | 0 | −9.797820515 | −11.69002718 | −42.75916085 | 0 | 5 |
| A5 | −7.690723811 | −10.09183931 | 2.557804216 | 0 | −8.6196643 | −28.96003164 | 0.472541445 | 3 |
| A6 | −2.803108252 | −8.056587041 | −2.93449979 | −5.331326249 | 0 | −19.12552133 | 0.809317313 | 2 |
| Overall Dominance | A1 | A2 | A4 | A5 | Row Sum | Standardization | Ranking |
|---|---|---|---|---|---|---|---|
| A1 | 0 | −8.990926515 | 2.931915191 | −8.938843187 | −20.86168489 | 0.450160481 | 3 |
| A2 | −0.729955048 | 0 | 2.359442933 | −5.304602676 | −8.394000656 | 1 | 1 |
| A4 | −8.739484018 | −12.53182913 | 0 | −9.797820515 | −31.06913367 | 0 | 4 |
| A5 | −7.690723811 | −10.09183931 | 2.557804216 | 0 | −20.34036734 | 0.473151197 | 2 |
| TODIM (θ = 1) | FSE | MABAC | TOPSIS | |||||
|---|---|---|---|---|---|---|---|---|
| Standardization | Ranking | Standardization | Ranking | Standardization | Ranking | Standardization | Ranking | |
| A1 | 0.560534266 | 3 | 0.568676003 | 4 | 0.531024749 | 4 | 0.374 | 6 |
| A2 | 1 | 1 | 0.586520874 | 3 | 0.548869619 | 3 | 0.417 | 5 |
| A3 | 0 | 6 | 0.725544148 | 1 | 0.687892893 | 1 | 0.556 | 3 |
| A4 | 0.003993886 | 5 | 0.321722035 | 6 | 0.284070781 | 6 | 0.456 | 4 |
| A5 | 0.486738309 | 4 | 0.648659789 | 2 | 0.611008535 | 2 | 0.623 | 1 |
| A6 | 0.769559256 | 2 | 0.467948566 | 5 | 0.430297311 | 5 | 0.561 | 2 |
Disclaimer/Publisher’s Note: The statements, opinions and data contained in all publications are solely those of the individual author(s) and contributor(s) and not of MDPI and/or the editor(s). MDPI and/or the editor(s) disclaim responsibility for any injury to people or property resulting from any ideas, methods, instructions or products referred to in the content. |
© 2025 by the authors. Licensee MDPI, Basel, Switzerland. This article is an open access article distributed under the terms and conditions of the Creative Commons Attribution (CC BY) license (https://creativecommons.org/licenses/by/4.0/).
Share and Cite
Song, Z.; Zhou, J.; Yang, C.; Wu, S.; Chen, Z.; Sun, J.; Wu, Y. “Photovoltaic +” Multi-Industry Integration for Sustainable Development in “Desert-Gobi-Wilderness” Region: Geospatial Suitability Simulation and Dynamic Site Selection Decision Optimization. Land 2025, 14, 1410. https://doi.org/10.3390/land14071410
Song Z, Zhou J, Yang C, Wu S, Chen Z, Sun J, Wu Y. “Photovoltaic +” Multi-Industry Integration for Sustainable Development in “Desert-Gobi-Wilderness” Region: Geospatial Suitability Simulation and Dynamic Site Selection Decision Optimization. Land. 2025; 14(7):1410. https://doi.org/10.3390/land14071410
Chicago/Turabian StyleSong, Zhaotong, Jianli Zhou, Cheng Yang, Shuxian Wu, Zhuohao Chen, Jiawen Sun, and Yunna Wu. 2025. "“Photovoltaic +” Multi-Industry Integration for Sustainable Development in “Desert-Gobi-Wilderness” Region: Geospatial Suitability Simulation and Dynamic Site Selection Decision Optimization" Land 14, no. 7: 1410. https://doi.org/10.3390/land14071410
APA StyleSong, Z., Zhou, J., Yang, C., Wu, S., Chen, Z., Sun, J., & Wu, Y. (2025). “Photovoltaic +” Multi-Industry Integration for Sustainable Development in “Desert-Gobi-Wilderness” Region: Geospatial Suitability Simulation and Dynamic Site Selection Decision Optimization. Land, 14(7), 1410. https://doi.org/10.3390/land14071410